Embed Size (px)
Citation preview

MAPPER TOOL USER GUIDE
RE-POWERING AMERICA’S LAND INITIATIVE
Office of Communications, Partnerships, and Analysis Office of Land and Emergency Management
September 2017

RE-Powering America’s Land Initiative September 2017 Mapper Tool User Guide
ii
Table of Contents
1. Introduction to RE-Powering Mapper 2.0 ....................................................................................................................... 1
1.1 What is the Mapper? ................................................................................................................................................. 1
1.2 What is different from the previous RE-Powering Mapper? ................................................................................ 1
Platform .......................................................................................................................................................................... 1
Map-Table Connection ................................................................................................................................................ 1
Data Organization and Access ................................................................................................................................... 1
State Policy Layer ........................................................................................................................................................ 1
2. Mapper Elements .............................................................................................................................................................. 2
3. Using the Mapper Functions ............................................................................................................................................ 4
3.1 Open the Mapper ....................................................................................................................................................... 4
3.2 Add or Remove Data Layers.................................................................................................................................... 4
3.3 Change the background ........................................................................................................................................... 4
3.4 Filter the data layers .................................................................................................................................................. 5
3.5 Export table(s) ............................................................................................................................................................ 6
3.6 Take Measurements.................................................................................................................................................. 6
3.7 Print .............................................................................................................................................................................. 8
3.8 Use the Query Tool ................................................................................................................................................... 8
3.9 Read Pop-up Box for Site Information Summary ................................................................................................. 9
3.10 Draw your own shapes ......................................................................................................................................... 10
3.11 Add Data ................................................................................................................................................................. 11
3.12 Bookmark ................................................................................................................................................................ 12
3.13. Share ...................................................................................................................................................................... 12
4. Attribute Table Details .................................................................................................................................................... 13
4.1 Solar........................................................................................................................................................................... 13
4.2 Wind ........................................................................................................................................................................... 14
4.3 Biomass/Biofuel ....................................................................................................................................................... 16
4.4 Geothermal ............................................................................................................................................................... 18
4.5 State Policies ............................................................................................................................................................ 19

RE-Powering America’s Land Initiative September 2017 Mapper Tool User Guide
1
1. Introduction to RE-Powering Mapper 2.0 This guide accompanies the EPA RE-Powering America’s Land Mapper 2017 update. Web applications are ubiquitous now and many users of the RE-Powering Mapper will have had experience using a web-based mapping application already. Still, others may not have had experience with such applications. Below are tips and reminders specific to the RE-Powering Mapper application to guide the user experience.
1.1 What is the Mapper? The Mapper is a web-based geographic information tool that provides location data for over 80,000 contaminated lands, landfills and mine sites, collected from state and federal sources that have been pre-screened for renewable energy potential. The points are generated from the best available latitude and longitude data. Attached to each point are attributes which describe the site and its renewable energy potential. Within the Mapper, you may choose to look at sites that have pre-screened positively for solar, wind, biomass/biofuel and geothermal energy potential.
For more information on the data and the screening process, please see <Data Documentation>. All data was last updated in August 2015.
1.2 What is different from the previous RE-Powering Mapper? Platform
The 2017 version of the Mapper is now hosted on the Internet. This means that the application can be reached directly from the RE-Powering website and does not require the user to download any additional software.
Map-Table Connection
In the 2017 version of the Mapper, all attribute data associated with the point data can be viewed and analyzed at the same time. That is, you can now sort the attribute table from the web application and immediately visualize the results in the map. [See Filter the Data below.] For those who wish to sort the spreadsheet off-line without the spatial reference you can export each data table to a .csv file and open it in Microsoft Excel. [See Export Table(s) below]
Data Organization and Access
All data is accessible through the Mapper and available for download from the website. Unlike the previous version, however, there is not one master table of sites with screening results for all renewable energy types. The information is presented in 4 tables and 4 geographic layers representing each of the renewable energy screening results (e.g., solar, wind, biomass and/or biofuel, and geothermal). This is based on the assumption that users may have expertise, or be interested, in 1 or 2 renewable energy types at a maximum. Mapper users can view one or all of four main layers. If two or more layers are selected, attribute information associated with a site that has screened positively for more than one chosen renewable type will be condensed into one pop-up with multiple pages. [See Read Pop-up Screen(s). . . below]. Users can add and search or filter the attribute table associated with each renewable energy type separately. To keep track of a single site that has screened positively for more than one renewable energy type, note the Cross-Reference Number associated with that point.
State Policy Layer
In addition to the point layers, the Mapper comes with an additional state layer with attribute information describing state policies related to renewable energy and renewable energy on contaminated lands. Please see the Data Documentation for more information on data types and sources.
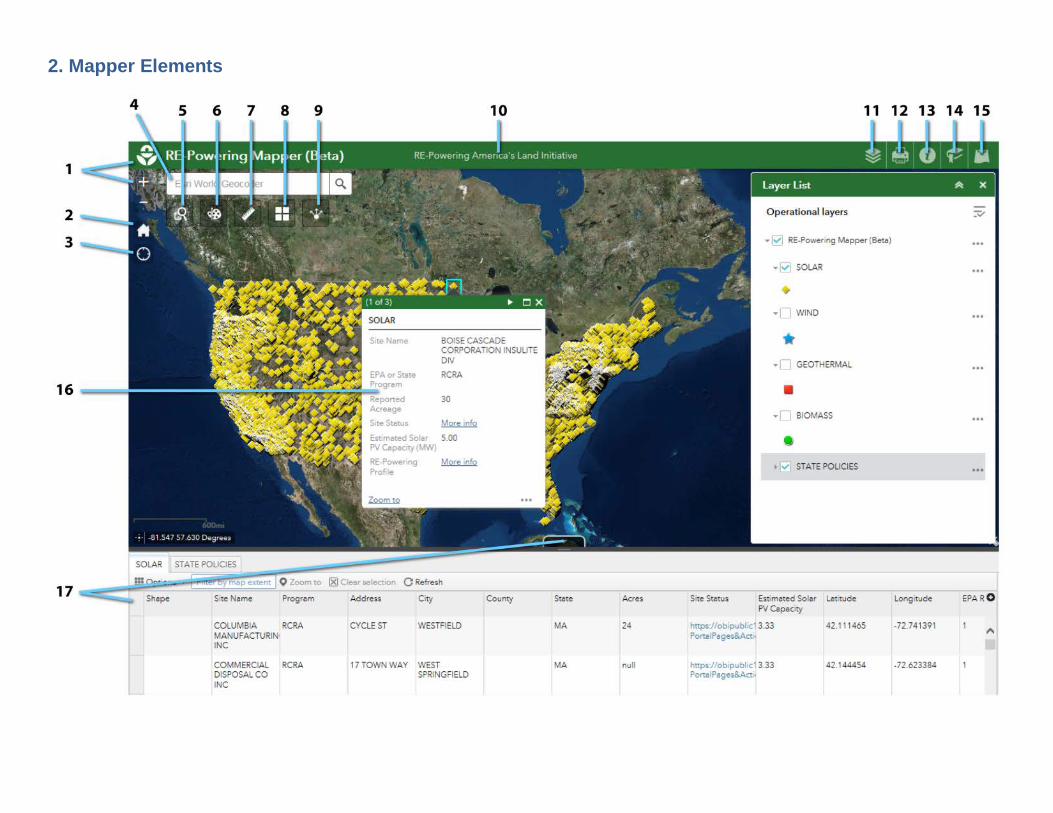
2. Mapper Elements
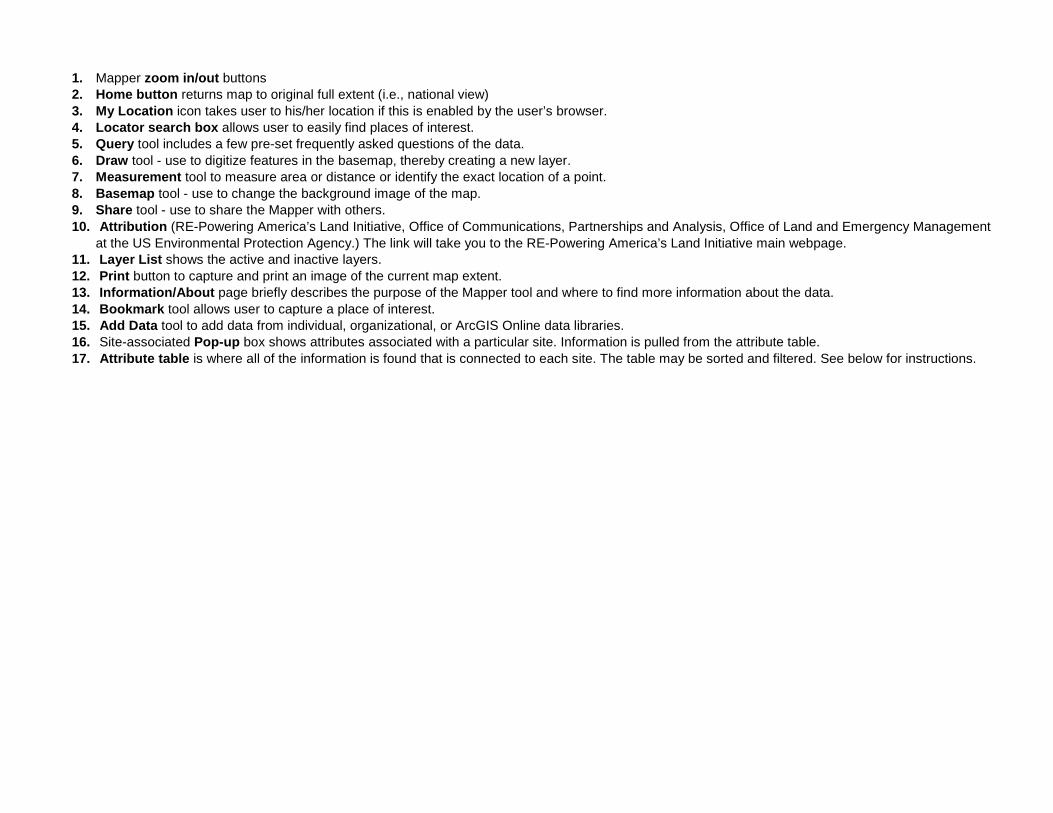
1. Mapper zoom in/out buttons 2. Home button returns map to original full extent (i.e., national view) 3. My Location icon takes user to his/her location if this is enabled by the user’s browser. 4. Locator search box allows user to easily find places of interest. 5. Query tool includes a few pre-set frequently asked questions of the data. 6. Draw tool - use to digitize features in the basemap, thereby creating a new layer. 7. Measurement tool to measure area or distance or identify the exact location of a point. 8. Basemap tool - use to change the background image of the map. 9. Share tool - use to share the Mapper with others. 10. Attribution (RE-Powering America’s Land Initiative, Office of Communications, Partnerships and Analysis, Office of Land and Emergency Management
at the US Environmental Protection Agency.) The link will take you to the RE-Powering America’s Land Initiative main webpage. 11. Layer List shows the active and inactive layers. 12. Print button to capture and print an image of the current map extent. 13. Information/About page briefly describes the purpose of the Mapper tool and where to find more information about the data. 14. Bookmark tool allows user to capture a place of interest. 15. Add Data tool to add data from individual, organizational, or ArcGIS Online data libraries. 16. Site-associated Pop-up box shows attributes associated with a particular site. Information is pulled from the attribute table. 17. Attribute table is where all of the information is found that is connected to each site. The table may be sorted and filtered. See below for instructions.
RE-Powering America’s Land Initiative September 2017 Mapper Tool User Guide
4
3. Using the Mapper Functions
3.1 Open the Mapper When you first open the Mapper tool from the RE-Powering landing page, you will see a gray box with an explanation of the Mapper and contact information for the RE-Powering America’s Land Initiative. Click “OK” to access the application.
The first time you open the Mapper, it will be populated with yellow diamonds representing the sites pre-screened for solar and the State Policies layer, the active layers and their symbols will be visible in the Layer List panel and you will see attributes related to the solar screen criteria in the Attribute Table [12] at the bottom of the screen. In the solar layer, you will also find sites that have specifically been identified as landfills. To filter this layer, see Filter the Data below. To add or remove data layers, see Add or Remove Data below.
Note: The time it takes to load data into the web map roughly corresponds to internet speed, plus the number of layers you want to visualize and the scale at which you are looking at the map. Thus, it may take a few more seconds to load all data for the whole United States than to load one layer for a particular community.
3.2 Add or Remove Data Layers You may add or remove layers at any time.
1. If not already displayed, click the Layer List icon [11].
2. To add layers not visible, click the box next to the name. At the same time as the layer appears, the attribute table associated with that layer will load at the bottom of the screen. You can navigate to that tab to filter that layer by the desired attribute(s).
3. Simply uncheck the box to remove a layer and the table from the map view.
4. To restore the application default layers, refresh the map.
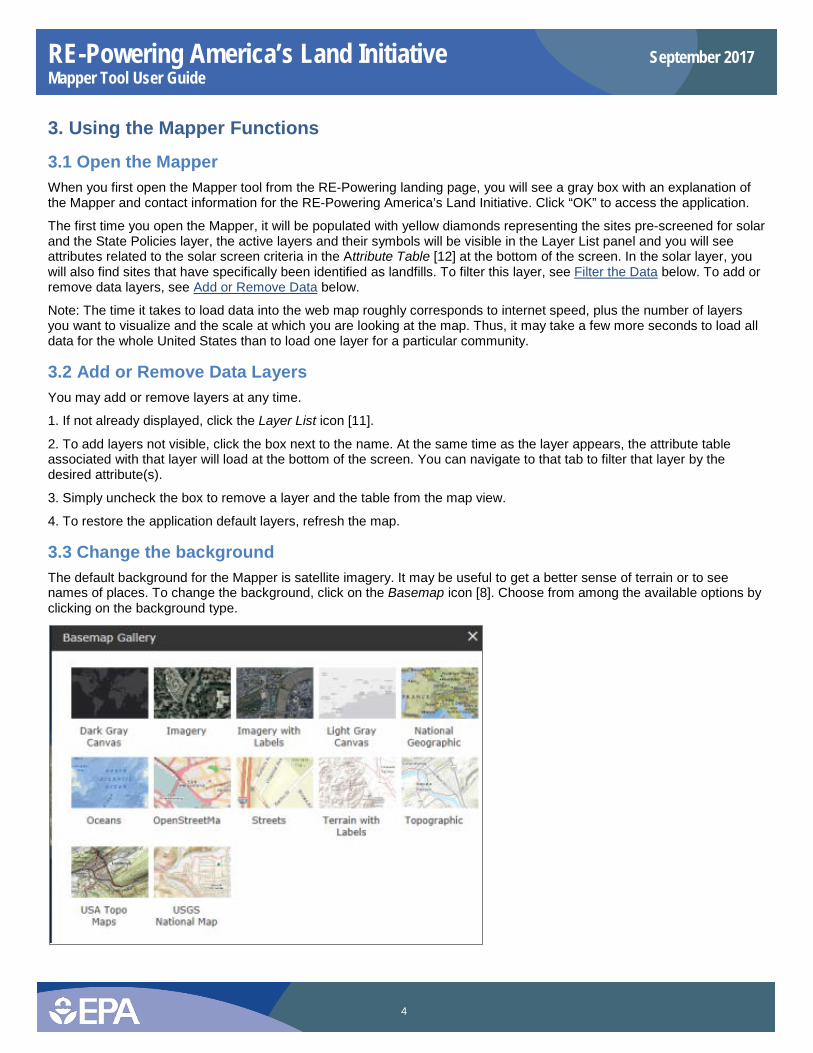
3.3 Change the background The default background for the Mapper is satellite imagery. It may be useful to get a better sense of terrain or to see names of places. To change the background, click on the Basemap icon [8]. Choose from among the available options by clicking on the background type.
RE-Powering America’s Land Initiative September 2017 Mapper Tool User Guide
5
3.4 Filter the data layers This is the most important function for finding what you need. Each table can be filtered within the application, dynamically altering the map display. Users can filter on every field in the data table. Below are some examples of how to filter the attribute table to narrow the dataset to the area(s) of interest, including the associated expressions and output. Output tables can be exported to a .csv file and opened in Microsoft Excel.
Example question 1:
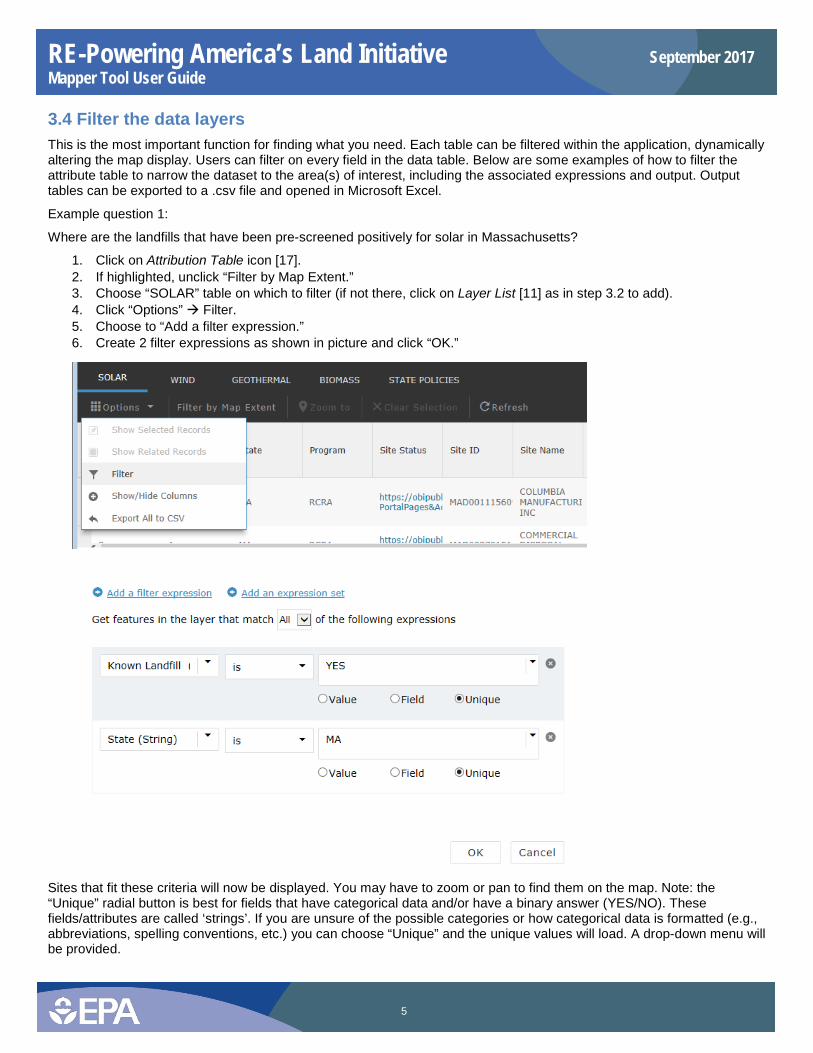
Where are the landfills that have been pre-screened positively for solar in Massachusetts?
1. Click on Attribution Table icon [17]. 2. If highlighted, unclick “Filter by Map Extent.” 3. Choose “SOLAR” table on which to filter (if not there, click on Layer List [11] as in step 3.2 to add). 4. Click “Options” Filter. 5. Choose to “Add a filter expression.” 6. Create 2 filter expressions as shown in picture and click “OK.”
Sites that fit these criteria will now be displayed. You may have to zoom or pan to find them on the map. Note: the “Unique” radial button is best for fields that have categorical data and/or have a binary answer (YES/NO). These fields/attributes are called ‘strings’. If you are unsure of the possible categories or how categorical data is formatted (e.g., abbreviations, spelling conventions, etc.) you can choose “Unique” and the unique values will load. A drop-down menu will be provided.
RE-Powering America’s Land Initiative September 2017 Mapper Tool User Guide
6
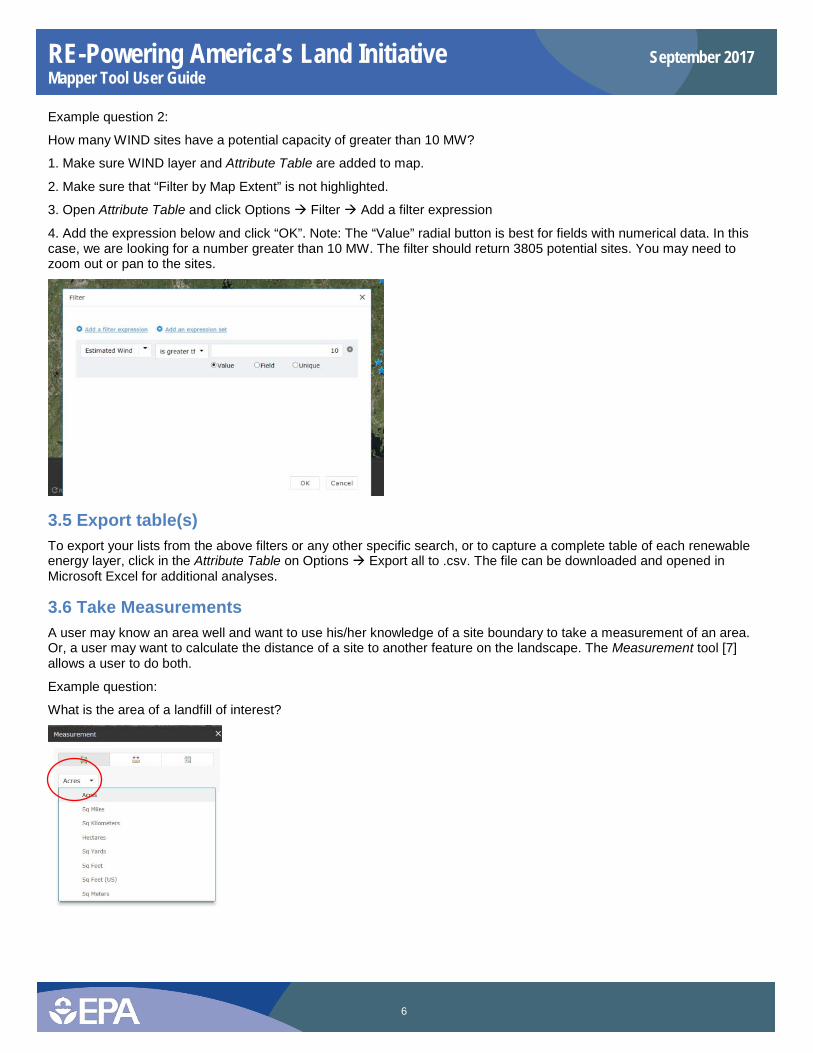
Example question 2:
How many WIND sites have a potential capacity of greater than 10 MW?
1. Make sure WIND layer and Attribute Table are added to map.
2. Make sure that “Filter by Map Extent” is not highlighted.
3. Open Attribute Table and click Options Filter Add a filter expression
4. Add the expression below and click “OK”. Note: The “Value” radial button is best for fields with numerical data. In this case, we are looking for a number greater than 10 MW. The filter should return 3805 potential sites. You may need to zoom out or pan to the sites.
3.5 Export table(s) To export your lists from the above filters or any other specific search, or to capture a complete table of each renewable energy layer, click in the Attribute Table on Options Export all to .csv. The file can be downloaded and opened in Microsoft Excel for additional analyses.
3.6 Take Measurements A user may know an area well and want to use his/her knowledge of a site boundary to take a measurement of an area. Or, a user may want to calculate the distance of a site to another feature on the landscape. The Measurement tool [7] allows a user to do both.
Example question:
What is the area of a landfill of interest?
RE-Powering America’s Land Initiative September 2017 Mapper Tool User Guide
7
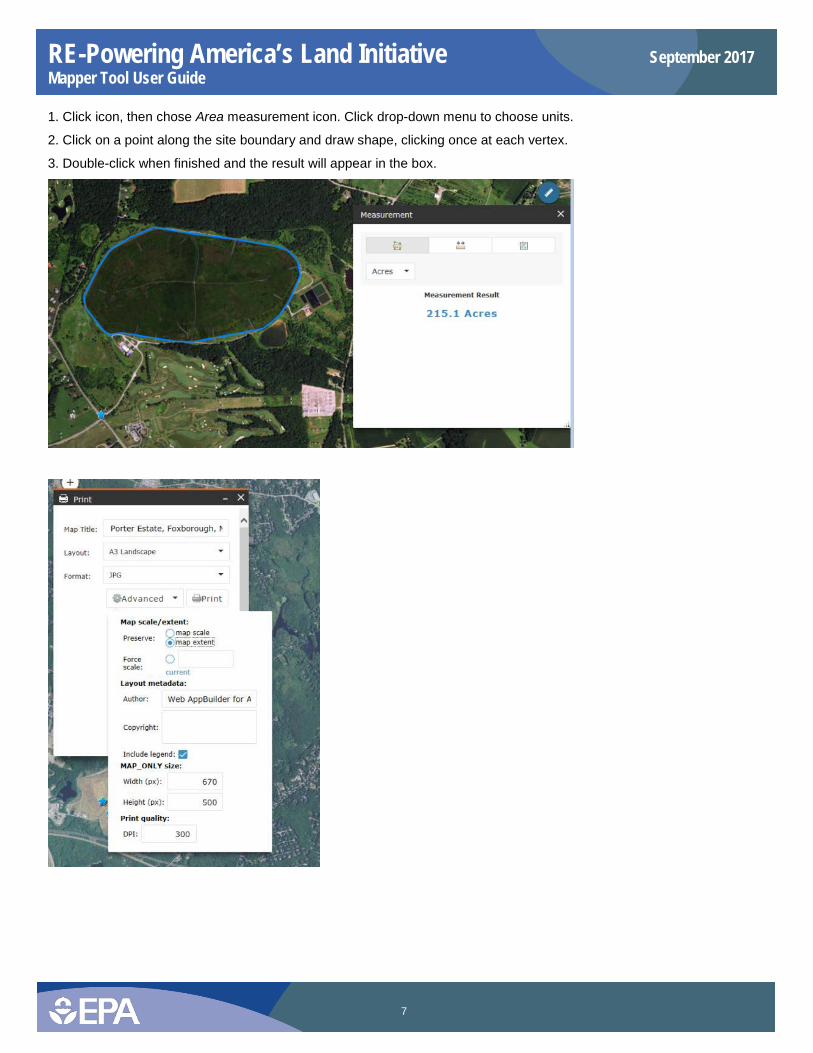
1. Click icon, then chose Area measurement icon. Click drop-down menu to choose units.
2. Click on a point along the site boundary and draw shape, clicking once at each vertex.
3. Double-click when finished and the result will appear in the box.
RE-Powering America’s Land Initiative September 2017 Mapper Tool User Guide
8
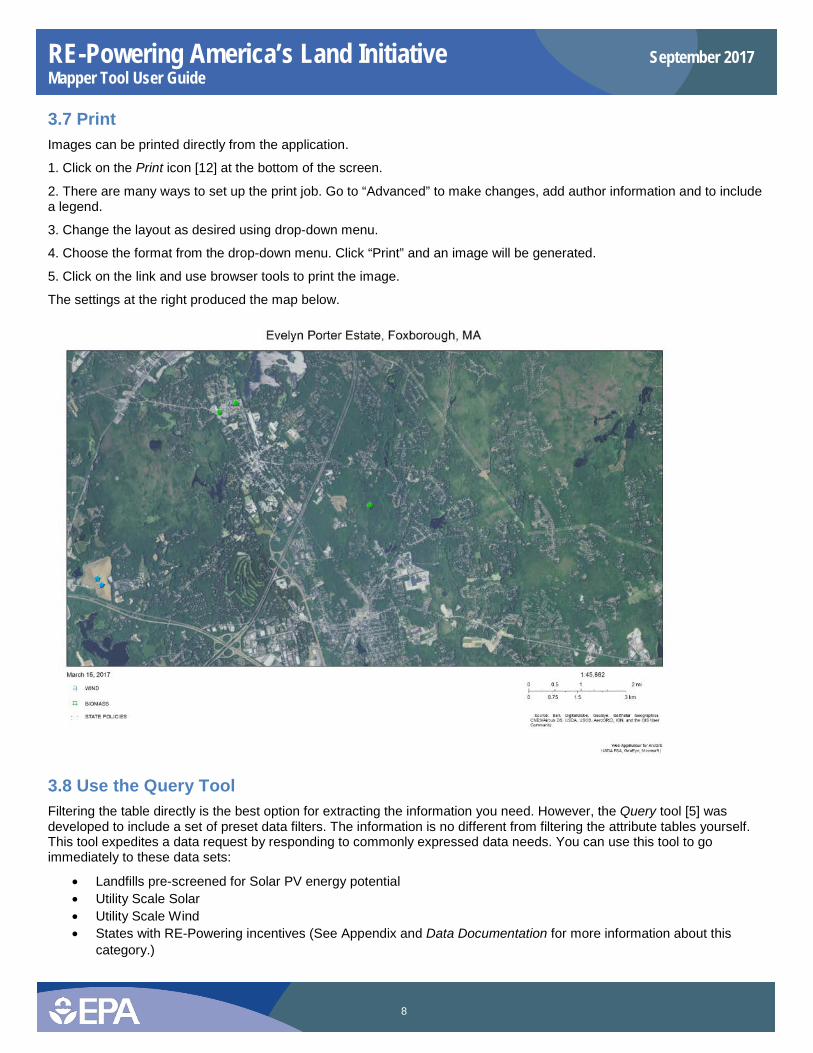
3.7 Print Images can be printed directly from the application.
1. Click on the Print icon [12] at the bottom of the screen.
2. There are many ways to set up the print job. Go to “Advanced” to make changes, add author information and to include a legend.
3. Change the layout as desired using drop-down menu.
4. Choose the format from the drop-down menu. Click “Print” and an image will be generated.
5. Click on the link and use browser tools to print the image.
The settings at the right produced the map below.
3.8 Use the Query Tool Filtering the table directly is the best option for extracting the information you need. However, the Query tool [5] was developed to include a set of preset data filters. The information is no different from filtering the attribute tables yourself. This tool expedites a data request by responding to commonly expressed data needs. You can use this tool to go immediately to these data sets:
• Landfills pre-screened for Solar PV energy potential • Utility Scale Solar • Utility Scale Wind • States with RE-Powering incentives (See Appendix and Data Documentation for more information about this
category.)
RE-Powering America’s Land Initiative September 2017 Mapper Tool User Guide
9
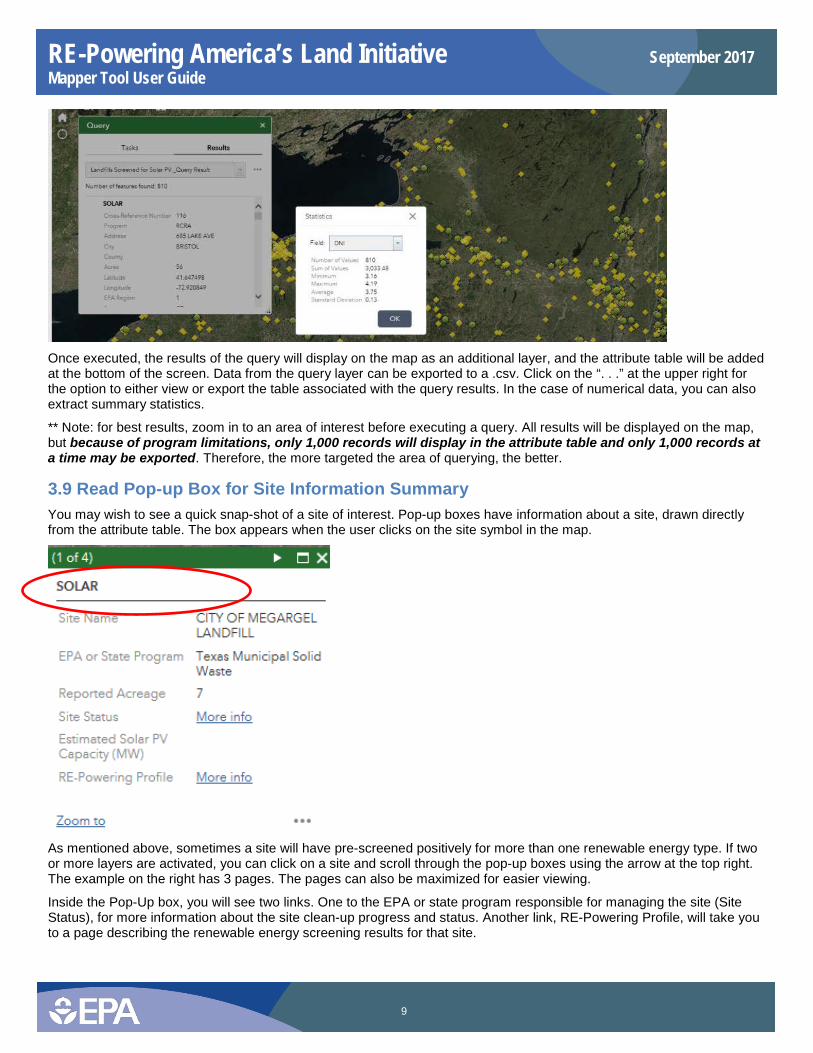
Once executed, the results of the query will display on the map as an additional layer, and the attribute table will be added at the bottom of the screen. Data from the query layer can be exported to a .csv. Click on the “. . .” at the upper right for the option to either view or export the table associated with the query results. In the case of numerical data, you can also extract summary statistics.
** Note: for best results, zoom in to an area of interest before executing a query. All results will be displayed on the map, but because of program limitations, only 1,000 records will display in the attribute table and only 1,000 records at a time may be exported. Therefore, the more targeted the area of querying, the better.
3.9 Read Pop-up Box for Site Information Summary You may wish to see a quick snap-shot of a site of interest. Pop-up boxes have information about a site, drawn directly from the attribute table. The box appears when the user clicks on the site symbol in the map.
As mentioned above, sometimes a site will have pre-screened positively for more than one renewable energy type. If two or more layers are activated, you can click on a site and scroll through the pop-up boxes using the arrow at the top right. The example on the right has 3 pages. The pages can also be maximized for easier viewing.
Inside the Pop-Up box, you will see two links. One to the EPA or state program responsible for managing the site (Site Status), for more information about the site clean-up progress and status. Another link, RE-Powering Profile, will take you to a page describing the renewable energy screening results for that site.
RE-Powering America’s Land Initiative September 2017 Mapper Tool User Guide
10
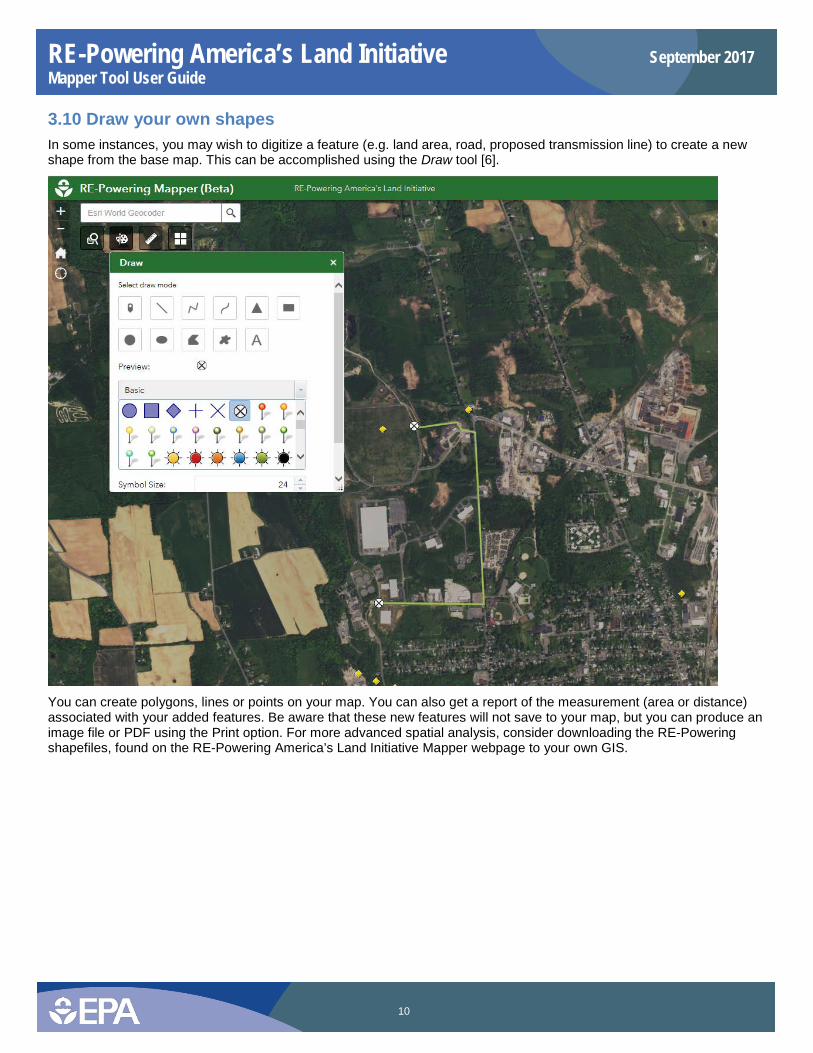
3.10 Draw your own shapes In some instances, you may wish to digitize a feature (e.g. land area, road, proposed transmission line) to create a new shape from the base map. This can be accomplished using the Draw tool [6].
You can create polygons, lines or points on your map. You can also get a report of the measurement (area or distance) associated with your added features. Be aware that these new features will not save to your map, but you can produce an image file or PDF using the Print option. For more advanced spatial analysis, consider downloading the RE-Powering shapefiles, found on the RE-Powering America’s Land Initiative Mapper webpage to your own GIS.
RE-Powering America’s Land Initiative September 2017 Mapper Tool User Guide
11
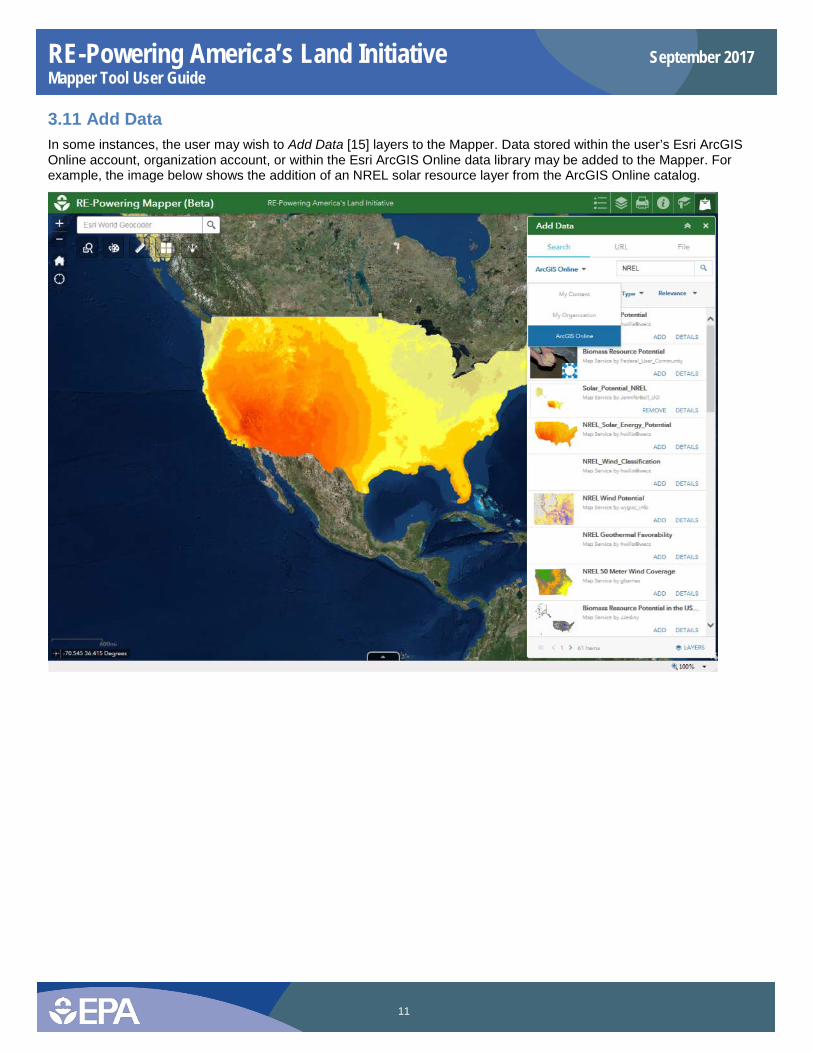
3.11 Add Data In some instances, the user may wish to Add Data [15] layers to the Mapper. Data stored within the user’s Esri ArcGIS Online account, organization account, or within the Esri ArcGIS Online data library may be added to the Mapper. For example, the image below shows the addition of an NREL solar resource layer from the ArcGIS Online catalog.
RE-Powering America’s Land Initiative September 2017 Mapper Tool User Guide
12
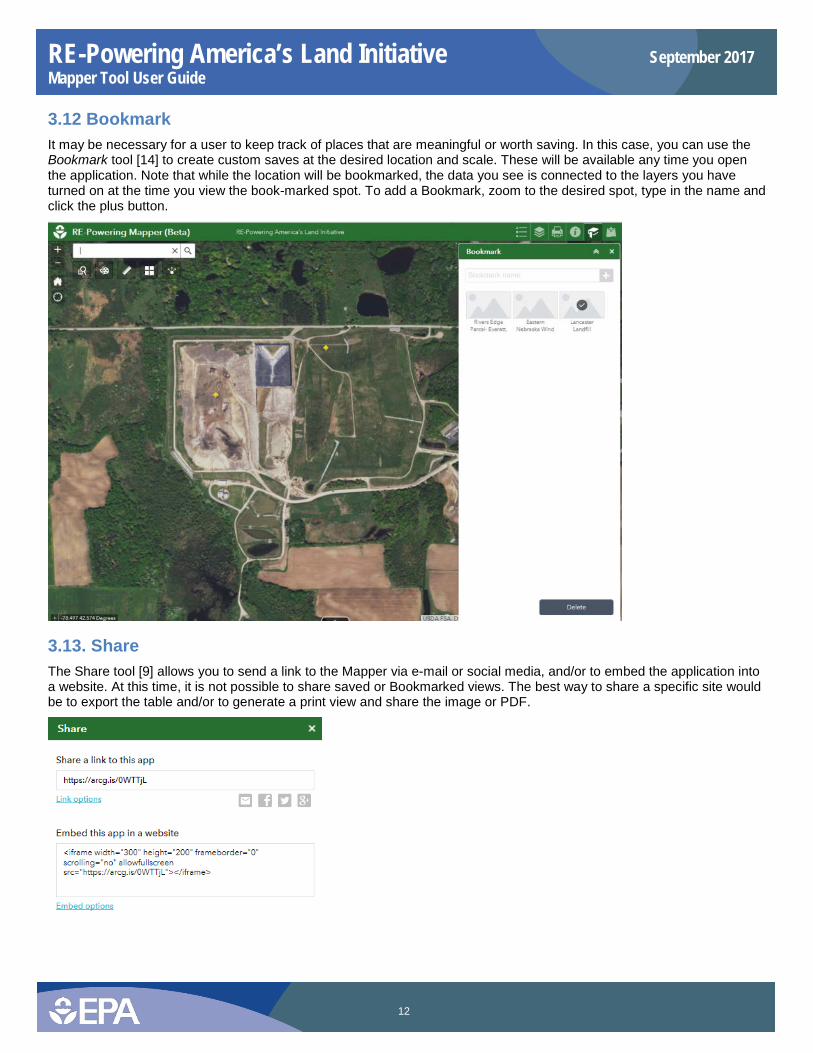
3.12 Bookmark It may be necessary for a user to keep track of places that are meaningful or worth saving. In this case, you can use the Bookmark tool [14] to create custom saves at the desired location and scale. These will be available any time you open the application. Note that while the location will be bookmarked, the data you see is connected to the layers you have turned on at the time you view the book-marked spot. To add a Bookmark, zoom to the desired spot, type in the name and click the plus button.
3.13. Share The Share tool [9] allows you to send a link to the Mapper via e-mail or social media, and/or to embed the application into a website. At this time, it is not possible to share saved or Bookmarked views. The best way to share a specific site would be to export the table and/or to generate a print view and share the image or PDF.
RE-Powering America’s Land Initiative September 2017 Mapper Tool User Guide
13
4. Attribute Table Details
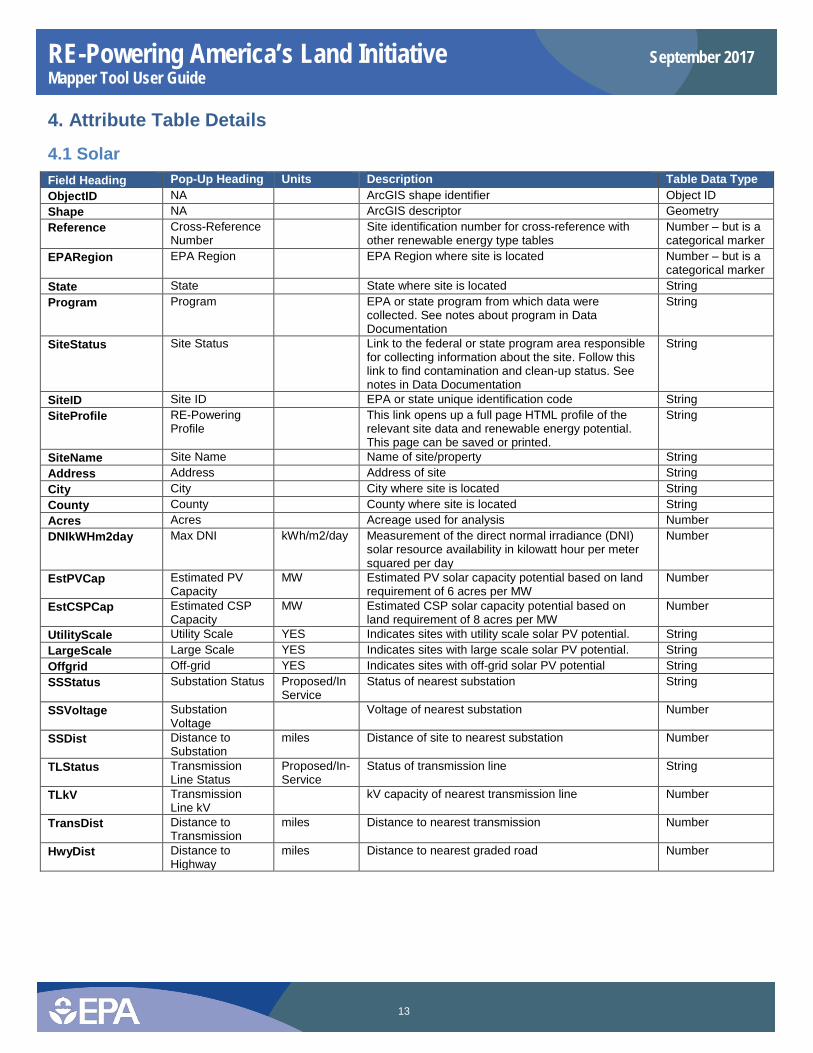
4.1 Solar Field Heading Pop-Up Heading Units Description Table Data Type ObjectID NA ArcGIS shape identifier Object ID Shape NA ArcGIS descriptor Geometry Reference Cross-Reference
Number Site identification number for cross-reference with
other renewable energy type tables Number – but is a categorical marker
EPARegion EPA Region EPA Region where site is located Number – but is a categorical marker
State State State where site is located String Program Program EPA or state program from which data were
collected. See notes about program in Data Documentation
String
SiteStatus Site Status Link to the federal or state program area responsible for collecting information about the site. Follow this link to find contamination and clean-up status. See notes in Data Documentation
String
SiteID Site ID EPA or state unique identification code String SiteProfile RE-Powering
Profile This link opens up a full page HTML profile of the
relevant site data and renewable energy potential. This page can be saved or printed.
String
SiteName Site Name Name of site/property String Address Address Address of site String City City City where site is located String County County County where site is located String Acres Acres Acreage used for analysis Number DNIkWHm2day Max DNI kWh/m2/day Measurement of the direct normal irradiance (DNI)
solar resource availability in kilowatt hour per meter squared per day
Number
EstPVCap Estimated PV Capacity
MW Estimated PV solar capacity potential based on land requirement of 6 acres per MW
Number
EstCSPCap Estimated CSP Capacity
MW Estimated CSP solar capacity potential based on land requirement of 8 acres per MW
Number
UtilityScale Utility Scale YES Indicates sites with utility scale solar PV potential. String LargeScale Large Scale YES Indicates sites with large scale solar PV potential. String Offgrid Off-grid YES Indicates sites with off-grid solar PV potential String SSStatus Substation Status Proposed/In
Service Status of nearest substation String
SSVoltage Substation Voltage
Voltage of nearest substation Number
SSDist Distance to Substation
miles Distance of site to nearest substation Number
TLStatus Transmission Line Status
Proposed/In-Service
Status of transmission line String
TLkV Transmission Line kV
kV capacity of nearest transmission line Number
TransDist Distance to Transmission
miles Distance to nearest transmission Number
HwyDist Distance to Highway
miles Distance to nearest graded road Number
RE-Powering America’s Land Initiative September 2017 Mapper Tool User Guide
14
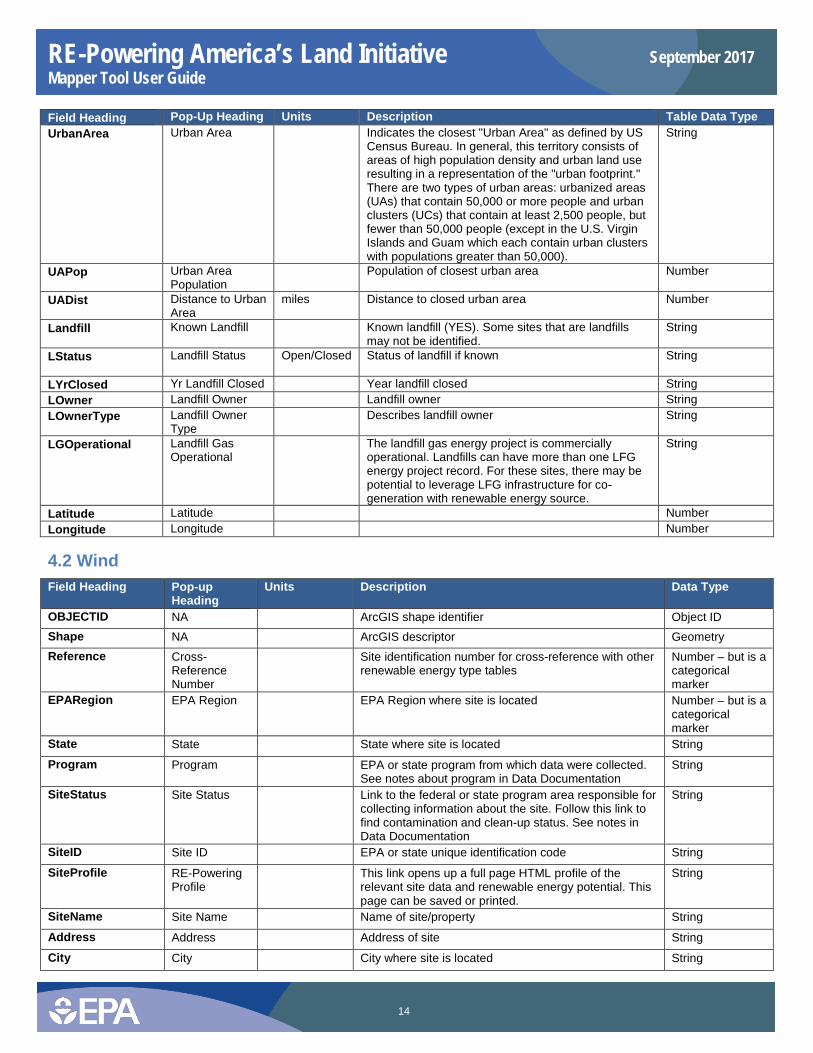
Field Heading Pop-Up Heading Units Description Table Data Type UrbanArea Urban Area Indicates the closest "Urban Area" as defined by US
Census Bureau. In general, this territory consists of areas of high population density and urban land use resulting in a representation of the "urban footprint." There are two types of urban areas: urbanized areas (UAs) that contain 50,000 or more people and urban clusters (UCs) that contain at least 2,500 people, but fewer than 50,000 people (except in the U.S. Virgin Islands and Guam which each contain urban clusters with populations greater than 50,000).
String
UAPop Urban Area Population
Population of closest urban area Number
UADist Distance to Urban Area
miles Distance to closed urban area Number
Landfill Known Landfill Known landfill (YES). Some sites that are landfills may not be identified.
String
LStatus Landfill Status Open/Closed
Status of landfill if known String
LYrClosed Yr Landfill Closed Year landfill closed String LOwner Landfill Owner Landfill owner String LOwnerType Landfill Owner
Type Describes landfill owner String
LGOperational Landfill Gas Operational
The landfill gas energy project is commercially operational. Landfills can have more than one LFG energy project record. For these sites, there may be potential to leverage LFG infrastructure for co-generation with renewable energy source.
String
Latitude Latitude Number Longitude Longitude Number
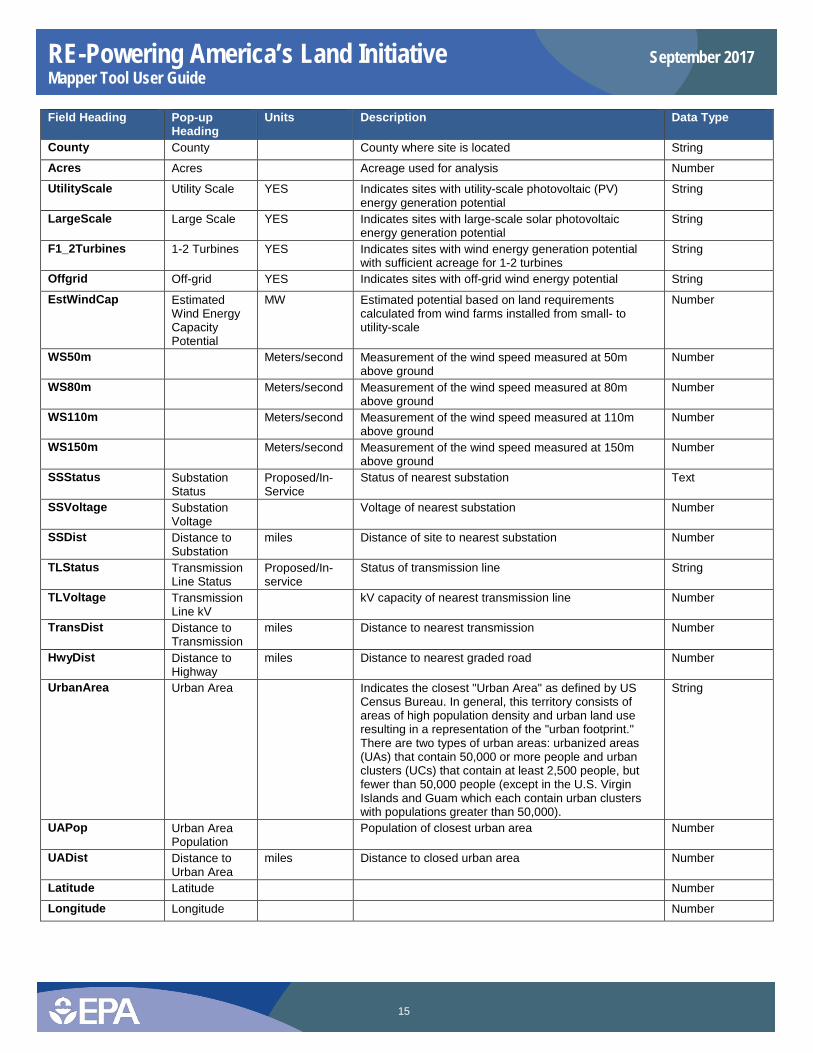
4.2 Wind Field Heading Pop-up
Heading Units Description Data Type
OBJECTID NA ArcGIS shape identifier Object ID Shape NA ArcGIS descriptor Geometry Reference Cross-
Reference Number
Site identification number for cross-reference with other renewable energy type tables
Number – but is a categorical marker
EPARegion EPA Region EPA Region where site is located Number – but is a categorical marker
State State State where site is located String
Program Program EPA or state program from which data were collected. See notes about program in Data Documentation
String
SiteStatus Site Status Link to the federal or state program area responsible for collecting information about the site. Follow this link to find contamination and clean-up status. See notes in Data Documentation
String
SiteID Site ID EPA or state unique identification code String
SiteProfile RE-Powering Profile
This link opens up a full page HTML profile of the relevant site data and renewable energy potential. This page can be saved or printed.
String
SiteName Site Name Name of site/property String
Address Address Address of site String
City City City where site is located String
RE-Powering America’s Land Initiative September 2017 Mapper Tool User Guide
15
Field Heading Pop-up Heading
Units Description Data Type
County County County where site is located String
Acres Acres Acreage used for analysis Number
UtilityScale Utility Scale YES Indicates sites with utility-scale photovoltaic (PV) energy generation potential
String
LargeScale Large Scale YES Indicates sites with large-scale solar photovoltaic energy generation potential
String
F1_2Turbines 1-2 Turbines YES Indicates sites with wind energy generation potential with sufficient acreage for 1-2 turbines
String
Offgrid Off-grid YES Indicates sites with off-grid wind energy potential String
EstWindCap Estimated Wind Energy Capacity Potential
MW Estimated potential based on land requirements calculated from wind farms installed from small- to utility-scale
Number
WS50m Meters/second Measurement of the wind speed measured at 50m above ground
Number
WS80m Meters/second Measurement of the wind speed measured at 80m above ground
Number
WS110m Meters/second Measurement of the wind speed measured at 110m above ground
Number
WS150m Meters/second Measurement of the wind speed measured at 150m above ground
Number
SSStatus Substation Status
Proposed/In- Service
Status of nearest substation Text
SSVoltage Substation Voltage
Voltage of nearest substation Number
SSDist Distance to Substation
miles Distance of site to nearest substation Number
TLStatus Transmission Line Status
Proposed/In-service
Status of transmission line String
TLVoltage Transmission Line kV
kV capacity of nearest transmission line Number
TransDist Distance to Transmission
miles Distance to nearest transmission Number
HwyDist Distance to Highway
miles Distance to nearest graded road Number
UrbanArea Urban Area Indicates the closest "Urban Area" as defined by US Census Bureau. In general, this territory consists of areas of high population density and urban land use resulting in a representation of the "urban footprint." There are two types of urban areas: urbanized areas (UAs) that contain 50,000 or more people and urban clusters (UCs) that contain at least 2,500 people, but fewer than 50,000 people (except in the U.S. Virgin Islands and Guam which each contain urban clusters with populations greater than 50,000).
String
UAPop Urban Area Population
Population of closest urban area Number
UADist Distance to Urban Area
miles Distance to closed urban area Number
Latitude Latitude Number
Longitude Longitude Number
RE-Powering America’s Land Initiative September 2017 Mapper Tool User Guide
16
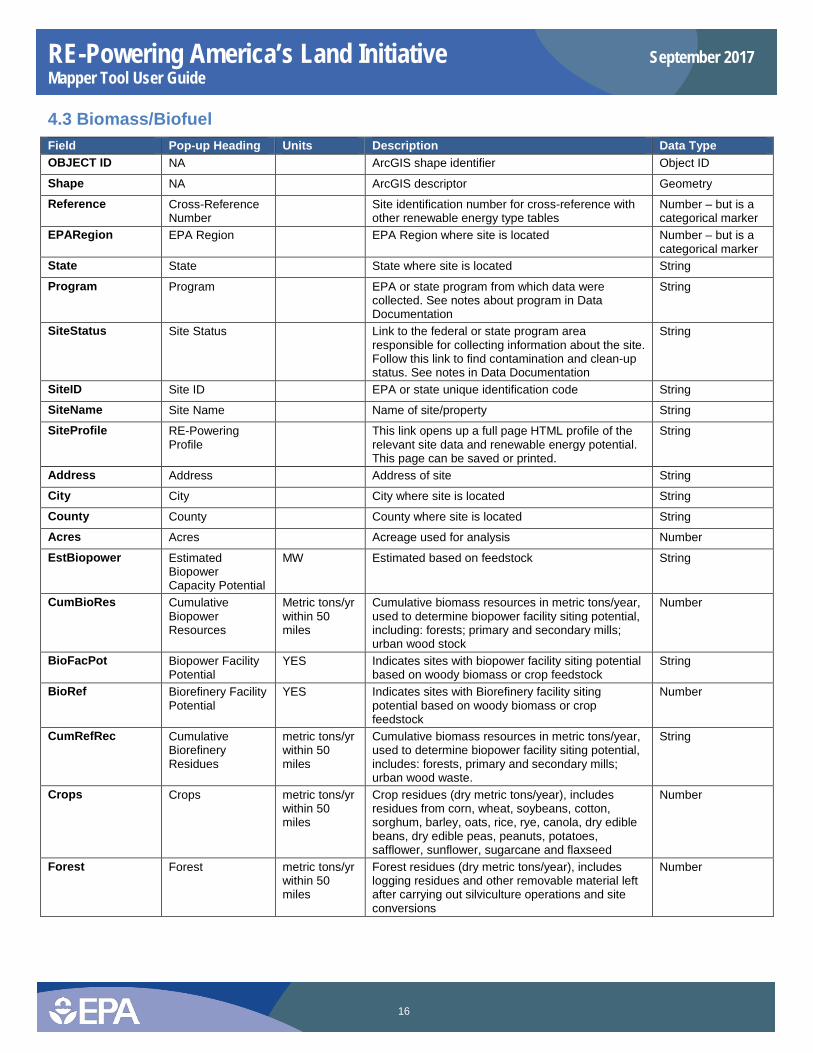
4.3 Biomass/Biofuel Field Pop-up Heading Units Description Data Type OBJECT ID NA ArcGIS shape identifier Object ID
Shape NA ArcGIS descriptor Geometry
Reference Cross-Reference Number
Site identification number for cross-reference with other renewable energy type tables
Number – but is a categorical marker
EPARegion EPA Region EPA Region where site is located Number – but is a categorical marker
State State State where site is located String
Program Program EPA or state program from which data were collected. See notes about program in Data Documentation
String
SiteStatus Site Status Link to the federal or state program area responsible for collecting information about the site. Follow this link to find contamination and clean-up status. See notes in Data Documentation
String
SiteID Site ID EPA or state unique identification code String
SiteName Site Name Name of site/property String
SiteProfile RE-Powering Profile
This link opens up a full page HTML profile of the relevant site data and renewable energy potential. This page can be saved or printed.
String
Address Address Address of site String
City City City where site is located String
County County County where site is located String
Acres Acres Acreage used for analysis Number
EstBiopower Estimated Biopower Capacity Potential
MW Estimated based on feedstock String
CumBioRes Cumulative Biopower Resources
Metric tons/yr within 50 miles
Cumulative biomass resources in metric tons/year, used to determine biopower facility siting potential, including: forests; primary and secondary mills; urban wood stock
Number
BioFacPot Biopower Facility Potential
YES Indicates sites with biopower facility siting potential based on woody biomass or crop feedstock
String
BioRef Biorefinery Facility Potential
YES Indicates sites with Biorefinery facility siting potential based on woody biomass or crop feedstock
Number
CumRefRec Cumulative Biorefinery Residues
metric tons/yr within 50 miles
Cumulative biomass resources in metric tons/year, used to determine biopower facility siting potential, includes: forests, primary and secondary mills; urban wood waste.
String
Crops Crops metric tons/yr within 50 miles
Crop residues (dry metric tons/year), includes residues from corn, wheat, soybeans, cotton, sorghum, barley, oats, rice, rye, canola, dry edible beans, dry edible peas, peanuts, potatoes, safflower, sunflower, sugarcane and flaxseed
Number
Forest Forest metric tons/yr within 50 miles
Forest residues (dry metric tons/year), includes logging residues and other removable material left after carrying out silviculture operations and site conversions
Number
RE-Powering America’s Land Initiative September 2017 Mapper Tool User Guide
17
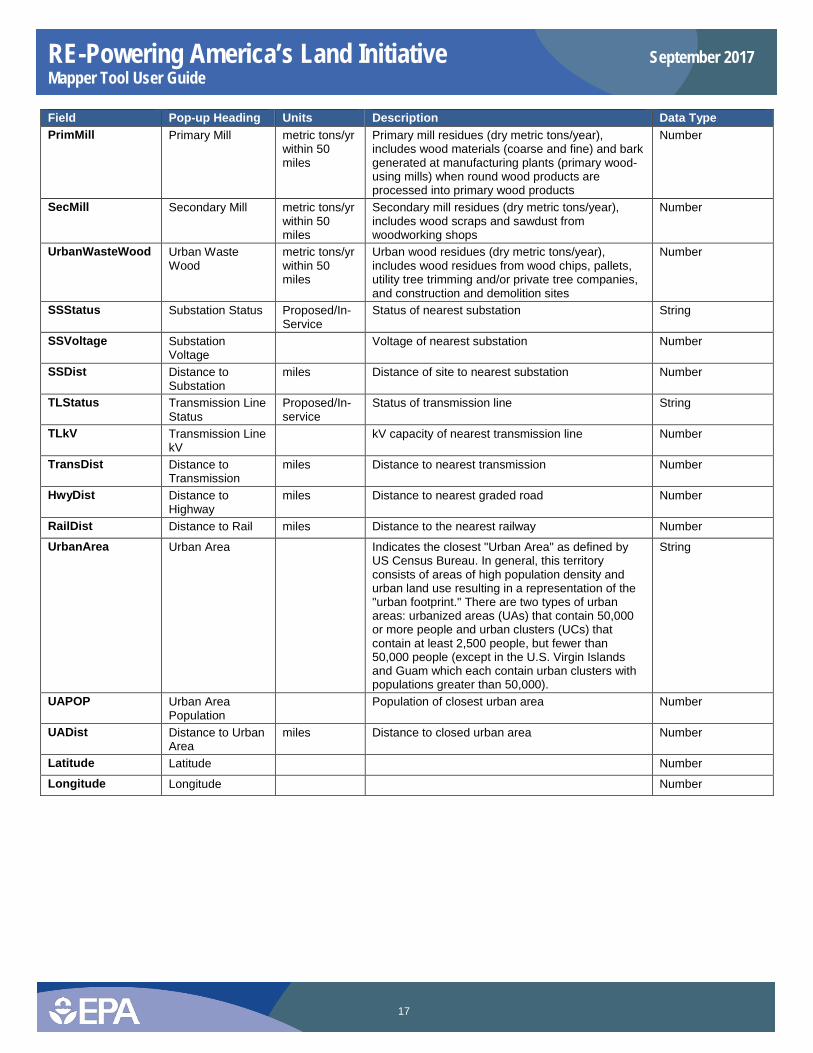
Field Pop-up Heading Units Description Data Type PrimMill Primary Mill metric tons/yr
within 50 miles
Primary mill residues (dry metric tons/year), includes wood materials (coarse and fine) and bark generated at manufacturing plants (primary wood-using mills) when round wood products are processed into primary wood products
Number
SecMill Secondary Mill metric tons/yr within 50 miles
Secondary mill residues (dry metric tons/year), includes wood scraps and sawdust from woodworking shops
Number
UrbanWasteWood Urban Waste Wood
metric tons/yr within 50 miles
Urban wood residues (dry metric tons/year), includes wood residues from wood chips, pallets, utility tree trimming and/or private tree companies, and construction and demolition sites
Number
SSStatus Substation Status Proposed/In- Service
Status of nearest substation String
SSVoltage Substation Voltage
Voltage of nearest substation Number
SSDist Distance to Substation
miles Distance of site to nearest substation Number
TLStatus Transmission Line Status
Proposed/In-service
Status of transmission line String
TLkV Transmission Line kV
kV capacity of nearest transmission line Number
TransDist Distance to Transmission
miles Distance to nearest transmission Number
HwyDist Distance to Highway
miles Distance to nearest graded road Number
RailDist Distance to Rail miles Distance to the nearest railway Number
UrbanArea Urban Area Indicates the closest "Urban Area" as defined by US Census Bureau. In general, this territory consists of areas of high population density and urban land use resulting in a representation of the "urban footprint." There are two types of urban areas: urbanized areas (UAs) that contain 50,000 or more people and urban clusters (UCs) that contain at least 2,500 people, but fewer than 50,000 people (except in the U.S. Virgin Islands and Guam which each contain urban clusters with populations greater than 50,000).
String
UAPOP Urban Area Population
Population of closest urban area Number
UADist Distance to Urban Area
miles Distance to closed urban area Number
Latitude Latitude Number
Longitude Longitude Number
RE-Powering America’s Land Initiative September 2017 Mapper Tool User Guide
18
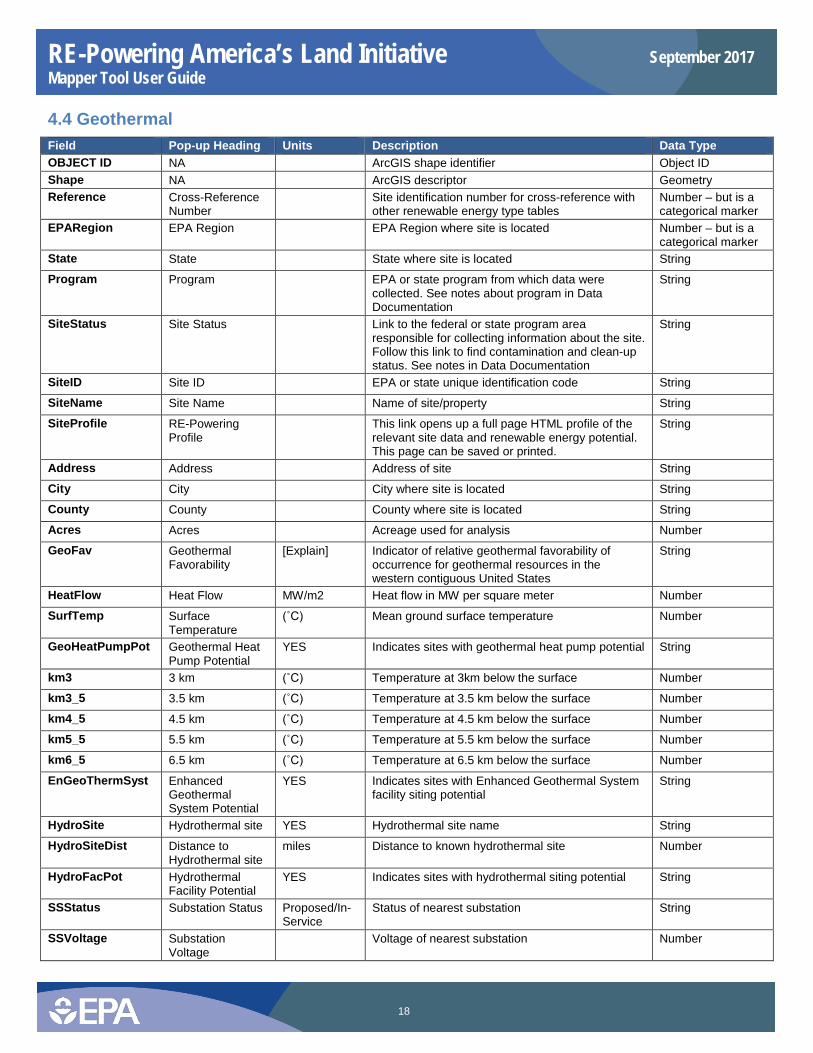
4.4 Geothermal Field Pop-up Heading Units Description Data Type OBJECT ID NA ArcGIS shape identifier Object ID Shape NA ArcGIS descriptor Geometry Reference Cross-Reference
Number Site identification number for cross-reference with
other renewable energy type tables Number – but is a categorical marker
EPARegion EPA Region EPA Region where site is located Number – but is a categorical marker
State State State where site is located String
Program Program EPA or state program from which data were collected. See notes about program in Data Documentation
String
SiteStatus Site Status Link to the federal or state program area responsible for collecting information about the site. Follow this link to find contamination and clean-up status. See notes in Data Documentation
String
SiteID Site ID EPA or state unique identification code String
SiteName Site Name Name of site/property String
SiteProfile RE-Powering Profile
This link opens up a full page HTML profile of the relevant site data and renewable energy potential. This page can be saved or printed.
String
Address Address Address of site String
City City City where site is located String
County County County where site is located String
Acres Acres Acreage used for analysis Number
GeoFav Geothermal Favorability
[Explain] Indicator of relative geothermal favorability of occurrence for geothermal resources in the western contiguous United States
String
HeatFlow Heat Flow MW/m2 Heat flow in MW per square meter Number
SurfTemp Surface Temperature
(˚C) Mean ground surface temperature Number
GeoHeatPumpPot Geothermal Heat Pump Potential
YES Indicates sites with geothermal heat pump potential String
km3 3 km (˚C) Temperature at 3km below the surface Number
km3_5 3.5 km (˚C) Temperature at 3.5 km below the surface Number
km4_5 4.5 km (˚C) Temperature at 4.5 km below the surface Number
km5_5 5.5 km (˚C) Temperature at 5.5 km below the surface Number
km6_5 6.5 km (˚C) Temperature at 6.5 km below the surface Number
EnGeoThermSyst Enhanced Geothermal System Potential
YES Indicates sites with Enhanced Geothermal System facility siting potential
String
HydroSite Hydrothermal site YES Hydrothermal site name String
HydroSiteDist Distance to Hydrothermal site
miles Distance to known hydrothermal site Number
HydroFacPot Hydrothermal Facility Potential
YES Indicates sites with hydrothermal siting potential String
SSStatus Substation Status Proposed/In- Service
Status of nearest substation String
SSVoltage Substation Voltage
Voltage of nearest substation Number
RE-Powering America’s Land Initiative September 2017 Mapper Tool User Guide
19
Field Pop-up Heading Units Description Data Type SSDist Distance to
Substation miles Distance of site to nearest substation Number
TLStatus Transmission Line Status
Proposed/In-service
Status of transmission line String
TLkV Transmission Line kV
kV capacity of nearest transmission line Number
TransDist Distance to Transmission
miles Distance to nearest transmission Number
HwyDist Distance to Highway
miles Distance to nearest graded road Number
UrbanArea Urban Area Indicates the closest "Urban Area" as defined by US Census Bureau. In general, this territory consists of areas of high population density and urban land use resulting in a representation of the "urban footprint." There are two types of urban areas: urbanized areas (UAs) that contain 50,000 or more people and urban clusters (UCs) that contain at least 2,500 people, but fewer than 50,000 people (except in the U.S. Virgin Islands and Guam which each contain urban clusters with populations greater than 50,000).
String
UAPop Urban Area Population
Population of closest urban area Number
UADist Distance to Urban Area
miles Distance to closed urban area Number
Latitude Latitude Number
Longitude Longitude Number
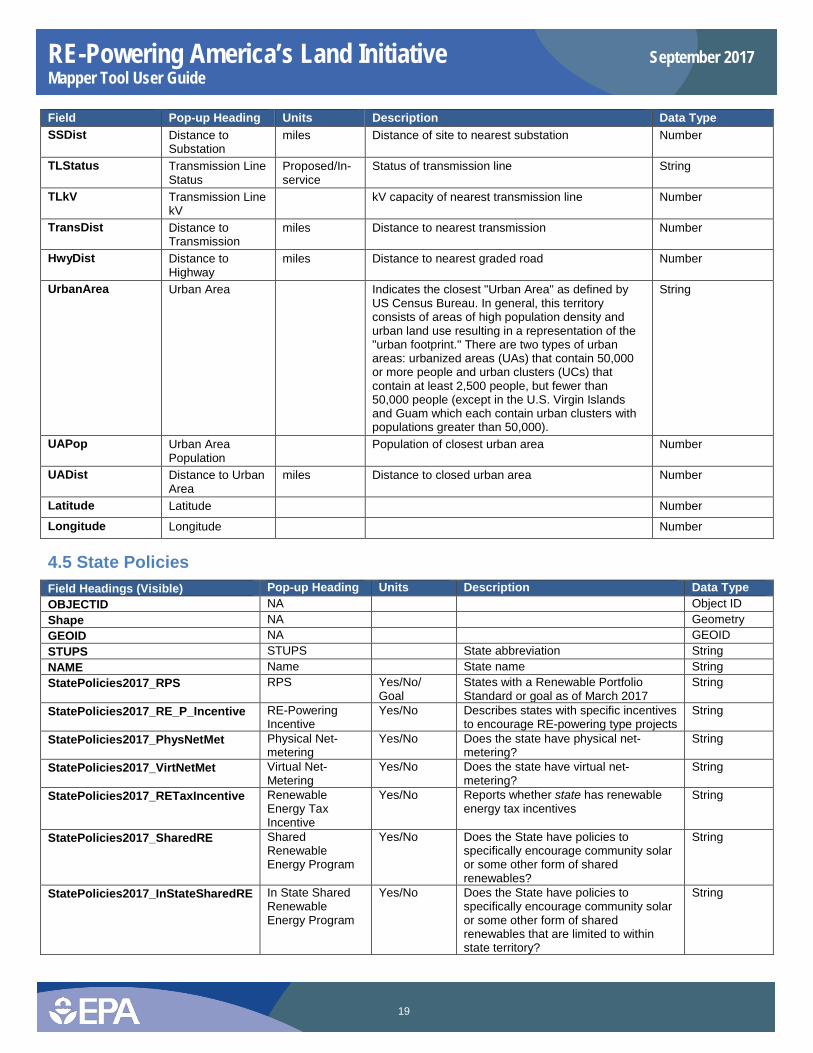
4.5 State Policies Field Headings (Visible) Pop-up Heading Units Description Data Type OBJECTID NA Object ID Shape NA Geometry GEOID NA GEOID STUPS STUPS State abbreviation String NAME Name State name String StatePolicies2017_RPS RPS Yes/No/
Goal States with a Renewable Portfolio Standard or goal as of March 2017
String
StatePolicies2017_RE_P_Incentive RE-Powering Incentive
Yes/No Describes states with specific incentives to encourage RE-powering type projects
String
StatePolicies2017_PhysNetMet Physical Net-metering
Yes/No Does the state have physical net-metering?
String
StatePolicies2017_VirtNetMet Virtual Net-Metering
Yes/No Does the state have virtual net-metering?
String
StatePolicies2017_RETaxIncentive Renewable Energy Tax Incentive
Yes/No Reports whether state has renewable energy tax incentives
String
StatePolicies2017_SharedRE Shared Renewable Energy Program
Yes/No Does the State have policies to specifically encourage community solar or some other form of shared renewables?
String
StatePolicies2017_InStateSharedRE In State Shared Renewable Energy Program
Yes/No Does the State have policies to specifically encourage community solar or some other form of shared renewables that are limited to within state territory?
String
RE-Powering America’s Land Initiative September 2017 Mapper Tool User Guide
20
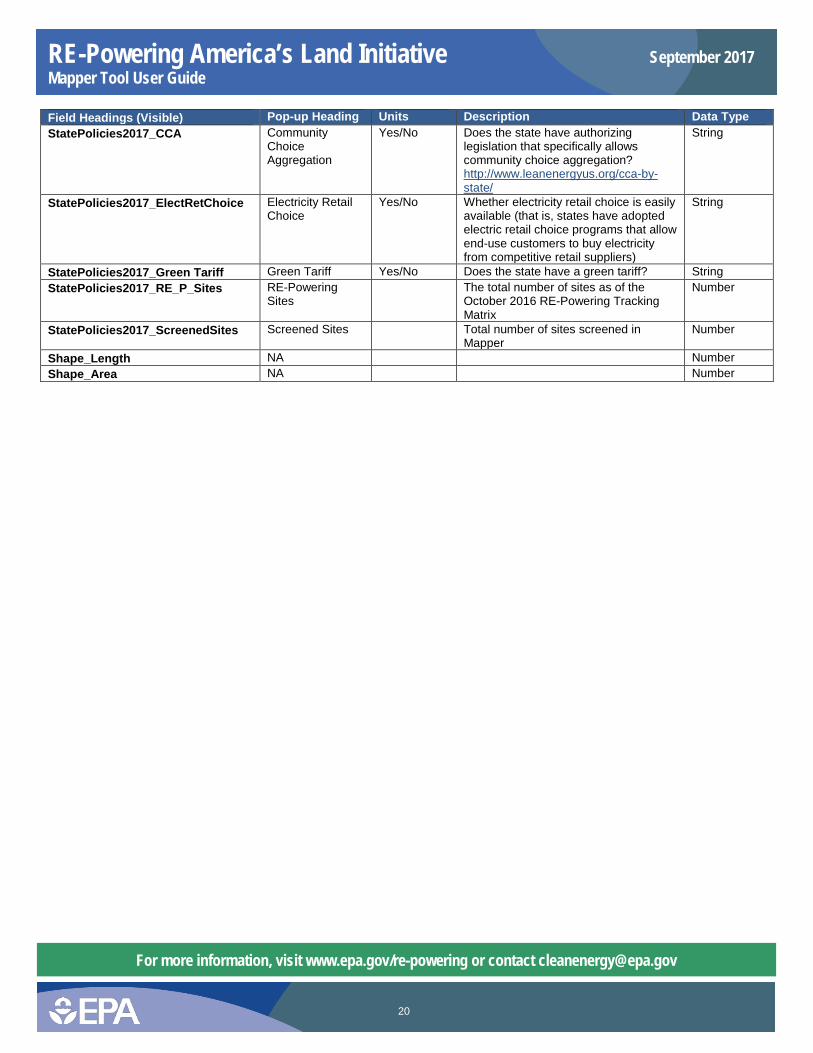
Field Headings (Visible) Pop-up Heading Units Description Data Type StatePolicies2017_CCA Community
Choice Aggregation
Yes/No Does the state have authorizing legislation that specifically allows community choice aggregation? http://www.leanenergyus.org/cca-by-state/
String
StatePolicies2017_ElectRetChoice Electricity Retail Choice
Yes/No Whether electricity retail choice is easily available (that is, states have adopted electric retail choice programs that allow end-use customers to buy electricity from competitive retail suppliers)
String
StatePolicies2017_Green Tariff Green Tariff Yes/No Does the state have a green tariff? String StatePolicies2017_RE_P_Sites RE-Powering
Sites The total number of sites as of the
October 2016 RE-Powering Tracking Matrix
Number
StatePolicies2017_ScreenedSites Screened Sites Total number of sites screened in Mapper
Number
Shape_Length NA Number Shape_Area NA Number
For more information, visit www.epa.gov/re-powering or contact [email protected]