Embed Size (px)
Citation preview
Mapping Air Quality: An Assessment of the Pollutants Dispersion in Inhabited Areas to Predict and Manage Environmental Risks
CARMEN LEANE NICOLESCU, GABRIEL GORGHIU, DANIEL DUNEA,
LAVINIA BURULEANU, VIRGIL MOISE Scientific Research Centre for Improving the Quality of Life in the frame of New Information and
Communication Technologies Valahia University Târgovişte
18-24 Unirii Boulevard, 130082 Târgovişte ROMANIA
[email protected] http://cavimetic.ssai.valahia.ro Abstract: - The momentary maximum concentration of the most important air pollutants (nitrogen oxide, sulfur dioxide, carbon monoxide and dusts) was determined using the dispersion curves of the pollutants in the densely inhabited areas of Dâmboviţa County. In order to present the industry-wide potential impact of air pollutants on the population and on the environment, maps showing air pollution levels have been generated using gathered data and model calculations. Emissions data were retrieved through an intensive survey locating, characterizing and monitoring all important stationary sources. Weather and wind can result in exposures that occur in different locations from where the emissions actually occurred, and can create new pollutants due to chemical reactions in the atmosphere. There were used on-line collected meteorological and air quality data. Geo-applications were used to obtain Digital Elevation Models from the corresponding orthophotos through raster-vector conversion for each envisaged areas. Once an orthophoto has been prepared, the images displayed are spatially attributed (accurately mapped) and can be linked with any other data that is spatially attributed through geographic information system (G.I.S.). New information, collected from a combination of photo-interpretation, ground reconnaissance, and specific measurements, were layered on top of the orthophoto for easy reference. A Gaussian mathematical model allowed the calculation of the pollutants dispersion in air in order to estimate the environmental risk situations. The pollutant concentrations curves for various scenarios were overlaid on DEMs indicating the most exposed inhabited areas to pollutants. With the aid of measurements and scenarios, pollutant maps show the present and future air pollution situation in Dâmboviţa county with regard to various nocive substances. The results presented in this paper are obtained in the frame of the MEMDUR Project, which has as the main objective to design, develop, test and implement in Dâmboviţa County an advanced management system, which has to assure the evaluation of the environmental risk in order to administrate the crises situations. Key-Words: - air pollution, MEMDUR Project, monitoring system, pollutant dispersion, environmental risk 1 Introduction A clean air supply is essential to our own health and that of the environment. But since the industrial revolution, the air quality has been deteriorated considerably, mainly as a result of human activities. For example, air pollution is increasingly being cited as the main cause of lung conditions such as asthma - twice as many people suffer from asthma today compared to 20 years ago [8]. Air pollution has been one of Europe's main political concerns since the late 1970s [21]. European Union policy on air quality aims to develop and implement appropriate instruments to improve air quality [13]. As the result of EU legislation, much progress has been made in tackling air pollutants such as sulfur dioxide, lead, nitrogen oxides, carbon monoxide and benzene.
However, despite a reduction in some harmful emissions, air quality continues to cause problems [25]. In Romania, according the law no.265/2006 for approving The Emergency Ordinance no. 195/2005 [27, 28, 29] regarding the environment protection, the authorities for the environment protection are responsible for the monitoring of the ambient air quality. The monitored pollutants, the measurement methods, the limit values, the warning and the information levels, the criteria for locating the monitoring places are established by the national legislation regarding the atmosphere protection, complying with the European regulations. The National Agency for the Environment Protection, which is subordinate to The Ministry of Environment and Sustainable Development,
WSEAS TRANSACTIONS on ENVIRONMENT and DEVELOPMENTCarmen Leane Nicolescu, Gabriel Gorghiu, Daniel Dunea, Lavinia Buruleanu, Virgil Moise
ISSN: 1790-5079 1078 Issue 12, Volume 4, December 2008
maintains the web site www.calitateaer.ro, informing the people, in real time, about the quality parameters of the air, monitored in more than 100 stations from the Romania’s area. These stations compile The National Network of Air Quality Monitoring (RNMCA). The site shows the quality parameters and the measured values, hourly updated, emerged in checkout and certification process. RNMCA is performing continuous measurements of sulfur dioxide (SO2), nitrogen oxides (NOx), carbon monoxide (CO), ozone (O3), particulate matters (PM10 and PM2.5), benzene (C6H6) and lead (Pb). The air quality in each station is represented through suggestive quality parameters, established on the concentration values basis of the main atmospheric measured pollutants.
In Romania, there are 117 stations for the continuous air quality monitoring equipped with automatic devices for measuring the concentrations of the principal atmospheric pollutants. RNMCA includes 38 local centers, which collect the data provided by the stations and send the environmental information to the public through the informing panels. The monitoring system allows the local authorities to evaluate the level of the air quality, to take, in proper time, quick measures to diminish and/or eliminate the pollution incidents or in the emergency situations, to prevent the accidental pollution, to notice and to protect the people in the emergency case. The information related to the air quality is provided by the monitoring stations and the values measured on-line by the sensors of the station analyzers are transmitted through GPRS to the local centers. The values must be comprehended under the reticence that there are practically validated only automatic (towards software). At the local centers the specialists validate manual all these data, which afterwards will be certified at the central level. Specific databases stock and archive both the raw data and the validated and certificated data. The specialists access these data to realize different studies, respectively for referencing the Romanian reports to European forums. In Dâmboviţa County, the Local Agency for the Environment Protection manages two automatic stations which monitors in real time the meteorological parameters (temperature, wind speed, wind direction, solar radiation intensity, quantity of precipitations, atmospheric pressure), gaseous pollutants (nitrogen oxides, sulfur dioxide, carbon monoxide and ozone) and particulate matters (PM10 fraction). In addition, the Dâmboviţa County air quality is monitored by two fixed stations, with manual manipulation of samples. In these points, the
activity of air quality monitoring supports the on-line collecting of environmental data. The main sources and activities which are polluting the atmosphere in Dâmboviţa County are: a) combustion processes in burning installations - the principal source being the thermal power plant of Doiceşti. The most important emissions in atmosphere are the combustion pollutants. b) industrial plants - such sources are generally concentrated in zones situated in the proximity of the urban areas, consequently the inhabited zones. Thus a variety of substances with pollution potential are emitted in the air. The dusts emissions from metallurgy (with a variable content in metals) affect the human health and the environment, besides those eliminated through combustion (SO2, NO2, NO and CO2); the dusts emissions from the industry of building materials etc. c) road traffic - intense especially in the urban localities and along the national highways, affect the quality of the atmosphere through the exhausted gases emissions. d) agriculture - the animal husbandry and the activities from the field of the sanitation, due to the defective management of the vegetable remnants, of the animal dejections and of the household waste products. In the atmosphere, the emissions result from the organic material decomposition. They have characteristic compositions (methane, hydrogen sulphide, different organic compounds with sulphur, particles, germs with pathogenic potential for human and animals etc.) In accordance to EU environmental legislation, it is necessary to solve the pollution monitoring problems, considering the actual situation in Dâmboviţa County, due to the existence of several industrial plants with high air pollution potential. Several issues needs to be addressed when considering the creation of feasible and viable monitoring instruments that can be used for sustainable environmental management through the analysis of spatial databases populated with climatic and environmental indicators. Such instruments might provide the capacity to forecast and to prevent eventual environmental risks and to offer appropriate solutions [5, 6].
A comprehensive environmental assessment system can facilitate tracking and benchmarking of the performance, providing a tool for measuring any continuous improvement [22]. 2 The MEMDUR Project Having all the abovementioned aspects as background, a three years research project was
WSEAS TRANSACTIONS on ENVIRONMENT and DEVELOPMENTCarmen Leane Nicolescu, Gabriel Gorghiu, Daniel Dunea, Lavinia Buruleanu, Virgil Moise
ISSN: 1790-5079 1079 Issue 12, Volume 4, December 2008
proposed by Valahia University Târgovişte in the frame of National Plan for Research 2. Consequently, the project “Sustainable Management System of Resources Used for Monitoring and Evaluating the Environmental Risks in Order to Prevent the Negative Effects and to Manage Crises Situations - MEMDUR”, code D11-037/18.09.2007 [30], has as main objective to design, develop, test and implement in Dâmboviţa County an advanced management system, which has to assure the evaluation of the environmental risk in order to administrate the crises situations, in accordance with the demands required by the sustainable development on local, regional and national level [2, 9, 11, 14, 15]. The general goals of the management system are: 1. Increasing the technical and informational level for the identification of the specific conditions in Dâmboviţa County where environmental risks factors are present (pollution source, specific pollutant, dispersion mechanism, impact) - in this frame, the selection of the environmental factors and atmosphere pollution sources will allow the estimation of a series of risk situations and the selection of the best monitoring points. Beside, the effectuation of pollutants analyses (dusts, pollution gases, noises), both with classical methods and online methods, will allow the determination of the efficiency of data utilization from online monitoring on evaluation and forecast activities. 2. Spatial development through an efficient resources management system definition and the existent systems adaptation to knowledge-based information society demands (knowledge management). 3. Systemic and detailed conception of information tools needed for territory spatial planning to provide the environmental risks evaluation in order to anticipate and prevent the negative effects. 4. The development of the sustainable management system and demonstration of its utility from the point of view of providing the reduction of costs to remove the risk generating causes and the effects on the environment and population. 5. The development of applications with information support which provides the technical content necessary for increasing the level of certitude in elaboration of technical and technological non-generating ecological risks solutions. 6. The generalization of good practices of sustainable resources management through large-scale research results dissemination and increasing
the prestige of the consortium created in the frame of the project. The finalized management system will have at least two minimal components: a. Spatial databases: contain the vectorial representation of the real world attached to a coordinates system. Three typical elements of spatial database will be implemented: position - in terms of spatial coordinates; attributes - characteristics of geographic entities (pollution factors names, admitted limit values, current values and alarming thresholds); spatial relations - relative position from the entities and characteristics (topology); b. The applicative software (client-server architecture) designed for creation, maintaining and exploitation of databases and for the communication with the system database. In order to represent the graphical entities, GIS technologies will be used for geographical data processing: geo referencing, vectorization and digital mapping. The data collected in the field are digitized in order to realize the digital plan and to populate the spatial database. The vectorial model stores the graphical information (shape of point sequences and linking segments) [23]. Finally, the management system will provide the real-time atmosphere pollutants monitoring methods and registering of data into the relational database system. There is envisaged the proving of automated online monitoring methods, in point of reliability (systems which can function automated for a long period of time) and their sensibility (to the detection level), being known the quickness of data providing (real-time measurements) [19, 24]. The paper outlines the results obtained in the frame of the first and second phases of the MEMDUR project dedicated to the analyses of the processes which occur as results of the atmospheric pollutants emission [30]. Dispersion maps of pollutants [3, 10, 12, 17] were compiled in order to estimate the environmental risk situations, focusing on their momentary maximum concentration. This parameter offers the base of air pollutants real-time analysis and provides the necessary information for forecasting the levels of the pollutants to different locations from the origin source [3, 10, 12, 17]. 3 Materials and Methods In the first and second stage of the MEMDUR project, geo-applications (GeoMedia, MicroTop and GeoTrans) were used for solving the task related to the evaluation of the pollution level through mathematical modelling of the pollutants dispersion
WSEAS TRANSACTIONS on ENVIRONMENT and DEVELOPMENTCarmen Leane Nicolescu, Gabriel Gorghiu, Daniel Dunea, Lavinia Buruleanu, Virgil Moise
ISSN: 1790-5079 1080 Issue 12, Volume 4, December 2008
in air. For the air quality studies, spatial data is crucial. The tools for performing such analysis generally are based on either vector or raster (grid) data models.
There were selected three of the most polluted urban areas of the Dambovita County: Targoviste, Fieni and Titu, and the rural area of Doicesti. It became possible to depict accurately all stationary emission sources, adjacent lands, and inhabited buildings in these regions with orthophotogrammetry, or orthophotos using existing survey information or the Global Positioning System (G.P.S.) technology.
Orthophotos had the clarity of aerial photography with the additional benefit of being true to scale for linear and area measurements. Together with associated data (attributes), orthophotos can provide risk management with the information needed to evaluate the air pollution impact on population.
A DEM was developed for each locality from the corresponding orthophotos through raster-vector conversion. The DEM was automatically generated in uSMART 8.52.1, using Cartesian points network by knowing the X, Y coordinates and computing through interpolation the elevation Z. The result was manually corrected on digital photogrammetric station using editing techniques such as separation lines to preserve the stereographic georeferencing system. The GPS survey provided the precise positioning of the most important stationary emission sources and the coordinates were layered on the corresponding orthophoto.
Local meteorological processes control the amount of pollution as it spreads and reaches ground level. Meteorological data was obtained from on-site measurement and from the nearest weather stations. On-line collected air quality data from the monitoring network of the Dâmboviţa Environmental Protection Agency were also used to compare the recorded imissions with the dispersion scenarios results [16, 26].
An analysis of the pollution status was performed for the most important pollutants affecting the human health established by the legislation [31, 32] as follows: CO, NO, NO2, SO2 and PM10 dusts. The values were compared with the hourly maximum admitted concentrations for preserving human health.
For establishing the areas were the level of pollution generated by the stationary pollution sources is maximum, it was used a Gaussian mathematical model that incorporates source-related factors and meteorological factors to estimate pollutant concentration from stationary sources [1, 4]. The equation used for the dispersion calculus is:
C(X,Y) = [Q/(2π×σY×σX×U)] × exp(-0.5×Y2/σY2)
× exp(-0.5×H2/σX2) [7]
where: C(X,Y) - pollutant concentration in (x,y) point; Q - mass flow; H - the effective height of the pollution source, function of the chimney height, its diameter, speed and temperature of gas exhaustion, air layering; σX, σY - dispersion parameters, function of source - receptor distance and air layering where the dispersion is present; U - the wind speed measured at the height of the source. This model use as basic criterion the wind speed, which is the most important meteorological parameter influencing the dispersion around the source [20]. Using the Gaussian model and other additional relations, it was possible to compute ground level concentrations at any receptor point (Xo,Yo) in the region resulting from each of the isolated sources in the emission inventory. The concentration distribution was available by computing the corresponding values at various receptors and summing over all sources. 4 Results and Discussions Previous studies realized in the frame of the MEMDUR Project have established the most polluted areas in the Dâmboviţa County: the industrial ones situated near inhabited areas of Târgovişte, Fieni, Doiceşti and Titu.
In the envisaged inhabited areas, pollutants of concern include ground-level ozone, which is formed by the chemical reaction of pollutants from vehicular exhaust emissions, power plants, and other industrial sources and particulate matter, which includes dust, dirt, soot, smoke, and liquid droplets emitted into the air by sources such as vehicles, factories, and construction activities. Both of these pollutants have been linked to asthma and other respiratory illnesses.
There were identified 17 stationary sources with mass flows greater than 4 m3 s-1 from which the most relevant have been the Doiceşti power plant (1074.6 and 392.5 m3 s-1), Târgovişte special steel factory (172.3 and 43.9 m3 s-1), and the Fieni cement factory (153 and 27 m3 s-1).
The annual and 24 hours MAC exceeding are still recorded in a high number of the monitored localities of Romania. The annual average concentrations - imissions values often exceeded MAC (0.075 mg/m3) in Targoviste, town considered as PM10 fraction risk area at national level. Within the Targoviste area, exceeding of the limit values of
WSEAS TRANSACTIONS on ENVIRONMENT and DEVELOPMENTCarmen Leane Nicolescu, Gabriel Gorghiu, Daniel Dunea, Lavinia Buruleanu, Virgil Moise
ISSN: 1790-5079 1081 Issue 12, Volume 4, December 2008
the annual mean concentrations for the protection of the eco-systems (0.030 mg/m3) was recorded in 1999 (0.0305 mg/m3). The main SO2 pollution sources (about 72%) have been represented by power combustions and conversion industries. The annual limit value for the protection of the eco-systems is 0.020 mg/m3. Within the areas, exceeding of the limit values of the annual MAC was recorded between 1996 and 2003. The SO2 emission decreases were due mainly to the reducing of sulfur content of the fuels used during the activities that generate thermal and electric power.
Consequently, in these locations the most important pollutants are CO, NO, NO2, SO2 and PM10 dusts. One of the most important results is linked to the development of the pollutant dispersion maps. The isolines show the momentary maximum concentration for each pollutant. This indicator was considered because it provides the most comprehensive information on the pollution level on each moment at a specific point of the area and it can be effectively used in managing possible crisis situations.
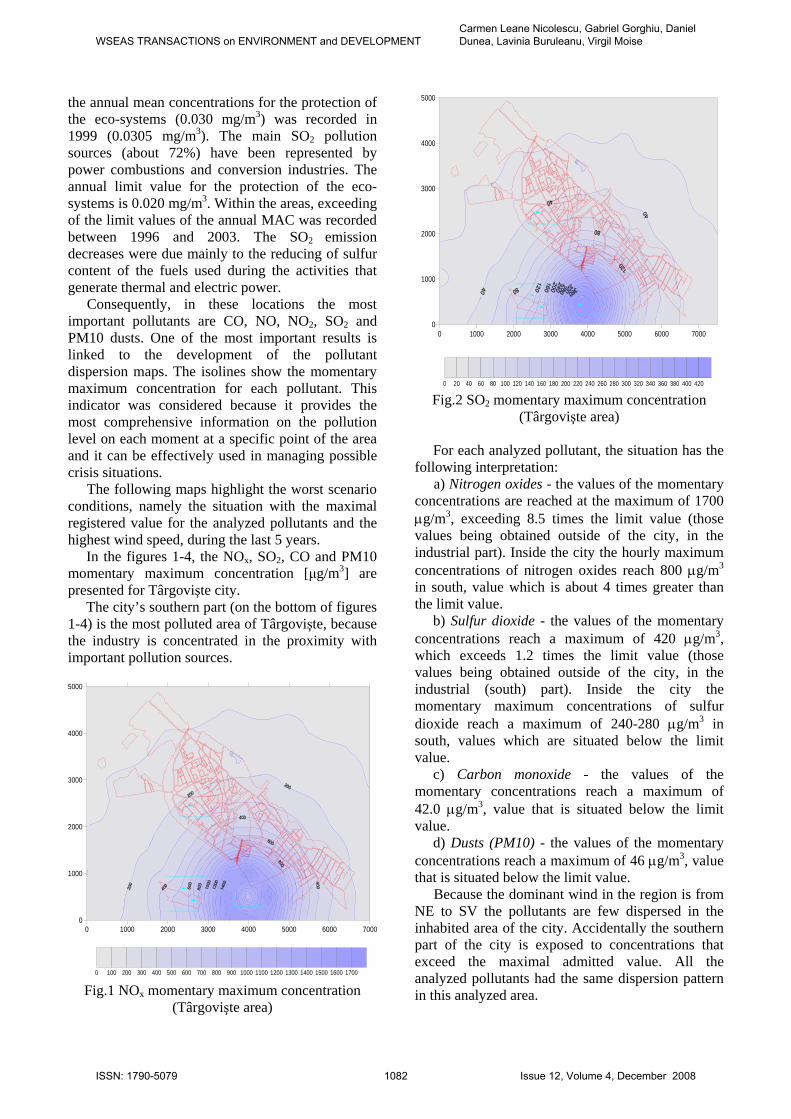
The following maps highlight the worst scenario conditions, namely the situation with the maximal registered value for the analyzed pollutants and the highest wind speed, during the last 5 years. In the figures 1-4, the NOx, SO2, CO and PM10 momentary maximum concentration [μg/m3] are presented for Târgovişte city. The city’s southern part (on the bottom of figures 1-4) is the most polluted area of Târgovişte, because the industry is concentrated in the proximity with important pollution sources.
0 1000 2000 3000 4000 5000 6000 70000
1000
2000
3000
4000
5000
0 100 200 300 400 500 600 700 800 900 1000 1100 1200 1300 1400 1500 1600 1700
Str. N ifon
Str. Mr. Spir escu
SC Mechel SA\P\P378711.953/ 536379.749
SC Otelinox SA\P\P378639.979/ 535318.489
SC Erdemir Romania SRL\P\P378905.496/ 535068.764
SC Otelinox SA\P\P380756.480/ 535236.420
Fig.1 NOx momentary maximum concentration
(Târgovişte area)
0 1000 2000 3000 4000 5000 6000 70000
1000
2000
3000
4000
5000
0 20 40 60 80 100 120 140 160 180 200 220 240 260 280 300 320 340 360 380 400 420
Str. N ifon
Str. Mr. Spirescu
SC Mechel SA\P\P378711.953/ 536379.749
SC Otelinox SA\P\P378639.979/ 535318.489
SC Erdemir Romania SRL\P\P378905.496/ 535068.764
SC Otelinox SA\P\P380756.480/ 535236.420
Fig.2 SO2 momentary maximum concentration
(Târgovişte area)
For each analyzed pollutant, the situation has the following interpretation:
a) Nitrogen oxides - the values of the momentary concentrations are reached at the maximum of 1700 μg/m3, exceeding 8.5 times the limit value (those values being obtained outside of the city, in the industrial part). Inside the city the hourly maximum concentrations of nitrogen oxides reach 800 μg/m3 in south, value which is about 4 times greater than the limit value. b) Sulfur dioxide - the values of the momentary concentrations reach a maximum of 420 μg/m3, which exceeds 1.2 times the limit value (those values being obtained outside of the city, in the industrial (south) part). Inside the city the momentary maximum concentrations of sulfur dioxide reach a maximum of 240-280 μg/m3 in south, values which are situated below the limit value. c) Carbon monoxide - the values of the momentary concentrations reach a maximum of 42.0 μg/m3, value that is situated below the limit value. d) Dusts (PM10) - the values of the momentary concentrations reach a maximum of 46 μg/m3, value that is situated below the limit value.
Because the dominant wind in the region is from NE to SV the pollutants are few dispersed in the inhabited area of the city. Accidentally the southern part of the city is exposed to concentrations that exceed the maximal admitted value. All the analyzed pollutants had the same dispersion pattern in this analyzed area.
WSEAS TRANSACTIONS on ENVIRONMENT and DEVELOPMENTCarmen Leane Nicolescu, Gabriel Gorghiu, Daniel Dunea, Lavinia Buruleanu, Virgil Moise
ISSN: 1790-5079 1082 Issue 12, Volume 4, December 2008
0 1000 2000 3000 4000 5000 6000 70000
1000
2000
3000
4000
5000
0 20 40 60 80 100 120 140 160 180 200 220 240 260 280 300 320 340 360 380 400 420
S tr. Nifon
S tr. Mr. Spir escu
SC Mechel SA\P\P378711.953/ 536379.749
SC Otelinox SA\P\P378639.979/ 535318.489
SC Erdemir Romania SRL\P\P378905.496/ 535068.764
SC Otelinox SA\P\P380756.480/ 535236.420
Fig.3 CO momentary maximum concentration
(Târgovişte area)
0 1000 2000 3000 4000 5000 6000 70000
1000
2000
3000
4000
5000
0 2 4 6 8 10 12 14 16 18 20 22 24 26 28 30 32 34 36 38 40 42 44 46
S tr. N ifon
S tr. Mr . Spir escu
SC Mechel SA\P\P378711.953/ 536379.749
SC Otelinox SA\P\P378639.979/ 535318.489
SC Erdemir Romania SRL\P\P378905.496/ 535068.764
SC Otelinox SA\P\P380756.480/ 535236.420
Fig.4 PM10 momentary maximum concentration
(Târgovişte area)
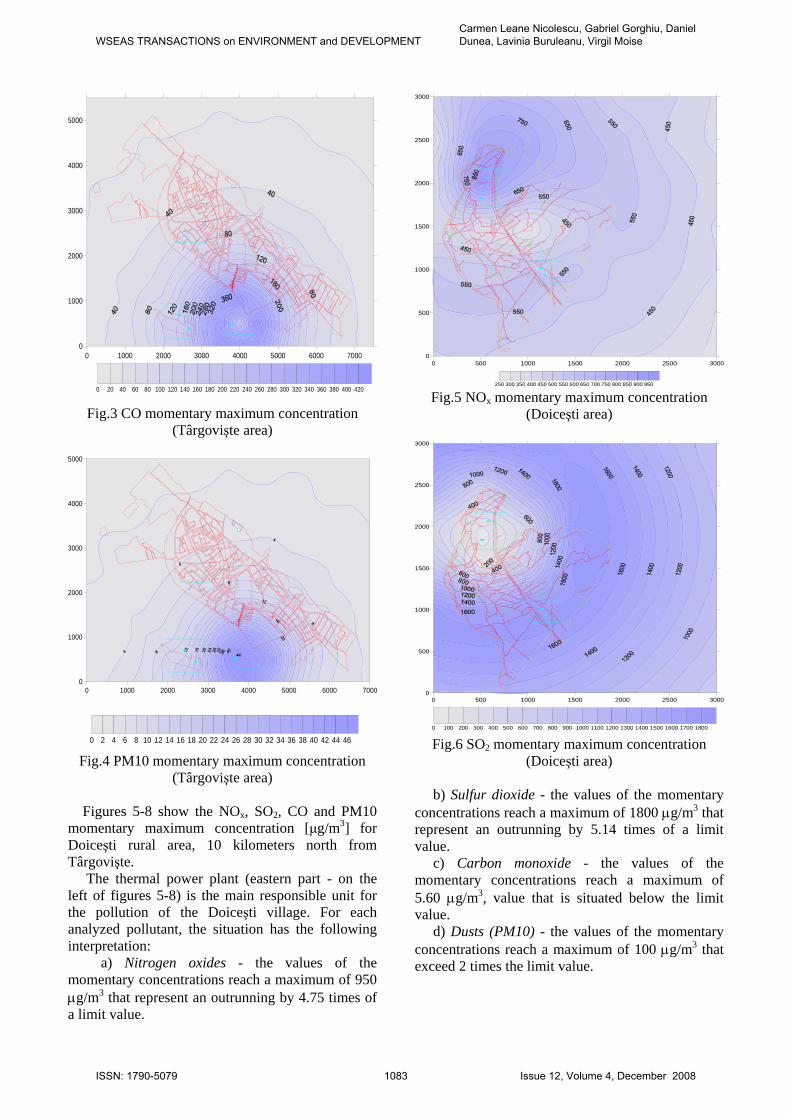
Figures 5-8 show the NOx, SO2, CO and PM10 momentary maximum concentration [μg/m3] for Doiceşti rural area, 10 kilometers north from Târgovişte. The thermal power plant (eastern part - on the left of figures 5-8) is the main responsible unit for the pollution of the Doiceşti village. For each analyzed pollutant, the situation has the following interpretation: a) Nitrogen oxides - the values of the momentary concentrations reach a maximum of 950 μg/m3 that represent an outrunning by 4.75 times of a limit value.
0 500 1000 1500 2000 2500 30000
500
1000
1500
2000
2500
3000
SC Soceram SA\P\P387240.029/ 532936.004
SC Nubiola Romania SRL\P\P387403.212/ 532841.636
SC Termoelectrica - SE Doicesti\P\P389192.295/ 531463.319
SC Soceram SA\P\P389677.277/ 531613.762
250 300 350 400 450 500 550 600 650 700 750 800 850 900 950 Fig.5 NOx momentary maximum concentration
(Doiceşti area)
0 500 1000 1500 2000 2500 30000
500
1000
1500
2000
2500
3000
SC Soceram SA\P\P387240.029/ 532936.004
SC Nubiola Romania SRL\P\P387403.212/ 532841.636
SC Termoelectrica - SE Doicesti\P\P389192.295/ 531463.319
SC Soceram SA\P\P389677.277/ 531613.762
0 100 200 300 400 500 600 700 800 900 1000 1100 1200 1300 1400 1500 1600 1700 1800 Fig.6 SO2 momentary maximum concentration
(Doiceşti area) b) Sulfur dioxide - the values of the momentary concentrations reach a maximum of 1800 μg/m3 that represent an outrunning by 5.14 times of a limit value. c) Carbon monoxide - the values of the momentary concentrations reach a maximum of 5.60 μg/m3, value that is situated below the limit value. d) Dusts (PM10) - the values of the momentary concentrations reach a maximum of 100 μg/m3 that exceed 2 times the limit value.
WSEAS TRANSACTIONS on ENVIRONMENT and DEVELOPMENTCarmen Leane Nicolescu, Gabriel Gorghiu, Daniel Dunea, Lavinia Buruleanu, Virgil Moise
ISSN: 1790-5079 1083 Issue 12, Volume 4, December 2008
0 500 1000 1500 2000 2500 30000
500
1000
1500
2000
2500
3000
SC Soceram SA\P\P387240.029/ 532936.004
SC Nubiola Romania SRL\P\P387403.212/ 532841.636
SC Termoelectrica - SE Doicesti\P\P389192.295/ 531463.319
SC Soceram SA\P\P389677.277/ 531613.762
80 90 100 110 120 130 140 150 160 170 180 190 200 210 220 230 240 250 260 270 280 290 300 Fig.7 CO momentary maximum concentration
(Doiceşti area)
0 500 1000 1500 2000 2500 30000
500
1000
1500
2000
2500
3000
5 10 15 20 25 30 35 40 45 50 55 60 65 70 75 80 85 90 95100
SC Soceram SA\P\P387240.029/ 532936.004
SC Nubiola Romania SRL\P\P387403.212/ 532841.636
SC Termoelectrica - SE Doicesti\P\P389192.295/ 531463.319
SC Soceram SA\P\P389677.277/ 531613.762
Fig.8 PM10 momentary maximum concentration
(Doiceşti area)
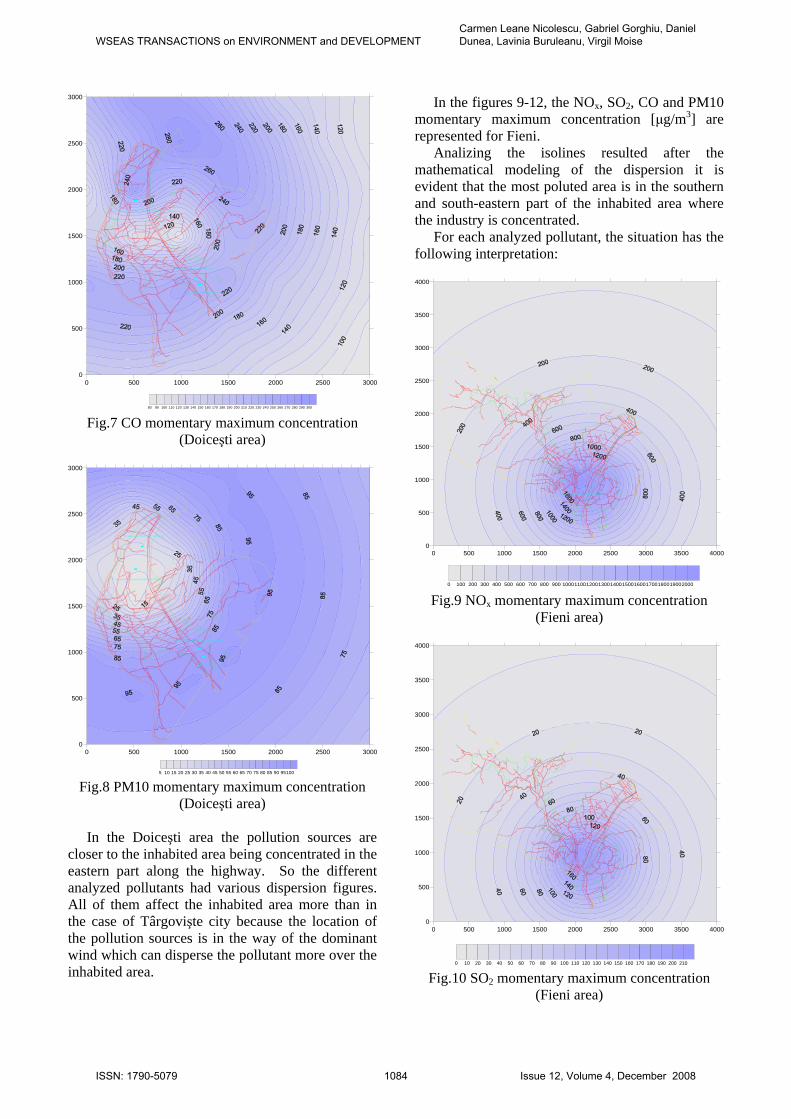
In the Doiceşti area the pollution sources are closer to the inhabited area being concentrated in the eastern part along the highway. So the different analyzed pollutants had various dispersion figures. All of them affect the inhabited area more than in the case of Târgovişte city because the location of the pollution sources is in the way of the dominant wind which can disperse the pollutant more over the inhabited area.
In the figures 9-12, the NOx, SO2, CO and PM10 momentary maximum concentration [μg/m3] are represented for Fieni.
Analizing the isolines resulted after the mathematical modeling of the dispersion it is evident that the most poluted area is in the southern and south-eastern part of the inhabited area where the industry is concentrated.
For each analyzed pollutant, the situation has the following interpretation:
0 500 1000 1500 2000 2500 3000 3500 40000
500
1000
1500
2000
2500
3000
3500
4000
SC Carpatcement Holding SA\P\P402422.794/ 532966.587
0 100 200 300 400 500 600 700 800 900 10001100120013001400150016001700180019002000 Fig.9 NOx momentary maximum concentration
(Fieni area)
0 500 1000 1500 2000 2500 3000 3500 40000
500
1000
1500
2000
2500
3000
3500
4000
SC Carpatcement Holding SA\P\P402422.794/ 532966.587
0 10 20 30 40 50 60 70 80 90 100 110 120 130 140 150 160 170 180 190 200 210 Fig.10 SO2 momentary maximum concentration
(Fieni area)
WSEAS TRANSACTIONS on ENVIRONMENT and DEVELOPMENTCarmen Leane Nicolescu, Gabriel Gorghiu, Daniel Dunea, Lavinia Buruleanu, Virgil Moise
ISSN: 1790-5079 1084 Issue 12, Volume 4, December 2008
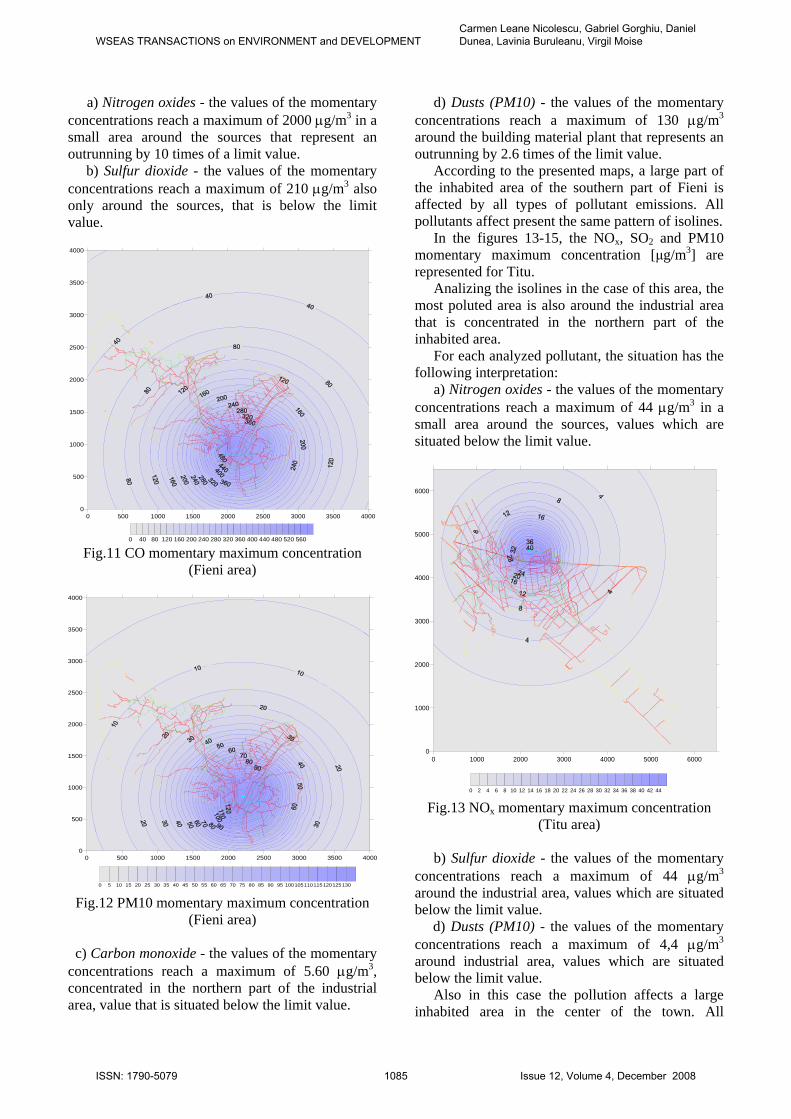
a) Nitrogen oxides - the values of the momentary concentrations reach a maximum of 2000 μg/m3 in a small area around the sources that represent an outrunning by 10 times of a limit value. b) Sulfur dioxide - the values of the momentary concentrations reach a maximum of 210 μg/m3 also only around the sources, that is below the limit value.
0 500 1000 1500 2000 2500 3000 3500 40000
500
1000
1500
2000
2500
3000
3500
4000
SC Carpatcement Holding SA\P\P402422.794/ 532966.587
0 40 80 120 160 200 240 280 320 360 400 440 480 520 560 Fig.11 CO momentary maximum concentration
(Fieni area)
0 500 1000 1500 2000 2500 3000 3500 40000
500
1000
1500
2000
2500
3000
3500
4000
SC Carpatcement Holding SA\P\P402422.794/ 532966.587
0 5 10 15 20 25 30 35 40 45 50 55 60 65 70 75 80 85 90 95 100105110115120125130 Fig.12 PM10 momentary maximum concentration
(Fieni area)
c) Carbon monoxide - the values of the momentary concentrations reach a maximum of 5.60 μg/m3, concentrated in the northern part of the industrial area, value that is situated below the limit value.
d) Dusts (PM10) - the values of the momentary concentrations reach a maximum of 130 μg/m3 around the building material plant that represents an outrunning by 2.6 times of the limit value.
According to the presented maps, a large part of the inhabited area of the southern part of Fieni is affected by all types of pollutant emissions. All pollutants affect present the same pattern of isolines.
In the figures 13-15, the NOx, SO2 and PM10 momentary maximum concentration [μg/m3] are represented for Titu.
Analizing the isolines in the case of this area, the most poluted area is also around the industrial area that is concentrated in the northern part of the inhabited area.
For each analyzed pollutant, the situation has the following interpretation:
a) Nitrogen oxides - the values of the momentary concentrations reach a maximum of 44 μg/m3 in a small area around the sources, values which are situated below the limit value.
0 1000 2000 3000 4000 5000 60000
1000
2000
3000
4000
5000
6000
SC ELSID SA\P\P352085.270/ 544546.162
0 2 4 6 8 10 12 14 16 18 20 22 24 26 28 30 32 34 36 38 40 42 44 Fig.13 NOx momentary maximum concentration
(Titu area)
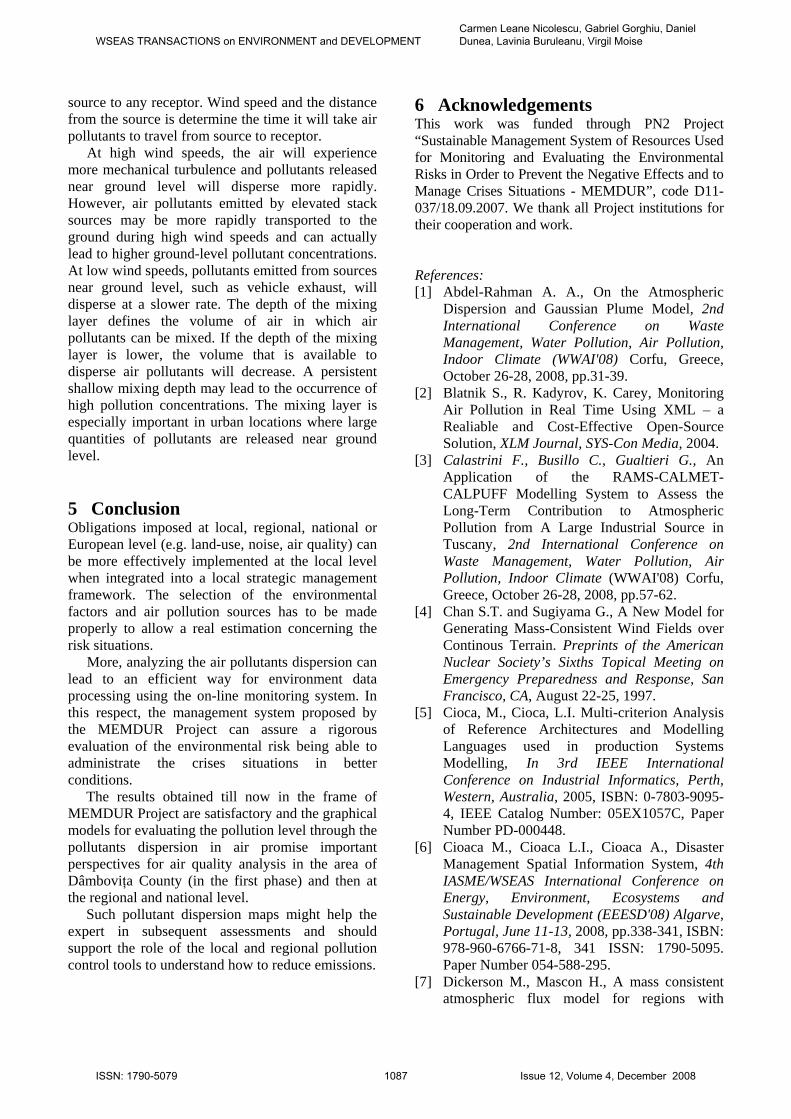
b) Sulfur dioxide - the values of the momentary concentrations reach a maximum of 44 μg/m3 around the industrial area, values which are situated below the limit value. d) Dusts (PM10) - the values of the momentary concentrations reach a maximum of 4,4 μg/m3 around industrial area, values which are situated below the limit value.
Also in this case the pollution affects a large inhabited area in the center of the town. All
WSEAS TRANSACTIONS on ENVIRONMENT and DEVELOPMENTCarmen Leane Nicolescu, Gabriel Gorghiu, Daniel Dunea, Lavinia Buruleanu, Virgil Moise
ISSN: 1790-5079 1085 Issue 12, Volume 4, December 2008
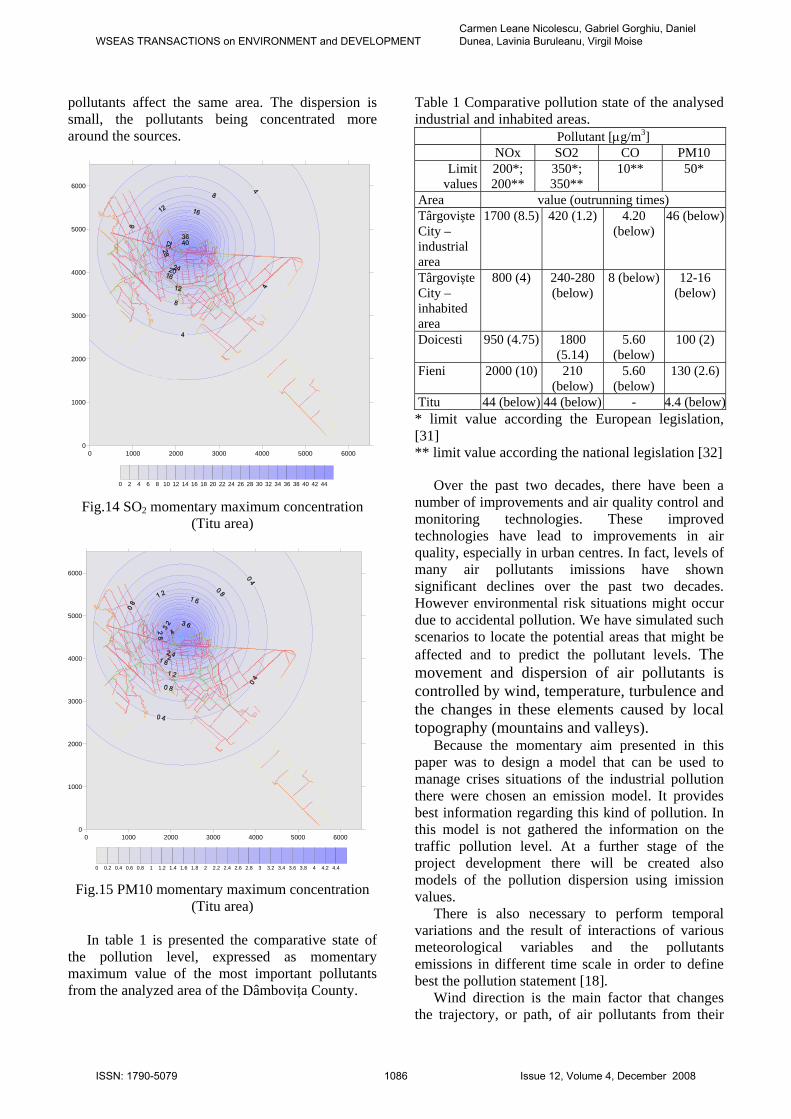
pollutants affect the same area. The dispersion is small, the pollutants being concentrated more around the sources.
0 1000 2000 3000 4000 5000 60000
1000
2000
3000
4000
5000
6000
SC ELSID SA\P\P352085.270/ 544546.162
0 2 4 6 8 10 12 14 16 18 20 22 24 26 28 30 32 34 36 38 40 42 44
Fig.14 SO2 momentary maximum concentration
(Titu area)
0 1000 2000 3000 4000 5000 60000
1000
2000
3000
4000
5000
6000
SC ELSID SA\P\P352085.270/ 544546.162
0 0.2 0.4 0.6 0.8 1 1.2 1.4 1.6 1.8 2 2.2 2.4 2.6 2.8 3 3.2 3.4 3.6 3.8 4 4.2 4.4
Fig.15 PM10 momentary maximum concentration
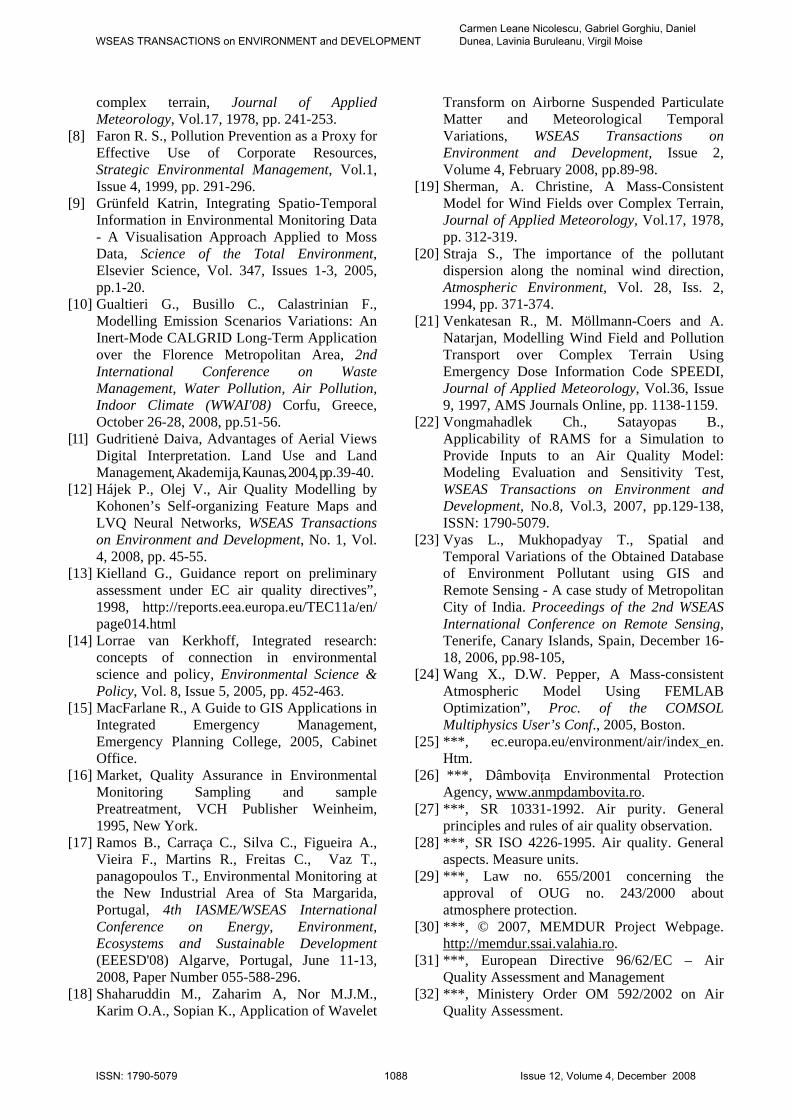
(Titu area) In table 1 is presented the comparative state of
the pollution level, expressed as momentary maximum value of the most important pollutants from the analyzed area of the Dâmboviţa County.
Table 1 Comparative pollution state of the analysed industrial and inhabited areas.
Pollutant [μg/m3] NOx SO2 CO PM10
Limit values
200*; 200**
350*; 350**
10** 50*
Area value (outrunning times) Târgovişte City –industrial area
1700 (8.5)
420 (1.2)
4.20 (below)
46 (below)
Târgovişte City –inhabited area
800 (4)
240-280 (below)
8 (below)
12-16 (below)
Doicesti 950 (4.75) 1800 (5.14)
5.60 (below)
100 (2)
Fieni 2000 (10) 210 (below)
5.60 (below)
130 (2.6)
Titu 44 (below) 44 (below) - 4.4 (below)* limit value according the European legislation, [31] ** limit value according the national legislation [32]
Over the past two decades, there have been a number of improvements and air quality control and monitoring technologies. These improved technologies have lead to improvements in air quality, especially in urban centres. In fact, levels of many air pollutants imissions have shown significant declines over the past two decades. However environmental risk situations might occur due to accidental pollution. We have simulated such scenarios to locate the potential areas that might be affected and to predict the pollutant levels. The movement and dispersion of air pollutants is controlled by wind, temperature, turbulence and the changes in these elements caused by local topography (mountains and valleys).
Because the momentary aim presented in this paper was to design a model that can be used to manage crises situations of the industrial pollution there were chosen an emission model. It provides best information regarding this kind of pollution. In this model is not gathered the information on the traffic pollution level. At a further stage of the project development there will be created also models of the pollution dispersion using imission values.
There is also necessary to perform temporal variations and the result of interactions of various meteorological variables and the pollutants emissions in different time scale in order to define best the pollution statement [18].
Wind direction is the main factor that changes the trajectory, or path, of air pollutants from their
WSEAS TRANSACTIONS on ENVIRONMENT and DEVELOPMENTCarmen Leane Nicolescu, Gabriel Gorghiu, Daniel Dunea, Lavinia Buruleanu, Virgil Moise
ISSN: 1790-5079 1086 Issue 12, Volume 4, December 2008
source to any receptor. Wind speed and the distance from the source is determine the time it will take air pollutants to travel from source to receptor.
At high wind speeds, the air will experience more mechanical turbulence and pollutants released near ground level will disperse more rapidly. However, air pollutants emitted by elevated stack sources may be more rapidly transported to the ground during high wind speeds and can actually lead to higher ground-level pollutant concentrations. At low wind speeds, pollutants emitted from sources near ground level, such as vehicle exhaust, will disperse at a slower rate. The depth of the mixing layer defines the volume of air in which air pollutants can be mixed. If the depth of the mixing layer is lower, the volume that is available to disperse air pollutants will decrease. A persistent shallow mixing depth may lead to the occurrence of high pollution concentrations. The mixing layer is especially important in urban locations where large quantities of pollutants are released near ground level. 5 Conclusion Obligations imposed at local, regional, national or European level (e.g. land-use, noise, air quality) can be more effectively implemented at the local level when integrated into a local strategic management framework. The selection of the environmental factors and air pollution sources has to be made properly to allow a real estimation concerning the risk situations.
More, analyzing the air pollutants dispersion can lead to an efficient way for environment data processing using the on-line monitoring system. In this respect, the management system proposed by the MEMDUR Project can assure a rigorous evaluation of the environmental risk being able to administrate the crises situations in better conditions. The results obtained till now in the frame of MEMDUR Project are satisfactory and the graphical models for evaluating the pollution level through the pollutants dispersion in air promise important perspectives for air quality analysis in the area of Dâmboviţa County (in the first phase) and then at the regional and national level. Such pollutant dispersion maps might help the expert in subsequent assessments and should support the role of the local and regional pollution control tools to understand how to reduce emissions.
6 Acknowledgements This work was funded through PN2 Project “Sustainable Management System of Resources Used for Monitoring and Evaluating the Environmental Risks in Order to Prevent the Negative Effects and to Manage Crises Situations - MEMDUR”, code D11-037/18.09.2007. We thank all Project institutions for their cooperation and work. References: [1] Abdel-Rahman A. A., On the Atmospheric
Dispersion and Gaussian Plume Model, 2nd International Conference on Waste Management, Water Pollution, Air Pollution, Indoor Climate (WWAI'08) Corfu, Greece, October 26-28, 2008, pp.31-39.
[2] Blatnik S., R. Kadyrov, K. Carey, Monitoring Air Pollution in Real Time Using XML – a Realiable and Cost-Effective Open-Source Solution, XLM Journal, SYS-Con Media, 2004.
[3] Calastrini F., Busillo C., Gualtieri G., An Application of the RAMS-CALMET-CALPUFF Modelling System to Assess the Long-Term Contribution to Atmospheric Pollution from A Large Industrial Source in Tuscany, 2nd International Conference on Waste Management, Water Pollution, Air Pollution, Indoor Climate (WWAI'08) Corfu, Greece, October 26-28, 2008, pp.57-62.
[4] Chan S.T. and Sugiyama G., A New Model for Generating Mass-Consistent Wind Fields over Continous Terrain. Preprints of the American Nuclear Society’s Sixths Topical Meeting on Emergency Preparedness and Response, San Francisco, CA, August 22-25, 1997.
[5] Cioca, M., Cioca, L.I. Multi-criterion Analysis of Reference Architectures and Modelling Languages used in production Systems Modelling, In 3rd IEEE International Conference on Industrial Informatics, Perth, Western, Australia, 2005, ISBN: 0-7803-9095-4, IEEE Catalog Number: 05EX1057C, Paper Number PD-000448.
[6] Cioaca M., Cioaca L.I., Cioaca A., Disaster Management Spatial Information System, 4th IASME/WSEAS International Conference on Energy, Environment, Ecosystems and Sustainable Development (EEESD'08) Algarve, Portugal, June 11-13, 2008, pp.338-341, ISBN: 978-960-6766-71-8, 341 ISSN: 1790-5095. Paper Number 054-588-295.
[7] Dickerson M., Mascon H., A mass consistent atmospheric flux model for regions with
WSEAS TRANSACTIONS on ENVIRONMENT and DEVELOPMENTCarmen Leane Nicolescu, Gabriel Gorghiu, Daniel Dunea, Lavinia Buruleanu, Virgil Moise
ISSN: 1790-5079 1087 Issue 12, Volume 4, December 2008
complex terrain, Journal of Applied Meteorology, Vol.17, 1978, pp. 241-253.
[8] Faron R. S., Pollution Prevention as a Proxy for Effective Use of Corporate Resources, Strategic Environmental Management, Vol.1, Issue 4, 1999, pp. 291-296.
[9] Grünfeld Katrin, Integrating Spatio-Temporal Information in Environmental Monitoring Data - A Visualisation Approach Applied to Moss Data, Science of the Total Environment, Elsevier Science, Vol. 347, Issues 1-3, 2005, pp.1-20.
[10] Gualtieri G., Busillo C., Calastrinian F., Modelling Emission Scenarios Variations: An Inert-Mode CALGRID Long-Term Application over the Florence Metropolitan Area, 2nd International Conference on Waste Management, Water Pollution, Air Pollution, Indoor Climate (WWAI'08) Corfu, Greece, October 26-28, 2008, pp.51-56.
[11] Gudritienė Daiva, Advantages of Aerial Views Digital Interpretation. Land Use and Land Management, Akademija, Kaunas, 2004, pp.39-40.
[12] Hájek P., Olej V., Air Quality Modelling by Kohonen’s Self-organizing Feature Maps and LVQ Neural Networks, WSEAS Transactions on Environment and Development, No. 1, Vol. 4, 2008, pp. 45-55.
[13] Kielland G., Guidance report on preliminary assessment under EC air quality directives”, 1998, http://reports.eea.europa.eu/TEC11a/en/ page014.html
[14] Lorrae van Kerkhoff, Integrated research: concepts of connection in environmental science and policy, Environmental Science & Policy, Vol. 8, Issue 5, 2005, pp. 452-463.
[15] MacFarlane R., A Guide to GIS Applications in Integrated Emergency Management, Emergency Planning College, 2005, Cabinet Office.
[16] Market, Quality Assurance in Environmental Monitoring Sampling and sample Preatreatment, VCH Publisher Weinheim, 1995, New York.
[17] Ramos B., Carraça C., Silva C., Figueira A., Vieira F., Martins R., Freitas C., Vaz T., panagopoulos T., Environmental Monitoring at the New Industrial Area of Sta Margarida, Portugal, 4th IASME/WSEAS International Conference on Energy, Environment, Ecosystems and Sustainable Development (EEESD'08) Algarve, Portugal, June 11-13, 2008, Paper Number 055-588-296.
[18] Shaharuddin M., Zaharim A, Nor M.J.M., Karim O.A., Sopian K., Application of Wavelet
Transform on Airborne Suspended Particulate Matter and Meteorological Temporal Variations, WSEAS Transactions on Environment and Development, Issue 2, Volume 4, February 2008, pp.89-98.
[19] Sherman, A. Christine, A Mass-Consistent Model for Wind Fields over Complex Terrain, Journal of Applied Meteorology, Vol.17, 1978, pp. 312-319.
[20] Straja S., The importance of the pollutant dispersion along the nominal wind direction, Atmospheric Environment, Vol. 28, Iss. 2, 1994, pp. 371-374.
[21] Venkatesan R., M. Möllmann-Coers and A. Natarjan, Modelling Wind Field and Pollution Transport over Complex Terrain Using Emergency Dose Information Code SPEEDI, Journal of Applied Meteorology, Vol.36, Issue 9, 1997, AMS Journals Online, pp. 1138-1159.
[22] Vongmahadlek Ch., Satayopas B., Applicability of RAMS for a Simulation to Provide Inputs to an Air Quality Model: Modeling Evaluation and Sensitivity Test, WSEAS Transactions on Environment and Development, No.8, Vol.3, 2007, pp.129-138, ISSN: 1790-5079.
[23] Vyas L., Mukhopadyay T., Spatial and Temporal Variations of the Obtained Database of Environment Pollutant using GIS and Remote Sensing - A case study of Metropolitan City of India. Proceedings of the 2nd WSEAS International Conference on Remote Sensing, Tenerife, Canary Islands, Spain, December 16-18, 2006, pp.98-105,
[24] Wang X., D.W. Pepper, A Mass-consistent Atmospheric Model Using FEMLAB Optimization”, Proc. of the COMSOL Multiphysics User’s Conf., 2005, Boston.
[25] ***, ec.europa.eu/environment/air/index_en. Htm.
[26] ***, Dâmboviţa Environmental Protection Agency, www.anmpdambovita.ro.
[27] ***, SR 10331-1992. Air purity. General principles and rules of air quality observation.
[28] ***, SR ISO 4226-1995. Air quality. General aspects. Measure units.
[29] ***, Law no. 655/2001 concerning the approval of OUG no. 243/2000 about atmosphere protection.
[30] ***, © 2007, MEMDUR Project Webpage. http://memdur.ssai.valahia.ro.
[31] ***, European Directive 96/62/EC – Air Quality Assessment and Management
[32] ***, Ministery Order OM 592/2002 on Air Quality Assessment.
WSEAS TRANSACTIONS on ENVIRONMENT and DEVELOPMENTCarmen Leane Nicolescu, Gabriel Gorghiu, Daniel Dunea, Lavinia Buruleanu, Virgil Moise
ISSN: 1790-5079 1088 Issue 12, Volume 4, December 2008