Embed Size (px)
Citation preview

Mapping of 2006 Flood Extent in Birupa Basin, Orissa, India, Using Visual and Digital
Classification Techniques on RADARSAT Image: A Comparative Analysis
Anupam Pandey January, 2009

Mapping of 2006 Flood Extent in Birupa Basin, Orissa, India, Using Visual and Digital
Classification Techniques on RADARSAT Image: A Comparative Analysis
by
Anupam Pandey
Thesis submitted to the International Institute for Geo-information Science and Earth Observation in partial fulfilment of the requirements for the degree of Master of Science in Geo-information Science and Earth Observation, in Geo-Hazards. Thesis Assessment Board: Thesis Supervisors: Chairman : Dr. Cees Van Western Dr. V. Hari Prasad (IIRS) External Examiner : Prof. P. K. Garg Drs. Nanette C. Kingma (ITC)IIRS Member : Dr. S. P. Aggarwal Dr. Harald van der Werff (ITC) Supervisor : Dr. V. Hari Prasad
iirs
INTERNATIONAL INSTITUTE FOR GEO-INFORMATION SCIENCE AND EARTH OBSERVATION
ENSCHEDE, THE NETHERLANDS &
INDIAN INSTITUTE OF REMOTE SENSING, NATIONAL REMOTE SENSING CENTRE (NRSC), DEPARTMENT OF SPACE, DEHRADUN, INDIA

I certify that although I may have conferred with others in preparing for this assignment, and drawn upon a range of sources cited in this work, the content of this thesis report is my original work. Signed Anupam Pandey
Disclaimer This document describes work undertaken as part of a programme of study at the International Institute for Geo-information Science and Earth Observation. All views and opinions expressed therein remain the sole responsibility of the author, and do not necessarily represent those of the institute.

i
Abstract
Birupa basin nested in Mahanadi basin in coastal Orissa presents a beautiful green rural landscape that is characteristic of eastern India. The region however suffers heavily due to recurring floods during the monsoon months. Serious disruption of functioning of society is caused as river overflows their embankments and flood water races through almost level plain submerging agricultural fields and villages along its way causing enormous damage to life and property. Floods cannot be prevented but accurate information about them can reduce its severity to large extent. Remote sensing technology in general and SAR images in particular are known to be efficient and cost-effective when large areas affected by floods are to be mapped and analyzed. The main objective of the proposed work was to make a comparative analysis of different classification techniques for flooded area extraction on RADARSAT images. Assessment of accuracy and validation by appropriate method along with role of ancillary data for comparison of results were other issues discussed. Mapping of flood extent from RADARSAT images was carried out using visual interpretation, thresholding technique, rule based expert classification and neural network. Results show that visual interpretation was the most appropriate technique in delineating land and water boundary while thresholding technique was appropriate for flood extent mapping for relief and rescue operations. Combining spectral and spatial information in rule based expert classification has the potential of improving the results while neural networks were appropriate if good knowledge and understanding of the area in terms of surface condition was available. The study proposes that to extract flood inundation maps from RADARSAT images, thresholding was more appropriate than other three techniques used but it should be kept in mind that better result are achievable if ancillary information was available and time was not a constraint. The threshold values, internal parameters and ancillary information used in different techniques on 2006 images was applied on RADARSAT image of 2008 for the same area and it was found that parameters derived can be applied in other areas with slight modifications. One of the areas that have contributed to errors in flood extent maps by different techniques was paddy fields. Of the four techniques used, none was found suitable in delineating irrigated paddy fields from flooded areas. Behaviour of backscatter coefficient during the crop growth cycle of paddy showed that paddy cultivation in the initial stage of growth had low backscatter coefficient value but showed constant increase in backscatter coefficient values due to growth of paddy. This particular behaviour of backscatter coefficient during the crop growth cycle of paddy was used to delineate paddy fields from flooded areas. Field information was used for accuracy assessment and for explaining the results of flood inundation extraction by different techniques, so that the strength and limitations of different techniques were identified. Validation of results was done by RADARSAT image of the same area acquired in 2008. Key words: Flood Mapping, RADARSAT, Backscatter coefficient, Visual Interpretation, Threshold, Rule Based Expert Classification, Neural Network, Ancillary data, Accuracy Assessment, Validation.

ii
Acknowledgements
Now that I have reached the end of my M.Sc project it is time to express gratitude to all the people who have encouraged me to carry out this work. For sure, the fulfilment of this research is due to the cooperation of many people. Therefore I can only hope that I mention you all and those who I forget at this moment please forgive me and think that despite this lapse I really do appreciate you all. I would like to begin by saying how greatly indebted I am to Prof. R.G.Harshe (Vice-Chancellor, University of Allahabad) and Dr. V. K. Dadwal, (Dean, I.I.R.S.) who made it possible for me to embark on my M.Sc from I.T.C. and I.I.R.S. Their cooperation and guidance through the years have brought me to the point of successfully completing this thesis. Thank you for always being interested in the progress of my work, and for all your valuable suggestions and finishing touches. My sincere thanks go to Dr. V. Hari Prasad (In-charge Water Resource Division IIRS) who accepted to guide me through the development of this thesis. His wise advice and suggestions when we were in lab or during fieldwork in the Birupa basin of Orissa, as well as his valuable corrections to my earlier draft, significantly improved the final dissertation. I would like to thank Ms. Nanette C. Kingma and Dr. Harald van der Werff who spontaneously took on the responsibility of reviewing my thesis and also provided me with much good advice. I am very grateful to my guides, whose comments and corrections concerning my first draft made me realize just how far I was straying from the right path. I would also like to express my gratitude to Prof R.P. Mishra, Prof. R. C. Lakhera, Dr. S. P. Agarwal, Dr. C. Jagannathan, Prof H. N. Mishra and Dr. D. Alkema who were a constant source of inspiration during the course of my work. Likewise, I extend my thanks to Dr. I. C. Das, Mr. Praveen Thakur (staff at Water Resource Division, IIRS) who in one way or another has cooperated in the development of this research. I sincerely acknowledge the role they have played. I am grateful to Mr. P.L.N. Raju, Ms. S. Agarwal, Dr. S. Maithani, Ms. P. S. Tiwari, Ms. H. Pandey and Dr. M. Damen who have been my module coordinators at IIRS and ITC. I extend my sincere thanks to Prof. Alok Pandey (Dean, University of Nevada, Las-Vegas USA), Prof Brahma Nand Singh (University of Allahabad) and Sagar Shukla (University of Illinois Chicago, USA) who have provided me with all kind of support and encouragement while I was in Europe as well as in India. I extend my sincere gratitude and thanks to Vijay Shankar Pandey, Arun Mondal, Virat Shukla, Sandeep Mukherjee and Tushar Ramchandra Zange for technical discussions and conversations during the tea/coffee breaks and other time when we were free that has increased my knowledge of the challenges that we faced and also that are still ahead in the field of Remote Sensing and GIS. A thank-you to all my fellow M.Sc colleagues and friends, Amitava Dutta, Amrinder Singh, Sashi Kumar, Manish Manjul, Dr. Anand Malik, Alka Singh, Mirza Beg, Rahul, Dileep Maity, Sashikanta, Gaurav, Anurag, Pradeep Upadhya and Pankaj Jaiswal for their friendship, and for their encouragement that gave me renewed spirit when I was sometimes struggling with my study. Besides teaching and giving guidance for research ITC gives us an opportunity to interact with peoples of different lands, understand them better which goes on in some way to build a universal brotherhood which seems to be the most important thing in today’s violent world. I am glad to say that I have friends from countries ranging from Nigeria, Namibia, Netherlands, Colombia, Georgia, Venezuela, Thailand, Bolivia, Belgium, China, Italy, Uzbekistan, Pakistan, Sri Lanka, Jamaica, Bangladesh and Indonesia. Finally I owe this effort to my elders, Mr. Madhav Prasad Pandey, Mr. Ganga Prasad Pandey, Mr. N. B. Mani Tripathi, Ms. Prem Lata Pandey, Ms. Usha Mani and my love Bharti, my daughter Alaknanda and son Aryan (who was born while I was preparing for my module 03 exams on 23rd October 2007) without whom it would not have been possible for me to carry out this effort.

iii
Table of contents
Abstract ................................................................................................................................................... i Acknowledgements ................................................................................................................................ ii Table of contents ................................................................................................................................... iii List of figures .......................................................................................................................................... v List of tables ......................................................................................................................................... vii 1. Introduction .................................................................................................................................... 1
1.1. Natural Hazards ........................................................................................................................ 1 1.2. Natural Disaster ........................................................................................................................ 2 1.3. Concept of Flood ...................................................................................................................... 3 1.4. Motivation and Problem Statement .......................................................................................... 4 1.5. Objective .................................................................................................................................. 5 1.6. Research Questions .................................................................................................................. 5 1.7. Structure of the Thesis .............................................................................................................. 6
2. Study Area ...................................................................................................................................... 7 2.1. Location .................................................................................................................................... 7 2.2. Physiography and Geomorphology. ......................................................................................... 8 2.3. Drainage network and sub-basins. ............................................................................................ 9 2.4. Climate ..................................................................................................................................... 9 2.5. Soil and Vegetation .................................................................................................................. 9 2.6. Economic Aspect .................................................................................................................... 10 2.7. Demography ........................................................................................................................... 10 2.8. Settlements ............................................................................................................................. 11 2.9. Road Network......................................................................................................................... 12 2.10. Canal Network .................................................................................................................... 12
3. Literature Review ......................................................................................................................... 14 3.1. Remote Sensing and Flood Inundation Mapping ................................................................... 14 3.2. Microwave Remote Sensing for Flood Inundation Mapping ................................................. 15 3.3. Conventional Techniques ....................................................................................................... 16 3.4. Advanced Techniques ............................................................................................................ 18
4. Materials and Methods ................................................................................................................ 21 4.1. Introduction to RADARSAT 1 ............................................................................................... 21
4.1.1. The RADARSAT-1 orbit ............................................................................................... 21 4.1.2. RADARSAT-1 system specifications ............................................................................ 22 4.1.3. The SAR antenna ............................................................................................................ 22 4.1.4. RADARSAT-1 Beam Modes ....................................................................................... 22
4.2. RADARSAT imageries .......................................................................................................... 23 4.3. The pre-processing of RADARSAT imageries ...................................................................... 24 4.4. Overall Methodology and Software used ............................................................................... 24 4.5. Extraction of flooded area from RADARSAT images ........................................................... 25
4.5.1. Visual Interpretation ....................................................................................................... 25 4.5.2. Threshold Technique ...................................................................................................... 28 4.5.3. Rule Based Expert Classification ................................................................................... 31

iv
4.5.4. Neural Network .............................................................................................................. 34 4.6. Comparison of flood extent by different techniques .............................................................. 37 4.7. Delineation of Non-flooded Paddy Fields .............................................................................. 38
5. Accuracy Assessment, Validation and Analysis ........................................................................ 41 5.1. Accuracy Assessment ............................................................................................................. 41
5.1.1. Accuracy Assessment of Visual Interpretation .............................................................. 44 5.1.2. Accuracy Assessment of Threshold Technique .............................................................. 45 5.1.3. Accuracy Assessment of Rule Based Expert Classification ........................................... 46 5.1.4. Accuracy Assessment of Neural Network Classification ............................................... 46 5.1.5. Overall Conclusion of Accuracy Assessment ................................................................ 47
5.2. Validation of results ............................................................................................................... 47 5.3. Analysis .................................................................................................................................. 48
5.3.1. Comparison of flooded area by Visual and Threshold Technique ................................. 49 5.3.2. Comparison of Flooded area by Visual and Rule Based Classification ......................... 50 5.3.3. Comparison of flooded area by Visual Interpretation and Neural Network ................... 51
5.4. Comparison of flooded area with the Rule Image for Water.................................................. 51 6. Conclusion and Recommendations ............................................................................................. 53
6.1. Conclusions ............................................................................................................................ 53 6.2. Recommendations .................................................................................................................. 54 6.3. Suggestions ............................................................................................................................. 55
Reference ............................................................................................................................................... 56 Appendix 1: Location and status of Ground Observation Points ................................................ 60

v
List of figures
Figure 1-1: Spatial spread of flood disaster 2006 ..................................................................................... 4 Figure 2-1: Location of Study Area ......................................................................................................... 7 Figure 2-2: Geomorphology ..................................................................................................................... 8 Figure 2-3: Settlements covering a paleo-channel ................................................................................... 9 Figure 2-4: Paddy cultivation .............................................................................................................. 10 Figure 2-5: Jute cultivation ................................................................................................................. 10 Figure 2-6: Settlements and Village Headquarters ................................................................................. 11 Figure 2-7: Strengthened embankment along Ganguty river. .......................................................... 12 Figure 2-8: Canal embankment along ................................................................................................. 12 Figure 2-9: Road and Canal network. .................................................................................................... 13 Figure 2-10:Siphon on Birupa river at Triveni .................................................................................. 13 Figure 2-11: Canal splitting into two branches. ................................................................................ 13 Figure 4-1: RADARSAT Beam modes (Centre for remote imaging 2006) ........................................... 22 Figure 4-2: Hydrograph of Ganguty river at Sripadmalabhpur .............................................................. 23 Figure 4-3: Flow chart of Methodology ................................................................................................. 25 Figure 4-4: Flooded Area by Visual Interpretation ................................................................................ 26 Figure 4-5: Compound bar Diagram for Flooded Area by Visual Interpretation ................................... 27 Figure 4-6: Flooded Area along NH 5A ................................................................................................. 27 Figure 4-7: Flood boundary in form of Zone ......................................................................................... 27 Figure 4-8: Flooded Area by Threshold Technique ............................................................................... 29 Figure 4-9: Compound bar Diagram for Flooded Area by Threshold Technique .................................. 30 Figure 4-10: Tall grass and trees in between flooded areas. .................................................................. 30 Figure 4-11: Drainage Congestion due to Road ..................................................................................... 30 Figure 4-12: Flooded Area by Rule Based Expert Classification .......................................................... 32 Figure 4-13: Decision tree for Rule Based Expert Classification .......................................................... 33 Figure 4-14: Compound bar Diagram for Flooded Area by Rule Based Expert Classification ............. 33 Figure 4-15: Role of Canal in Spread of Water ...................................................................................... 34 Figure 4-16: Road and Drainage Congestion ......................................................................................... 34 Figure 4-17: Flooded Area by Neural Network ..................................................................................... 35 Figure 4-18: Neural Network plot .......................................................................................................... 36 Figure 4-19: Neural Network plot .......................................................................................................... 36 Figure 4-20: Compound bar Diagram for Flooded Area by Neural Network ........................................ 37 Figure 4-21: Comparison of flooded area by different techniques ......................................................... 38 Figure 4-22: Effect of Paddy growth on Backscatter behaviour. ........................................................... 38 Figure 4-23: Backscatter model for rice - Saho, et al. (2001). ............................................................. 39 Figure 4-24: Non-Flooded Paddy fields. ................................................................................................ 39 Figure 5-1: Location of Ground Observation Points, Category – A ...................................................... 42 Figure 5-2: Location of Ground Observation Points, Category – B, C, D, E and F. .............................. 43 Figure 5-3: Orchard close to area of drainage congestion ...................................................................... 45 Figure 5-4: Gentle slope of the land identified only by stagnant water ................................................. 45 Figure 5-5: Flooded Area 24 July 2008 and Comparison of Accuracy between 2006 and 2008 ........... 48 Figure 5-6: Comparison of results of visual interpretation and other techniques .................................. 49

vi
Figure 5-7: Flooded area by Visual Interpretation and Threshold Technique ....................................... 50 Figure 5-8: Flooded area by Visual Interpretation and Rule Based Expert Classification ..................... 50 Figure 5-9: Flooded area by Visual Interpretation and Neural Network Technique .............................. 51 Figure 5-10: Probability for occurrence of Water (Rule Image) ............................................................ 52

vii
List of tables
Table 5-1: Results of Accuracy Assessment .......................................................................................... 44

MAPPING OF 2006 FLOOD EXTENT IN BIRUPA BASIN, ORISSA, INDIA, USING VISUAL AND DIGITAL CLASSIFICATION TECHNIQUES ON RADARSAT IMAGE. A COMPARATIVE ANALYSIS
1
1. Introduction
1.1. Natural Hazards
Before man took control of our planet, a purely natural system prevailed on earth. Geophysical events such as earthquakes, volcanic eruptions, landslides, spread and retreat of water along the river plains took place as part of the natural system. This continued for millions of years before the human presence transformed not only the natural system and phenomena but also gave the geophysical events of the past a new meaning and term ‘natural hazards’. With increase in human interference and influence, the natural hazards of the pre-modern age became ‘man induced natural disasters’ of present time. The term natural hazard implies the occurrence of a natural condition or phenomenon, which threatens or acts hazardously in a defined space and time. A natural hazard has been expressed as elements in physical environment that may become harmful to man. Natural disasters of different types, including extreme weather-related events such as floods and cyclones, have increased worldwide in recent years, both in frequency and in intensity, Khan and Rahman, (2007). Natural hazards are events, capable of producing damage to the physical and social environment where they take place not only at the time of their occurrence, but on a long-term basis due to their associated consequences. Specifically, natural hazards are considered within a geological (earthquakes, volcanoes and landslides) and hydro-meteorological (floods, storms, droughts and tsunamis) conceptualization of their types. Hazards are the result of sudden changes in long-term behavior caused by minute changes in the initial conditions. In this sense, geomorphic hazards can be categorized as endogenous (volcanism and neo-tectonics), exogenous (floods, karst collapse, snow avalanche, channel erosion, sedimentation, mass movement, tsunamis, coastal erosion), and those induced by climate and land-use change (desertification, permafrost, degradation, soil erosion, salinization and floods). Recent hurricanes, earthquakes, storms and disease outbreaks have revealed a tendency for escalating economic and human losses and major factor promoting such losses is the lack of specific knowledge regarding the hazardous event. (Ermolievaa and Sergienko, 2008). The concepts of magnitude, frequency and time are essential for the assessment of natural hazards. For example, the consequence of a flood are measured using concept of return period which gives an idea of the characteristics that the flood may have (magnitude) and how often it is likely to occur (frequency). Natural hazards occur at a certain place and during a specific time, but their occurrence is not instantaneous. Time is always involved in the development and occurrence of such phenomena. For example, flooding triggered by tropical storms is developed on a time basis. Certain specific atmospheric conditions lead to the formation of tropical storms, taking from a few hours to some days. Hence, the intensity and duration of rainfall on a time basis would have an important role in determining the characteristics of the flooding.
MAPPING OF 2006 FLOOD EXTENT IN BIRUPA BASIN, ORISSA, INDIA, USING VISUAL AND DIGITAL CLASSIFICATION TECHNIQUES ON RADARSAT IMAGE. A COMPARATIVE ANALYSIS
2
1.2. Natural Disaster
Several definitions of natural disasters better explain the character of this term. During the 1960’s disasters were understood as uncontrollable events in which a society undergoes severe danger, disrupting all or some of the essential functions of the society. The idea of a society damaged by a powerful natural force is expressed where a disaster is a severe, sudden and deadly (flooding due to breach in embankment as it happened along Indo-Nepal border in 2008). In the interaction between ‘unstable earth and un-resting man’ extreme physical or natural phenomena can bring general disruption and destruction of loss of life and property to vulnerable human group. Presently disaster is understood as a serious disruption of the functioning of a society, causing widespread human, material, or environmental loss which exceeds the ability of affected society to cope using only its own resources. The dual characters of natural disaster have been addressed by considering not only the natural character, but also the social and economic systems. As a result, a natural disaster can be expressed as some rapid and instantaneous impact of the natural environment upon the socio-economic system or as a sudden dis-equilibrium of the balance between the forces released by the natural system and the counteracting forces of the society. The severity of such dis-equilibrium depends on the relation between the magnitude of the natural event and human tolerance to such an event. While the number of lives lost has declined in the past 20 years the total number of people affected has risen. Over the past decade, the total number of people affected by natural disasters has tripled to 2 billion, Noy (2008). Countries with a higher literacy rate, better institutions, higher per capita income, higher degree of openness to trade, and higher levels of government spending are better able to withstand the initial disaster shock, Noy (2008). Their impact is greater in developing countries, where poverty and pressure of population on land has forced people to settle in areas prone to flooding or in areas susceptible to land slides. Lack of wide spread education and awareness acts in conjunction with the historical development of these poor countries, where the economic, social, political and cultural conditions are not good, and consequently act as factors that contribute in making these areas and there population highly vulnerability to natural disasters. Recently, attention has been paid to the prevention, reduction and mitigation of natural disasters by creating a Scientific and Technical Committee of the International Decade for Natural Disaster Reduction (IDNDR). Efforts within this international framework have been taken worldwide. Since natural disasters continue to devastate different parts of the world it has been understood that changes at micro level can accumulate and their impact can be felt on global scale (global warming) and global phenomena can have impact on local level. The role and interdependence of different nations, institutions and technologies continue to grow in an effort to better understand not only the natural phenomena but the role of anthropogenic activities in causing and modifying them. Although, humans will never be able to prevent these occurrences of natural phenomena, scientists are able to gain a better understanding of the factors that cause the disasters and to deliver their knowledge to disaster management agencies which in turn become more prepared to cope with such extreme events, Zadeh and Bear, (2007).

MAPPING OF 2006 FLOOD EXTENT IN BIRUPA BASIN, ORISSA, INDIA, USING VISUAL AND DIGITAL CLASSIFICATION TECHNIQUES ON RADARSAT IMAGE. A COMPARATIVE ANALYSIS
3
1.3. Concept of Flood
River valleys and flood plains have been the cradle of civilization since ancient times and still they happen to be one of the most densely populated parts of the world. It is the immense density of population in close proximity to rivers that makes floods one of the most common natural disasters affecting more people across the globe than all other natural or technological disasters and also the most costly in terms of human hardship and economic loss, (Huang et al,.2008). Flooding is primarily the result of heavy or continuous rainfall exceeding the absorptive capacity of soil and the flow capacity of river channels and streams. The natural flow of a river is variable and flooding is a natural and recurring event for a river or a stream. In many parts of the world, as much population is concentrated along the river valleys, flood is responsible for a greater number of damaging events than any other type of natural hazard. Floodplains are a valuable resource in an agricultural economy, but anthropogenic activities on the floodplains has increased the potential for floods to damage and disrupt lives and this is likely to grow as more floodplain encroachment takes place, (Sultana et al, 2008). The level at which the high level flows become floods is a matter of perspective. Physically, a flood is a high flow of water which overtops either the natural or artificial embankments. From a pure ecological perspective; floods are over bank flows that provide water and nutrient to floodplain. From a geomorphic perspective, high flow becomes floods when they alter the erosive, transport and depositional capacity of a river at a given point so that it alters the morphology of the river channel and the surrounding flood plain. From a human perspective, river is in floods when its waters ‘invade’ areas of human settlements and agriculture killing people and causing damage to means of livelihood. As proposed by Ologunorisa and Adeyemo, (2005) the study of perception, by their very nature, involve a high degree of generalization and it seems essential that those responsible for the planning of flood management and development in flood prone areas should obtain the perception and behavioral responses to flood hazard by floodplain dwellers as well. Flood events can occur due to a wide range of both natural and human induced factors. The damage caused by floods in term of loss of life, property and economic loss due to disruption of economic activity are all too well known. As stated earlier, the flood plains are the areas of concentration of human activities, which in turn results in greater damage due to floods. To minimize the damage due to flooding it is required to undertake various wide ranging measures and activities related with prediction, prevention, warning, monitoring and relief along a floodplain. To carry out the above measures there is a need of in-depth analysis of the factors causing (natural) and modifying (anthropogenic) the spread of flood water. Interaction among different government and private agencies on one hand, and the people of the region facing the disaster on the other hand is essential if scientific knowledge and understanding is to be utilized for reducing the damage due to flood. Flood management can have a significant impact on both the natural and human environment and do not always offer a simple solution to the problem. Human interference and modification may reduce the risk due to flood in one area but they may increase the risk somewhere else making studies and research relating to floods more challenging and interesting.

MAPPING OF 2006 FLOOD EXTENT IN BIRUPA BASIN, ORISSA, INDIA, USING VISUAL AND DIGITAL CLASSIFICATION TECHNIQUES ON RADARSAT IMAGE. A COMPARATIVE ANALYSIS
4
Figure 1-1: Spatial spread of flood disaster in 2006 Source: www.dartmouth.edu.floods India is one of the worst flood-affected countries, being second in the world after Bangladesh in terms of damage due to floods. In India almost 75% of the annual rainfall is received during four months of monsoon (June- September) and as a result, almost all the rivers carry heavy discharge during this period. The flood hazard is generated and compounded by the problems of sediment deposition, drainage congestion and synchronization of river floods with sea tides in the coastal plains. Increased use of fossil fuel, massive deforestation, and rapid increase in rice cultivation using Nitrogen based chemical fertilizers in India, Nepal and Bangladesh have been responsible for greenhouse warming and consequently high frequency of flood events in the region, (Ali 2007). The area vulnerable to floods is around 0.4 million km² and the average area affected by floods annually is about 0.08 million km². The cropped area affected annually ranges from 3.5 million hectare during normal floods to 10 million hectare during worst flood. Flood control measures comprise mainly of construction of new embankments, drainage channels and afforestation to prevent loss of life and property due to floods.
1.4. Motivation and Problem Statement
Orissa is one of the most flood prone states of India. The coastal districts of Orissa have experienced in the past, severe flooding, not only due to storm surges originating in the Bay of Bengal, but also flooding from the rivers as well as from heavy precipitation associated with tropical cyclones and monsoon depressions, (Mohapatra and Mohanty, 2005). These flooding events in the deltaic area of Orissa arise due to a highly complex and non linear interaction of additional river discharge from the rivers swollen by heavy rainfall as well as direct flooding of the deltaic land by intense rainfall over several days, (Chittibabu 2004). Due to cyclonic storm or heavy monsoon rainfall in a short period of time, rivers are unable to carry the increased volume of water along its course that results in overbank flow causing inundation of neighbouring land. Once the river water has overflowed or breached the levees, water races through the almost level flood plain submerging the cultivated fields and villages along its way causing enormous damage to life and property as happened in 2006. In such situation poverty ridden rural population in this part of the country can do little but to suffer. What is required by

MAPPING OF 2006 FLOOD EXTENT IN BIRUPA BASIN, ORISSA, INDIA, USING VISUAL AND DIGITAL CLASSIFICATION TECHNIQUES ON RADARSAT IMAGE. A COMPARATIVE ANALYSIS
5
the scientific and administrative community working in this area is to find appropriate and quick technique for location and estimation of flooded area so that relief and rescue operations can be taken up quickly and efficiently. Accurate information on the extent of water bodies is important for flood prediction, monitoring, and relief operations, damage estimation of crops etc. The spatial extent and temporal variation of flood-affected areas are very much required for flood mitigation and relief operations. Often this information is difficult to procure using traditional survey techniques because water bodies can be at times be inaccessible. Once the inundation maps are prepared it helps the decision makers to make an assessment of the damage and also plan for better relief operations. Remote sensing comes out to be a cost-effective and efficient technique when large areas are to be mapped and analyzed. It provides one of the most powerful tools for the preparation of flood inundation maps which can be used for damage and relief management and also helps the decision makers to achieve a scientific assessment of the flooded area. Using the satellite data acquired during flood, pre and post flood along with ground information and other ancillary data, flood damages can also be estimated. Flood often does not occur at a same time and location in region of flat topography, but its occurrence depends on upstream reach and downstream reach. To understand the true nature of flood, not only the extent of flood needs to be drawn out but also it needs to be figured out as to what are the possible sources of water within the area, what is the route it is following while it spreads and from where it finally leaves the area. Thus understanding the geomorphology, hydrological characteristics and pattern of man made structures within the region would be a complementary effect to conclude whether a specified flood event is induced due to anthropogenic, natural causes or a combination of both. It would further help to identify the real causes of inundation at various parts of the study area and will give an idea whether it is due to local rainfall, river flooding or anthropogenic modifications of the natural system of drainage in form of embankments, roads and canals that may cause drainage congestion and consequent damage in some parts while protecting some other areas.
1.5. Objective
The main objective of the proposed work is to make a comparative analysis of different classification techniques for flooded area extraction on RADARSAT images.
1.6. Research Questions
1. Which technique is more appropriate for extraction of flooded area from RADARSAT images?
2. Which method will be more appropriate for validation of the extracted flood area? 3. How can paddy fields be separated from flood inundated area? 4. What ancillary data help in improving the accuracy of the extraction and in
interpretation of results?

MAPPING OF 2006 FLOOD EXTENT IN BIRUPA BASIN, ORISSA, INDIA, USING VISUAL AND DIGITAL CLASSIFICATION TECHNIQUES ON RADARSAT IMAGE. A COMPARATIVE ANALYSIS
6
1.7. Structure of the Thesis
The present work has been structured into six chapters with each chapter focusing on a particular theme. Chapter one is the introductory chapter with basic aim to introduce the concepts of natural hazards, natural disaster, and flood as a disaster. The chapter further points towards how flood is a major concern in parts of Orissa and attempts a kind of justification, why the present study needs to be carried out in the delta region of Orissa before stating the main objective and specific research questions. The second chapter describes the different geographical aspects (physical, human and economic) of the study area, an understanding of which is essential not only while analyzing the results but also in justifying the work undertaken from academic, social and economic perspective. The third chapter relates to review of literature with an aim to establish the originality of the proposed work, place the work in context and to compare different methodological approaches. Chapter four gives a description of the characteristics of the data sets that are to be used in the present study. It further gives a detailed description of the methodology that is to be applied and finally comes up with the results of different techniques proposed in the methodology (visual and digital) to extract the area inundated by flood. Chapter five deals with analysis part of the work where results of different techniques are not only compared but also on basis of ancillary information and field observation the accuracy of different techniques is assessed. The sixth and concluding chapter points towards major findings and makes suggestions and recommendations as to how accurately and efficiently flood extent can be mapped and monitored using remote sensing and GIS that will help in better management of flood in the area. The work concludes with suggestions regarding further studies that need to be carried out by researchers that will go on to solve not only the problems relating to floods but will also help in better understanding of floods in Orissa. Thus the present work has been planned keeping the challenge posed by geomorphic variability and human habitations over the floodplains in mapping flood events using remote sensing approach. Precipitation events in the lower reaches of large basins generate local-scale flood flow paths that inundate low-lying surfaces. Local-scale flood flow paths may include direct precipitation onto floodplain and backswamps where water is brought through abandoned channels that serve as important flow paths (Poole et al., 2002). The movement of water is further influenced due to anthropogenic activities like construction of road, rail and canal network in the area that not only define the direction of flow but also generate areas of drainage congestion. As the minute but important details attached with man made obstructions can not be recorded unless working with very high resolution satellite data, field verification becomes inevitable to fill in the gaps in our understanding of the factors controlling the extent of spread of flood water with time. Thus the flood extent can be mapped using different visual and digital techniques but its accuracy will depend on the ancillary information and understanding of the surface that was inundated by flood. Validation of results from different techniques can also be done by applying the same techniques over an image of flood event in the same area but of different date preferably of different year so that the similarity and difference in results can be better understood and explained.
MAPPING OF 2006 FLOOD EXTENT IN BIRUPA BASIN, ORISSA, INDIA, USING VISUAL AND DIGITAL CLASSIFICATION TECHNIQUES ON RADARSAT IMAGE. A COMPARATIVE ANALYSIS
7
2. Study Area
2.1. Location
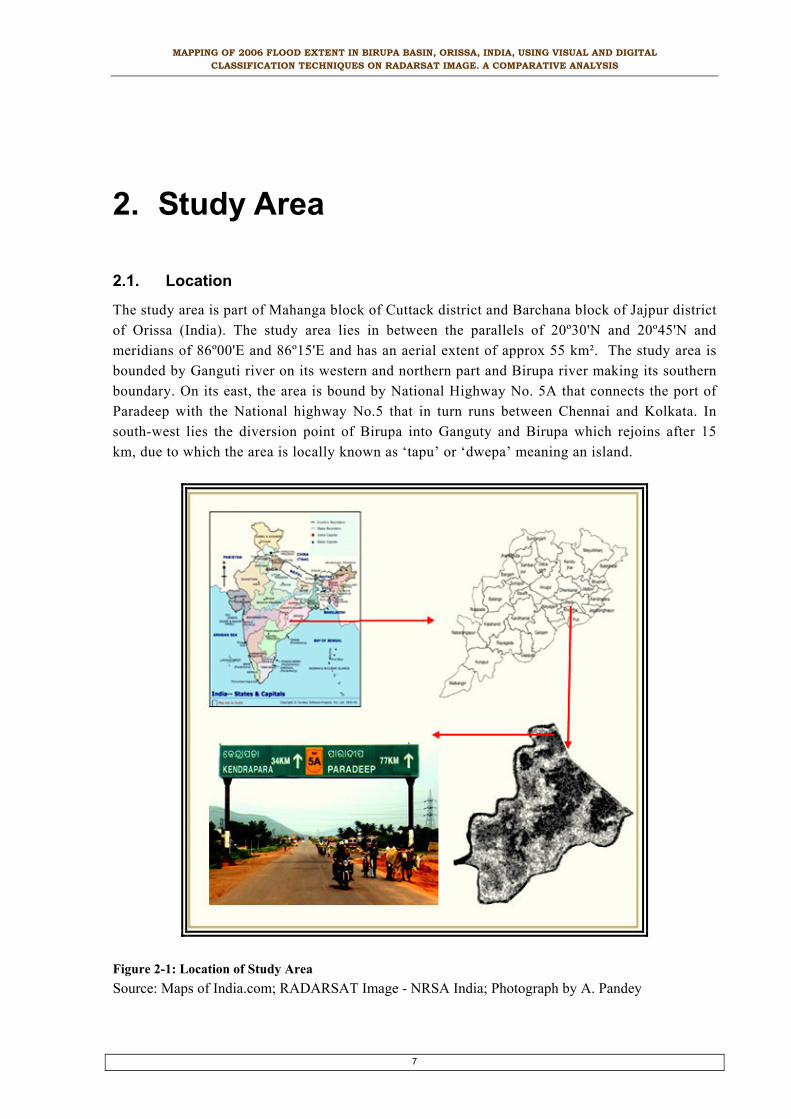
The study area is part of Mahanga block of Cuttack district and Barchana block of Jajpur district of Orissa (India). The study area lies in between the parallels of 20º30'N and 20º45'N and meridians of 86º00'E and 86º15'E and has an aerial extent of approx 55 km². The study area is bounded by Ganguti river on its western and northern part and Birupa river making its southern boundary. On its east, the area is bound by National Highway No. 5A that connects the port of Paradeep with the National highway No.5 that in turn runs between Chennai and Kolkata. In south-west lies the diversion point of Birupa into Ganguty and Birupa which rejoins after 15 km, due to which the area is locally known as ‘tapu’ or ‘dwepa’ meaning an island.
Figure 2-1: Location of Study Area Source: Maps of India.com; RADARSAT Image - NRSA India; Photograph by A. Pandey

MAPPING OF 2006 FLOOD EXTENT IN BIRUPA BASIN, ORISSA, INDIA, USING VISUAL AND DIGITAL CLASSIFICATION TECHNIQUES ON RADARSAT IMAGE. A COMPARATIVE ANALYSIS
8
2.2. Physiography and Geomorphology.
Physiographically the region is almost flat area with low actual and relative relief, which is typical of delta region. In such region of low relief, the role of geomorphic features becomes prominent especially when a study relating to flood is to be carried out. Geomorphology is the study of the configuration of the earth surface. The variation in surface configuration in the study area is result of interplay between physical properties of materials upon which fluvial process have acted over geological times. It’s well known that to understand and interpret the landscape, it is necessary to understand the geomorphic history of the evolution of that particular region. Figure 2-2 shows some of the important geomorphic features of the region.
Figure 2-2: Geomorphology Source: Based on map provided by Orissa Remote Sensing Application Centre (ORSAC) India. The region is located in between the alluvial plain of Ganguti river in the north and Birupa river in the south. Natural levees are found along the southern and central part of the Birupa river. The other complex of natural levees is found along the banks of Ganguti river in central and northern parts. Besides natural levees, the other important geomorphic features of the area are the paleo-channels that are scattered primarily in the central part of the area. These channels have been abandoned in the past and now in conjunction with canal system within the area, help in draining the excess water out of the area. In the central part of the study area are numerous back swamps that are low lying areas of drainage congestion. The eastern part of the area is characterized by a long narrow latertic residual hill, which along with the natural levees now forms a prominent location for human settlements. The geomorphic features mentioned are

MAPPING OF 2006 FLOOD EXTENT IN BIRUPA BASIN, ORISSA, INDIA, USING VISUAL AND DIGITAL CLASSIFICATION TECHNIQUES ON RADARSAT IMAGE. A COMPARATIVE ANALYSIS
9
based on map prepared by Orissa Remote Sensing Application Centre but during the field survey it was felt that some more geomorphic features must have been present which either have been modified by human habitation ( figure 2-3) or are covered under paddy fields.
Figure 2-3: Settlements covering a paleo-channel Source: Google image (Quick bird image of 14 May 2004).
2.3. Drainage network and sub-basins.
The study area is bounded by Ganguti river on its west and northern part and Birupa river making its southern boundary. As stated earlier the region is almost flat with small shallow sub-basins divided by very low ridges. Water makes its way into the area by rainfall, through the extensive canal system or when the bordering rivers overflow or breach their banks as has happened in 2003. Once water enters the region its movement is influenced by the natural levees, paleo-channel and numerous scattered back swamps. The behaviour of water moving through the area is further complicated by small embankments that run along with the canals and roads (figure 4-11) crossing the entire region and imposing an anthropogenic system on naturally existing system of sub-basins and low ridges.
2.4. Climate
The area experiences a tropical monsoon type climate. The long- term average rainfall from southwest monsoon is about 1450 mm. The variability of rainfall can at times be high due to erratic nature of south west monsoon as most of the rain is associated with depressions from the Bay of Bengal. During the post monsoon and early part of Northeast monsoon, storms and depressions originating in the Bay affect the weather of coastal Orissa. Some of the depressions originating in the neighbouring sea may intensify into severe cyclonic storms with strong winds (80-140 km/hour) and squalls giving very heavy rainfall to the region. The mean maximum summer and mean minimum winter temperature are around 39ºC and 11.5ºC respectively, (Meteorological Department at Cuttack, Government of Orissa).
2.5. Soil and Vegetation
The region is covered primarily by two major soil types. The area is rich in Lateritic soil which is characterized by high composition of hydrated oxides of iron and aluminium. These soils are

MAPPING OF 2006 FLOOD EXTENT IN BIRUPA BASIN, ORISSA, INDIA, USING VISUAL AND DIGITAL CLASSIFICATION TECHNIQUES ON RADARSAT IMAGE. A COMPARATIVE ANALYSIS
10
loamy sand to sandy loam in the surface having ‘hard-pan’ (locally used as cheap building material) in the subsoil. These soils are low in fertility with low proportion of organic matter. Crops can be raised better in these soils through proper soil management and application of organic manure. Deltaic alluvial soil forms the other category of soil and is characterized by high water holding capacity. Once water-logged, the clay soil takes longer time to become ploughable. Drainage is difficult due to slow permeability. Deltaic alluvial soils are generally fertile but fertility decreases if the soil is not recharged regularly by flood. Deltaic alluvial soils are suitable for paddy that is cultivated thrice in a year in some of the patches. Although the area falls within the area of tropical deciduous forest, almost the entire natural cover has been removed and replaced by agricultural fields and small scattered rural settlements.
2.6. Economic Aspect
Cereals dominate the cropping pattern in this area and among cereals; paddy is dominant crop, making it virtually a monoculture region (figure 2-4). Paddy is grown in all the seasons in the study area. The crop period is divided into three parts. First, Kharif season in which sowing is done in starting of June and harvesting in September to November. Second, sowing starts in April and harvested in August or September. Third, is the Rabi paddy crop sown in November December and harvested in March April. Paddy is a crop of hot and humid climate. Paddy needs high temperature (21ºC to 37ºC) and enormous amount of water (0.5 to 0.6 meters) the initial stage of cultivation. Paddy can withstand water if the water height is not more then the plant height up to approximately 10 days, but longer duration then this is harmful for the plant roots. The other important crop of the area is Jute which is a fibre crop (figure 2-5). Jute requires 24oC to 37oC of temperature. Constant water logging for more then 2 weeks is harmful for the crop, if the stagnant water height is more then the plant height, even a period of one week of stagnant water can totally damage the crop. As both crops require large amount of water, farmers start planting from the areas of drainage congestion and gradually expand outwards as water spreads due to rain or water being brought into the area by canals.
Figure 2-4: Paddy cultivation Figure 2-5: Jute cultivation
2.7. Demography
The total population of the study area is 13708 (Block Development Office, Government of Orissa). Arakhpur (2040 persons), Kundal (1792 persons), Koliatha (1353 persons) villages have highest, while Hargobindpur (51 persons), Bidiyadharpur (115 persons), Daulatpur (152

MAPPING OF 2006 FLOOD EXTENT IN BIRUPA BASIN, ORISSA, INDIA, USING VISUAL AND DIGITAL CLASSIFICATION TECHNIQUES ON RADARSAT IMAGE. A COMPARATIVE ANALYSIS
11
persons) villages have lowest population. Males out-number the female population as they comprise 56% of the total population while the female comprise the remaining 44%. The percentage of population below 16 years of age is 60% indicating a very high growth rate of population. This very high growth rate of population is cause as well as the effect of the low quality of life that poverty ridden people of the area are subjected to.
2.8. Settlements
The study area has a typical rural setting with settlements occupying primarily the natural levees, covered under dense canopy and characterized by large number of small tanks. The area has two strings of settlements, one running along the Ganguty river and the other running close to Birupa river. Prominent villages along the Ganguty include Jaypur, Kundi, Madhupur, Dobandia, Basudeopur, Nilambarpur, Gaurpatana and Surkudeipur (figure 2-6). Sipura, Kotpada, Hansadia, Kuhunda, Kotpada, Sankhapur, Alorigram and Sahapur are the major villages along the Birupa river. The villages along Ganguty river have the advantage of being protected by separate embankment that has been strengthened (figure 2-7) at locations vulnerable to breaching by layer of small boulders while those along Birupa are left with what
Figure 2-6: Settlements and Village Headquarters Source: Based on Google Image of the area and Indian Toposheet No 73 L/2 ever little protection the canal embankment (figure 2-8) can offer. Houses in the area are made either of concrete and brick or of straw and mud. Those made of concrete were mostly located along the road where as the house made of mud and straw were on the outskirts of the village close to adjoining fields. Houses were made on raised platforms to avoid the effects of an occasional high floods caused due to breach in river embankments.

MAPPING OF 2006 FLOOD EXTENT IN BIRUPA BASIN, ORISSA, INDIA, USING VISUAL AND DIGITAL CLASSIFICATION TECHNIQUES ON RADARSAT IMAGE. A COMPARATIVE ANALYSIS
12
Figure 2-7: Strengthened embankment along
Ganguty river.
Figure 2-8: Canal embankment along
Birupa river
2.9. Road Network
The National Highway No 5A is the only prominent road in the region that also marks the eastern extent of the study area (figure 2-9). Within the area roads connect the major nucleus of rural settlements. The eastern part has the longest road within the area that connects Gaurpatana village with Sipura while passing through Nauhat, Barabali and Gopalpur. Moving west in the central part is a small road that passes through the areas of drainage congestion and connects Ghisuan with Dhaulia. Further west is an important road that connects Kotpada with Jaypur after passing through Banagaria, Molikpur and Kundi. Kotpada along Birupa and Jaypur along Ganguti are the locations where bridges have been built to cross the two rivers. In the south western corner is the road that connects Nurtang (the ‘tehsil’ headquarter located on the other side of Birupa river) with the study area and further reaches up to the village of Jaypur to join the road running from Kotpada (figure 2-9). The two roads after joining cross Ganguty river via a bridge. The area has two other major roads that follow the two canals along the rivers and connect the cluster of villages along the two rivers and canals.
2.10. Canal Network
The canal system, developed in this area is an extension of the Pattamundai canal system that starts near Naraj barrage on the outskirts of Cuttack city on Birupa river. Water from Pattamundai canal is brought into the area through a siphon system (figure 2-10) where canal is made to cross Birupa river at Triveni (figure 2-9) in the southern part of the area. Immediately after crossing the Birupa river the canal splits into two parts (figure 2-11), one branch continues to run parallel to Birupa river before ending near Sipura (figure 2-9). In the eastern part of the area while the other branch runs towards north and after reaching the embankments of Ganguti river, runs parallel to it before culminating at Nilambarpur (figure 2-9) in the north eastern corner of the area.
EMBANKMENT

MAPPING OF 2006 FLOOD EXTENT IN BIRUPA BASIN, ORISSA, INDIA, USING VISUAL AND DIGITAL CLASSIFICATION TECHNIQUES ON RADARSAT IMAGE. A COMPARATIVE ANALYSIS
13
Figure 2-9: Road and Canal network. Source: Based on Google image and field survey.
Figure 2-10:Siphon on Birupa river at Triveni Figure 2-11: Canal splitting into two branches.
The two canals while running parallel to the rivers have minor canals originating from them that bring the canal water to the areas of natural depressions in the central part of the area. It was observed that some of the small canals have been made through the low ridges in the central part so that they interconnect the areas of depressions. This arrangement has been made to facilitate the movement of ‘excess’ water from one area of depression to the next and thus was protecting the agricultural fields around the first depression from getting submerged. The embankments along the canal also play an important role in influencing the spread of water in the process of preventing the fields from flooding.

MAPPING OF 2006 FLOOD EXTENT IN BIRUPA BASIN, ORISSA, INDIA, USING VISUAL AND DIGITAL CLASSIFICATION TECHNIQUES ON RADARSAT IMAGE. A COMPARATIVE ANALYSIS
14
3. Literature Review
3.1. Remote Sensing and Flood Inundation Mapping
Accurate information on the extent of water bodies is important for flood prediction, monitoring, and relief (Smith, 1997). Often, this information is difficult to acquire using traditional ground based survey techniques as water bodies in times of flood can be inaccessible and dangerous. The synoptic and repetitive nature of remotely sensed data by satellites have emerged as a powerful tool to prepare flood inundation maps in near real-time, which can be effectively used for relief , damage assessment and flood management. Remote sensing techniques have become promising tools for determining the extent and duration of flood in different areas, depth of flooded areas and the consequent hazard due to flood. Information on flood magnitude can be provided by remote sensing by relating the extent of flooding to the flood magnitude. Flood duration and inundation pattern can also be extracted with multiple data of the same area by satellites. The other potential uses of remote sensing for flood disaster management include flood plain land use mapping, providing inputs for flood forecasting and warning, mapping river channel migration and identification of chronic flood prone areas. When compared with traditional ground based survey on a long term basis, remote sensing come out to be a cost-effective and efficient technique when large areas are to be covered and analyzed for intensive study. In the initial stages of satellite remote sensing data was available from Landsat Multi Spectral Scanner (MSS) with 80 m resolution. MSS band 7 (0.8–1.1 μm) was found suitable for delineating water or moist soil from dry surface on account of strong absorption of water in the near infrared range of the spectrum (Smith, 1997). In the infrared region of the Electromagnetic (EM) spectrum, water body absorbs the incoming energy where as the surrounding land features including vegetation are comparatively highly reflective. This unique physical principle of reflectance had been used to map flood inundated area by Sanyal and Lu, (2003).Since the early 1980, Landsat Thematic Mapper (TM) images with 30 m resolution had been the major source of data for monitoring floods and delineating the boundary of inundation. During later stages SPOT multi spectral imageries were also used for flood delineation with an assumption that water has very low reflectance in the near infrared portion of the spectrum. SPOT imageries were used along with digital elevation model for delineation of floods in Bangladesh (Oberstadler et al., 1997; Sado and Islam, 1997). Coarse resolution imageries like Advanced Very High Resolution Radiometer (AVHRR) data were found useful for floods with large areal extent (Islam and Sado, 2000). In case of flood affected area being very large, it will not be feasible to use very high-resolution data as the whole area will be covered in number of scenes. Therefore use of NOAA (National Oceanographic Atmospheric Administrative) data is quite useful in such type of studies. NOAA-

MAPPING OF 2006 FLOOD EXTENT IN BIRUPA BASIN, ORISSA, INDIA, USING VISUAL AND DIGITAL CLASSIFICATION TECHNIQUES ON RADARSAT IMAGE. A COMPARATIVE ANALYSIS
15
AVHRR data have the potential for flood monitoring due to high frequency of global coverage, wide swath, high repeativity and low cost that provides an opportunity to monitor the progress of a flood in near real-time, (Jain et al,. 2006). To use near infra red band more effectively for water detection, Normalized Difference Vegetation Index (NDVI) has been used to monitor river from AVHRR images. Water has a unique spectral signature in the near infrared region which is very different from other surface features. Thus when a surface feature is inundated, its NDVI value changes considerably from the normal situation. Wang et al. (2002) have observed that the NDVI value for inundated surface features remains negative while the value for non inundated surface is commonly greater than 0. The choice of threshold in such cases is critical because natural condition of river flooding varies from place to place which suggests that using NDVI values might not be universally effective and accurate in delineation of inundated area. Other factors such as atmospheric condition, cloud cover and satellite viewing angle also influence NDVI values and these should be kept into consideration before calculating the NDVI (Sanyal, and Lu, 2003). In the past decade Indian Remote Sensing satellites have been providing flood information for different parts of the country. The IRS series of satellites has on board, LISS-I and LISS-II and PAN (IRS-1C and 1D) sensors which provides valuable information on flood in optical region of Electromagnetic Spectrum at spatial resolution of 72 m (LISS-I), 36.5 m (LISS-II), 23.5 m (LISS-III) and 5.8 m (PAN) with a repetitively of 22 days (IRS-1A and 1B), 5 days and 24 days (IRS-1C and 1D), and 5 days (IRSP3). WiFS sensor data from IRS-1C, 1D and P3 satellites is now playing an important role in monitoring and management of flood in view of its large swath, high repeativity and frequent coverage of flood scenes during critical period of flood. In addition to IRS satellites, NRSA has been receiving data from meteorological satellites, NOAA (AVHRR) as well. With optical remote sensing, difficulties are often faced in mapping and monitoring of flooded terrain. Dense vegetation canopy leads to loss of information from the visible or infrared portion of the Electromagnetic Spectrum. The presence of cloud cover appears as the single most important limitation in capturing the progress of floods in bad weather condition (Rashid and Pramanik, 1993; Melack et al., 1994). In this respect microwave data provides a solution to such limitations on account of its penetration capability through the clouds.
3.2. Microwave Remote Sensing for Flood Inundation Mapping
Radar imagery is capable of penetrating the atmosphere regardless of weather conditions and depending on the wavelengths and polarization mode involved. Microwave energy can ‘see’ through haze, light rain, snow, clouds and smoke. Microwave reflections or emissions from earth materials bear no direct relationship to their counterparts in the visible or thermal portions of the spectrum, thereby providing independent environmental information concerning landscape features. Since the system is active, it is not dependent on natural illumination, and the frequencies used are capable of penetrating cloud cover. This gives microwave sensors a unique all-weather, day/night capability, which is a considerable advantage over optical sensors. Thus due to its all weather, day and night capabilities, SAR imagery presents obvious

MAPPING OF 2006 FLOOD EXTENT IN BIRUPA BASIN, ORISSA, INDIA, USING VISUAL AND DIGITAL CLASSIFICATION TECHNIQUES ON RADARSAT IMAGE. A COMPARATIVE ANALYSIS
16
advantages over optical instruments, especially in flood management applications (Matgen et al., 2007). SAR image from ERS and RADARSAT differs from optical sensors in the type of data it acquires and in how this data is collected, processed and analysed. Typical multi-spectral sensors, such as SPOT and LANDSAT, collect the energy reflected from the Earth’s surface at wavelengths roughly equivalent to those detected by human eyes as well. These sensors capture the reflected energy within one or more frequency bands. Each band or channel represents a unique picture of the Earth’s surface and can be interpreted individually or in combination with other bands. Image processing techniques make it possible to combine these bands to produce a colour image of the Earth’s surface. Radar sensors such as RADARSAT, ERS, and JERS make use of energy transmitted at microwave frequencies (not detected by the human eye). RADARSAT operates at a single microwave frequency, which generates one channel of data and consequently, a black and white image. As an active sensor, SAR transmits a microwave energy pulse directly towards the surface of the earth. The SAR sensor measures the amount of energy which returns to the satellite after it interacts with the earth’s surface. Unlike optical sensors, microwave energy from RADARSAT penetrates clouds, rain, dust, or haze, and acquires images regardless of the Sun’s illumination, enabling RADARSAT to collect data under most atmospheric conditions. SAR has been used for a number of flood and flooded vegetation mapping applications. Radar is good at detecting open water which generally is a specular target, unless significantly wind roughened, providing good contrast with the higher backscatter from land and vegetation. Thus radar data in general, and RADARSAT in particular, are very good for detecting open surface water and have been used operationally for flood monitoring in many countries, (Brisco et al., 2008).
3.3. Conventional Techniques
Analysis of satellite data for flood inundation mapping is generally carried out by visual interpretation or by digital image processing techniques. Visual interpretation is based on the fact that water surface which is comparatively smoother than the surrounding dry land, acts as a specular reflector, giving low backscatter. Visual interpretation gives a reasonably accurate assessment of spread of water (Sanyal and Lu, 2003) but as this is done manually, it consumes lot of time especially when the area to be mapped happens to be large (Matgen et al., 2007). In relief and rescue operations, information relating to flood extent should not only to be accurate but also is to be provided as soon as possible and it for this reason that visual technique inspite of being accurate is often not used and flood extent mapping is carried out by some other appropriate digital technique. In digital analysis, the applied technique classifies each pixel into water and non-water categories by comparing their individual reflectance value. Beside visual interpretation there are a number of automatic information extractions algorithms that have been developed over the years in order to extract information form satellite imagery. Thresholding is one of the most commonly used techniques in active remote sensing to delineate flooded areas from non flooded areas in a radar image. A threshold value of radar back scatter is set in decibel (dB) to determine whether a given pixel is ‘flooded’ or not. In this technique,

MAPPING OF 2006 FLOOD EXTENT IN BIRUPA BASIN, ORISSA, INDIA, USING VISUAL AND DIGITAL CLASSIFICATION TECHNIQUES ON RADARSAT IMAGE. A COMPARATIVE ANALYSIS
17
intensities below a threshold value is regarded as flooded where pixels with intensities above the threshold are regarded as non-flooded. This threshold will depend on the contrast between the land and water classes. One way to choose an appropriate threshold is by visual inspection of the image histogram. The histograms of SAR image covering flood events often do not show a clear distinction between two modes ‘flood’ and ‘non-flood’. Thus, the method of choosing a threshold value by trial and error still enjoys a central position in applications of radar image segmentation (Gonzalez et al., 2004). In this case study, the choice of a reliable threshold value was facilitated by the availability of control points measured at the inundation boundary. The contrast further depends on the polarization, incidence angle of the SAR system and the ground conditions as is demonstrated by Hiroya et al., (2006). Change detection can be used as a powerful tool to detect flooded area in SAR imagery. It is performed by acquiring two imageries taken before and after the flood. Coherence and amplitude change detection techniques are applied in SAR domain. In the amplitude approach, areas are delineated as flooded where the radar back scatter is observed to be in considerable decline from before flood to after flood imagery (Nico et al., 2000). In the coherence approach areas are generally identified as flooded where the coherence or correlation of radar backscatters from before and after flood imagery are very low (Nico et al., 2000). Multi-date SAR scenes for the same area can be projected to red, green and blue channels to create a colour composite. Ramsey (1995) has used ERS SAR data to map the extent of coastal wetlands in Florida based on backscatter differences associated with high tide (flooded) and low tide (non-flooded) conditions. Ramsey (1995) further showed that there is a direct relationship between marsh flooding and low radar returns. Imhoff et al., (1987) showed that SAR imagery can be more effective than Landsat images or aerial photographs (colour and infrared) for mapping flooded areas. They showed that SAR imagery processed using simple density slicing or threshold techniques delineated flooding in Bangladesh during the monsoon than Landsat imagery with better precession. When verified by the aerial photographs, SAR imagery had an accuracy of 85% compared with 64% by Landsat (Imhoff and Gesch, 1990). Several studies in the Brazilian Amazon region (Pope et al., 1997 and Costa et al., 2002) have demonstrated that radar backscatter signatures could discriminate flood stages along the Amazon. Similar observations have been made in other studies in south-eastern USA (Townsend, 2002). SAR data has emerged as a useful data source for mapping inundation in forested wetland. It has been reported that L-band radar provides the best distinction of flooding in a forest when compared to C-band radar (Wang et al., 2002). SAR data has been used extensively to mapping flood event of Rhine valley using evidence based interpretation of satellite images (Oberstlader et al., 1997) and catastrophic flood that occurred in Regione Piemonte in Italy (Brivio et al., 2002). Multi-temporal time series of space borne L-band SAR data from Japanese Earth Resource Satellite-1, (JERS-1) were used to generate a model of the spatial and temporal variation of inundation and trace gas emissions on the floodplain of Central Amazon river (Rosenqvist et al., 2002). Works have been carried out towards modelling flood inundation using integrated GIS with Radar and Optical Remote sensing by Townsend and Walsh, (1998). Synthetic aperture radar (SAR) data along with visible/infrared (VIR) satellite imagery was used for mapping the extent of standing water in the Peace-Athabasca delta. The importance to using

MAPPING OF 2006 FLOOD EXTENT IN BIRUPA BASIN, ORISSA, INDIA, USING VISUAL AND DIGITAL CLASSIFICATION TECHNIQUES ON RADARSAT IMAGE. A COMPARATIVE ANALYSIS
18
SAR imagery in combination with radar data is highlighted by (Toyra and Martz, 2001) who have demonstrated that SPOT scene in combination RADARSAT S1 scene achieved significantly better results than those obtained when SPOT was classified in combination with RADARSAT S7 scene.
3.4. Advanced Techniques
The nature of surface in terms of vegetation also has a significant impact in delineation of water using SAR images. In areas of rice cultivation, bogs and marshes there can be ample amount of ambiguity in separating water from short-vegetation as protruding vegetation has significant effect on backscatter values in SAR images (Matgen et al., 2004). Horritt et al., (2003) have discussed the use of polarimetric radar in discriminating short emergent vegetation in coastal wetlands by combining radar and optical remote sensing data. Townsend and Walsh, (1998) have evaluated the ability of Landsat TM and SAR data to detect flooding under forest canopy and their results showed that combined use of radar and optical remote sensing in conjunction with GIS modelling can be an effective method for forested wetland mapping. ERS-1 SAR and IRS-1B LISS-II (Indian satellite with optical sensor) data were used for discrimination of mangrove wetlands in the Ganges delta of West Bengal, India (Kushwaha et al., 2000). They found that the use of multi-temporal SAR images and the integration of SAR data with the multi-temporal optical sensor data can improve the information on wetlands considerably. Augusteijn and Warrender (1998), have integrated AIRSAR (NASA 2000) and ATLAS (Advanced Thermal and Land Applications Sensor) data together into a neural network classifier, and found marked improvement in results as compared to when the data were used separately. While each of the methods and datasets has its own merits and suitability for certain wetland conditions, there is no single method or dataset that can accomplish the job on a large scale. Hence for rule-based wetland mapping method, the inputs that are to be considered depends on the surface characteristics of the area and also what needs to be extracted and mapped. Rule-based mapping method has been used by Junhua and Wenjun, (2005), to integrate Landsat ETM+, RADARSAT SAR images and DEM data for accurately mapping the east Canadian wetlands. Multiple reflections between the water surface and upright vegetation enhances backscattering giving flooded vegetation a bright radar return, the magnitude of which depends on radar look angle, wavelength and polarization. Henderson (1995) has detected high radar returns from flooded forest and swamp and found an inverse relationship between SAR returns and the depth of marsh flooding. Wang et al., (1995) have modelled these interactions mathematically and their results show that for C-band SAR at an incidence angle of approximately 20° flooding under Amazonian forest canopies increase backscatter by approximately 2.6 dB. The phase information in SAR imagery also has the potential to be used for flood mapping. Wegmuller et al., (1995) have found that water could be identified as regions of low backscatter and low interferometric phase correlation between 2 SAR scenes. Active contour models or snakes which is a statistical tool have recently gained popularity as a means of turning incomplete and noisy edge maps into smooth continuous vector segment boundaries Horritt et al., (2003). The capability of contour algorithm to image statistics over a

MAPPING OF 2006 FLOOD EXTENT IN BIRUPA BASIN, ORISSA, INDIA, USING VISUAL AND DIGITAL CLASSIFICATION TECHNIQUES ON RADARSAT IMAGE. A COMPARATIVE ANALYSIS
19
number of pixels while maintaining well define boundaries of SAR makes it potentially powerful tool for image processing Horritt et al., (2003). Flood extent mapping using object-oriented image segmentation approach is based on the concept that important information necessary to interpret an image is not always represented in single pixels but in meaningful image objects and their mutual relations (Benz et al., 2004). The object oriented approach is preferred as an image processing method as it combines the spectral information with spatial information as shape, size, texture and neighbourhood relations to increase the classification abilities. The object-oriented approach can contribute to powerful automatic and semi-automatic analysis for most remote sensing applications (Benz et al., 2004). It is generally hard to sharply delineate objects from nature. In satellite image also the boundary of natural objects can not be represented by a crisp line. As the sensor systems records, the reflected or emitted energy from heterogeneous mixture of biophysical materials such as soil, water and vegetation and the land-cover classes merges them into one another without any sharp, hard boundaries. To overcome these difficulties of the conventional statistical classifiers, fuzzy set classification logic is considered. This takes into account heterogeneous and imperfect nature of the real world. Instead of being assigned to a single class out of ‘n’ possible classes, each pixel in a fuzzy classification has ‘n’ membership values, each associated with the degree of co-relation with each of the classes of interest. Subpixel mapping is a recently proposed technology aimed at increasing the spatial resolution of fuzzy or soft classification results derived from remote sensing imagery by Ling et al., (2008). This technique uses the soft classification results as input and determines the spatial allocation of each class based on the principle of spatial correlation. Subpixel mapping technology has been used in refinement of ground control point location estimates (Foody, 2002) and coast waterline mapping (Foody et al., 2005).The foundation of these subpixel mapping methods is based on the spatial correlation of natural phenomenon, referring to the tendency for spatially proximate observations of a given property to be more alike than more distant observations (Ling et al., 2008). However the spatial correlation principle is often not enough to represent precisely the spatial relationship of some particular natural phenomena and additional information about the land cover can provide more accurate subpixel mapping results (Nguyen et al., 2006). The existing studies point out some common problems encountered in accurately extracting the flood affected area from SAR imageries. The major problem is associated with the relation between radar wave length and roughness of the terrain and water body. Pure and calm water acts as a specular reflector to the radar signals due to which the radar antennae receive no backscatter and the water appears in dark tone in the SAR imageries. Rough water surface appears in brighter tone in the SAR imageries than the calm water (Kundus et al., 2001). During floods, windy condition usually prevails over the affected area. Wind induced ripples in the water surface frequently creates problems for the interpreter to determine the threshold value to delineate the flooded area. As discussed earlier forest cover also poses an obstacle to accurately identify inundated areas from a SAR image. The key to identify the inundated areas under forest cover lies in the fact that flooded forests produces a bright radar back scatter in contrast to non flooded forests due to a double bounce

MAPPING OF 2006 FLOOD EXTENT IN BIRUPA BASIN, ORISSA, INDIA, USING VISUAL AND DIGITAL CLASSIFICATION TECHNIQUES ON RADARSAT IMAGE. A COMPARATIVE ANALYSIS
20
effect (Kundus et al., 2001), whereas the flooded areas without a forest canopy appear dark in SAR imageries. An accurate separation of the flooded and non-flooded settlements is also problematic. Normally the high back scatter of the buildings overlay the back scatter of flood water within the settlements. Rural settlements, especially in eastern India are often surrounded by trees. Therefore, due to the effect of trees, inundation within the settlements is very difficult to detect (Oberstadler et al., 1997). Radar back scatter also depends on the orientation of the rough surface (furrows of a ploughed field). As radar signals are directional in nature, the same surface may produce different tonal signatures depending on the relative orientation of the rough surface to the radar antenna. Establishing a universal threshold value for detecting flood is neither possible nor justified. A particular algorithm of deriving the threshold for differentiating inundated areas from the dry land may or may not work with the same efficiency in different settings (Jin, 1999). He emphasized the importance of knowledge in the regional geography of the area under investigation in setting any threshold value which emphasizes the importance of an extensive field survey when working with SAR images to delineate land water boundary.

MAPPING OF 2006 FLOOD EXTENT IN BIRUPA BASIN, ORISSA, INDIA, USING VISUAL AND DIGITAL CLASSIFICATION TECHNIQUES ON RADARSAT IMAGE. A COMPARATIVE ANALYSIS
21
4. Materials and Methods
To carry out any research, different types of data are required from different sources and for different purpose. This chapter gives a brief description of the input data, the RADARSAT SAR images from which flooded areas are to be extracted. Further some of the important characteristics of RADRASAT relating to its orbit, system specification and the SAR antenna and the different beam modes that are available are mentioned. A brief account is made regarding the backscatter coefficient value of Synthetic Aperture Radar (SAR) images and how they are generated. Details are mentioned regarding the-pre processing of data that had already been carried out at National Remote Sensing Centre (NRSC) before providing to Indian Institute of Remote Sensing (IIRS). The pre-processing of data need to be understood and kept into consideration while data processing, while analysing the results and drawing conclusions. Finally, the chapter presents a brief methodology as to how the input data is used in different techniques to generate flood inundated maps.
4.1. Introduction to RADARSAT 1
Developed by Canada, RADARSAT-1 is a sophisticated Earth observation satellite that provides the world with the first operational radar satellite system. RADARSAT-1 was developed under the management of the Canadian Space Agency (CSA) in cooperation with NASA/NOAA, the Canadian provincial governments, and the Canadian private sector. RADARSAT -1 was launched by Canadian Space Agency on November 4, 1995 to monitor environmental change and to support resource sustainability. With its launch, Canada offers access to the first radar satellite system capable of large scale production and timely delivery of data to meet the needs of scientific programmes and provides a new source of reliable and cost-effective data for environmental and resource professionals world wide (Centre for remote imaging 2006). RADARSAT-1 uses SAR, an active microwave sensor and allows data collection independent of weather and illumination.
4.1.1. The RADARSAT-1 orbit
RADARSAT is placed in a near-polar, sun-synchronous orbit 798 km above the Earth. It has a dawn-dusk orbit and is rarely in eclipse or darkness. The orbit characteristics are: Geometry near-polar, sun-synchronous (dawn-dusk) Altitude 798 km Inclination 98.60 Period 100.7 minutes Repeat cycle 24 days Orbits per day 14

MAPPING OF 2006 FLOOD EXTENT IN BIRUPA BASIN, ORISSA, INDIA, USING VISUAL AND DIGITAL CLASSIFICATION TECHNIQUES ON RADARSAT IMAGE. A COMPARATIVE ANALYSIS
22
4.1.2. RADARSAT-1 system specifications
Frequency 5.3 GHz Wavelength 5.6 cm (C-band) RF Bandwidth 11.6, 17.3, or 30.0 MHz Antenna Size 15.0 x 1.5 m Shifter Quantization 8 bits
4.1.3. The SAR antenna
RADARSAT is equipped with an advanced SAR: • C-band wavelength (5.6 cm), • HH polarization (horizontally transmitted, horizontally received), • Right-looking, steerable antenna, • Scan SAR capability for wide area coverage • Multi-mode imaging capabilities.
4.1.4. RADARSAT-1 Beam Modes
The RADARSAT-1 satellite has seven beams modes along with its 500 km swath (figure 4-1). Each beam mode offers a different coverage of area and resolution. Within each RADARSAT-1 beam mode a number of incidence angle are present which are termed as Beam Positions. Generally the SAR sensor operates either in Single Mode or in Scan SAR. In Single Beam Mode operation the beam elevation is constant through out the data collection period. It includes Fine Beam, Standard Beam, Wide Beam, Extended High Beam and Extended Low Beam. Whereas in case of Scan SAR operation two, three or four single beams are used during data collection (Centre for remote imaging 2006). In RADARSAT-1 various beam modes while tracking the earth surface are shown in the figure 2.1. The SAR sensor works at 5.6 cm wavelength, termed as C-band. RADARSAT-1 transmits and receives its C-band microwave energy in a horizontal orientation known as polarization. This is known as HH polarization system. Variation in the return signal in the form backscatter is a result of variations in the physical property, roughness and topography of the surface. This sensor has selective viewing angles that allow a wide range of terrain conditions, applications and ground coverage to be imaged according to the requirements (Centre for remote imaging 2006).
Figure 4-1: RADARSAT Beam modes (Centre for remote imaging 2006)

MAPPING OF 2006 FLOOD EXTENT IN BIRUPA BASIN, ORISSA, INDIA, USING VISUAL AND DIGITAL CLASSIFICATION TECHNIQUES ON RADARSAT IMAGE. A COMPARATIVE ANALYSIS
23
4.2. RADARSAT imageries
In the present work, RADARSAT SAR data of 50 meter spatial resolution with narrow beam mode (300 x 300 km scene) is used. All four images depict the backscatter coefficient of the pixels that is the values are in ‘σo’ (sigma nought) which is expressed in dB. A single radar image is usually displayed as a grey scale image. The intensity of each pixel represents the proportion of microwave energy backscattered from the surface, which depends on factors like type of the surface, size, shape and orientation of the target area, moisture content of the target area, land-use and presence of vegetation etc. Frequency and polarization of the radar pulses as well as the incident angle of the radar beam also have a role to play on the signal strength received. Backscatter is the portion of the outgoing radar signal that the target redirects directly back towards the radar antenna. The scattering cross-section in the direction toward the radar is called the backscattering cross-section. The usual notation for it is the symbol ‘σ’. The normalized measure of the radar return from a distributed target is called the backscatter coefficient or ‘σ0’ and is defined as per unit area on the ground. In all, four images (dated 4 August 2006, 19 August 2006, 26 August 2006 and 4 September 2006) are provided for the study area. The 4 Aug 2006 image correspond with the initial phase of the flood when the water starts to accumulate in the areas of depressions, the 19 Aug 2006 image correspond with the stage when flood water begins to spread out from the areas of depressions and drainage congestion and makes its way into the adjoining agricultural fields and orchards. The overview of third image (26 August 2006) gives an indication that the flood has somewhat receded with water settling back into the areas of depression. The 4 September 2006 image corresponds with the peak flood when the flood water had attained its maximum height and reached its maximum spread (figure 4-2). At this stage only a visual overview of the spread and retreat can be made but how much area was inundated and how the flood has progressed remains the focus of this work which will be precisely known only after different image processing techniques have been adopted on different imageries.
Figure 4-2: Hydrograph of Ganguty river at Sripadmalabhpur Source: Irrigation Department, Government of Orissa.

MAPPING OF 2006 FLOOD EXTENT IN BIRUPA BASIN, ORISSA, INDIA, USING VISUAL AND DIGITAL CLASSIFICATION TECHNIQUES ON RADARSAT IMAGE. A COMPARATIVE ANALYSIS
24
4.3. The pre-processing of RADARSAT imageries
In the pre-processing phase, geometric correction, geo-referencing and re-sampling were carried out after which filtering of RADARSAT imagery was carried out using Lee-Filter, Median Filter to suppress and remove speckle, which intern improve image quality there by helping to resolve fine details within the images. Single radar image is usually displayed as a grey scale image and the intensity of each pixel represents the proportion of microwave energy backscattered from that area on the ground which depends on a variety of factors such as- type, size, shape and orientation of the surface in the target area; moisture content of the target area; frequency and polarization of the radar pulses; as well as the incidence angle of the radar beam. The pixel intensity values are often converted to a physical quantity called the backscattering coefficient or normalized radar cross-section measured in decibel (dB) units with values ranging from +5 dB for very bright objects to -40 dB for very dark surfaces (Cunjian et al., 1999). Hashim and Kadir, 1999 have calculated radar backscatter co-efficient value, dB using; Backscatter co-efficient = 10 log (DN2 /A) + 10 LOG sin I Where A Scaling gain (5695770.5) I Incidence angel (local incidence angle) DN Digital Number / Pixel value recorded from images.
4.4. Overall Methodology and Software used
Remote sensing approach is adopted and implemented for the purpose of this study. In this approach four classification techniques were performed on multi-temporal RADAR imageries for extraction of flood extent. Visual interpretation is accurate but tedious and time consuming while threshold technique is fast and is widely used to generate flood maps but as it is purely based on backscatter coefficient value which is affected by tree canopy, agricultural fields and man made structures, it may not give the best results. Rule based expert classification has been experimented to extract flooded areas that have close proximity in terms of spectral reflectance with irrigated rice and jute fields. Here spectral values are used in combination with spatial information (height) to improve the accuracy of classification results. After visual interpretation that works on human decision making and threshold and rule based expert classification that are digital techniques, Neural Network technique is applied which is designed to work like human neurons. Neural network with its capability to be trained and to generalize is used to delineate flooded areas from area of rice fields and scattered settlements and orchards. A schematic flow-chart depicting the methodology and techniques is shown (figure 4-3) followed by a brief background of the techniques along with their results and its description. There are various image processing softwares for processing and analysis of remotely sensed datasets. In the present work Arc GIS 9.1has been used for on-screen digitization resulting in the generation of the flood inundated areas. ERDAS Imagine 9.1has been used for generating classified map from thresholding and rule based expert classification techniques. ENVI 4.3 software has been used for neural network analysis for generating flood maps and rule image (fuzzy) for the given images. Microsoft excel 2007 has been employed for plotting graphs for interpretation and analysis. For the preparation of layouts of maps Arc GIS 9.1 and Adobe Photoshop 7.0 have been used. Picasa 3.0 has been used for processing of photographs that were taken during the field survey.

MAPPING OF 2006 FLOOD EXTENT IN BIRUPA BASIN, ORISSA, INDIA, USING VISUAL AND DIGITAL CLASSIFICATION TECHNIQUES ON RADARSAT IMAGE. A COMPARATIVE ANALYSIS
25
Figure 4-3: Flow chart of Methodology
4.5. Extraction of flooded area from RADARSAT images
4.5.1. Visual Interpretation
For satellite data analysis, visual interpretation is considered an effective and reliable technique for extracting the flood inundation extents, there by resulting in an accurate flood boundary (Sanyal and Lu, 2003). It is based on the principal that water surface on account of being comparatively smoother than the surrounding land, acts as a specular reflector and gives a low backscatter. However, one of the main drawbacks of this technique is that is consumes lot of time and is not considered suitable when working for large area. The process of visual interpretation limits quick and accurate acquisition of flood information at the time of emergency. Visual interpretation of the multi-temporal RADARSAT images of 4 August, 19 August 2006, 26 August and 4 September 2006 was carried out by onscreen digitization in Arc GIS 9.1. The digitization has been carried out by the creation of Personal Geo-database in ARC GIS 9.1. The line feature class was created under the feature dataset having the same co-ordinate system of that of the RADAR image. Once digitization of the datasets was complete, the vector layer was converted to polygons using the conversion tool viz. feature to
COMPARISON AND
ACCURACY ASSESSMENTS
VALIDATION OF RESULTS
FIELD WORK CARTOSAT-1 DEM
RADARSAT IMAGE4 AUG, 19 AUG,
26 AUG, 4 SEPT 2006
RADARSAT IMAGE24 JULY 2008
VISUAL INTERPRETATION
THRESHOLD METHOD
NEURAL NETWORK
RULE BASED EXPERT
CLASSIFICATION
FLOOD EXTENT MAP
FLOOD EXTENT MAP
FLOOD EXTENT MAP
FLOOD EXTENT MAP

MAPPING OF 2006 FLOOD EXTENT IN BIRUPA BASIN, ORISSA, INDIA, USING VISUAL AND DIGITAL CLASSIFICATION TECHNIQUES ON RADARSAT IMAGE. A COMPARATIVE ANALYSIS
26
polygon under the Data Management Tools of ARC GIS Toolbox. After digitization, datasets were completed, vector layer was cleaned and typology was built after which it was converted to shape file and finally to grid (Raster format).
Figure 4-4: Flooded Area by Visual Interpretation

MAPPING OF 2006 FLOOD EXTENT IN BIRUPA BASIN, ORISSA, INDIA, USING VISUAL AND DIGITAL CLASSIFICATION TECHNIQUES ON RADARSAT IMAGE. A COMPARATIVE ANALYSIS
27
Figure 4-5: Compound bar Diagram for Flooded Area by Visual Interpretation The results of visual interpretation reveal that the flood inundated area was 10.46 km2 on 4 August 2006 image and has spread to 17.67 km2 on 19 August 2006. Flood extent had decreased to 13.60 km2 on 26 August 2006 after which it reached its maximum spread of 23.57 km2 on 4 September 2006. The 4 August 2006 flood extent map shows that most of the water is concentrated in the central part of the study area with few patches along the national highway No. 5A (figure 4-6). The map for 19 August 2006 shows that the major spread of water has been towards the eastern side of the study area which shifts towards the west as the flood extent shrinks by 26 August 2006. On 4 September 2006 image flooded areas for on in the eastern part are devoid of non-flooded patches which are in sharp contrast with flooded areas of western side which area studded with non-flooded patches. The major feature of maps generated by visual interpretation is that flooded areas are devoid of non-flooded patches especially in the eastern corner of the study area on the 4 September 2006 image. As the flood spreads, it brings more and more cultivated area under water and a sharp boundary of flooded area gets transformed into a zone of transition (figure 4-7) and that makes delineation of flooded areas by visual method more tedious and difficult. It has been proved by Matgen et al, (2004), that protruding vegetation produces increased signal returns which makes accurate delineation of flood boundary more difficult.
Figure 4-6: Flooded Area along NH 5A
Figure 4-7: Flood boundary in form of Zone

MAPPING OF 2006 FLOOD EXTENT IN BIRUPA BASIN, ORISSA, INDIA, USING VISUAL AND DIGITAL CLASSIFICATION TECHNIQUES ON RADARSAT IMAGE. A COMPARATIVE ANALYSIS
28
When comparing the results of visual interpretation with the field observations it was found that some of the rice fields that were irrigated and were adjoining to the flood patches were also classified as flooded area and that makes it necessary to extract the areas of non- flooded rice fields from the study area. As the backscatter value shows only a minor change during the crop growth cycle it is not possible to visually delineate non-flooded paddy fields from the flooded areas. Non-flooded rice fields can be identified on the basis of typical change in backscatter value, the details of which and its results are discussed later in para 4.6.
4.5.2. Threshold Technique
Thresholding or Density Slicing implies dividing the histogram into two or more parts. To each sliced spectral range, an identity or class name is assigned for example flooded and non-flooded. There is a clear distinction between water and surrounding objects on radar image with backscatter values. The value for water ranges from a minimum value of -40 dB for clear water to an upper value of around -12 dB where water has protruding vegetation and heavy concentration of sediments. The histogram of the image is also looked upon for break values which can be used to divide the histogram. To accurately classify the image a good knowledge of the surface cover of the area is essential as radar backscatter is very sensitive to slight change in the moisture content of the surface. Presence of paddy fields can easily go on to add to the complexity while classifying. The time period between different images and the possible changes that could occur in the area besides spread and retreat of flood water also need to be understood and recorded for the area. As part of the pre-field work, the image with maximum extent of flood (4 September 2006) was classified using backscatter coefficient value of -13Db. Threshold value and accuracy of map generated was defined after an extensive field survey. In this study an attempt has been made to derive flood maps with choosing a threshold value by trial and error as suggested by Gonzalez et al., (2004). Threshold values in the range of -12 dB to -14 dB at an interval of 0.25 dB were used to derive different flood extent maps. Based on field data that is collected about the inundation pattern, accuracy assessment of above derived flood maps was made and among them the flood map with backscatter coefficient value of -12.5dB was found to have highest accuracy. Images of same area but of different year may not have the same threshold value of backscatter coefficient as was the case with the 24 July 2008 image for which the appropriate backscatter coefficient value was found to be -13.0 dB. The value of backscatter varies due to change in depth of water, presence of small vegetation, intermittent canopy of trees, sediments dissolved in water and agricultural fields at different stages of crop cycle. It was observed that a particular backscatter value can be appropriate for one patch and it may not be very appropriate for another patch due to effect of some of the factors mentioned above. Thus as the size of the area increases or the complexity of the area increases it becomes difficult to assign a single threshold value. Images of different dates can also have a difference in appropriate threshold value due to change in surface conditions and weather conditions but that is usually the case when flooding has occurred due to cyclonic storm which was not the case in 2006. Thus field information is very necessary to decide the threshold value to be used for classification. In the present study manual method was adopted

MAPPING OF 2006 FLOOD EXTENT IN BIRUPA BASIN, ORISSA, INDIA, USING VISUAL AND DIGITAL CLASSIFICATION TECHNIQUES ON RADARSAT IMAGE. A COMPARATIVE ANALYSIS
29
Figure 4-8: Flooded Area by Threshold Technique so that a correct and precise threshold range can be achieved by interactively slicing the histogram according to user needs. Thresholding technique was applied on all four

MAPPING OF 2006 FLOOD EXTENT IN BIRUPA BASIN, ORISSA, INDIA, USING VISUAL AND DIGITAL CLASSIFICATION TECHNIQUES ON RADARSAT IMAGE. A COMPARATIVE ANALYSIS
30
RADARSAT images (4th August, 19 August 2006, 26 August and 4 September 2006) and flood inundated maps were generated. Reclassifying or slicing of the histogram of all four images was done in ArcGIS 9.1 platform. There are various methods for classifying the histogram which is available in “Reclassify” option in Arc Map. The reclassify options include manual, equal interval, quintile, natural breaks, and standard deviation range of pixel values was studied and difference of Radar dB value between flood water and non-inundated areas. This in turn helps in land-flood discrimination where by the histogram was reclassified into two main broad classes i.e. flooded and non-flooded.
Figure 4-9: Compound bar Diagram for Flooded Area by Threshold Technique The results of thresholding technique show that the flood inundated area was 10.46 km2 on 4 August 2006 image and has increased to 16.74 km2 on 19 August 2006. Flood extent had decreased to 10.39 km2 on 26 August 2006 after which it reached its maximum spread of 21.22 km2 on 4 September 2006. The flooded areas in the images of first three dates are more or less devoid of non-flooded patches but in 4 September 2006 image large areas within the flooded parts are classified as non-flooded. During field survey it was observed that the area has numerous patches of tall grasses and scattered trees (figure 4-10).
Figure 4-10: Tall grass and trees in between
flooded areas.
Figure 4-11: Drainage Congestion due to Road
These areas of tall grasses and trees when classified by threshold techniques were classified as non-flooded as their canopy had a high backscatter coefficient value as compared to the

MAPPING OF 2006 FLOOD EXTENT IN BIRUPA BASIN, ORISSA, INDIA, USING VISUAL AND DIGITAL CLASSIFICATION TECHNIQUES ON RADARSAT IMAGE. A COMPARATIVE ANALYSIS
31
surrounding water. Thus on account of canopy, the area gave an impression that it is an elevated area surrounded by water, and in this condition DEM (digital elevation model) was used in the Rule Based Expert Classification. Outside the large areas that were flooded, numerous small and isolated areas were also shown as flooded. Field verification shows that large numbers of such patches were areas of paddy fields with different height of paddy crop and varying depth of water. Some of the patches that were close to the roads (figure 4-11) were flooded due to drainage congestion caused by roads. Such areas even have retained the moisture even after water has moved out and have been misclassified as flooded areas.
4.5.3. Rule Based Expert Classification
It has been established that spectral information when used in combination with spatial information can improve the accuracy of classification results. Human knowledge and experience about the topography, geology etc, about an area can be embodied in the classification procedures to prepare accurate classified maps. However, the most difficult part of knowledge based classification is the creation of knowledge base itself (Argialas and Harlow, 1990). Generally, knowledge base is prepared with help of other data sources that include government records and field observation. Once information base is prepared in context with objective to be achieved, hypothesis, rules for hypothesis and variables for the rule are defined and are subsequently used to prepare a decision tree (figure 4-13). In brief it can be said that knowledge engineer provides the interface for an expert with first-hand knowledge of the data and the application of it to identify the variable rules and concerned output classes and create the hierarchical decision tree (Argialas and Harlow, 1990). The classification to extract the land, river and flood in the pixel level had been worked out with the aid of expert classifier techniques in ERDAS IMAGINE 9.1 software. Rule based expert classification has been applied in the study area flooded areas have a close proximity in terms of spectral reflectance with irrigated rice and jute fields. Isolated clusters of trees within areas of drainage congestion, which were part of flooded area but due to their canopy cover, were misclassified as non-flooded areas by threshold method. To overcome such limitations, elevation data from DEM was used in combination with spectral information from RADARSAT images. Settlement clusters of Sipura in the eastern corner, Nilambarpur in north, Sahapur in south and Ghisuan in the central part (figure 2.4) that were located on the edge of the flood prone areas were selected and the area of these settlements that used to get flooded was carefully marked. The Cartosat DEM for the area shows that the areas that remained non-flooded were at an elevation above 13 meters while those that were subjected to flooding had elevation less than 13 meters. Thus 13 meters was assumed to be the higher limit of flood extent. Flood hydrograph prepared for Ganguty river observed at Sripadmalabhpur (figure 4-2) shows 12 meters was the highest flood level for 2006. Due to complex network of roads and canals within the area it was found that although the upper limit of flood was 13 meters it was not that all areas that were below 13 meters elevation were flooded. Thus besides the height information provided by DEM, backscatter coefficient values from RADARSAT images were used as input for making rules for expert classification (figure 4-13). Flood extent was extracted on the basis of areas that were below 13 meters elevation AND also had a backscatter coefficient value less than -12.5 dB.

MAPPING OF 2006 FLOOD EXTENT IN BIRUPA BASIN, ORISSA, INDIA, USING VISUAL AND DIGITAL CLASSIFICATION TECHNIQUES ON RADARSAT IMAGE. A COMPARATIVE ANALYSIS
32
Figure 4-12: Flooded Area by Rule Based Expert Classification

MAPPING OF 2006 FLOOD EXTENT IN BIRUPA BASIN, ORISSA, INDIA, USING VISUAL AND DIGITAL CLASSIFICATION TECHNIQUES ON RADARSAT IMAGE. A COMPARATIVE ANALYSIS
33
Figure 4-13: Decision tree for Rule Based Expert Classification
The results of rule based expert classification show that the flood inundated area was 10.46 km2 on 4 August 2006 and expanded to 15.4 km2 on 19 August 2006. Flood extent had decreased to 9.8 km2 on 26 August 2006 after which, it reached its maximum spread of 22.1 km2 on 4 September 2006. The 4 August 2006 flood extent map shows that most water is in the central part with few scattered patches. Within the flooded patches most of the area is shown as water with only two major lands patches one in the eastern part and another in the central part. There is marked increase in the spread of flood on 19 August 2006 image with swelling of water patches. The patch of land within the flooded area in the eastern part continues to exist while the patch of land within the flooded area in the central part has increased in size. The 26 August 2006 map show that there is decrease in extent of flood but the flooded patches in the eastern part are more or less devoid of non flooded patches.
Figure 4-14: Compound bar Diagram for Flooded Area by Rule Based Expert Classification Flood extent reaches its maximum extent on 4 September 2006 and the main feature of flood extent is the presence of large number of non-flooded patches in between the flooded area. It is interesting to note that as the flood spreads out due to increase in height of water, non
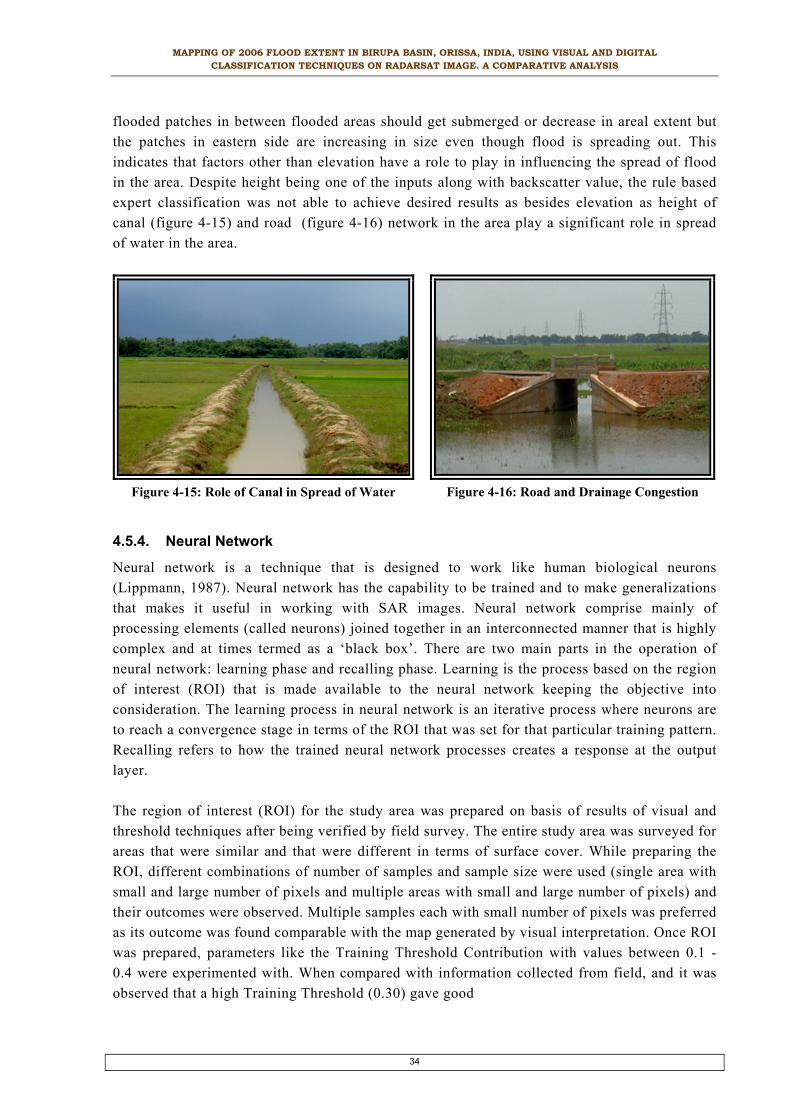
MAPPING OF 2006 FLOOD EXTENT IN BIRUPA BASIN, ORISSA, INDIA, USING VISUAL AND DIGITAL CLASSIFICATION TECHNIQUES ON RADARSAT IMAGE. A COMPARATIVE ANALYSIS
34
flooded patches in between flooded areas should get submerged or decrease in areal extent but the patches in eastern side are increasing in size even though flood is spreading out. This indicates that factors other than elevation have a role to play in influencing the spread of flood in the area. Despite height being one of the inputs along with backscatter value, the rule based expert classification was not able to achieve desired results as besides elevation as height of canal (figure 4-15) and road (figure 4-16) network in the area play a significant role in spread of water in the area.
Figure 4-15: Role of Canal in Spread of Water
Figure 4-16: Road and Drainage Congestion
4.5.4. Neural Network
Neural network is a technique that is designed to work like human biological neurons (Lippmann, 1987). Neural network has the capability to be trained and to make generalizations that makes it useful in working with SAR images. Neural network comprise mainly of processing elements (called neurons) joined together in an interconnected manner that is highly complex and at times termed as a ‘black box’. There are two main parts in the operation of neural network: learning phase and recalling phase. Learning is the process based on the region of interest (ROI) that is made available to the neural network keeping the objective into consideration. The learning process in neural network is an iterative process where neurons are to reach a convergence stage in terms of the ROI that was set for that particular training pattern. Recalling refers to how the trained neural network processes creates a response at the output layer. The region of interest (ROI) for the study area was prepared on basis of results of visual and threshold techniques after being verified by field survey. The entire study area was surveyed for areas that were similar and that were different in terms of surface cover. While preparing the ROI, different combinations of number of samples and sample size were used (single area with small and large number of pixels and multiple areas with small and large number of pixels) and their outcomes were observed. Multiple samples each with small number of pixels was preferred as its outcome was found comparable with the map generated by visual interpretation. Once ROI was prepared, parameters like the Training Threshold Contribution with values between 0.1 - 0.4 were experimented with. When compared with information collected from field, and it was observed that a high Training Threshold (0.30) gave good

MAPPING OF 2006 FLOOD EXTENT IN BIRUPA BASIN, ORISSA, INDIA, USING VISUAL AND DIGITAL CLASSIFICATION TECHNIQUES ON RADARSAT IMAGE. A COMPARATIVE ANALYSIS
35
results for small part of the image but when entire area was to be classified, a lower value (0.1) was found to be more suitable.
Figure 4-17: Flooded Area by Neural Network

MAPPING OF 2006 FLOOD EXTENT IN BIRUPA BASIN, ORISSA, INDIA, USING VISUAL AND DIGITAL CLASSIFICATION TECHNIQUES ON RADARSAT IMAGE. A COMPARATIVE ANALYSIS
36
Training Rate values between 0.1 and 0.5 were experimented and it was observed that as the training rate increased, the number of iterations decreased and the plot window showed a trend of oscillation. The training rate 0.2 was found suitable for classifying the SAR images for the area. As the training rate was kept low (0.2), the Training Momentum value was also kept low as higher values are used only with higher training rate to control the training process from oscillation. During the training process the plot window showing the RMS error as the iterations progressed was observed. The error should decrease and approach a steady low value if proper training occur (figure 4.a). If the errors are oscillating and not converging (figure 4.b), a lower training rate or a different ROIs should be used.
Figure 4-18: Neural Network plot
without oscillation (acceptable)
Figure 4-19: Neural Network plot
with oscillation (unacceptable)
The number of hidden layer was kept to one for classifying the single band RADARSAT imageries as the imageries were to be classified only in two classes (flooded and non-flooded). The number of hidden layers is kept more than one in cases where the image is to be classified into large number of classes or when the input data has large number of bands. A high number of iterations were set (1000) although while classifying the maximum number of iterations that were used ranged from 350 to 400. Once information from field was collected regarding the flooded and non-flooded status of the fixed points (road junctions, canal and road intersection), different combinations of internal parameters were applied on different images numerous times to find an optimum combination of internal parameters that could be used for extracting flooded areas in other but similar settings. Optimum combination of internal parameters of neural network that was used for extracting flooded areas is as follows; Training Threshold 0.1 Training Rate 0.2 Training Momentum 0.1 Number of Hidden Layer 01 The neural network results show that the flood inundated area was 10.76 km2 on 4 August 2006 image and has increased to 18.31 km2 on 19 August 2006. Flood extent had decreased to 10.81 km2 on 26 August 2006 after which it reached its maximum spread of 20.65 km2 on 4 September 2006. The 4 August 2006 flood extent map shows that most of the water was in the central part of the area while on 19 August 2006 flooded area had increased with swelling of

MAPPING OF 2006 FLOOD EXTENT IN BIRUPA BASIN, ORISSA, INDIA, USING VISUAL AND DIGITAL CLASSIFICATION TECHNIQUES ON RADARSAT IMAGE. A COMPARATIVE ANALYSIS
37
water patches and a few new water patches coming up. The 19 August 2006 image shows a major decline in the areal extent in flooding while the flood extent reached its maximum on 4 September 2006
Figure 4-20: Compound bar Diagram for Flooded Area by Neural Network
Similar pattern of flooded area and the intermittent non-flooded patches was observed in neural network also as observed by threshold and rule based classification. During the field survey it was found that these areas were actually irrigated rice fields and patches of scattered vegetation within the flooded area that were classified as water by visual method but by the digital method they were classified as non-flooded patches within flooded areas.
4.6. Comparison of flood extent by different techniques
Figure 4-21 shows that the flooded area extracted by neural network was maximum followed by visual interpretation on the first two dates while the trend is reversed in last two dates. The possible reason for this may be attributed to the error that has been introduced in flooded area extracted by visual interpretation due to spread of flood water in areas of rice fields in last two dates. It was found that visual interpretation was not accurate in delineating rice fields from flooded areas. Flooded area by threshold technique was comparatively more than that derived by rule based expert classification on first three dates (as the role of road and canal is dominant in initial stages of the flood) but 4 September 2006 (date corresponding with maximum spread of flood), flooded area by threshold technique was less as compared to flooded area by rule based expert classification (role of road and canal becomes less significant once water level rises above the height of road and canal embankment). In terms of flooded area as percentage of the total area, minimum variation (4%) in area by different techniques was recorded on 4 August 2006 when flood was in initial stage and maximum variation in flooded area (8%) was recorded on 26 August 2006 as flood has receded and in the process many areas that were earlier flooded had retained small patches and moisture and this had led to comparatively high variation in flooded area extracted by different techniques. On 19 August 2006 the variation in flooded area by different techniques is 6% and on 4 September 2006 the variation recorded was 5%. The figures indicate that as the flood reaches its maximum spread, it

MAPPING OF 2006 FLOOD EXTENT IN BIRUPA BASIN, ORISSA, INDIA, USING VISUAL AND DIGITAL CLASSIFICATION TECHNIQUES ON RADARSAT IMAGE. A COMPARATIVE ANALYSIS
38
inundates small patches of elevated areas, road and canal making a big and almost homogeneous stretch of water that leads to less variation in flooded area by different technique.
Figure 4-21: Comparison of flooded area by different techniques
4.7. Delineation of Non-flooded Paddy Fields
The results of the four techniques applied for extraction of flooded area from RADARSAT imageries show that the paddy fields within the area have played a major role in influencing the overall results. In visual interpretation, the irrigated paddy fields (which were non-flooded) have been classified as flooded area. In threshold method, areas that were inundated by flood waters, on account of rice crop were classified as non- flooded and individual irrigated rice fields far away from the flooded areas were classified as flooded although they were non-flooded. Similar problem persists in the rule based expert classification where addition of height information could help little in identifying the non-flooded patches within flooded areas and small patches of irrigated rice fields surrounded by non-flooded areas. Results from Neural Network are based on the region of interest (ROI) that is provided as input. If the input ROI is taken, where water was devoid of vegetation, then large areas where flood water has inundated agricultural crops would be left out and if ROI is taken from area where vegetation is present in water, then irrigated rice fields are also classified as flooded areas. Thus identification and delineation of rice fields from the flooded area becomes important so that the results of different classification techniques can be better understood. It is for this reason that delineation of rice fields from flooded areas has been kept as one of the sub-objective of the study.
Figure 4-22: Effect of Paddy growth on Backscatter behaviour. Source: Saho, et al. (2001).
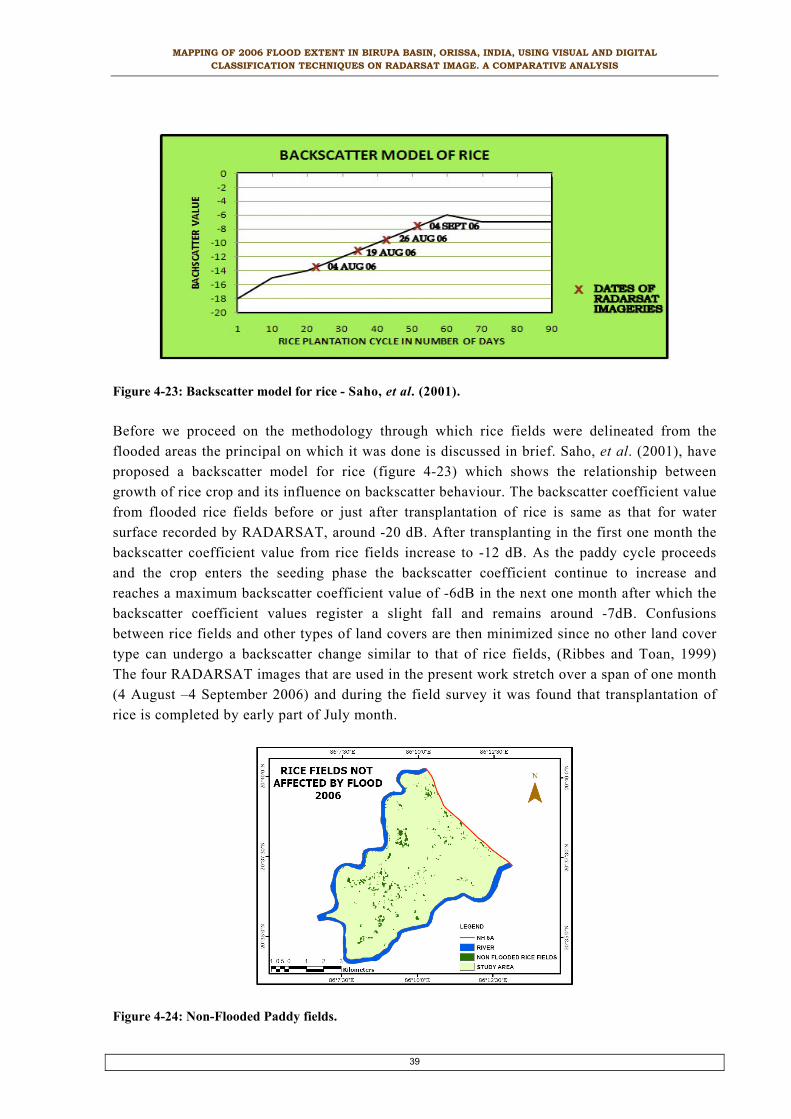
MAPPING OF 2006 FLOOD EXTENT IN BIRUPA BASIN, ORISSA, INDIA, USING VISUAL AND DIGITAL CLASSIFICATION TECHNIQUES ON RADARSAT IMAGE. A COMPARATIVE ANALYSIS
39
Figure 4-23: Backscatter model for rice - Saho, et al. (2001). Before we proceed on the methodology through which rice fields were delineated from the flooded areas the principal on which it was done is discussed in brief. Saho, et al. (2001), have proposed a backscatter model for rice (figure 4-23) which shows the relationship between growth of rice crop and its influence on backscatter behaviour. The backscatter coefficient value from flooded rice fields before or just after transplantation of rice is same as that for water surface recorded by RADARSAT, around -20 dB. After transplanting in the first one month the backscatter coefficient value from rice fields increase to -12 dB. As the paddy cycle proceeds and the crop enters the seeding phase the backscatter coefficient continue to increase and reaches a maximum backscatter coefficient value of -6dB in the next one month after which the backscatter coefficient values register a slight fall and remains around -7dB. Confusions between rice fields and other types of land covers are then minimized since no other land cover type can undergo a backscatter change similar to that of rice fields, (Ribbes and Toan, 1999) The four RADARSAT images that are used in the present work stretch over a span of one month (4 August –4 September 2006) and during the field survey it was found that transplantation of rice is completed by early part of July month.
Figure 4-24: Non-Flooded Paddy fields.

MAPPING OF 2006 FLOOD EXTENT IN BIRUPA BASIN, ORISSA, INDIA, USING VISUAL AND DIGITAL CLASSIFICATION TECHNIQUES ON RADARSAT IMAGE. A COMPARATIVE ANALYSIS
40
Thus the paddy crop within the study area starts around 10 July and culminates around 10 October which implies that the first date of RADARSAT image (4 August 2006) corresponds with around 20th days of paddy crop when the backscatter coefficient from the crop is around -13db and -14dB and the last image (4 September 2006) corresponds with 50th day of paddy cycle when the backscatter coefficient values is around -7dB and -8dB. Based on the model provided by Saho, et al., (2001), non flooded rice fields were identified as those areas that had backscatter coefficient value around -13db and -14dB on 4 August 2006 image and around -7dB and -8dB backscatter coefficient value on 4 September 2006 using model maker in ERDAS imagine 9.1 software. The total area of non-flooded paddy fields was calculated as 1.92 km2 .

MAPPING OF 2006 FLOOD EXTENT IN BIRUPA BASIN, ORISSA, INDIA, USING VISUAL AND DIGITAL CLASSIFICATION TECHNIQUES ON RADARSAT IMAGE. A COMPARATIVE ANALYSIS
41
5. Accuracy Assessment, Validation and Analysis
The flood inundated area extracted from different image processing techniques as expected was not exactly the same. Although most flooded areas were common, there were certain areas of differences in flood maps generated for image of the same date but by different technique. The difference in flooded areas was identified by comparing the maps generated by different techniques and such areas needed to be verified. To verify such areas, information was collected from the field based on which, accuracy of different techniques was assessed and is discussed in first part of the chapter. Once a technique was found to be accurate for the area, the question that follows was, whether the technique would be suitable for delineation of flood extent in other areas as well and that required some kind of validation. Validation of results of 2006 imageries was done by RADARSAT SAR image of the same area but of a different date (24 July 2008). After accuracy assessment and validation, some of the results pertaining to difference in flood maps generated for maps of same date but by different technique needed to be analysed spatially so that an assessment of strength and limitations of different techniques in different aspects of the study area could be carried out.
5.1. Accuracy Assessment
Previous work in the area have been compared the results of digital technique with that of visual interpretation assuming that the visual interpretation was accurate (Sanyal, and Lu, 2003). In the present work, accuracy of visual interpretation as well as other digital techniques was made on basis of information collected from the field. As part of pre-field work, flood inundation maps were generated using different techniques for 4 September 2006 image (image almost corresponding with maximum extent of flood in 2006). On the flood maps generated for 4 September 2006, maps of road and canal network of the area prepared using Google image (Quick bird image of 14 May 2004) were overlaid so that fixed points for which information regarding whether they were flooded or non-flooded, when flood extent was at its maximum in 2006 could be collected. Road junctions and intersection of road and canal network were selected as ground truth points so that they can be visited during the field survey and information regarding whether that location was flooded or non-flooded in 2006 could be collected. Once information regarding status of the locations in terms of 2006 flood was recorded from the field, the same point on the map is given an attribute, flooded or non-flooded depending upon its status. In all 80 such points were selected based on the flood map of 4 September 2006. The details pertaining to ground truth points in terms of their location and their status (flooded and non-flooded) during 2006 and 2008 flood event is given in appendix 1.

MAPPING OF 2006 FLOOD EXTENT IN BIRUPA BASIN, ORISSA, INDIA, USING VISUAL AND DIGITAL CLASSIFICATION TECHNIQUES ON RADARSAT IMAGE. A COMPARATIVE ANALYSIS
42
Figure 5-1: Location of Ground Observation Points, Category – A The 80 points selected comprised of six categories, each representing a different aspect of study area. Category ‘A’ included 40 points (50%) comprising of ground truth locations that were close to the land water boundary as observed on 4 September 2006 flood extent map. Category ‘B’ 8 points (10%) and ‘C’ 8 points (10%) represented areas that were sure to be flooded and areas sure to be non-flooded, so that accuracy of classification by different techniques could be assessed. The remaining 24 points (30%) were equally divided into ‘D’,’E’ and ‘F’ categories representing rice fields, land and water patches and settlements respectively. The above mentioned points along with road and canal network superimposed on flooded area of 4 September 2006 image is shown in figures 5.1 (Category-A) and figure 5.2

MAPPING OF 2006 FLOOD EXTENT IN BIRUPA BASIN, ORISSA, INDIA, USING VISUAL AND DIGITAL CLASSIFICATION TECHNIQUES ON RADARSAT IMAGE. A COMPARATIVE ANALYSIS
43
Figure 5-2: Location of Ground Observation Points, Category – B, C, D, E and F. (Categories B, C, D, E and F). During the field survey all 80 points marked on the map were visited and their status in terms of being flooded and non-flooded during the 2006 flood was inquired from the local people and recorded. On basis of information collected from field, all observation points were assigned either flooded or non-flooded status on the reference map. Subsequently accuracy of different techniques was assessed by superimposing the status of observation points on the flood maps generated by different techniques from 4 September 2006 image. Counting the number of points that were classified correctly in different categories by different techniques (table 5-1) gives the status of different techniques in terms of their strength and limitations in handling different aspects of the study area.

MAPPING OF 2006 FLOOD EXTENT IN BIRUPA BASIN, ORISSA, INDIA, USING VISUAL AND DIGITAL CLASSIFICATION TECHNIQUES ON RADARSAT IMAGE. A COMPARATIVE ANALYSIS
44
Table 5-1: Results of Accuracy Assessment
CATEGORY OF OBSERVATION POINTS A B C D E F TOTAL
NUMBER OF OBSERVATION POINTS 40 8 8 8 8 8 80
VISUAL
NO. OF CORRECT POINTS 38 8 8 4 4 8 70
% OF CORRECT POINT 95% 100% 100% 50% 50% 100% 87.5%
THRESHOLD
NO. OF CORRECT POINTS 34 8 8 5 6 8 67
% OF CORRECT POINT 85% 100% 100% 62.5% 75% 100% 83.7%
RULE BASED
NO. OF CORRECT POINTS 33 8 8 5 7 7 68
% OF CORRECT POINT 82.5% 100% 100% 62.5% 87.5% 87.5% 85%
NEURAL NETWORK
NO. OF CORRECT POINTS 32 8 8 4 5 7 64
% OF CORRECT POINT 80% 100% 100% 50% 62.5% 87.5% 80%
A- Land and Water boundary; B- Areas sure to be Flooded; C- Areas sure to be Non-Flooded; D- Irrigated Paddy fields; E- land and water patches; F- Settlements.
5.1.1. Accuracy Assessment of Visual Interpretation
In all, 70 observation points were correctly classified by visual interpretation for 4 September 2006 image giving an overall accuracy of 87.5% (table 5-1). In terms of points along the boundary of land and water (Category -A), 38 out of 40 points were correctly classified giving a high accuracy of 95%. In terms of points where it was sure to be flooded (Category-B) and where it was sure to be non-flooded (Category-C) visual interpretation gave 100% correct result. Results of visual interpretation were bad in terms of delineating rice fields (Category- D) as half of the points were classified as flooded although the paddy fields were non-flooded. Similar problem was faced in visually interpreting small patches of land and water (Category- E) as 50% of the points in this category were also misclassified. Settlements (Category-F) in the area were classified as non flooded areas with 100% results. Although our main focus was delineation of flooded areas (50% points were taken along land-water boundary), small samples of observation points were taken from other categories to ensure that the process employed was correct and also to make an insight into the strength of particular technique when encountered with different and complex situations. Thus it can be concluded that visual interpretation is

MAPPING OF 2006 FLOOD EXTENT IN BIRUPA BASIN, ORISSA, INDIA, USING VISUAL AND DIGITAL CLASSIFICATION TECHNIQUES ON RADARSAT IMAGE. A COMPARATIVE ANALYSIS
45
appropriate in delineating land and water features but the method is not very reliable in handling complex situations offered by irrigated rice fields and small patches of land and water.
5.1.2. Accuracy Assessment of Threshold Technique
Results of threshold technique for 4 September 2006 image when compared with the ground observation points show that 67 out of 80 points were classified correctly giving an overall accuracy of 83.7% (table 5-1). In terms of boundary between land and water (Category-A), 34 points were correctly classified giving an accuracy of 85%. In terms of points where it was sure to be flooded (Category-B) and where it was sure to be non-flooded (Category-C) threshold technique like the visual interpretation gives a 100% correct result. Results of threshold technique are comparatively better than the results of visual interpretation in terms of delineating non-flooded paddy fields (62.5%) on account of a comparatively high backscatter value of rice which was around 50 day in it’s crop cycle (figure 4-23) on 4 September 2006. Still there was an error of 37.5% as a high backscatter value from rice gets mixed with low backscatter value that is characteristic of the underlying water.
Figure 5-3: Orchard close to area of drainage
congestion
Figure 5-4: Gentle slope of the land identified only
by stagnant water Land and water patches were delineated with an accuracy of 75%. Field observation shows that small clumps of tall grasses (figure 4-10) in between the flooded patches tend to introduce some error while classifying the patches of land and water. Settlements (Category F) in the area were classified as non-flooded with an accuracy of 100%. Threshold method was found suitable for delineating land and water features and gave better result for delineating non-flooded rice fields and small patches of land and water. Before we conclude on accuracy of threshold method an important point that needs mention is that once information from field was gathered, threshold method was experimented with different backscatter values to improve its results. Despite working with different values and with results in hand, accuracy of threshold could not be achieved beyond 85% as the presence of orchards (figure 5-3) with their large canopy in between the flooded areas could not be properly classified.

MAPPING OF 2006 FLOOD EXTENT IN BIRUPA BASIN, ORISSA, INDIA, USING VISUAL AND DIGITAL CLASSIFICATION TECHNIQUES ON RADARSAT IMAGE. A COMPARATIVE ANALYSIS
46
5.1.3. Accuracy Assessment of Rule Based Expert Classification
Based on the comparison of field data and flood extent map generated by rule based expert classification, 68 out of 80 observation points were classified correctly giving an accuracy of 85% (table 5-1) for the 4 September 2006 image. In terms of points along the boundary of land and water (Category A), 33 out of 40 points were correctly classified giving an accuracy of 82.5% which is slightly lower than what was achieved by threshold method. In terms of locations where it was sure to be flooded (Category B) and where it was sure to be non-flooded (Category C) rule based expert classification also achieves a 100% result. In terms of delineating non-flooded rice fields (Category D) the results of rule based expert classification are similar to that of threshold method (62.5%) which implies that adding information of height to the backscatter coefficient value does not makes much of difference as rice fields in the area are almost flat with very gentle slope observable due to stagnating water (figure 5-4). The addition of height information makes a significant improvement in classification of land and water patches by achieving an accuracy of 87.5%. It should be noted that this accuracy was achieved by use of appropriate threshold value and information relating to height collected from four different villages (process explained in 4.3.3) and the information of guage data on Ganguty river (figure 4-2). Thus by addition of height information, although there is a marginal increase in the overall accuracy as compared to threshold method, the accuracy regarding classification of land and water patches has increased substantially. Unlike other techniques 7 observation points for settlements (Category F) were classified as non-flooded but point adjoining Sipura village (figure 2-3) along Birupa river was misclassified as flooded probably due to its low elevation and also as the part of Sipura was devoid of the dense canopy that is characteristic of other settlements in the area. Due to lack of canopy cover, low density of houses and presence of numerous tanks within the village, it was misclassified as flooded.
5.1.4. Accuracy Assessment of Neural Network Classification
Results of neural network for 4 September 2006 image show that 64 out of 80 points were classified correctly giving an overall accuracy of 80% (table 5.1). In terms of boundary between land and water (Category A), 32 points were correctly classified giving an accuracy of 80%. In terms of points where it was sure to be flooded (Category B) and where it was sure to be non-flooded (Category C) neural network method like the other classification techniques gives a 100% result. Results of neural network are similar to visual interpretation (50%) in terms of delineating non-flooded rice fields (Category D). Neural network gives a comparatively low accuracy in terms of category ‘E’ as land and water patches were delineated with an accuracy of only 62.5%. Accuracy for category ‘E’ was probably due to the ROI being taken from multiple locations giving the ROI a heterogeneous character. It was due to the absence of homogeneous stretch of clear and deep water, the ROI for water was a mixture of sediment laden water with protruding vegetation and on account of such ROI rice fields and land and water patches were misclassified. Similar to the result of rule based expert classification Sipura village along Birupa river was misclassified as flooded area which may have been due to absence of canopy that had exposed the numerous tanks within the village. Thus it can be concluded that when working with neural network the ROI should be prepared keeping only one specific surface

MAPPING OF 2006 FLOOD EXTENT IN BIRUPA BASIN, ORISSA, INDIA, USING VISUAL AND DIGITAL CLASSIFICATION TECHNIQUES ON RADARSAT IMAGE. A COMPARATIVE ANALYSIS
47
feature into consideration and a small homogeneous patch of that surface should be selected as input for ROI.
5.1.5. Overall Conclusion of Accuracy Assessment
Visual interpretation is one of the most reliable techniques in terms of accurate delineation of flooded area but has the limitation in handling complex surface features like rice fields when working with SAR images. Thresholding can be a reliable method for fast and accurate generation of flood extent maps but good knowledge of the study area is essential while deciding the threshold values of backscatter coefficient. Threshold technique was not good enough to classify land and water patches. The use of high resolution DEM along with the threshold values should be used to improve the accuracy of results but information regarding other factors influencing the spread of flood also needs to be understood. When working with neural networks, keeping more than one target into consideration leads to a generalised approach of classification where classes with slightest of ambiguity have chances of being misclassified and thus ROI should be focused on only one specific aspect.
5.2. Validation of results
After the accuracy of different techniques has been worked out, the next stage that follows is whether the methodology developed and parameters used in different techniques for this particular study can be applied in different area under same conditions or in same area under different conditions. Thus the significance of accuracy figures should be viewed along with validity of the results. Vrieling, (2006) has demonstrated that satellite image of same area but of different date can be used for validation. In the present work validation has been made on the basis of RADARSAT image of 24 July 2008 for the same area. As the field work for the study was carried out from 16 July 2008 to 30 July 2008 the image of 24 July 2008 becomes very important for validation of results. All four techniques were applied for 24 July 2008 image and information regarding areas of drainage congestion and patches of land and water within the study area was collected from the field to be compared with maps generated for 24 July 2008 image. Comparison of accuracy figures for visual interpretation show that the results of 2008 are slightly better as compared to the 2006 results. Paddy fields were the major area where visual interpretation of 4 September 2006 image was inaccurate (paddy crop was in mature stage) but in 24 July 2008 image paddy fields were in the initial stages of transplantation with paddy plant in itself playing a minor role .The other area where visual interpretation of 4 September 2006 image was inaccurate was in proper classification of water patches. It should be noted that 4 September 2006 image corresponded with peak flood when the complexity in terms of flooded patches and moisture in non-flooded areas was high and 24 July 2008 is a pre-flood image when such complexities were comparatively low. There is similar improvement in results of threshold techniques due to same reason that the area on 24 July 2008 was less complex in terms of non-flooded patches as compared to 4 September 2006. The appropriate threshold value for 4 September 2006 images was -12.5dB but in case of 2008 image, best results were achieved using threshold value of -13dB. Thus slight adjustments in the threshold values should be made if required as conditions in different years and different time of the year within the same area

MAPPING OF 2006 FLOOD EXTENT IN BIRUPA BASIN, ORISSA, INDIA, USING VISUAL AND DIGITAL CLASSIFICATION TECHNIQUES ON RADARSAT IMAGE. A COMPARATIVE ANALYSIS
48
may differ. Results of rule based expert classification were affected by the influence of road and canal network in spread of water in 2006 images.
Figure 5-5: Flooded Area 24 July 2008 and Comparison of Accuracy between 2006 and 2008 The results of rule based expert classification have slightly deteriorated for 24 July 2008 as in pre-flood conditions the influence of road and canal network is comparatively high as the water level in the fields is below the road and canal embankments. In the peak flood scenario (4 September 2006) the influence of road and canal decreases as once water height is above the road embankment, the presence or absence of such obstruction becomes immaterial. However influence of road and canal embankments will once again become prominent as the flood water begins to retreat. Results of neural network show marked improvements as ROI that was prepared keeping only one objective (identification of water patches) for 24 July 2008 image and a better ROI were prepared as it was based on direct field observation. Thus the methods applied for 2006 images could be used at another time period but slight adjustment in threshold values and parameters should be made if required.
5.3. Analysis
The areal extent of flooded area on different dates with different techniques has been described in 4.3 along with the explanations that were based on observation made during the field study. It needs to be mentioned that in accuracy assessment, accuracy of different techniques were compared on basis of 80 observation points from the area (figure 5.1 and 5.2) and explanations have been made regarding factors that have contributed for error or have

MAPPING OF 2006 FLOOD EXTENT IN BIRUPA BASIN, ORISSA, INDIA, USING VISUAL AND DIGITAL CLASSIFICATION TECHNIQUES ON RADARSAT IMAGE. A COMPARATIVE ANALYSIS
49
posed limitations for the techniques. As visual interpretation was found to be most accurate in terms of delineation of land water boundary (accuracy 95%), maps generated by other techniques need to be compared with visual interpretation map. The rule image for water generated by neural network gives the probability of occurrence of water in each pixel. The flood inundated areas are compared with the rule image for water to analyse what was the spatial variation of probability of occurrence of water within the flooded area. Flood maps generated by visual interpretation were compared with those generated by other techniques to identify flooded areas that were common in both maps. Further areas that were shown flooded only on map generated from visual interpretation and those that were flooded only on map generated by other technique were also identified.
Figure 5-6: Comparison of results of visual interpretation and other techniques
5.3.1. Comparison of flooded area by Visual and Threshold Technique
Comparison of the flood maps from visual interpretation and threshold technique show that the flooded patches along the NH 5A in the eastern part of the study area were extracted as flooded area by both techniques (figure 5-7). Areas extracted as flooded only by visual interpretation are concentrated in the western part of the area and are in between or around the areas that were common in both techniques. The areas shown flooded only by threshold technique are found along Ganguty river in north and as scattered patches around the boundary of areas that were common in both techniques.

MAPPING OF 2006 FLOOD EXTENT IN BIRUPA BASIN, ORISSA, INDIA, USING VISUAL AND DIGITAL CLASSIFICATION TECHNIQUES ON RADARSAT IMAGE. A COMPARATIVE ANALYSIS
50
Figure 5-7: Flooded area by Visual Interpretation and Threshold Technique
5.3.2. Comparison of Flooded area by Visual and Rule Based Classification
Figure 5-8: Flooded area by Visual Interpretation and Rule Based Expert Classification Comparison of the flood maps from visual interpretation and rule based expert classification show that the Areas that were common on both techniques are concentrated in the central and eastern part with flooded patches in the northern part that were common in visual interpretation and threshold technique (figure 5-8), have patches of areas that were shown as flooded only in visual technique. Thus the areas that were shown flooded only by visual

MAPPING OF 2006 FLOOD EXTENT IN BIRUPA BASIN, ORISSA, INDIA, USING VISUAL AND DIGITAL CLASSIFICATION TECHNIQUES ON RADARSAT IMAGE. A COMPARATIVE ANALYSIS
51
technique have extended from western part (comparison of the flood maps from visual interpretation and threshold technique) to northern part as well. Areas shown flooded only by rule based expert classification are concentrated along the river boundary.
5.3.3. Comparison of flooded area by Visual Interpretation and Neural Network
Figure 5-9: Flooded area by Visual Interpretation and Neural Network Technique Comparison of the flood maps from visual interpretation and neural network technique reveal that the flood patches in the eastern corner of the of the study area along NH 5A has major areas shown flooded by both techniques. The other area common to both techniques is concentrated in the central part of study area (figure 5-9). Area shown flooded only by visual interpretation is has spread to almost all parts of the study area while areas shown flooded only by neural network technique are scattered around the edges of flooded areas in eastern and central part of the study area.
5.4. Comparison of flooded area with the Rule Image for Water.
Backscatter coefficient values on RADARSAT image for 4 September 2006 varies between -29 dB to 0.5 dB. As mentioned earlier water was identified with backscatter coefficient values less than -12.5dB. Thus once the image was classified as flooded and non flooded areas, all areas that had backscatter coefficient values less than -12.5 dB were classified as flooded. Although represented as one class, flooded patches have backscatter coefficient values between -12.5 dB and -29 dB. To further make use of the backscatter coefficient values, rule image is generated in ENVI 4.3 software using the parameters that were used for delineation of flooded area in neural network technique. The rule image gives the probability of occurrence of water within each pixel. The value of pixels on the rule image varies between ‘0’ (probability 0%) and ‘1’ (probability 100%).

MAPPING OF 2006 FLOOD EXTENT IN BIRUPA BASIN, ORISSA, INDIA, USING VISUAL AND DIGITAL CLASSIFICATION TECHNIQUES ON RADARSAT IMAGE. A COMPARATIVE ANALYSIS
52
Rule image for water was classified into two broad classes with rule value 0.5 as the threshold between land and water as pixels with less than 0.5 rule values have more probability of having land as compared to water and similarly pixels with rule value more than 0.5 have more probability for water than for land. For further analysis within the water class, two sub-divisions were made using rule value 0.75 as threshold to divide areas with high probability, rule value more than 0.75 (75% and above) and areas with moderate probability rule value in between 0.5 and 0.75 (50% to 75%).
Figure 5-10: Probability for occurrence of Water (Rule Image) Once the classified rule map was prepared (figure 5-10), land water boundary derived from the flood map prepared by visual interpretation was overlaid to compare the probability of occurrence of water within the flooded area. It was observed that besides a few small scattered patches, almost all areas that had probability more than 50% was classified as flooded. Two patches of flooded areas in the western part and one small patch in the central part (marked as X in figure 5-10) comprised of areas that had probability less than 50% but were misclassified as flooded area. However even in these erroneous flooded patches visual interpretation could delineate the boundary of flooded and non-flooded areas with high accuracy. As the rule image was generated by neural network and the compared flooded was delineated by visual method, it not only makes a comparison between the two techniques but also is in conformity with the accuracy assessment that showed strength of visual interpretation in delineating flood boundaries and also its limitation in delineating irrigated paddy fields from flooded areas.

MAPPING OF 2006 FLOOD EXTENT IN BIRUPA BASIN, ORISSA, INDIA, USING VISUAL AND DIGITAL CLASSIFICATION TECHNIQUES ON RADARSAT IMAGE. A COMPARATIVE ANALYSIS
53
6. Conclusion and Recommendations
Any effort relating to planning and management for prevention from floods is based on accurate information regarding flood extent in terms of time and space. The present study was carried out with basic objective as to how accurately and efficiently flood extent mapping can be done using different techniques on RADARSAT images, the findings of which are mentioned in the first part of this chapter. Based on the results and findings from different techniques, recommendations are made for future studies some of which can build further on the present work while others can address to different aspect of study area that were found interesting during the course of present study. Finally a few suggestions are made for government officials, planners and surveyors working in the area that can be used to minimise the adverse effect of floods.
6.1. Conclusions
• Mapping of flood extent from RADARSAT images was carried out using visual
interpretation, threshold technique, rule based expert classification and neural network. Results show that visual interpretation was the most appropriate technique in delineating land and water boundary but the technique was not appropriate in handling water patches that were in close proximity with paddy fields. Thresholding technique should be applied if flood extent maps needed for relief and rescue operations while for damage assessment and mitigation purposes additional ancillary information like elevation, geomorphology etc should be used in combination with spectral information in rule based expert classification. Neural network also attained substantially high accuracy but for preparing region of interest (ROI), a good knowledge and understanding of the area is required in terms of heterogeneity of the surface, which at times may not be available for the area.
• Information from the field was collected for accuracy assessment of different techniques
in terms of different aspects of the study area. Field information was also used for explaining areas relating to errors in extraction of flooded area by different techniques so that the strength and limitations of different techniques could be identified. The threshold values, internal parameter and ancillary information used in different techniques for 2006 images was applied for RADARSAT image of 2008 for the same area and it was found that parameters used can be applied to other area with slight modifications. The internal parameters of neural network were same as used for 2006 image but a new ROI was prepared for 2008 image. Maps generated by visual interpretation was compared with maps generated by other techniques for image same date and areas of difference from maps generated by other techniques were identified

MAPPING OF 2006 FLOOD EXTENT IN BIRUPA BASIN, ORISSA, INDIA, USING VISUAL AND DIGITAL CLASSIFICATION TECHNIQUES ON RADARSAT IMAGE. A COMPARATIVE ANALYSIS
54
spatially and compared statistically. Thus accuracy assessment and validation was made on the basis of field observation and RADARSAT image of the same area but of different year (2008) and it was found that methodology and parameters used for 2006 images can be used for other areas of similar setting as well.
• One of the areas that have contributed to errors in flood extent maps by different
techniques is paddy fields. Off the four techniques used in the present study, none was found suitable enough in delineating irrigated paddy fields from flooded areas. Flooded areas were characterised by a consistently low backscatter values but areas of paddy cultivation in the initial image had a low backscatter value but showed constant increase in backscatter values in subsequent images. This particular behaviour of backscatter during the cropping cycle of paddy was used to delineate paddy from flooded areas. Working with techniques of flood extraction, presence of paddy was viewed as a factor having a negative impact on the classification results but once the backscatter behaviour of paddy was understood, it offered a unique opportunity to use RADARSAT images to extract flooded areas as well as monitor paddy fields from same image.
• Ancillary data regarding the field was collected from different government departments
and other primary and secondary sources. Ancillary data related to elevation information from Cartosat DEM that was used in rule based expert classification. Geomorphology map of the area was used for understanding the spread of flood. Toposheet of the area was used as reference in conducting field survey and high resolution Google image of study area was used in understanding the road and canal network within the area. Information regarding role of canals was acquired from the government offices. Presence of orchards and large clumps of trees was carefully recorded in field book especially if they were large in size and also if they happened to be located in area prone to flooding.
6.2. Recommendations
Subpixel mapping is recognised as a promising technique for increasing the spatial resolution of the classification results derived from satellite imagery. In water line mapping problems it should be kept into consideration that water flow is controlled by the topography. The study recommends use of high resolution digital elevation model (DEM) to address the subpixel waterline mapping problem. Fine spatial resolution DEM can be used as feasible supplementary data along with coarse resolution RADARSAT images to increase the accuracy of delineated land water edge. Rule images for water generated through neural network were used to assess the accuracy and validate the results of other techniques but during the course of present study it was found that rule images generated for water have immense potential in terms of their correlation with backscatter values. Rule image for water show probability of occurrence of water within individual pixel. It needs to be investigated whether rule images can be used to delineate flood boundary and also what more information can be extracted by values generated by rule image in terms of depth, proportion of vegetation, sediment load etc within the pixel.

MAPPING OF 2006 FLOOD EXTENT IN BIRUPA BASIN, ORISSA, INDIA, USING VISUAL AND DIGITAL CLASSIFICATION TECHNIQUES ON RADARSAT IMAGE. A COMPARATIVE ANALYSIS
55
6.3. Suggestions
Water has played a major role in providing possibilities and putting limitations on human endeavour in Birupa basin. Role of road and canal system was observed during the course of filed study and on basis of that it is suggested that the canal network within the area which is damaged and is not continuous in the central part of the study area should be repaired at the earliest. Once canal system is repaired and upgraded, the areas of natural depression and drainage congestion can be converted to permanent water bodies that will have immense potential of fisheries in the area. Thus the adverse effects of excess water brought to the area from Birupa barrage through Pattamundai canal system can be converted to a factor that can contribute to development of the region. Besides its economic prospects, well defined water bodies connected through an efficient canal system will help in reducing the adverse impacts of floods as well. Separate study should be carried out to explore more such possibilities in the region. India has the second largest population in the world and with increasing population and consequently the increasing pressure on the land food supply for over a billion people is a serious concern facing India. Crop production information becomes very important for authorities to manage and distribute grains throughout the country and throughout the year. The process of planning and distribution is hampered with fall in crop yields due to flooding which is common in areas of rice cultivation. Flood extent, duration and depth maps can be prepared using satellite remote sensing data for an estimation of degree of loss of crop. Damage to rice can have far reaching socio economic consequences and if prior estimation of loss is made through SAR monitoring, the government can make adequate arrangements in handling of buffer stocks. In areas of appreciable damage, compensation that is to be made to the farmers can also be decided as who should be given what on basis of information pertaining to degree of loss. In India these practices are carried out by ground survey which has its own limitations. It is difficult to verify these reported figures and it is at this stage SAR data emerges as a potential tool. Thus crop damage estimation which is done manually by ground survey should be carried out through remote sensing as well.

MAPPING OF 2006 FLOOD EXTENT IN BIRUPA BASIN, ORISSA, INDIA, USING VISUAL AND DIGITAL CLASSIFICATION TECHNIQUES ON RADARSAT IMAGE. A COMPARATIVE ANALYSIS
56
Reference
Ali, M.A.S., 2007. September 2004 Flood Event in South western Bangladesh: A Study of its Nature, Causes and Human Perception and Adjustments to a New Hazard. Natural Hazards, 40: 89–111.
Argialas, D. and Harlow, C., 1990. Computational Image Interpretation Models: An overview.
Photogrammetric engineering and RS, 56(6): 871-886. Augusteijn, M.F. and Warrender, C.E., 1998. Wetland classification using optical and radar data
and neural network classification. International Journal of Remote Sensing, 19: 1545–1560.
Benz, U.C., Hofmann, P., Willhauck, G., Lingenfelder, I. and Heynen, M., 2004. Multi-
resolution, object-oriented fuzzy analysis of remote sensing data for GIS-ready information. ISPRS Journal of Photogrammetry & Remote Sensing, 58: 239-258.
Brisco, B. 2008. Water resource applications with RADARSAT-2 a preview. International
Journal of Digital Earth, 1(1): 130 -147. Brivio, P.A., Colombo, R., Maggi, M. and Tomasoni, R., 2002. Integration of Remote Sensing
data and GIS for accurate mapping of flooded areas. International Journal of Remote Sensing, 23(3): 429-441.
Chittibabu, P., 2004. Mitigation of Flooding and Cyclone Hazard in Orissa, India. Natural
Hazards, 31: 455–485. Costa, M.P.F., Niemann, O., Novo, E. and Ahern, F., 2002. Biophysical properties and mapping
of aquatic vegetation during the hydrological cycle of the Amazon floodplain using JERS-1 and RADARSAT. International Journal of Remote Sensing, 23: 1401–1426.
Ermolievaa, T.Y. and Sergienko, V.I., 2008. Catastrophe risk management for sustainable
development of regions under risks of natural disasters. Cybernetics and Systems Analysis, 44(3): 405-417.
Foody, G.M., 2002. The role of soft classification techniques in the refinement of estimates of
ground control point location. Photogrammetric Engineering and Remote Sensing, 68: 897–903.
Foody, G.M., Muslim, A.M. and Atkinson, P.M., 2005. Super-resolution mapping of the
waterline from remotely sensed data. International Journal of Remote Sensing, 26: 5381–5392.
Gonzalez, R.C., Woods, R.E. and Eddins, S.L., 2004. Digital Image Processing using Matlab.
Prentice Hall, New Jersey.

MAPPING OF 2006 FLOOD EXTENT IN BIRUPA BASIN, ORISSA, INDIA, USING VISUAL AND DIGITAL CLASSIFICATION TECHNIQUES ON RADARSAT IMAGE. A COMPARATIVE ANALYSIS
57
Henderson, F.M., 1995. Environmental factors and the detection of open surface water using x-
band radar imagery. International Journal of Remote Sensing, 16: 2423–2437. Hiroya, Y. 2006. Evaluation of various satellite sensors for waterline extraction in a coral reef
environment: Majuro Atoll, Marshall Islands. Geomorphology, 82(3-4): 398-411. Horritt, M.S., Mason, D.C., Cobby, D.M., Davenport, I.J. and Bates, P.D., 2003. Waterline
mapping in flooded vegetation from airborne SAR imagery. Remote Sensing of Environment, 85: 271–281.
Huang, X. et al., 2008. Flood hazard in Hunan province of China: an economic loss analysis.
Natural Hazards, 47: 65–73. Imhoff, M.L. and Gesch, 1990. The derivation of sub-canopy digital terrain model of a flooded
forest using Synthetic Aperture Radar. Photogrammetric Engineering and Remote Sensing, 56: 1155–1162.
Imhoff, M.L. et al., 1987. Monsoon flood boundary delineation and damage assessment using
space borne imaging radar and Landsat data. Photogrammetric Engineering and Remote Sensing, 53: 405–413.
Islam, M.M. and Sado, K., 2000. Flood hazard assessment in Bangladesh using NOAA AVHRR
data with geographical information system. Hydrological Processes, 14: 605-620. Jain, S.K., Saraf, A.K., Goswami, A. and Ahmad, T., 2006. Flood inundation mapping using
NOAA AVHRR data. Water Resource Management, 20: 949–959. Jin, Y.Q., 1999. A flooding index and its regional threshold values for monitoring in china from
SSM data. International Journal of Remote Sensing, 20(5): 1025–1030. Junhua, L. and Wenjun, C., 2005. A rule-based method for mapping Canada’s wetlands using
optical, radar and DEM data. International Journal of Remote Sensing, 26(22): 5051–5069.
Khan, M.R. and Rahman, M.A., 2007. Partnership approach to disaster management in
Bangladesh: a critical policy assessment. Natural Hazards, 41: 359–378. Kundus, P., Karszenbaum, H., Pultz, T., Paramuchi, G. and Bava, J., 2001. Influence of flood
conditions and vegetation status on the radar back scatter of wetland ecosystem. Canadian Journal of Remote Sensing, 27(6): 651–662.
Kushwaha, S.P.S., Dwivedi, R.S. and Rao, B.R.M., 2000. Evaluation of various digital image
processing techniques for detection of coastal wetlands using ERS-1 SAR data. International Journal of Remote Sensing, 21: 565–579.
Ling, F., Xiao, F., Du, Y., Xue, H. and Ren, X., 2008. Waterline mapping at the subpixel scale
from remote sensing imagery with high resolution digital elevation models. International Journal of Remote Sensing, 29(6): 1809- 1815.
Lippmann, R.P., 1987. An Introduction to Computing With Neural Nets. IEEE ASSP Magazine,
4(2): 58-75.

MAPPING OF 2006 FLOOD EXTENT IN BIRUPA BASIN, ORISSA, INDIA, USING VISUAL AND DIGITAL CLASSIFICATION TECHNIQUES ON RADARSAT IMAGE. A COMPARATIVE ANALYSIS
58
Matgen, J.B. et al., 2004. Uncertainty in calibrating flood propagation models with flood
boundaries observed from synthetic aperture radar imagery, 20th Congress of the International Society of Photogrammetry and Remote Sensing, Istanbul, pp. 352–358.
Matgen, P., Schumann, G., Henry, J.B., Hoffmann, L. and Pfister, L., 2007. Integration of SAR-
derived river inundation areas, high-precision topographic data and a river flow model toward near real-time flood management. International Journal of Applied Earth Observation and Geoinformation, 9(3): 247-263.
Melack, J.M., Hess, L.L. and Sippel, S., 1994. Remote sensing of lakes and floodplains in the
Amazon Basin. Remote Sensing Review, 10: 127–142. Mohapatra, M. and Mohanty, U.C., 2005. Some characteristics of heavy rainfall over Orissa
during summer monsoon season. Journal of Earth System Sciences, 114(1): 17- 36. Nguyen, M.Q., Atkinson, P.M. and Lewis, H.G., 2006. Super-resolution mapping using a
Hopfield neural network with fused images. IEEE Transactions on Geo-science and Remote Sensing, 44: 736–749.
Nico, G., Pappalepore, M., Pasquariello, G., Refice, A. and Samarelli, S., 2000. Comparison of
SAR amplitude vs. coherence flood detection methods- A GIS application. International Journal of Remote Sensing, 21(8): 1619–1631.
Noy, I., 2008. The macroeconomic consequences of disasters. Journal of Development
Economics, 88: 221–231. Oberstlader, R., Honsch, H. and Huth, D., 1997. Assessment of the mapping capabilities of
ERS-1 SAR Data for Flood mapping. A case study in Germany. Hydrological Processes, 11(1415-1425).
Ologunorisa, T.E. and Adeyemo, A., 2005. Public Perception of Flood Hazard in the Niger
Delta, Nigeria. The Environmentalist, 25: 39–45. Poole, G.C., Stanford, J.A., Frissell, C.A. and Running, S.W., 2002. Three-dimensional
mapping of geomorphic controls on floodplain hydrology and connectivity from aerial photos. Geomorphology, 48(329–347).
Pope, K.O., Rejmankova, E., Paris, J.F. and Woodrull, P., 1997. Detecting seasonal flooding
cycles in the marshes of the Yucatan Peninsula with SIR-C polarimetric radar imagery. Remote Sensing of environment, 59: 157–166.
Ramsey, E.W., 1995. Monitoring flooding in coastal wetlands by using radar imagery and
ground-based measurements. International Journal of Remote Sensing, 16: 2495–2502. Rashid, H. and Pramanik, M.A.H., 1993. Areal extent of the 1988 flood in Bangladesh: How
much did the satellite imagery show? Natural Hazards, 8: 189–200. Ribbes, F. and Toan, T.L., 1999. Rice field mapping and monitoring with RADARSAT data.
International Journal of Remote Sensing, 20(4): 745 - 765.

MAPPING OF 2006 FLOOD EXTENT IN BIRUPA BASIN, ORISSA, INDIA, USING VISUAL AND DIGITAL CLASSIFICATION TECHNIQUES ON RADARSAT IMAGE. A COMPARATIVE ANALYSIS
59
Rosenqvist, A., Forsberg, B.R., Pimentel, T., Rauste, Y.A. and Richey, J.E., 2002. The use of
space borne radar data to model inundation patterns and trace gas emissions in the central Amazon Floodplain. International Journal of Remote Sensing, 23(7): 1303-1328.
Sado, K. and Islam, M.M., 1997. Satellite remote sensing data analysis for flooded area and
weather study: Case study of Dhaka city, Bangladesh. Journal of Hydraulic Engineering, 41: 945–950.
Saho, Y. et al., 2001. Rice monitoring and production estimation using multi temopral
RADARSAT. Remote sensing of Environment, 76: 310-325. Sanyal, J. and Lu, X.X., 2003. Application of Remote Sensing in Flood Management with
special Reference to Monsoon Asia, A Review. Natural Hazards, 33: 283-301. Smith, L.C., 1997. Satellite remote sensing of river inundation area, stage, and discharge: A
review. Hydrological Processes, 11: 1427–1439. Sultana, P., Thompson, P. and Green, C., 2008. Can England Learn Lessons from Bangladesh in
Introducing Participatory Floodplain Management? Water Resource Management, 22: 357–376.
Townsend, P.A., 2002. Estimating forest structure in wetlands using multitemporal SAR.
Remote Sensing of Environment, 79: 288–304. Townsend, P.A. and Walsh, J., 1998. Modeling floodplain inundation using an integrated GIS
with radar and optical remote sensing. Geomorphology, 21: 295-312. Toyra, J. and Martz, W., 2001. Multisensor Hydrological Assessment of a Freshwater Wetland.
Remote sensing of Environment, 75: 162-173. Vrieling, A., 2006. Satellite remote sensing for water erosion assessment: A review Catena,
65(1): 2-18 Wang, Y., Colby, J.D. and Mulchay, K.A., 2002. An efficient method for mapping flood extent
in a coastal floodplain using Landsat TM and DEM data. International Journal of Remote Sensing, 23(18): 3681-3696.
Wang, Y., Hess, L.L., Filoso, S. and Melack, J.M., 1995. Understanding the radar
backscattering from flooded and non-flooded Amazonian forests: results from canopy backscatter modelling. Remote Sensing of Environment, 54: 324–332.
Wegmuller, U., Werner, C.L., Nuesch, D. and Borgeaud, M., 1995. Forest mapping using ERS
repeat-pass SAR interferometry. Earth Observation Quarterly, 49: 4–7. Zadeh, A.I. and Beer, T., 2007. Geo-risks: Interactions between Science and Society. Natural
Hazards, 42: 455–457.

MAPPING OF 2006 FLOOD EXTENT IN BIRUPA BASIN, ORISSA, INDIA, USING VISUAL AND DIGITAL CLASSIFICATION TECHNIQUES ON RADARSAT IMAGE. A COMPARATIVE ANALYSIS
60
Appendix 1: Location and status of Ground Observation Points
POINT NO.
LOCATION STATUS IN 2006
STATUS IN 2008 LONGITUDE LATITUDE
P 01 20 37 24.20 N 86 12 33.88 E NON FLOODED NON FLOODEDP 02 20 37 01.93 N 86 12 31.21 E NON FLOODED NON FLOODEDP 03 20 37 25.22 N 86 11 30.33 E FLOODED FLOODED P 04 20 37 33.43 N 86 11 12.20 E NON FLOODED NON FLOODEDP 05 20 37 51.08 N 86 11 52.46 E NON FLOODED NON FLOODEDP 06 20 38 11.98 N 86 10 07.52 E FLOODED NON FLOODEDP 07 20 38 24.59 N 86 09 55.86 E FLOODED NON FLOODEDP 08 20 38 31.62 N 86 10 06.02 E FLOODED NON FLOODEDP 09 20 38 40.07 N 86 10 37.98 E FLOODED NON FLOODEDP 10 20 38 56.78 N 86 09 32.02 E FLOODED NON FLOODEDP 11 20 38 59.97 N 86 09 59.84 E NON FLOODED NON FLOODEDP 12 20 39 31.42 N 86 10 02.91 E FLOODED NON FLOODEDP 13 20 39 33.51 N 86 09 44.35 E FLOODED NON FLOODEDP 14 20 38 43.18 N 86 09 18.64 E FLOODED NON FLOODEDP 15 20 38 31.84 N 86 09 21.49 E FLOODED NON FLOODEDP 16 20 38 00.76 N 86 09 04.04 E FLOODED NON FLOODEDP 17 20 37 46.88 N 86 09 22.67 E NON FLOODED NON FLOODEDP 18 20 37 42.11 N 86 09 30.11 E NON FLOODED NON FLOODEDP 19 20 37 43.69 N 86 08 55.78 E FLOODED NON FLOODEDP 20 20 37 14.45 N 86 08 58.26 E FLOODED NON FLOODEDP 21 20 37 15.58 N 86 08 22.54 E NON FLOODED NON FLOODEDP 22 20 36 53.09 N 86 07 36.76 E FLOODED FLOODED P 23 20 36 29.74 N 86 08 23.73 E FLOODED FLOODED P 24 20 36 02.52 N 86 07 52.81 E FLOODED NON FLOODEDP 25 20 35 16.67 N 86 07 51.68 E NON FLOODED NON FLOODEDP 26 20 35 21.15 N 86 08 13.91 E NON FLOODED NON FLOODEDP 27 20 35 02.39 N 86 08 17.26 E NON FLOODED NON FLOODEDP 28 20 34 53.64 N 86 08 13.60 E FLOODED NON FLOODEDP 29 20 34 42.75 N 86 08 17.37 E FLOODED NON FLOODEDP 30 20 34 44.25 N 86 08 55.85 E NON FLOODED NON FLOODEDP 31 20 35 06.90 N 86 08 46.45 E FLOODED NON FLOODEDP 32 20 35 09.66 N 86 09 13.79 E FLOODED NON FLOODEDP 33 20 35 32.36 N 86 09 13.67 E NON FLOODED NON FLOODEDP 34 20 35 26.90 N 86 09 57.29 E NON FLOODED NON FLOODEDP 35 20 36 11.03 N 86 10 04.93 E FLOODED FLOODED P 36 20 36 47.95 N 86 09 24.85 E NON FLOODED NON FLOODEDP 37 20 36 34.67 N 86 10 17.79 E NON FLOODED NON FLOODEDP 38 20 37 00.17 N 86 10 54.75 E NON FLOODED NON FLOODEDP 39 20 36 41.54 N 86 11 26.85 E FLOODED NON FLOODEDP 40 20 36 34.88 N 86 11 01.84 E NON FLOODED NON FLOODED

MAPPING OF 2006 FLOOD EXTENT IN BIRUPA BASIN, ORISSA, INDIA, USING VISUAL AND DIGITAL CLASSIFICATION TECHNIQUES ON RADARSAT IMAGE. A COMPARATIVE ANALYSIS
61
P 41 20 36 31.64 N 86 08 50.50 E FLOODED NON FLOODED P 42 20 36 00.48 N 86 08 50.11 E FLOODED NON FLOODED P 43 20 36 48.70 N 86 10 12.11 E FLOODED NON FLOODED P 44 20 39 05.45 N 86 09 17.65 E FLOODED NON FLOODED P 45 20 39 26.11 N 86 10 07.83 E FLOODED NON FLOODED P 46 20 37 17.10 N 86 11 49.10 E FLOODED NON FLOODED P 47 20 36 48.01 N 86 09 40.12 E FLOODED NON FLOODED P 48 20 38 25.40 N 86 10 08.73 E FLOODED FLOODED
P 49 20 38 35.42 N 86 09 29.82 E NON FLOODED NON FLOODEDP 50 20 37 14.76 N 86 09 17.12 E NON FLOODED NON FLOODEDP 51 20 36 10.08 N 86 10 26.61 E NON FLOODED NON FLOODEDP 52 20 34 29.01 N 86 08 24.91 E NON FLOODED NON FLOODEDP 53 20 36 10.82 N 86 07 28.35 E NON FLOODED NON FLOODEDP 54 20 37 05.44 N 86 12 24.01 E NON FLOODED NON FLOODEDP 55 20 36 24.99 N 86 11 51.08 E NON FLOODED NON FLOODEDP 56 20 38 56.50 N 86 09 55.42 E NON FLOODED NON FLOODED
P 57 20 38 14.98 N 86 09 24.79 E FLOODED FLOODED P 58 20 37 56.18 N 86 09 26.03 E FLOODED FLOODED P 59 20 37 30.80 N 86 09 01.60 E FLOODED FLOODED P 60 20 36 44.33 N 86 08 08.72 E FLOODED FLOODED P 61 20 36 46.35 N 86 07 41.86 E FLOODED FLOODED P 62 20 35 36.10 N 86 09 58.80 E FLOODED NON FLOODED P 63 20 35 31.98 N 86 08 45.12 E FLOODED NON FLOODED P 64 20 34 48.24 N 86 08 00.81 E NON FLOODED NON FLOODED
P 65 20 35 39.01 N 86 08 55.37 E FLOODED NON FLOODEDP 66 20 37 46.90 N 86 10 48.94 E NON FLOODED NON FLOODEDP 67 20 38 40.05 N 86 10 38.37 E NON FLOODED NON FLOODEDP 68 20 36 32.34 N 86 09 23.64 E FLOODED NON FLOODEDP 69 20 35 48.03 N 86 10 21.01 E NON FLOODED NON FLOODEDP 70 20 36 57.61 N 86 07 37.23 E FLOODED FLOODED P 71 20 35 41.17 N 86 07 09.67 E FLOODED NON FLOODEDP 72 20 36 10.49 N 86 09 59.18 E FLOODED NON FLOODED
P 73 20 39 11.92 N 86 09 22.76 E NON FLOODED NON FLOODEDP 74 20 34 46.24 N 86 08 32.24 E NON FLOODED NON FLOODEDP 75 20 35 31.66 N 86 09 30.26 E NON FLOODED NON FLOODEDP 76 20 38 26.38 N 86 09 50.44 E NON FLOODED NON FLOODEDP 77 20 37 35.72 N 86 09 18.15 E NON FLOODED NON FLOODEDP 78 20 37 30.92 N 86 11 17.02 E NON FLOODED NON FLOODEDP 79 20 36 39.78 N 86 10 57.87 E NON FLOODED NON FLOODEDP 80 20 35 49.55 N 86 08 14.18 E NON FLOODED NON FLOODED