Embed Size (px)
Citation preview

Mapping of Selected Hazards Affecting Rural Livelihoods in Zimbabwe - A District and Ward Analysis
1 | P a g e
.
Mapping of Selected Hazards Affecting Rural
Livelihoods in Zimbabwe
A District and Ward Analysis

Mapping of Selected Hazards Affecting Rural Livelihoods in Zimbabwe - A District and Ward Analysis
2 | P a g e
Mapping of Selected Hazards Affecting Rural
Livelihoods in Zimbabwe A District and Ward Analysis
This publication was developed with technical assistance from World Food Programme, Harare Office.

Mapping of Selected Hazards Affecting Rural Livelihoods in Zimbabwe - A District and Ward Analysis
3 | P a g e
Copyright @ United Nations Development Programme 2016
© UNDP 2016
This publication may be reproduced in whole or in part and in any format for educational, research and/or non-profit purposes without special
permission from the copyright holder, provided acknowledgement of the source is made. UNDP would appreciate receiving a copy of any publication
or article that uses this report as a source.
No use of this publication or any of its contents may be made for resale or for any other commercial purpose whatsoever without prior permission in
writing from UNDP.
For bibliographic and reference purposes, this publication should be referred to as: “UNDP (2016), Mapping of Selected Hazards Affecting Rural
Livelihoods in Zimbabwe”.
To obtain copies of this publication, please contact:
UNDP Zimbabwe,
Zimbabwe Resilience Building Fund (ZRBF) Management Unit;
Arundel Office Park, Block 7,
Norfolk Rd, Mt. Pleasant,
Harare, Zimbabwe
+263 4 338836-44

Mapping of Selected Hazards Affecting Rural Livelihoods in Zimbabwe - A District and Ward Analysis
4 | P a g e
Foreword
In 2015, the Government of Zimbabwe, led by the Ministry of Agriculture, Mechanisation and Irrigation Development (MAMID)
with technical and financial support from United Nations Development Programme (UNDP), European Union (EU) and UK’s
Department for International Development (DfID), embarked on laying the groundwork for a resilience-building initiative. This
initiative seeks to ensure that development programmes are designed and based on evidence concerning the shocks and
stresses that affect the well-being of communities in Zimbabwe, as well as their capacities to withstand and recover from
these shocks. This initiative follows a series of conversations, meetings and workshops with the active participation from
Government colleagues, UN agencies, NGOs and academia to define a strategic framework for resilience in Zimbabwe.
The building of an evidence base seeks to deepen the understanding of the most important hazards affecting rural livelihoods in Zimbabwe, as well
as potential pathways to strengthen the resilience capacities of our communities. The mapping of key hazards has been developed to form a basis
for decision-making and the targeting of programmes, as well as mainstreaming disaster risk reduction in planning processes.
I would like to take this opportunity to thank all Ministries and agencies for their helpful participation in the mapping, and particularly UNDP for their
continuous support and technical assistance in identifying and supporting rural communities in Zimbabwe. I urge all Ministries, public institutions and
other development partner agencies to consider and apply the Mapping of Selected Hazards Affecting Rural Livelihoods in Zimbabwe to their future
plans and programmes. We trust that these efforts will help the Government of Zimbabwe and its development partners in their joint efforts to support
the development of resilient communities in rural Zimbabwe.
……………………………………………….. R.J. Chitsiko Permanent Secretary in the Ministry of Agriculture, Mechanisation and Irrigation Development
Mapping of Selected Hazards Affecting Rural Livelihoods in Zimbabwe - A District and Ward Analysis
5 | P a g e
List of Acronyms
AGRITEX Agricultural Technical and Extension Services UNDP United Nations Development Programme
DLVS Department of Livestock and Veterinary Services
WFP World Food Programme
DRR Disaster Risk Reduction WRSI Water Requirement Satisfaction Index
EU European Union ZIMVAC Zimbabwe Vulnerability Assessment Committee
FAO Food and Agriculture Organization ZINWA Zimbabwe National Water Authority
FMD Foot & Mouth Disease
GDP Gross Domestic Product
GIS Geographical Information Systems
LGB Larger Grain Borer
NAC National AIDS Council
NEWU National Early Warning Unit
NGO Non-Governmental Organisation
NPA Norwegian People’s Aid
SPI Standardised Precipitation Index
UNAIDS Joint United Nations Programme on HIV/AIDS
Mapping of Selected Hazards Affecting Rural Livelihoods in Zimbabwe - A District and Ward Analysis
6 | P a g e
Table of Contents
Foreword ................................................................................................................................................................................................... 4
List of Acronyms ........................................................................................................................................................................................ 5
Table of Figures ......................................................................................................................................................................................... 8
I. Introduction ............................................................................................................................................................................................. 9
1.1 Background of the Hazard Mapping .................................................................................................................................................. 9
1.2 Objectives and scope ........................................................................................................................................................................ 9
1.3 Beneficiaries and users...................................................................................................................................................................... 9
1.4 What are Hazards? .......................................................................................................................................................................... 10
1.5 Methodology .................................................................................................................................................................................... 10
1.6 Limitations ........................................................................................................................................................................................ 10
1.7 Data sources .................................................................................................................................................................................... 10
1.8 Data analysis and visualisation ........................................................................................................................................................ 12
1.9 Validation ......................................................................................................................................................................................... 15
II. Major Shocks and Hazards in Zimbabwe ............................................................................................................................................ 16
III. Hazard Mapping Results .................................................................................................................................................................... 18 3.1 Drought ............................................................................................................................................................................................ 19
3.2 Mid-season dry spells ...................................................................................................................................................................... 22
3.3 Floods .............................................................................................................................................................................................. 25
3.4 Landmines ....................................................................................................................................................................................... 28
3.5 Cereal price changes ....................................................................................................................................................................... 31
3.6 Livestock prices ............................................................................................................................................................................... 34
3.7 Crop pests and diseases ................................................................................................................................................................. 37
3.8 Animal diseases ............................................................................................................................................................................... 40
3.9 HIV and AIDS .................................................................................................................................................................................. 43
3.10 Diarrheal diseases ......................................................................................................................................................................... 46

Mapping of Selected Hazards Affecting Rural Livelihoods in Zimbabwe - A District and Ward Analysis
7 | P a g e
IV. Application of the Mapping of Selected Hazards Affecting Rural Livelihoods in Zimbabwe ............................................................... 48 4.1 Hazard Convergence Map ............................................................................................................................................................... 49
4.2 District Profiles for the four districts of Beitbridge, Chimanimani, Mhondoro-Ngezi and Mutoko ...................................................... 50
V. Recommendations .............................................................................................................................................................................. 58
References .............................................................................................................................................................................................. 59 Annex 1: Ranking of Districts by their Mean Hazard Index .................................................................................................................... 60
Annex 2: Percentage contributions of the Hazards to the Mean Hazard Index ...................................................................................... 62
Notes ..................................................................................................................................................................................................... 65

Mapping of Selected Hazards Affecting Rural Livelihoods in Zimbabwe - A District and Ward Analysis
8 | P a g e
Table of Figures
Figure 1: Map showing drought proneness in Zimbabwe ......................................................................................................................................... 20
Figure 2: Map showing the mid-season dry spells in Zimbabwe ............................................................................................................................... 23
Figure 3: Map showing the flood proneness in Zimbabwe ........................................................................................................................................ 26
Figure 4: Map showing the landmine hazards in Zimbabwe ..................................................................................................................................... 29
Figure 5: Map showing the the magnitude of cereal prices changes in Zimbabwe ................................................................................................... 32
Figure 6: Map showing the magnitude of livestock price changes in Zimbabwe ....................................................................................................... 35
Figure 7: Map showing the crop pests and diseases prevalence in Zimbabwe ......................................................................................................... 38
Figure 8: Map showing the livestock diseases prevalence in Zimbabwe .................................................................................................................. 41
Figure 9: Map showing the HIV/AIDS prevalence in Zimbabwe ................................................................................................................................ 44
Figure 10: Map showing diarrhoeal diseases prevalence in Zimbabwe .................................................................................................................... 47
Figure 11: Map showing the proneness to all the 9 hazards in Zimbabwe ................................................................................................................ 49
Figure 12: Map showing the hazard map for Beitbridge District ................................................................................................................................ 50
Figure 13: Maps showing individual hazards in Beitbridge District............................................................................................................................ 51
Figure 14; Map showing the hazard map for Chimanimani District ........................................................................................................................... 52
Figure 15: Maps showing individual hazards in Chimanimani District ....................................................................................................................... 53
Figure 16 Map showing the hazard map for Mhondoro-Ngezi District ...................................................................................................................... 54
Figure 17: Maps showing individual hazards in Mhondoro-Ngezi District ................................................................................................................. 55
Figure 18: Map showing the hazard map for Mutoko District .................................................................................................................................... 56
Figure 19: Maps showing individual hazards in Mutoko District ................................................................................................................................ 57

Mapping of Selected Hazards Affecting Rural Livelihoods in Zimbabwe - A District and Ward Analysis
9 | P a g e
I. Introduction
1.1 Background of the Hazard Mapping
The Government of Zimbabwe, led by the Ministry of Agriculture,
Mechanisation and Irrigation Development (MAMID) with technical and
financial support from United Nations Development Programme
(UNDP), European Union (EU) and UK’s Department for International
Development (DfID), have embarked on a resilience-building
programme to ensure that recurrent shocks and hazards do not
undermine the progress being made to improve the overall wellbeing
of Zimbabweans. Zimbabwe has experienced a number of these
hazards, especially in the past three decades. These include but are
not limited to, droughts, mid-season dry spells, floods and cyclones,
crop pests and diseases and a number of health-related shocks.
As a first step toward designing resilience programming for Zimbabwe
a joint analysis was conducted to establish the multi-sectoral factors
affecting resilience of at-risk communities, including characterizing and
mapping of key hazards.
The mapping of hazards was undertaken as a way of forming a
knowledge base for building resilience among rural communities. A
thorough understanding of these shocks will assist in the design of
appropriate context specific resilience-building strategies.
1.2 Objectives and scope
The aim of the Mapping of Hazards is to deepen and broaden an
understanding of shocks in Zimbabwe and how they impact upon the
resilience of affected populations.
The work on mapping hazards is intended to:
elaborate on the existing national hazard profile,
estimate the number of people at risk to different shocks, and
identify areas experiencing frequent and multiple risks.
1.3 Beneficiaries and users
The Hazard Mapping is intended for wide range of stakeholders and
potential users. For key decision and policymakers the mapping will
enable them to ensure that both policies and decisions are based on
robust hazard information. The mapping may benefit donors and
development partners by providing important and evidence-based
information which can support their respective project formulation and
designs as well as the targeting of development interventions. It can
also contribute to ensuring that informed planning processes take
place within government institutions, non-government organizations
and the private sector. In addition, the academia is one of the
expected beneficiaries and users of the mapping, specifically as it
provides a basis and reference for further research.

Mapping of Selected Hazards Affecting Rural Livelihoods in Zimbabwe - A District and Ward Analysis
10 | P a g e
1.4 What are Hazards?
Hazards are defined as anything that poses danger or threat to
humans. They can be divided into natural and anthropogenic hazards.
Understanding the severity of hazards is usually essential for risk
analysis and planning for resilience-building as there is evidence of
the linkages between hazards and the resilience of rural communities1.
Additionally, understanding the spatial distribution of the effect of
hazards unravels part of the reasons why communities and households
need to build resilience.
1.5 Methodology
The hazards which mostly affect rural livelihoods in Zimbabwe were
identified through a series of meetings with stakeholders in
government, non-governmental and private sectors. The consultation
process identified nine hazards as the ones mainly affecting rural
livelihoods in Zimbabwe. These are: 1) drought, 2) mid-season dry
spells, 3) floods,4) landmines, 5) cereal and livestock price changes,
6) crop pests and diseases, 7) animal diseases, 8) HIV & AIDS and 9)
diarrhoeal diseases. The analysis of the spatial distribution and
convergence of the selected hazards was completed in order to gain
increased insight into their potential combined effect on livelihoods in
rural wards of Zimbabwe.
All the analytical steps of the mapping of hazards were made using
a Geographical Information System (GIS), a tool widely used for
hazard mapping and risk modelling2.
1.6 Limitations
Although the hazard mapping was successfully completed, the
following limitations were observed:
Access to data was challenging due to department specific data
access policies.
Different reporting periods among the different sector data
providers.
Different spatial units of reporting among the different sector
data provider.
1.7 Data sources
This study made use of secondary data from the mandated
government departments as well as from other organisations which
collect primary data for various programmes.
Every hazard amongst those nine selected falls under the mandate of
at least one government department. Table 1 below shows the
relevant departments that were consulted.
n

Mapping of Selected Hazards Affecting Rural Livelihoods in Zimbabwe - A District and Ward Analysis
11 | P a g e
Table 1: Data Sources
Hazard Parameters used Source Duration
Drought Standardised Precipitation Index (SPI) & Water Requirement Satisfaction Index (WRSI)
The Meteorological Services Department, WFP 1971-2014
Mid-season dry spells
Number of dry days within a season AGRITEX 2010-2015
Flooding Flood prone wards Zimbabwe National Water Authority (ZINWA)
10 year return period
Landmines Wards affected by landmines Halo Trust, NPA Current state
HIV & AIDS HIV prevalence as % National AIDS Council (NAC), UNAIDS
2013 estimates
Cereal and
Livestock prices
Inter-seasonal prices changes (June and October prices) Prices per kg and beast respectively
AGRITEX- National Early
Warning Unit (NEWU) 2010-2014
Crop pests and diseases
Areas affected by Armyworm, Large grain borer and Quelea birds
AGRITEX 2010-2015
Animal diseases Reported cases of Newcastle, Heart water, Foot and Mouth and Anthrax
Department of Livestock and Veterinary Services
2014-2015
Diarrhoeal diseases Reported cases of cholera, dysentery, typhoid and common diarrheal
Ministry of Health and Child Care 2008-2015

Mapping of Selected Hazards Affecting Rural Livelihoods in Zimbabwe - A District and Ward Analysis
12 | P a g e
1.8 Data analysis and visualisation
The data from the various sources underwent a standard data cleaning
processes followed by mapping of each individual hazard based on the
SMUG (Seriousness, Manageability, Urgency and Growth) hazard
priority system3. The method was adapted to allow classification of
hazards based on quantitative and qualitative data obtained from the
government departments and development partners. The four SMUG
concepts were considered in classifying the hazards into low, medium,
medium high and high classes represented by values 0-3 or 1-4 in some
cases. Experts from the data source departments were consulted during
the pre-processing and mapping stages to avoid any loss of crucial
information and misclassification. Some hazards such as flooding and
drought had fewer classes than others hence normalisation was
conducted to fit all hazards into a single scale. The following equation
was used for normalisation resulting in all hazards having values ranging
between 0 and 1:
𝐻𝑛 =∑𝐻𝑖 − 𝐻𝑜𝐻ℎ − 𝐻𝑜
𝑛
Where Hn – normalised hazard value
Hi – raw hazard value
Hh – highest hazard value
Ho – lowest hazard value
The nine hazards were then weighted using the livelihood zones
developed by ZIMVAC in 20104 (see Figure 1).
Hazards were ranked based on their impact on the population in each
one of the 25 rural livelihood zones. Ranking was done from 1-9 with
9 allocated to the shock affecting each zone most. The allocated
values in ranking were converted into percentage weights using the
following formula (adapted from Markovic and Urosevic (2011).
𝑤𝑖 =𝑅𝑖
∑ 𝑅𝑖𝑛𝑖
Where 𝑤𝑖 represent the weight of the ith shock
𝑅𝑖 is the rank for the ith shock and
∑ 𝑅𝑖𝑛𝑖 is the sum of all ranks.
The weights were then multiplied by the normalised values of
each shock in the respective livelihood zones resulting in the
weighted values for drought, mid-season dry spells, floods, HIV
& AIDS, landmines, cereal and livestock prices, crops pests
and diseases, livestock and diarrhoeal diseases.
Convergence of shocks was explored by calculating the sum
of weighted values of the nine hazards. The values ranged
between 0 and 1 just the same as the normalised values. The
final hazard map was classified into four classes of Low,
Medium, Medium high and High (Figure 11). The diagram
below (Figure 2) summarises the entire methodology used in
this exercise.

Mapping of Selected Hazards Affecting Rural Livelihoods in Zimbabwe - A District and Ward Analysis
13 | P a g e
Figure 1: The Zimbabwe Livelihood Zones

Mapping of Selected Hazards Affecting Rural Livelihoods in Zimbabwe - A District and Ward Analysis
14 | P a g e
Figure 2: Methodology framework for mapping of selected hazard affecting rural livelihoods in Zimbabwe

Mapping of Selected Hazards Affecting Rural Livelihoods in Zimbabwe - A District and Ward Analysis
15 | P a g e
1.9 Validation
Validation of all the mapping products and the methodology in this document was undertaken through
bilateral meetings with the data providers,
a workshop with technical staff from all the data provider departments,
Presentations and discussions with
o UN partners in the UN Resilience and DRM task force,
o Various stakeholders at the National Civil Protection Committee Meeting, and
A full-day multi stakeholder validation workshop on the 3rd of September 2015.

Mapping of Selected Hazards Affecting Rural Livelihoods in Zimbabwe - A District and Ward Analysis
16 | P a g e
II. Major Shocks and Hazards in Zimbabwe
Agriculture is the most important economic sector in Zimbabwe,
contributing to about 70% of the employment and 13% of the annual
GDP.5 However, recent productivity has been decreasing, particularly
for small grains and maize crops. Previously controlled prices of maize
and other commodities led commercial farmers to switch to non-price
controlled cash crops, such as tobacco and cotton6. There are also a
number of factors causing low agricultural productivity in rural areas
which include lack of both support services and credit as well as limited
access to inputs such as seeds and fertilizer.7 Agriculture in Zimbabwe
is particularly vulnerable to natural disasters and drought which occur
regularly and are expected to increase in coming years due to climate
change.
Over the last few decades, Zimbabwe has experienced hotter days
and an increasingly variable rainfall, with little change in annual rainfall
but with more extreme events (i.e., longer, more frequent dry spells and
fewer, more intense rain days). Studies have found that climate change
has caused some regional shifts to drier agro-ecological zones8 which
could impact livelihoods, especially where people have limited
resources and information with which to adapt to new conditions.
Small-scale farmers have already been affected by changing climate
conditions over the last few decades and these climate trends are
predicted to continue.9 Policies such as Zimbabwe Agriculture
Investment Plan (2013-2017) are designed to increase “production,
productivity and competitiveness of Zimbabwean agriculture.”10
However barriers such as limited resources, technical capacity and
access to information have constrained Zimbabwe’s ability to
implement climate change adaptation measures which may be
essential to creating long-term sustainability in agriculture and food
security.11
Frequent natural disasters such as droughts and floods have further
exacerbated poverty levels since the predominant economic activity,
rain-fed agriculture, is vulnerable to climatic variability. The most
common hazards affecting rural Zimbabwe are drought and mid-
season dry spells. Drought has caused six of the ten worst natural
disasters between 1991 and 2013.12 Much of Zimbabwe is comprised
of semi-arid agro-ecological regions IV and V, characterised by “low
and erratic rainfalls and poor soils.”13 Given Zimbabwe’s heavy reliance
on rain-fed agriculture and livestock, drought has serious implications
on food security and livelihoods. Drought also impacts on water
availability for domestic and industrial use and power generation
affecting cities and non-agriculture sectors.14
Floods occur more frequently, usually every year, and often as a result
of cyclones. Recent records also show an increase in violent storms
with hail and strong winds which damage infrastructure, property and
crops and cause loss of life (i.e., human and livestock). Floods tend to
occur in the southern and northern low lying areas of Zimbabwe, in the
paths of cyclones, in between river confluences and downstream of
major dams. The frequency of floods and droughts is increasing in
Zimbabwe as a result of climate change.

Mapping of Selected Hazards Affecting Rural Livelihoods in Zimbabwe - A District and Ward Analysis
17 | P a g e
The prevalence of landmines which were planted during the liberation
war of the 1970s, remain a threat to rural farming-based livelihoods,
is. Although they are not common in most parts of the country, the
north-eastern part of Zimbabwe still has a recorded 187 minefields15
and land mines are a serious threat to human and animal life in these
areas. No economic or livelihood activity can be carried out in mining
fields hence communities are deprived of economic and livelihood
opportunities in these areas.
Another major shock affecting Zimbabwe is the HIV/AIDS epidemic.
Although progress has been made in reducing the problem, Zimbabwe
still has one of the highest HIV prevalence rates in the world at 15%.16
Prevalence of HIV is slightly higher in urban areas compared to rural
areas and among people ages 15-24. HIV prevalence is 1.5 times
higher among women than men. Over 1.2 million adults and children
were living with HIV/AIDS in 2011, and HIV-related deaths have led to
25% of children being vulnerable or orphaned.17 Other diseases such
as tuberculosis, malaria and cholera are also prevalent in Zimbabwe
and are exacerbated by HIV/AIDS, climate change and lack of access
to safe water and sanitation services.
Erratic rains, drought, mid-season dry spells and other negative effects
on agriculture combine to cause crop and livestock price changes. The
prices changes are often a threat to livelihoods since they lead to
unaffordability of food when they are high and a reduction in income
when they are low. Another set of hazards of note are the crop pest
and diseases due to their effect of reducing yield in affected areas.
Besides lack of pastures in certain areas, some districts have
experienced more animal disease outbreaks in the past 10 years
compared to the period 1980-2000. The most common diseases
among domesticated herbivorous animals include lumpy skin, rabies,
diarrhoea, heartwater, anthrax, and foot and mouth. For poultry,
newcastle and coccidiosis are the major ones identified by The
Veterinary Services .This is based on the areas affected in any given
year as well as the severity of damage. Rural Zimbabwe remain
vulnerable to these diseases due to limited resources18 for
coordination, vaccination and awareness campaigns. Humans are
also at risk since many do consume meat from animals which die of
“unknown causes”. In most parts of the country loss of animals due to
diseases is a major setback to livelihoods hence the inclusion of
diseases as a hazard.
The last hazard nominated by the stakeholders for inclusion in this
publication are the diarrhoeal diseases. The records reveal a number
of outbreaks every year which affect production and in some cases
lead to mortality. Diarrhoeal diseases include common diarrhoea,
typhoid, dysentery and cholera. The main causes of diarrhoeal
diseases are limited water and sanitation facilities. One of the worst
outbreaks occurred in 2008 when over 11 000 were affected by
cholera19 countrywide. The following chapters illustrate the spatial
distribution and convergence of the selected nine hazards at ward and
district levels.

Mapping of Selected Hazards Affecting Rural Livelihoods in Zimbabwe - A District and Ward Analysis
18 | P a g e
III. Hazard Mapping Results
Results of the hazards mapping process are shown in this section by first presenting the maps for individual hazards, the convergence map for all
hazards and then four examples of the district level maps.

Mapping of Selected Hazards Affecting Rural Livelihoods in Zimbabwe - A District and Ward Analysis
19 | P a g e
3.1 Drought
Drought is defined as a deficiency in precipitation over an extended
period, usually a season or more, resulting in a water shortage causing
adverse impacts on vegetation, animals, and/or people. Drought is a
recurrent feature of climate change that occurs in virtually all climate
zones, from very wet to very dry.
For the mapping of drought as a hazard, the meteorological (derived from
the SPI) and agricultural drought (calculated from the Water Requirement
Satisfaction Index (WRSI) for maize as a proxy for drought) were
combined. For the meteorological drought, the Standardised Precipitation
Index (SPI) for the years between 1981 and 2014 were calculated and
used to determine whether these respective years were drought years or
not. SPI was calculated from rainfall data from 44 stations across the
country. SPI reflects the probability of recording a given amount of
precipitation. The probabilities are standardized so that an index of zero
indicates the median precipitation amount per year. SPI is negative for
drought while it is positive for wet conditions. The meteorological drought
map used the following classes: Mild (12 -15 drought years), Moderate
(16-18 drought years) and Severe (19-21 drought years). This was over
the 33 year period.
The mapping of agricultural drought was based on a WFP analysis using
10 years (2004 to 2014) Crop WRSI data from SADC and FEWSNET as
a proxy for drought. This was validated with OCHA analysis based on
frequency and magnitude/impact of experienced drought cases to map
drought prone areas. The drought map considers the frequency and
magnitude/impact of drought in a specific area. The frequency is defined
as how often the phenomenon occurs in an area over a ten-year period.
Meteorological and agricultural drought were combined and mapped using
the following three point scale:
Mild: wards ranked mild for both droughts
Moderate: wards ranked at moderate for one or both
droughts
Severe: wards ranked severe for both droughts

Mapping of Selected Hazards Affecting Rural Livelihoods in Zimbabwe - A District and Ward Analysis
20 | P a g e
Figure 1: Map showing drought proneness in Zimbabwe

Mapping of Selected Hazards Affecting Rural Livelihoods in Zimbabwe - A District and Ward Analysis
21 | P a g e

Mapping of Selected Hazards Affecting Rural Livelihoods in Zimbabwe - A District and Ward Analysis
22 | P a g e
3.2 Mid-season dry spells
Dry spells are defined as prolonged periods of dry weather of at least ten consecutive days that happen after the onset of the wet season. The
mid-season dry spell is described in terms of its length expressed in days and the frequency of occurrence. Its impact is directly related to the
length and time of occurrence and therefore scores can be treated as one combined score.
A 5-point scale was adopted after consulting with Agronomists and Crop Science Specialists at the AGRITEX Headquarters in Harare.
None: 0 -10 days
Low: 11 -14 days
Medium: 15 -21 days
Medium high: 22 -31 days
High: > 32 days

Mapping of Selected Hazards Affecting Rural Livelihoods in Zimbabwe - A District and Ward Analysis
23 | P a g e
Figure 2: Map showing the mid-season dry spells in Zimbabwe

Mapping of Selected Hazards Affecting Rural Livelihoods in Zimbabwe - A District and Ward Analysis
24 | P a g e

Mapping of Selected Hazards Affecting Rural Livelihoods in Zimbabwe - A District and Ward Analysis
25 | P a g e
3.3 Floods
Flooding is defined as an overflow of water onto land that is normally dry. Flooding occurs due to heavy rains, tropical cyclones or rising dam
levels that results in the destruction of crops and structures such as homes and other infrastructures.
The scoring of the flood prone map of Zimbabwe was based on recorded frequency of floods over a ten year period based on data from the Zimbabwe
National Water Authority (ZINWA). The scoring was as follows:
None: No recorded incidences of flooding
Low: 1 to 3 incidences of flooding
Medium: 3 to 5 incidences of flooding
High: > 5 incidences of flooding

Mapping of Selected Hazards Affecting Rural Livelihoods in Zimbabwe - A District and Ward Analysis
26 | P a g e
Figure 3: Map showing the flood proneness in Zimbabwe

Mapping of Selected Hazards Affecting Rural Livelihoods in Zimbabwe - A District and Ward Analysis
27 | P a g e

Mapping of Selected Hazards Affecting Rural Livelihoods in Zimbabwe - A District and Ward Analysis
28 | P a g e
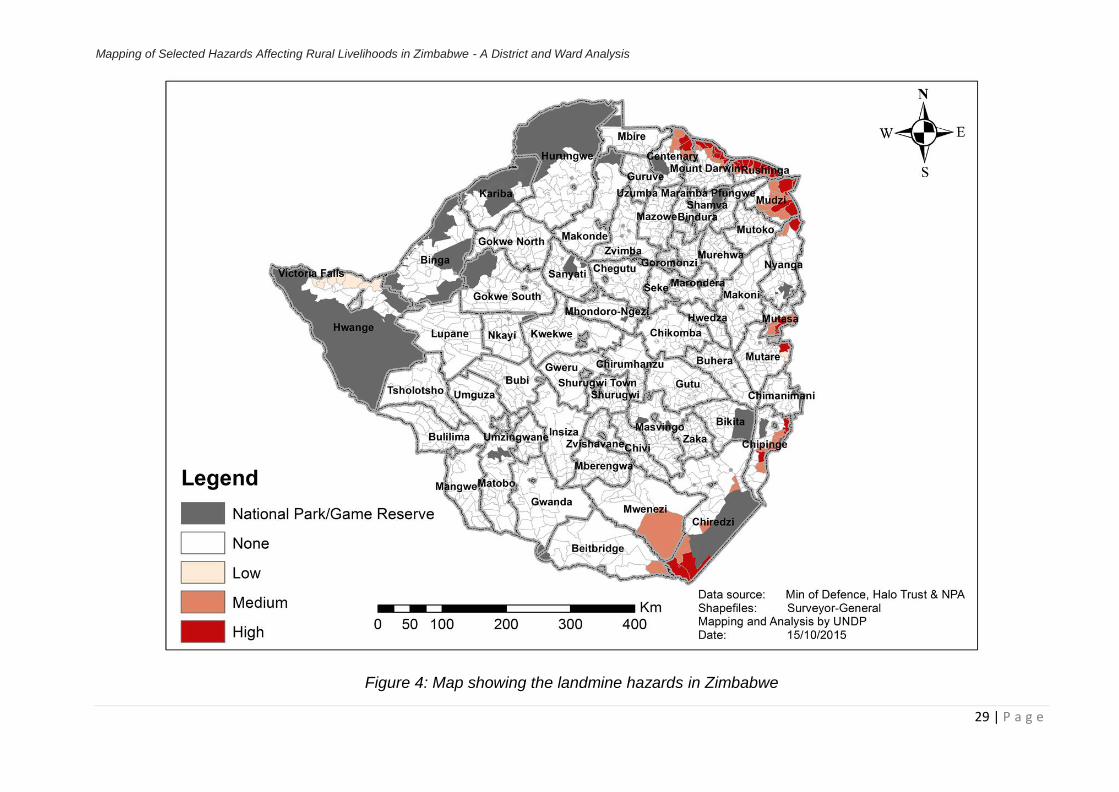
3.4 Landmines
A land mine is an explosive which has been laid on or just under the surface of the ground. Landmines are a serious threat to human and animal life
and no economic or livelihood activity can be carried out in landmine infested areas. Most of the landmines in Zimbabwe were laid out during the
liberation war and seven mine fields have been identified.20 About 626 km of the minefields are adjacent to communal lands thereby threatening
livelihoods of many of these areas.21
The wards have been classified into the following classes based on demarcated mine fields in Zimbabwe:
None: Wards with no detected landmines
Low: Wards where landmines have been cleared and the land handed back to communities.
Medium: All wards which are next to landmine infested wards. Human and animal movement across ward boundaries makes it a hazard
for these neighbouring wards.
High: This refers to all wards that are known to have landmines.
Mapping of Selected Hazards Affecting Rural Livelihoods in Zimbabwe - A District and Ward Analysis
29 | P a g e
Figure 4: Map showing the landmine hazards in Zimbabwe
Mapping of Selected Hazards Affecting Rural Livelihoods in Zimbabwe - A District and Ward Analysis
30 | P a g e

Mapping of Selected Hazards Affecting Rural Livelihoods in Zimbabwe - A District and Ward Analysis
31 | P a g e
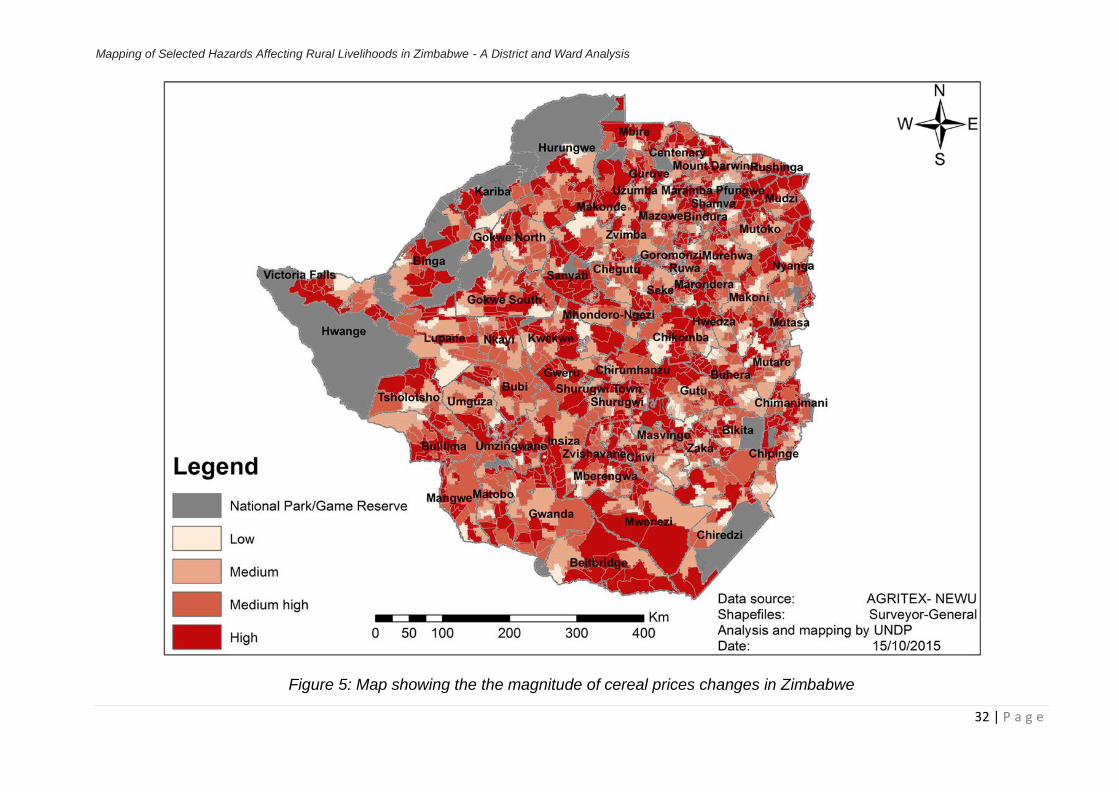
3.5 Cereal price changes
In this section we mapped cereal price changes after calculating maize’s inter-seasonal price changes (June and October prices) for the period 2010
to 2014. The average maize price per kilogram for the months of June and October for the five years was calculated. Thereafter the average
differences between winter (June) and summer (October) prices was calculated. Classes were then derived from the price differences using the
following ranges:
Low: -$0.04 - $0.05
Medium: $0.05 - $0.10
Medium high: $0.10 - $0.15
High: > $0.15
Mapping of Selected Hazards Affecting Rural Livelihoods in Zimbabwe - A District and Ward Analysis
32 | P a g e
Figure 5: Map showing the the magnitude of cereal prices changes in Zimbabwe

Mapping of Selected Hazards Affecting Rural Livelihoods in Zimbabwe - A District and Ward Analysis
33 | P a g e

Mapping of Selected Hazards Affecting Rural Livelihoods in Zimbabwe - A District and Ward Analysis
34 | P a g e
3.6 Livestock prices
A change in livestock prices refers to the inter-seasonal price changes between June and October prices, mainly for cattle. The average cattle price
per beast for the months of June and October were calculated for the period of 2010-2014. The average differences between winter (June) and
summer (October) prices were then finally calculated.
Classes were then derived from the price differences using the following ranges:
Low: -$20 - $0
Medium: $40 - $20
Medium high: $60 - $40
High: > $60

Mapping of Selected Hazards Affecting Rural Livelihoods in Zimbabwe - A District and Ward Analysis
35 | P a g e
Figure 6: Map showing the magnitude of livestock price changes in Zimbabwe

Mapping of Selected Hazards Affecting Rural Livelihoods in Zimbabwe - A District and Ward Analysis
36 | P a g e

Mapping of Selected Hazards Affecting Rural Livelihoods in Zimbabwe - A District and Ward Analysis
37 | P a g e
3.7 Crop pests and diseases
Crop pests are defined as those pests of economic importance to livelihoods. For the purpose of the Mapping of Hazards Affecting Rural Livelihoods
in Zimbabwe AGRITEX officials identified army worm, larger grain borer and quelea birds as the major pests affecting crop production based on
average number of districts affected in a year as well as the severity of damage to crops. Individual maps were produced for the selected crop
pests and diseases. The maps were based on following data sources:
Quelea birds outbreak data – was mapped using small grain production as proxy for quelea prevalence
Army worm infestation – was mapped based on cases reported to AGRITEX.
Larger Grain Borer – was mapped based on cases reported to AGRITEX.
The individual pests and diseases scoring is based on the frequency and severity of the attacks which were then mapped. Both the individual and
the combined maps adopted the following four point scale based on the five year data:
Low: wards which experienced just one incident of one of the three pests and diseases (quelea, armyworm and LB)
Medium: wards which experienced two incidences of any of the three pests and diseases (quelea, armyworm and LB)
Medium high: wards which experienced all three incidences of all three pests and diseases (quelea, armyworm and LB) without
severe consequences.
High: wards which experienced high incidences of all three pests and diseases (quelea, armyworm and LB) with severe
consequences.

Mapping of Selected Hazards Affecting Rural Livelihoods in Zimbabwe - A District and Ward Analysis
38 | P a g e
Figure 7: Map showing the crop pests and diseases prevalence in Zimbabwe

Mapping of Selected Hazards Affecting Rural Livelihoods in Zimbabwe - A District and Ward Analysis
39 | P a g e

Mapping of Selected Hazards Affecting Rural Livelihoods in Zimbabwe - A District and Ward Analysis
40 | P a g e
3.8 Animal diseases
The definition of animal diseases includes livestock diseases of economic importance such as anthrax, foot & mouth disease (FMD), newcastle and heartwater.
The mapping of animal diseases was based on the 2010-2014 data on reported cases of heartwater, newcastle, anthrax and FMD as recorded by
the Veterinary Services Division within the Department of Livestock and Veterinary Services. Using the reported cases of the selected diseases, the
individual diseases were mapped by district. heartwater, newcastle, anthrax were combined with FMD, which received a high prioritisation due to its
decimating effect to people’s herds of cattle and livelihoods using a 4-point classification.
Four classes were then derived using the following criteria:
Low: No incidences of the four diseases
Medium: wards which experienced at least one of the three diseases (Heartwater, Newcastle and Anthrax)
Medium high: wards which experienced at least two of the three diseases (Heartwater, Newcastle and Anthrax)
High: wards which experienced at least three of the four diseases (Heartwater, Newcastle and Anthrax and FMD)

Mapping of Selected Hazards Affecting Rural Livelihoods in Zimbabwe - A District and Ward Analysis
41 | P a g e
Figure 8: Map showing the livestock diseases prevalence in Zimbabwe

Mapping of Selected Hazards Affecting Rural Livelihoods in Zimbabwe - A District and Ward Analysis
42 | P a g e

Mapping of Selected Hazards Affecting Rural Livelihoods in Zimbabwe - A District and Ward Analysis
43 | P a g e
3.9 HIV and AIDS
HIV and AIDS prevalence is defined as the 2014 HIV and AIDS prevalence rate estimates for an adult population. The HIV and AIDS prevalence
rate was used to score this parameter and a four point scale22 was adopted. These are:
Low: < 13%
Medium: 13 – 16%
Medium with high risk factors: 16 – 20%
High: >20%

Mapping of Selected Hazards Affecting Rural Livelihoods in Zimbabwe - A District and Ward Analysis
44 | P a g e
Figure 9: Map showing the HIV/AIDS prevalence in Zimbabwe

Mapping of Selected Hazards Affecting Rural Livelihoods in Zimbabwe - A District and Ward Analysis
45 | P a g e

Mapping of Selected Hazards Affecting Rural Livelihoods in Zimbabwe - A District and Ward Analysis
46 | P a g e
3.10 Diarrheal diseases
Diarrhoeal diseases are defined as the reported cases of cholera, dysentery, typhoid and common diarrhoea according to the Ministry of Health and
Child Care. Data from health centres was interpolated to obtain figures on diarrhoeal diseases per ward. Each of the selected type of diarrhoeal
disease was mapped for each year and then combined to produce the final map with four classes representing the prevalence of the diseases over
the period 2010-2015.The four point scale used is:
Low: wards affected by any one of the following diseases: common diarrhoea, dysentery or typhoid since 2010
Medium: wards affected by any two of the following diseases: common diarrhoea, dysentery or typhoid since 2010
Medium high: wards affected by all of the following diseases: common diarrhoea, dysentery or typhoid since 2010
High: wards affected by all of the following diseases: cholera, common diarrhoea, dysentery or typhoid since 2010

Mapping of Selected Hazards Affecting Rural Livelihoods in Zimbabwe - A District and Ward Analysis
47 | P a g e
Figure 10: Map showing diarrhoeal diseases prevalence in Zimbabwe

Mapping of Selected Hazards Affecting Rural Livelihoods in Zimbabwe - A District and Ward Analysis
48 | P a g e
IV. Application of the Mapping of Selected Hazards Affecting Rural Livelihoods in Zimbabwe
The mapping of selected hazards affecting rural livelihoods in Zimbabwe
has generated a considerable amount of hazard information and
knowledge, including data sets compiling hazards and shocks on district
and ward level, which is structured to meet the needs and requirements
for hazard information from different stakeholders. While recognizing that
different end users have different information needs for different
purposes, the presentation of the mapping of hazards are tailored to the
needs of stakeholders in very general terms. The information in Annex 1,
the ranking of districts by their mean hazard index and Annex 2, the
percentage contributions of the hazards to the mean hazard index per
district, is presented as a list of information and can be used to feed into
the work of stakeholders as needed.
The following sections are examples of how this information can be used.
The Hazard Convergence Map on page 31 shows an overview of all the
hazards per district layered in one map. This map can be split into district
and ward level information as the following chapters demonstrate with
examples of Beitbridge, Chimanimani, Mhondoro-Ngezi and Mutoko.
In this publication four districts have been chosen as examples of how
the hazard information can be unpacked and used. These districts give a
broad picture of the type of information which it is possible to extract from
Annexes 1 and 2.

Mapping of Selected Hazards Affecting Rural Livelihoods in Zimbabwe - A District and Ward Analysis
49 | P a g e
4.1 Hazard Convergence Map
Figure 11: Map showing the proneness to all the nine hazards in Zimbabwe

Mapping of Selected Hazards Affecting Rural Livelihoods in Zimbabwe - A District and Ward Analysis
50 | P a g e
4.2 District Profiles for Beitbridge, Chimanimani, Mhondoro-Ngezi and Mutoko Districts
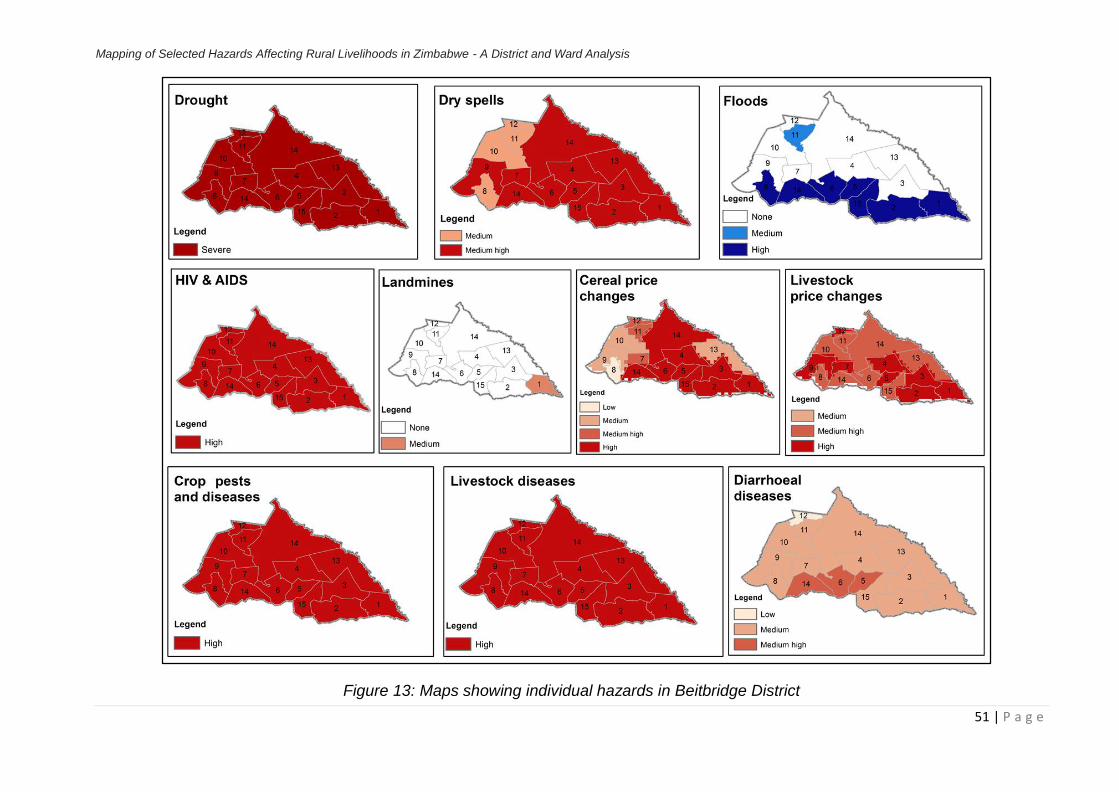
Figure 12: Map showing the hazard map for Beitbridge District
Beitbridge
Beitbridge district ranks highest in the Mean Hazard
Index with a mean hazard index of 0.7317. Most of
the wards in the district fall into the high category
which means that they are highly affected by the
majority of the selected nine hazards.
The maps in Fig 13 give the district profile of all the
individual hazards. Here it is obvious that the wards
in this area experience a range of hazards although
only some wards are flood prone, for example.
Please note that cereal and livestock prices were
separated for visual purposes only, otherwise they
were combined for the final analysis.
Mapping of Selected Hazards Affecting Rural Livelihoods in Zimbabwe - A District and Ward Analysis
51 | P a g e
Figure 13: Maps showing individual hazards in Beitbridge District

Mapping of Selected Hazards Affecting Rural Livelihoods in Zimbabwe - A District and Ward Analysis
52 | P a g e
Chimanimani District
Chimanimani district is primarily a medium
affected district and is ranked 24th with a
mean hazard index of 0.527. The wards in
Chimanimani districts rank from medium to
high affected by hazards.
Figure 15 gives the district profile of the
individual hazards. It shows how the wards
differ in the level of impact they experience
due to diversity in areas such as drought, dry
spells and changes in cereal and livestock
prices.
Figure 14: Map showing the hazard map for Chimanimani District

Mapping of Selected Hazards Affecting Rural Livelihoods in Zimbabwe - A District and Ward Analysis
53 | P a g e
Figure 15: Maps showing individual hazards in Chimanimani District

Mapping of Selected Hazards Affecting Rural Livelihoods in Zimbabwe - A District and Ward Analysis
54 | P a g e
Figure 16: Map showing the hazard map for Mhondoro-Ngezi District
Mhondoro-Ngezi District
Mhondoro-Ngezi district is ranked 58th with a
mean hazard index of 0.337 which falls into the
medium range. The district has one of the
lowest mean hazard indexes in the country.
Some of the wards in this district experienced
changes in crop and livestock prices and the
whole district has a medium prevalence to HIV/
AIDS and diarrheal diseases.

Mapping of Selected Hazards Affecting Rural Livelihoods in Zimbabwe - A District and Ward Analysis
55 | P a g e
Figure 17: Maps showing individual hazards in Mhondoro-Ngezi District

Mapping of Selected Hazards Affecting Rural Livelihoods in Zimbabwe - A District and Ward Analysis
56 | P a g e
Figure 18: Map showing the hazard map for Mutoko District
Mutoko District
Mutoko District has a mean hazard index
of 0.3655. It is ranked 57th on the mean
hazard index.
As shown on the district map, Figure 19,
most of the wards fall within the medium
level in terms of proneness to all the nine
hazards included in this study.

Mapping of Selected Hazards Affecting Rural Livelihoods in Zimbabwe - A District and Ward Analysis
57 | P a g e
Figure 19: Maps showing individual hazards in Mutoko District

Mapping of Selected Hazards Affecting Rural Livelihoods in Zimbabwe - A District and Ward Analysis
58 | P a g e
V. Recommendations
The following recommendations were drawn from the mapping of selected hazards which affect rural parts of Zimbabwe:
The majority of the districts in the western and southern parts of the country suffer the effects of multiple hazards.
Hazard mapping exercises need to be undertaken at least once every two years since some hazards such as drought, diarrhoeal diseases,
floods and crop pests and diseases are becoming more frequent in Zimbabwe than in previous decades.
Based on feedback from the data providers and other stakeholders, there is a need to derive indicators in the next update for mapping
environmental degradation and veld fires as additional hazards.
There is a great need for advocacy and information sharing so that this product is used to feed into evidence-based policy and decision-
making at local and national levels.

Mapping of Selected Hazards Affecting Rural Livelihoods in Zimbabwe - A District and Ward Analysis
59 | P a g e
References
CANNON, T. 2008. Reducing people’s vulnerability to natural hazards: Communities and Resilience. Research Paper 2008/34, UNU-WIDER.
CHEN, A., BLONG, R. & JACOBSON, C. 2003. Towards an integrated approach to natural hazards risk assessment using GIS: with reference to
bushfires. Environmental Management 31, 546-560.
COPPOCK, J. T. 1995. GIS and natural hazards: an overview from a GIS perspective. In: CARRARA, A. & GUZZETTI, F. (eds.) Geographical
Information Systems in Assessing Natural Hazards. Netherlands: Kluwer Academic.
MARKOVIC, P. & UROSEVIC, B. 2011. Market risk stress testing for internationally active financial institutions. Economic Annals, 56, 62-90.
PEARCE, L. D. R. 2000. An integrated approach for community hazard, impact, risk and vulnerability analysis: HIRV. Doctor of Philosophy, The
University of British Columbia.
ZERGER, A. 2002. Examining GIS decision utility for natural hazard risk modelling. Environmental Modelling & Software, 17, 287-294.
ZHOU, H., WANG, J. A., WAN, J. & JIA, H. 2010. Resilience to natural hazards: a geographic perspective. Natural Hazards, 53, 21-41.
ZIMVAC 2010. Zimbabwe Livelihoods Zone Profiles. Harare: The Zimbabwe Vulnerability Assessment Committee.

Mapping of Selected Hazards Affecting Rural Livelihoods in Zimbabwe - A District and Ward Analysis
60 | P a g e
Annex 1: Ranking of Districts by their Mean Hazard Index
Rank District Mean Hazard
Index
1 Beitbridge 0.7317
2 Binga 0.7080
3 Bubi 0.7066
4 Matobo 0.6965
5 Umguza 0.6944
6 Mangwe 0.6670
7 Gwanda 0.6522
8 Chiredzi 0.6505
9 Umzingwane 0.6432
10 Tsholotsho 0.6363
11 Buhera 0.6336
12 Bulilima 0.6328
13 Mwenezi 0.6251
14 Zaka 0.6168
15 Lupane 0.6026
16 Chipinge 0.5983
17 Chivi 0.5971
18 Mbire 0.5901
19 Insiza 0.5850
20 Nkayi 0.5544
21 Zvishavane 0.5532
22 Bikita 0.5395
23 Hurungwe 0.5273
24 Chimanimani 0.5270
25 Kariba 0.5044
26 Hwange 0.5034
27 Mutare 0.5009
28 Chikomba 0.4985
29 Makoni 0.4966
30 Mberengwa 0.4947
31 Nyanga 0.4904
32 Gokwe South 0.4880
33 Gutu 0.4860
34 Gokwe North 0.4854
35 Makonde 0.4731
36 Zvimba 0.4693
37 Sanyati 0.4680
38 Centenary 0.4671
39 Shamva 0.4639
40 Hwedza 0.4635
41 Masvingo 0.4580
42 Marondera 0.4496

Mapping of Selected Hazards Affecting Rural Livelihoods in Zimbabwe - A District and Ward Analysis
61 | P a g e
43 Chegutu 0.4480
44 Uzumba Maramba
Pfungwe 0.4475
45 Mazowe 0.4436
46 Bindura 0.4307
47 Mount Darwin 0.4242
48 Guruve 0.4224
49 Seke 0.4189
50 Goromonzi 0.4172
51 Murehwa 0.4146
52 Kwekwe 0.4138
53 Chirumhanzu 0.3970
54 Mutasa 0.3963
55 Rushinga 0.3829
56 Mudzi 0.3806
57 Mutoko 0.3655
58 Mhondoro-Ngezi 0.3370
59 Shurugwi 0.3247
60 Gweru 0.3205
61 Chinhoyi 0.3193

Mapping of Selected Hazards Affecting Rural Livelihoods in Zimbabwe - A District and Ward Analysis
62 | P a g e
Annex 2: Percentage contributions of the Hazards to the Mean Hazard Index
District
Drought
and Dry
spells
Floods HIV/AIDS Landmines Cereal
prices
Crop
pests
and
diseases
Animal
disease
s
Diarrhoeal
diseases
Beitbridge 33.54 3.82 6.95 0 14.56 15.39 21.55 4.20
Bikita 35.73 0 4.06 0 16.73 10.48 21.12 11.88
Bindura 19.56 0 10.63 0 23.41 19.91 9.30 17.18
Binga 37.75 0.26 2.16 0 15.61 9.96 18.78 15.48
Bubi 42.17 0.59 8.21 0 16.34 10.40 15.05 7.24
Buhera 32.91 0.42 10.66 0 14.04 12.58 18.65 10.73
Bulilima 38.96 0 8.56 0 16.02 9.09 19.25 8.12
Centenary 12.61 22.36 6.76 1.86 14.46 22.19 7.43 12.33
Chegutu 19.19 0 5.12 0 21.38 19.20 17.93 17.18
Chikomba 41.21 0 5.25 0 18.23 15.27 8.08 11.95
Chimanimani 28.16 0.55 4 0.61 20.49 19.33 15.71 11.15
Chipinge 31.10 2.99 5.47 2.98 16.20 17.81 14.11 9.34
Chiredzi 29.38 3.97 3.06 0.19 14.06 15.79 22.17 11.39
Chirumhanzu 26.76 0 6.42 0 26.19 23.40 9.93 7.30
Chivi 32.54 0 3.76 0 16.75 11.74 23.68 11.53
Gokwe North 26.54 1.13 3.22 0 11.67 13.91 24.35 19.17
Gokwe South 26.41 2.12 4.42 0 12.31 13.77 24.26 16.71
Goromonzi 27.57 0 5.44 0 23.51 16.98 9.51 16.99
Guruve 26.44 3.73 5.38 0 23.54 10.07 18.81 12.03
Gutu 25.82 0 4.82 0 17.25 17.05 24.33 10.74
Gwanda 31.99 0.26 8.75 0 16.23 15.07 23.02 4.68
Gweru 10.60 0 7.46 0 35.21 7.37 23.64 15.72
Hurungwe 27.63 0.10 8.26 0 18.05 15.55 15.06 15.35

Mapping of Selected Hazards Affecting Rural Livelihoods in Zimbabwe - A District and Ward Analysis
63 | P a g e
Hwange 27.77 2.08 3 1.32 24.37 6.68 17.47 17.32
Hwedza 28.61 0 5.06 0 21.95 14.25 16.95 13.19
Insiza 25.38 0.19 13.56 0 17.94 12.06 25.14 5.73
Kariba 21.48 0 3.86 0 21.89 8.16 21.29 23.32
Karoi 18.72 0 11.89 0 38.16 0 0 31.22
Kwekwe 18.66 0.43 5.24 0 20.66 21.48 18.09 15.43
Lupane 38.08 3.36 3.15 0 13.82 12.35 18.09 11.16
Makonde 25.36 0.12 10.12 0 22.66 17.49 8.26 15.99
Makoni 26.43 0 9.49 0 17.23 16.34 15.88 14.63
Mangwe 34.09 0.37 7.20 0 16.19 12.74 23.78 5.63
Marondera 22.94 0 15.11 0 22.90 15.73 8.81 14.52
Masvingo 19.77 0 5.16 0 19.77 24.81 16.86 13.63
Matobo 35.53 0.94 8.53 0 14.06 12.08 22.44 6.41
Mazowe 13.88 0 17.23 0 20.59 19.92 8.90 19.48
Mberengwa 23.31 0.49 4.73 0 19.70 17.12 20.90 13.75
Mbire 30.95 29.32 0 0 9.26 15.35 9.59 5.51
Mhondoro-Ngezi 17.25 0 14.32 0 31.57 4.31 12.08 20.47
Mount Darwin 17.97 10.95 9.81 6.93 17.49 9.33 8.95 18.57
Mudzi 19.10 0 6.09 2.10 28.56 12.18 10.66 21.32
Murehwa 26.33 0 5.52 0 21.59 20.68 9.66 16.22
Mutare 34.48 0.07 9.11 0.17 17.90 18.20 8.06 12
Mutasa 20.56 0 7.19 2.20 25.56 22.71 10.55 11.23
Mutoko 12.99 0 6.80 0 25.95 10.51 22.29 21.47
Mwenezi 32.80 0.30 3.64 0 19.26 17.88 16.24 9.88
Nkayi 27.55 2.83 8.47 0 18.52 9.98 18.50 14.15
Nyanga 16.28 0.35 9.69 0.24 18.96 17.45 24.04 13

Mapping of Selected Hazards Affecting Rural Livelihoods in Zimbabwe - A District and Ward Analysis
64 | P a g e
Rushinga 20.58 0 6.37 3.28 27.78 9.25 10.48 22.26
Sanyati 32.64 3.74 0 0 17.43 21.09 8.53 16.57
Seke 16.25 0 5.53 0 24.67 17.04 19.09 17.43
Shamva 24.07 0 11.40 0 21.03 15.90 8.35 19.26
Shurugwi 28.38 0 7.96 0 30.18 12.21 12.17 9.11
Tsholotsho 44 6.82 2.45 0 15.92 8.17 13.47 9.18
Umguza 40.73 0.34 4.12 0 15.80 12.16 22.08 4.78
Umzingwane 38.32 0.10 11.54 0 17.80 13.09 16.50 2.65
Uzumba Maramba Pfungwe
25.11 0 5.13 0 23.83 7.69 17.95 20.29
Zaka 35.79 0 3.66 0 14.21 9.13 25.58 11.64
Zvimba 15.72 0 11.67 0 19.25 18.17 16.34 18.85
Zvishavane 33.05 0 4.25 0 19.77 12.61 21.19 9.14

Mapping of Selected Hazards Affecting Rural Livelihoods in Zimbabwe - A District and Ward Analysis
65 | P a g e
Notes
1 Cannon, 2008, Zhou et al., 2010
2 Zerger, 2002, Coppock, 1995, Chen et al., 2003
3 Pearce, 2000
4 ZIMVAC, 2010
5 Government of Zimbabwe and UNCT. 2014. Zimbabwe Country Analysis: Working Document. Dated 4 November 2014.
6 UNDP programme documents.
7 IFAD. Rural poverty in Zimbabwe. http://www.ruralpovertyportal.org/country/home/tags/zimbabwe.
8 Government of Zimbabwe and UNCT Zimbabwe. 2014. Zimbabwe Country Analysis: Working Document. Dated 4 November 2014.
9 Government of Zimbabwe. 2015. Zimbabwe’s National Climate Change Response Strategy.
10 Government of Zimbabwe and UNCT Zimbabwe. 2014. Zimbabwe Country Analysis: Working Document. Dated 4 November 2014.
11 Government of Zimbabwe. 2015. Zimbabwe’s National Climate Change Response Strategy.
12 Government of Zimbabwe and UNCT Zimbabwe. 2014. Zimbabwe Country Analysis: Working Document. Dated 4 November 2014.
13 WFP. 2014. Zimbabwe: Results of exploratory food and nutrition security analysis. Harare: WFP.
14 UNDP programme documents.
15 Halo Trust, http://www.halotrust.org/where-we-work/zimbabwe
16 Government of Zimbabwe and UNCT Zimbabwe. 2014. Zimbabwe Country Analysis: Working Document. Dated 4 November 2014.
17 Government of Zimbabwe and UNCT Zimbabwe. 2010. Country Analysis Report for Zimbabwe. August 2010.
18 Government of Zimbabwe, Zimbabwe Anthrax Control Guidelines in Humans and Animals, May 2012
19 World Health Organisation, Cholera in Zimbabwe, 02 December 2008, http://www.who.int/csr/don/2008_12_02/en/
20 Rupiya, M (1995). A historical study of land-mines in Zimbabwe, 1963-1995. Zambezia, 22 (1).
21 Mine-Tech, (1994). Zimbabwe Minefields Survey Report, Harare, December 1994
22 Smart Investment to End HIV AIDS in Zimbabwe based on Hotspot Analysis, UNAIDS 2015.

Mapping of Selected Hazards Affecting Rural Livelihoods in Zimbabwe - A District and Ward Analysis
66 | P a g e
Photography
Credit Page
UNDP Cover Photo, 15
FAO 18, 21, 30, 33, 36, 39
The Herald 24
HALO Trust 27
Samaritan's Purse 45