Embed Size (px)
Citation preview
Mapping of selected markets with Nodal pricing or similar systemsAustralia, New Zealand and North American power marketsVivi Mathiesen (Ed.)
RE
PO
RT
22011

Mapping of selected markets with Nodal pricing or similar systems
Australia, New Zealand and North American power markets
Norwegian Water Resources and Energy Directorate 2011
Report no. 2 – 2011
Published by: Norwegian Water Resources and Energy Directorate
Editor: Vivi Mathiesen
Authors: Finn Erik Pettersen, Lars Ekern, Vegard Willumsen
Print: Norwegian Water Resources and Energy Directorate Number printed: 100
Cover photo:
ISSN: 1502-3540
ISBN: 978-82-410-0742-2 Abstract:
Key words: Congestion management, market design, nodal pricing, zonal pricing, central market based dispatch
Norwegian Water Resources and Energy Directorate Middelthunsgate 29 P.O. Box 5091 Majorstua N 0301 OSLO NORWAY Telephone: +47 22 95 95 95 Fax: +47 22 95 90 00 E-mail: [email protected] Internet: www.nve.no February 2011
Contents Preface ................................................................................................. 5
Summary ............................................................................................. 6
1 Introduction ................................................................................... 7 1.1 Background ...................................................................................... 7 1.2 Key terminology ............................................................................... 8 1.3 Structure of report ............................................................................ 9
2 Findings ....................................................................................... 10 2.1 Detailed representation of the network .......................................... 10 2.2 Zonal versus nodal prices .............................................................. 10
2.2.1 Zonal market in Australia, zonal retail markets in USA ......... 11 2.2.2 Fully nodal in New Zealand ................................................... 12
2.3 Risk management .......................................................................... 12 2.3.1 Liquid financial markets in Australia and North America ....... 13 2.3.2 Physical hedging in New Zealand ......................................... 13 2.3.3 Transmission rights and financial trading in US .................... 14
2.4 System operation versus system planning ..................................... 14
3 Australia ...................................................................................... 15 3.1 Brief history and background ......................................................... 15 3.2 Regulation and governance ........................................................... 16 3.3 Responsibilities – market and system ............................................ 16 3.4 The wholesale market .................................................................... 16
3.4.1 Market structure .................................................................... 17 3.4.2 Bidding .................................................................................. 17 3.4.3 Pricing ................................................................................... 17 3.4.4 Settlement ............................................................................. 18 3.4.5 Prices and hedging................................................................ 18
3.5 Ancillary services ........................................................................... 19
4 New Zealand ................................................................................ 20 4.1 Brief history and background ......................................................... 20 4.2 Regulation and governance ........................................................... 23 4.3 Responsibilities – market and system ............................................ 24 4.4 The wholesale market .................................................................... 24
4.4.1 Market structure .................................................................... 25 4.4.2 Requirements for bidding ...................................................... 25 4.4.3 Pricing ................................................................................... 25 4.4.4 Settlement ............................................................................. 26
4.5 Prices and hedging ........................................................................ 26 4.6 Ancillary services ........................................................................... 27
5 North America ............................................................................. 29 5.1 Brief history and background ......................................................... 29
5.1.1 Regulation and governance .................................................. 30
5.1.2 Responsibilities – market and system .................................. 31 5.2 The wholesale market ................................................................... 31
5.2.1 Market structure .................................................................... 31 5.2.2 Requirements for bidding ..................................................... 31 5.2.3 Sequence of bidding ............................................................. 33 5.2.4 Pricing ................................................................................... 33 5.2.5 Settlement ............................................................................ 34 5.2.6 GNP – zonal pricing of load .................................................. 34
5.3 Prices and hedging ........................................................................ 35 5.3.1 Price development and price differences ............................. 35 5.3.2 Hedging opportunities ........................................................... 36 5.3.3 Hedging instruments ............................................................. 36 5.3.4 Trading hubs ......................................................................... 37 5.3.5 Financial Transmission Rights (FTRs) ................................. 37 5.3.6 Hedging and liquidity ............................................................ 37
5.4 Market power and market monitoring ............................................ 38 5.5 ERCOT transition to a nodal market .............................................. 39
6 Conclusions ................................................................................ 41 6.1.1 Zonal versus nodal prices ..................................................... 41 6.1.2 Zonal market in Australia, zonal retail markets in USA ........ 41 6.1.3 Different solutions to risk management ................................ 41 6.1.4 Different underlying characteristics ...................................... 42 6.1.5 Further work ......................................................................... 42
Disclaimer ...........................................................................................43

6
Summary This report shows that the principals of nodal pricing can be implemented in different ways. A common denominator for markets with nodal pricing is a central market based nodal dispatch, where prices and flows are determined simultaneously close to real time. This stands apart from the European market design, which is based on a highly simplified version of the grid, and a physical point auction day ahead. Congestion management is handled by the TSO during the operational hour and not through the market as is the case in nodal pricing systems. Nodal pricing yields optimal dispatch and congestion management through the market, and as such an optimal utilisation of energy generation and network.
However, whether this short term optimisation delivers the highest overall efficiency for the market in terms of competition in the wholesale and retail market, price discovery, possibilities for hedging, long term price signals etc. is difficult to determine. The markets investigated handle issues such as market power, risk management, investment signals and retail markets in very different ways.
New Zealand and PJM are examples of markets with full nodal pricing, i.e. both generators and the demand side are exposed to nodal prices. The PJM market has more “additional features” than the New Zealand market. Examples of these are separate capacity market to trigger investments in generation and generator price caps to deal with situations of market power. In addition PJM offers liquid and mature markets for risk management, such as aggregates of nodes where market participant can chose to be settled (rather than to be settled directly at the node). A general finding though, seems to be that risk management at peripheral nodes is challenging in nodal markets, particularly for independent retailers. In New Zealand generators and retailers were permitted to “re-integrate” in order to cope with the nodal prices.
The Australian market has central market based nodal dispatch, but generators and demand are settled at a zonal price, as such it is a zonal market. On the one hand this seems to allow for easier risk management for the market participants, but on the other hand there is an efficiency loss in that market participants are settled at a different price to what they are dispatched at.
Whether the efficiency of nodal pricing offers overall efficiency of the markets has not been possible to determine though this mapping exercise. However, the findings may offer some useful insight into how nodal pricing systems can be implemented in different ways.
7
1 Introduction 1.1 Background During the first half of the congestion management project, the project group looked at the current Nordic market design with respect to finding possible ways of improving the efficiency of the Nordic congestion management.
The current Nordic market model is based on a simplified representation of the transmission network and does not take into account the physical laws of electricity when calculating prices and flows. To make sure that the actual power flows are within proper safety limits, the TSO both determines ex ante trading capacities between market areas and use counter trade during the operation phase. A system with nodal pricing combines these steps by implementing a detailed network model, taking the actual location of supply and demand into account in the algorithm that determines market prices.
The motivation for this report is to gain a better understanding of the practical implementation and functioning of markets which have implemented nodal pricing or similar systems.
In addition to this empirical study, there is an external project given to SNF, where a simulation model with a detailed model of the Norwegian transmission network is used to analyse consequences of implementing nodal pricing in the Norwegian system. The results of this analysis are planned published second quarter 2011.
There are several markets outside Europe that in different ways and in different degrees have implemented nodal market design. This report gives an overview of the following electricity markets
New Zealand Electricity Market (NZEM)
Australian National Energy Market (NEM)
Pennsylvania, New Jersey and Maryland (PJM)
Mid West ISO (MISO)
New York ISO
There is also a brief mention of the ERCOT (Texas) market, which changed from zonal to nodal market design 1 December 2010.
Common denominators for these markets are that they are based on central market based dispatch and that energy is traded close to real time. For the US and New Zealand markets, generators bids are submitted at nodes in the network, whereas the Australian market is zonal.
8
During the work with this report NVE has had the opportunity to interview stakeholders and regulators in the different markets, and also a stakeholder in the Irish electricity market where nodal pricing was planned but abandoned1.
1.2 Key terminology The markets investigated for this report are all characterized by central market based nodal dispatch, which entails a simultaneous setting of price and flow. The markets also have in common that the trade takes place close to real time. The markets are typically mandatory and thus generators’ bids submitted to the market and generators’ production plans are basically the same.
In the Norwegian (and Nordic and European) electricity markets there is only a loose link between bids to the market place, which is typically a voluntary day ahead market, and production plans which are submitted to the system operator after the market is cleared. Further, available transmission capacity is published to the market in advance of the bidding, i.e. trading capacities on interconnectors are determined separately from the market.2 The Norwegian / European market design uses three steps for determining trading capacity, clearing the market and determining dispatch (based on production plans). In a central market based dispatch these steps are solved in one step.
Nodal pricing, also known as locational marginal pricing (LMP), is a form of central market based dispatch. Within a nodal system market actors submit their bids at the node where they are located, such that a price is set for each node. In case of congestions between nodes, prices at nodes will vary.
Markets with central market based dispatch are also referred to as integrated markets meaning that the real time and day ahead markets are integrated. As the market is cleared near real time, this gives to opportunity to dispatch ancillary services within the market. Thus there is no need for a separate balancing market which is the case in Nordic and European market design.
Central market based dispatch and nodal pricing connects the physical system directly to the market such that congestions are solved within the market. In most European markets, on the other hand, congestion management is based on TSO countertrading and redispatching during the operational hour to deal with internal congestions. The Nordic, and indeed the Norwegian markets are in between these systems since constraints between elspot areas (zones) are taken into account in the price setting, but there nevertheless a weak link between the physical system and the market, and countertrading is used.
1 The Irish authorities had planned implementation of nodal pricing in 2005, but abandoned these
plans in favour of a “one zone market” after pressure from market stakeholders. 2 This may raise competition issues where generators with portfolio covering more than one price
area may have incentive to deviate from marginal cost in their bidding in order to congest lines.
9
1.3 Structure of report The report is structured such that the markets are addressed one by one through a set of topics. The Australian market, then the New Zealand market, and last but not least the North American markets. The report goes through a brief background and history of the markets, then the structure and responsibility in terms of regulation and oversight. The main part of this mapping exercise is to give a good overview of how the wholesale markets are organised. Other markets, such as markets for hedging, ancillary services and capacity are also addressed where that is relevant.
In addition to the summary at the end there is a key findings chapter that pulls out some of the most important results from the interviews and mapping exercise.
The information complied in this report has been found mostly by web search, and in part by contacting actors directly per phone or email (e.g. this was done for AEMO, the Australian market operator). In the case of the US markets, NVE had the opportunity to visit the institutions, PJM; NYISO, the respective market monitoring units, the Federal Energy Regulatory Commission (FERC), and an energy service company (Gateway) for in-depth interviews. NVE also had the opportunity to interview two representatives from a large generator in New Zealand (Mighty River Power) when they visited Oslo. NVE also spoke to representatives from the Irish market where nodal pricing was due to be implemented in 2005, but the process reversed.
The sources of information are listed in the footnotes. However the institutions and interviewees are not responsible for the accuracy of this report. The views in this report are not necessarily the views of NVE.
10
2 Findings This chapter presents key findings. Central market based dispatch, and in particular nodal pricing, yields optimal use of generation and network resources through a real time market. The markets in this report also deliver fine time intervals for the market, e.g. there are prices at each node every five minutes or per half hour, whereas the Nordic market has hourly settlement after a day ahead auction. A question raised here is whether this nodal optimisation in real time delivers a more efficient market overall.3
In general this study has shown that the principles of nodal pricing can be implemented in different ways. The essential characteristic of nodal pricing is to take into account a load flow calculation in the optimisation that determines prices of each location as defined by a network model.
2.1 Detailed representation of the network A common feature of all the markets studied in this report, is that the model of the transmission network used in the price calculation is specified for a large number of grid points down to very low voltage levels of the grid. A DC model is used in the clearing, determining locational prices and losses. A detailed representation of the grid may be necessary to get a sufficiently correct load flow calculation and properly take into account security constraints of the grid.
2.2 Zonal versus nodal prices A key difference between nodal and zonal pricing is that a nodal system delivers prices and dispatch at the nodes, whereas zonal prices are aggregates or based on marginal bid in that zone. Another key feature of nodal pricing is that typically nodal prices become higher the further away from demand the generation is located, and in most of the systems losses are incorporated as part of the nodal price. Price signals are “sharper” in a nodal than in a zonal system.
Findings from New Zealand, which is fully nodal, show some occurrences of extreme locational volatility (large variation in price of a node in isolation from other nodes), which is different to general price volatility that can be seen in zonal and nodal markets alike. Whether this experience of locational volatility is transferrable to Norway if Norway were to implement nodal pricing is an open question.
To the extent that nodal prices reflect the true scarcity at each point of time and ensures that demand is met at least cost, nodal pricing is the most efficient system for the hour to hour dispatch. The short term efficiency relies on market players bidding the true marginal cost of production or willingness to pay. In a hydro system the bids of producers should depend on expectation of future prices which determine the value of storage. If the
3 Another discussion is if an “energy only” market can deliver sufficient generation capacity for
peak events. Several of the US markets have a separate capacity markets to ensure sufficient
capacity for peak load situations, and the regulator in New Zealand is considering introducing a
scarcity pricing mechanism to encourage peak load.
11
volatility of prices is substantial at certain nodes and future prices are hard to predict, it may be difficult to determine reasonable water values.
An intuitively reasonable argument is that short term (dispatch) locational price signals should translate into longer term locational signals driving investment - for example, causing generation to locate in a high priced area, and promoting network investment to alleviate grid constraints. However, there are typically many other locational factors in addition to the short run nodal prices that are important drivers for investments, and in many cases may significantly outweigh any nodal price signal. Availability of resources (fuel and land) and political guidelines for e.g. renewable energy are among these factors. Availability of fuel and also the so-called NIMBY-effect often place new generation away from demand centers. These factors may override the locational signals from the nodal price4. It is therefore difficult to say whether a nodal system actually leads to more “correctly” located investments in generation and network5 than a zonal system, and implies the concept of "correctly" located investments is somewhat more complex and subtle than a simple reading of the nodal price signal would suggest.
Interestingly, nodal pricing markets such as the PJM have additional support mechanisms6 to encourage investments, implying that at least these implementations of nodal pricing have not historically provided sufficient investment signals.
More correct price signals in the short term should imply more correct price signals in the long term. The signals from electricity prices in a nodal system shall give locational signals for investment, so that e.g. generation can locate in a high price area and network can be built where there are constraints. However, there are typically many other locational factors in addition to the short run nodal prices that are important drivers for investments. Availability of resources (fuel and land) and political guidelines for e.g. renewable energy are among these factors. Availability of fuel and also the so-called NIMBY-effect often place new generation away from demand centres. These factors may override the locational signals from the nodal price It is therefore difficult to say whether a nodal system actually leads to more “correctly” located investments in generation and networkthan a zonal system
2.2.1 Zonal market in Australia, zonal retail markets in USA Australia is a fully zonal market, which means that both generators and retailers are settled at a zonal price. Several of the North American markets have so-called generator nodal pricing (GNP), which means that generators are settled at nodal prices, but the demand side is settled on a zonal price.
The NYISO (New York) and NE-ISO (New England) markets in the US have implemented a zonal simplification on the demand side where retailers and large
4 Migliavacca (2004) points out locational factors such as access to fuel and environmental
regulations that can undermine the effectiveness of transmission related locational signals
themselves. 5 Perez et al. (2008) point out that short run locational signal from nodal pricing is insufficient to
recover fixed cost of transmission, and also that nodal pricing per se does not give sufficient
signals to coordinate generation and transmission investment. 6 PJM and New England have separate capacity markets to ensure investments in peak capacity.
12
consumers submit bids into predefined load zones and are settled to load zone prices, while generators bid and are settled on nodes. The entire load is distributed to the nodes of the load zones and prices of all nodes are calculated. The load zone price is a weighted average of the nodal prices within the load zone where total load of each node serve as weights.
Such a zonal approach on the demand side yields more simplicity for the retail market, and the zones may also facilitate competition since there typically will be more participants within a zone that at a single node. Further, a zonal approach may also have positive implications with regard to liquidity within each price zone and consequently serves a more robust reference price for financial markets and hedging instruments.
To the extent that load is highly price independent in the short term, the loss of efficiency with respect to load zones is mainly related to the long term where end-users located in more high priced nodes do not get the (correct nodal) price signals to invest in energy saving measures. Often it is political issues that are behind a simplification of the demand side. E.g. the fact that nodal pricing can be combined with a zonal simplification for load has been important for introducing nodal pricing in Texas.
The arguments for introducing zones on the demand side, i.e. predictability, simplicity and a robust reference price for hedging, could also apply to the generator side however generation is thought to have higher ability to react to price signals.
2.2.2 Fully nodal in New Zealand Whereas the Australian and several North American markets are fully zonal or have zones on the demand side respectively, the New Zealand market is fully nodal. This means that both generators and retailers are settled at the nodal price. However 95 % of customers are on fixed price contracts, and this poses some risk challenges to independent retailers.
To handle their risk, many retailers are vertically integrated “gentailers”, by securing retail customers close to their generation. This has led to market situation with several integrated generators / retailers that effectively have regional monopolies on supply in their area.
NVE has not found a market where small and medium sizes consumers are exposed to nodal prices.
2.3 Risk management Predictability and stability are important aspects for market actors, whether they are already in the market or consider entry into the market. Faced with volatile prices market participants require the opportunity to manage their risk. There is a socioeconomic benefit provided by participants being able to offload their risk on parties better able to handle risk (lower cost of capital).
Prices and risk are closely related. Basis risk on the prices themselves is a key issue, i.e. the risk created by the difference between the node (or zone) of exposure and the price defined within a hedging instrument. There are other risks that an actor is faced with, e.g. counter party risk (the possibility to find a solid counterparty to trade with); additional
13
risks include such things as personnel risk (that a company has the right staff able to understand and act in the market). In markets with high complexity and low liquidity, risk management is even more challenging.
Liquidity in varying products and regions in a market is crucial to enable the closing of decisions and therefore manageable risk exposure. Liquidity in hedging products is important for investors in order to be able to manage as many risk factors as possible.
A liquid market for risk management should be expected to deliver a higher socio economic benefit than if that market did not exist and actors have to resort to other less efficient methods such as purely physical hedging.
Generators and retailers face different distribution of risk. Whereas a generators risk is “capped” downwards at a price of zero, the price risk facing a retailer is that the price can become a multiple of the marginal cost of the most expensive generator. If the retailer has to purchase power in the wholesale market (i.e. is not hedged), that level of prices could bankrupt a retailer within hours.
Many of these considerations are true for all market designs, the question, which is difficult to answer, is whether nodal pricing gives better predictability or higher volatility of prices, and whether the increased complexity nodal pricing is manageable.
In Ireland the perception of risk was the main reason why nodal pricing was rejected. The price picture in a nodal market was considered too uncertain and thus too risky. Market participants reported that they had problems finding banks that would lend money for investment in generation assets, and also suppliers were worried about how to handle the basis risk (exposure to uncertain prices) in a nodal pricing market. Since the Irish nodal pricing was never implemented this reservation is hypothetical, but nevertheless an interesting observation.
The markets in this report offer significantly different solutions for hedging price risk.
2.3.1 Liquid financial markets in Australia and North America In Australia there is a liquid financial market that offers a range of forward contracts on area prices and differences between these. In addition there are liquid markets for various products in bilateral trade, such as contracts for differences between zones. There are no transmission rights, neither physical nor financial in the Australian market.
In the North American markets there are several examples of liquid financial market for energy hedging instruments, and physical hubs consisting of several nodes, which delivers robust reference prices for the hedging market.
2.3.2 Physical hedging in New Zealand In New Zealand there were for a long time no organised markets for long term financial hedging. There are also no physical or financial transmission rights in this market. After the reform with nodal pricing, companies were allowed to re-integrate, i.e. generation and retail in one company. As such most of the hedging is physical, and a large proportion of the market is hedged through company internal portfolios (vertically integrated companies).
14
Several generators and gentailers have bilateral inter-generator swaps between generators in different regions. Thus there is limited volume in the market that would be “interested in” financial hedging instruments.
There are 2-3 nodes that have sufficient liquidity to trade; in the rest of the market liquidity is so limited that it is a challenge for small independent generators or retailers to enter the market or new regions. It is difficult for small market participants in the regions (outside the 2-3 liquid nodes) to find a counterparty for hedging.
Recently (late 2010) the electricity industry In New Zealand established a forward / futures trading mechanism which trades of the Australian Stock Exchange. This is an organised market for financial products which enables market participants to hedge their positions.
2.3.3 Transmission rights and financial trading in US In North America, the PJM market has liquid price hubs which consists of several nodes, i.e. the prices at each node are aggregated into price zones where market actors sell and buy electricity. These represent robust reference prices for financial instruments for hedging. In addition several of the US markets feature Financial Transmission Rights (FTR), which allow market participants to hedge their positions.
2.4 System operation versus system planning The markets in North America are organized with ISO (independent system operator) which is in most cases also the market operator (MO), but not the transmission system owner. In Australia and New Zealand there are TSOs, which both own and operate the system, the same as in Norway (and Europe).
The owner of the system may have other incentives than the operator of the system, in particular if the system operator also operates the market. There could be conflicting interest between protecting and maintaining the assets for the longer term on the one hand, and maximizing available capacity to the market on the other.
This raises the question of regulation of the system operator and incentives for real time optimization versus long term planning.
15
3 Australia 3.1 Brief history and background The National Electricity Market (NEM) in Australia was established in 1998, by integrating previously state based electricity systems. There was typically little congestion within these systems but weak interconnections between them, and hence the NEM regions that were created largely map onto each of the participating states, Queensland, New South Wales, Victoria, Tasmania and South Australia. New South Wales is the largest region in terms of electricity volume with over 35 % of the total consumption (2007-2008). Victoria and Queensland have 26 and 28 % respectively of the total consumption.
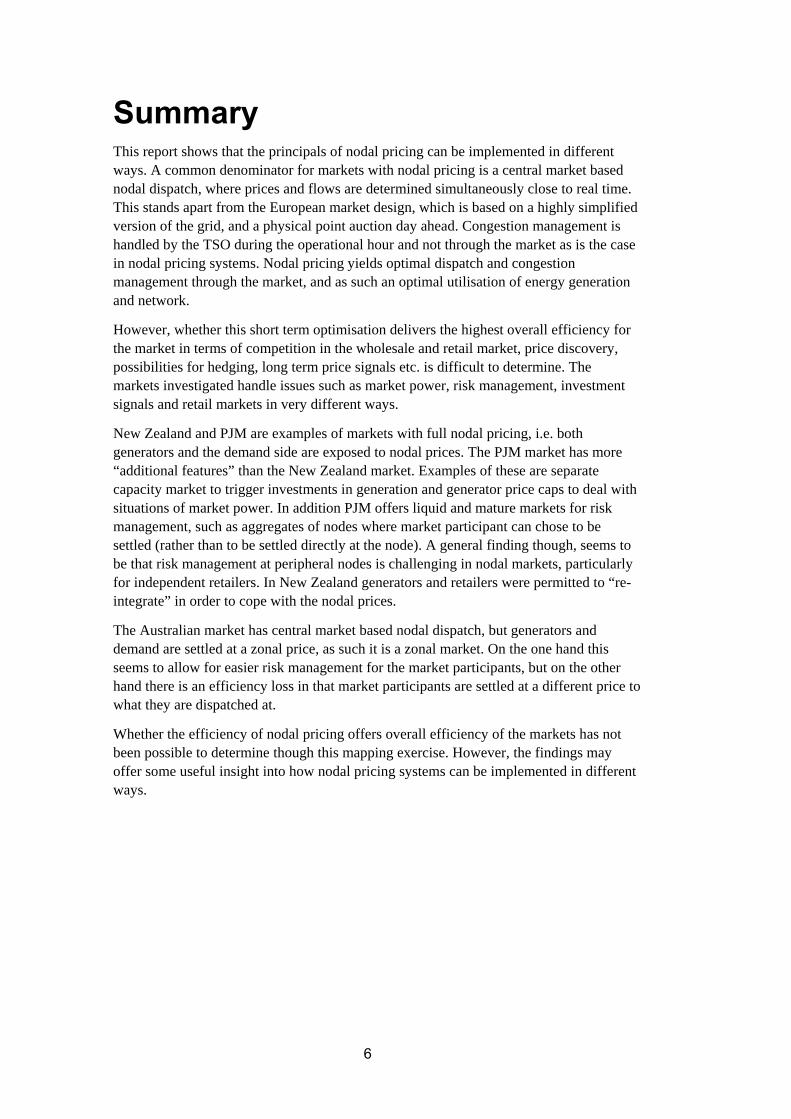
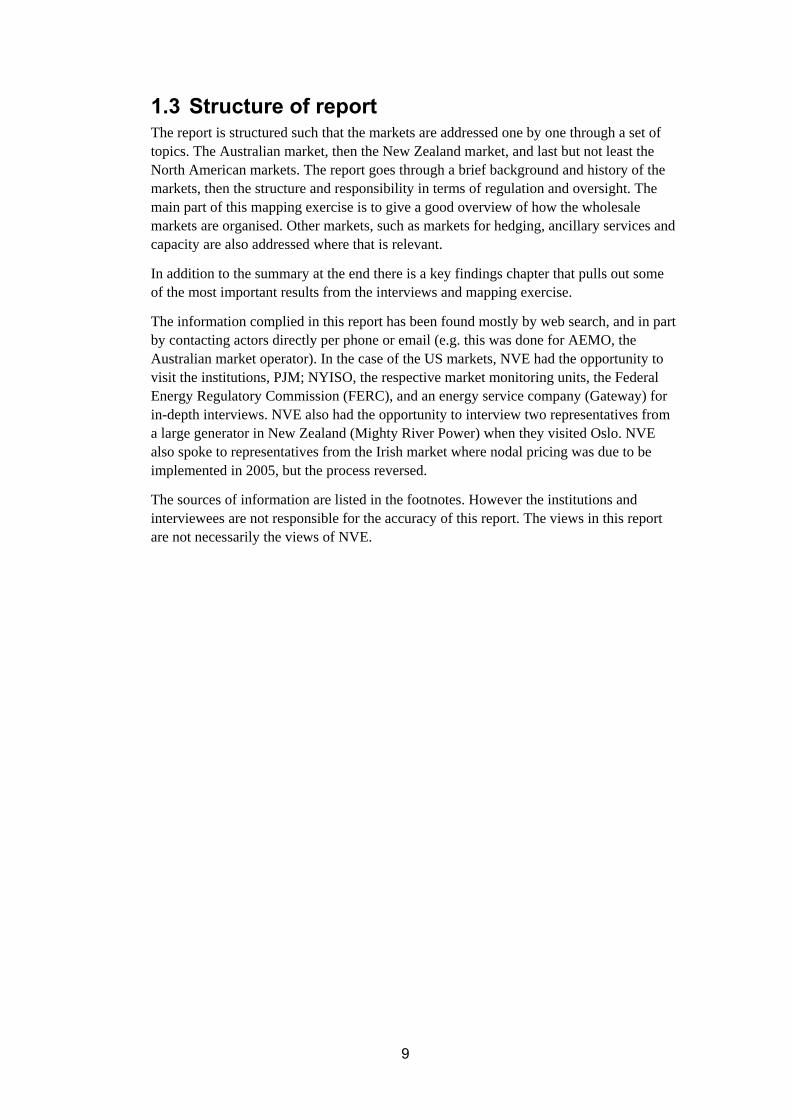
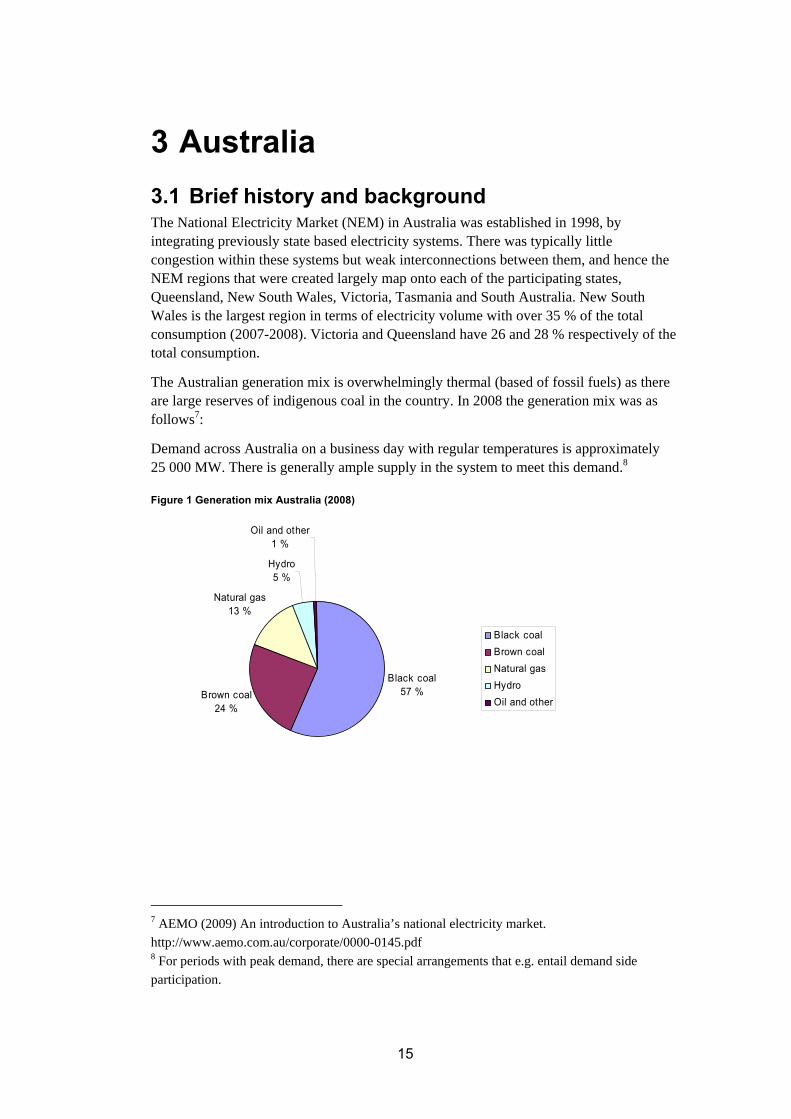
The Australian generation mix is overwhelmingly thermal (based of fossil fuels) as there are large reserves of indigenous coal in the country. In 2008 the generation mix was as follows7:
Demand across Australia on a business day with regular temperatures is approximately 25 000 MW. There is generally ample supply in the system to meet this demand.8
Figure 1 Generation mix Australia (2008)
Black coal57 %Brown coal
24 %
Natural gas13 %
Hydro5 %
Oil and other1 %
Black coalBrown coalNatural gasHydroOil and other
7 AEMO (2009) An introduction to Australia’s national electricity market.
http://www.aemo.com.au/corporate/0000-0145.pdf 8 For periods with peak demand, there are special arrangements that e.g. entail demand side
participation.
16
3.2 Regulation and governance The Australian Energy Market Commission (AEMC) determines policy and governance structures, shapes development of the Australian energy market, and sets requirements and obligation for market parties. The AEMC is responsible to the Council of Australian Governments through the MCE.
AER, the Australian Energy Regulator, which is a constituent of the Australian Competition and Consumer Commission, is responsible for economic regulation and compliance with the National Electricity Law and Rules and the National Gas Law and Rules.
AEMO, the Australian Energy Market Operator operates the market central dispatch and settlement, as well as being responsible for interpreting and applying energy market rules and for satisfying operational performance requirements set out in those rules.
AEMO is governed by a Board, whose main governance responsibilities are to ensure integrity of market transactions, predictability and transparency of decision making and full representation of relevant parties in the on-going process of market development. Extensive involvement by market participants through advisory committees and consultation processes ensure that governance issues are quickly identified and resolved in ways that reflect the long term interests of Australian energy consumers.9
The national electricity rules, often referred to as The Rules, lay down the mandate for AEMO.
3.3 Responsibilities – market and system The Australian Energy Market Operator (AEMO) is responsible for central dispatch and settlement. This includes management of bidding, scheduling and dispatching generation, determining a spot price, measuring electricity use and financial settlement of the market. In addition AEMO is responsible for managing the security of power system.
AEMO is also responsible for planning investments and development of the transmission network in Australia.
3.4 The wholesale market In NEM, wholesale trading is conducted as a spot market through a centrally coordinated dispatch where supply and demand are instantaneously matched in real time. Australia does not apply nodal pricing since prices are averaged into regional prices. However for the purposes of this report (to investigate market models that seem efficient), the Australian market is interesting. There are similarities to nodal pricing, e.g. an underlying network model and a central nodal dispatch close to real time.
The network model that is used, is a model based on constraint equations to determine dispatch. As such, constraints are implied rather than modelled explicitly.
9 Source AEMO: http://www.aemo.com.au/aboutaemo.html
17
3.4.1 Market structure The Australian market is divided into five regional markets with little congestion within each region but relatively weak interconnections between regions.
3.4.2 Bidding There are very few demand bids in NEM – only a few very large loads. The price is set virtually in real time – AEMO set the price to meet the demand that is forecast 5 minutes in the future. Therefore, this forecast is based very substantially on the prevailing level of demand.
Forecast demand profiles typically use actual measured demands as a template, with appropriate adjustments to suit the period under forecast.
The demand forecast is a five-minute demand adjustment that attempts to relate the demand at the beginning of the dispatch interval (initial supply) to the target at the end (cleared supply). This is updated every five minutes for each dispatch interval and reported to the market participants.
In the case where peak demand is expected (typically short term during summer months), it is met by a combination of generators that have been specifically built to service peak demand, and demand side participation where consumers voluntarily and temporarily withdraw from the market when the spot price reaches a pre-defined threshold level.
On the supply side there are three types of bids – daily bids, re-bids and default bids. Daily bids are submitted before 12:30 p.m. the day ahead of delivery. These bids are reflected in pre-dispatch forecasts. Generators may submit re-bid up until approximately 5 minutes before dispatch. They may then change volume, but not the offer price.10 Default bids are standing bids that apply in the case where no daily offer has been submitted.
Bids are submitted at each network node for every 5 minutes of the day (24 hours). Trading intervals are every 30 minutes, i.e. the six dispatch prices within each half hour are averaged to the half hourly price for the trading interval.
A trading day in the Australian power market is as follows:
00:00 start / end of settlement day
04:00 trading day starts / ends
12:30 deadline for daily bids for next trading day (re-bids can be submitted until 5 mins before dispatch)
Within each trading hour, AEMO publishes a pre-dispatch forecast each half hour. Dispatch takes place every five minutes (288 per day).
3.4.3 Pricing A dispatch price is determined every 5 minutes; six dispatch prices are averaged every half hour to determine the spot price for each trading interval – for each of the regions. 10 AEMO (2009) An introduction to Australia’s national electricity market.
http://www.aemo.com.au/corporate/0000-0145.pdf
18
Generators in Australia are settled against the regional reference price (RRP) each half hour. The RRP is set at the marginal cost of supplying an additional MWh at a regional reference node (RRN), which is normally located in or near the largest demand centre in the region.
Although generator bids are referenced to particular nodes, this is mainly to ensure that the appropriate fixed loss factor is used to scale the generator's output at the Regional Reference Node (RRN), which is used for settlement at the zonal level.
3.4.4 Settlement Generators bids are referenced to participator nodes in the network, in order to ensure the appropriate fixed loss factor to scale the generator’s output at the Regional Reference Node (RRN). The generators are settled against the Regional Reference Price (RRP).
There is a preliminary settlement 1 week Settlement Preliminary settlement 1 week after billing period ends. Final settlement takes place 1 month after. There is a 20 week and 30 week revised statement.
3.4.5 Prices and hedging A generator is settled against the RRP which may differ from the marginal price that generator faces at the node where it is located. This is a form of price risk, and may lead generators to submit bids that deviate from marginal costs (disorderly bidding).
In connection with Congestion Management Review in 200811 it was considered to introduce generator nodal pricing (GNP) i.e. that generators were settled against the nodal price at the node to which they submit their bids, but to keep zonal settlement for demand. It was considered that GNP would resolve so-called disorderly bidding, and that it would contribute to better locational price signals to generators, and thus better signals for planning and investments. However, the review concluded not to introduce GNP for the time being, i.a due to relatively low amount of disorderly bidding and loactional decision problem being modest and the significant change to the system an introduction of GNP would entail.
The Australian market has a so-called “open access” transmission regime, i.e. a generators “right” to use the transmission network depends on whether it is dispatched by AEMO or not. Transmission right, such as auctioned or firm transmission rights, as they are known from European markets are not a part of the Australian market. An introduction of such transmission rights would mean a significant shift in the market design.
In the Congestion Management Review (2008) allocation of financial access rights, for risk management, was listed as one of several issues to be considered at a later stage in light of the Australian Government’s climate change agenda.
Price varies between regions when there are congestions, and a market participants who trades across regions may need to hedge the risk associated with regional differing prices
11 Australian Energy Market Commission (2008) Congestion Management Review.
http://www.aemc.gov.au/Market-Reviews/Completed/Congestion-Management-Review.html
19
if that participant is settled against RRP in another region than where it has contractual obligation (e.g. for delivery).
As there is significant volatility in the spot price during trading periods, it is necessary for market participants to be able to manage their risk. There are a range of possible financial contracts available in the bilateral market, which allows participants to lock in a future price, thus reducing exposure to volatile spot prices. Such derivative products can take various forms, e.g. options, futures, swaps. These types of financial hedging contracts are available independently of the AEMO market administration, and are unregulated by the Rules. A typical hedge contract is a bilateral agreement between a generator and a consumer at an agree price.
3.5 Ancillary services It is AEMO’s responsibility to manage the power system safely, securely and reliably. For this purpose AEMO operates eight separate markets for ancillary services. These services maintain key technical characteristics of the system, including standards for frequency, voltage, network loading and system restart processes. Participants in these markets have contracted with AEMO to provide ancillary services. These service providers submit bids in a similar way to generators bidding into the energy market. Payments for ancillary services include payments for availability and for the delivery of the services.
20
4 New Zealand12 4.1 Brief history and background The reformed wholesale electricity market (NZEM) began trading in October 1996: New Zealand was the first country in the world to introduce full nodal pricing. The market is mandatory and all electricity is traded through a central pool, with the exception of small generators with installed capacity below 10 MW.
New Zealand’s total generation capacity is currently around 9 100 MW, with daily peak demand of about 6 500 MW. Total electricity consumption is about 40 TWh/year.
New Zealand has a nodal market with 253 grid points / nodes, with prices at each node. The nodes are at 110 – 220 kV, and down to 66 kV. New Zealand has a primarily radial network with some loops, and a state owned TSO. Three of the five major generators are state-owned, the remaining two are publicly-listed companies.
More than half of New Zealand’s electricity is generated from hydro stations, several of which have storage capacity. Because New Zealand’s storage lakes can only hold enough water for a few weeks of winter energy demand (up to 2 months), hydro generation is very sensitive to the level of inflows from rainfall and snowmelt. In years where inflows are low for a sustained period, alternative generation such as coal and gas is used to fill the place of reduced hydro generation. 13
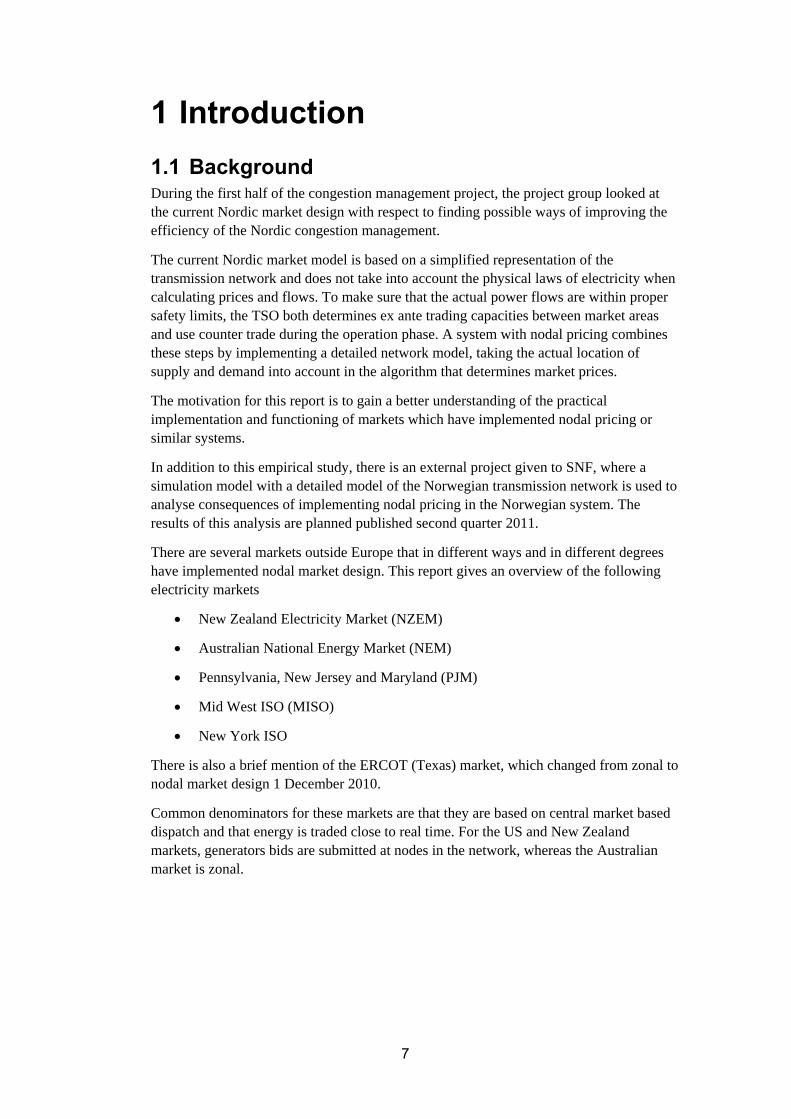
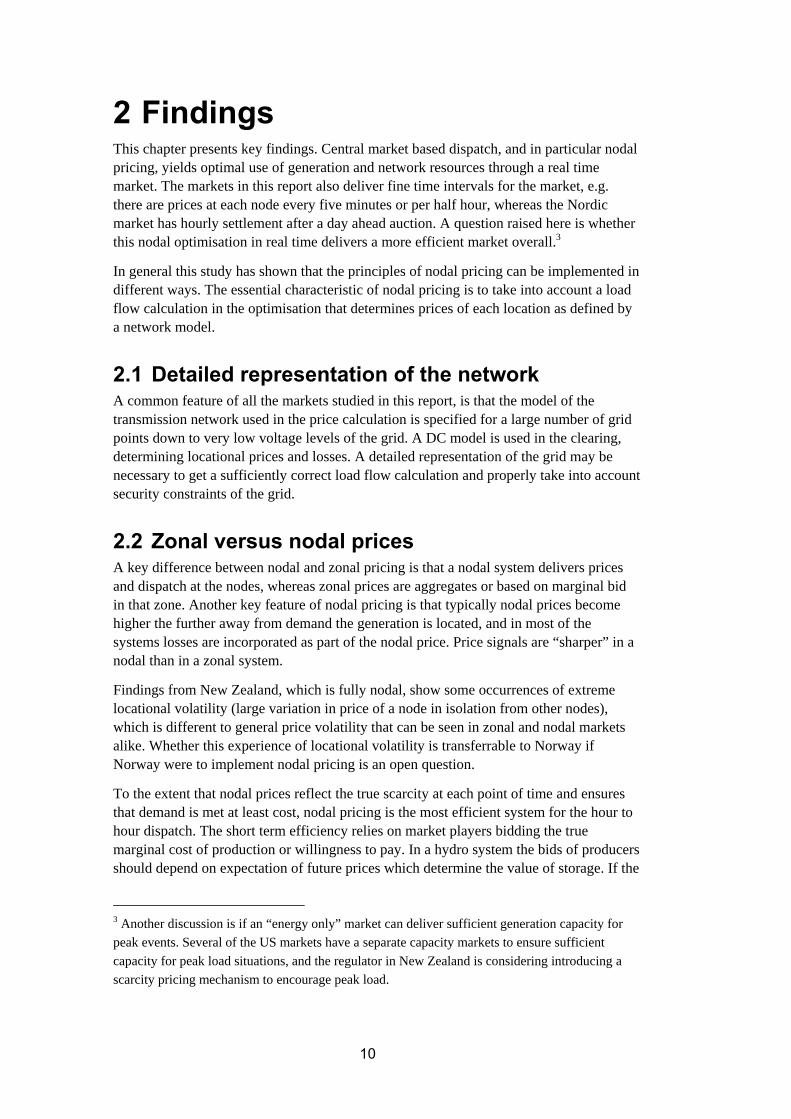
In 2008, one of the driest years on record for the country, just over half of electricity was produced by hydro stations, about a fourth by gas-fired power stations, around ten and nine percent by coal-fired and geothermal power stations respectively, 2.5 percent wind power and 1.5 percent other sources. Hydro contribution has ranged between about 50 and 65 % over the last five years. The country has recently significantly reduced coal generation in favour of geothermal and wind.
12 The project group is grateful to Stephen Batstone of Mighty River Power (New Zealand), who
provided some of the input for this chapter. He is not responsible for any errors or views that may
be presented here.. 13 Source : Electricity Commision http://www.electricitycommission.govt.nz
21
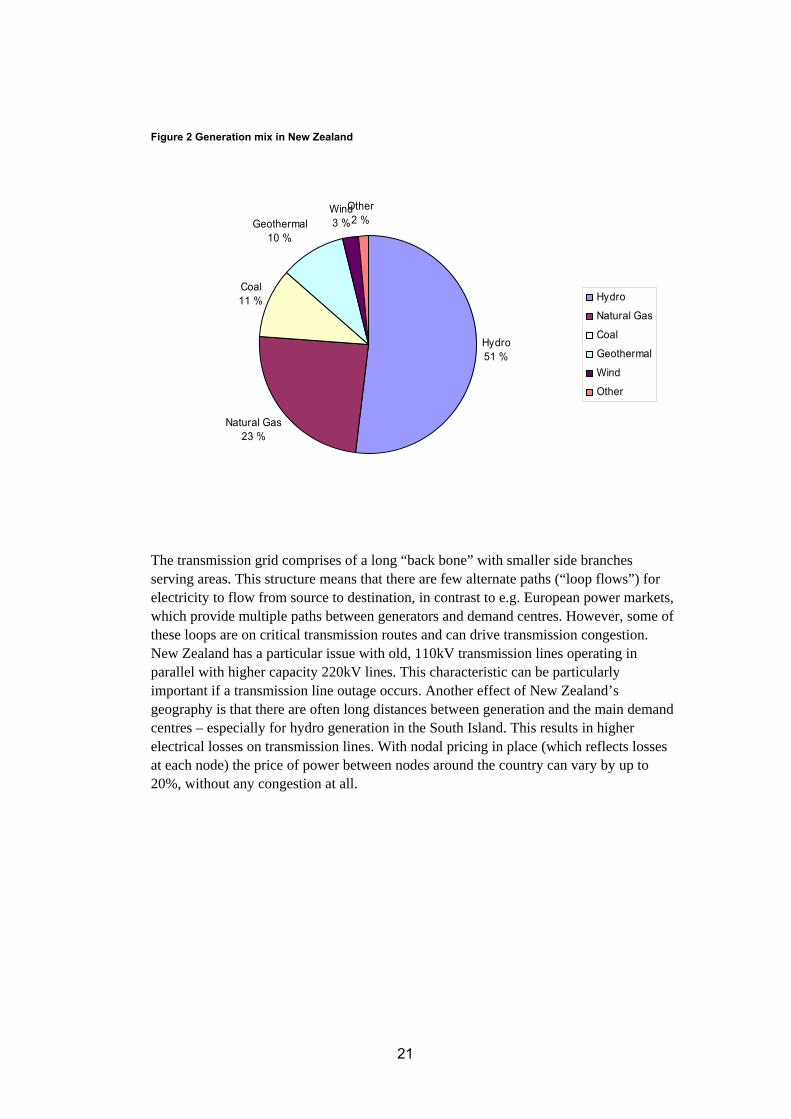
Figure 2 Generation mix in New Zealand
Hydro 51 %
Natural Gas23 %
Coal11 %
Geothermal10 %
Other2 %
Wind3 %
Hydro
Natural Gas
Coal
Geothermal
Wind
Other
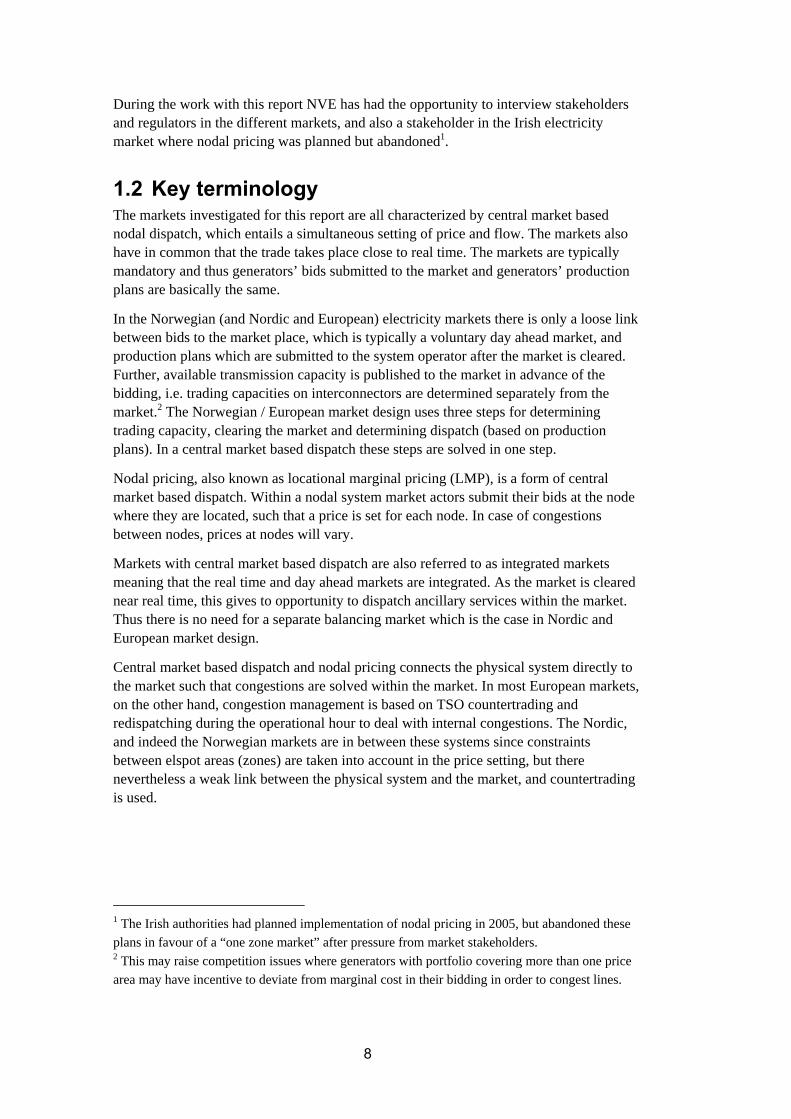
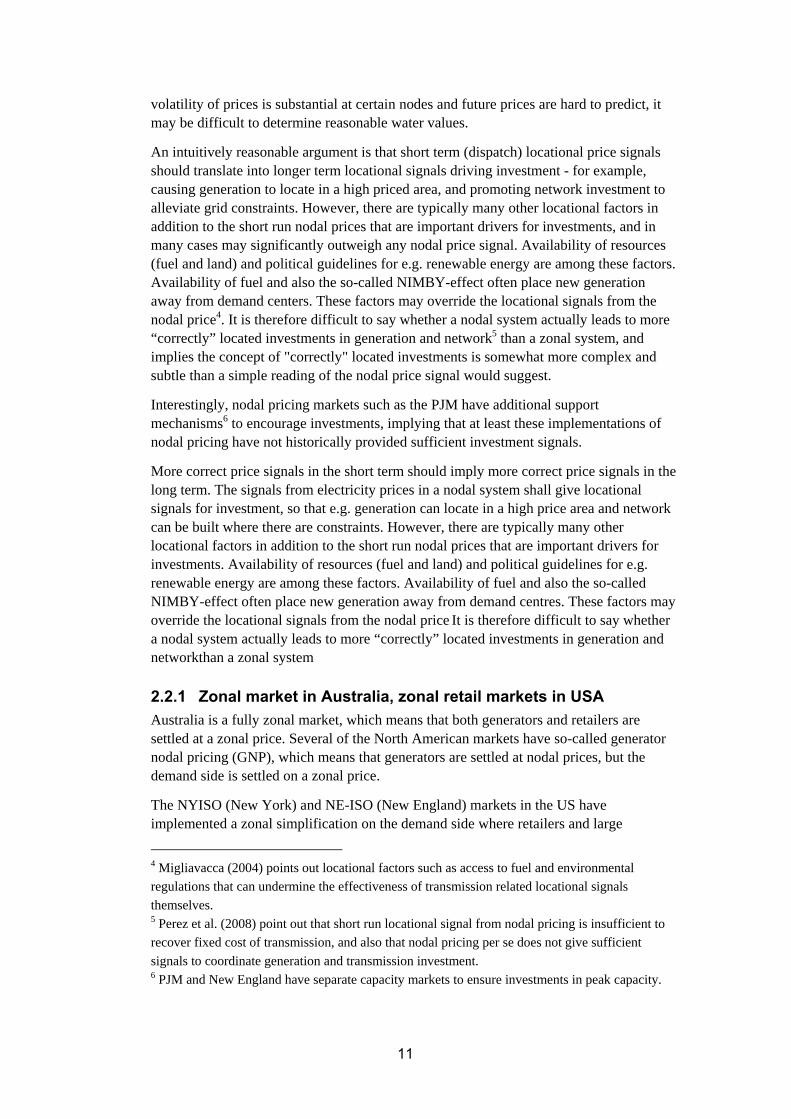
The transmission grid comprises of a long “back bone” with smaller side branches serving areas. This structure means that there are few alternate paths (“loop flows”) for electricity to flow from source to destination, in contrast to e.g. European power markets, which provide multiple paths between generators and demand centres. However, some of these loops are on critical transmission routes and can drive transmission congestion. New Zealand has a particular issue with old, 110kV transmission lines operating in parallel with higher capacity 220kV lines. This characteristic can be particularly important if a transmission line outage occurs. Another effect of New Zealand’s geography is that there are often long distances between generation and the main demand centres – especially for hydro generation in the South Island. This results in higher electrical losses on transmission lines. With nodal pricing in place (which reflects losses at each node) the price of power between nodes around the country can vary by up to 20%, without any congestion at all.
22
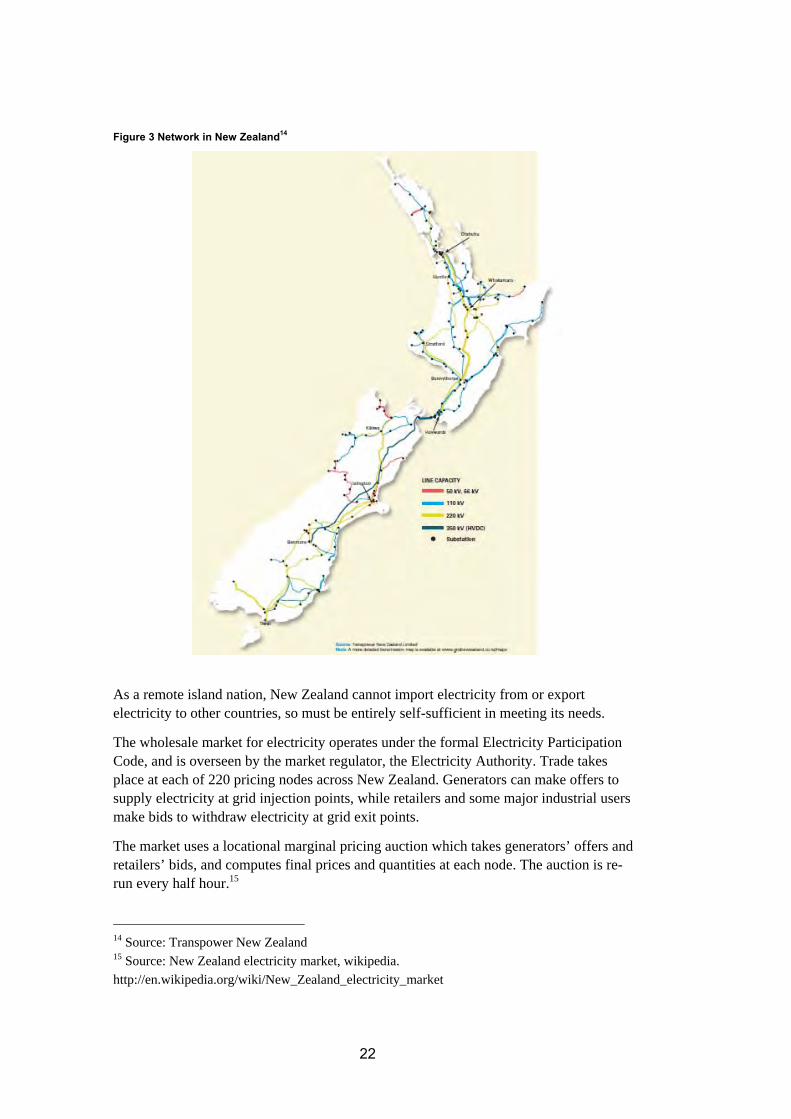
Figure 3 Network in New Zealand14
As a remote island nation, New Zealand cannot import electricity from or export electricity to other countries, so must be entirely self-sufficient in meeting its needs.
The wholesale market for electricity operates under the formal Electricity Participation Code, and is overseen by the market regulator, the Electricity Authority. Trade takes place at each of 220 pricing nodes across New Zealand. Generators can make offers to supply electricity at grid injection points, while retailers and some major industrial users make bids to withdraw electricity at grid exit points.
The market uses a locational marginal pricing auction which takes generators’ offers and retailers’ bids, and computes final prices and quantities at each node. The auction is re-run every half hour.15
14 Source: Transpower New Zealand 15 Source: New Zealand electricity market, wikipedia.
http://en.wikipedia.org/wiki/New_Zealand_electricity_market
23
As of October 2009, there are five major generators in New Zealand. These five together produce about 95 % of New Zealand’s electricity. All the major generators also own retailing arms, and are thus commonly known as "gentailers". There are currently twelve electricity supply companies (including the five gentailers). Not all retailers supply to all locations, and indeed most of the gentailers supply energy in the same area that they have generation. However locational risk remains since generation is dominated by hydro and geothermal which is typically located far away from load centres. Competition for retail customers varies across the country but since 1999, when full retail competition was introduced, customers have switched at a rate between 9 % and 14 % per annum.
4.2 Regulation and governance The New Zealand Electricity Market was previously a self regulated market overseen by M-Co16 and a market surveillance committee. Form 2004 an independent energy market regulator was established; the Electricity Commission. From October 2010 this entity change name to the Electricity Authority 17. The set of rules that govern the New Zealand Electricity Market is known as the Electricity Participation Code. 18
The Electricity Authority is responsible for overseeing New Zealand’s wholesale and retail electricity markets and regulating some aspects of electricity transmission. In addition it is also responsible for operating the electricity system and promoting efficient use of electricity. Further. the Authority is responsible for compliance monitoring with the Rules, and that power system operation remains efficient and relevant. The role includes providing arrangements for protection of consumers, as well as for administering retail market rules such as metering arrangements, customer switching and reconciliation. Approving the transmission pricing methodology – which determines how total transmission charges are divided up among the contracting parties, and the basis for those charges such as their share of peak usage.
Whereas the Commission up until recently focussed primarily on the wholesale market, it is now increasingly looking at the retail market, in particular looking at measures to increase retail market competition. Nearly all (95 %) of household and middle sized customers are on fixed price contracts. Retailers could in principle introduce spot price contracts, but “the customers don’t want it”.
Many companies are vertically integrated and also regionally delineated. This may be a direct cause from market actors attempt at hedging their positions against the volatility and regional variety of nodal prices. These are structural factors that have had a limiting effect on retail market competition; however in a Ministerial Review (2009), some structural changes were imposed in that a power station owned by one state owned company in the South Island was transferred to another, which previously only had generation in the North Island. Thus ensuring that all generators had a proportion og both North and South Island generation.
16 M-co was established in 1993 as a joint venture with the electricity industry. M-Co’d role was to
design, implement and operate a wholesale electricity market in New Zealand. 17 From 31 October – the Electricity Authority http://www.ea.govt.nz/about-us/new-entity/ 18 Source: Electricity Trading in the New Zealand Electricity Market. Genesis Energy
24
4.3 Responsibilities – market and system Wholesale generators submit and revise bids for electricity to the system operator, which is responsible for determining which generators should generate and how much each should produce at every point in time. The system operator is also the market operator.
Grid owners submit and revise information about the capacities and availabilities of their transmission assets to the system operator. Ancillary service agents submit offers to provide reserves to the system operator.
The system operator prepares and publishes the pre-dispatch schedules, prepares and implements the dispatch schedules and prepares and publishes forecast prices, forecast reserve prices, dispatch prices and real time prices using an electronic information system.
The clearing manager holds must-run dispatch auctions. The pricing manager collects data and produces provisional prices and final prices. Participants provide reconciliation information and the reconciliation manager carries out the reconciliation process.19
The objective of the system operator, in deciding how much electricity each generation plant should be scheduled to produce for dispatch into the grid, is to maximise for each half hour the gross economic benefits20 for all purchasers of electricity at the grid exit points less the costs of supplying the electricity at the grid injection points and the costs of ancillary services purchased.
Constraints can change during the operational hour, e.g. that the TSO withdraws capacity from the market- The TSO tends to be conservative, to protect its assets in the operational hour, but this raises the question whether it was “too optimistic” in the planning phase. Changing of constraints makes planning unpredictable for the market participants and poses a risk which is difficult to manage.
4.4 The wholesale market The New Zealand wholesale electricity market is nodal, i.e. generators submit their bids at the node where the generation is fed into the grid. Demand is estimated per node such that a unique supply and demand curve at each node determines the nodal price. Trading takes place through a centrally organized trading platform (WITS), which delivers pricing, scheduling and other market data.
The trading period is half hourly. Information and updates about the market are published every five minutes at the market platform. The system operator uses the bids and offers for supply and demand for scheduling of generation and reserves at five-minute intervals by interpolating the half hourly bids. Schedules are updated and published every trading period (half hour).
Generator offers, other than those for intermittent generators, can contain up to five price bands and can be different for each half hour trading period. Purchaser bids can contain
19 Source: The markets for electricity in New Zealand. Report to the Electricity Commission.
February 2007 20 Within the day this objective is for the TSO to minimise costs.

25
up to 10 price bands for each trading period. In general, generators and purchasers are able to revise or cancel bids and offers up to two hours prior to the beginning of the trading period by submitting a new bid or offer or a notice of cancellation to the system operator. 21
There is a National Reconciliation Manager who reconciles all metered quantities, a Pricing Manager who determines the prices at each node, a Clearing and Settlement Manager who pays generators for their generation at the market clearing price and invoices all retailers for their offtake. The market has 5-minute pricing at nodes, settled on 30 minute basis
There is a day ahead market forecast which offers a national price in order to give an overview for the next day. This is an indicative price, and the results are not binding for the participants. The market parties submit their final bids two hours in advance of the operational hour.
There is limited demand side participation in the wholesale market. Demand is mostly forecast. Rules are due to change next in 2011 in order to encourage demand side participation.
4.4.1 Market structure The New Zealand electricity market is an energy only market with locational marginal pricing. All electricity is required to be traded through a central pool, with the exception of small generating stations of less than 10 MW. Bilateral and other hedge arrangements are possible, but function as separate financial contracts. There is no forward energy market.
4.4.2 Requirements for bidding Trading develops by bids and offers for 48 half hour periods over 220 pricing nodes on the national grid. Bids and offers start 36 hours before the actual real-time dispatch. Up to 4 hours (pre-dispatch) before the real-time dispatch starts a new “forecast price” is calculated to guide participants in the market. From four hours to the start of the trading period every half hour a “dispatch price” is calculated (and communicated) using a statistical forecast of demand rather than bids from electricity retailers. Two hours before the start of the real-time dispatch bids and offers can no longer be revised (with some exceptions) and the new prices reflect TSO's adjustments in load forecasts and system availability.
During each half hour period the TSO publishes a new real-time price every five minutes, and a time-weighted 30-minute average price. The real-time prices are used by some large direct-connect consumers to adapt demand.
4.4.3 Pricing All market clearing is performed using a full nodal model with a DC power flow approximation which uses piecewise linear losses and security constraints (linear
21 Source: The markets for electricity in New Zealand. Report to the Electricity Commission.
February 2007

26
approximations to voltage and thermal constraints). An AC model is used by the system operator for real-time dispatch, and results from the two models are most of the time within two decimals of each other.
Reserves are integrated into the market clearing process at all times, so that joint energy/reserve offers are used to form a joint energy/reserve schedule in a single LP (locational price), with prices being produced for energy at every node, and for 2 classes of reserve in each island.22 The pricing algorithm is a security-constrained bid-clearing system for the entire New Zealand wholesale electricity market.
Losses are fully priced into the nodal dispatch through a marginal loss factor based on revenue / cost at the node.
4.4.4 Settlement
As soon as practicable the system operator will publish a set of real time prices giving the price of electricity at each grid exit and grid injection point on a five minute basis. These are calculated using the same mathematical formulas and optimisation objective as the pre-dispatch and dispatch schedules.
Along with the real time prices, the system operator publishes information on the extent to which capacity constraints on lines, grid points, and ramp rates occurred and the number of grid exit points at which demand was estimated. The system operator also publishes for each grid injection point and grid exit point a time weighted average of the five minute real time prices for each 30 minute trading period.
The real time prices are indicative only and are not used in the settlement and clearing processes. They are produced to give participants better information on likely market prices.
The above prices are all guiding only; The “final prices” are calculated ex-post (normally noon the following day, unless there are irregularities or disputes) using the offer prices as established two hours before the “trading period” and volumes as established during the trading period.
4.5 Prices and hedging The information NVE has gathered about the New Zealand Electricity market reveals that Electricity wholesale prices are highly volatile. There are unique wholesale prices at each of ~250 nodes, so there is potential for great variation in prices across the nodes in the country. The NZ grid is characterised by a number of “loops”, and parallel 110kV and 220kV lines, and constraints on the loops give rise to extreme price spikes which are known as the “spring washer effect”. The spring washer effect has resulted in market-clearing prices at some nodes reaching 15 000 NZD/MWh for a short time (under an hour), compared with an average price of 65 NZD/MWh.
The spring washer is the most extreme form of locational volatility. There have been occurrences of less severe locational volatility with unpredictable price variations both in
22 Source: Transmission Pricing in New Zealand. E.G. Read.
27
the peripheral areas of the grid and the core parts, which still pose challenges for market participants, particularly for independent retailers.
After the introduction of nodal market, the regulator allowed re-integration of unbundled companies, thus leading to vertically integrated and regionally limited “monopolies”. Also after this structural change in the market, energy companies tend to get physical hedges, e.g. inter-generator swaps for power.
Since several of the energy companies are vertically integrated, these have a limited need to buy external hedging instruments since a large proportion of their “book” is hedged within the internal portfolio. This poses a challenge for those wanting to establish a financial market in energy derivatives since potential volumes are so low.
There are 2-3 nodes which are liquid, and where market participants can trade. However, smaller generators located in the regions at nodes that are less liquid have problems finding a counterparty and managing their risk. Retailers may also have problems handling risk, since they will be exposed to variable prices in the wholesale market whereas their customers are on fixed price contracts. Retailers could in theory pass the nodal price through to the end users, but there is little demand for that and passing the nodal price through would mean severe price differences between customers. This could be politically challenging to explain.
Today retailers handle their risk by adding a risk premium to the final customer. It is difficult to say whether the premium is fair or not, and due to limited competition in the retail segment, it may well be that these premiums are excessive.
Retail pricing zones, which are the case in e.g. the NYISO (described in chapter 5) would ease risk management for retailers, however it would imply a wealth transfer.
Since late 2010 electricity industry started trading in financial instruments related to the New Zealand market at the Australian Stock Exchange. This is a relatively new organised market. It is of course possible for parties buy and sell power at their local connection nodes in the spot market, and form a variety of financial contracts based on this; typically hedging against prices at the relevant island's reference node. There are currently no financial products available to hedge the difference between the relevant reference node and the purchase (or sell) node.
4.6 Ancillary services A party is able to submit reserve offers to the system operator for trading periods of the following trading day. Reserve offers must be received by the system operator by 1:00pm on the day prior to the trading day to which they apply.
Three sources of instantaneous reserves are recognised: partly loaded spinning reserves, tail water depressed spinning reserves, and interruptible load. Each reserve offer may be for fast instantaneous reserves, sustained instantaneous reserves or both.
The same generating capacity is able to be offered as energy and as instantaneous reserves and for this reason the party making the reserve offer has to identify the generating unit or station to which the energy offer relates. It is the system operator’s responsibility to ensure that the combined quantity of its dispatch instructions for energy

28
and instantaneous reserves do not exceed the capacity of the individual generating unit or station. This “co-optimisation” of energy and reserves has occasionally driven significant price volatility in itself, especially when generating capacity is tight and the model must tradeoff generation available for energy versus generation available for reserves. In 2006, this lead to half-hour prices reaching NZD10,000 on one occasion (19 June 2006).
29
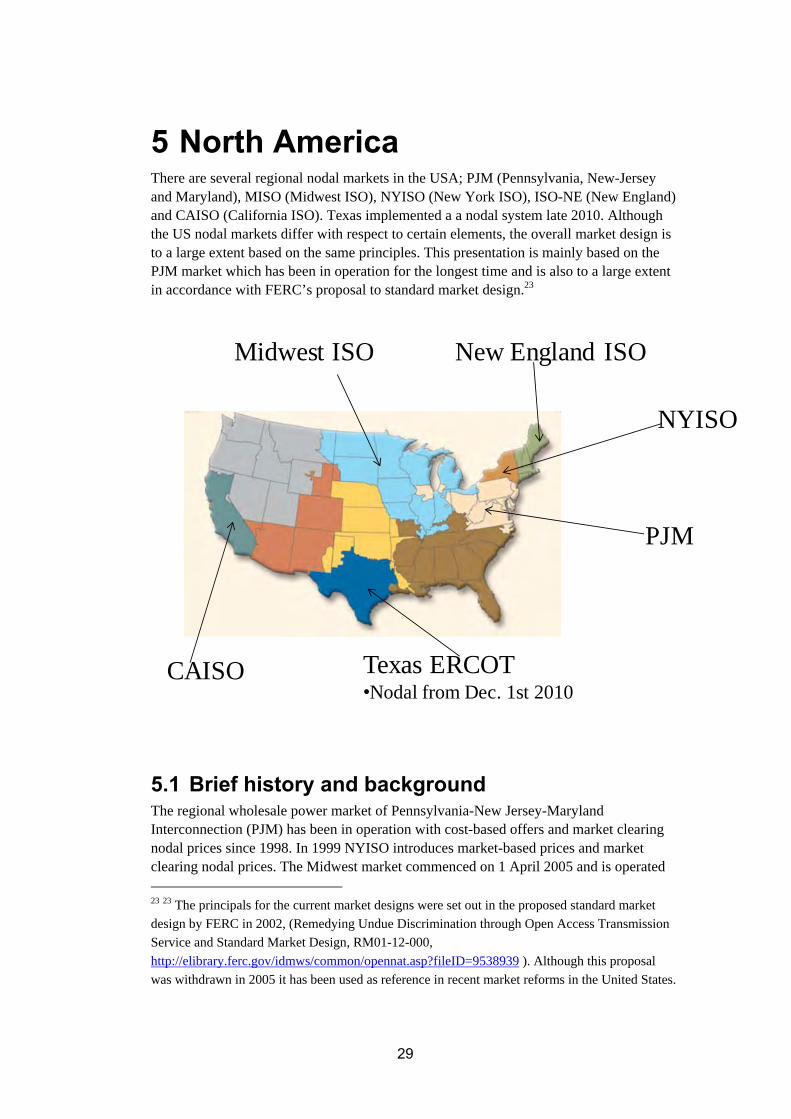
5 North America There are several regional nodal markets in the USA; PJM (Pennsylvania, New-Jersey and Maryland), MISO (Midwest ISO), NYISO (New York ISO), ISO-NE (New England) and CAISO (California ISO). Texas implemented a a nodal system late 2010. Although the US nodal markets differ with respect to certain elements, the overall market design is to a large extent based on the same principles. This presentation is mainly based on the PJM market which has been in operation for the longest time and is also to a large extent in accordance with FERC’s proposal to standard market design.23
Midwest ISO New England ISO
NYISO
PJM
Texas ERCOT•Nodal from Dec. 1st 2010
CAISO
5.1 Brief history and background The regional wholesale power market of Pennsylvania-New Jersey-Maryland Interconnection (PJM) has been in operation with cost-based offers and market clearing nodal prices since 1998. In 1999 NYISO introduces market-based prices and market clearing nodal prices. The Midwest market commenced on 1 April 2005 and is operated 23 23 The principals for the current market designs were set out in the proposed standard market
design by FERC in 2002, (Remedying Undue Discrimination through Open Access Transmission
Service and Standard Market Design, RM01-12-000,
http://elibrary.ferc.gov/idmws/common/opennat.asp?fileID=9538939 ). Although this proposal
was withdrawn in 2005 it has been used as reference in recent market reforms in the United States.
30
by the Midwest ISO (MISO). Two recent additions to the nodal markets was introduced with CAISO (California) on March 31 2009 , and ERCOT (Texas) on 1. December 2010.
PJM is a federally regulated Regional Transmission Organization (RTO) operating the power market and manages the high-voltage electricity grid in all or parts of Delaware, Illinois, Indiana, Kentucky, Maryland, Michigan, New Jersey, North Carolina, Ohio, Pennsylvania, Tennessee, Virginia, West Virginia and the District of Columbia.
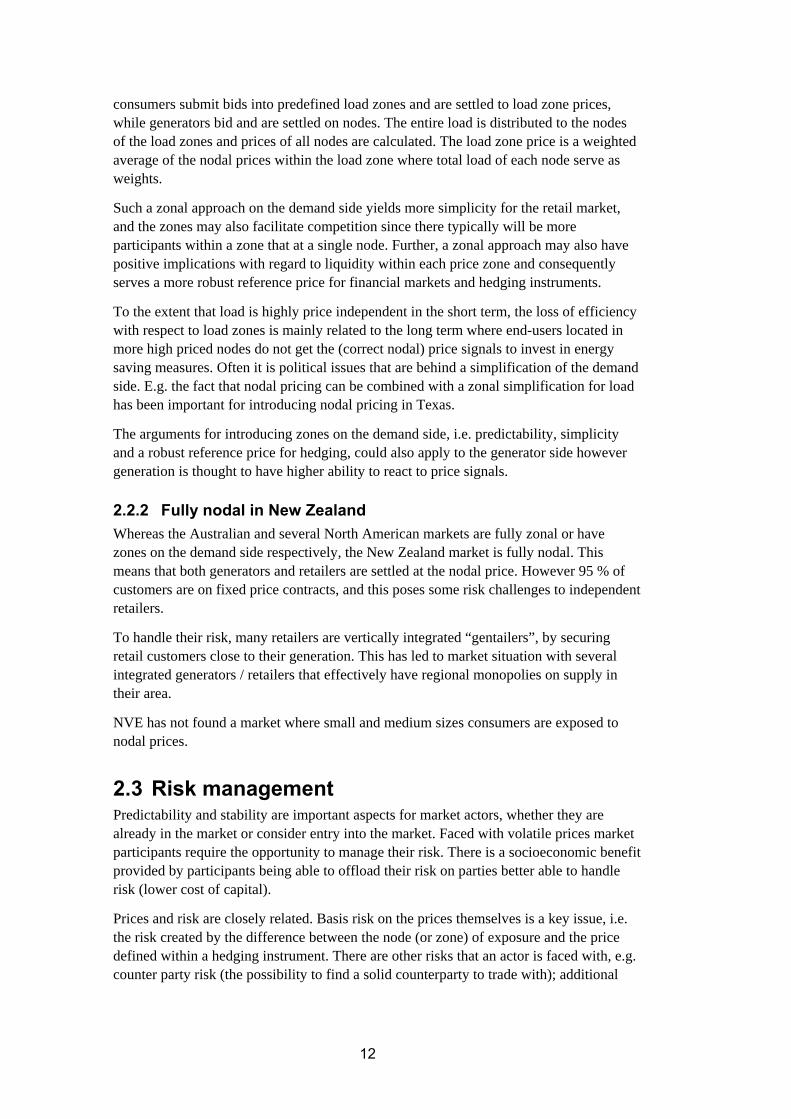
PJM constitutes the largest centrally dispatched grid in North-America. The area includes more than 51 billion people. The members of PJM include more than 500 power generators, electricity distributors, power marketers and large consumers. The installed generating capacity is 167,326 MW. Over 500 market buyers, sellers and traders participate in the market. All time peak load was 144,644 MW in August 2006.
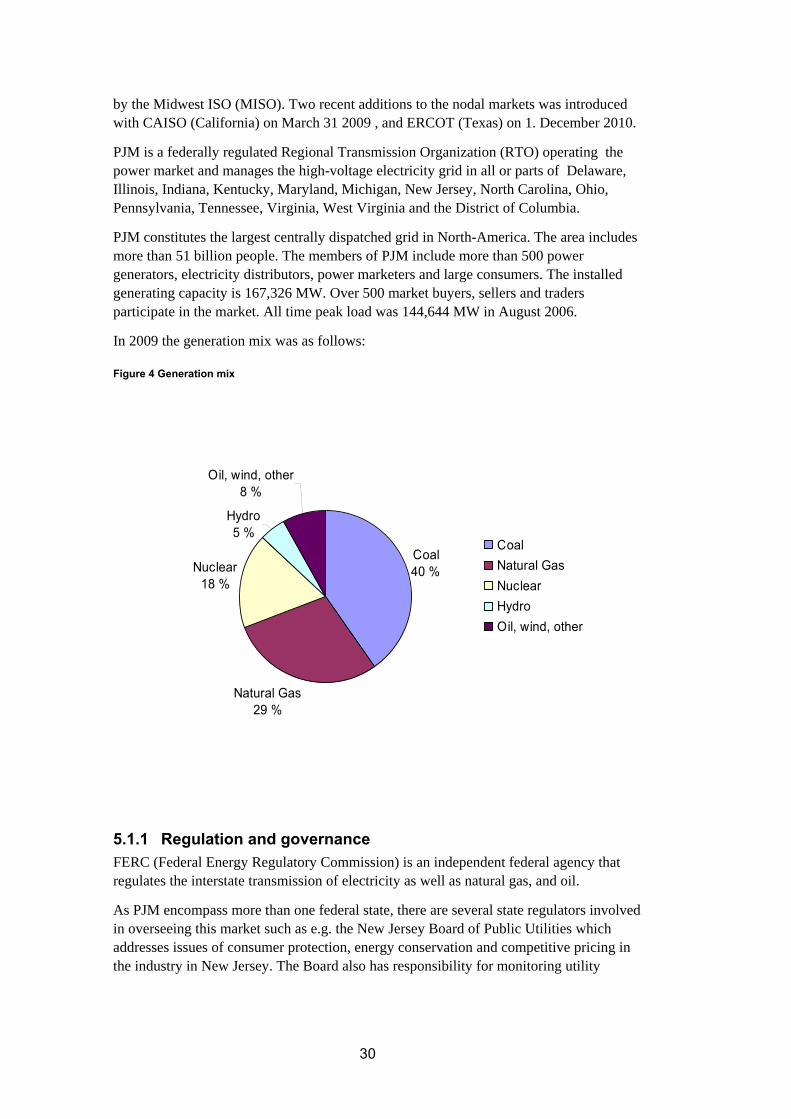
In 2009 the generation mix was as follows:
Figure 4 Generation mix
Coal40 %
Natural Gas29 %
Nuclear18 %
Hydro5 %
Oil, wind, other 8 %
CoalNatural GasNuclearHydroOil, wind, other
5.1.1 Regulation and governance FERC (Federal Energy Regulatory Commission) is an independent federal agency that regulates the interstate transmission of electricity as well as natural gas, and oil.
As PJM encompass more than one federal state, there are several state regulators involved in overseeing this market such as e.g. the New Jersey Board of Public Utilities which addresses issues of consumer protection, energy conservation and competitive pricing in the industry in New Jersey. The Board also has responsibility for monitoring utility

31
service and responding to consumer complaints. There are similar Utility Boards overseeing customer issues in the other involved states.
PJM has a boards which oversees the operation of the markets, and are responsible for maintaining PJM’s and MISO’s independence respectively, and ensuring that the market operators fulfil their business obligations and legal and regulatory requirements.
The PJM board has on occasion also cooperated on market design issues and e.g. made recommendations to the FERC.24
5.1.2 Responsibilities – market and system The Federal Energy Regulatory Commission (FERC) is an independent regulatory agency within Department of Energy that regulates the interstate transmission of natural gas, oil, and electricity. It is responsible for economic regulation of the transmission and wholesale sales of electricity in interstate commerce.
PJM Interconnection (PJM) is a regional transmission organsation (RTO) which operates the region’s power grid and wholesale electric market. It administers the two-settlement spot market and produces locational marginal prices. It also is responsible for operating capacity markets, ancillary services markets, market in financial transmission rights (FTR).
5.2 The wholesale market 5.2.1 Market structure PJM operates a day-ahead market and a real-time balancing market. Nodal prices or locational marginal prices (LMPs) are calculated for both the day-ahead and the real-time market and there are performed separate settlements for each market. The price calculation is based upon a network model containing 8464 buses - 6659 of these are load buses and 1583 generation buses. The voltage level of the network model ranges from 2 to 765 KV.
5.2.2 Requirements for bidding The day prior to the operating day market participants may submit bids into the day-ahead market or the real-time balancing market. The balancing market opens for bidding after clearing of the day-ahead market. Bids accepted in the day-ahead market automatically carry over into the balancing market.
Hourly bids are submitted for the next day both in the day-ahead and the real-time market. The bids in the day-ahead market include fixed demand bids, price sensitive demand bids, external transactions, generation offers and virtual bids. The market players have to specify the location of their bids according to a predefined list of locations updated regularly by PJM.
24 PJM/MISO Joint Board Recommendations: http://www.ferc.gov/industries/electric/indus-
act/joint-boards/pjm-rpt.pdf

32
The list of locations include transmission zones, aggregates in addition to buses:
Zones: The grid of PJM is currently divided into 19 zones. The zones are typically used by Electricity distribution companies (EDCs) with retail load. LMPs for zones are load weighted averages of LMPs of the buses in the zone. EDCs shall submit a forecast of demand within their zones. This is for reliability purposes and is not binding.
Aggregates: Mainly used by load serving entities or generation owners. Aggregate LMPs can be load or generation weighted.
Hubs: Load or generation weighted average LMPs used mainly for financial contracts. (More in this under “Prices and Hedging”).
In the day-ahead market, market participants may submit increment offers or decrement bids, which are virtual offers or bids that serve as financial instruments in the day-ahead market only. All bids must be consistent with a $1000/MWh cap. Virtual bids pressure Day Ahead and Real-Time prices to converge25.
Virtual bids imply willingness to sell or buy energy in day-ahead market with opposite transaction in real–time market (virtual purchase bids day-ahead turn into sell bids real-time) and are financial instruments to exploit differences between day-ahead and real-time prices. If there are expected to be congestions in real-time market but not in the day-ahead market a market participants may buy energy day-ahead and sell it to a higher price in the real-time market. Virtual bids may also be used for hedging purposes. I.e. load serving entities or generators may use virtual purchase bids to hedge against unsecure payments due to higher load than expected or unscheduled outages in generation. Virtual bidding contributes to price convergence between day-ahead and real-time markets and thereby mitigates price manipulation. To some extent virtual bidding may give opportunities of anti-competitive behavior. For example a trader may use virtual bids to increase price in a remote location to increase the value of its FTRs. However, this can be mitigated by other traders taking the reverse position.
Market sellers that own generation capacity resources are obliged to submit offer data into the day-ahead market. If it is not scheduled in the day-ahead market, it may revise its offer and submit it into the real-time market. It is optional for other market sellers to participate in the day-ahead market. Generation offers may consist of start up and no-load offers. A Capacity Resource’s last offer data remains in effect until specifically superseded by another offer.
Transmission customers may submit external bilateral transaction schedules and may indicate willingness to pay congestion charges into either the Day-Ahead Market or balancing market. In the Day-Ahead Market, a transaction shall indicate willingness to 25 Explicit virtual bids refer to financial-only transactions that are explicitly differentiated from
physical bids, while implicit virtual bids refer to a combination of physical bids and real-time
behaviour. An example of an implicit bid could be a LSE (load serving entity) who submits a
demand bid higher than expected real-time load to expose itself to the price difference between
day-ahead and real-time prices for the overscheduled load (Celebi, M, et al. Virtual Bidding: The
Good, the Bad and the Ugly, The Electricity Journal, Volume 23, Issue 5, June 2010, Pages 16-
25.)
33
pay congestion charges by submitting the transaction as an up to congestion bid that may be between -$50/MWh and $50/MWh.
5.2.3 Sequence of bidding The gate closure of the day-ahead market is 12 pm. PJM determines hourly commitment schedules and LMPs for the day-ahead market. The results are published 4 pm. The balancing market is open for bidding between 4 and 6 pm. Then a second resource commitment is performed based on updated resource availability and load forecasts. This is for reliability purposes. PJM runs additional commitment schedules as necessary based on new information during operating day. Updated individual generation schedules are sent to specific generation owners.
5.2.4 Pricing LMPs and schedules for the day-ahead market are calculated using least-cost security constrained unit commitment and security constrained economic dispatch programs. Hourly offers and bids are used in an optimization where the aim is to cover fixed (forecasted) demand by at minimum cost taking into consideration a full transmission model, unit commitment constraints and reserve requirement model.
In the real-time market LMPs are calculated based on actual operating conditions. LMPs are calculated for each five minutes interval. Hourly real-time LMPs are calculated based on the five-minute segments of each hour.
The LMP consists of three components which are calculated both day-ahead and real-time:
System energy price: Represents optimal dispatch ignoring congestion and losses and is the same for each bus in PJM.
Congestion price: Represents price of congestions for binding constraints. Load pays and generation is paid the congestion price. The congestion price is zero if no constraints. Sensitivity factors on each bus are used to calculate the congestion price. The sensitivity factors calculate the price to deliver power to every location in the least expensive way and take into account impedances of transmission lines and the impact of marginal generators on transmission constraints and generator price.
Loss price: Represent price of marginal losses. The loss price is calcualated based on penalty factors which adjust the incremental cost of each generator to include effects of losses. The penalty factors tells how much the overall system losses increase or decrease when raising a units output.
The Real-Time LMPs are defined as the cost to serve the next increment of load at each node bus location for the current system state estimated operating point, taking into account eligible resource real-time offer prices and the buses‘ location with respect to transmission limitations and incremental system losses.
34
5.2.5 Settlement There are two settlements – one for the day-ahead market and one for the real-time market.
The day-ahead market settlement is based on scheduled hourly quantities and day-ahead hourly prices. For each hour of the day-ahead market scheduled demand pay and scheduled generators are paid system energy price component of the LMP. Scheduled transactions pay congestion charges based on locational differences in congestion price component the LMP. Transmission losses are settled at the day-ahead loss price component of the LMP.
Settlements in the Real-Time market will be calculated by determining the deviation from the Day Ahead spot schedule multiplied by the Real-Time LMPs. For the time being PJM settles its real-time market using “ex post” prices. The ex post prices are used in settlements and are calculated after the operating period based upon the actual power flows and output.
5.2.6 GNP – zonal pricing of load The PJM market is regarded as a full nodal pricing market. However, in several of the US nodal markets nodal pricing is combined with zonal simplifications on the demand side. This is called generator nodal pricing (GNP) and is implemented in the NYISO and ISO-NE markets. This is also part of the market design that is planned implemented in Texas from 1 December 2010. The recognition by regulators in Texas that nodal pricing can be commercially simplified on the demand side has been important to drive the process forward26.
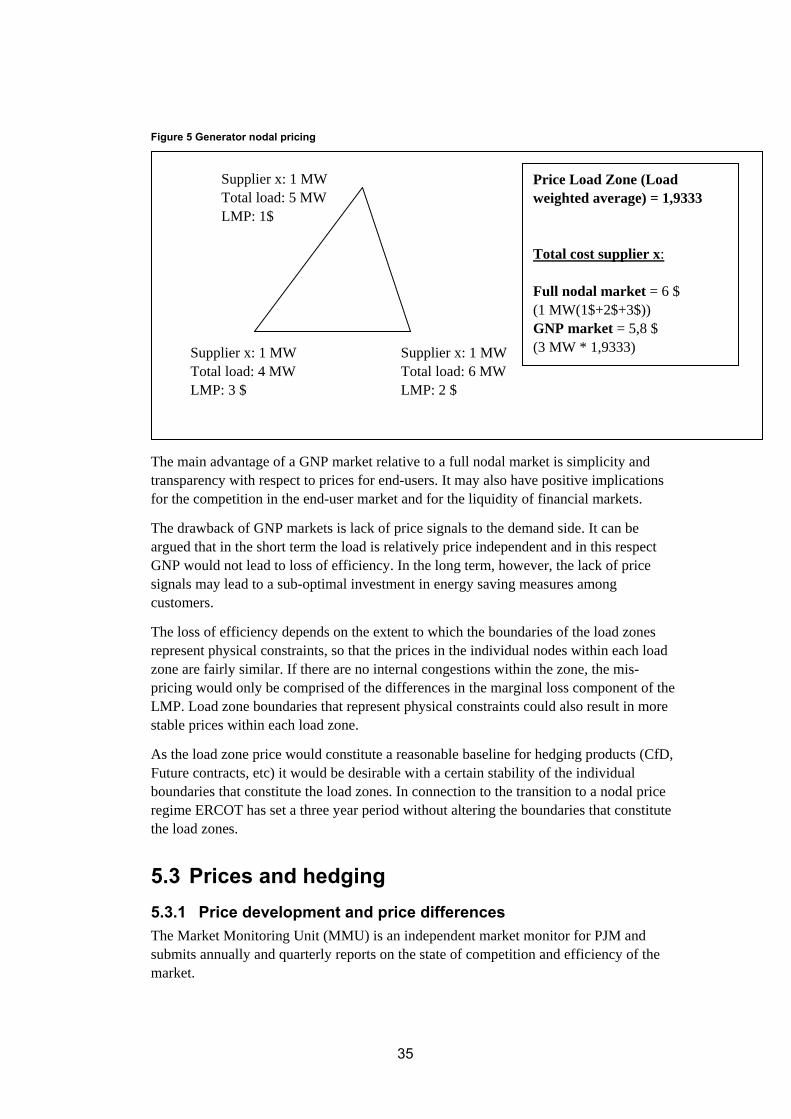
GNP implies that generators bid and are settled on nodes while consumers bid and are settled on predefined zones. It is important to stress that all load in addition to generation are distributed on nodes and that the pricing algorithm explicitly take into account the physical capability of the transmission network when calculating prices for each node. The zonal price is a load weighted average of the prices of the nodes that are defined within the particular load zone.
As mentioned under 1.4.2 there also exist load zones and aggregates in the PJM where load weighted averages are published. However, in the PJM system a load serving entity can ask the PJM to calculate a load weighted average price of an aggregate which is a subpart of the zone and the load serving entity (LSE) can charge that price to the load it serves. Individual large customers can choose to become their own LSE and pay the price of the node it is attached to. Since there is a choice, it can be argued that PJM not completely use full nodal pricing. In a GNP system all load are paying the zonal price where the total load of each node in the load zone is used to weight the average of the nodal LMPs. All suppliers/consumers within a load zone pay the same price for its load. The difference in settlement between a GNP- and a full nodal market is illustrated in the figure below.
26 Based on e-mail correspondence with Daniel Jones, Director of ERCOT Independent Market
Monitoring Unit, Potomac Economics.
35
Figure 5 Generator nodal pricing
The main advantage of a GNP market relative to a full nodal market is simplicity and transparency with respect to prices for end-users. It may also have positive implications for the competition in the end-user market and for the liquidity of financial markets.
The drawback of GNP markets is lack of price signals to the demand side. It can be argued that in the short term the load is relatively price independent and in this respect GNP would not lead to loss of efficiency. In the long term, however, the lack of price signals may lead to a sub-optimal investment in energy saving measures among customers.
The loss of efficiency depends on the extent to which the boundaries of the load zones represent physical constraints, so that the prices in the individual nodes within each load zone are fairly similar. If there are no internal congestions within the zone, the mis-pricing would only be comprised of the differences in the marginal loss component of the LMP. Load zone boundaries that represent physical constraints could also result in more stable prices within each load zone.
As the load zone price would constitute a reasonable baseline for hedging products (CfD, Future contracts, etc) it would be desirable with a certain stability of the individual boundaries that constitute the load zones. In connection to the transition to a nodal price regime ERCOT has set a three year period without altering the boundaries that constitute the load zones.
5.3 Prices and hedging 5.3.1 Price development and price differences The Market Monitoring Unit (MMU) is an independent market monitor for PJM and submits annually and quarterly reports on the state of competition and efficiency of the market.
Supplier x: 1 MW Total load: 5 MW LMP: 1$
Supplier x: 1 MW Total load: 6 MW LMP: 2 $
Price Load Zone (Load weighted average) = 1,9333 Total cost supplier x: Full nodal market = 6 $ (1 MW(1$+2$+3$)) GNP market = 5,8 $ (3 MW * 1,9333) Supplier x: 1 MW
Total load: 4 MW LMP: 3 $
36
According to the State of the market report 2009 the prices in PJM has in general been below the marginal cost of the highest cost unit of the system. Price peaks have occurred, but have been limited in duration and are normally related to scarcity situations. In 2009 the average load-weighted real-time PJM was 39.05$. The annual average load weighted LMP has varied from $24.16 in 1998 to $71.13 in 2008. The decrease in prices from 2008 to 2009 generally reflects lower fuel costs and lower demand. In general the market results indicate that the prices are set by marginal units operating close to their marginal costs. UMM concludes that both the real-time and the day-ahead market are competitive.
Congestion costs in the PJM have varied between 3 and 9 percent of the total PJM billings since 2003. In 2009 the congestion costs amounted to $719 billion in 2009. The annual congestion costs were highest in 2008 with $2119. In 2009 both the congestion costs and frequency of congestions was the significantly higher in the day-ahead market than in the real-time market. One particular interface (AP South interface) was the main source to price separation between eastern, southern and western control zones. Eastern and southern control zones were on the constrained side with higher prices than the western control zones. The AP South interface accounted for 29 percent of the total PJM congestion costs in 2009.
5.3.2 Hedging opportunities27 As in the Nordic power market, end-use customers in the US nodal markets can choose their supplier from competing retailers. These retailers offer different contracts that vary with respect to price certainty for the customer. The contracts limit the extent to which retailers can pass changes in the wholesale price on to customers. Retailers typically charge a premium to customers depending on the degree of wholesale price variability of the retail contract. I.e. a fixed price contract would have a larger premium than a variable price contract. Nevertheless retailers are interested in mitigating risk associated with what they need to pay for electricity in the future.
Generators are interested in mitigating the risk associated with how much they get paid for future electricity. These risks may be managed by taking an offsetting position, physical or financial. If you are a generator and long in the physical market (earning money if the price increases and losing money if the price goes down), this can be offset by selling a corresponding futures contract and lock in the price you are paid. A retailer who is short (earning money if the price goes down and losing money if the price increases) in the physical market may buy a futures contract to remove uncertainty about future prices they have to pay.
5.3.3 Hedging instruments There are a large number of instruments for market players to hedge their risks in the US markets. Most term markets in the US are traded bilaterally (OTC) through live brokers. This includes financial instruments like forwards and swaps. Futures on the other hand are mostly traded on exchanges like NYMEX and ICE. In comparison with forwards traded in the OTC markets the futures are more standardized with respect to delivery date,
27 This paragraph is to a large extent based on an interview with Eric Hansen in Gateway Energy
Services. Gateway Energy Services is among the largest energy retail companies in the US and
operates in the PJM market in addition to the NYISO market and the market in Texas.
37
quantity and location etc. The advantages of futures are trading liquidity, low transaction cost and price transparency. Mostly short term power is traded on an exchange. The specification of forwards in the OTC markets is determined by negotiation and may therefore be tailored to meet the specific needs of the parties.
5.3.4 Trading hubs The futures contracts are to a large extent specified for delivery at trading hubs. Hubs are a collection of nodes in the transmission network for which a hub LMP is published by the ISO. The hub LMP is a weighted (load/generation) average of the LMPs of the nodes that constitute the hub. Hubs are typically an area of the grid where significantly sized transmission wires come together and/or there is a substantial amount of generation capacity. Typically there are not large price deviations across the nodes of the hub and it is mainly the loss component of the LMP that varies and not the congestion price.
Bilateral transactions tend to be on the nodes that constitute hubs. Some hubs are traded on exchanges. The most liquid hub in PJM is the Western hub and it is traded both bilaterally and on the CME/NYMEX exchange.
Ten hubs are defined in the PJM today. The hub size varies from 6 to more than 1000 nodes.
5.3.5 Financial Transmission Rights (FTRs) FTR is a financial entitlement that gives the holder right to congestion charges incurred on a specific transmission path defined by its source and sink independent of physical energy delivered. FTRs give the opportunity to hedge against the difference of the congestion price component of the LMP (day-ahead) between two points of the grid. FTRs are also regarded as a valuable tool for hedging price differences between areas; generators-hub, hub-load zone, load zone-load zone etc. FTRs also served as a way of compensating load customers that has financially supported the construction of transmission lines. The ISO collects more from load than it pays generators during constrained conditions. FTRs are a way of fairly redistributing this money to market participants.
PJM run annual and monthly auctions of FTRs. The most usual way of acquiring FTRs at the PJM is through the annual auctions every spring. The annual auction concerns the entire system capability, while “left over” capability is auctioned at the monthly auctions. A third way to acquire FTRs is through secondary markets. This can be done bilaterally or through Nodal Exchange, which is an exchange providing an auction platform and clearing service for distinct price locations and nodes. Nodal Exchange is still in its infancy, but as it develops it may increase the market liquidity of FTRs.
5.3.6 Hedging and liquidity The degree of liquidity varies from hub to hub. The West hub is the most liquid hub in PJM. It is easy for market participants to find acceptable deals at this location. However, when this hub doesn’t correspond to the location of your generation or load you are exposed to a basis risk. The basis refers to the deviation from the price you have hedged at the West hub and the price of your location.
38
One way to hedge this price difference is through FTRs. However, this can be less attractive for several reasons. The timing and terms of the FTR auctions may not always be satisfactory. The market for FTRs can be described as relatively illiquid. Furthermore FTRs do not hedge against changing losses (only congestion price component). For this reason basis swaps may be a better hedging method.
In practice, basis swaps typically trades between highly liquid points and less liquid points. It refers to selling one location and buying another location for the same quantity (using futures or other instruments). How this works can be illustrated with an example where we consider a supplier with customers mainly located on the East hub. The financial market at East hub is not very liquid and offers at acceptable prices do not come along frequently.
In this example we consider supplier that at a certain point of time is offered 50 MW at East hub priced at $75 for 2011. This makes it possible for the supplier to remove price un-certainty. However, the supplier also needs to assess the quantity risk. The supplier does not know how much his physical load is going to be in 2011. That depends on the amount of customers and how much electricity they will consume.
Since the East hub is not very liquid he cannot be certain that he is able to sell back excess load at an acceptable price as the time evolves. However, the supplier knows that West hub is a strongly correlated and liquid market that is trading at $70. This gives him the opportunity to sell 50 MW at $70 at West hub at the same time as he buys 50 MW at East hub. He is now 50 MW short on West hub and 50 MW long on East hub. This will to a large degree offset the risk exposure at East hub. As the average sale per customer is 1 MW per customer, the supplier is now able to trade the highly liquid West hub in 1 MW increments depending on the actual amount of customers he get. If he only get 20 customers corresponding to a total load of 20 MW, he can buy back 20 MW at West hub. He is then exposed to the basis risk (price spread between East hub and West hub) of 30 MW unsold East hub West hub basis. Under the assumption that the price of East hub and West hub is highly correlated the risk of the supplier is substantially removed using this basis swap relative to being outright exposed to the quantity risk of a long position on the illiquid east hub. The basis risk should also affect the margin on the contract offered to its customers.
This example illustrates a typical way for suppliers to mitigate risk when the liquidity of financial trading varies for different locations. Typically there will be more frequent trade of smaller volumes at liquid points and more infrequent trade with larger volumes at locations with less liquidity. Another implication of this example is that the stability of the price structure of the market affects how easy it is for market participants to manage their risk through hedging. Although prices may differ across the locations of the market, the variation of locational prices may to a large degree be correlated.
5.4 Market power and market monitoring Compared to the Norwegian market the US nodal markets have implemented more resources to monitor the markets. Independent external entities are in place both to investigate the use of market power and to assess the overall functioning of the markets.
39
In PJM the market monitoring unit (Monitoring Analytics) monitor the compliance with rules, identifies design flaws in rules, standards and practices in addition to structural problems that may inhibit a robust and competitive market. It also evaluates the potential of market participants to exercise market power. The monitoring unit has access to all the market data in the PJM.
When it comes to mitigating market power there exist ex ante instruments in addition to ex-post market surveillance. The ex-ante instruments refer to a direct use of offer caps in the price calculation. If an offer exceed the offer cap and a test shows that the offer has an price impact the offer is set equal to the offer caps. How strict these offer caps are and how they are calculated vary between the US markets. In PJM these caps are relatively strict and calculated based on detailed cost data submitted by the generating units to market monitor unit. Potomac Economics which is market monitoring unit for NYISO, CAISO in addition to ERCOT in Texas, calculate offer caps based on historical bidding.
In general there is a debate in the US with regard to the use of offer caps. It is argued that exercise of market power should to larger extent be allowed during scarcity to recover fixed costs, and that the use of capacity markets should be as limited as possible.
5.5 ERCOT transition to a nodal market The Texas power market is operated by the Electric Reliability Council of Texas (ERCOT). ERCOT is in a process of transitioning into a nodal system that is planned implemented in on 1. December 2010
The ERCOT market currently applies a zonal approach to congestion management, with five zones now in place. Congestion between zones is managed through zonal price separation (market splitting). Congestion within each zone is managed through the redispatch of individual generators, much like the Nordic market.
In September 2003 the Texas Regulatory Authority (Public Utility Commission of Texas) adopted an Order relating to wholesale market design. The Order contains the rules defining the nodal market structure. The commission identified some flaws in the current market design. 28
The lack of resource-specific bid curves for use in dispatch by ERCOT
The lack of a day-ahead market
The lack of stable zones
The inability of the current market design to respond to changes in operating circumstances
The lack of direct assignment of congestion rents for local congestion
The importance of appropriately designing settlement zones for load was stressed by the commission in order to reduce the potential impacts on individual retailers. Specifically
28 Rulemaking Proceeding On Wholesale Market Design Issues In The Electric Reliability Council
Of Texas, (Project No. 26376 Order Adopting New §25.501) P.61
40
the commission stressed how the size and configuration of load zones would ease, if not eliminate, the impact of the Texas nodal model on customers. The rules where by the Public Utility Commission of Texas expected to yield important benefits, such as29
a reduction in local congestion costs;
reduced opportunities for gaming and manipulation in the wholesale power market;
increased price transparency and liquidity in the wholesale electricity day-ahead energy market;
increased locational price transparency for resources;
more efficient and transparent dispatch of resources in real-time;
improved siting of new resources;
reduction in the amount of new transmission facilities needed to support the reliability of, and competition in, the wholesale power market.
The implementation date for this new market design was initially set to 1. March 2006. ERCOTs nodal market redesign process involved 4 ‘tracks’. Track 1 and 2 initiated operator and participant system procurement and development processes. This also involved a comprehensive cost-benefit analysis. ERCOT Cost-Benefit study focused on two alternative market design choices: a zonal market design and a nodal market design.
The cost-benefit analysis found that the nodal market design was measured to produce average annual benefits of $ 76 million per year in reduced generation costs. This represents about 1 % of total system costs.
The study further found implementation costs impacts to the total market to constitute between –$ 108 million and –$ 157 million. Most of these costs where thought borne directly by ERCOT and incurred mainly due to the increased capital and operating costs of the nodal market systems and support staff.
Other significant market impacts found in the study included an increase in complexity with the shift to the nodal market design. The study found that this was especially prevalent during the first few years of nodal market operations, and it disproportionately impacts small participants and participants whose business is limited to the ERCOT region. Qualitative benefits included ERCOT’s improved ability to manage the system with unit-specific bids rather than portfolio bids, and the resulting increased system efficiency and increased transparency of prices at specific locations.30
Track 3 focused on market training while Track 4 involved system testing and finally nodal market implementation from 1 December 2010.
29 Rulemaking Proceeding On Wholesale Market Design Issues In The Electric Reliability Council
Of Texas, (Project No. 26376 Order Adopting New §25.501) P. 1 30 Market Restructuring Cost-Benefit Analysis, FINAL REPORT, November 30, 2004, Tabors
Caramanis & Associates and KEMA Consulting
41
6 Conclusions Through an overview of markets with nodal pricing, the aim of this report has been to obtain an understanding of the practical implementation of nodal pricing. Whilst it is difficult to quantify the effects nodal pricing on the market outside the hour-to-hour dispatch process, the variety of market responses within this study shows it is imperative that such an analysis be undertaken if the practical impact of a nodal pricing system on the entire market is to be assessed.
Locational marginal pricing gives a solution for improving market efficiency in terms of delivering an “instantaneous” dispatch that reflects the demand and supply situation at the nodes in the grid as well as the underlying physics of the network itself. Although the theoretic principles are clear, this study shows considerable variation with respect to the practical implementation of these principles in existing nodal markets and the consequent implications for the functioning of these markets.
6.1.1 Zonal versus nodal prices A key difference between nodal and zonal pricing is that nodal prices deliver prices and dispatch at the nodes, whereas zonal prices are aggregates or based on marginal bid in that zone. Findings from New Zealand, which is fully nodal, show some occurrences of extreme locational volatility, which is different to general price volatility that can be seen in zonal and nodal markets alike. Whether this experience of locational volatility is transferrable to Norway is an open question..
6.1.2 Zonal market in Australia, zonal retail markets in USA Australia is a fully zonal market, which means that both generators and retailers are settled at a zonal price. Several of the North American markets have so-called generator nodal pricing, which means that generators are settled at nodal prices, but the demand side is settled on a zonal price. All the markets we looked at have limited demand side participation, i.e the demand is estimated on the nodes or zones respectively.
A zonal approach on the demand side yields more predictable pricing and more simplicity for the retail market, and the zones also facilitate competition. Further, a zonal approach may also have positive implications with regard to liquidity within each price zone and consequently serves a more robust reference price for financial markets and hedging instruments.
6.1.3 Different solutions to risk management From the markets investigated it is clear that nodal pricing will have a significant effect on market actors, how they behave and manage risk and on level of the welfare benefit inherent in the power market.
In Australia there is a liquid financial market that offers a range of forward contracts on area prices and differences between these. In addition there are liquid markets for various products in bilateral trade, such as contracts for differences between zones. The zonal model ensures volume and liquidity within each price are, and as such the reference
42
prices are robust. There are no transmission rights, neither physical nor financial in the Australian market.
In the North American markets there are several examples of liquid financial market for energy hedging instruments, and physical hubs consisting of several nodes, which delivers robust reference prices for the hedging market. Further more several of the US markets feature Financial Transmission Rights (FTR), which allow market participants to hedge their positions.
In New Zealand the hedging is predominantly physical, through e.g. vertical integration.
Findings show that risk management at peripheral nodes is challenging in all nodal markets; this is particularly the case for independent retailers.
6.1.4 Different underlying characteristics Last but not least, differences in the fundamental physical characteristics of the markets may influence market functioning and the extent to which experiences in one market are transferrable to another.
The markets reviewed for this report are predominantly thermal, with the exception of New Zealand which has a large proportion of hydro and geothermal generation. Further more the network topology varies with the North American market typically having meshed networks with weak interconnection between markets. The Australian market is a mix of radial and meshed network, and there is weak interconnection between zones. The New Zealand market has a mostly radial net with weak interconnection between the two islands.
In contrast, the Norwegian market has a large proportion of hydro generation. This could imply fundamentally changing power flows throughout the grid with changing hydrological situations. The Norwegian / Nordic market is also well interconnected to other markets, with large volumes of trade cross border, intra-day as well as over the year. The experiences from the markets studied, whilst instructive, cannot be assumed a priori to apply one-to-one to the Norwegian / Nordic market.
6.1.5 Further work If the idea of nodal pricing for Norway is to be pursued, it is essential to consider how the principles of nodal pricing could be implemented in the Norwegian/Nordic context. Although knowledge about existing nodal markets is useful, other elements of design may be necessary to make it work properly in Norway.
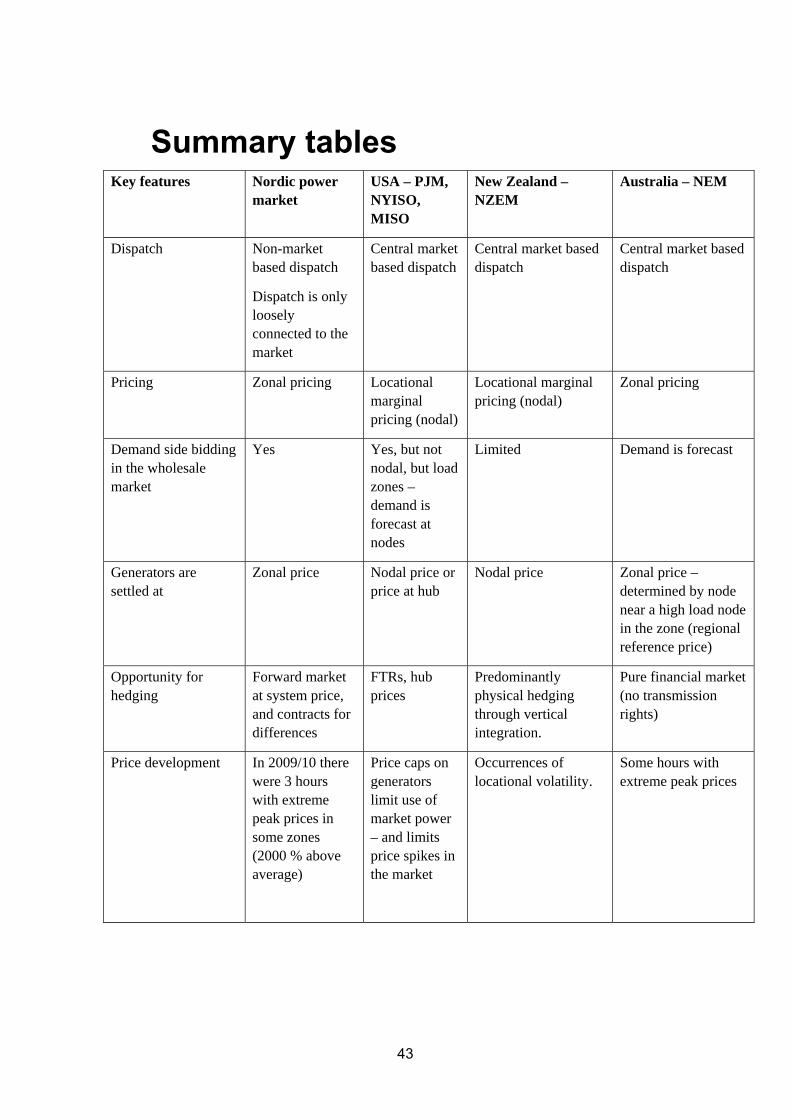
43
Summary tables Key features
Nordic power market
USA – PJM, NYISO, MISO
New Zealand – NZEM
Australia – NEM
Dispatch Non-market based dispatch
Dispatch is only loosely connected to the market
Central market based dispatch
Central market based dispatch
Central market based dispatch
Pricing Zonal pricing Locational marginal pricing (nodal)
Locational marginal pricing (nodal)
Zonal pricing
Demand side bidding in the wholesale market
Yes Yes, but not nodal, but load zones – demand is forecast at nodes
Limited Demand is forecast
Generators are settled at
Zonal price Nodal price or price at hub
Nodal price Zonal price – determined by node near a high load node in the zone (regional reference price)
Opportunity for hedging
Forward market at system price, and contracts for differences
FTRs, hub prices
Predominantly physical hedging through vertical integration.
Pure financial market (no transmission rights)
Price development In 2009/10 there were 3 hours with extreme peak prices in some zones (2000 % above average)
Price caps on generators limit use of market power – and limits price spikes in the market
Occurrences of locational volatility.
Some hours with extreme peak prices
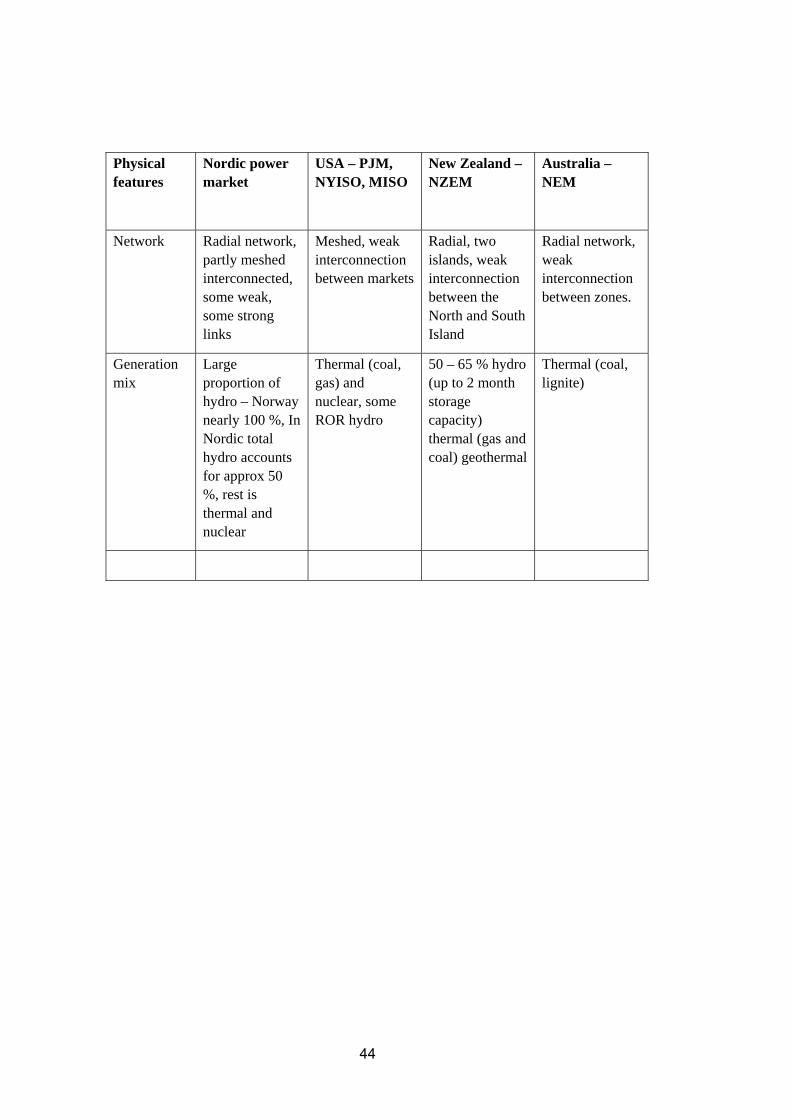
44
Physical features
Nordic power market
USA – PJM, NYISO, MISO
New Zealand – NZEM
Australia – NEM
Network Radial network, partly meshed interconnected, some weak, some strong links
Meshed, weak interconnection between markets
Radial, two islands, weak interconnection between the North and South Island
Radial network, weak interconnection between zones.
Generation mix
Large proportion of hydro – Norway nearly 100 %, In Nordic total hydro accounts for approx 50 %, rest is thermal and nuclear
Thermal (coal, gas) and nuclear, some ROR hydro
50 – 65 % hydro (up to 2 month storage capacity) thermal (gas and coal) geothermal
Thermal (coal, lignite)

This series is published by Norwegian Water Resources and Energy Directorate (NVE)
Published in the Report series 2010 Nr. 1 Representation of catchment hydrology, water balance, runoff and discharge in the JULES and SURFEX land surface models. Tuomo Saloranta (26 s.)
Nr. 2 Mapping of selected markets with Nodal pricing or similar systems Australia, New Zealand and North American power markets. Vivi Mathiesen (Ed.) (44 s.)


Norwegian Water Resources and Energy Directorate
Middelthunsgate 29 PB. 5091 Majorstuen, N-0301 Oslo Norway
Telephone: +47 22 95 95 95Internet: www.nve.no