Embed Size (px)
Citation preview
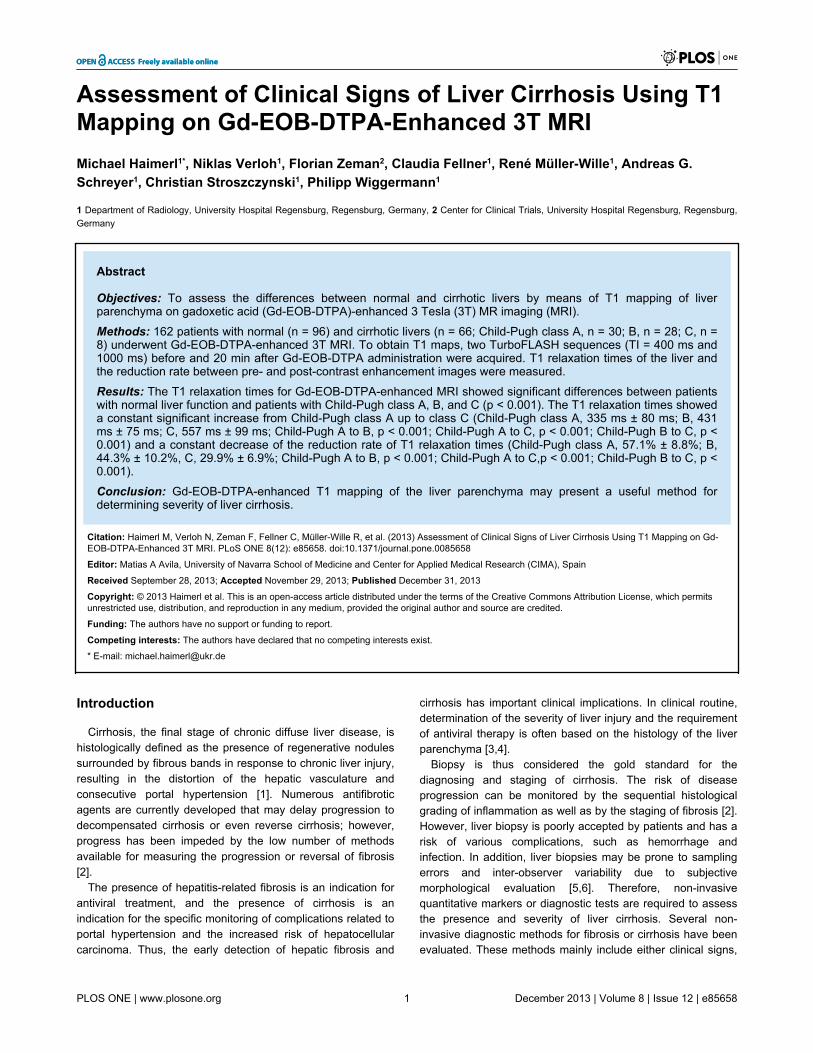
Assessment of Clinical Signs of Liver Cirrhosis Using T1Mapping on Gd-EOB-DTPA-Enhanced 3T MRIMichael Haimerl1*, Niklas Verloh1, Florian Zeman2, Claudia Fellner1, René Müller-Wille1, Andreas G.Schreyer1, Christian Stroszczynski1, Philipp Wiggermann1
1 Department of Radiology, University Hospital Regensburg, Regensburg, Germany, 2 Center for Clinical Trials, University Hospital Regensburg, Regensburg,Germany
Abstract
Objectives: To assess the differences between normal and cirrhotic livers by means of T1 mapping of liverparenchyma on gadoxetic acid (Gd-EOB-DTPA)-enhanced 3 Tesla (3T) MR imaging (MRI).Methods: 162 patients with normal (n = 96) and cirrhotic livers (n = 66; Child-Pugh class A, n = 30; B, n = 28; C, n =8) underwent Gd-EOB-DTPA-enhanced 3T MRI. To obtain T1 maps, two TurboFLASH sequences (TI = 400 ms and1000 ms) before and 20 min after Gd-EOB-DTPA administration were acquired. T1 relaxation times of the liver andthe reduction rate between pre- and post-contrast enhancement images were measured.Results: The T1 relaxation times for Gd-EOB-DTPA-enhanced MRI showed significant differences between patientswith normal liver function and patients with Child-Pugh class A, B, and C (p < 0.001). The T1 relaxation times showeda constant significant increase from Child-Pugh class A up to class C (Child-Pugh class A, 335 ms ± 80 ms; B, 431ms ± 75 ms; C, 557 ms ± 99 ms; Child-Pugh A to B, p < 0.001; Child-Pugh A to C, p < 0.001; Child-Pugh B to C, p <0.001) and a constant decrease of the reduction rate of T1 relaxation times (Child-Pugh class A, 57.1% ± 8.8%; B,44.3% ± 10.2%, C, 29.9% ± 6.9%; Child-Pugh A to B, p < 0.001; Child-Pugh A to C,p < 0.001; Child-Pugh B to C, p <0.001).Conclusion: Gd-EOB-DTPA-enhanced T1 mapping of the liver parenchyma may present a useful method fordetermining severity of liver cirrhosis.
Citation: Haimerl M, Verloh N, Zeman F, Fellner C, Müller-Wille R, et al. (2013) Assessment of Clinical Signs of Liver Cirrhosis Using T1 Mapping on Gd-EOB-DTPA-Enhanced 3T MRI. PLoS ONE 8(12): e85658. doi:10.1371/journal.pone.0085658
Editor: Matias A Avila, University of Navarra School of Medicine and Center for Applied Medical Research (CIMA), Spain
Received September 28, 2013; Accepted November 29, 2013; Published December 31, 2013
Copyright: © 2013 Haimerl et al. This is an open-access article distributed under the terms of the Creative Commons Attribution License, which permitsunrestricted use, distribution, and reproduction in any medium, provided the original author and source are credited.
Funding: The authors have no support or funding to report.
Competing interests: The authors have declared that no competing interests exist.
* E-mail: [email protected]
Introduction
Cirrhosis, the final stage of chronic diffuse liver disease, ishistologically defined as the presence of regenerative nodulessurrounded by fibrous bands in response to chronic liver injury,resulting in the distortion of the hepatic vasculature andconsecutive portal hypertension [1]. Numerous antifibroticagents are currently developed that may delay progression todecompensated cirrhosis or even reverse cirrhosis; however,progress has been impeded by the low number of methodsavailable for measuring the progression or reversal of fibrosis[2].
The presence of hepatitis-related fibrosis is an indication forantiviral treatment, and the presence of cirrhosis is anindication for the specific monitoring of complications related toportal hypertension and the increased risk of hepatocellularcarcinoma. Thus, the early detection of hepatic fibrosis and
cirrhosis has important clinical implications. In clinical routine,determination of the severity of liver injury and the requirementof antiviral therapy is often based on the histology of the liverparenchyma [3,4].
Biopsy is thus considered the gold standard for thediagnosing and staging of cirrhosis. The risk of diseaseprogression can be monitored by the sequential histologicalgrading of inflammation as well as by the staging of fibrosis [2].However, liver biopsy is poorly accepted by patients and has arisk of various complications, such as hemorrhage andinfection. In addition, liver biopsies may be prone to samplingerrors and inter-observer variability due to subjectivemorphological evaluation [5,6]. Therefore, non-invasivequantitative markers or diagnostic tests are required to assessthe presence and severity of liver cirrhosis. Several non-invasive diagnostic methods for fibrosis or cirrhosis have beenevaluated. These methods mainly include either clinical signs,
PLOS ONE | www.plosone.org 1 December 2013 | Volume 8 | Issue 12 | e85658
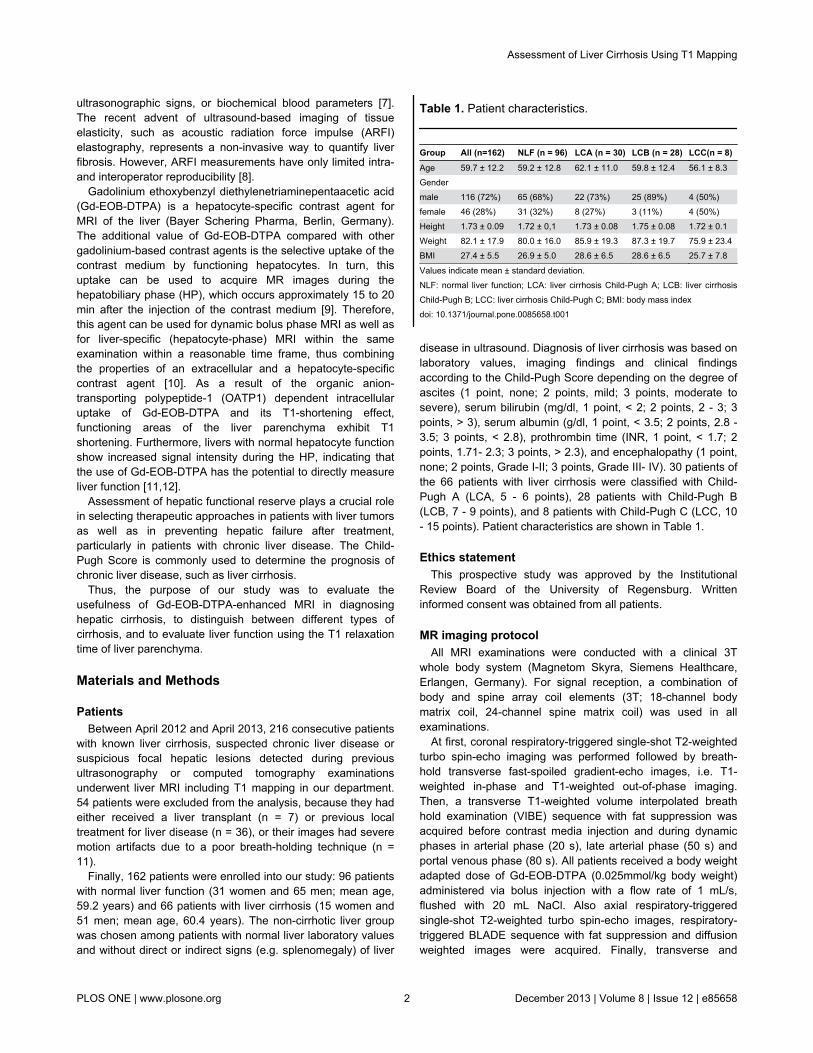
ultrasonographic signs, or biochemical blood parameters [7].The recent advent of ultrasound-based imaging of tissueelasticity, such as acoustic radiation force impulse (ARFI)elastography, represents a non-invasive way to quantify liverfibrosis. However, ARFI measurements have only limited intra-and interoperator reproducibility [8].
Gadolinium ethoxybenzyl diethylenetriaminepentaacetic acid(Gd-EOB-DTPA) is a hepatocyte-specific contrast agent forMRI of the liver (Bayer Schering Pharma, Berlin, Germany).The additional value of Gd-EOB-DTPA compared with othergadolinium-based contrast agents is the selective uptake of thecontrast medium by functioning hepatocytes. In turn, thisuptake can be used to acquire MR images during thehepatobiliary phase (HP), which occurs approximately 15 to 20min after the injection of the contrast medium [9]. Therefore,this agent can be used for dynamic bolus phase MRI as well asfor liver-specific (hepatocyte-phase) MRI within the sameexamination within a reasonable time frame, thus combiningthe properties of an extracellular and a hepatocyte-specificcontrast agent [10]. As a result of the organic anion-transporting polypeptide-1 (OATP1) dependent intracellularuptake of Gd-EOB-DTPA and its T1-shortening effect,functioning areas of the liver parenchyma exhibit T1shortening. Furthermore, livers with normal hepatocyte functionshow increased signal intensity during the HP, indicating thatthe use of Gd-EOB-DTPA has the potential to directly measureliver function [11,12].
Assessment of hepatic functional reserve plays a crucial rolein selecting therapeutic approaches in patients with liver tumorsas well as in preventing hepatic failure after treatment,particularly in patients with chronic liver disease. The Child-Pugh Score is commonly used to determine the prognosis ofchronic liver disease, such as liver cirrhosis.
Thus, the purpose of our study was to evaluate theusefulness of Gd-EOB-DTPA-enhanced MRI in diagnosinghepatic cirrhosis, to distinguish between different types ofcirrhosis, and to evaluate liver function using the T1 relaxationtime of liver parenchyma.
Materials and Methods
PatientsBetween April 2012 and April 2013, 216 consecutive patients
with known liver cirrhosis, suspected chronic liver disease orsuspicious focal hepatic lesions detected during previousultrasonography or computed tomography examinationsunderwent liver MRI including T1 mapping in our department.54 patients were excluded from the analysis, because they hadeither received a liver transplant (n = 7) or previous localtreatment for liver disease (n = 36), or their images had severemotion artifacts due to a poor breath-holding technique (n =11).
Finally, 162 patients were enrolled into our study: 96 patientswith normal liver function (31 women and 65 men; mean age,59.2 years) and 66 patients with liver cirrhosis (15 women and51 men; mean age, 60.4 years). The non-cirrhotic liver groupwas chosen among patients with normal liver laboratory valuesand without direct or indirect signs (e.g. splenomegaly) of liver
disease in ultrasound. Diagnosis of liver cirrhosis was based onlaboratory values, imaging findings and clinical findingsaccording to the Child-Pugh Score depending on the degree ofascites (1 point, none; 2 points, mild; 3 points, moderate tosevere), serum bilirubin (mg/dl, 1 point, < 2; 2 points, 2 - 3; 3points, > 3), serum albumin (g/dl, 1 point, < 3.5; 2 points, 2.8 -3.5; 3 points, < 2.8), prothrombin time (INR, 1 point, < 1.7; 2points, 1.71- 2.3; 3 points, > 2.3), and encephalopathy (1 point,none; 2 points, Grade I-II; 3 points, Grade III- IV). 30 patients ofthe 66 patients with liver cirrhosis were classified with Child-Pugh A (LCA, 5 - 6 points), 28 patients with Child-Pugh B(LCB, 7 - 9 points), and 8 patients with Child-Pugh C (LCC, 10- 15 points). Patient characteristics are shown in Table 1.
Ethics statementThis prospective study was approved by the Institutional
Review Board of the University of Regensburg. Writteninformed consent was obtained from all patients.
MR imaging protocolAll MRI examinations were conducted with a clinical 3T
whole body system (Magnetom Skyra, Siemens Healthcare,Erlangen, Germany). For signal reception, a combination ofbody and spine array coil elements (3T; 18-channel bodymatrix coil, 24-channel spine matrix coil) was used in allexaminations.
At first, coronal respiratory-triggered single-shot T2-weightedturbo spin-echo imaging was performed followed by breath-hold transverse fast-spoiled gradient-echo images, i.e. T1-weighted in-phase and T1-weighted out-of-phase imaging.Then, a transverse T1-weighted volume interpolated breathhold examination (VIBE) sequence with fat suppression wasacquired before contrast media injection and during dynamicphases in arterial phase (20 s), late arterial phase (50 s) andportal venous phase (80 s). All patients received a body weightadapted dose of Gd-EOB-DTPA (0.025mmol/kg body weight)administered via bolus injection with a flow rate of 1 mL/s,flushed with 20 mL NaCl. Also axial respiratory-triggeredsingle-shot T2-weighted turbo spin-echo images, respiratory-triggered BLADE sequence with fat suppression and diffusionweighted images were acquired. Finally, transverse and
Table 1. Patient characteristics.
Group All (n=162) NLF (n = 96) LCA (n = 30) LCB (n = 28) LCC(n = 8)Age 59.7 ± 12.2 59.2 ± 12.8 62.1 ± 11.0 59.8 ± 12.4 56.1 ± 8.3Gender male 116 (72%) 65 (68%) 22 (73%) 25 (89%) 4 (50%)female 46 (28%) 31 (32%) 8 (27%) 3 (11%) 4 (50%)Height 1.73 ± 0.09 1.72 ± 0,1 1.73 ± 0.08 1.75 ± 0.08 1.72 ± 0.1Weight 82.1 ± 17.9 80.0 ± 16.0 85.9 ± 19.3 87.3 ± 19.7 75.9 ± 23.4BMI 27.4 ± 5.5 26.9 ± 5.0 28.6 ± 6.5 28.6 ± 6.5 25.7 ± 7.8
Values indicate mean ± standard deviation.NLF: normal liver function; LCA: liver cirrhosis Child-Pugh A; LCB: liver cirrhosisChild-Pugh B; LCC: liver cirrhosis Child-Pugh C; BMI: body mass indexdoi: 10.1371/journal.pone.0085658.t001
Assessment of Liver Cirrhosis Using T1 Mapping
PLOS ONE | www.plosone.org 2 December 2013 | Volume 8 | Issue 12 | e85658
coronal breath-hold T1-weighted VIBE sequence was repeatedin hepatobiliary phase 20 min after contrast mediaadministration.
In addition to the routine MRI protocol, two TurboFLASHsequences (inversion time (TI), 400 ms, 1000 ms; repetitiontime (TR), 4000 ms; echo time (TE), 1.16 ms; flip angle 8°;slice thickness, 6 mm; FOV 400 mm x 400 mm; matrix size,192 x 192; acquisition time 16s) were acquired to obtain T1maps of the porta hepatis in a single breath-hold before and 20min after Gd-EOB-DTPA administration.
Image analysisThe T1 maps of the liver were generated with the evaluation
tool for calculating T1 relaxation times (Siemens Healthcare,Erlangen, Germany).
In T1 mapping images before and after the administration ofthe contrast medium, regions of interest (ROIs) were locatedwith reasonable care in the right lobe (2 ROIs) and in the leftlobe (1 ROI). We avoided focal hepatic lesions (e.g.hepatocellular carcinoma, hemangioma, cysts, etc.), imagingartifacts, and major branches of the portal or hepatic veins.Each ROI was a circle (size of the ROI ranged between 1.0cm2 and 3.5 cm2) chosen as large as possible. Mean T1 valuesfor the three ROIs were considered as the representative T1value for the liver. ROIs of identical size and shape wereplaced at the same imaging sequence in T1 maps before andafter Gd-EOB-DTPA administration. The reduction rate in T1values between pre- and post-Gd-EOB-DTPA enhancementwas calculated as follows:
Reduction rate of T1 values = T1pre−T1post
T1pre×100 %
T1pre is the T1 relaxation time before Gd-EOB-DTPAadministration and T1post the T1 relaxation time 20 min afterGd-EOB-DTPA administration. T1 maps were color-codedusing a visualization tool of the open source OsiriX imagingsoftware.
Statistical analysisData are expressed as mean ± standard deviation (SD). A
one-way analysis of variance (ANOVA) was used to analyzedifferences between patients with normal liver function andpatients with liver cirrhosis. Post hoc pair-wise comparisonswere made with the Tukey procedure. ROC analyses weredone to differentiate between patient groups, and the optimalcut-off was estimated according to the Youden Index.Estimates for the area under the curve (AUC) as well as trueclassification rates are reported. All tests were two-sided andvalues of p < 0.05 indicated a significant difference. Allstatistical analyses were done with IBM SPSS Statistics(version 20, Chicago, IL) and R 2.14.
Results
Including the results of all patients, the T1 relaxation times ofnon-enhanced MRI (774.2 ms ± 123 ms) and Gd-EOB-DTPA-
enhanced MRI (322.3 ms ± 113 ms) were significantly different(p < 0.001): the mean reduction rate was 58.3% ± 13%.
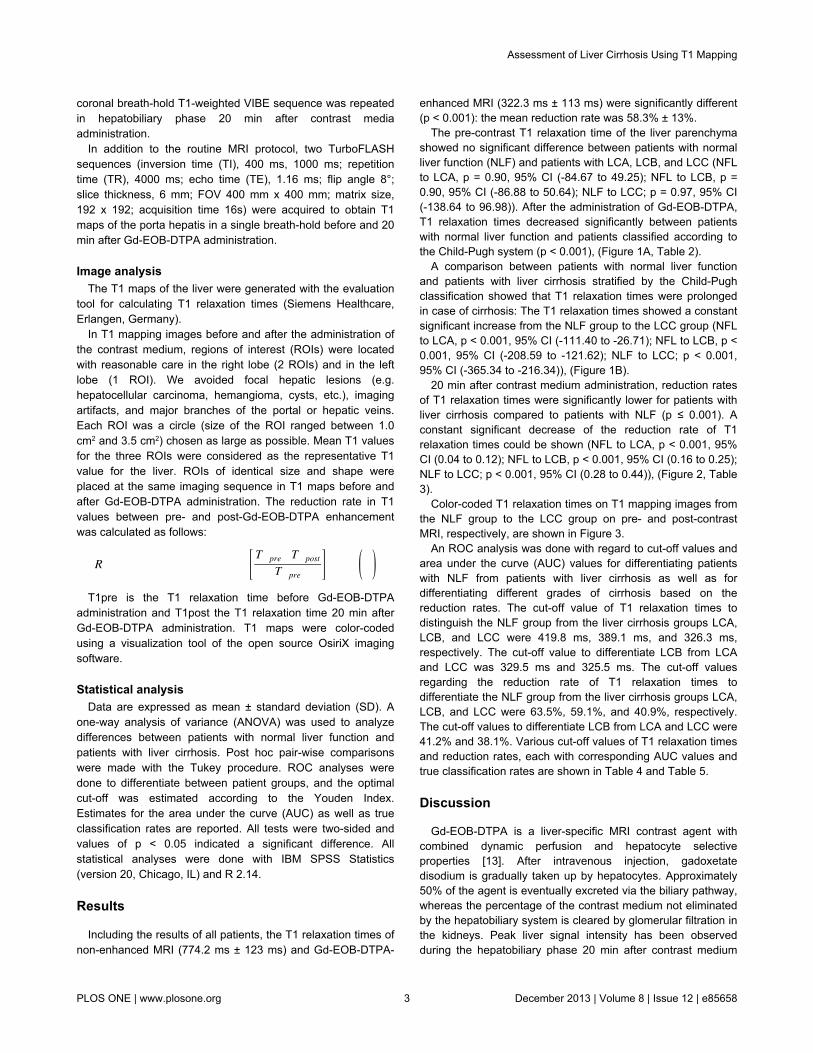
The pre-contrast T1 relaxation time of the liver parenchymashowed no significant difference between patients with normalliver function (NLF) and patients with LCA, LCB, and LCC (NFLto LCA, p = 0.90, 95% CI (-84.67 to 49.25); NFL to LCB, p =0.90, 95% CI (-86.88 to 50.64); NLF to LCC; p = 0.97, 95% CI(-138.64 to 96.98)). After the administration of Gd-EOB-DTPA,T1 relaxation times decreased significantly between patientswith normal liver function and patients classified according tothe Child-Pugh system (p < 0.001), (Figure 1A, Table 2).
A comparison between patients with normal liver functionand patients with liver cirrhosis stratified by the Child-Pughclassification showed that T1 relaxation times were prolongedin case of cirrhosis: The T1 relaxation times showed a constantsignificant increase from the NLF group to the LCC group (NFLto LCA, p < 0.001, 95% CI (-111.40 to -26.71); NFL to LCB, p <0.001, 95% CI (-208.59 to -121.62); NLF to LCC; p < 0.001,95% CI (-365.34 to -216.34)), (Figure 1B).
20 min after contrast medium administration, reduction ratesof T1 relaxation times were significantly lower for patients withliver cirrhosis compared to patients with NLF (p ≤ 0.001). Aconstant significant decrease of the reduction rate of T1relaxation times could be shown (NFL to LCA, p < 0.001, 95%CI (0.04 to 0.12); NFL to LCB, p < 0.001, 95% CI (0.16 to 0.25);NLF to LCC; p < 0.001, 95% CI (0.28 to 0.44)), (Figure 2, Table3).
Color-coded T1 relaxation times on T1 mapping images fromthe NLF group to the LCC group on pre- and post-contrastMRI, respectively, are shown in Figure 3.
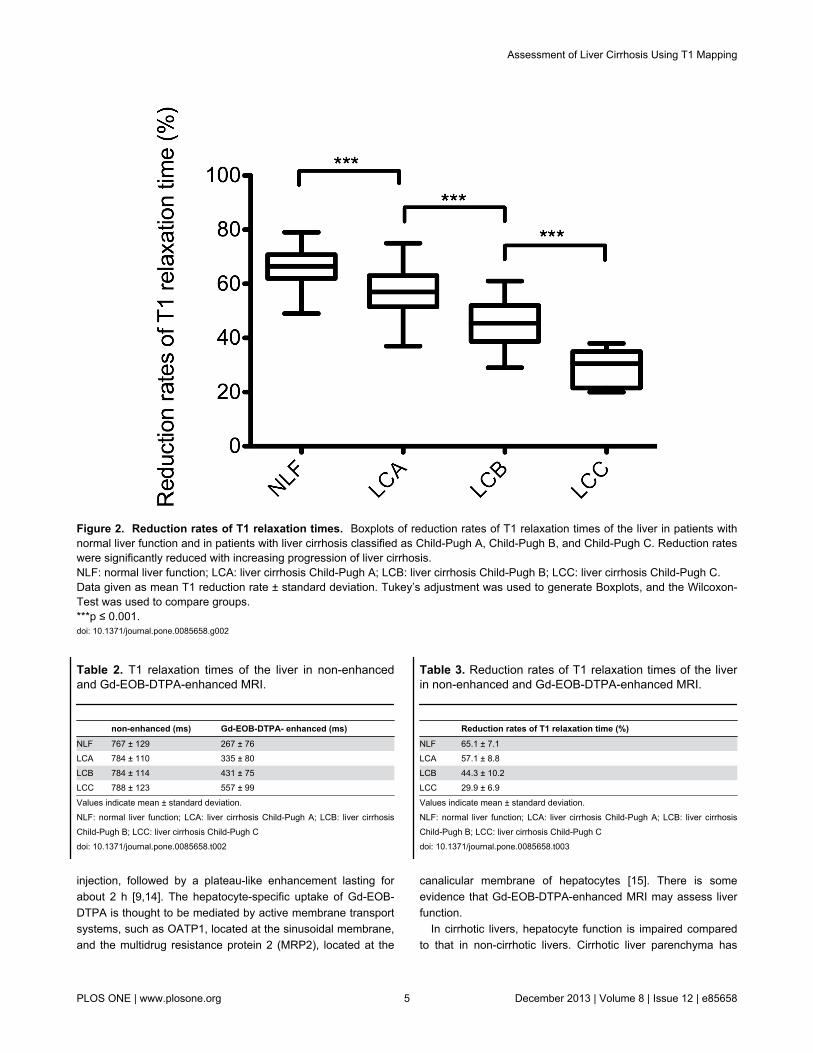
An ROC analysis was done with regard to cut-off values andarea under the curve (AUC) values for differentiating patientswith NLF from patients with liver cirrhosis as well as fordifferentiating different grades of cirrhosis based on thereduction rates. The cut-off value of T1 relaxation times todistinguish the NLF group from the liver cirrhosis groups LCA,LCB, and LCC were 419.8 ms, 389.1 ms, and 326.3 ms,respectively. The cut-off value to differentiate LCB from LCAand LCC was 329.5 ms and 325.5 ms. The cut-off valuesregarding the reduction rate of T1 relaxation times todifferentiate the NLF group from the liver cirrhosis groups LCA,LCB, and LCC were 63.5%, 59.1%, and 40.9%, respectively.The cut-off values to differentiate LCB from LCA and LCC were41.2% and 38.1%. Various cut-off values of T1 relaxation timesand reduction rates, each with corresponding AUC values andtrue classification rates are shown in Table 4 and Table 5.
Discussion
Gd-EOB-DTPA is a liver-specific MRI contrast agent withcombined dynamic perfusion and hepatocyte selectiveproperties [13]. After intravenous injection, gadoxetatedisodium is gradually taken up by hepatocytes. Approximately50% of the agent is eventually excreted via the biliary pathway,whereas the percentage of the contrast medium not eliminatedby the hepatobiliary system is cleared by glomerular filtration inthe kidneys. Peak liver signal intensity has been observedduring the hepatobiliary phase 20 min after contrast medium
Assessment of Liver Cirrhosis Using T1 Mapping
PLOS ONE | www.plosone.org 3 December 2013 | Volume 8 | Issue 12 | e85658
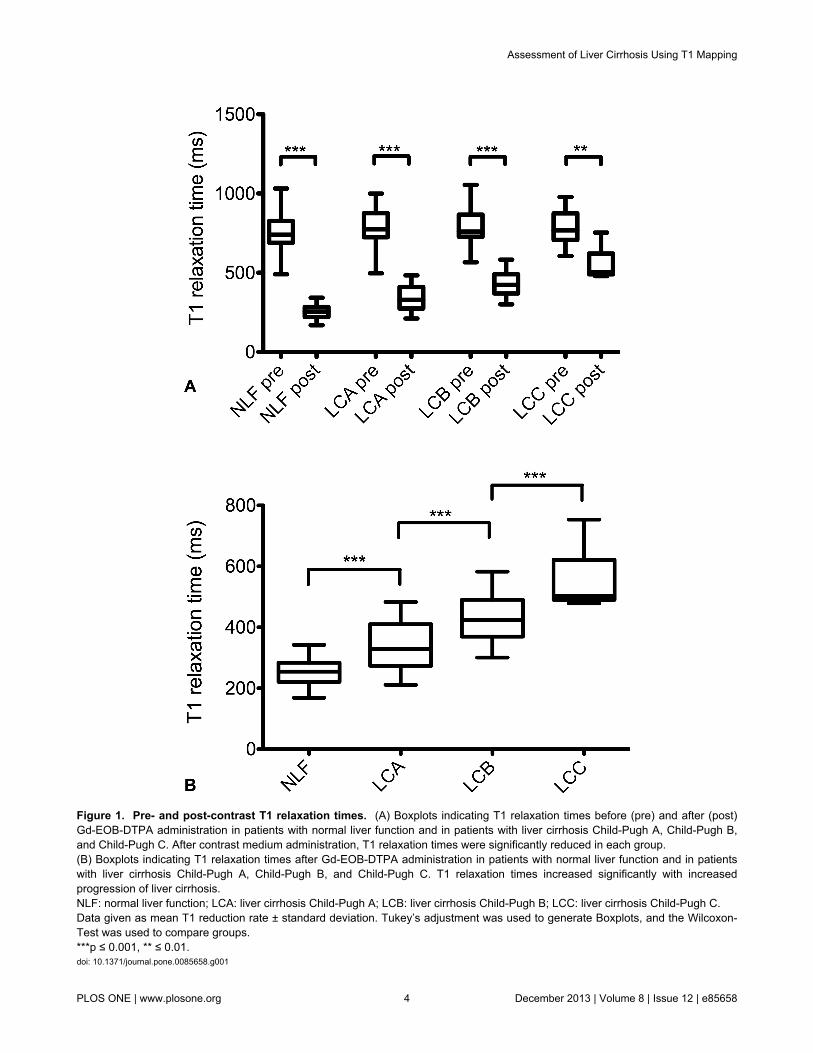
Figure 1. Pre- and post-contrast T1 relaxation times. (A) Boxplots indicating T1 relaxation times before (pre) and after (post)Gd-EOB-DTPA administration in patients with normal liver function and in patients with liver cirrhosis Child-Pugh A, Child-Pugh B,and Child-Pugh C. After contrast medium administration, T1 relaxation times were significantly reduced in each group.(B) Boxplots indicating T1 relaxation times after Gd-EOB-DTPA administration in patients with normal liver function and in patientswith liver cirrhosis Child-Pugh A, Child-Pugh B, and Child-Pugh C. T1 relaxation times increased significantly with increasedprogression of liver cirrhosis.NLF: normal liver function; LCA: liver cirrhosis Child-Pugh A; LCB: liver cirrhosis Child-Pugh B; LCC: liver cirrhosis Child-Pugh C.Data given as mean T1 reduction rate ± standard deviation. Tukey’s adjustment was used to generate Boxplots, and the Wilcoxon-Test was used to compare groups.***p ≤ 0.001, ** ≤ 0.01.doi: 10.1371/journal.pone.0085658.g001
Assessment of Liver Cirrhosis Using T1 Mapping
PLOS ONE | www.plosone.org 4 December 2013 | Volume 8 | Issue 12 | e85658
injection, followed by a plateau-like enhancement lasting forabout 2 h [9,14]. The hepatocyte-specific uptake of Gd-EOB-DTPA is thought to be mediated by active membrane transportsystems, such as OATP1, located at the sinusoidal membrane,and the multidrug resistance protein 2 (MRP2), located at the
Table 2. T1 relaxation times of the liver in non-enhancedand Gd-EOB-DTPA-enhanced MRI.
non-enhanced (ms) Gd-EOB-DTPA- enhanced (ms)NLF 767 ± 129 267 ± 76LCA 784 ± 110 335 ± 80LCB 784 ± 114 431 ± 75LCC 788 ± 123 557 ± 99
Values indicate mean ± standard deviation.NLF: normal liver function; LCA: liver cirrhosis Child-Pugh A; LCB: liver cirrhosisChild-Pugh B; LCC: liver cirrhosis Child-Pugh Cdoi: 10.1371/journal.pone.0085658.t002
canalicular membrane of hepatocytes [15]. There is someevidence that Gd-EOB-DTPA-enhanced MRI may assess liverfunction.
In cirrhotic livers, hepatocyte function is impaired comparedto that in non-cirrhotic livers. Cirrhotic liver parenchyma has
Table 3. Reduction rates of T1 relaxation times of the liverin non-enhanced and Gd-EOB-DTPA-enhanced MRI.
Reduction rates of T1 relaxation time (%)NLF 65.1 ± 7.1LCA 57.1 ± 8.8LCB 44.3 ± 10.2LCC 29.9 ± 6.9
Values indicate mean ± standard deviation.NLF: normal liver function; LCA: liver cirrhosis Child-Pugh A; LCB: liver cirrhosisChild-Pugh B; LCC: liver cirrhosis Child-Pugh Cdoi: 10.1371/journal.pone.0085658.t003
Figure 2. Reduction rates of T1 relaxation times. Boxplots of reduction rates of T1 relaxation times of the liver in patients withnormal liver function and in patients with liver cirrhosis classified as Child-Pugh A, Child-Pugh B, and Child-Pugh C. Reduction rateswere significantly reduced with increasing progression of liver cirrhosis.NLF: normal liver function; LCA: liver cirrhosis Child-Pugh A; LCB: liver cirrhosis Child-Pugh B; LCC: liver cirrhosis Child-Pugh C.Data given as mean T1 reduction rate ± standard deviation. Tukey’s adjustment was used to generate Boxplots, and the Wilcoxon-Test was used to compare groups.***p ≤ 0.001.doi: 10.1371/journal.pone.0085658.g002
Assessment of Liver Cirrhosis Using T1 Mapping
PLOS ONE | www.plosone.org 5 December 2013 | Volume 8 | Issue 12 | e85658
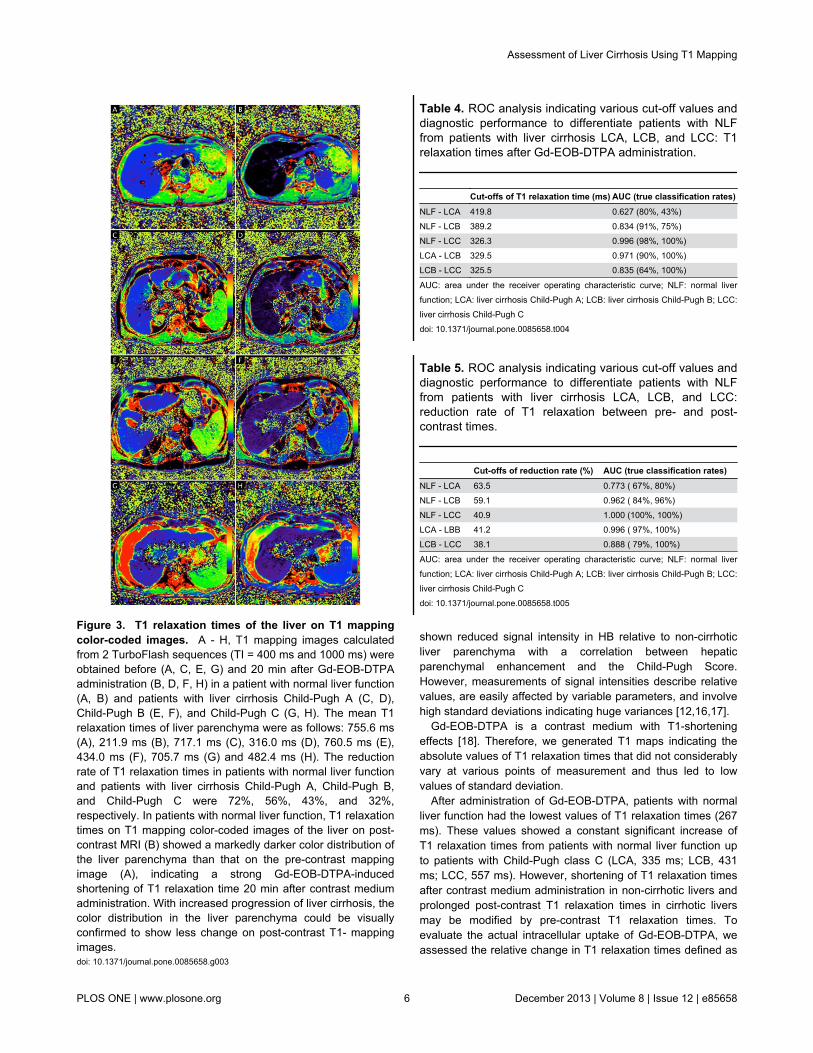
Figure 3. T1 relaxation times of the liver on T1 mappingcolor-coded images. A - H, T1 mapping images calculatedfrom 2 TurboFlash sequences (TI = 400 ms and 1000 ms) wereobtained before (A, C, E, G) and 20 min after Gd-EOB-DTPAadministration (B, D, F, H) in a patient with normal liver function(A, B) and patients with liver cirrhosis Child-Pugh A (C, D),Child-Pugh B (E, F), and Child-Pugh C (G, H). The mean T1relaxation times of liver parenchyma were as follows: 755.6 ms(A), 211.9 ms (B), 717.1 ms (C), 316.0 ms (D), 760.5 ms (E),434.0 ms (F), 705.7 ms (G) and 482.4 ms (H). The reductionrate of T1 relaxation times in patients with normal liver functionand patients with liver cirrhosis Child-Pugh A, Child-Pugh B,and Child-Pugh C were 72%, 56%, 43%, and 32%,respectively. In patients with normal liver function, T1 relaxationtimes on T1 mapping color-coded images of the liver on post-contrast MRI (B) showed a markedly darker color distribution ofthe liver parenchyma than that on the pre-contrast mappingimage (A), indicating a strong Gd-EOB-DTPA-inducedshortening of T1 relaxation time 20 min after contrast mediumadministration. With increased progression of liver cirrhosis, thecolor distribution in the liver parenchyma could be visuallyconfirmed to show less change on post-contrast T1- mappingimages.doi: 10.1371/journal.pone.0085658.g003
shown reduced signal intensity in HB relative to non-cirrhoticliver parenchyma with a correlation between hepaticparenchymal enhancement and the Child-Pugh Score.However, measurements of signal intensities describe relativevalues, are easily affected by variable parameters, and involvehigh standard deviations indicating huge variances [12,16,17].
Gd-EOB-DTPA is a contrast medium with T1-shorteningeffects [18]. Therefore, we generated T1 maps indicating theabsolute values of T1 relaxation times that did not considerablyvary at various points of measurement and thus led to lowvalues of standard deviation.
After administration of Gd-EOB-DTPA, patients with normalliver function had the lowest values of T1 relaxation times (267ms). These values showed a constant significant increase ofT1 relaxation times from patients with normal liver function upto patients with Child-Pugh class C (LCA, 335 ms; LCB, 431ms; LCC, 557 ms). However, shortening of T1 relaxation timesafter contrast medium administration in non-cirrhotic livers andprolonged post-contrast T1 relaxation times in cirrhotic liversmay be modified by pre-contrast T1 relaxation times. Toevaluate the actual intracellular uptake of Gd-EOB-DTPA, weassessed the relative change in T1 relaxation times defined as
Table 4. ROC analysis indicating various cut-off values anddiagnostic performance to differentiate patients with NLFfrom patients with liver cirrhosis LCA, LCB, and LCC: T1relaxation times after Gd-EOB-DTPA administration.
Cut-offs of T1 relaxation time (ms) AUC (true classification rates)NLF - LCA 419.8 0.627 (80%, 43%)NLF - LCB 389.2 0.834 (91%, 75%)NLF - LCC 326.3 0.996 (98%, 100%)LCA - LCB 329.5 0.971 (90%, 100%)LCB - LCC 325.5 0.835 (64%, 100%)
AUC: area under the receiver operating characteristic curve; NLF: normal liverfunction; LCA: liver cirrhosis Child-Pugh A; LCB: liver cirrhosis Child-Pugh B; LCC:liver cirrhosis Child-Pugh Cdoi: 10.1371/journal.pone.0085658.t004
Table 5. ROC analysis indicating various cut-off values anddiagnostic performance to differentiate patients with NLFfrom patients with liver cirrhosis LCA, LCB, and LCC:reduction rate of T1 relaxation between pre- and post-contrast times.
Cut-offs of reduction rate (%) AUC (true classification rates)NLF - LCA 63.5 0.773 ( 67%, 80%)NLF - LCB 59.1 0.962 ( 84%, 96%)NLF - LCC 40.9 1.000 (100%, 100%)LCA - LBB 41.2 0.996 ( 97%, 100%)LCB - LCC 38.1 0.888 ( 79%, 100%)
AUC: area under the receiver operating characteristic curve; NLF: normal liverfunction; LCA: liver cirrhosis Child-Pugh A; LCB: liver cirrhosis Child-Pugh B; LCC:liver cirrhosis Child-Pugh Cdoi: 10.1371/journal.pone.0085658.t005
Assessment of Liver Cirrhosis Using T1 Mapping
PLOS ONE | www.plosone.org 6 December 2013 | Volume 8 | Issue 12 | e85658
the reduction rate, which was 65.1% in non-cirrhotic patients.This percentage was further decreased with increasedprogression of liver cirrhosis (LCA, 57.1%; LCB, 44.3%, LCC,29.9%). The reduced Gd-EOB-DTPA uptake may be either dueto a decreased number of normal hepatocytes according tocharacteristic morphological changes in cirrhotic liver tissue ordue to a decreased Gd-EOB-DTPA uptake by hepatocytes,attributed to diminished OATP1 activity, resulting in lower Gd-EOB-DTPA intracellular hepatocyte uptake [19]. In animalmodels, the expression of organic anion-transporting proteinshas been reported to decrease in hepatitis and cirrhosis and toup-regulate MRP2 activity [20,21].
However, it is still uncertain whether morphologicallyadvanced cirrhosis would impair the uptake of Gd-EOB-DTPAand, in turn, reduce liver parenchymal enhancement after Gd-EOB-DTPA administration because of the expected impairmentof hepatocyte function or the decreased number ofhepatocytes. In this context, it has been reported thatdecreased hepatic enhancement in patients with impairedhepatocyte function may impede the detection of focal liverlesions because of the reduced contrast between the lesionand the surrounding liver parenchyma [22]. Therefore, thedetection of focal liver lesions in patients with impaired liverfunction, such as severe cirrhosis, also represents a challengein daily clinical routine.
Because the intracellular uptake of Gd-EOB-DTPAdecreases with impaired liver function, measurement of T1relaxation times in Gd-EOB-DTPA-enhanced images may be anew, non-invasive technique to quantify the actual function ofhepatocytes.
In line with the controversial findings in the current literature[23,24], we did not find any significant differences in T1relaxation times between patients with normal liver function andpatients with liver cirrhosis in non-enhanced images (NLF: 767ms ± 129 ms; LCA: 784 ms ± 110 ms; LCB: 784 ms ± 114 ms;LCC, 788 ms ± 123 ms). Liver cirrhosis involves increaseddeposition of manganese, copper, iron, and collagen ─paramagnetic macromolecules that induce T1-shorteningeffects [25,26]. However, characteristics of T1 relaxation timesin healthy and cirrhotic patients has been discussedcontroversially in the literature: Contrary to our findings,Thomson et al. indicated that tissue remodeling in livercirrhosis may be reflected in prolonged T1 relaxation times[27], a conclusion that has been supported by other recentstudies [17,28]. These findings have been validated in somerecent animal studies that showed an increase in T1 relaxationtimes in CCL4-induced liver fibrosis. However, this increase ismost likely caused by pathophysiological processes of inducedliver fibrogenesis characterized by edema, inflammation, andsynthesis of the extracellular matrix [29,30]. At this early stageof fibrous formation, the tissue is often edematous becausenew vessels have leaky interendothelial junctions, allowing thepassage of proteins and red blood cells into the extravascularspace [31]. This process results in augmented hepatic watercontent, hypercellularity, and an increase in the ratio of free tobound water with consecutive prolonged T1 relaxation times
[32,33]. However, increases of T1 relaxation times could alsobe observed in a bile-duct ligation model, which is anothercommon method to induce liver fibrosis, resulting in minimalinflammation and limited edema. Such increases are mostlikely due to an increase in water-containing small biliary ducts[34].
Advanced stages of cirrhosis show increased extracellularconstituents, mostly collagen, and a decreased number ofactive fibroblasts and new vessels, resulting in lower total watercontents and consecutively decreased T1 relaxation times. Inthe clinical setting, liver cirrhosis is mostly an expression ofchronic liver disease and is not commonly combined with acuteinflammation. Kim et al. have recently reported a significantshortened T1 value in patients with liver cirrhosis measured bymeans of an unenhanced 3T system [35]. These controversialfindings indicate that non-enhanced MRI is unlikely to be anappropriate method for detecting and staging liver fibrosis.
Our study supports the conclusion that measuring T1relaxation times by means of Gd-EOB-DTPA-enhanced MRImay be incorporated into the clinical routine as a screening testof liver imaging to detect silent disease and to define the stageof existing disease or liver function in pre- or postoperativeassessments, while extending the acquisition time of a liverMRI protocol by only 32 s.
Our study has several limitations. First, the trial was a single-center study with a limited patient population. Second, ourstudy included various types of cirrhosis, such as cirrhosisinduced by alcohol, cirrhosis based on longtime viral hepatitis,or a combination of both. Future studies should use ahomogenous patient population because the etiology ofcirrhosis has an impact on parenchymal changes and may thusinfluence the resulting T1 maps.
Third, some evidence exists that clinical Child-Pugh scoresare related to histopathological fibrosis, and Child-Pughclassification has been proven to correctly assess diseasestages in clinical practice. However, results of T1 mappingneeds to be evaluated in comparison to histopathologicalresults to prove that disease progression into higher Child-Pugh classes also reflects progressive parenchymal changes.
Finally, we compared the hepatic intracellular uptake of Gd-EOB-DTPA only with the Child-Pugh classification but did notevaluate other liver function tests, such as ICG test. Therefore,further studies are required in this respect.
In conclusion, T1 mapping by means of non-enhanced andGd-EOB-DTPA-enhanced MRI may provide suitable and robustparameters for detecting and characterizing liver cirrhosis at anearly stage. Additionally, this method may be useful formonitoring disease progression and has the potential tobecome a novel index of global and remnant liver function.
Author Contributions
Conceived and designed the experiments: MH NV CF RMWAGS CS PW. Performed the experiments: MH NV CF.Analyzed the data: MH NV FZ. Contributed reagents/materials/analysis tools: MH NV CF PW. Wrote the manuscript: MH PW.
Assessment of Liver Cirrhosis Using T1 Mapping
PLOS ONE | www.plosone.org 7 December 2013 | Volume 8 | Issue 12 | e85658
References
1. Schuppan D, Afdhal NH (2008) Liver cirrhosis. Lancet 371: 838-851.doi:10.1016/S0140-6736(08)60383-9. PubMed: 18328931.
2. Schuppan D, Kim YO (2013) Evolving therapies for liver fibrosis. J ClinInvest 123: 1887-1901. doi:10.1172/JCI66028. PubMed: 23635787.
3. Kumada H, Okanoue T, Onji M, Moriwaki H, Izumi N et al. (2010)Guidelines for the treatment of chronic hepatitis and cirrhosis due tohepatitis B virus infection for the fiscal year 2008 in Japan. Hepatol Res40: 1-7. doi:10.1111/j.1872-034X.2009.00633.x. PubMed: 20156295.
4. Kim AI, Saab S (2005) Treatment of hepatitis C. Am J Med 118:808-815. doi:10.1016/j.amjmed.2005.01.073. PubMed: 16084169.
5. Regev A, Berho M, Jeffers LJ, Milikowski C, Molina EG et al. (2002)Sampling error and intraobserver variation in liver biopsy in patientswith chronic HCV infection. Am J Gastroenterol 97: 2614-2618. doi:10.1111/j.1572-0241.2002.06038.x. PubMed: 12385448.
6. Bedossa P, Poynard T (1996) An algorithm for the grading of activity inchronic hepatitis C. The METAVIR Cooperative Study Group.Hepatology 24: 289-293. doi:10.1002/hep.510240201. PubMed:8690394.
7. Nojiri S, Kusakabe A, Fujiwara K, Shinkai N, Matsuura K et al. (2013)Noninvasive evaluation of hepatic fibrosis in HCV-infected patientsusing EOB-MR imaging. J Gastroenterol Hepatol.
8. Bota S, Sporea I, Sirli R, Popescu A, Danila M et al. (2012) Intra- andinteroperator reproducibility of acoustic radiation force impulse (ARFI)elastography--preliminary results. Ultrasound Med Biol 38: 1103-1108.doi:10.1016/j.ultrasmedbio.2012.02.032. PubMed: 22579536.
9. Frericks BB, Loddenkemper C, Huppertz A, Valdeig S, Stroux A et al.(2009) Qualitative and quantitative evaluation of hepatocellularcarcinoma and cirrhotic liver enhancement using Gd-EOB-DTPA. AJRAm J Roentgenol 193: 1053-1060. doi:10.2214/AJR.08.1946. PubMed:19770329.
10. Zech CJ, Herrmann KA, Reiser MF, Schoenberg SO (2007) MRimaging in patients with suspected liver metastases: value of liver-specific contrast agent Gd-EOB-DTPA. Magn. Reson - Med Sci 6:43-52. doi:10.2463/mrms.6.43.
11. Tschirch FT, Struwe A, Petrowsky H, Kakales I, Marincek B et al.(2008) Contrast-enhanced MR cholangiography with Gd-EOB-DTPA inpatients with liver cirrhosis: visualization of the biliary ducts incomparison with patients with normal liver parenchyma. Eur Radiol 18:1577-1586. doi:10.1007/s00330-008-0929-6. PubMed: 18369632.
12. Tamada T, Ito K, Higaki A, Yoshida K, Kanki A et al. (2011) Gd-EOB-DTPA-enhanced MR imaging: evaluation of hepatic enhancementeffects in normal and cirrhotic livers. Eur J Radiol 80: e311-e316. doi:10.1016/j.ejrad.2011.01.020. PubMed: 21315529.
13. Bluemke DA, Sahani D, Amendola M, Balzer T, Breuer J et al. (2005)Efficacy and safety of MR imaging with liver-specific contrast agent:U.S. multicenter phase III study. Radiology 237: 89-98. doi:10.1148/radiol.2371031842. PubMed: 16126918.
14. Hamm B, Staks T, Mühler A, Bollow M, Taupitz M et al. (1995) Phase Iclinical evaluation of Gd-EOB-DTPA as a hepatobiliary MR contrastagent: safety, pharmacokinetics, and MR imaging. Radiology 195:785-792. PubMed: 7754011.
15. Tsuda N, Matsui O (2010) Cirrhotic rat liver: reference to transporteractivity and morphologic changes in bile canaliculi--gadoxetic acid-enhanced MR imaging. Radiology 256: 767-773. doi:10.1148/radiol.10092065. PubMed: 20663976.
16. Tsuda N, Okada M, Murakami T (2007) Potential of gadolinium-ethoxybenzyl-diethylenetriamine pentaacetic acid (Gd-EOB-DTPA) fordifferential diagnosis of nonalcoholic steatohepatitis and fatty liver inrats using magnetic resonance imaging. Invest Radiol 42: 242-247. doi:10.1097/01.rli.0000258058.44876.a5. PubMed: 17351431.
17. Katsube T, Okada M, Kumano S, Hori M, Imaoka I et al. (2011)Estimation of liver function using T1 mapping on Gd-EOB-DTPA-enhanced magnetic resonance imaging. Invest Radiol 46: 277-283. doi:10.1097/RLI.0b013e318200f67d. PubMed: 21343827.
18. Seale MK, Catalano OA, Saini S, Hahn PF, Sahani DV (2009)Hepatobiliary-specific MR contrast agents: role in imaging the liver and
biliary tree. RadioGraphics 29: 1725-1748. doi:10.1148/rg.296095515.PubMed: 19959518.
19. Malhi H, Gores GJ (2008) Cellular and molecular mechanisms of liverinjury. Gastroenterology 134: 1641-1654. doi:10.1053/j.gastro.2008.03.002. PubMed: 18471544.
20. Tsuda N, Harada K, Matsui O (2011) Effect of change in transporterexpression on gadolinium-ethoxybenzyl-diethylenetriamine pentaaceticacid-enhanced magnetic resonance imaging duringhepatocarcinogenesis in rats. J Gastroenterol Hepatol 26: 568-576. doi:10.1111/j.1440-1746.2010.06494.x. PubMed: 21332553.
21. Geier A, Dietrich CG, Voigt S, Kim SK, Gerloff T et al. (2003) Effects ofproinflammatory cytokines on rat organic anion transporters duringtoxic liver injury and cholestasis. Hepatology 38: 345-354. doi:10.1053/jhep.2003.50317. PubMed: 12883478.
22. Ichikawa T, Saito K, Yoshioka N, Tanimoto A, Gokan T et al. (2010)Detection and characterization of focal liver lesions: a Japanese phaseIII, multicenter comparison between gadoxetic acid disodium-enhancedmagnetic resonance imaging and contrast-enhanced computedtomography predominantly in patients with hepatocellular carcinomaand chronic liver disease. Invest Radiol 45: 133-141. doi:10.1097/RLI.0b013e3181caea5b. PubMed: 20098330.
23. Kreft B, Dombrowski F, Block W, Bachmann R, Pfeifer U et al. (1999)Evaluation of different models of experimentally induced liver cirrhosisfor MRI research with correlation to histopathologic findings. InvestRadiol 34: 360-366. doi:10.1097/00004424-199905000-00006.PubMed: 10226849.
24. Goldberg HI, Moss AA, Stark DD, McKerrow J, Engelstad B et al.(1984) Hepatic cirrhosis: magnetic resonance imaging. Radiology 153:737-739. PubMed: 6494469.
25. Ito K, Mitchell DG, Gabata T, Hann HW, Kim PN et al. (1999)Hepatocellular carcinoma: association with increased iron deposition inthe cirrhotic liver at MR imaging. Radiology 212: 235-240. doi:10.1148/radiology.212.1.r99jl41235. PubMed: 10405747.
26. Bataller R, Brenner DA (2005) Liver fibrosis. J Clin Invest 115: 209-218.doi:10.1172/JCI200524282. PubMed: 15690074.
27. Thomsen C, Christoffersen P, Henriksen O, Juhl E (1990) ProlongedT1 in patients with liver cirrhosis: an in vivo MRI study. Magn ResonImaging 8: 599-604. doi:10.1016/0730-725X(90)90137-Q. PubMed:2082130.
28. Heye T, Yang SR, Bock M, Brost S, Weigand K et al. (2012) MRrelaxometry of the liver: significant elevation of T1 relaxation time inpatients with liver cirrhosis. Eur Radiol 22: 1224-1232. doi:10.1007/s00330-012-2378-5. PubMed: 22302503.
29. Aisen AM, Doi K, Swanson SD (1994) Detection of liver fibrosis withmagnetic cross-relaxation. Magn Reson Med 31: 551-556. doi:10.1002/mrm.1910310513. PubMed: 8015410.
30. Chow AM, Gao DS, Fan SJ, Qiao Z, Lee FY et al. (2012) Measurementof liver T(1) and T(2) relaxation times in an experimental mouse modelof liver fibrosis. J Magn Reson Imaging 36: 152-158. doi:10.1002/jmri.23606. PubMed: 22334510.
31. Lee JK, Glazer HS (1990) Controversy in the MR imaging appearanceof fibrosis. Radiology 177: 21-22. PubMed: 2399319.
32. Wynn TA (2008) Cellular and molecular mechanisms of fibrosis. JPathol 214: 199-210. doi:10.1002/path.2277. PubMed: 18161745.
33. Chamuleau RA, Creyghton JH, De Nie I, Moerland MA, Van der LendeOR et al. (1988) Is the magnetic resonance imaging proton spin-latticerelaxation time a reliable noninvasive parameter of developing liverfibrosis? Hepatology 8: 217-221. doi:10.1002/hep.1840080204.PubMed: 3356402.
34. Aubé C, Moal F, Oberti F, Roux J, Croquet V et al. (2007) Diagnosisand measurement of liver fibrosis by MRI in bile duct ligated rats. DigDis Sci 52: 2601-2609. doi:10.1007/s10620-006-9143-z. PubMed:17429735.
35. Kim KA, Park MS, Kim IS, Kiefer B, Chung WS et al. (2012)Quantitative evaluation of liver cirrhosis using T1 relaxation time with 3tesla MRI before and after oxygen inhalation. J Magn Reson Imaging36: 405-410. doi:10.1002/jmri.23620. PubMed: 22392835.
Assessment of Liver Cirrhosis Using T1 Mapping
PLOS ONE | www.plosone.org 8 December 2013 | Volume 8 | Issue 12 | e85658