Embed Size (px)
Citation preview

1
Mapping the Hampshire Ecological Network
On behalf of the Local Nature Partnership
Updated November 2018
Nicky Court, Manager, Hampshire Biodiversity Information Centre Tel. 01962 832322, email: [email protected]
Wolfgang Ritter, Senior Ecologist, Hampshire Biodiversity Information Centre.
Tel. 01962 832324, email: [email protected]

2
1. Introduction The Hampshire Biodiversity Information Centre (HBIC) was contracted by Natural England in 2015 to produce a detailed Ecological Network Map for Hampshire on behalf of the Local Nature Partnership (LNP). A draft was produced in 2016 and has since been road tested and updated to reflect changes in site designations and habitat mapping over the intervening period. A yearly update is recommended going forward. The map represents the hierarchy of international, national and locally designated sites of importance for biodiversity, plus other priority habitats and, importantly, areas identified for habitat restoration or creation. At the same time the boundaries of Biodiversity Opportunity Areas (BOAs, established in 2009) have also been updated to reflect recent changes. BOAs are based on the same mapping as the detailed network and can be said to form the “Strategic Ecological Network” representing a more targeted landscape-scale approach to conserving biodiversity in Hampshire where resources could be focused to have the greatest positive impact for wildlife. The mapping covers the administrative county of Hampshire which includes eleven District Councils; the two unitary authorities of Southampton and Portsmouth; the New Forest National Park; and part of the South Downs National Park. The requirement for local planning authorities to map and consider ecological networks within their plans, policies and decisions is referenced in several places in the National Planning Policy Framework (updated 2018): Para 170 states that “Planning policies and decisions should contribute to and enhance the natural and local environment by ….. minimising impacts on and providing net gains for biodiversity, including by establishing coherent ecological networks that are more resilient to current and future pressures.” Para 174 states that “To protect and enhance biodiversity and geodiversity, plans should: a) Identify, map and safeguard components of local wildlife-rich habitats and wider
ecological networks, including the hierarchy of international, national and locally designated sites of importance for biodiversity; wildlife corridors and stepping stones that connect them; and areas identified by national and local partnerships for habitat management, enhancement, restoration or creation; and
b) Promote the conservation, restoration and enhancement of priority habitats, ecological networks and the protection and recovery of priority species; and identify and pursue opportunities for securing measurable net gains for biodiversity.
2. Background to Ecological Networks
Many habitats in England are now far more fragmented that they were 50 years ago, with patches smaller and more isolated. Fragmentation is a significant cause of species decline. In 2010, an independent review of England’s wildlife sites and ecological networks, chaired by Professor Sir John Lawton, concluded unequivocally that England’s collection of wildlife

3
areas does not represent a coherent and resilient ecological network capable of responding to the challenges of climate change and other pressures. The review called for ‘a step-change in nature conservation ... a new, restorative approach which rebuilds nature and creates a more resilient natural environment for the benefit of wildlife and ourselves’1.The review made 24 recommendations, but summarised what needed to be done in just four words: more, bigger, better and joined and argued that we must:
• improve the quality of current wildlife sites by better habitat management;
• increase the size of existing wildlife sites;
• enhance connections between sites, either through physical corridors or through ‘stepping stones’;
• create new sites; and
• reduce the pressure on wildlife by improving the wider environment What is an Ecological Network? An ecological network is a group of habitat patches that species can move easily between, maintaining ecological function and conserving biodiversity. Through appropriate management, ecological networks can provide a connected collection of refuges for wildlife. These networks form the basic natural infrastructure that will begin to enable biodiversity to recover from recent declines, and help to protect socially and economically important ecosystem goods and services Planning Practice Guidance on the Natural Environment, 2014 (Para 009 Reference ID: 12-009-20140306) states that ecological network mapping should reflect the following;
• key natural systems and processes within the area, including fluvial and coastal;
• the location and extent of internationally, nationally and locally designated sites;
• the distribution of protected and priority habitats and species including areas of irreplaceable natural habitat such as ancient woodland;
• main landscape features which, due to their linear or continuous nature, are important for the migration, dispersal and genetic exchanges of plants and animals, including any potential for new habitat corridors to link any isolated sites that hold nature conservation value, and therefore improve species dispersal;
• areas with potential for habitat enhancement or restoration, including those necessary to help biodiversity adapt to climate change;
• green space within built areas. See: https://www.gov.uk/guidance/natural-environment
Previously, the Hampshire Biodiversity Information Centre had developed and mapped Biodiversity Opportunity Areas (BOAs) as part of a regional project to identify those areas of strategic importance that offered the greatest opportunity for landscape-scale habitat management and restoration. These BOAs were produced in consultation with a great many
1 Lawton JH, Brotherton PNM, Brown VK et al. (2010) Making Space for Nature: A review of England’s wildlife sites and ecological network. Report to Defra.

4
stakeholders and utilised HBIC’s Habitat Suitability GIS model2 in combination with data on existing habitats, site designations, geology and historic mapping. However, it was agreed that BOAs were considered too broad-brush for defining ecological networks for use in planning at the local scale, plus they excluded large parts of Hampshire. A much more precise delineation of an ecological network was required, whilst retaining BOAs as the “strategic ecological network” for landscape scale projects. See http://documents.hants.gov.uk/biodiversity/BOAOverviewMap.pdf
In terms of method HBIC decided not to follow the BEETLE least-cost network model3 due to;
• funding & time constraints linked to the complexities of the model and processing power required;
• lack of technical information beyond generating arbitrary permeability cost scores for aggregated habitats and species dispersal distances for just a few focal species;
• the availability of detailed habitat suitability mapping for Hampshire which identifies areas where the restoration or creation of specific priority habitats is most suitable based on detailed local physical and biological parameters.
• importantly, the ease to which the Hampshire Ecological Network can be ‘refreshed’ annually as HBIC updates its habitat, species and site designations mapping.
3. The Hampshire Ecological Network Map: Principles
The Hampshire Ecological Network mapping is based on the following principles:
• The network is hierarchical with the following components: o Biodiversity Opportunity Areas (BOAs) – the Strategic Network o Core Statutory Sites o Core Non-statutory Sites o Network Opportunity Areas o Hedgerows (optional) o Green Grid Areas (urban optional)
• All components are polygon based. The core sites and network opportunity polygons do not overlap. If a polygon is already part of a higher level, then it is not part of a lower level. BOAs, hedgerows and ‘Green Grid Areas’ can be overlain to add further knowledge to the network.
• The ecological network is spatially precise, all polygons which form part of the network opportunities layer are MasterMap polygons. Core Statutory and Core Non-statutory sites are mostly digitised to MasterMap polygons, but there are a few sites where the boundaries are not yet digitised to MasterMap boundaries.
• The reasons why a polygon is part of a specific layer is set out in the associated attribute tables.
2 Habitat Suitability layers were developed by HBIC and the Geodata Institute to identify areas most suitable for restoration or recreation of a priority habitat. Examples are given in Appendix 2. 3 As described in Somerset’s Ecological Network report (2016)

5
4. The Hampshire Ecological Network Map: Components 4.1 Biodiversity Opportunity Areas Please see the following link for a full description of the BOAs. They have recently received some limited tidying up to reflect small changes in site designations or habitat mapping near their boundaries. Appendix 3 shows the BOAs in the context of the full network. https://www.hants.gov.uk/landplanningandenvironment/environment/biodiversity/informationcentre/information 4.2 Core statutory sites comprise the following:
• Ramsar sites
• Special Areas of Conservation
• Special Protection Areas
• Sites of Special Scientific Interest
• National Nature Reserves
• Local Nature Reserves
4.3 Core non-statutory sites contain the following:
• Ancient Woodlands taken from the Ancient Woodland Inventory – includes both semi-natural and replanted ancient woodland. Ancient Woodlands under 2ha should hopefully be captured under the Lowland Mixed Deciduous Woodland Prioirty habitat
• All Local Wildlife Sites (SINCs) , excluding those which only qualify as “Brent Geese & Wader“ SINCs as they are curently undergoing a review, pending the next Wader & Brent Geese Strategy
• All polygons from MasterMap with the classification of “Inland Water” – this covers all rivers and ponds, many of which will already be designated.
• All polygons from HBIC‘s Priority Habitat layer, including lowland mixed deciduous woodland, wet woodland, lowland meadow, calcareous and acid grasslands,heathland, purple moor-grass & rush pasture, vegetated shingle, sand-dune, saltmarsh and mudflat. Coastal and floodplain grazing marsh4 is excluded, but many sites are already designated.
• All polygons from HBIC‘s Broad Habitat layer classified as “Fen, Marsh, swamp” which have not been surveyed at the detail needed to fully identify qualifying NVC/Priority habitat types.
• All polygons, which are classified as “Important” in the in the Wader and Brent Goose Strategy 2010
4.4 Network Opportunity Areas contain the following:
• All polygons from HBIC’s Broad Habitats layer, which are classified as “Woodland/ Scrub”, “Neutral Grassland” or “Calcareous Grassland”, where the latter two are likely to support semi-improved or neglected grassland capable of restoration. They may even support relic Priority grassland, but more survey is needed.
4 Excluded on the basis it was itself developed from GIS modelling and requires more ground truthing
6
• All MasterMap polygons classified as Improved Grassland, Neutral Grassland or Arable in HBIC‘s Broad Habitats layer, and which are covered by at least 80% of the floodzone layer (“EA Floodzone 2”), or are covered by 20% to 80% of the floodzone layer but only those parts of MasterMap polygons, which are actually covered by the EA Floodzone. These areas could support wet grassland for least for part of the year and would be of importance for wetland birds and other species.
• All polygons classified as “Uncertain” in the Wader and Brent Goose Strategy 2010 i.e. Brent Geese and Waders have been recorded but there has been insufficient survey to determine ‘important’ status.
• All polygons where there are recent (post 2010) records of Wader or Brent Geese
• All polygons from MasterMap that are not buildings, roads and feature type ‘10053’5, which are covered by at least 80% of the 50x50m grid cells from the Priority Habitat Suitability layers which have a Suitability Index of at least 5 (out of 9). These are areas with the right geology, hydrology etc. where appropriate habitats could be recreated.
Fig 1 Area east of Winchester showing the three main components of the Ecological Network
4.5 Hedgerows
Linear features such as hedgerows link up habitat patches and have a conservation value in their own right. HBIC maintains a Hampshire wide GIS layer of digitised hedgerows6 which are shown as linear features not polygons, representing 6 different types of hedgerow ‘structure’ up to 5m wide. This layer can be added to the ecological network layers to visually illustrate the network connections and corridors that exist within the landscape They are about to be translated into IHS habitat codes using current/on-going
5 Land with a general surface or multi surface like a pavement etc. 6 Digitised from 1996 aerial photographs and still remarkably up to date

7
and previous survey data so that ‘priority habitat’ hedgerows can be identified and extracted.
Fig 2 Example of the Ecological Network overlain with the hedgerow mapping
4.6 Urban ‘Green Grid’ Areas
For the urban area of Southampton additional data has been added to the model using information obtained from LiDAR imagery to enable the mapping of ‘green’ areas. The following was extracted from the imagery:
• a digital terrain model (DTM) which shows the elevation of the bare ground above sea level
• a digital surface model (DSM) which shows the elevation of the bare ground and everything on it (houses, trees…)
• all areas covered by vegetation using the Normalised Difference Vegetation Index (NDVI)
By selecting those areas more than 3m above ground level and which are covered by vegetation it is possible to digitally map areas covered by trees, and then to select those OS MasterMap polygons which are covered by at least 60% of tree canopy in order to generate a ‘green grid’ of tree cover. In a similar way other OS MasterMap polygons can be selected which support 60% vegetated areas (mainly grassland) without trees or a combination of both. All polygons below 0.075ha were then taken out to remove lots of small gardens and other tiny patches of land, leaving the larger habitat rich gardens, tree belts and other green areas.
Together these polygons can be merged to create a green grid/network within the urban area which adds to the ecological network map. A similar Green Grid can be developed for

8
Gosport and Portsmouth, and other urban areas if LiDAR imagery can be obtained of similar quality.
Fig 3 Example of the urban ‘green’ network in Southampton
5. Updating the Ecological Network Map though consultation
An early draft of the Ecological Network Map was presented to the Hampshire Local Planning Authorities at the HBIC Users Advisory Group meeting in November 2015. Feedback was positive, and the mapping was further refined and re-presented at the HBIC UAG meeting in May 2016.
In early 2018 the mapping was completely re-run to accommodate any changes to the following sources of data over the intervening 2 years:
• OS MasterMap,
• Site designations
• Habitat mapping
• EA Flood zone 2 layer The following features which had been inadvertently missed out were also added into the mapping:
• SINCs which qualify under the criterion 6B became part of the Core-Non-statutory layer if they were designated for species other than Brent Geese. Previously all 6B7 SINCs had been excluded.
7 Sites which regularly support a significant population of a species which has a restricted distribution or has
substantially declined in population or range. Such sites may be used seasonally or for only one part of a species
life-cycle.

9
• If a MasterMap polygon was covered partly by Core Statutory or Core Non-statutory sites, then the other part of the MasterMap polygon was included in the opportunity layer, if that fraction was covered by at least 80% by the habitat suitability layers even if the total polygon was not.
• Polygons from MasterMap, which were classified as 'Inland Water; Natural Environment' were added in addition to the 'Inland Water' only polygons.
The mapping was then ‘road tested’ in 2018 against recent planning applications, by a number of local authorities, to validate its accuracy and usefulness. It was agreed the mapping was now ready for use and will benefit from an annual update (See section 9)
6. Using the Ecological Network Map to inform the planning process
The Hampshire Ecological Network Map should not be viewed as a barrier to development; instead it can be used to guide the location, layout and design of development to enable habitat and species mitigation, restoration and re-creation to inform green infrastructure and achieve net gain. With regard to the Core statutory and Core non-statutory mapping the usual distinctions should be made between the hierarchy of international, national and locally designated sites, so that protection is commensurate with their status and gives appropriate weight to their importance and the contribution that they make to the ecological network – as set out in Para 171 of the revised NPPF. Both the core statutory and core non-statutory components of the ecological network map also support the majority of Priority habitat in Hampshire, which local authorities have a duty to have regard to their conservation under the NERC Act 2006. Improving the quality of existing priority habitat through positive management would achieve net gain for biodiversity.
The ‘Network Opportunities’ component of the mapping can also be used to inform proposals to achieve net gain for biodiversity as part of the planning process in order to:
• promote the restoration and re-creation of priority habitats including increasing the size of existing wildlife sites,
• enhance connections between sites, either through physical corridors or through ‘stepping stones’
• enable the recovery and enhancement of priority species populations
Buffering of statutory/non-statutory sites and priority habitat polygons is not included in the network mapping on the basis that any planning proposal would need to consider measures to mitigate impacts on biodiversity on a case by case basis, depending on type and size of development, the designation status, the habitat type, and the presence of notable species in the area. For example, main rivers already enjoy an 8m consultation zone from the bank requiring screening and consent for most types of development, whilst standing advice on development adjacent to ancient woodland recommends a minimum 15m buffer of developing semi-natural habitat to mitigate the impacts of development and disturbance on the ancient woodland.
Note that both ancient semi-natural and replanted ancient woodland (PAWs) are shown as core-non-statutory sites (unless they support a statutory designation) as PAWs woodland

10
contains relic ancient woodland soils and features and there is a policy direction8 in favour of gradually restoring such woodland back to a native woodland in order to achieve net biodiversity gain and halt species decline.
7. Project Outputs PDF maps and GIS layers for each local planning authority in Hampshire are available which map the hierarchical components of the ecological network and provide a 2km buffer (beyond their LPA boundary). The GIS layers provide the associated attributes describing each polygon in terms of its designation type(s) and name, current habitat/land use type, and potential habitat type(s) with scoring. A full set of metadata can be found online at: https://www.hants.gov.uk/landplanningandenvironment/environment/biodiversity/informationcentre/information/metadata
8. Limitations of the data
The Ecological Network mapping relies on accurate up-to-date data on site designations and broad and priority habitat mapping. The site designations are 100% accurate and updated annually and whilst Hampshire has an enviable reputation for its uninterrupted habitat survey programme going back 35 years and resulting habitat and land use mapping, not every parcel of land has been visited. Some parcels have only been interpreted from aerial photographs dating back to 1996, and those that have been visited are only surveyed once every five, ten or twenty years depending on the habitat type. Habitats and land use are constantly changing through land management practices and succession or abandonment. Some ‘anomalies’ that occur within the current GIS mapping include;
• Woodland habitat mapped within gardens,
• Cleared areas within woodland have not always been mapped to a ‘habitat’ type and so appear as ‘gaps’ in the mapping. It may not have been known at the time if they were to be restocked, planted with game strips or left as glades.
• Ponds mapped within OS MasterMap which do not discern between natural and more agricultural or ornamental ponds. For example, farmed cress-beds are mapped as ‘inland open water’. However, they can be considered as part of the core non-statutory network as they tend to occur on ‘chalk stream’.
• Many more recently planted woods which will not been captured due to the original habitat mapping being based on the 1996 aerial photographs.
All District GIS maps include a 2km buffer. Data from adjoining counties has therefore been used where available, including international, national and local designations and priority habitat mapping, but there is a variation in completeness of the data available.
8 https://assets.publishing.service.gov.uk/government/uploads/system/uploads/attachment_data/file/778106/KeepersofTimeanw-policy.pdf

11
9. Updating the Ecological Network Map
As an evidence base it is recommended that the Ecological Network Map is refreshed annually to take into account changes in site designations, habitat mapping and the review of Brent Geese & Wader sites. The following will also be investigated and applied, subject to further consultation:
• Adding in non-designated conifer woodland on non-ancient sites as an ‘opportunity’
• Adding in woodlands which have been planted or have developed on grassland since the 1996 aerial photographic interpretation as ‘opportunity’
• Removal of tiny holes within the EA Flood zone 2 mapping (where they occur on elevated ground)
• Adding in small parcels of land almost entirely encapsulated within core statutory/non-statutory sites as ‘opportunity’ (unless built and where the habitat suitability index is less than 80%)
Removing further ‘unsuitable’ sub categories in the OS MasterMap layer will also have to be built into the GIS model on an on-going basis as they are picked up.
The mapping could also be further developed to map rare arable plant hotspots and particular species networks/hotspots for bats, dormice, great crested newts, water voles etc. Green grid maps can be developed for other urban areas such as Portsmouth and Gosport if high quality LIDAR data can be obtained. Updating the Hedgerow GIS layer to incorporate the following would be the next step in adding value to the Hedgerow GIS layer but would require additional resources to track back through all known survey reports:
• Known ‘Important’ hedgerows (as defined by the Hedgerow Regulations 2007)
• Ancient and Species Rich hedgerows (as defined under UK BAP criteria)
• Hedgerows that would qualify as Priority Habitat for supporting >80% native species

12
10. Summary Statistics Appendix 1 provides tables on hectares and % cover for both the total network and total area of each District/Unitary Authority covered by each component of the network. The figures can be summarised as follows: Fig. 1 Network displayed by number of hectares within each Local Authority
Fig 2 Network displayed as % of area within each Local Authority
0
5,000
10,000
15,000
20,000
25,000
30,000
35,000
40,000
45,000Network Opportunities (ha)
Core Non-statutory Sites (ha)
Core Statutory Sites (ha)
0
10
20
30
40
50
60
70
80
Core Statutory Sites (% of Authority)
Core Non-statutory Sites (% of Authority)
Network Opportunities (% of Authority)
Note: The Ecological Network Mapping for the ‘New Forest’ has been divided into the separate District Council and National Park areas for statistics but is provided as one integrated map because of the obvious relationships and networks between the open Forest and surrounding meadows, commons, river valleys and coast.
13
11. References
Hampshire Biodiversity Opportunity Areas (BOAs): http://www3.hants.gov.uk/landscape-and-heritage/hbic/hbic-projects/hbic-boas.htm Sites of Importance for Nature Conservation http://www3.hants.gov.uk/landscape-and-heritage/biodiversity/hampshire/sincs.htm Hampshire Habitat Suitability Mapping 2009 Geodata Institute Solent Waders and Brent Goose Strategy 2010 http://www.solentforum.org/forum/sub_groups/Natural_Environment_Group/Waders%20and%20Brent%20Goose%20Strategy/Solent%20Waders%20and%20Brent%20Goose%20Strategy.pdf Lawton, J.H., Brotherton, P.N.M., Brown, V.K., Elphick, C., Fitter, A.H., Forshaw, J., Haddow, R.W., Hilborne, S., Leafe, R.N., Mace, G.M., Southgate, M.P., Sutherland, W.J., Tew, T.E., Varley, J., & Wynne, G.R. (2010) Making Space for Nature: a review of England’s wildlife sites and ecological network. Report to Defra. http://webarchive.nationalarchives.gov.uk/20130402170324/http://archive.defra.gov.uk/environment/biodiversity/documents/201009space-for-nature.pdf Department for Communities and Local Government (2012) National Planning Policy Framework. London: Department for Communities and Local Government https://www.gov.uk/government/collections/revised-national-planning-policy-framework Catchpole, R. (2006) Planning for Biodiversity – opportunity mapping and habitat networks in practice: a technical guide. English Nature Research Reports, No 687. Peterborough: English Nature. http://publications.naturalengland.org.uk/publication/59008 Somerset’s Ecological Network 2016 Report http://www.somerset.gov.uk/policies-and-plans/policies/ecological-networks/
14
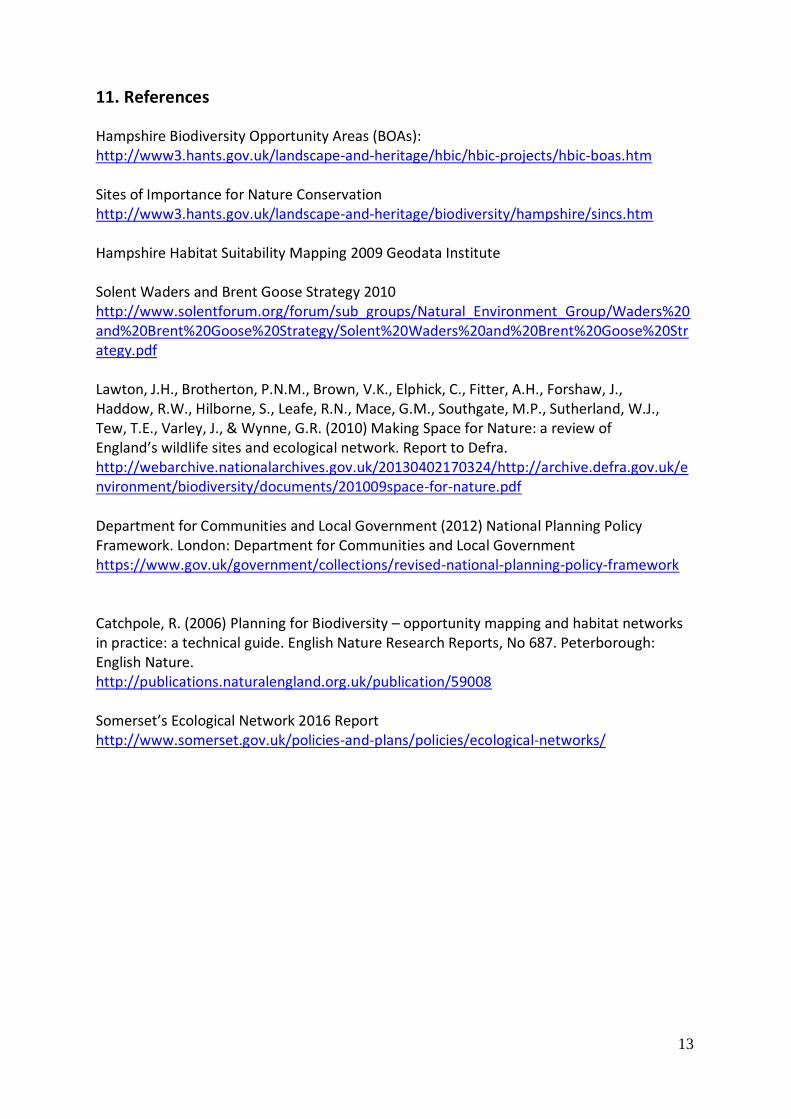
Appendix 1 Area and % Area of Local Authority covered by the network and its components
Note Total ‘ha’ figures include an overlap between TVBC and NFNPA as separate network maps have been produced for TVBC and NFDC/NFNPA.
Local Authority Total Area of District
(Ha)
Core Statutory Sites (ha)
Core Statutory
Sites (% of
Authority)
Core Non-statutory
Sites ( ha)
Core Non-statutory
Sites (% of
Authority)
Network Opportuni
ties (ha)
Network Opportuni
ties (% of
Authority)
Potential area of
full Network
% of Authority
area
Basingstoke & Deane
63,382 861 1.4 9,667 15.3 4,501 7.1 15,029 23.7
East Hampshire 51,443 2,812 5.5 8,936 17.4 4,577 8.9 16,325 31.7
Eastleigh 8,527 632 7.4 988 11.6 749 8.8 2,369 27.8
Fareham 7,780 749 9.6 720 9.3 1,081 13.9 2,550 32.8
Gosport 2,750 277 10.1 405 14.7 184 6.7 866 31.5
Hart 21,527 2,724 12.7 3,329 15.5 3,381 15.7 9,434 43.8
Havant 7,910 2,716 34.3 714 9.0 918 11.6 4,348 55.0
New Forest DC 24,517 2,523 10.3 3,271 13.3 2,695 11.0 8,489 34.6
New Forest NPA 56,652 32,265 57.0 5,630 9.9 5,684 10.0 43,579 76.9
Portsmouth 6,014 1,788 29.7 447 7.4 428 7.1 2,663 44.3
Rushmoor 3,905 474 12.1 634 16.2 459 11.8 1,567 40.1
Southampton 5,639 233 4.1 504 8.9 206 3.7 943 16.7
Test Valley 62,762 2,200 3.5 8,796 14.0 7,135 11.4 18,131 28.9
Winchester 66,107 1,365 2.1 9,810 14.8 6,276 9.5 17,451 26.4
Hampshire 388,915 51,619 13.3 53,851 13.8 38,274 9.8 143,744 37.0
As a % of the ecological network itself within each Authority
Potential Area of Network
(Ha)
Core Statutory Sites %
Core Non-statutory Sites %
Network Opportunities %
Total
Basingstoke & Deane 15,029 5.7 64.3 29.9 100
East Hampshire 16,325 17.2 54.7 28.0 100
Eastleigh 2,369 26.7 41.7 31.6 100
Fareham 2,550 29.4 28.2 42.4 100
Gosport 866 32.0 46.8 21.2 100
Hart 9,434 28.9 35.3 35.8 100
Havant 4,348 62.5 16.4 21.1 100
New Forest District 8,489 29.7 38.5 31.7 100
New Forest NPA 43,579 74.0 12.9 13.0 100
Portsmouth 2,663 67.1 16.8 16.1 100
Rushmoor 1,567 30.3 40.5 29.3 100
Southampton 943 24.7 53.5 21.8 100
Test Valley 18,131 12.1 48.5 39.4 100
Winchester 17,451 7.8 56.2 36.0 100
Hampshire 143,744 35.9 37.5 26.6 100

15
Appendix 2 Examples of Habitat Suitability Mapping for Lowland Calcareous Grassland and Lowland Heath
Habitat Suitability layers were developed by HBIC and the Geodata Institute to identify areas most suitable for creation or restoration to a priority habitat. Each 50m by 50 m grid cell in Hampshire was assigned a Habitat Suitability Index ranging from 0 (none) to 9 (high) for ten Priority habitat types based on a number of factors including geology, soils, fluvial, topography, current land use, historic habitat distribution, and presence of existing priority habitats and indicator species. Habitat suitability maps for chalk grassland and heathland are shown below. A mid point of of around 5 (dark orange-red colours) was chosen to represent the best areas of opportunity within the Ecological Network.
Lowland Calcareous Grassland
Lowland Heathland

16
Appendix 3 Biodiversity Opportunity Areas as part of the Hampshire Ecological network
Legend
Core Statutory
Core Non-statutory
Network Opportunities
Biodiversity Opportunity Areas 2018
Urban Areas 2000