Embed Size (px)
Citation preview

INVESTMENT INSIGHTS AUGUST 2013 | VOLUME 16, ISSUE 3
MAPPING THE JOURNEY New Standards in Pension Plan Investment Policy and ImplementationBY STUART JARVIS AND ANDY HUNT
[ 2 ] M a p p i n g T h e J o u r n e y : N e w S t a n d a r d s i n P e n s i o n P l a n I n v e s t m e n t P o l i c y a n d I m p l e m e n t a t i o n
STUART JARVIS, PhD
Stuart Jarvis, PhD, Managing Director, is a member of the Client Strategy team within BlackRock Solutions. BlackRock Solutions is responsible for developing, assembling and managing investment solutions involving multiple strategies and asset classes. Within Client Strategy, Dr. Jarvis has a specific focus on research, modeling and special projects.
Dr. Jarvis joined the firm in 2004, including his years with Barclays Global Investors (BGI), which merged with BlackRock in 2009. At BGI, Dr. Jarvis was responsible for leading the research effort behind the solutions and strategies created to meet a wide range of client investment problems. Prior to joining the firm, Dr. Jarvis was a pensions consultant at Hewitt Bacon & Woodrow.
Dr. Jarvis earned an M.Math degree in mathematics from Cambridge University in 1991, and a PhD degree in mathematics from Oxford University in 1994 and is a Fellow of the Institute of Actuaries.
ANDY HUNT, FIA, CFA
Andy Hunt, FIA, CFA, Managing Director, is a member of the Client Strategy team in the BlackRock Solutions (BRS) group. This team is responsible for developing, assembling and managing investment solutions involving multiple strategies and asset classes. He leads the firm’s Liability Driven Investment (LDI) capabilities in the Americas.
Mr. Hunt’s service with the firm dates back to 2005, including his years with Barclays Global Investors (BGI), which merged with BlackRock in 2009. At BGI, Mr. Hunt was an investment strategist within the US Client Solutions group. Prior to BGI, he was a partner and senior investment consultant at Watson Wyatt for 13 years, responsible for consulting to a number of large multinational pension funds and also to government retirement funds around the world.
Mr. Hunt is a qualified actuary (UK) and earned an M.A. degree in mathematics from Cambridge University in 1992.
Authors
EXECUTIVE EDITORSRonald N. Kahn [email protected]
Russ Koesterich [email protected]
EDITORMarcia Roitberg [email protected]
INVESTMENT INSIGHTSTHE INVESTMENT RESEARCH JOURNAL FROM BLACKROCK
Volume 16, Issue 3 August 2013
The authors would like to thank the following colleagues for their helpful comments and suggestions: Gareth Davies, Robert Hayes, Paul Henderson, Ron Kahn, Paul Purcell, Mike Rierson, Andrew Stephens and Michael Wray.
[ 2 ] M a p p i n g T h e J o u r n e y : N e w S t a n d a r d s i n P e n s i o n P l a n I n v e s t m e n t P o l i c y a n d I m p l e m e n t a t i o n I n v e s t m e n t I n s i g h t s , A u g u s t 2 0 13 [ 3 ]
Executive summary 4
Introduction 6
Section 1: Why dynamic investment policies are helpful 8
Section 2: The optimal pattern of exposures 14
Section 3: Considering variable contributions 22
Section 4: Practical journey management design 28
Section 5: How to implement in practice 32
Conclusions: Journey management 40
References 42
Appendix 1: Sample pension plan in Section 2 43
Appendix 2: Details of stochastic model in Section 2 44
Appendix 3: Section 2 case study assumptions 45
ContentsAUGUST 2013

[ 4 ] M a p p i n g T h e J o u r n e y : N e w S t a n d a r d s i n P e n s i o n P l a n I n v e s t m e n t P o l i c y a n d I m p l e m e n t a t i o n
Does traditional asset allocation for defined benefit pension plans remain appropriate for today’s rapidly changing world? In this article, we make the case for revisiting the established, static approach and explore how an alternative, more dynamic approach might offer pension plans a more effective and risk-controlled path toward full funding.
Specifically, we advocate an approach that focuses on:
1. Setting an appropriate investment risk budget that is linked to a plan’s circumstances, and then,
2. Spending the risk budget to the best effect over time.
The natural consequence of this approach is to adopt a dynamic asset allocation related to the plan’s funded ratio. In addition, we argue that pension plan boards should be comfortable with asset leverage as long as it is better used to attain the desired risk exposures (i.e., spend the investment risk budget more efficiently). In doing so, boards can manage their plans’ liability risks (principally those associated with liability duration risk) more fully while seeking to add outperformance as desired.
Executive summary

[ 4 ] M a p p i n g T h e J o u r n e y : N e w S t a n d a r d s i n P e n s i o n P l a n I n v e s t m e n t P o l i c y a n d I m p l e m e n t a t i o n I n v e s t m e n t I n s i g h t s , A u g u s t 2 0 13 [ 5 ]
We do not support a single one-size-fits-all strategy. Instead, we suggest a universal framework that can be applied to many different situations, as illustrated by a case study. This, in turn, will yield plan-specific “journey management” solutions that fit the individual plan’s needs more closely.
We are conscious that the whole endeavor puts more demands on pension plan boards to consider multiple portfolio choices at the same time, and to do so on a regular basis. In many cases, pension plan boards will need to strengthen their governance structures to meet the additional demands. However, practical solutions are at hand for those that do not have the means to obtain the necessary dedicated resource internally, whether it is bringing on board independent trustees or flexibly outsourcing the day-to-day investment management to an experienced partner.
Ultimately, the significant promise of this journey management approach is more-likely attainment of a pension plan’s long-term goal and the avoidance of inappropriately large funded ratio volatility.
[ 6 ] M a p p i n g T h e J o u r n e y : N e w S t a n d a r d s i n P e n s i o n P l a n I n v e s t m e n t P o l i c y a n d I m p l e m e n t a t i o n
This paper explores the task of designing a strategic asset allocation for a defined benefit pension plan, with a specific emphasis on how this allocation should vary over time.
It is well understood that an optimal investment strategy depends upon the characteristics of the investor (e.g., consumption requirements, external income, tolerance for risk) and should respond to changing investment opportunities. Yet the typical output of a strategic asset allocation review for a pension plan is a benchmark that is adhered to over multiple subsequent years; that is, it results in an essentially static investment policy.
Working out how a strategic benchmark should vary over time is an essentially universal, but complex, problem for many classes of investor. In one important respect, however, the presence of clearly defined liabilities for a pension plan actually makes it easier to see how the allocation should change. This is because the goal of the investment strategy is usually much clearer: the plan’s assets are there to pay the liabilities as they fall due. The funding level of the plan therefore strongly influences its need for return, and therefore its tolerance for investment risk-taking.
We believe that two things should lead pension plan boards to revisit their investment portfolio between strategic reviews: (1) changes in the funding ratio, which can be very large over even short periods of time; and (2) changes in the investment opportunity set.2 In our experience, boards often struggle with these tasks. This suggests that a rather different governance approach might be required.
“ To form a long-term portfolio, investors must first think systematically about their preferences and the constraints they face.”John Campbell1
1 See Campbell (2002).
2 The term “pension plan board” generally refers to a fiduciary entity that oversees a pension plan. It is also known as a trustee board, pension plan committee, investment committee or other similar phrases.
Introduction

[ 6 ] M a p p i n g T h e J o u r n e y : N e w S t a n d a r d s i n P e n s i o n P l a n I n v e s t m e n t P o l i c y a n d I m p l e m e n t a t i o n I n v e s t m e n t I n s i g h t s , A u g u s t 2 0 13 [ 7 ]
This goal-focused, time- and circumstance-contingent investment policy is what we term “journey management.” Journey management holds out the prospect of improving the range of outcomes that the pension plan might experience. It aims to increase the utility of the pension plan by increasing the likelihood of achieving the plan’s goal and reducing the probability and magnitude of failing to achieve the goal.
This paper is structured as follows:
`` In Section 1, we use a simple exposure-based metric to show how a fixed-asset benchmark leads to very different risk allocations for different funded ratios. This permits us to suggest that a preferred approach is to allow the allocation to vary as the funding level changes.
`` In Sections 2-4, we dig deeper into how a dynamic de-risking investment strategy should be designed. We conclude that while there are best practices, tailoring investment policies to pension plans will be necessary, to accommodate individual situations, views and preferences.
`` In Section 5, we briefly discuss a framework for capturing the changing investment opportunity set faced by investors. An understanding of, or belief in, these tactical opportunities leads to tilts away from any planned, funded ratio-linked investment policy. We describe some of the governance challenges that can arise in implementing these dynamic strategies and set out what works in practice.

[ 8 ] M a p p i n g T h e J o u r n e y : N e w S t a n d a r d s i n P e n s i o n P l a n I n v e s t m e n t P o l i c y a n d I m p l e m e n t a t i o n
THE SIDE-EFFECTS OF STATIC ALLOCATIONSThe theory and practice of liability driven investment (LDI) has succeeded in changing the focus of pension plan boards from asset-only risk to asset-liability risk (also referred to sometimes as surplus risk). Investment risk is only worthwhile if it helps grow the assets faster than the liabilities, and uncertainty is best understood in terms of the mismatch of assets to liabilities.
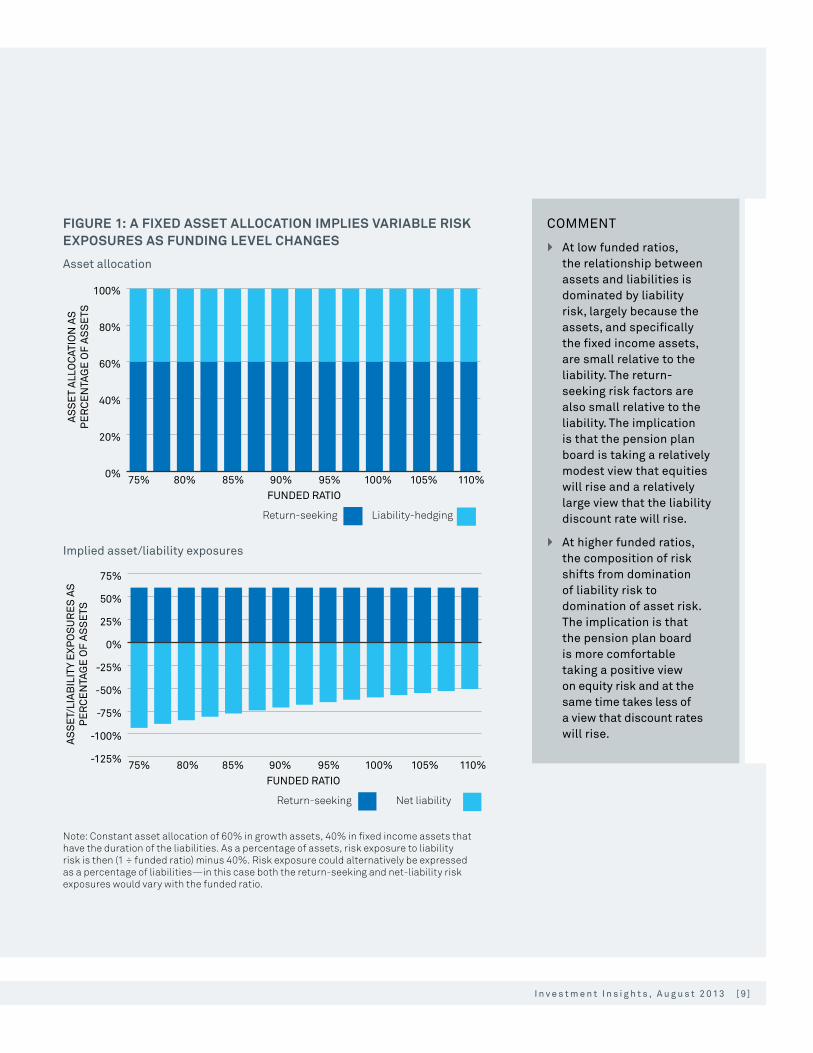
And yet, investment strategies have been slow to change to truly place this thinking at their heart; specifically, they are very often static (i.e., they are described in terms of a fixed asset allocation). Figure 1 shows the effect of a static asset allocation in terms of surplus risk exposures as funded ratio changes for a typical pension plan.
ASSETS MINUS LIABILITIES OR ASSETS OVER LIABILITIES?The funding ratio (assets divided by liabilities) and the deficit (assets minus liabilities) are two perspectives on the same underlying problem faced by an underfunded pension plan.
` The sponsor has a focus on any changes in contribution rates and accounting impacts and therefore views the problem in terms of the absolute deficit—assets minus liabilities.
` The board’s main focus, on the other hand, is on the individual beneficiaries and the likelihood that they will receive the pension they are promised. From this perspective, the assets to liabilities ratio matters most.
` Regulators can take into account both perspectives.
` Corporate pension plans have multiple stakeholders and therefore both perspectives matter. In practice, however, absent a few details relating mainly to the ideal quantity of liability-hedging assets when underfunded, the two views of the pension plan lead to very similar investment decisions. We therefore do not spend much time seeking to differentiate between these two perspectives in this paper.
SECTION 1
Why dynamic investment policies are helpful
[ 8 ] M a p p i n g T h e J o u r n e y : N e w S t a n d a r d s i n P e n s i o n P l a n I n v e s t m e n t P o l i c y a n d I m p l e m e n t a t i o n I n v e s t m e n t I n s i g h t s , A u g u s t 2 0 13 [ 9 ]
FIGURE 1: A FIXED ASSET ALLOCATION IMPLIES VARIABLE RISK EXPOSURES AS FUNDING LEVEL CHANGES
Asset allocation
0%
20%
40%
60%
80%
100%
Liability-hedgingReturn-seeking
FUNDED RATIO
AS
SE
T A
LLO
CAT
ION
AS
PE
RC
EN
TAG
E O
F A
SS
ETS
75% 80% 85% 90% 95% 100% 105% 110%
Implied asset/liability exposures
-125%
-100%
-75%
-50%
-25%
0%
25%
50%
75%
FUNDED RATIO
AS
SE
T/LI
AB
ILIT
Y E
XPO
SU
RE
S A
S
PE
RC
EN
TAG
E O
F A
SS
ETS
75% 80% 85% 90% 95% 100% 105% 110%
Net liabilityReturn-seeking
Note: Constant asset allocation of 60% in growth assets, 40% in fixed income assets that have the duration of the liabilities. As a percentage of assets, risk exposure to liability risk is then (1 ÷ funded ratio) minus 40%. Risk exposure could alternatively be expressed as a percentage of liabilities—in this case both the return-seeking and net-liability risk exposures would vary with the funded ratio.
COMMENT
` At low funded ratios, the relationship between assets and liabilities is dominated by liability risk, largely because the assets, and specifically the fixed income assets, are small relative to the liability. The return-seeking risk factors are also small relative to the liability. The implication is that the pension plan board is taking a relatively modest view that equities will rise and a relatively large view that the liability discount rate will rise.
` At higher funded ratios, the composition of risk shifts from domination of liability risk to domination of asset risk. The implication is that the pension plan board is more comfortable taking a positive view on equity risk and at the same time takes less of a view that discount rates will rise.
[1 0 ] M a p p i n g T h e J o u r n e y : N e w S t a n d a r d s i n P e n s i o n P l a n I n v e s t m e n t P o l i c y a n d I m p l e m e n t a t i o n
In summary, a constant asset allocation implies both a non-constant risk budget for the plan as a whole, and a non-constant allocation of this risk budget among underlying risk factors. This raises a challenging question: “Is this pattern of risk exposures rational and consistent with the mission and goals of most pension plans?”
INTRODUCING DYNAMIC INVESTMENT STRATEGIESTo consider this question, we make use of a model pension plan that we believe to be fairly typical, and seek to reverse-engineer the asset allocations that deliver a desired size and spend of risk budget across different funded ratios.
Our premise here is that the board of our model pension plan wishes to reduce risk as their funded ratio rises. This is consistent with a desire to use asset outperformance to help fund a pension fund deficit, coupled with a tacit recognition that a fully funded plan is worth preserving. We see this as an increasingly common situation among corporate pension plans, especially those that are mature, closed or terminated.
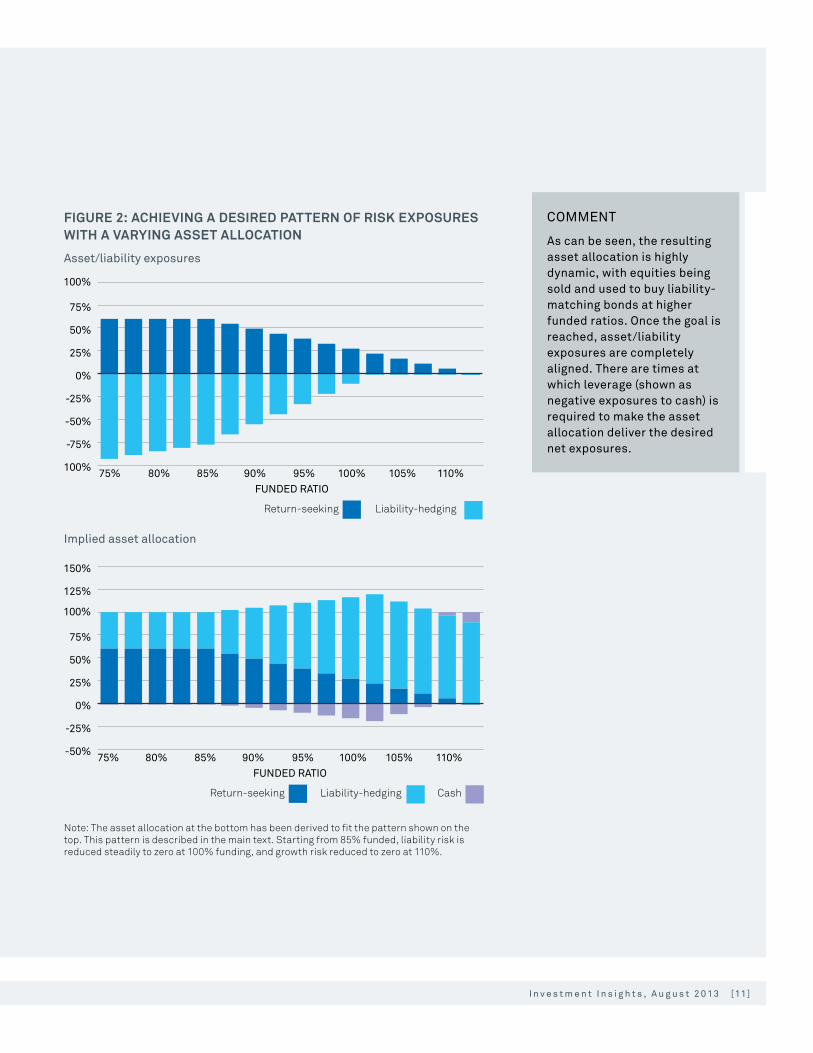
This example builds upon the example above with the assumption that the asset allocation is appropriate at funding levels of 85% and lower, but that the asset-liability (surplus) risk should be reduced as the funded ratio rises to 110%.3 The pattern of the net risk exposures we have modeled is shown in Figure 2, along with the resulting asset allocation.4
3 Figure 2 again builds upon the apparent preferences of a typical pension plan in, for instance, the US or the UK today in that there is a tactical view that long interest rates will rise in the future. We do not comment within this paper on whether this is appropriate.
4 The pattern of surplus exposures shown here is merely for illustration. The rest of the paper seeks to explore what profile of risk and asset exposures might be appropriate for pension plans to adopt.
SECTION 1
[1 0 ] M a p p i n g T h e J o u r n e y : N e w S t a n d a r d s i n P e n s i o n P l a n I n v e s t m e n t P o l i c y a n d I m p l e m e n t a t i o n I n v e s t m e n t I n s i g h t s , A u g u s t 2 0 13 [11 ]
FIGURE 2: ACHIEVING A DESIRED PATTERN OF RISK EXPOSURES WITH A VARYING ASSET ALLOCATION
Asset/liability exposures
-100%
-75%
-50%
-25%
0%
25%
50%
75%
100%
FUNDED RATIO75% 80% 85% 90% 95% 100% 105% 110%
Liability-hedgingReturn-seeking
Implied asset allocation
-50%
-25%
0%
25%
50%
75%
100%
125%
150%
FUNDED RATIO75% 80% 85% 90% 95% 100% 105% 110%
Liability-hedging CashReturn-seeking
Note: The asset allocation at the bottom has been derived to fit the pattern shown on the top. This pattern is described in the main text. Starting from 85% funded, liability risk is reduced steadily to zero at 100% funding, and growth risk reduced to zero at 110%.
COMMENT
As can be seen, the resulting asset allocation is highly dynamic, with equities being sold and used to buy liability-matching bonds at higher funded ratios. Once the goal is reached, asset/liability exposures are completely aligned. There are times at which leverage (shown as negative exposures to cash) is required to make the asset allocation deliver the desired net exposures.
[12 ] M a p p i n g T h e J o u r n e y : N e w S t a n d a r d s i n P e n s i o n P l a n I n v e s t m e n t P o l i c y a n d I m p l e m e n t a t i o n
ESSENTIALS
Understanding asset-liability risk
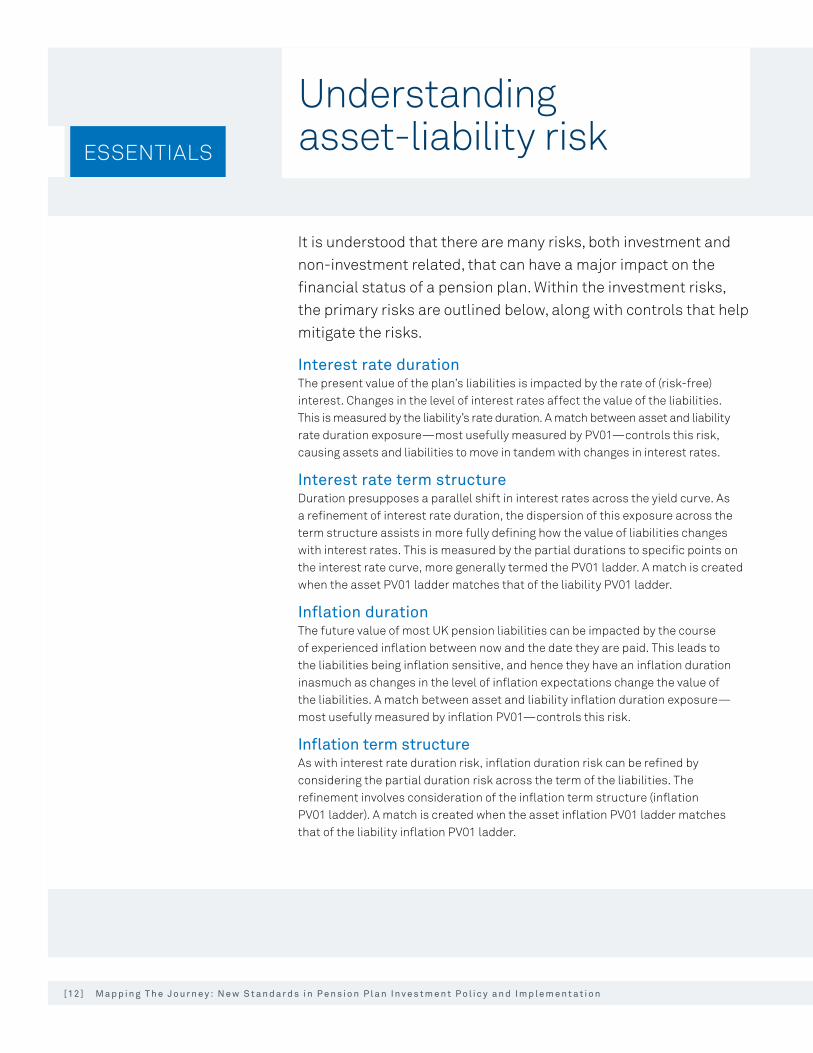
It is understood that there are many risks, both investment and non-investment related, that can have a major impact on the financial status of a pension plan. Within the investment risks, the primary risks are outlined below, along with controls that help mitigate the risks.
Interest rate durationThe present value of the plan’s liabilities is impacted by the rate of (risk-free) interest. Changes in the level of interest rates affect the value of the liabilities. This is measured by the liability’s rate duration. A match between asset and liability rate duration exposure—most usefully measured by PV01—controls this risk, causing assets and liabilities to move in tandem with changes in interest rates.
Interest rate term structureDuration presupposes a parallel shift in interest rates across the yield curve. As a refinement of interest rate duration, the dispersion of this exposure across the term structure assists in more fully defining how the value of liabilities changes with interest rates. This is measured by the partial durations to specific points on the interest rate curve, more generally termed the PV01 ladder. A match is created when the asset PV01 ladder matches that of the liability PV01 ladder.
Inflation durationThe future value of most UK pension liabilities can be impacted by the course of experienced inflation between now and the date they are paid. This leads to the liabilities being inflation sensitive, and hence they have an inflation duration inasmuch as changes in the level of inflation expectations change the value of the liabilities. A match between asset and liability inflation duration exposure—most usefully measured by inflation PV01—controls this risk.
Inflation term structureAs with interest rate duration risk, inflation duration risk can be refined by considering the partial duration risk across the term of the liabilities. The refinement involves consideration of the inflation term structure (inflation PV01 ladder). A match is created when the asset inflation PV01 ladder matches that of the liability inflation PV01 ladder.

[12 ] M a p p i n g T h e J o u r n e y : N e w S t a n d a r d s i n P e n s i o n P l a n I n v e s t m e n t P o l i c y a n d I m p l e m e n t a t i o n I n v e s t m e n t I n s i g h t s , A u g u s t 2 0 13 [13 ]
Credit spread durationIn some jurisdictions, statutory funding and accounting guidelines use a corporate bond-derived discount rate. This means that a change in corporate bond credit spreads causes a change in the value of the liability. Accordingly, credit spread duration risk exists in an analogous manner to interest rate duration risk.
Credit spread term structureWhere credit spread duration risk exists, it can be refined by considering the partial duration risk across the points on the discount curve (i.e., credit PV01 ladder). However, the essence of good credit management is controlling downgrade and default risk of individual issuers, and hence portfolio diversification is key. Furthermore, credit term structure matching is generally less important due to the term structure of credit being generally less volatile than that of interest rates. The consequence is that it is not generally worthwhile to seek to match asset to liability credit PV01 ladders if doing so compromises diversification or comes at a high cost.
Return-seeking risksIn order to increase expected long-term returns above the plan’s liabilities, equities and other return-seeking risks may be voluntarily included in the portfolio. Equities and other return-seeking assets are not considered a match to the characteristics of the plan’s liabilities. They are, however, expected to generate higher returns and hence can help offset the costs of funding the plan. Effective risk management centers on diversification across different return-sources (or risk factors) and prudent use of active management to create diverse return-streams.
Longevity riskEven with a 100% funding ratio, a plan is still exposed to volatility in liability cashflow projections as a result of changes in longevity expectations. To cater to that risk, pension plan boards may still want to maintain some exposure to risk assets until a small funding ratio buffer is obtained, and/or consider longevity risk hedges via either longevity swaps or other insurance arrangements.
[1 4 ] M a p p i n g T h e J o u r n e y : N e w S t a n d a r d s i n P e n s i o n P l a n I n v e s t m e n t P o l i c y a n d I m p l e m e n t a t i o n
SECTION 2
INTRODUCTIONIn Section 1, we showed how an investor with liabilities is not able to maintain simultaneously a fixed asset allocation and a constant risk budget, although either one can be targeted by the investor. This was due to the variation over time in the relative sizes of assets and liabilities—for typical pension plans, this variation in the funding ratio (assets ÷ liabilities) is highly significant.
We now discuss how asset allocation might be appropriately designed to vary with a pension plan’s funding ratio, again using our model pension plan. In practice, market moves will lead to changes in both funding ratio and market opportunities, but the responses are different in nature. The first is plan-focused and therefore essentially strategic (we deal with this in Sections 2 to 4)—the second is more market-focused and we would characterize it as tactical asset allocation (we deal with this in Section 5).
SUGGESTED APPROACH FOR COMPARING STRATEGIESTo assess whether a proposed strategy is a good one, we need a methodology for comparing strategies. Perhaps unsurprisingly, clarity in understanding the investment objectives is crucial to making an accurate comparison. In our experience, the board of an underfunded pension plan will have two interlinked objectives:
` Increase the probability of achieving full funding; and
` Reduce the likelihood of unwelcome contribution calls and, in a worst-case scenario, remedial measures such as plan closures or benefit cuts.
The first objective comes from the plan board’s aim to ensure that beneficiaries get paid, while the second objective reflects the sponsor’s aversion to unexpected cash calls and/or accounting consequence. The second objective is traditionally reflected in a preference for the funding ratio to be less volatile, so that the twin objectives lead to a classic risk/return tradeoff. However, since contributions are only required when there is a deficit, there is an asymmetry, and mean/variance frameworks struggle to assimilate asymmetries. This is important in this paper and for this subject, since dynamic investment strategies can help shape pension plans’ distribution of funded ratio outcomes to be asymmetric as well, and hence more attuned to the needs of pension plan boards and sponsors.
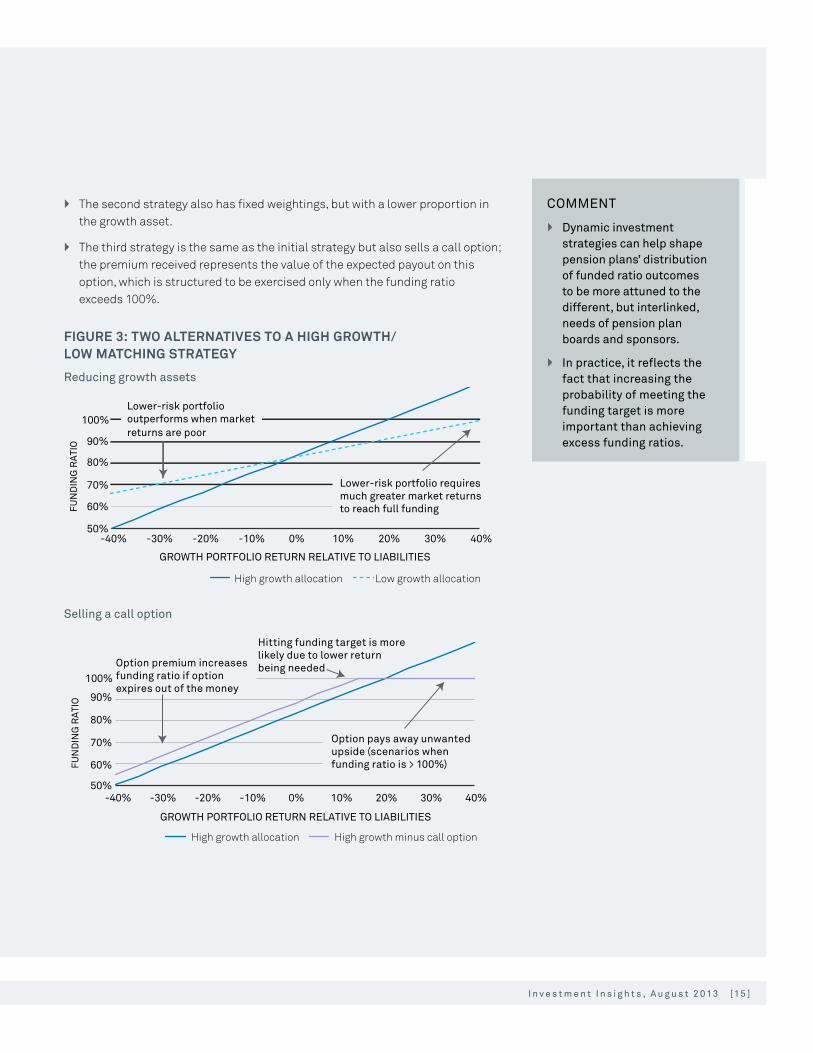
To illustrate this, consider three simplified strategies illustrated in Figure 3. Suppose that there are two underlying assets: a matching asset, which closely tracks the liabilities, and a growth asset. We consider three strategies:
` The initial strategy keeps a fixed weighting in each of these, with a high proportion in the growth asset and the remainder in the matching asset.
The optimal pattern of exposures
[1 4 ] M a p p i n g T h e J o u r n e y : N e w S t a n d a r d s i n P e n s i o n P l a n I n v e s t m e n t P o l i c y a n d I m p l e m e n t a t i o n I n v e s t m e n t I n s i g h t s , A u g u s t 2 0 13 [1 5 ]
` The second strategy also has fixed weightings, but with a lower proportion in the growth asset.
` The third strategy is the same as the initial strategy but also sells a call option; the premium received represents the value of the expected payout on this option, which is structured to be exercised only when the funding ratio exceeds 100%.
FIGURE 3: TWO ALTERNATIVES TO A HIGH GROWTH/ LOW MATCHING STRATEGY
Reducing growth assets
50%
60%
70%
80%
90%
100%
-40% -30% -20% -10% 0% 10% 20% 30% 40%
FUN
DIN
G R
ATI
O
GROWTH PORTFOLIO RETURN RELATIVE TO LIABILITIES
High growth allocation Low growth allocation
Lower-risk portfolio requiresmuch greater market returns to reach full funding
Lower-risk portfoliooutperforms when marketreturns are poor
Selling a call option
50%
60%
70%
80%
90%
100%
-40% -30% -20% -10% 0% 10% 20% 30% 40%
High growth allocation High growth minus call option
Option premium increasesfunding ratio if option expires out of the money
Hitting funding target is morelikely due to lower returnbeing needed
FUN
DIN
G R
ATI
O
GROWTH PORTFOLIO RETURN RELATIVE TO LIABILITIES
Option pays away unwantedupside (scenarios when funding ratio is > 100%)
COMMENT
` Dynamic investment strategies can help shape pension plans’ distribution of funded ratio outcomes to be more attuned to the different, but interlinked, needs of pension plan boards and sponsors.
` In practice, it reflects the fact that increasing the probability of meeting the funding target is more important than achieving excess funding ratios.
[1 6 ] M a p p i n g T h e J o u r n e y : N e w S t a n d a r d s i n P e n s i o n P l a n I n v e s t m e n t P o l i c y a n d I m p l e m e n t a t i o n
To decide which of the different strategies best fits the pension plan’s objectives requires more information: for instance, how likely are the different growth return outcomes, and how useful are these different outcomes to the plan’s board and sponsor? Clearly the former requires some understanding about the interaction of financial markets and the construction of a suitable model, while the latter is more subjective and situation-specific.
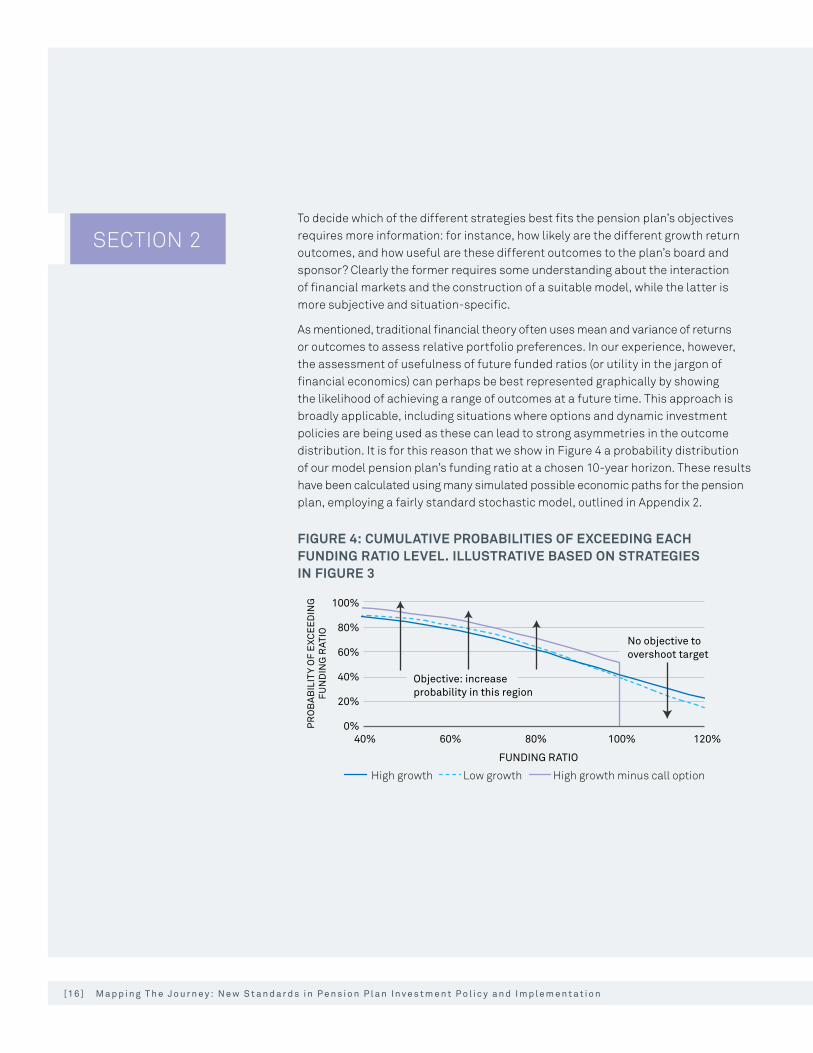
As mentioned, traditional financial theory often uses mean and variance of returns or outcomes to assess relative portfolio preferences. In our experience, however, the assessment of usefulness of future funded ratios (or utility in the jargon of financial economics) can perhaps be best represented graphically by showing the likelihood of achieving a range of outcomes at a future time. This approach is broadly applicable, including situations where options and dynamic investment policies are being used as these can lead to strong asymmetries in the outcome distribution. It is for this reason that we show in Figure 4 a probability distribution of our model pension plan’s funding ratio at a chosen 10-year horizon. These results have been calculated using many simulated possible economic paths for the pension plan, employing a fairly standard stochastic model, outlined in Appendix 2.
FIGURE 4: CUMULATIVE PROBABILITIES OF EXCEEDING EACH FUNDING RATIO LEVEL. ILLUSTRATIVE BASED ON STRATEGIES IN FIGURE 3
100%
80%
60%
40%
20%
0%40% 60% 80% 100% 120%
High growth Low growth High growth minus call option
FUNDING RATIO
PR
OB
AB
ILIT
Y O
F E
XCE
ED
ING
FUN
DIN
G R
ATIO
Objective: increaseprobability in this region
No objective toovershoot target
SECTION 2

[1 6 ] M a p p i n g T h e J o u r n e y : N e w S t a n d a r d s i n P e n s i o n P l a n I n v e s t m e n t P o l i c y a n d I m p l e m e n t a t i o n I n v e s t m e n t I n s i g h t s , A u g u s t 2 0 13 [17 ]
The objectives discussed earlier amount to a preference for this curve to be as high as possible to the left of our 100% funding ratio target. On the basis that overshooting the target is merely unwanted upside, there is no equivalent preference to the right of 100%. This assessment of usefulness might not be completely universal, but in our experience is largely reflective of how most pension plan boards and plan sponsors have come to evaluate their plans.
Taking this assessment of future funded status usefulness, the option-based strategy should be unambiguously preferred to the fixed-weight strategy. In contrast, a comparison between the high-growth and low-growth strategies is more nuanced: with the lower-growth strategies there is a lower probability of reaching the 100% target, but the likelihood of falling far short of the target is reduced.
PRACTICALITIESIt is worth noting that, in practice, simple option strategies such as the third strategy above are not available: the required option involves relative performance between a complex portfolio and a complex liability over multiple years. For the same reason, the pricing offered for such options will typically be opaque and/or unattractive.
There is also often no natural choice of maturity date; although we illustrate the impact of following various strategies over 10 years, we could equally well plot them over a longer or shorter period since there is nothing inherent in most of the strategies discussed in this paper that is linked to this time window. Yet an option would require such a choice.
In textbook option-pricing theory, dynamic strategies can replicate any desired option payoff, but these can be impractical to implement in the real world. Nonetheless, dynamic strategies do lead to the asymmetric outcome distributions that can meet the differing, but interlinked, needs of pension plan boards and sponsors, and so we explore them further in the rest of this paper.
There is one additional complication to bear in mind, although the illustration of its effects is more straightforward. It is not just the investment strategy that varies through time: the contributions made into the plan will also respond to changes in the funding position, typically after annual or triennial reviews. Therefore, in addition to monitoring the probability of specific funding ratio levels being reached, we also examine the expected level and expected variation of contributions paid into the plan.
COMMENT
Dynamic investment strategies are a practical, implementable version of an option strategy that might be seen as opaque and costly.

[1 8 ] M a p p i n g T h e J o u r n e y : N e w S t a n d a r d s i n P e n s i o n P l a n I n v e s t m e n t P o l i c y a n d I m p l e m e n t a t i o n
SECTION 2
LIABILITIES DEMAND DYNAMIC REBALANCING STRATEGIESIt is interesting to note how the presence of liabilities has influenced the need for dynamic strategies. Although an investor without liabilities would seem rather rare, this is a common simplification in theoretical work. A liability-free investor has no natural scale for their assets but, conveniently, their aversion to volatility has been used to determine the level of return they should seek.
Such an investor, faced with multiple periods of investment, will have no reason to weight their risk differently over time; indeed, their total exposure to volatility will be minimized by spreading risk equally across all periods. A fixed-mix strategy is therefore more optimal than other dynamic policies for these idealized, although perhaps somewhat unrealistic, investors. Our analysis in this section, however, shows the fixed mix strategy to be sub-optimal for investors with defined liabilities.
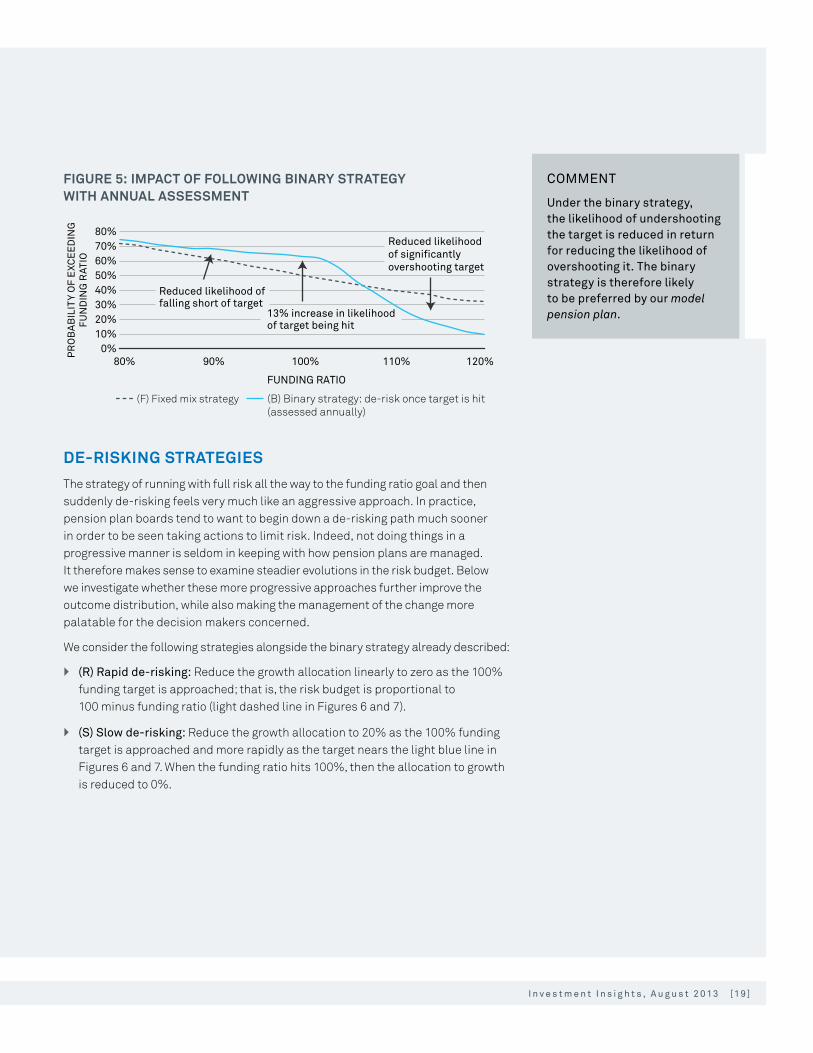
BINARY STRATEGYBuilding on the above example, we first test a simple binary dynamic asset allocation against a fixed allocation, showing the funded ratio outcomes at the same 10-year horizon. Initially, we keep contributions fixed, so that the effect of asset allocation can be isolated. Later on, for a more realistic view, we allow contributions to vary over the 10-year period:
` (F) Fixed mix: Rebalancing to a 60% growth/40% bond portfolio each year.
` (B) Binary strategy: Identical to fixed mix until the funding level exceeds 100% at which point the strategy switches to 100% in bonds thereafter.
The bond portfolio is assumed to be liability-matching, so that once the binary switch is made, the funding level remains above 100%. The results are shown in Figure 5.
[1 8 ] M a p p i n g T h e J o u r n e y : N e w S t a n d a r d s i n P e n s i o n P l a n I n v e s t m e n t P o l i c y a n d I m p l e m e n t a t i o n I n v e s t m e n t I n s i g h t s , A u g u s t 2 0 13 [1 9 ]
FIGURE 5: IMPACT OF FOLLOWING BINARY STRATEGY WITH ANNUAL ASSESSMENT
PR
OB
AB
ILIT
Y O
F E
XCE
ED
ING
FUN
DIN
G R
ATIO
80%70%60%50%40%30%20%10%
0%80% 90% 100% 110% 120%
FUNDING RATIO
(F) Fixed mix strategy (B) Binary strategy: de-risk once target is hit(assessed annually)
Reduced likelihood offalling short of target
13% increase in likelihoodof target being hit
Reduced likelihoodof significantlyovershooting target
DE-RISKING STRATEGIESThe strategy of running with full risk all the way to the funding ratio goal and then suddenly de-risking feels very much like an aggressive approach. In practice, pension plan boards tend to want to begin down a de-risking path much sooner in order to be seen taking actions to limit risk. Indeed, not doing things in a progressive manner is seldom in keeping with how pension plans are managed. It therefore makes sense to examine steadier evolutions in the risk budget. Below we investigate whether these more progressive approaches further improve the outcome distribution, while also making the management of the change more palatable for the decision makers concerned.
We consider the following strategies alongside the binary strategy already described:
` (R) Rapid de-risking: Reduce the growth allocation linearly to zero as the 100% funding target is approached; that is, the risk budget is proportional to 100 minus funding ratio (light dashed line in Figures 6 and 7).
` (S) Slow de-risking: Reduce the growth allocation to 20% as the 100% funding target is approached and more rapidly as the target nears the light blue line in Figures 6 and 7. When the funding ratio hits 100%, then the allocation to growth is reduced to 0%.
COMMENT
Under the binary strategy, the likelihood of undershooting the target is reduced in return for reducing the likelihood of overshooting it. The binary strategy is therefore likely to be preferred by our model pension plan.

[ 2 0 ] M a p p i n g T h e J o u r n e y : N e w S t a n d a r d s i n P e n s i o n P l a n I n v e s t m e n t P o l i c y a n d I m p l e m e n t a t i o n
SECTION 2Figure 6 illustrates the rebalancing rules; that is, the proportion in growth assets as a function of funding ratio. Figure 7 shows the effect on the outcome distribution of following each of these rules.
FIGURE 6: THREE DYNAMIC REBALANCING RULESG
RO
WTH
ALL
OC
ATIO
N 70%60%50%40%30%20%10%
0%70% 75% 80% 85% 90% 95% 100% 105% 110%
FUNDING RATIO
(F) Fixed mix (B) Binary (R) Rapid de-risking (S) Slow de-risking
COMMENT
` From Figure 7, the rapid de-risking strategy can be criticized for reducing risk too rapidly as the funding ratio increases. Although the distribution is better than simply static-mix rebalancing (the likelihoods of both overshooting and undershooting the target significantly are reduced), the likelihood of hitting the target is increased by only 6% rather than by the 12% that the binary strategy achieves.
` The slower de-risking strategy seeks to learn from this and, indeed, offers improvements over the binary strategy. It marginally improves the likelihood of reaching funding levels below 100% while helping to limit potential overshoot.5 The likelihood of hitting a 100% funding ratio is marginally increased relative to the binary strategy (now a 13% improvement relative to the fixed-mix strategy). In addition, the tighter distribution around this target is more attractive.
` The other key advantage of the progressive de-risking strategy is visible in Figure 6 rather than Figure 7—progressively de-risking changes the way that the journey is experienced. Progressive de-risking avoids the optical concerns associated with the binary strategy that were raised above (i.e., high risk until the goal is reached, followed by a dramatic de-risk).
5 This overshoot is largely a function of our model having an annual de-risking process. A higher frequency of monitoring and hence a more rapid response to achieving the funded status goal would reduce the incidence and size of any overshoot. Nevertheless, a more progressive de-risking process will help, not hinder, the implementation of any de-risking actions at or near the funded ratio goal.

[ 2 0 ] M a p p i n g T h e J o u r n e y : N e w S t a n d a r d s i n P e n s i o n P l a n I n v e s t m e n t P o l i c y a n d I m p l e m e n t a t i o n I n v e s t m e n t I n s i g h t s , A u g u s t 2 0 13 [ 2 1 ]
FIGURE 7: IMPACT ON THE DISTRIBUTION OF OUTCOMES OF THE REBALANCING RULES SHOWN IN FIGURE 6
PR
OB
AB
ILIT
Y O
F E
XC
EE
DIN
GF
UN
DIN
G R
ATI
O
FUNDING RATIO
90%80%70%60%50%40%30%20%10%
0%80% 90% 100% 110% 120%
(F) Fixed mix (B) Binary (R) Rapid de-risking (S) Slow de-risking
Comparison of outcome distributions
DIF
FER
EN
CE
IN
PR
OB
AB
ILIT
Y R
ELA
TIVE
TO
FIX
ED
-MIX
STR
ATE
GY
FUNDING RATIO
(B) Binary (R) Rapid de-risking (S) Slow de-risking
-40%
-30%
-20%
-10%
0%
10%
20%
120%110%100%90%80%
Note: The lower chart is based on the same data. It shows differences compared to the fixed-mix strategy to make visual comparison easier.

[ 2 2 ] M a p p i n g T h e J o u r n e y : N e w S t a n d a r d s i n P e n s i o n P l a n I n v e s t m e n t P o l i c y a n d I m p l e m e n t a t i o n
The simulations have thus far made the unrealistic assumption that contributions are fixed for 10 years at the outset. This allowed the impact of the funding-ratio-contingent investment policy to be examined without the interference of other factors. Of course, in practice, contributions are reviewed on a regular basis. In this section, we therefore allow contributions to vary as a result of an annual review. We follow the typical approach of spreading deficits over future years, choosing a spreading period of 10 years (starting from each review date). There are two broad approaches to calculating the deficit for these contribution calculations, although there are obviously many differences in the fine detail.
` No respreading. In this paradigm, it is the deficit that has arisen since the last review that is used to calculate new contribution adjustments; that is, spread over the next 10 years. Effectively, the value of planned contributions is added to the current asset value before comparing with the liability value. The existing plan for forthcoming contributions (i.e., nine years’ worth at the point of first review) is retained, and only the new deficit (after taking these contributions into account) is spread over 10 years.
` With respreading. In this paradigm, the existing contribution schedule is replaced with a completely new schedule each year, so that contributions are calculated to fill the current deficit (liability value minus current asset value) over the next 10 years.
Figure 8 shows the result of following the fixed-mix and slow de-risking strategies, with and without respreading.
FIGURE 8: IMPACT ON THE DISTRIBUTION OF OUTCOMES WHEN CONTRIBUTIONS ARE VARIABLE
PR
OB
AB
ILIT
Y O
F E
XCE
ED
ING
FUN
DIN
G R
ATIO
FUNDING RATIO
0%
20%
40%
60%
80%
100%
120%110%100%90%80%
(F1) Fixed mix – no respreading (F2) Fixed mix – with respreading (S1) Slow de-risking – no respreading (S2) Slow de-risking – with respreading
SECTION 3
Considering variable contributions
[ 2 2 ] M a p p i n g T h e J o u r n e y : N e w S t a n d a r d s i n P e n s i o n P l a n I n v e s t m e n t P o l i c y a n d I m p l e m e n t a t i o n I n v e s t m e n t I n s i g h t s , A u g u s t 2 0 13 [ 2 3 ]
The relationship between the various strategies is very similar to before (which is why we have only shown two strategies). The one interesting new feature is that if the deficit is respread each year, this has the effect of regularly putting off contributions further into the future—and it becomes correspondingly less probable that any specific funding ratio will be met within the 10-year timescale illustrated here.
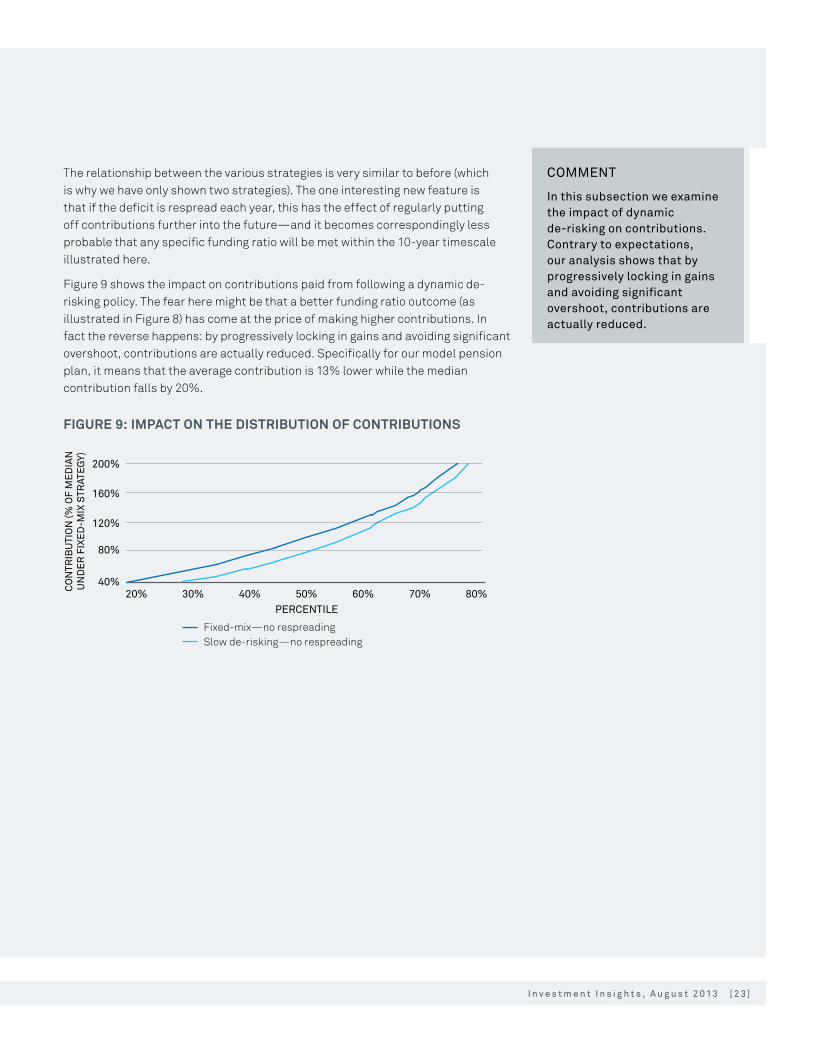
Figure 9 shows the impact on contributions paid from following a dynamic de-risking policy. The fear here might be that a better funding ratio outcome (as illustrated in Figure 8) has come at the price of making higher contributions. In fact the reverse happens: by progressively locking in gains and avoiding significant overshoot, contributions are actually reduced. Specifically for our model pension plan, it means that the average contribution is 13% lower while the median contribution falls by 20%.
FIGURE 9: IMPACT ON THE DISTRIBUTION OF CONTRIBUTIONS
200%
160%
120%
80%
40%
CO
NTR
IBU
TIO
N (%
OF
ME
DIA
NU
ND
ER
FIX
ED
-MIX
STR
ATE
GY)
PERCENTILE80%70%60%50%40%30%
Fixed-mix—no respreading Slow de-risking—no respreading
20%
COMMENT
In this subsection we examine the impact of dynamic de-risking on contributions. Contrary to expectations, our analysis shows that by progressively locking in gains and avoiding significant overshoot, contributions are actually reduced.
[ 2 4 ] M a p p i n g T h e J o u r n e y : N e w S t a n d a r d s i n P e n s i o n P l a n I n v e s t m e n t P o l i c y a n d I m p l e m e n t a t i o n
SECTION 3 KEY CONCLUSIONS FROM MODELING
`` There are tangible benefits and improvements in the distribution of future funded ratios (both with and without contributions) from adopting a dynamic investment policy linked to funded ratio.
`` There are merits in not de-risking too early, as the distribution of future funded ratios is improved by keeping asset-liability (i.e., surplus) investment risk relatively high until close to the funded ratio destination. This is true for most normal contribution rules. Indeed, de-risking too early causes a shift toward contributions to address the underfunding within the plan (i.e., away from investment risk) and/or the time to achieving the goal can be inappropriately long.
`` At the other extreme, however, a strategy of high risk until close to destination can lead to higher likelihood of undershooting the target (in those scenarios where the target is not quite achieved prior to a market fall). This will likely be uncomfortable for decision makers to live with, as year-on-year volatility is not reduced—despite getting closer to the end goal—and hence might appear an imprudent strategy to outside observers.

[ 2 4 ] M a p p i n g T h e J o u r n e y : N e w S t a n d a r d s i n P e n s i o n P l a n I n v e s t m e n t P o l i c y a n d I m p l e m e n t a t i o n I n v e s t m e n t I n s i g h t s , A u g u s t 2 0 13 [ 2 5 ]

[ 2 6 ] M a p p i n g T h e J o u r n e y : N e w S t a n d a r d s i n P e n s i o n P l a n I n v e s t m e n t P o l i c y a n d I m p l e m e n t a t i o n
ESSENTIALS
As well as the modeling output above, there are a range of more qualitative issues to bring to bear in the final design of an appropriate de-risking strategy, outlined in this section. It is inevitable that different boards and plan sponsors will judge the relative importance of each item differently, leading them to select different journey paths.
INVESTMENT RISK DIVERSIFICATIONIf a pension plan has no view on whether this year or a future year will be better in terms of the opportunities for investment, then a null or baseline strategy would be to consider spending risk evenly through time.
This can be thought of as the investment strategy equivalent of dollar cost-averaging, in that it reduces the pension plan’s exposure to investment risk in any one period by seeking to spread it evenly across time periods.
Observation. This pattern of risk exposure is perhaps best delivered by a strategy that de-risks only when the funding ratio goal has been achieved.
PROGRESSIVELY LOCKING IN GAINSFor a pension plan that wishes to progressively take less risk as it nears its goal—perhaps in order to provide evidence to stakeholders that it is becoming more cautious as and when the opportunity presents itself—a tapering risk budget is appropriate. This has the benefit of progressively increasing certainty of outcomes, and can provide utility as a result.
But it can also mean that the pension plan only achieves its goal over a protracted period. And, as noted previously, it can mean that the burden to fill any funding gap falls more heavily on expected contributions.
Observation. This is best illustrated by strategies that de-risk steadily over time. In these, the quantity of return-seeking assets falls faster than the funded ratio increases.
PLAN SPONSOR COVENANT STRENGTHOne of the main reasons a pension plan board can take investment risk is that it has the security that the plan sponsor is willing to make contributions into the plan to restore any deficit that emerges if investment risk-taking does not pay off. This is often referred to as the plan sponsor covenant. The strength of the plan sponsor
Other issues to consider

[ 2 6 ] M a p p i n g T h e J o u r n e y : N e w S t a n d a r d s i n P e n s i o n P l a n I n v e s t m e n t P o l i c y a n d I m p l e m e n t a t i o n I n v e s t m e n t I n s i g h t s , A u g u s t 2 0 13 [ 2 7 ]
6 Such an accounting change is a distinct possibility in the US, for instance, where the second part of FAS87 reform is outstanding. This might remove the expected return on assets from the calculation of pension plan expense, and might directly bias pension plan boards to take risk ahead of this change rather than afterward.
covenant provides for investment freedom. As a general rule, a plan’s board will be less confident of the plan sponsor covenant the longer the forecast period and, as a result, it is probably appropriate to spend more risk in the early years than in years far in the future. The result is a downward slope to the graph of investment risk budget over time.
Observation. Again, this is best illustrated by strategies that spend their risk budget earlier rather than later. In these, the quantity of return-seeking assets falls faster than the funded ratio increases.
VIEWS ON ABSOLUTE LEVEL OF INVESTMENT REWARDIf a plan board has a view about the relative reward from investment markets in the near term versus the longer term, the investment risk budget can be tuned accordingly. For instance, if there is a view that near-term risks are abnormally high, or that near-term downside risks are particularly acute or worrisome, the near-term risk budget can be reduced in favor of planning to take more risk at a later point in time. This can manifest itself through an overall lower risk budget, or by explicitly reducing one risk factor within the investment strategy; for example, reducing the interest rate duration mismatch. Naturally the reverse can also be true, resulting in a desire for a higher near-term risk budget than would otherwise be the case.
It is worth noting that incorporating views of this nature into the journey path requires the decision makers to exhibit skill—that is,some positive return to their views—in order for this to be worthwhile.
Observation. Depending on the investors’ view, any of the investment strategies could be preferred.
ACCOUNTING OR OTHER REGULATORY CHANGESExternal, essentially non-investment, factors can also play into the decision of how to spend investment risk over multiple years. For instance, if there is a known or expected future change to pension plan accounting, it might have the consequence of biasing upward the amount of investment risk taken in the years before the change, and a plan to take less risk after the change.6
Such external factors are very market-specific but are important, as they can cause all plans in that market to act in a similar manner.
Observation. This can cut both ways, but it is likely that regulatory uncertainty or expected change would favor a strategy that de-risks steadily.
[ 2 8 ] M a p p i n g T h e J o u r n e y : N e w S t a n d a r d s i n P e n s i o n P l a n I n v e s t m e n t P o l i c y a n d I m p l e m e n t a t i o n
SECTION 4
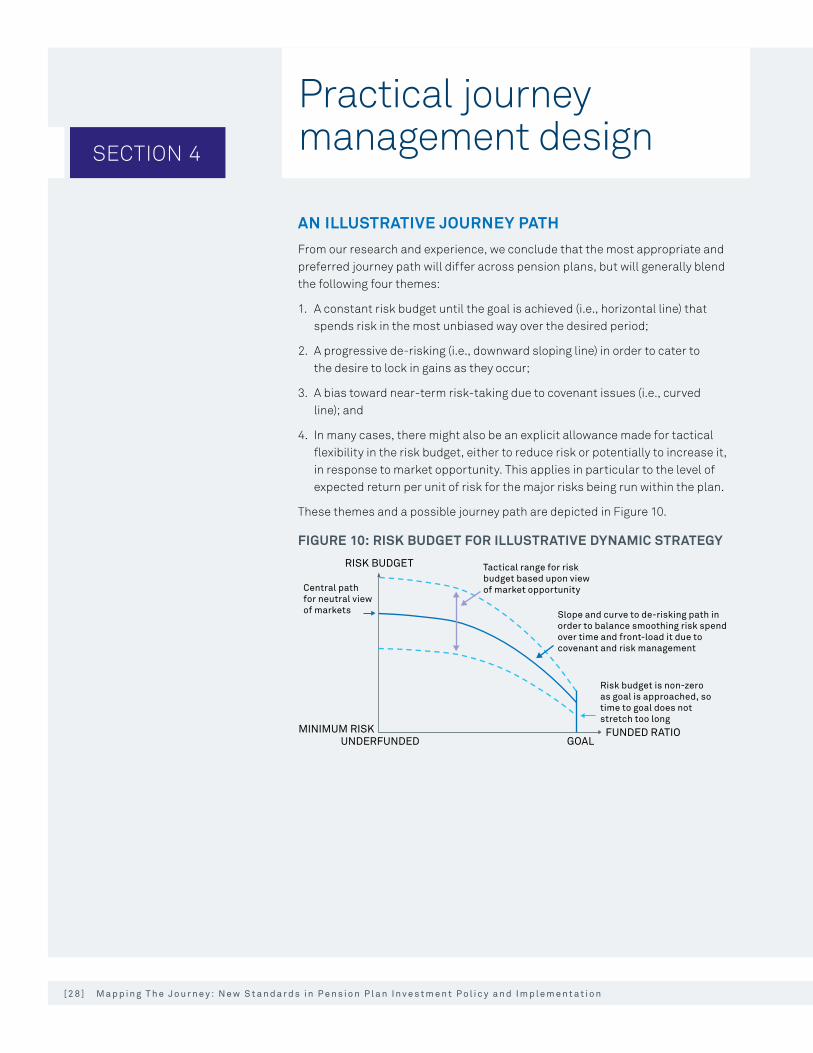
AN ILLUSTRATIVE JOURNEY PATHFrom our research and experience, we conclude that the most appropriate and preferred journey path will differ across pension plans, but will generally blend the following four themes:
1. A constant risk budget until the goal is achieved (i.e., horizontal line) that spends risk in the most unbiased way over the desired period;
2. A progressive de-risking (i.e., downward sloping line) in order to cater to the desire to lock in gains as they occur;
3. A bias toward near-term risk-taking due to covenant issues (i.e., curved line); and
4. In many cases, there might also be an explicit allowance made for tactical flexibility in the risk budget, either to reduce risk or potentially to increase it, in response to market opportunity. This applies in particular to the level of expected return per unit of risk for the major risks being run within the plan.
These themes and a possible journey path are depicted in Figure 10.
FIGURE 10: RISK BUDGET FOR ILLUSTRATIVE DYNAMIC STRATEGY
Central path for neutral view of markets
Tactical range for riskbudget based upon view of market opportunity
FUNDED RATIO
RISK BUDGET
UNDERFUNDED
Risk budget is non-zeroas goal is approached, sotime to goal does notstretch too long
Slope and curve to de-risking path inorder to balance smoothing risk spend over time and front-load it due tocovenant and risk management
GOALMINIMUM RISK
Practical journey management design

[ 2 8 ] M a p p i n g T h e J o u r n e y : N e w S t a n d a r d s i n P e n s i o n P l a n I n v e s t m e n t P o l i c y a n d I m p l e m e n t a t i o n I n v e s t m e n t I n s i g h t s , A u g u s t 2 0 13 [ 2 9 ]
THE JOURNEY MANAGEMENT PROCESSGiven that there is no single correct journey plan—that is, the most appropriate journey map varies from plan to plan according to situation, preferences and views—we believe that best practices in this area center on an appropriate process. We outline this in high-level terms below:
` Set the journey path in terms of a risk budget linked to the funded ratio7 (as shown above). This provides a focused framework for decision making, and yet enables a flexible implementation if, for instance, key risk variables such as yields and equity P/E ratios have changed a great deal but the funded ratio has stayed relatively constant.
` Seek to optimize the spend of the risk budget at each point in time via consideration of current market conditions and views of return opportunities. Clearly this could be done at the outset when the journey plan is formed, but we believe it is important to keep any premeditated asset allocations under review to make sure that the journey plan remains fresh and appropriate and reacts to new information as time passes.
` In spending the investment risk budget in the most efficient manner, all of the usual LDI best practices apply:
— Be prepared to use asset leverage if it improves the ability to create efficient surplus portfolios (i.e., increases the surplus Sharpe ratio);
— Consider risk factors ahead of asset classes per se, as this can help frame asset-liability risk more clearly;
— Consider potential co-cyclicality between the plan and the plan sponsor; that is, be cautious of economic scenarios that would coincidentally hurt the plan and the plan sponsor’s ability to make additional contributions; and
— Embrace both beta and alpha, and do not limit the alpha to the beta assets; that is, think in terms of alpha/beta separation and portability.
7 We note that the ultimate goal might be a funded ratio in excess of 100%; that is, there might need to be a surplus to cover unhedgeable risks and/or a recognition that the true value of the liability is higher than the measured value. Furthermore, in certain markets, such as the Netherlands, regulators may impose a minimum coverage ratio that is higher than 100%.

[ 3 0 ] M a p p i n g T h e J o u r n e y : N e w S t a n d a r d s i n P e n s i o n P l a n I n v e s t m e n t P o l i c y a n d I m p l e m e n t a t i o n
CASE STUDY: CREATING A SET OF ASSET ALLOCATIONS TO DELIVER A STRATEGIC JOURNEY PLANSuppose a pension plan board has chosen a journey plan that seeks to link risk to funded status in a manner consistent with the thoughts and discussions above. Using a simplified set of asset classes or risk factors, and a constraint that no asset leverage is to be used, we can design a series of most efficient—that is, optimal—portfolios for each funded ratio point (see Appendix 3 for details):
COMMENT
` The target for the de-risking plan has been set here to be 110% funded, whereas elsewhere in our analysis we have used 100%. This is due to the real-world situation whereby 100% funded is rarely enough to truly discharge the liabilities over time, due to a range of factors that might impact the plan, such as underestimated population longevity, the costs and fees of running the plan, and the credit downgrade headwind (Ransenberg and Hobbs 2011).
` Due to the inability in this part of the case study to leverage the assets, there is a tension between the dual tasks of managing the liability-related risks and generating excess return. This is particularly seen at lower funded ratios where the targeted risk budget is larger. The result is an incomplete liability interest rate hedge. (Note that the credit spread hedge ratio is reported above 100% in many portfolios, due to the assumed influence of equities; see Appendix 3 for more details.)
FIGURE 11: CASE STUDY (A)—WITHOUT USING ASSET LEVERAGE
Funded ratio 85% 90% 95% 100% 102.5% 105% 107.5% 110%
Surplus volatility 10.0% 9.5% 8.5% 7.0% 6.0% 4.5% 2.5% 0%
Global equity 45% 44% 41% 35% 31% 24% 14% 0%
Long corporate 49% 51% 54% 60% 64% 71% 80% 76%
Treasury Strips 20+ 7% 6% 5% 5% 5% 5% 5% 7%
Cash 0% 0% 0% 0% 0% 0% 0% 17%
Rate hedge ratio 53% 55% 61% 70% 76% 85% 99% 100%
Credit hedge ratio 88% 95% 101% 107% 111% 115% 119% 100%
Surplus return (scaled by funded ratio) 0.4% 0.7% 1.0% 1.1% 1.1% 1.1% 0.9% 0.2%
Surplus return/vol ratio 4% 8% 11% 16% 19% 24% 37% n/a
SECTION 4
[ 3 0 ] M a p p i n g T h e J o u r n e y : N e w S t a n d a r d s i n P e n s i o n P l a n I n v e s t m e n t P o l i c y a n d I m p l e m e n t a t i o n I n v e s t m e n t I n s i g h t s , A u g u s t 2 0 13 [ 3 1 ]
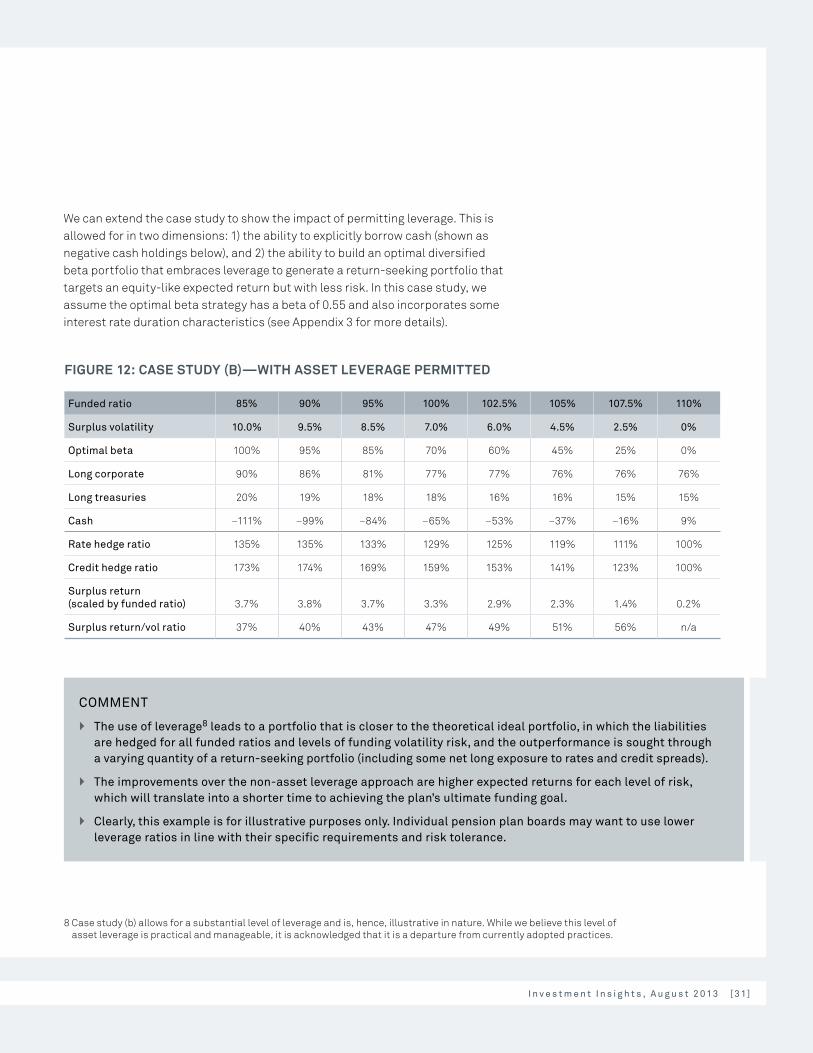
We can extend the case study to show the impact of permitting leverage. This is allowed for in two dimensions: 1) the ability to explicitly borrow cash (shown as negative cash holdings below), and 2) the ability to build an optimal diversified beta portfolio that embraces leverage to generate a return-seeking portfolio that targets an equity-like expected return but with less risk. In this case study, we assume the optimal beta strategy has a beta of 0.55 and also incorporates some interest rate duration characteristics (see Appendix 3 for more details).
FIGURE 12: CASE STUDY (B)—WITH ASSET LEVERAGE PERMITTED
Funded ratio 85% 90% 95% 100% 102.5% 105% 107.5% 110%
Surplus volatility 10.0% 9.5% 8.5% 7.0% 6.0% 4.5% 2.5% 0%
Optimal beta 100% 95% 85% 70% 60% 45% 25% 0%
Long corporate 90% 86% 81% 77% 77% 76% 76% 76%
Long treasuries 20% 19% 18% 18% 16% 16% 15% 15%
Cash –111% –99% –84% –65% –53% –37% –16% 9%
Rate hedge ratio 135% 135% 133% 129% 125% 119% 111% 100%
Credit hedge ratio 173% 174% 169% 159% 153% 141% 123% 100%
Surplus return (scaled by funded ratio) 3.7% 3.8% 3.7% 3.3% 2.9% 2.3% 1.4% 0.2%
Surplus return/vol ratio 37% 40% 43% 47% 49% 51% 56% n/a
8 Case study (b) allows for a substantial level of leverage and is, hence, illustrative in nature. While we believe this level of asset leverage is practical and manageable, it is acknowledged that it is a departure from currently adopted practices.
COMMENT
` The use of leverage8 leads to a portfolio that is closer to the theoretical ideal portfolio, in which the liabilities are hedged for all funded ratios and levels of funding volatility risk, and the outperformance is sought through a varying quantity of a return-seeking portfolio (including some net long exposure to rates and credit spreads).
` The improvements over the non-asset leverage approach are higher expected returns for each level of risk, which will translate into a shorter time to achieving the plan’s ultimate funding goal.
` Clearly, this example is for illustrative purposes only. Individual pension plan boards may want to use lower leverage ratios in line with their specific requirements and risk tolerance.

[ 3 2 ] M a p p i n g T h e J o u r n e y : N e w S t a n d a r d s i n P e n s i o n P l a n I n v e s t m e n t P o l i c y a n d I m p l e m e n t a t i o n
SECTION 5
INTEGRATING MARKET INSIGHTS INTO A JOURNEY MANAGEMENT POLICYHaving established that a more dynamic and flexible approach to asset allocation can be helpful in meeting a plan’s objectives, it follows that pension plan boards might seek to incorporate short-to-medium term asset allocation views to help implement their policy. Specifically, can they find a fertile middle-ground between long-term expected returns and a highly tactical policy that involves market-timing, and hence one that fits well with their dynamic de-risking time horizon?
Trying to time the markets is a notoriously difficult exercise, given inherent market volatility and the wide range of factors that influence price-formation. Nevertheless, solely relying upon very long-term, equilibrium market-expected returns might be out of sync with the implicit time horizon over which investments are being made in a dynamic de-risking strategy. The answer we suggest lies in reviewing traditional risk and return perspectives in light of a shorter, albeit medium-term, time horizon.
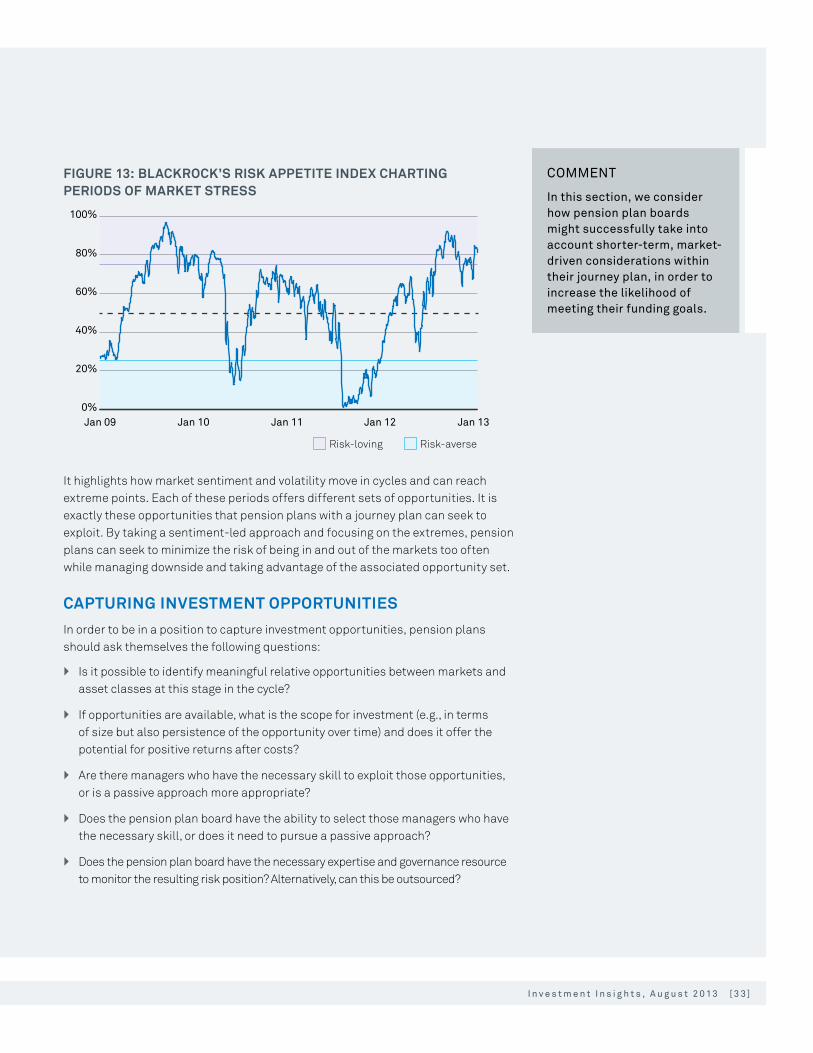
ADJUSTING SIZE AND SPEND OF RISK BUDGETTraditional strategic asset allocation and portfolio optimization are based on long- term views of market behavior. A standard assumption is that the returns have a known stable distribution. In particular, constant volatility and correlations are assumed. In cases where the measurement period is long, for example annual data, these assumptions might hold sufficiently well to ignore the difference between the assumed and true behavior of the returns. For shorter periods, however, observed data generally exhibit behavior that is not in line with these model assumptions. In particular, correlations tend to vary over time, and volatility tends to appear in clusters of high and low volatility. Further, correlations between different asset classes tend to increase when volatility is very high. These periods of high volatility and highly correlated asset class returns seem to be driven by irrational or even panic behavior. By way of example, Figure 13 shows the output of BlackRock’s Risk Appetite and Stress Index.
How to implement in practice
[ 3 2 ] M a p p i n g T h e J o u r n e y : N e w S t a n d a r d s i n P e n s i o n P l a n I n v e s t m e n t P o l i c y a n d I m p l e m e n t a t i o n I n v e s t m e n t I n s i g h t s , A u g u s t 2 0 13 [ 3 3 ]
FIGURE 13: BLACKROCK’S RISK APPETITE INDEX CHARTING PERIODS OF MARKET STRESS
Risk-loving Risk-averse
0%
20%
40%
60%
80%
100%
Jan 13Jan 12Jan 11Jan 10Jan 09
It highlights how market sentiment and volatility move in cycles and can reach extreme points. Each of these periods offers different sets of opportunities. It is exactly these opportunities that pension plans with a journey plan can seek to exploit. By taking a sentiment-led approach and focusing on the extremes, pension plans can seek to minimize the risk of being in and out of the markets too often while managing downside and taking advantage of the associated opportunity set.
CAPTURING INVESTMENT OPPORTUNITIESIn order to be in a position to capture investment opportunities, pension plans should ask themselves the following questions:
` Is it possible to identify meaningful relative opportunities between markets and asset classes at this stage in the cycle?
` If opportunities are available, what is the scope for investment (e.g., in terms of size but also persistence of the opportunity over time) and does it offer the potential for positive returns after costs?
` Are there managers who have the necessary skill to exploit those opportunities, or is a passive approach more appropriate?
` Does the pension plan board have the ability to select those managers who have the necessary skill, or does it need to pursue a passive approach?
` Does the pension plan board have the necessary expertise and governance resource to monitor the resulting risk position? Alternatively, can this be outsourced?
COMMENT
In this section, we consider how pension plan boards might successfully take into account shorter-term, market-driven considerations within their journey plan, in order to increase the likelihood of meeting their funding goals.
[ 3 4 ] M a p p i n g T h e J o u r n e y : N e w S t a n d a r d s i n P e n s i o n P l a n I n v e s t m e n t P o l i c y a n d I m p l e m e n t a t i o n
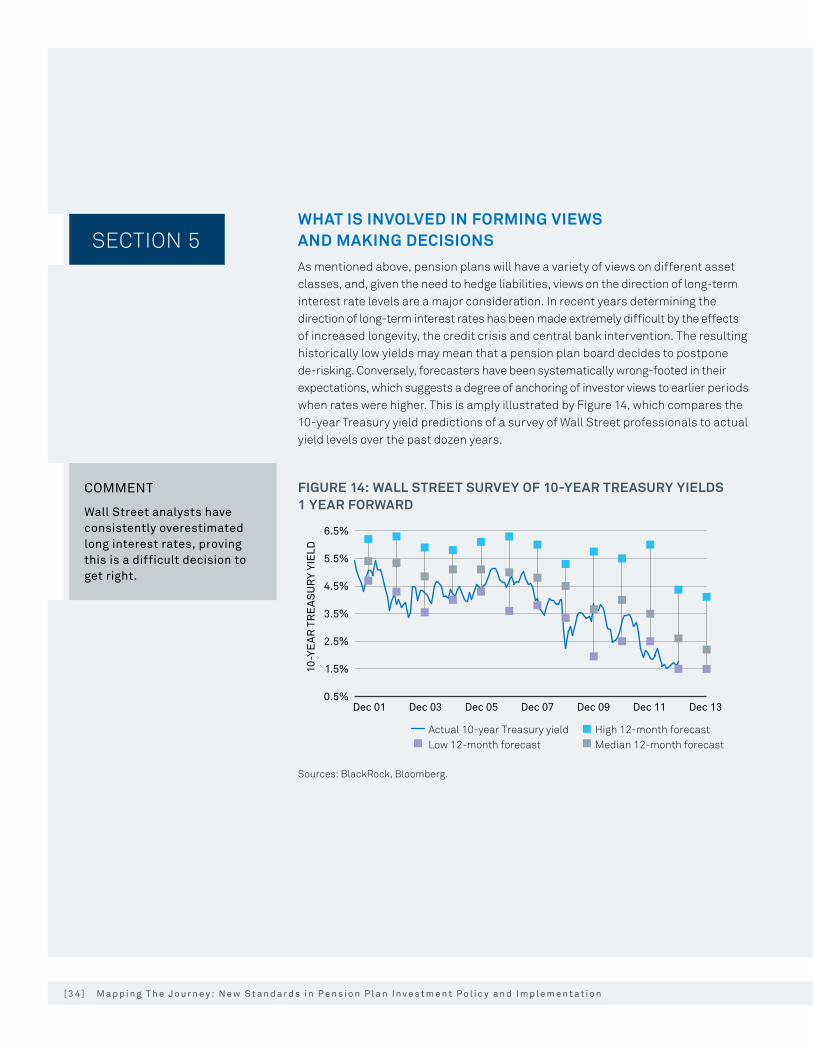
SECTION 5WHAT IS INVOLVED IN FORMING VIEWS AND MAKING DECISIONS As mentioned above, pension plans will have a variety of views on different asset classes, and, given the need to hedge liabilities, views on the direction of long-term interest rate levels are a major consideration. In recent years determining the direction of long-term interest rates has been made extremely difficult by the effects of increased longevity, the credit crisis and central bank intervention. The resulting historically low yields may mean that a pension plan board decides to postpone de-risking. Conversely, forecasters have been systematically wrong-footed in their expectations, which suggests a degree of anchoring of investor views to earlier periods when rates were higher. This is amply illustrated by Figure 14, which compares the 10-year Treasury yield predictions of a survey of Wall Street professionals to actual yield levels over the past dozen years.
FIGURE 14: WALL STREET SURVEY OF 10-YEAR TREASURY YIELDS 1 YEAR FORWARD
10-Y
EA
R T
RE
AS
UR
Y YI
ELD
Actual 10-year Treasury yield High 12-month forecastLow 12-month forecast Median 12-month forecast
0.5%
1.5%
2.5%
3.5%
4.5%
5.5%
6.5%
Dec 13Dec 11Dec 09Dec 07Dec 05Dec 03Dec 01
Sources: BlackRock, Bloomberg.
COMMENT
Wall Street analysts have consistently overestimated long interest rates, proving this is a difficult decision to get right.
[ 3 4 ] M a p p i n g T h e J o u r n e y : N e w S t a n d a r d s i n P e n s i o n P l a n I n v e s t m e n t P o l i c y a n d I m p l e m e n t a t i o n I n v e s t m e n t I n s i g h t s , A u g u s t 2 0 13 [ 3 5 ]
While many investors think long rates are likely to go up, it could take longer than is anticipated, and they might be muted by the pent-up demand from pension plan and other long-horizon investors, particularly in light of the rapid aging of the world population and the associated demand for income. The outlook is further complicated by the sovereign bond crisis, which means that, in several jurisdictions, pension plan boards now have to take a view on the creditworthiness of government bonds or start exploring alternative hedging instruments.
More generally, all asset views will need to be underpinned by the most appropriate relative value measures, such as credit quality for fixed income, PE ratios for equities, rental yields in real estate, and so on. Where strategies are taking relative stock positions, this will drill down to the individual characteristics of that stock. The outcome of that analysis is then tied back to the parameters we set out above in terms of risk, return potential and liquidity, and is set against the pension plan’s time horizon in relation to that particular risk position.
Ultimately, all views about asset and security risks and returns must be scaled by size and confidence, and built into the investment portfolio in a meaningful way. The process should be consistently and regularly refreshed so that the portfolio stays appropriate over time.
OPTIMIZING THE GOVERNANCE PROCESSAs outlined above, successful implementation of a dynamic investment policy is more complex than the management of a static policy; hence, the oversight and governance process involved should be reconsidered and, if necessary, re-engineered. Although the precise design varies according to each plan’s needs and expertise, in our experience good governance systems contain the following key elements:
` Clear statement of beliefs;
` Holistic oversight of investment decisions;
` An awareness of the broad market environment;
` Reporting that is aligned to the overall objective of the plan; and
` An explicit agreement on appropriate levels of delegation.
COMMENT
Successful implementation of a dynamic investment policy is more complex than the management of a static policy; hence, the oversight and governance process involved should be reconsidered and, if necessary, re-engineered.
[ 3 6 ] M a p p i n g T h e J o u r n e y : N e w S t a n d a r d s i n P e n s i o n P l a n I n v e s t m e n t P o l i c y a n d I m p l e m e n t a t i o n
SECTION 5Clear statement of beliefsAs we have argued, it is important to take risk knowingly and with eyes open—having explicit views forces a pension plan to weigh the risks around these views and thus to size the resulting positions appropriately. If, on the other hand, a plan board has no strong view, then that is an important step in itself. Pension plan boards oversee a wide range of investment decisions. The challenge is to focus on the important rather than the urgent issues. To successfully prepare for this, we believe a discipline of setting out a set of core beliefs can help in a number of ways:
` Prioritization. By helping to sift potential decisions, scarce resources can be deployed into those areas where a difference can be made. It may also help to determine where decisions should be delegated to a third party.
` Transparency. Investment involves taking risk to generate performance. A clear statement of beliefs helps stakeholders to move from simply focusing on return to understanding the context within which risk has been taken. Discussions on appropriate strategy are more likely to reach consensus if underlying principles can be agreed first.
` Consistency. Different and inconsistent approaches may be taken in different areas of a portfolio, particularly where these are managed in silos. Having a clear statement of beliefs can help mitigate this risk.
Oversight of investment decisionsTo the extent that investment views are being used to drive the investment strategy, they will need to be taken by delegates of the pension plan. These may be internal (e.g., staff of the pension plan) or external (e.g., investment managers). In either case, monitoring is essential to ensure consistency with plan objectives, but it should be oversight rather than interference to enable the investment portfolio to adapt speedily to a changing environment and maintain a holistic view.
In the context of journey management, the investment views expressed will be partly strategic, partly tactical. They will often lead to a medium-term portfolio tilt away from a neutral position based on the conviction that these views will be rewarded by the markets, even if short-term volatility is rather large. These types of views can add a great deal of value compared with the typical narrowly controlled positions taken within an active mandate, but it is important for a board to understand in advance the nature and scale of the positions and be prepared for the resulting short-term volatility.
COMMENT
Optimizing each of the essential components of the governance process is an important prerequisite for effective journey management. Only then can boards take informed decisions around the need and extent of delegation.

[ 3 6 ] M a p p i n g T h e J o u r n e y : N e w S t a n d a r d s i n P e n s i o n P l a n I n v e s t m e n t P o l i c y a n d I m p l e m e n t a t i o n I n v e s t m e n t I n s i g h t s , A u g u s t 2 0 13 [ 3 7 ]
Broad market awarenessThe output of reviews of investment strategy should be a decision on which market exposures are required by the plan. We believe that this should be separated from the question of how this exposure is to be achieved. This choice often benefits from an in-depth knowledge of the market instruments available, their practical issues, and an awareness of short-term and structural market dynamics.
Objective-oriented reportingToo often, in our experience, plan boards struggle to switch their focus back from the detail of short-term investment decisions to the bigger strategic picture. Yet the shorter-term decisions are only valuable if, in aggregate, they meet the longer-term needs. A vital check on the overall process is therefore provided by always reporting the high-level funding and risk positions; this puts short-term decisions in their proper context and allows them to be measured against their impact on the long-term objectives of the plan. Specifically, expected contributions of each source of return (e.g., broad allocation, active management or tactical views) should correspond broadly to the ranges expected in advance.
DelegationThe key elements discussed above apply equally well when there is an in-house chief investment officer or where there is an externally delegated CIO function. The decision of which route to use depends on a range of considerations. These include:
1. Whether or not the plan has the ability to deploy the necessary resources to develop market views confidently and to keep track of developments in the instrument opportunity set;
2. The ability to trade quickly and efficiently when required, including during periods of market stress; and
3. The board’s views on the relative skills of in-house and third-party staff. Often the decision between delegation and in-house is not either/or. Pension plans may decide, for instance, to delegate only specific functions such as risk management or to adopt a gradual approach to outsourcing or delegation.

[ 3 8 ] M a p p i n g T h e J o u r n e y : N e w S t a n d a r d s i n P e n s i o n P l a n I n v e s t m e n t P o l i c y a n d I m p l e m e n t a t i o n
ESSENTIALS
A STATEMENT OF CORE (LONG-TERM) INVESTMENT BELIEFS WILL USUALLY INCORPORATE MANY OF THE FOLLOWING THEMES:
` Plan objectives. These can vary significantly. Security for members is a primary consideration, but so too is the potential impact of investment returns on the level of contributions required from sponsors and beneficiaries. Where benefits are flexible (e.g., if discretionary benefits may be payable) a statement of objectives can help to clarify the risk appetite of the plan.
` Least-risky strategy. Measuring risk in a long-term enterprise such as a pension plan is often controversial. Consideration of what a least-risky investment strategy may look like helps to focus attention on the right risk measure: risk relative to this safe harbor may then be the right benchmark for how much risk the plan is taking. In addition, the discussion of what represents least risk can be revealing: some boards may prefer government bonds, some swaps, some high-quality corporate bonds. Evolving views on the credit quality of governments and the financial industry can have a big impact on the answer here, with implications for the entire strategic asset allocation.
` Time frame. For underfunded plans, a recovery plan, with signposts for how deviations from this plan will be managed, will often be a key part of the strategic planning process; the desired time frame over which to recover is therefore an important determinant of a plan’s risk appetite.
` Role of tactics. Some plans take a long-term, more strategic approach to asset allocation; others recognize that the market opportunity set can change rapidly and furthermore believe that they can profit by allocating tactically to more attractive asset classes. Some plans may do this internally, while others may delegate the tactical asset allocation to a third party. In either case, the plan is acknowledging they have access to tactical expertise of sufficient quality. Having a clear view that, for example, government debt is fairly priced only if it
Statement of investment beliefs

[ 3 8 ] M a p p i n g T h e J o u r n e y : N e w S t a n d a r d s i n P e n s i o n P l a n I n v e s t m e n t P o l i c y a n d I m p l e m e n t a t i o n I n v e s t m e n t I n s i g h t s , A u g u s t 2 0 13 [ 3 9 ]
has a certain minimum yield enables the appropriate asset allocation strategy to be readily determined. In our experience, the articulation process helps to build consensus and to provide confidence later on, should markets not behave as predicted. Also, by being explicit, the board and/or delegated manager’s view can be readily monitored and revised as market conditions change.
` Asset universe. Most plans will seek to diversify to generate return with as little risk as possible. However, the range of asset classes to consider from a strategic perspective may be rather small or more extensive (e.g., high-yield bonds, emerging market exposures, currency exposures and so on). So-called alternative asset classes and strategies can also be attractive, although some pension plans may not be in a position to invest in alternative asset classes due to their relative complexity. Delegating or outsourcing may be a way of overcoming this expertise gap.
` Role of active management. Active management may be required for some asset classes (e.g., property, private equity), but for others plans will face a choice. A decision to invest actively in a particular market must depend on three things: (1) the existence of opportunities to produce positive excess returns; (2) the capability of a manager to identify these and invest so as to produce a positive return net of costs; and (3) the ability of the plan to identify such a manager. Pension plan boards may determine that active management is worthwhile in some markets but not in others, or that the plan should focus on a particular investment style or diversify across many. A subsequent question is then to determine what the right mix of market risk and manager risk should be when constructing a total portfolio.
` Role of derivatives. Derivatives are now widely used by pension plans, largely to help manage risk efficiently. If there are concerns about the operational or other aspects of derivative use, then it is helpful to determine this at a high level so that the policy can be applied consistently across the entire portfolio.
[ 4 0 ] M a p p i n g T h e J o u r n e y : N e w S t a n d a r d s i n P e n s i o n P l a n I n v e s t m e n t P o l i c y a n d I m p l e m e n t a t i o n
Conclusions: Journey management
Pension plan boards should first and foremost focus on achieving a goal. This goal for many pension plans, especially mature, closed or terminated plans, is to achieve and maintain full funding (or perhaps a modest surplus). To this end we advocate an approach that focuses on:
1. Setting an appropriate surplus investment risk budget, and then
2. Spending the risk budget to the best effect over time. As shown in this paper, the natural consequence of this approach is the adoption of a dynamic asset allocation related to the plan’s funded ratio.
In addition, we contend that pension plan boards should be comfortable with asset leverage as long as it is used to better attain the desired risk exposures, and therefore to more fully manage liability risks (principally those associated with liability duration risk) while seeking to add outperformance as desired. In practice, plan boards can design their dynamic asset allocation in several forms, depending on their strategic and tactical views, but we suggest it will necessarily involve reviewing traditional risk-and-return perspectives in light of a shorter, albeit medium-term, time horizon.
Effective journey management also requires pension plan boards to consider multiple portfolio choices at the same time and to do so on a regular basis. This, in turn, requires pension fund boards to optimize their governance processes. For many pension plans this will entail partial or complete outsourcing of the pension investment management function in order to obtain the necessary dedicated resources.

[ 4 0 ] M a p p i n g T h e J o u r n e y : N e w S t a n d a r d s i n P e n s i o n P l a n I n v e s t m e n t P o l i c y a n d I m p l e m e n t a t i o n I n v e s t m e n t I n s i g h t s , A u g u s t 2 0 13 [ 41 ]
Define success: For example, full funding in 7 years’ time and de-risked.
Strategic plan: Determine how investment policy should evolve as funding ratio improves.
Tactical refinements: Agree on process for adapting key risk exposures as market opportunities arise.
Smooth and secure implementation, through:
—Choice of benchmarks;
—Capital budgeting;
—Instrument selection;
—Governance process;
—Performance measurement.
Effective monitoring: Use surplus exposure (ex ante) and performance attribution reporting (ex post) that incorporates the assets and liabilities.
Adapt journey plan: Take into account changes in funding ratio, risk budget and market environment.
1
2
3
4
5
65
4
31GOAL 2
STRATEGY
REFI
NE
IMPLEMENT
MONITOR
6 ADA
PT
MEETING PLAN-SPECIFIC
OUTCOME
The significant promise of a carefully designed and implemented journey plan is more-likely attainment of a pension plan’s long-term goal and the avoidance of inappropriately large funded ratio volatility.
FIGURE 15: SUMMARY OF THE JOURNEY MANAGEMENT DEVELOPMENT AND IMPLEMENTATION PROCESS

[ 4 2 ] M a p p i n g T h e J o u r n e y : N e w S t a n d a r d s i n P e n s i o n P l a n I n v e s t m e n t P o l i c y a n d I m p l e m e n t a t i o n
Black, Fischer, and Piotr Karasinski. 1991. “Bond and Option Pricing when Short Rates are Lognormal.” Financial Analysts Journal 47, no. 4 (July-August).
Campbell, John. 2002. “Strategic Asset allocation: Portfolio Choice for Long-Term Investors” address to the American Economic Association and American Finance Association, January 4.
Jarrow, Robert A., David Lando, and Stuart M. Turnbull. 1997. “A Markov Model for the Term Structure of Credit Risk Spreads.” The Review of Financial Studies 10, no. 2.
Merton, Robert C. 1976. “Option Pricing When Underlying Stock Returns Are Discontinuous.” Journal of Financial Economics 3.
Heston, Steven L. 1993. “A Closed-Form Solution for Options with Stochastic Volatility with Applications to Bond and Currency Options.” The Review of Financial Studies 6, no. 2.
Ransenberg, Dan, and Jonathan Hobbs. 2011. “Overcoming Credit Headwinds: Four Ways to Improve Your Liability Hedge.” Investment Insights 14 issue 2 (April), New York: BlackRock, Inc.
References
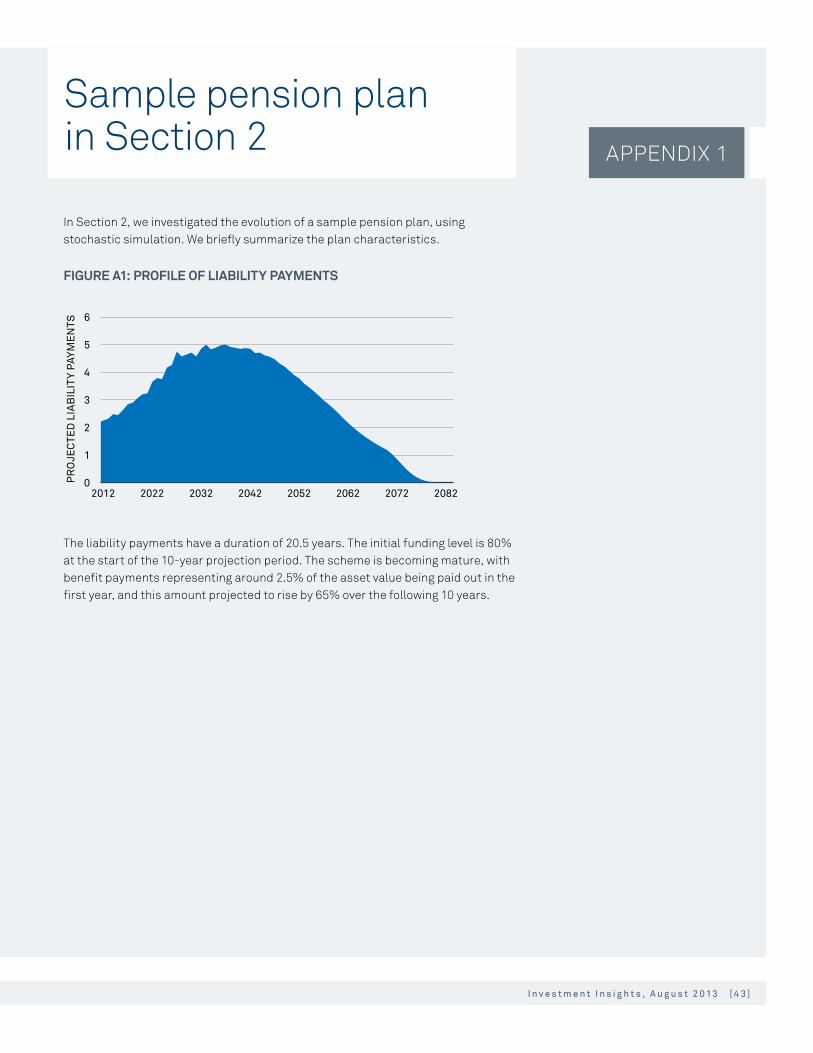
[ 4 2 ] M a p p i n g T h e J o u r n e y : N e w S t a n d a r d s i n P e n s i o n P l a n I n v e s t m e n t P o l i c y a n d I m p l e m e n t a t i o n I n v e s t m e n t I n s i g h t s , A u g u s t 2 0 13 [ 4 3 ]
APPENDIX 1
In Section 2, we investigated the evolution of a sample pension plan, using stochastic simulation. We briefly summarize the plan characteristics.
FIGURE A1: PROFILE OF LIABILITY PAYMENTS
PR
OJE
CTE
D L
IAB
ILIT
Y PA
YME
NTS
0
1
2
3
4
5
6
20822072206220522042203220222012
The liability payments have a duration of 20.5 years. The initial funding level is 80% at the start of the 10-year projection period. The scheme is becoming mature, with benefit payments representing around 2.5% of the asset value being paid out in the first year, and this amount projected to rise by 65% over the following 10 years.
Sample pension plan in Section 2
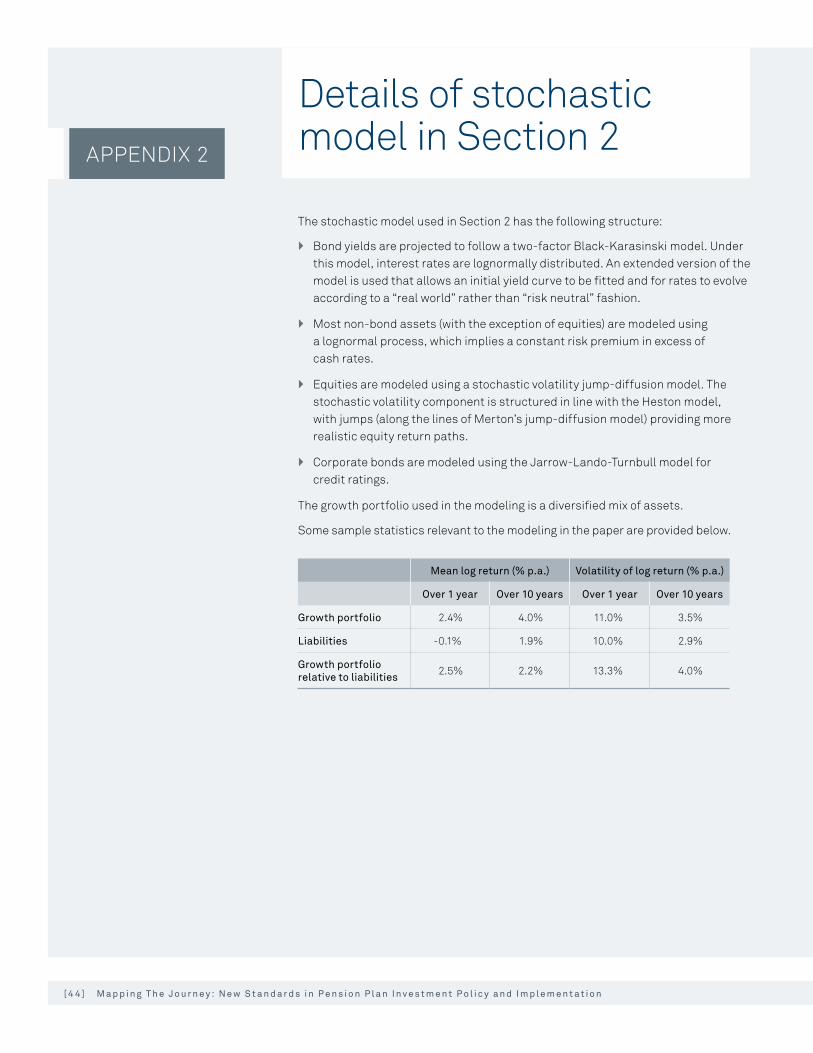
[ 4 4 ] M a p p i n g T h e J o u r n e y : N e w S t a n d a r d s i n P e n s i o n P l a n I n v e s t m e n t P o l i c y a n d I m p l e m e n t a t i o n
The stochastic model used in Section 2 has the following structure:
` Bond yields are projected to follow a two-factor Black-Karasinski model. Under this model, interest rates are lognormally distributed. An extended version of the model is used that allows an initial yield curve to be fitted and for rates to evolve according to a “real world” rather than “risk neutral” fashion.
` Most non-bond assets (with the exception of equities) are modeled using a lognormal process, which implies a constant risk premium in excess of cash rates.
` Equities are modeled using a stochastic volatility jump-diffusion model. The stochastic volatility component is structured in line with the Heston model, with jumps (along the lines of Merton’s jump-diffusion model) providing more realistic equity return paths.
` Corporate bonds are modeled using the Jarrow-Lando-Turnbull model for credit ratings.
The growth portfolio used in the modeling is a diversified mix of assets.
Some sample statistics relevant to the modeling in the paper are provided below.
Mean log return (% p.a.) Volatility of log return (% p.a.)
Over 1 year Over 10 years Over 1 year Over 10 years
Growth portfolio 2.4% 4.0% 11.0% 3.5%
Liabilities -0.1% 1.9% 10.0% 2.9%
Growth portfolio relative to liabilities 2.5% 2.2% 13.3% 4.0%
APPENDIX 2
Details of stochastic model in Section 2
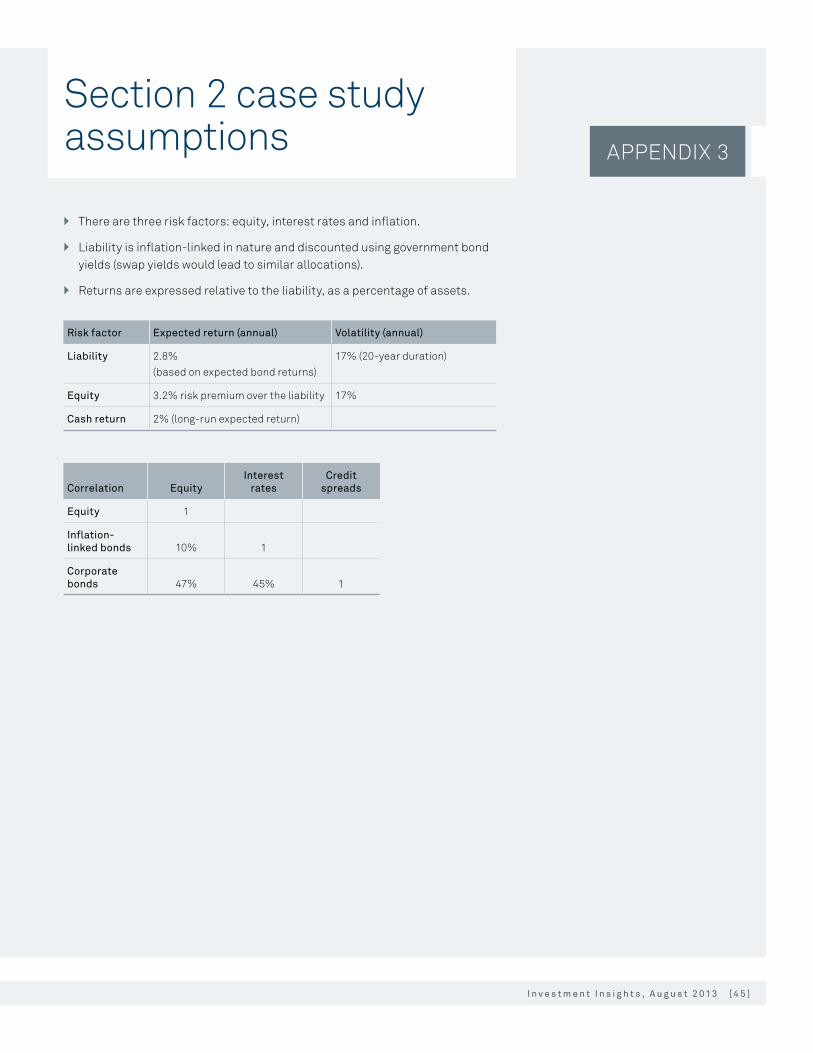
[ 4 4 ] M a p p i n g T h e J o u r n e y : N e w S t a n d a r d s i n P e n s i o n P l a n I n v e s t m e n t P o l i c y a n d I m p l e m e n t a t i o n I n v e s t m e n t I n s i g h t s , A u g u s t 2 0 13 [ 4 5 ]
APPENDIX 3
` There are three risk factors: equity, interest rates and inflation.
` Liability is inflation-linked in nature and discounted using government bond yields (swap yields would lead to similar allocations).
` Returns are expressed relative to the liability, as a percentage of assets.
Risk factor Expected return (annual) Volatility (annual)
Liability 2.8% (based on expected bond returns)
17% (20-year duration)
Equity 3.2% risk premium over the liability 17%
Cash return 2% (long-run expected return)
Correlation
Equity
Interest rates
Credit spreads
Equity 1
Inflation-linked bonds 10% 1
Corporate bonds 47% 45% 1
Section 2 case study assumptions


For more information on liability-driven investing, please contact your BlackRock account manager or email [email protected]
BLACKROCK, INC.400 Howard Street San Francisco, CA 94105
www.blackrock.com
Investment InsightsPublished by BlackRock
Please direct topic ideas, comments, and questions to:
Marcia Roitberg, editor Telephone 415-509-7042 Facsimile 415-618-1455 [email protected]
BlackRock, Inc. and its subsidiaries (together, “BlackRock”) do not provide investment advice regarding any security, manager or market. This information is for illustrative purposes only and is not intended to provide investment advice. BlackRock does not guar-antee the suitability or potential value of any particular investment. Past performance is no guarantee of future results. Index per-formance is shown for illustrative purposes only. You cannot invest directly in an index. Investing involves risk, including possible loss of principal.
The information included in this material has been taken from trade and other sources we consider to be reliable. We do not represent that this information is accurate and com-plete, and it should not be relied upon as such. Any opinions expressed in this material reflect our judgment at this date, are subject to change and should not be relied upon as the basis of your investment decisions. No part of this material may be reproduced in any manner without the prior written permis-sion of BlackRock.
In Canada, this material is intended for accredited investors and permitted clients only. In Latin America, this material has been provided by BlackRock in a private and confi-dential manner to institutional investors upon request. This material is provided for informa-tional purposes only and is not an offer to sell, nor an invitation to apply for any particular product or service in any jurisdiction.
In Latin America, this material is intended for institutional and professional investors only. This material is solely for educational purposes and does not constitute an offer or a solicitation to sell or a solicitation of an offer to buy any shares of any fund (nor shall any such shares be offered or sold to any person) in any jurisdiction within Latin America in which an offer, solicitation, purchase or sale would be unlawful under the securities law of that juris-diction. If any funds are mentioned or inferred to in this material, it is possible that they have not been registered with the securities regu-lator of Brazil, Chile, Colombia, Mexico and Peru or any other securities regulator in any Latin American country, and thus might not be publicly offered within any such country. The securities regulators of such countries have not confirmed the accuracy of any information contained herein. No information discussed herein can be provided to the general public in Latin America.
©2013 BlackRock, Inc. All rights reserved. BLACKROCK is a registered trademark of BlackRock, Inc.
BLK-0797 5589-02-R4_v01HK_08/13
FOR INSTITUTIONAL USE ONLY— NOT FOR PUBLIC DISTRIBUTION


![Cap. 173] Pensions CHAPTER 173. PENSIONS. 173.pdf · Pensions, etc., to cease on bankruptcy. 14. Pensions, etc., may cease on sentence to term of imprisonment. 15. Pensions, etc.,](https://img.pdfslide.net/doc/110x75/5f32c41fe2aa25713c052446/cap-173-pensions-chapter-173-173pdf-pensions-etc-to-cease-on-bankruptcy.jpg)