Embed Size (px)
Citation preview

8/11/2019 MAR2010 - Standard Series Data
http://slidepdf.com/reader/full/mar2010-standard-series-data 1/47
Rod Sampson - School of Marine Science and Technology - 21st February 2008
...Open water propeller tests, Standardseries model propeller tests and Propeller
design diagrams...
Resistance & Propulsion (1)
MAR 2010

8/11/2019 MAR2010 - Standard Series Data
http://slidepdf.com/reader/full/mar2010-standard-series-data 2/47
Rod Sampson - School of Marine Science and Technology - 21st February 2008
Open water propeller test
O/W tests performed with the propeller alone inuniform flow to establish:
Basic thrust, torque and propeller efficiency

8/11/2019 MAR2010 - Standard Series Data
http://slidepdf.com/reader/full/mar2010-standard-series-data 3/47
Rod Sampson - School of Marine Science and Technology - 21st February 2008
Open water propeller test
Two facilities are commonly used to perform openwater tests:
Towing tank
Cavitation tunnel
Each facility has its own limitations

8/11/2019 MAR2010 - Standard Series Data
http://slidepdf.com/reader/full/mar2010-standard-series-data 4/47
Rod Sampson - School of Marine Science and Technology - 21st February 2008
Open water test - propeller boat
Towing carriageshaft bearing
clearancespropeller boat
boss cap

8/11/2019 MAR2010 - Standard Series Data
http://slidepdf.com/reader/full/mar2010-standard-series-data 5/47
Rod Sampson - School of Marine Science and Technology - 21st February 2008
Open water test - cavitation tunnel
Flow direction
shaft bearing
propellerdynamometer
boss cap

8/11/2019 MAR2010 - Standard Series Data
http://slidepdf.com/reader/full/mar2010-standard-series-data 6/47
Rod Sampson - School of Marine Science and Technology - 21st February 2008
Open water test - concept
flow direction
Full scale vessel
boss cap

8/11/2019 MAR2010 - Standard Series Data
http://slidepdf.com/reader/full/mar2010-standard-series-data 7/47
Rod Sampson - School of Marine Science and Technology - 21st February 2008
Open water test - concept
flow direction

8/11/2019 MAR2010 - Standard Series Data
http://slidepdf.com/reader/full/mar2010-standard-series-data 8/47
Undisturbed flow
Rod Sampson - School of Marine Science and Technology - 21st February 2008
Open water test - concept
boss cap
Dflow
not less than 1.5D
towing carriage Velocity
• Lenticular shaped “propeller boat” mounted on the towing carriage
• Boat advances through undisturbed flow
• Velocity and shaft rpm are varied

8/11/2019 MAR2010 - Standard Series Data
http://slidepdf.com/reader/full/mar2010-standard-series-data 9/47
Rod Sampson - School of Marine Science and Technology - 21st February 2008
Open water test - concept
drive motordynamometer
PROFILE
PLAN
not less than 1.5D

8/11/2019 MAR2010 - Standard Series Data
http://slidepdf.com/reader/full/mar2010-standard-series-data 10/47
Rod Sampson - School of Marine Science and Technology - 21st February 2008
Open water test - concept
• measurements taken over a series of runs
• Thrust & Torque are taken at varying J (n usually kept constant)
• Velocity varied from zero speed ( J = 0) to higher values withinthe limitation of the system ( J = 1.0)
note: J = 1.0 is not an upper limit
Tests are performed usually until KT tends to zero

8/11/2019 MAR2010 - Standard Series Data
http://slidepdf.com/reader/full/mar2010-standard-series-data 11/47
Rod Sampson - School of Marine Science and Technology - 21st February 2008
Open water test - results
J =V
nD
C T =
T
ρV 2D2
Test results are presented in the earlier derived coefficients:
C Q =
Q
ρV 2D3

8/11/2019 MAR2010 - Standard Series Data
http://slidepdf.com/reader/full/mar2010-standard-series-data 12/47
Rod Sampson - School of Marine Science and Technology - 21st February 2008
Open water test - results
As CT and CQ 0 as V = 0
CT and CQ are replaced by Aeronautical coefficients
KT and KQ respectively
using:
V = n2D
2

8/11/2019 MAR2010 - Standard Series Data
http://slidepdf.com/reader/full/mar2010-standard-series-data 13/47
Rod Sampson - School of Marine Science and Technology - 21st February 2008
Open water test - results
C T =
T
ρV 2D2 K T =
T
ρn2D4
C Q =
Q
ρV 2D3 K Q =
Q
ρn2D5

8/11/2019 MAR2010 - Standard Series Data
http://slidepdf.com/reader/full/mar2010-standard-series-data 14/47
Rod Sampson - School of Marine Science and Technology - 21st February 2008
Open water test - results
η0 =P T
P D=
TV
Q2πn
η0 =J
2π×
K T
K Q

8/11/2019 MAR2010 - Standard Series Data
http://slidepdf.com/reader/full/mar2010-standard-series-data 15/47
0
0.1
0.2
0.3
0.4
0.5
0.6
0.7
0.8
0.1 0.2 0.3 0.4 0.5 0.6 0.65 0.7 0.8
KT 10 KQ Eta_0
Advance coefficient
Basic Design - open water tests
Rod Sampson - School of Marine Science and Technology - 21st February 2008

8/11/2019 MAR2010 - Standard Series Data
http://slidepdf.com/reader/full/mar2010-standard-series-data 16/47
0
0.1
0.2
0.3
0.4
0.5
0.6
0.7
0.8
0.1 0.2 0.3 0.4 0.5 0.6 0.65 0.7 0.8
KT 10 KQ Eta_0
Advance coefficient
Basic Design - open water tests
φV
2πrn
Thrust
Torque
Vr
φ
V
2πrn
Thrust
Torque
Vr
D
L
D
L
L
Rod Sampson - School of Marine Science and Technology - 21st February 2008
Small V ( J ) = Large T Large V ( J ) = Small T

8/11/2019 MAR2010 - Standard Series Data
http://slidepdf.com/reader/full/mar2010-standard-series-data 17/47
Standard series Propeller model test
Tests form the basis for propeller design
Parameters that influence the performance aresystematically varied in the parent design
Rod Sampson - School of Marine Science and Technology - 21st February 2008

8/11/2019 MAR2010 - Standard Series Data
http://slidepdf.com/reader/full/mar2010-standard-series-data 18/47
Standard series Propeller model test
Diameter (D)Pitch (P)
Blade area ratio (BAR)Number of blades (Z)
Blade shapeBlade thickness
Usually D is fixed, P/D varied
BAR & Z are varied
Kept constant in line with goodmodern design practice
Rod Sampson - School of Marine Science and Technology - 26th February 2008

8/11/2019 MAR2010 - Standard Series Data
http://slidepdf.com/reader/full/mar2010-standard-series-data 19/47
Standard series Propeller model test
Vary P/D
Vary Z
Vary BARParent model P/D
BARZ
3,4,5,6 blades = 4 models
0.4 - 2.0 by 0.2 = 9 models
0.4 - 1.5 by 0.15 = 6 models
216 members
Rod Sampson - School of Marine Science and Technology - 26th February 2008

8/11/2019 MAR2010 - Standard Series Data
http://slidepdf.com/reader/full/mar2010-standard-series-data 20/47
Standard series Propeller model test
Rod Sampson - School of Marine Science and Technology - 26th February 2008

8/11/2019 MAR2010 - Standard Series Data
http://slidepdf.com/reader/full/mar2010-standard-series-data 21/47
Standard series Propeller model test
From the Parent model a series of 216
propeller models would be generated.
Each member requires testing in open waterconditions
The data from each test is combined intodesign diagrams with varying P/D and fixedBAR & Z
Rod Sampson - School of Marine Science and Technology - 26th February 2008

8/11/2019 MAR2010 - Standard Series Data
http://slidepdf.com/reader/full/mar2010-standard-series-data 22/47
Standard series Propeller model test
P/D = 0.4 P/D = 0.8 P/D = 1.0P/D = 0.6
L ine o f m a x imum e f fic ienc y
K T P / D = 1 .0
1 0 K Q P / D = 1 .0
η0
1 0 K Q P / D = 0 .4 K T P / D = 0 .4
Find optimum diameter to absorb:
a delivered power (kW)
a shaft rotation (N)
an advance speed (VA)
Rod Sampson - School of Marine Science and Technology - 26th February 2008
J

8/11/2019 MAR2010 - Standard Series Data
http://slidepdf.com/reader/full/mar2010-standard-series-data 23/47
Standard series Propeller model test
Rod Sampson - School of Marine Science and Technology - 26th February 2008
Using the above diagram design an propeller(optimum diameter)to absorb:
• Delivered Power Pd (kW)
• Rotation N (rpm)• Advance speed J (kn)

8/11/2019 MAR2010 - Standard Series Data
http://slidepdf.com/reader/full/mar2010-standard-series-data 24/47
Standard series Propeller model test
First obtain:
n =N
60
Q = 1000P D
2πn
N.m
Rod Sampson - School of Marine Science and Technology - 26th February 2008
S

8/11/2019 MAR2010 - Standard Series Data
http://slidepdf.com/reader/full/mar2010-standard-series-data 25/47
Standard series Propeller model test
Then:
K Q =
Q
ρn2D5 =
k1
D5
J =V A
nD =
k2
D
Rod Sampson - School of Marine Science and Technology - 26th February 2008
S d d P ll d l

8/11/2019 MAR2010 - Standard Series Data
http://slidepdf.com/reader/full/mar2010-standard-series-data 26/47
Standard series Propeller model test
P/D = 0.4 P/D = 0.8 P/D = 1.0P/D = 0.6
L ine o f m a x imum e f fic ienc y
K T P / D = 1 .0
1 0 K Q P / D = 1 .0
η0
1 0 K Q P / D = 0 .4 K T P / D = 0 .4
Plot 10KQ and J for varying D on the diagram
Intersect with line of maximum efficiency ( )η0
Rod Sampson - School of Marine Science and Technology - 26th February 2008
S d d P ll d l

8/11/2019 MAR2010 - Standard Series Data
http://slidepdf.com/reader/full/mar2010-standard-series-data 27/47
Standard series Propeller model test
P/D = 0.4 P/D = 0.8 P/D = 1.0P/D = 0.6
L ine o f m a x imum e f fic ienc y
K T P / D = 1 .0
1 0 K Q P / D = 1 .0
η0
1 0 K Q P / D = 0 .4 K T P / D = 0 .4
Read off J, hence: Dopt =k2
J
advance coefficient
Interpolate P/D
Rod Sampson - School of Marine Science and Technology - 26th February 2008
P ll D i Di

8/11/2019 MAR2010 - Standard Series Data
http://slidepdf.com/reader/full/mar2010-standard-series-data 28/47
Given data required data
1.2.
3.
4.5.
6.
Propeller Design Diagrams
The representation of systematic open water
diagrams may differ depending upon various designoptions which can be listed as:
P D,N ,V AP D,D,V AP D, V A
T,N,V AT,D,V AT, V A
Dopt
N opt
N opt, Dopt
Dopt
N opt
N opt, Dopt
Rod Sampson - School of Marine Science and Technology - 26th February 2008
P ll D i Di
8/11/2019 MAR2010 - Standard Series Data
http://slidepdf.com/reader/full/mar2010-standard-series-data 29/47
Rod Sampson - School of Marine Science and Technology - 26th February 2008
Propeller Design Diagrams
From the previous options the most widely usedcase is option 1 & 4.
Option 1 requires the delivered power and
rotation rate to be known at a specified advancevelocity
The unknown variable is the optimum propeller
diameter
P ll D i Di
8/11/2019 MAR2010 - Standard Series Data
http://slidepdf.com/reader/full/mar2010-standard-series-data 30/47
Rod Sampson - School of Marine Science and Technology - 26th February 2008
Propeller Design Diagrams
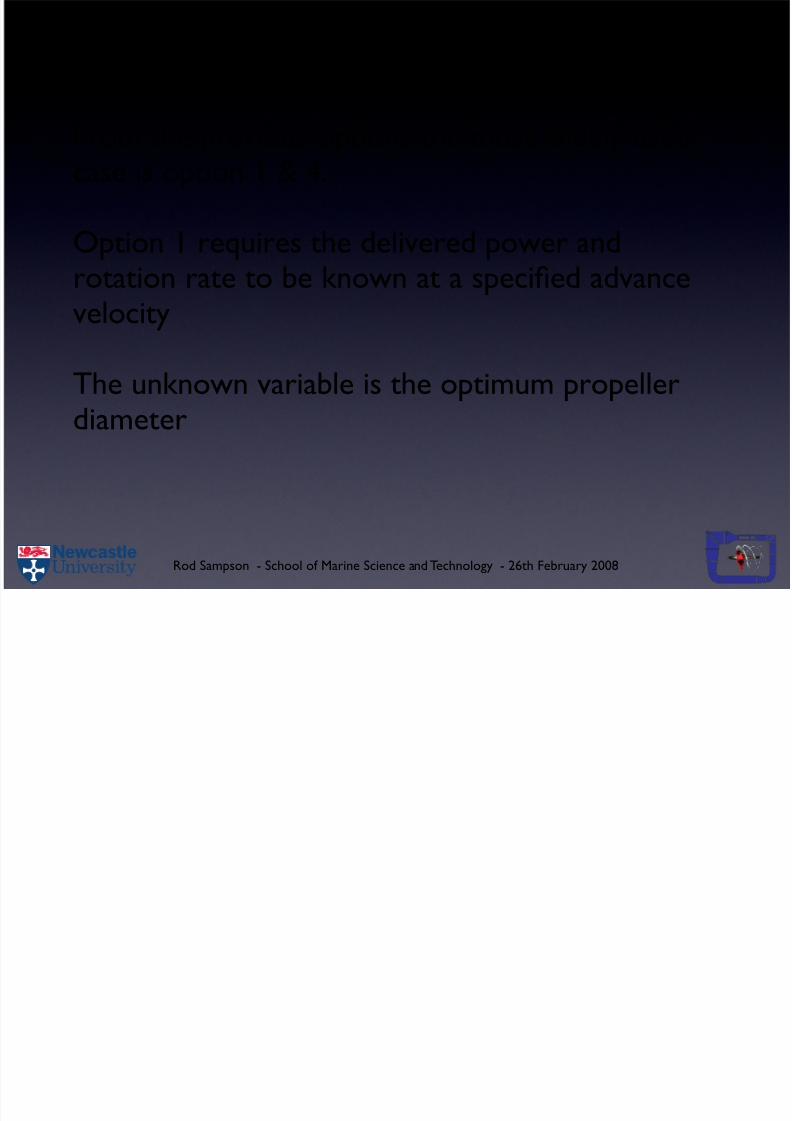
Considering option 1:
The diameter can be eliminated from the systematicopen water diagrams by replacing the and J
terms as follows:
K Q
K Q vs 1
J
P D,N ,V A D
opt
K Q
J 5 =
Q
ρN 2D5 ×
1V anD
5 =
QN 3
ρV 5a
P ll D i Di

8/11/2019 MAR2010 - Standard Series Data
http://slidepdf.com/reader/full/mar2010-standard-series-data 31/47
Rod Sampson - School of Marine Science and Technology - 26th February 2008
Propeller Design Diagrams
Since:
P D = 2π
QN
K Q
J
5 =
N 2P D
2πρV
5 −→
NP 1
2
D
V
2.5
A
K QJ 5
= QN 3
ρV 5a
P ll D i Di

8/11/2019 MAR2010 - Standard Series Data
http://slidepdf.com/reader/full/mar2010-standard-series-data 32/47
Rod Sampson - School of Marine Science and Technology - 26th February 2008
Propeller Design Diagrams
Let:B p =
NP 12
D
V 2.5A
andδ =
1
J =
ND
V A
P ll D i Di

8/11/2019 MAR2010 - Standard Series Data
http://slidepdf.com/reader/full/mar2010-standard-series-data 33/47
Rod Sampson - School of Marine Science and Technology - 26th February 2008
Propeller Design Diagrams
Considering option 4:
A similar analogy can be used by replacing thestandard KT versus J by:
K T
J
4 =
T
ρN
2
D
4 ×
1
V a
nD4
=TN
2
ρV
4
a
P ll D i Di

8/11/2019 MAR2010 - Standard Series Data
http://slidepdf.com/reader/full/mar2010-standard-series-data 34/47
Rod Sampson - School of Marine Science and Technology - 26th February 2008
Propeller Design Diagrams
Since PT = Va T ( PT = thrust power )
K T
J 4 =
P T N 2
ρV 5a
−→
NP 1
2
T
V 5a
= BU
Let
BU =
NU 1
2
V 5a
Where U = PT after useful power
P ll D i Di

8/11/2019 MAR2010 - Standard Series Data
http://slidepdf.com/reader/full/mar2010-standard-series-data 35/47
Rod Sampson - School of Marine Science and Technology - 26th February 2008
Propeller Design Diagrams
(BP , BU & δ )The above coefficients
are known as the D.W. Taylors propeller constants,
most standard series propeller design diagrams aregiven using these constants.
Pr eller Desi n Dia rams

8/11/2019 MAR2010 - Standard Series Data
http://slidepdf.com/reader/full/mar2010-standard-series-data 36/47
Rod Sampson - School of Marine Science and Technology - 26th February 2008
Propeller Design Diagrams
BP =
NP 1
2
DV 2.5A
= 1.158
NP 1
2
DV 2.5A
BU =NU
1
2
V 2.5A
= 1.158NU
1
2
V 2.5A
δ =ND
V A= 3.2808
ND
V A
η0 =P T
P D
Propeller Design Diagrams

8/11/2019 MAR2010 - Standard Series Data
http://slidepdf.com/reader/full/mar2010-standard-series-data 37/47
Rod Sampson - School of Marine Science and Technology - 26th February 2008
Propeller Design Diagrams
Typical diagramBP − δ
Basic Design - BP delta diagrams

8/11/2019 MAR2010 - Standard Series Data
http://slidepdf.com/reader/full/mar2010-standard-series-data 38/47
Basic Design - BP delta diagrams
Rod Sampson - School of Marine Science and Technology - 26th February 2008
η0
δ
η0(max)
Line of max.
efficiency
BP Design
P D
BP
Basic Design - BP delta diagrams

8/11/2019 MAR2010 - Standard Series Data
http://slidepdf.com/reader/full/mar2010-standard-series-data 39/47
Basic Design - BP delta diagrams
Rod Sampson - School of Marine Science and Technology - 26th February 2008
η0
δ
η0(max)
Line of max.
BP Desi
P D
BP
Calculate BPEnter diagramRead off at max efficiency line
BP − δ
δ opt.
Dopt. = V aδ opt
N −→ read P/D
Existing standard propeller series

8/11/2019 MAR2010 - Standard Series Data
http://slidepdf.com/reader/full/mar2010-standard-series-data 40/47
Existing standard propeller series
Rod Sampson - School of Marine Science and Technology - 26th February 2008
Several key systematic series exist, developed forfixed pitch, controllable pitch propellers, ductedpropellers, etc.
FroudeSchaffranTaylorGawn
WageningenGawn-Burrill (KCA Series)KCn Series
Existing standard propeller series

8/11/2019 MAR2010 - Standard Series Data
http://slidepdf.com/reader/full/mar2010-standard-series-data 41/47
Existing standard propeller series
Rod Sampson - School of Marine Science and Technology - 26th February 2008
Existing standard propeller series

8/11/2019 MAR2010 - Standard Series Data
http://slidepdf.com/reader/full/mar2010-standard-series-data 42/47
Existing standard propeller series
Rod Sampson - School of Marine Science and Technology - 26th February 2008
One of the most extensive and widely used seriesis the Wageningen B series.
Fixed pitch propeller
Merchant ship style designSlow to medium speed operation
Wageningen B-Series

8/11/2019 MAR2010 - Standard Series Data
http://slidepdf.com/reader/full/mar2010-standard-series-data 43/47
Wageningen B Series
Rod Sampson - School of Marine Science and Technology - 21st February 2008
Modern sections Good performance 210 members
Wageningen B-Series Characteristics

8/11/2019 MAR2010 - Standard Series Data
http://slidepdf.com/reader/full/mar2010-standard-series-data 44/47
Rod Sampson - School of Marine Science and Technology - 21st February 2008
Wageningen B Series Characteristics
Wageningen B-Series Characteristics

8/11/2019 MAR2010 - Standard Series Data
http://slidepdf.com/reader/full/mar2010-standard-series-data 45/47
Rod Sampson - School of Marine Science and Technology - 21st February 2008
Wageningen B Series Characteristics
• Constant radial pitch distribution
• Small skew
• 15 degrees of backward rake angle
• blade contour with fairly wide tips
• segmental tip blade sections and aerofoil innerradial sections
Wageningen B-Series Characteristics

8/11/2019 MAR2010 - Standard Series Data
http://slidepdf.com/reader/full/mar2010-standard-series-data 46/47
Rod Sampson - School of Marine Science and Technology - 21st February 2008
Wageningen B Series Characteristics
B 4. 85
series type = B
blade number = 4
expanded area ratio = 0.85
Wageningen B-Series Characteristics

8/11/2019 MAR2010 - Standard Series Data
http://slidepdf.com/reader/full/mar2010-standard-series-data 47/47
Wageningen B Series Characteristics
Wageningen B Series analysed and presented as
polynomial equations
Allows computerisation of the design algorithm
K T =47n=1
C n (J )sn
P
D
tnAe
Ao
un
(Z )vn
K Q =47n=1
C n (J )snP
D
tnAe
Ao
un
(Z )vn