Embed Size (px)
Citation preview
Departamento de Ciências Sociais Aplicadas
MARIA CECÍLIA MARTINS FERREIRA DA SILVA
THE NATIONAL PHYSICS AND CHEMISTRY EXAMS
AND THE LEARNING OF SCIENCES
(OS EXAMES NACIONAIS DE FÍSICA E QUÍMICA
E A APRENDIZAGEM NAS CIÊNCIAS)
Dissertação apresentada para
obtenção do Grau de Doutor em
Ciências da Educação, pela
Faculdade de Ciências e Tecnologia
da Universidade Nova de Lisboa.
LISBOA
Fevereiro 2011


THE NATIONAL PHYSICS AND CHEMISTRY EXAMS
AND THE LEARNING OF SCIENCES
(OS EXAMES NACIONAIS DE FÍSICA E QUÍMICA E A
APRENDIZAGEM NAS CIÊNCIAS)
Copyright
Maria Cecília Martins Ferreira da Silva
Aluna nº 22947
"A Faculdade de Ciências e Tecnologia e a Universidade Nova de Lisboa têm o direito, perpétuo e sem limites geográficos, de arquivar e publicar esta dissertação através de exemplares impressos reproduzidos em papel ou de forma digital, ou por qualquer outro meio conhecido ou que venha a ser inventado, e de a divulgar através de repositórios científicos e de admitir a sua cópia e distribuição com objectivos educacionais ou de investigação, não comerciais, desde que seja dado crédito ao autor e editor''.


i
To my parents, Emília and Rui, and to all my family.

ii

iii
Acknowledgements
I must thank, first of all, my mentor, Professor Doctor Vitor D. Teodoro, who with his
guidance, patience, availability and encouragement led me to finish this work.
I would also like to thank all my colleagues and students who contributed to this study as
well as those who have encouraged me to write this work, including the following: Maria
Orlanda Ferrão, Maria Manuela C. Rosa, Carlos Faria – all of them Secondary School teachers.
Also, Professor Doctor J. B. Duarte from ULHT, whose friendship and professional
collaboration meant a great deal to me. I would like to express my thanks to Escola Secundária
Camões, Escola Secundária Sebastião e Silva, Escola Secundária Belém-Algés and other 20
anonymous schools around Lisbon for their help in data collection. I also have to mention the
contributions of my Friends and Colleagues of Escola Secundária de Alvide, Escola Secundária
Luís de Freitas Branco and others schools for their critiques, collaboration in filling out
countless questionnaires, suggestions and encouragement in face of hardship. Last but not least,
I am deeply indebted to Nuno Fernandes and Sónia Teixeira, the English text reviewers that
encouraged me to revise and improve the manuscript.
I hope this document satisfies most of you, family, friends, colleagues, and students who
have supported me all along, as well as you, interested readers, who are willing to read this
work.

iv

v
Abstract
This work has as its starting point the acknowledgement of significant fluctuations in the degree
of difficulty of the Physics-Chemistry national exams. The study of these fluctuations from
1949 to 2005 aims to understand to what extent the differences, which occurred in the content,
the structure of the exams, and the adopted standards, are reflected on the degree of difficulty
they present. It reports and provides comparative standard-setting results of Portuguese exams
of Physics and Chemistry for the nine and the last years of secondary schooling through the use
of different item-grouping approaches. Three standard setting methods, Contrasting Groups,
Beuk and Extended Angoff, were applied in order to study the differences in item, panellist and
item difficulty in final performance.
Initially, my goal in this work was to investigate the existence of possible differences in
exam results in a logical and holistic manner, as to promote improvements in the teaching and
learning process. I found, however, that it was very difficult to establish a single difficulty
variation pattern due to the heterogeneity of the results. Even though the cognitive analysis
allowed for the creation of a group of items, the evolution in the exams analysed, in a 50 year
period, reflects the changes in the educational policies and allow for other considerations to be
pondered based on different political, social and economic contexts.
Key-words: Evaluation Models; Measurement Techniques; Test Building; Data Analysis;
Educational and Evaluation Standards

vi

vii
Table of Contents
ACKNOWLEDGEMENTS .................................................................................................. III
ABSTRACT ........................................................................................................................... V
TABLE OF CONTENTS ................................................................................................... VII
LIST OF FIGURES .............................................................................................................. XI
LIST OF TABLES ............................................................................................................ XVII
ABBREVIATIONS ........................................................................................................ XXIII
1 INTRODUCTION .............................................................................................................. 1
1.1 Motivation .................................................................................................................................. 2
1.2 Exams: a social institution .......................................................................................................... 3
1.3 Goals and structure of the investigation ..................................................................................... 7
2 EXAMS LEGISLATION ................................................................................................. 11
2.1 Exploratory analysis of the legislation before 1947 ................................................................... 12
2.2 An outline of exams legislation from 1947 to 2005 ................................................................... 23
viii
3 LITERATURE REVIEW ................................................................................................ 51
3.1 Exams and curriculum change ................................................................................................... 52
3.2 Estimating item and test difficulty using psychometric tools .................................................... 66
4 METHODOLOGY ........................................................................................................... 81
4.1 Sampling and Data Collection ................................................................................................... 82
4.2 Standard Setting Methods ........................................................................................................ 88
A. Contrasting Groups Method ................................................................................................. 88
B. Beuk Method ........................................................................................................................ 96
C. Extended Angoff Method ..................................................................................................... 99
4.3 Content and cognition level of exams items ........................................................................... 102
5 RESULTS AND DISCUSSION ................................................................................... 113
5.1 Contrasting Groups Method ................................................................................................... 114
5.2 Beuk Method .......................................................................................................................... 143
5.3 Extended Angoff Method........................................................................................................ 154
5.4 Content and cognition level of exams items ........................................................................... 170
Physics: Unit 1 – 2E – Rotational Motion ....................................................................................... 170
Physics: Unit 2 – 1 – Gravitation ..................................................................................................... 172
Chemistry: Unit 2 – Inter-molecular Bonds and Gas Laws ............................................................. 175
Chemistry: Unit 5 – Energy and Entropy in Chemical Reactions .................................................... 177
6 CONCLUSIONS ............................................................................................................ 181
6.1 Major Findings ........................................................................................................................ 182
6.2 Limitation of the Study and Suggestions for Further Research ................................................ 185
BIBLIOGRAPHY ............................................................................................................ 189
ix
INDEX ............................................................................................................................... 201
APPENDIX ....................................................................................................................... 205
Appendix 1 – Digital Exam Archive ............................................................................................... 205
Appendix 2 – Multiple-choice Physics and Chemistry items from 2003 to 2005 ............................ 209
Appendix 3 – Data Tables of Standard Setting Methods ............................................................... 219
A. Contrasting Groups Method ............................................................................................... 219
B. Beuk Method ...................................................................................................................... 231
C. Extended Angoff Method ................................................................................................... 256

x
xi
List of Figures
FIGURE 3.1. CHEMISTRY LABORATORY FROM COLÉGIO MILITAR (ATAÍDE, 1944B, P. 2970) ..................... 55
FIGURE 3.2. SOCIAL CONTEXT AND MAIN EDUCATIONAL POLICIES (ADAPTED FROM 50 YEARS OF
EDUCATIONAL STATISTICS – VOLUME I, 2009, INE & GEPE, LISBON, P. 12) ...................................... 65
FIGURE 3.3. RELATIONSHIP BETWEEN PERFORMANCE STANDARDS AND TEST SCORES [SOURCE: BASED
ON (CIZEK & BUNCH, 2007, P. 16) ] ................................................................................................... 70
FIGURE 4.1.DISTRIBUITION OF EXAMINEES FROM GROUP I ...................................................................... 97
FIGURE 4.2.DISTRIBUITION OF EXAMINEES FROM GROUP II. .................................................................... 97
FIGURE 4.3.DISTRIBUITION OF EXAMINEES FROM GROUP III. ................................................................... 98
FIGURE 4.4.DISTRIBUTION OF PHYSICS AND CHEMISTRY EXAMINEES FROM 2003 TO 2005. ................. 100
FIGURE 4.5. DISTRIBUTION OF PHYSICS AND CHEMISTRY EXAMINEES FROM 2003 TO 2005. ................ 102
FIGURE 4.6. BLOOM’S TAXONOMY – ADAPTED FROM DING (2007, P. 104) ............................................ 106
FIGURE 5.1. SCHOOL 1 - 1950 2ND CYCLE ................................................................................................ 115
FIGURE 5.2. SCHOOL 1 - 1951 2ND CYCLE ................................................................................................ 115
FIGURE 5.3. SCHOOL 1 - 1953 2ND CYCLE ................................................................................................ 115
FIGURE 5.4. SCHOOL 1 - 1954 2ND CYCLE ................................................................................................ 115
FIGURE 5.5. SCHOOL 1 - 1956 2ND CYCLE ................................................................................................ 115
FIGURE 5.6. SCHOOL 1 - 1960 2ND CYCLE ................................................................................................ 116
FIGURE 5.7. SCHOOL 1+ 2 - 1965 2ND CYCLE ........................................................................................... 116
FIGURE 5.8. SCHOOL 1+ 2 - 1967 2ND CYCLE ........................................................................................... 116
FIGURE 5.9. SCHOOL 1 - 1970 2ND CYCLE ................................................................................................ 117
FIGURE 5.10. SCHOOL 1 - 1972 2ND CYCLE .............................................................................................. 117
FIGURE 5.11. SCHOOL 1 - 1973 2ND CYCLE .............................................................................................. 117
FIGURE 5.12. CUT SCORES OBTAINED BY MCGM1 AND MCGM2, FOR THE 2ND
CYCLE, BETWEEN 1950
AND 1973. ........................................................................................................................................ 118
FIGURE 5.13. SCHOOL 1 - 1949 3RD CYCLE .............................................................................................. 119
FIGURE 5.14. SCHOOL 1 - 1954 3RD CYCLE .............................................................................................. 119
FIGURE 5.15. SCHOOL 1 - 1955 3RD CYCLE .............................................................................................. 119
xii
FIGURE 5.16. SCHOOL 1 - 1956 3RD CYCLE .............................................................................................. 120
FIGURE 5.17. SCHOOL 1 - 1956 3RD CYCLE .............................................................................................. 120
FIGURE 5.18. SCHOOL 1 - 1959 3RD CYCLE .............................................................................................. 120
FIGURE 5.19. SCHOOL 2 - 1960 3RD CYCLE .............................................................................................. 121
FIGURE 5.20. SCHOOL 2 - 1960 3RD CYCLE .............................................................................................. 121
FIGURE 5.21. SCHOOL 2 -1961 3RD CYCLE ............................................................................................... 121
FIGURE 5.22. SCHOOL 2 - 1964 3RD CYCLE .............................................................................................. 121
FIGURE 5.23. SCHOOL 1+ 2 - 1965 3RD CYCLE .......................................................................................... 122
FIGURE 5.24. SCHOOL 1+ 2 - 1965 3RD CYCLE .......................................................................................... 122
FIGURE 5.25. SCHOOL 2 - 1966 3RD CYCLE .............................................................................................. 122
FIGURE 5.26. SCHOOL 2 - 1969 3RD CYCLE .............................................................................................. 123
FIGURE 5.27. SCHOOL 2 - 1969 3RD CYCLE .............................................................................................. 123
FIGURE 5.28. SCHOOL 1+ 2 - 1970 3RD CYCLE .......................................................................................... 123
FIGURE 5.29. SCHOOL 2 - 1971 3RD CYCLE .............................................................................................. 123
FIGURE 5.30. SCHOOL 1+ 2 - 1972 3RD CYCLE .......................................................................................... 124
FIGURE 5.31. SCHOOL 1+ 2 - 1972 3RD CYCLE .......................................................................................... 124
FIGURE 5.32. SCHOOL 2 - 1973 3RD CYCLE .............................................................................................. 124
FIGURE 5.33. CUT SCORES OBTAINED THROUGH MCGM1 AND MCGM2, IN THE 3RD
CYCLE, BETWEEN
1949 AND 1973. ............................................................................................................................... 125
FIGURE 5.34. SCHOOL 3 - PHYSICS 1982 12TH GRADE ............................................................................. 126
FIGURE 5.35. SCHOOL 3 - PHYSICS 1982 12TH GRADE ............................................................................. 126
FIGURE 5.36. SCHOOL 3 - PHYSICS 1983 12TH GRADE ............................................................................. 126
FIGURE 5.37. SCHOOL 3 - PHYSICS 1983 12TH GRADE ............................................................................. 126
FIGURE 5.38. SCHOOL 3 - PHYSICS 1984 12TH GRADE ............................................................................. 127
FIGURE 5.39. SCHOOL 3 - PHYSICS 1984 12TH GRADE ............................................................................. 127
FIGURE 5.40. SCHOOL 3 - PHYSICS 1985 12TH GRADE ............................................................................. 127
FIGURE 5.41. SCHOOL 3 - PHYSICS 1986 12TH GRADE ............................................................................. 127
FIGURE 5.42. SCHOOL 3 - PHYSICS 1987 12TH GRADE ............................................................................. 128
FIGURE 5.43. SCHOOL 3 - PHYSICS 1988 12TH GRADE ............................................................................. 128
FIGURE 5.44. SCHOOL 3 - PHYSICS 1989 12TH GRADE ............................................................................. 128
FIGURE 5.45. SCHOOL 3 - PHYSICS 1990 12TH GRADE ............................................................................. 129
FIGURE 5.46. SCHOOL 3 - PHYSICS 1991 12TH GRADE ............................................................................. 129
FIGURE 5.47. SCHOOL 3 - PHYSICS 1992 12TH GRADE ............................................................................. 129
FIGURE 5.48. SCHOOL 3 - PHYSICS 1993 12TH GRADE ............................................................................. 129
FIGURE 5.49. SCHOOL 3 - PHYSICS 1994 12TH GRADE ............................................................................. 130
xiii
FIGURE 5.50. SCHOOL 3 - PHYSICS 1995 12TH GRADE ............................................................................. 130
FIGURE 5.51. SCHOOL 3 - PHYSICS 1996 12TH GRADE ............................................................................. 130
FIGURE 5.52. SCHOOL 1+ 4 - PHYSICS 1997 12TH GRADE ........................................................................ 130
FIGURE 5.53. SCHOOL 1+ 4 - PHYSICS 1998 12TH GRADE ........................................................................ 131
FIGURE 5.54. SCHOOL 1+ 4 - PHYSICS 1999 12TH GRADE ........................................................................ 131
FIGURE 5.55. SCHOOL 1+ 4 - PHYSICS 2000 12TH GRADE ........................................................................ 131
FIGURE 5.56. SCHOOL 1+ 4 - PHYSICS 2001 12TH GRADE ........................................................................ 131
FIGURE 5.57. 6 SCHOOLS - PHYSICS 2002 12TH GRADE ........................................................................... 132
FIGURE 5.58. 9 SCHOOLS - PHYSICS 2003 12TH GRADE ........................................................................... 132
FIGURE 5.59. ENES PHYSICS 2004 12TH GRADE ....................................................................................... 132
FIGURE 5.60. ENES PHYSICS 2004 12TH GRADE ....................................................................................... 132
FIGURE 5.61. ENES PHYSICS 2005 12TH GRADE ....................................................................................... 133
FIGURE 5.62. ENES PHYSICS 2005 12TH GRADE ....................................................................................... 133
FIGURE 5.63. CUT SCORES OBTAINED THROUGH MCGM1 AND MCGM2 IN THE PHYSICS EXAM, BETWEEN
1982 AND 2005. ............................................................................................................................... 133
FIGURE 5.64. SCHOOL 3 - CHEMISTRY 1982 12TH GRADE ....................................................................... 135
FIGURE 5.65. SCHOOL 3 - CHEMISTRY 1982 12TH GRADE ....................................................................... 135
FIGURE 5.66. SCHOOL 3 - CHEMISTRY 1983 12TH GRADE ....................................................................... 135
FIGURE 5.67. SCHOOL 3 - CHEMISTRY 1983 12TH GRADE ....................................................................... 135
FIGURE 5.68. SCHOOL 3 - CHEMISTRY 1984 12TH GRADE ....................................................................... 136
FIGURE 5.69. SCHOOL 3 - CHEMISTRY 1984 12TH GRADE ....................................................................... 136
FIGURE 5.70. SCHOOL 3 - CHEMISTRY 1985 12TH GRADE ....................................................................... 136
FIGURE 5.71. SCHOOL 3 - CHEMISTRY 1986 12TH GRADE ....................................................................... 136
FIGURE 5.72. SCHOOL 3 - CHEMISTRY 1987 12TH GRADE....................................................................... 137
FIGURE 5.73. SCHOOL 3 - CHEMISTRY 1988 12TH GRADE ....................................................................... 137
FIGURE 5.74. SCHOOL 3 - CHEMISTRY 1989 12TH GRADE ....................................................................... 137
FIGURE 5.75. SCHOOL 3 - CHEMISTRY 1990 12TH GRADE ....................................................................... 138
FIGURE 5.76. SCHOOL 3 - CHEMISTRY 1991 12TH GRADE ....................................................................... 138
FIGURE 5.77. SCHOOL 3 - CHEMISTRY 1992 12TH GRADE ....................................................................... 138
FIGURE 5.78. SCHOOL 3 - CHEMISTRY 1993 12TH GRADE ....................................................................... 138
FIGURE 5.79. SCHOOL 3 - CHEMISTRY 1994 12TH GRADE ....................................................................... 139
FIGURE 5.80. SCHOOL 3 - CHEMISTRY 1995 12TH GRADE ....................................................................... 139
FIGURE 5.81. SCHOOL 3 - CHEMISTRY 1996 12TH GRADE ....................................................................... 139
FIGURE 5.82. SCHOOL 3 - CHEMISTRY 1997 12TH GRADE ....................................................................... 139
FIGURE 5.83. SCHOOL 3 - CHEMISTRY 1998 12TH GRADE ....................................................................... 140
xiv
FIGURE 5.84. SCHOOL 3 - CHEMISTRY 1999 12TH GRADE ....................................................................... 140
FIGURE 5.85. SCHOOL 3 - CHEMISTRY 2000 12TH GRADE ....................................................................... 140
FIGURE 5.86. SCHOOL 3 - CHEMISTRY 2001 12TH GRADE ....................................................................... 140
FIGURE 5.87. 6 SCHOOLS -- CHEMISTRY 2002 12TH GRADE .................................................................... 141
FIGURE 5.88. 9 SCHOOLS -- CHEMISTRY 2003 12TH GRADE .................................................................... 141
FIGURE 5.89. ENES CHEMISTRY 2004 12TH GRADE.................................................................................. 141
FIGURE 5.90. ENES CHEMISTRY 2004 12TH GRADE.................................................................................. 141
FIGURE 5.91. ENES CHEMISTRY 2005 12TH GRADE.................................................................................. 142
FIGURE 5.92. ENES CHEMISTRY 2005 12TH GRADE.................................................................................. 142
FIGURE 5.93. CUT SCORES OBTAINED THROUGH MCGM1 AND MCGM2, IN THE CHEMISTRY EXAM,
BETWEEN 1982 AND 2005. .............................................................................................................. 142
FIGURE 5.94. BEUK CUT SCORE FOR THE1956 PHYSICS-CHEMISTRY EXAM. ............................................ 144
FIGURE 5.95. BEUK CUT SCORE FOR THE 1960 PHYSICS-CHEMISTRY EXAM. ........................................... 145
FIGURE 5.96. BEUK CUT SCORE OF THE 1965 PHYSICS-CHEMISTRY EXAM. ............................................. 145
FIGURE 5.97. BEUK CUT SCORE FOR THE 1969 PHYSICS-CHEMISTRY EXAM. ........................................... 146
FIGURE 5.98. BEUK CUT SCORE FOR THE 1972 PHYSICS-CHEMISTRY EXAM ............................................ 146
FIGURE 5.99. BEUK CUT SCORE FOR THE 1982 PHYSICS EXAM. ............................................................... 147
FIGURE 5.100. BEUK CUT SCORE FOR THE 1983 PHYSICS EXAM. ............................................................. 147
FIGURE 5.101. BEUK CUT SCORE FOR THE 1984 PHYSICS EXAM. ............................................................. 148
FIGURE 5.102. BEUK CUT SCORE FOR THE 1982 CHEMISTRY EXAM. ....................................................... 148
FIGURE 5.103. BEUK CUT SCORE FOR THE 1983 CHEMISTRY EXAM. ....................................................... 149
FIGURE 5.104. BEUK CUT SCORE OF 1984 CHEMISTRY EXAM. ................................................................. 149
FIGURE 5.105. BEUK CUT SCORE FOR THE 2004 PHYSICS EXAM. ............................................................. 150
FIGURE 5.106. BEUK CUT SCORE FOR THE 2005 PHYSICS EXAM. ............................................................. 150
FIGURE 5.107. BEUK CUT SCORE FOR THE 2004 CHEMISTRY EXAM ........................................................ 151
FIGURE 5.108. BEUK CUT SCORE FOR THE 2005 CHEMISTRY EXAM. ....................................................... 151
FIGURE 5.109. CUT SCORE RESULTS OF THE CONTRASTING METHOD (MCGM1 E MCGM2) AND BEUK
METHOD OF PHYSICS-CHEMISTRY EXAMS, FOR GROUP I. .............................................................. 152
FIGURE 5.110. CUT SCORE RESULTS OF THE CONTRASTING METHOD (MCGM1 E MCGM2) AND BEUK
METHOD OF PHYSICS EXAMS, FOR GROUP II AND GROUP III. ........................................................ 153
FIGURE 5.111. CUT SCORE RESULTS OF THE CONTRASTING METHOD (MCGM1 E MCGM2) AND BEUK
METHOD OF CHEMISTRY EXAMS, FOR GROUP II AND GROUP III. ................................................... 153
FIGURE 5.112 A BAR CHART OF THE PERCENTAGE OF CORRECT ITEM ANSWERS FOR GROUPS B1 AND
GROUP B2. ....................................................................................................................................... 154
xv
FIGURE 5.113. A BAR CHART OF THE PERCENTAGE OF CORRECT ITEM ANSWERS FOR GROUP B1 AND
GROUP B2. ....................................................................................................................................... 157
FIGURE 5.114. DESCRIPTIVE ANALYSIS OF GROUP B1 AND GROUP B2 (SAMPLE AND ENES), IN 2004
PHYSICS EXAM. ................................................................................................................................ 159
FIGURE 5.115. A BAR CHART OF THE PERCENTAGE OF CORRECT ITEM ANSWERS FOR GROUP B1 AND
GROUP B2. ....................................................................................................................................... 159
FIGURE 5.116. DESCRIPTIVE ANALYSIS OF GROUP B1 AND GROUP B2 (SAMPLE AND ENES), IN 2005
PHYSICS EXAM. ................................................................................................................................ 161
FIGURE 5.117. A BAR CHART OF THE PERCENTAGE OF CORRECT ITEM ANSWERS FOR GROUP B1 AND
GROUP B2. ....................................................................................................................................... 162
FIGURE 5.118 A BAR CHART OF THE PERCENTAGE OF CORRECT ITEM ANSWERS FOR GROUP B1 AND
GROUP B2. ....................................................................................................................................... 164
FIGURE 5.119. DESCRIPTIVE ANALYSIS OF GROUP B1 AND GROUP B2 (SAMPLE AND ENES), IN 2004
CHEMISTRY EXAM. ........................................................................................................................... 166
FIGURE 5.120. A BAR CHART OF THE PERCENTAGE OF CORRECT ITEM ANSWERS FOR GROUP B1 AND
GROUP B2. ....................................................................................................................................... 166
FIGURE 5.121. DESCRIPTIVE ANALYSIS OF GROUP B1 AND GROUP B2 (SAMPLE AND ENES), FOR THE 2005
CHEMISTRY EXAM. ........................................................................................................................... 168
FIGURE 5.122. CUT SCORES FOR GROUPS B1+B2 OBTAINED THROUGH THE APPLICATION OF THE
CONTRASTING GROUPS METHOD, EXTENDED ANGOFF METHOD AND BEUK METHOD. ............... 169
FIGURE 5.123. A BAR CHART OF THE PERCENTAGE OF CORRECT ITEM ANSWERS FOR P1, P3 AND P5
ITEMS. .............................................................................................................................................. 170
FIGURE 5.124. A BAR CHART OF THE DIFFICULTY INDEX AND DISCRIMINATION INDEX FOR ITEMS P1, P3
AND P5. ............................................................................................................................................ 171
FIGURE 5.125. A BAR CHART OF THE PERCENTAGE OF CORRECT ITEM ANSWERS FOR ITEMS P2, P4, AND
P6. .................................................................................................................................................... 172
FIGURE 5.126. A BAR CHART OF THE DIFFICULTY INDEX AND DISCRIMINATION INDEX FOR ITEMS P2, P4
AND P6. ............................................................................................................................................ 173
FIGURE 5.127. A BAR CHART OF THE PERCENTAGE OF CORRECTE ITEM ANSWERS FOR ITEMS C1, C3, AND
C5. .................................................................................................................................................... 175
FIGURE 5.128. A BAR CHART OF THE DIFFICULTY INDEX AND DISCRIMINATION INDEX FOR ITEMS C1, C3,
AND C5. ............................................................................................................................................ 176
FIGURE 5.129. A BAR CHART OF THE PERCENTAGE OF CORRECTE ITEM ANSWERS FOR ITEMS C2, C4, AND
C6. .................................................................................................................................................... 177
xvi
FIGURE 5.130. A BAR CHART OF THE DIFFICULTY AND DISCRIMINATION INDEXES FOR ITEMS C2, C4, AND
C6. .................................................................................................................................................... 178
FIGURE 6.1. WEBSITE STRUCTURE ............................................................................................................ 206
xvii
List of Tables
TABLE 2.1. TYPES OF TEACHING/TRAINING (CONTINUING EDUCATION COURSE AND TECHNOLOGICAL
COURSES)/CALCULATION OF THE FINAL GRADE OF BASIC AND SECONDARY HIGH SCHOOL.
ADAPTED FROM 50 YEARS OF EDUCATIONAL STATISTICS – VOLUME I, 2009, INE E GEPE, LISBON, P.
10] ...................................................................................................................................................... 44
TABLE 4.1. SIZE OF A RANDOM SAMPLE WITH THE POPULATION SIZE(N) AND THE SAMPLE SIZE(S)
[SOURCE: KREJCIE AND MORGAN (1970)] ......................................................................................... 85
TABLE 4.2. DISTRIBUTION OF EXAMINEES FROM 1949 TO 1959. .............................................................. 90
TABLE 4.3. DISTRIBUTION OF EXAMINEES FROM 1960 TO 1969. .............................................................. 90
TABLE 4.4. DISTRIBUTION OF EXAMINEES FROM 1970 TO 1973. .............................................................. 90
TABLE 4.5. DISTRIBUTION OF EXAMINEES FROM 1982 TO 1989. .............................................................. 91
TABLE 4.6. DISTRIBUTION OF EXAMINEES FROM 1990 TO 1999. .............................................................. 91
TABLE 4.7. DISTRIBUTION OF EXAMINEES FROM 2000 TO 2005. .............................................................. 92
TABLE 4.8. DISTRIBUTION TABLE OF THE EXAM GRADES (EG) IN 20 REFERENCE GRADES. ....................... 93
TABLE 4.9. DISTRIBUTION TABLE OF THE EXAM GRADES (EG) IN 10 REFERENCE GRADES. ....................... 93
TABLE 4.10. SUMMARY OF THE CONTENTS OF THE 12TH
GRADE PHYSICS CURRICULUM. ....................... 104
TABLE 4.11. SUMMARY OF THE CONTENTS OF THE 12TH
GRADE CHEMISTRY CURRICULUM. ................. 105
TABLE 4.12. CLASSIFICATION RESULTS FOR THE PHYSICS (P) ITEMS. ....................................................... 107
TABLE 4.13. CLASSIFICATION RESULTS FOR THE CHEMISTRY (C) ITEMS. ................................................. 107
TABLE 4.14. PHYSICS ITEMS RESOLUTION AND DESCRIPTION OF THE CONTENT LEVELS AND COGNITION
DIMENSIONS. ................................................................................................................................... 108
TABLE 4.15. CHEMISTRY ITEMS RESOLUTION AND A DESCRIPTION OF THE CONTENT LEVELS AND
COGNITION DIMENSIONS. ............................................................................................................... 110
TABLE 5.1. TABLE OF THE AVERAGE GRADES PER ITEM (GROUP B1 AND GRADING TEACHERS GROUP) IN
THE 18 TO 78 POINTS SCALE. ........................................................................................................... 155
TABLE 5.2. RESULTS OF THE BINOMIAL LOGISTIC REGRESSION. .............................................................. 156
TABLE 5.3. ITEM ANSWER ANALYSIS RESULTS. ........................................................................................ 156
TABLE 5.4. TABLE OF THE AVERAGE GRADES PER ITEM IN THE 17 TO 74 POINTS SCALE. ....................... 157

xviii
TABLE 5.5. RESULTS OF THE BINOMIAL LOGISTIC REGRESSION. .............................................................. 158
TABLE 5.6. ITEM ANSWER ANALYSIS RESULTS FOR INTERNAL EXAMINEES AND FOR THE ENSEMBLE
GROUP B1 + GRADING TEACHERS. .................................................................................................. 158
TABLE 5.7. TABLE OF THE AVERAGE GRADES PER ITEM IN THE 17 TO 74 POINTS SCALE. ....................... 160
TABLE 5.8. RESULTS OF THE BINOMIAL LOGISTIC REGRESSION. .............................................................. 160
TABLE 5.9. ITEM ANSWER ANALYSIS. ....................................................................................................... 161
TABLE 5.10. TABLE OF THE AVERAGE ITEM GRADES (GROUP B1 AND GROUP OF GRADING TEACHERS) ON
THE 18 TO 82 POINTS SCALE. ........................................................................................................... 162
TABLE 5.11. RESULTS OF THE BINOMIAL LOGISTIC REGRESSION. ............................................................ 163
TABLE 5.12. ITEM ANSWER ANALYSIS RESULTS. ...................................................................................... 163
TABLE 5.13. TABLE OF THE AVERAGE ITEM GRADES (GROUP B1 AND GROUP OF GRADING TEACHERS) ON
THE 18 TO 76 POINTS SCALE. ........................................................................................................... 164
TABLE 5.14. RESULTS OF THE BINOMIAL LOGISTIC REGRESSION. ............................................................ 165
TABLE 5.15. ITEM ANSWER ANALYSIS RESULTS. ...................................................................................... 165
TABLE 5.16. TABLE OF THE AVERAGE ITEM GRADES (GROUP B1 AND GROUP OF GRADING TEACHERS).
......................................................................................................................................................... 167
TABLE 5.17. RESULTS OF THE BINOMIAL LOGISTIC REGRESSION. ............................................................ 167
TABLE 5.18. ITEM ANSWER ANALYSIS RESULTS. ...................................................................................... 168
TABLE 5.19. CUT SCORES OBTAINED FOR GROUPS B1+B2 BY APPLYING THE CONTRASTING GROUPS
METHOD, MODIFIED ANGOFF METHOD, AND BEUK METHOD. ...................................................... 169
TABLE 5.20. STATISTICAL PARAMETRES FOR ITEMS P1, P3, AND P5. ....................................................... 171
TABLE 5.21. STATISTICAL PARAMETRES FOR ITEMS P2, P4, AND P6. ....................................................... 173
TABLE 5.22. STATISTICAL PARAMETRES FOR ITEMS C1, C3, AND C5. ...................................................... 176
TABLE 5.23. STATISTICAL PARAMETRES FOR ITEMS C2, C4, AND C6. ...................................................... 178
TABLE 5.24. AVERAGE VALUES OF THE DIFFERENCE BETWEEN IFG AND EG ON THE 200 POINTS SCALE.
......................................................................................................................................................... 179
TABLE 5.25. AVERAGE VALUES OF THE DIFFERENCE BETWEEN IFG (130 POINTS) AND THE CUT SCORES
FOR GROUPS B1+B2, IN THE 200 POINTS SCALE. ............................................................................ 180
THE APPLICATION OF THE CONTRASTING GROUPS METHOD ALLOWED SEEING TWO DISTINCT GROUPS
OF INTERNAL STUDENTS WITH INTERNAL FINAL GRADES GENERALLY HIGHER THAN THE EXAM
GRADES. THE CUT SCORES FOR INTERNAL STUDENTS OBTAINED FROM MCGM1 AND MCGM2
HAVE A MAXIMUM DIFFERENCE OF 2%, WHILE THE MAXIMUM VARIATION FOR THE MODIFIED
ANGOFF METHOD IS 3.5% FOR THE SAME SAMPLES. (TABLE 6.1) THE CUT SCORES OBTAINED FROM
THE MODIFIED ANGOFF METHOD WERE HIGHER THAN THE CUT SCORES OBTAINED FROM THE
APPLICATION OF THE CONTRASTING GROUPS METHOD. ............................................................... 184
xix
TABLE 6.2. FREQUENCY TABLE OF EXAMS GRADES OF PHYSICS-CHEMISTRY – 2ND
CYCLE FROM 1950 TO
1956. ................................................................................................................................................ 219
TABLE 6.3. FREQUENCY TABLE OF EXAMS GRADES OF PHYSICS-CHEMISTRY – 2ND
CYCLE FROM 1960 TO
1967. ................................................................................................................................................ 220
TABLE 6.4. FREQUENCY TABLE OF EXAMS GRADES OF PHYSICS-CHEMISTRY – 2ND
CYCLE FROM 1970 TO
1973 ................................................................................................................................................. 220
TABLE 6.5. FREQUENCY TABLE OF EXAMS GRADES OF PHYSICS-CHEMISTRY – 3RD
CYCLE FROM 1949 TO
1956. ................................................................................................................................................ 221
TABLE 6.6. FREQUENCY TABLE OF EXAMS GRADES OF PHYSICS-CHEMISTRY – 3RD
CYCLE FROM 1959 TO
1964. ................................................................................................................................................ 221
TABLE 6.7. FREQUENCY TABLE OF EXAMS GRADES OF PHYSICS-CHEMISTRY – 3RD
CYCLE FROM 1965 TO
1969. ................................................................................................................................................ 222
TABLE 6.8. FREQUENCY TABLE OF EXAMS GRADES OF PHYSICS-CHEMISTRY – 3RD
CYCLE FROM 1969 TO
1973. ................................................................................................................................................ 222
TABLE 6.9. FREQUENCY TABLE OF EXAMS GRADES OF PHYSICS 12TH
GRADE FROM 1982 TO 1984. ...... 223
TABLE 6.10. FREQUENCY TABLE OF EXAMS GRADES OF PHYSICS 12TH
GRADE FROM 1984 TO 1989. ..... 223
TABLE 6.11. FREQUENCY TABLE OF EXAMS GRADES OF PHYSICS 12TH
GRADE FROM 1990 TO 1994. ..... 224
TABLE 6.12. FREQUENCY TABLE OF EXAMS GRADES OF PHYSICS 12TH
GRADE FROM 1995 TO 1999. ..... 224
TABLE 6.13. FREQUENCY TABLE OF EXAMS GRADES OF PHYSICS 12TH
GRADE FROM 2000 TO 2002. ..... 225
TABLE 6.14. FREQUENCY TABLE OF EXAMS GRADES OF PHYSICS 12TH
GRADE FROM 2002/2003. .......... 225
TABLE 6.15. FREQUENCY TABLE OF EXAMS GRADES OF PHYSICS 12TH
GRADE FROM 2004 TO 2005. ..... 226
TABLE 6.16. FREQUENCY TABLE OF EXAMS GRADES OF CHEMISTRY12TH
GRADE FROM 1982 TO 1984. 227
TABLE 6.17. FREQUENCY TABLE OF EXAMS GRADES OF CHEMISTRY12TH
GRADE FROM 1985 TO 1989. 227
TABLE 6.18. FREQUENCY TABLE OF EXAMS GRADES OF CHEMISTRY12TH
GRADE FROM 1990 TO 1994. 228
TABLE 6.19. FREQUENCY TABLE OF EXAMS GRADES OF CHEMISTRY12TH
GRADE FROM 1995 TO 1999. 228
TABLE 6.20. FREQUENCY TABLE OF EXAMS GRADES OF CHEMISTRY12TH
GRADE FROM 2000 TO 2002. 229
TABLE 6.21. FREQUENCY TABLE OF EXAMS GRADES OF CHEMISTRY12TH
GRADE 2002/2003. ................ 229
TABLE 6.22. FREQUENCY TABLE OF EXAMS GRADES OF CHEMISTRY12TH
GRADE FROM 2004 TO 2005. 230
TABLE 6.23. RESULTS FROM TEACHER’S ANSWERS FOR EACH QUESTION (QA AND QB), TOTAL AVERAGE,
STANDARD DEVIATION, RATIO OF THESE STANDARD DEVIATIONS (STDQA/STDQB) AND SLOPE OF A
LINE EQUAL TO THIS RATIO ARE PRESENTED FOR THE GROUP I ..................................................... 231
TABLE 6.24. RESULTS FROM TEACHER’S ANSWERS FOR EACH QUESTION (QA AND QB), TOTAL AVERAGE,
STANDARD DEVIATION, RATIO OF THESE STANDARD DEVIATIONS (STDQA/STDQB) AND SLOPE OF A
LINE EQUAL TO THIS RATIO ARE PRESENTED FOR GROUP II – PHYSICS. ......................................... 232

xx
TABLE 6.25. RESULTS FROM TEACHER’S ANSWERS FOR EACH QUESTION (QA AND QB), TOTAL AVERAGE,
STANDARD DEVIATION, RATIO OF THESE STANDARD DEVIATIONS (STDQA/STDQB) AND SLOPE OF A
LINE EQUAL TO THIS RATIO ARE PRESENTED FOR GROUP II – CHEMISTRY. .................................... 233
TABLE 6.26. RESULTS FROM TEACHER’S ANSWERS FOR EACH QUESTION (QA AND QB), TOTAL AVERAGE,
STANDARD DEVIATION, RATIO OF THESE STANDARD DEVIATIONS (STDQA/STDQB) AND SLOPE OF A
LINE EQUAL TO THIS RATIO ARE PRESENTED FOR GROUP III - PHYSICS. ......................................... 234
TABLE 6.27. RESULTS FROM TEACHER’S ANSWERS FOR EACH QUESTION (QA AND QB), TOTAL AVERAGE,
STANDARD DEVIATION, RATIO OF THESE STANDARD DEVIATIONS (STDQA/STDQB) AND SLOPE OF A
LINE EQUAL TO THIS RATIO ARE PRESENTED FOR GROUP III - CHEMISTRY. ................................... 235
TABLE 6.28. FREQUENCY TABLE OF EG AND PR OF PHYSICS-CHEMISTRY – 3RD
CYCLE FROM 1956. ........ 236
TABLE 6.29. FREQUENCY TABLE OF EG AND PR OF PHYSICS-CHEMISTRY – 3RD
CYCLE FROM 1960. ........ 237
TABLE 6.30. FREQUENCY TABLE OF EG AND PR OF PHYSICS-CHEMISTRY – 3RD
CYCLE FROM 1965. ........ 238
TABLE 6.31. FREQUENCY TABLE OF EG AND PR OF PHYSICS-CHEMISTRY – 3RD
CYCLE FROM 1969. ........ 239
TABLE 6.32. FREQUENCY TABLE OF EG AND PR OF PHYSICS-CHEMISTRY – 3RD
CYCLE FROM 1972. ........ 240
TABLE 6.33. FREQUENCY TABLE OF EG AND PR OF PHYSICS 12TH
GRADE FROM 1982. ........................... 241
TABLE 6.34. FREQUENCY TABLE OF EG AND PR OF PHYSICS 12TH
GRADE FROM 1983. ........................... 243
TABLE 6.35. FREQUENCY TABLE OF EG AND PR OF PHYSICS 12TH
GRADE FROM 1984. ........................... 244
TABLE 6.36. FREQUENCY TABLE OF EG AND PR OF PHYSICS 12TH
GRADE FROM 2004 ............................ 245
TABLE 6.37. FREQUENCY TABLE OF EG AND PR OF PHYSICS 12TH
GRADE FROM 2005. ........................... 247
TABLE 6.38. FREQUENCY TABLE OF EG AND PR OF CHEMISTRY 12TH
GRADE FROM 1982. ..................... 249
TABLE 6.39. FREQUENCY TABLE OF EG AND PR OF CHEMISTRY 12TH
GRADE FROM 1983 ...................... 251
TABLE 6.40. FREQUENCY TABLE OF EG AND PR OF CHEMISTRY 12TH
GRADE FROM 1984. ..................... 253
TABLE 6.41. FREQUENCY TABLE OF EG AND PR OF CHEMISTRY 12TH
GRADE FROM 2004. ..................... 254
TABLE 6.42. FREQUENCY TABLE OF EG AND PR OF CHEMISTRY 12TH
GRADE FROM 2005. ..................... 255
TABLE 6.43. DATA OF 275 EXAMINEES GRADES IN GROUP I (MC ITEMS), PHYSICS EXAM 1ST
PHASE, 1ST
CALL, 2003. ...................................................................................................................................... 256
TABLE 6.44. DATA OF 275 EXAMINEES GRADES IN GROUP II (CR ITEMS), PHYSICS EXAM 1ST
PHASE, 1ST
CALL, 2003. ...................................................................................................................................... 262
TABLE 6.45. DATA OF 275 EXAMINEES GRADES IN GROUP III (LAB CR ITEMS), PHYSICS EXAM 1ST
PHASE,
1ST
CALL, 2003. ................................................................................................................................. 272
TABLE 6.46. DATA OF 251 EXAMINEES GRADES IN GROUP I (MC ITEMS), PHYSICS EXAM 1ST
PHASE, 1ST
CALL, 2004. ...................................................................................................................................... 278
TABLE 6.47. DATA OF 251 EXAMINEES GRADES IN GROUP II (CR ITEMS), PHYSICS EXAM 1ST
PHASE, 1ST
CALL, 2004. ...................................................................................................................................... 285
xxi
TABLE 6.48. DATA OF 251 EXAMINEES GRADES IN GROUP III (LAB CR ITEMS), PHYSICS EXAM 1ST
PHASE,
1ST
CALL, 2004. ................................................................................................................................. 294
TABLE 6.49. DATA OF 148 EXAMINEES GRADES IN GROUP I (MC ITEMS), PHYSICS EXAM 1ST
PHASE, 1ST
CALL, 2005. ...................................................................................................................................... 300
TABLE 6.50. DATA OF 148 EXAMINEES GRADES IN GROUP II (CR ITEMS), PHYSICS EXAM 1ST
PHASE, 1ST
CALL, 2005. ...................................................................................................................................... 304
TABLE 6.51. DATA OF 148 EXAMINEES GRADES IN GROUP III (LAB CR ITEMS), PHYSICS EXAM 1ST
PHASE,
1ST
CALL, 2005. ................................................................................................................................. 310
TABLE 6.52. DATA OF 153 EXAMINEES GRADES IN GROUP I (MC ITEMS), CHEMISTRY EXAM 1ST
PHASE, 1ST
CALL, 2003 ....................................................................................................................................... 314
TABLE 6.53. DATA OF 153 EXAMINEES GRADES IN GROUP II (CR ITEMS), CHEMISTRY EXAM 1ST
PHASE, 1ST
CALL, 2003 ....................................................................................................................................... 318
TABLE 6.54. DATA OF 153 EXAMINEES GRADES IN GROUP III (LAB CR ITEMS), CHEMISTRY EXAM 1ST
PHASE, 1ST
CALL, 2003...................................................................................................................... 324
TABLE 6.55. DATA OF 317 EXAMINEES GRADES IN GROUP I (MC ITEMS), CHEMISTRY EXAM 1ST
PHASE, 1ST
CALL, 2004. ...................................................................................................................................... 328
TABLE 6.56. DATA OF 317 EXAMINEES GRADES IN GROUP II (CR ITEMS), CHEMISTRY EXAM 1ST
PHASE, 1ST
CALL, 2004. ...................................................................................................................................... 336
TABLE 6.57. DATA OF 317 EXAMINEES GRADES IN GROUP III (LAB CR ITEMS), CHEMISTRY EXAM 1ST
PHASE, 1ST
CALL, 2004...................................................................................................................... 347
TABLE 6.58. DATA OF 382 EXAMINEES GRADES IN GROUP I (MC ITEMS), CHEMISTRY EXAM 1ST
PHASE, 1ST
CALL, 2005. ...................................................................................................................................... 355
TABLE 6.59. DATA OF 382 EXAMINEES GRADES IN GROUP II (CR ITEMS), CHEMISTRY EXAM 1ST
PHASE, 1ST
CALL, 2005. ...................................................................................................................................... 365
TABLE 6.60. DATA OF 382 EXAMINEES GRADES IN GROUP III (LAB CR ITEMS), CHEMISTRY EXAM 1ST
PHASE, 1ST
CALL, 2005...................................................................................................................... 379

xxii
xxiii
Abbreviations
AERA American Educational Research Association
AHME Historical Archive of the Ministry of Education
APA American Psychological Association
BEMA Brief Electricity and Magnetism Assessment
BESEL Library of the Lisbon School of Education
BFCT-UNL Library of the College of Sciences and Technology of the New
University of Lisbon
BFC-UL Library of the College of Sciences - University of Lisbon
BN Portuguese National Library
B-on Online Library of Knowledge
CR items Constructed-response items
CR-INE Resource Centre of the Institute of Educational Innovation
CSIP Board of Public Instruction
CSPOPE Secondary Courses Mainly Aimed at Continuing Studies
CSPOVA Secondary Courses Mainly Aimed at Working Life
DG Government Diary
DGEL Directorate General of High School Education
DGEN General Directorate of High School Education
DGES Directorate General of University Education
DGIP General Directorate of Public Instruction
DL Decree-Law
DR Diary of the Republic
EG Exam Grade
ENES Secondary School National Statistics
xxiv
FMS Mário Soares Foundation
FPCE-UL College of Psychology and Educational Sciences of the
University of Lisbon
GAVE Office of Educational Assessment
GEPE Office of Educational Statistics and Planning
IEL Inspection of High School Teaching
IFG Internal Final Grade
IMAE Institute of Audiovisual Media for Teaching
INE Portuguese National Statistics Institute
IRT Item Response Theory
JNE National Examinations Jury
MC Multiple-choice
MCGM1 Modified Contrasting Groups Method variation 1
MCGM2 Modified Contrasting Groups Method variation 2
ME Ministry of Education
MEC Ministry of Education and Culture
MEIC Ministry of Education and Scientific Research
MEN National Ministry of Education
NBPTS National Board of Professional Teaching Standards (USA)
NCME National Council on Measurement Education (USA)
PIDE
PR
State Defense and International Police, in effect a politicized
secret police (Polícia Internacional e de Defesa do Estado)
Passing Rate
RTP
SAAP
Portuguese public service broadcasting
Propaedeutic Year Support Service
SD Standard Deviation
SGME General Secretariat of the Ministry of Education
SN Student's number
SPSS Statistical Package for the Social Science
TPU
ULHT
Pre-University Texts
Lusophone University of Humanities and Technologies
1
1 Introduction
“...to use a magnifying glass to assess an exam is to look at a tree and lose sight of
the forest.” (Grácio, 1996, p. 134)
There is a growing consensus regarding the need to increase and deepen the debate over the
quality and efficiency of the production and distribution of knowledge by the educational
system, and the strategic question of its evaluation. Several theories and methods were
developed since the 50s1 allowing the comparison of the evaluation results of the learning of
different populations in different times and spaces. Analysing exam organization, its contents
and pedagogical objectives, the grading methods, as well as the behaviour of both examiners
and examinees when faced with the learning is an important aspect for the debate regarding
exams in Portugal and elsewhere.
1 Examples of those theories are: Item Response Theory (IRT) (Baker, 2001; DeMars, 2010),
Classical Measurement Theory (Lord & Novick, 1968) and the Evaluation Model of the Learning Results
(Kolb, 1984), associated with the idea of accountability, i.e., that the production and distribution of
information regarding the knowledge that students acquire in school are part of the duties of the
Government towards the population regarding the quality of the services it provides.
2
1.1 Motivation
There are presently in our society deep concerns with low school performance. Even though
there have been great investments in the educational system, there are still many students that
upon failing a national exam leave the system thus contributing to the high percentage of school
drop-outs found in Portugal.
This leads to the need to focus on exams as a device to regulate teaching. With this goal, and
keeping in mind the central role that grading has taken on the formulation and implementation
of curricula and learning, student graduation and certification, the propose of this study is to
analyse the evolution of the national exams in Physics and Chemistry as a whole, and the
implications they have in the learning process.
The starting point for this investigation is the significant variation in difficulty of the national
exams in Physics and Chemistry. This research also adds other reflexions regarding social and
political environment as well as the several educational reforms that happened through the
years. The analysis of these variations will allow understanding in which way changes in the
content and structure of the exams, and in the adopted techniques affect the difficulty they
present.
The goal of this thesis is not to defend the pedagogic legitimacy of the Physics and
Chemistry exams, considered by some as socially unavoidable (Therer, 1999, p. 2), but to
analyse their evolution through the reforms implemented on a limited time horizon. The origin
of the time reference for this study is 1948, with the so-called “Pires de Lima reform”, and ends
in 2005, with the creation of a unique exam for both subjects of the current curriculum. The
reasoning behind choosing this starting point is its “significant evolution in the definition of
pedagogical and didactic norms in teaching” (Grácio, 1996, p. 67), which led to the
implementation of national exams, replacing the district exams created in local high schools.
The exams of the current reform, which first appeared in 2005, were excluded due to the
hastened way this reform was implemented, leading to great imbalance amongst students in its
first year due to different class loads for the same curriculum.
There are countless debates about exams and their applications, not only in the definition of
educational policies in its key points, but also in considering them symbols of peripheral
political conflicts regarding race, social class, and gender, which are connected to social and
public money distribution criteria.

3
For that reason, “exams will mainly be whatever we want them to be” (Ferro, 1970, p. 421).
1.2 Exams: a social institution
The analysis of exams as grading tools has raised several questions and fed countless
controversies through the years. Nowadays, exams are a “critical” part of the education reform
movements and also a way to legitimize educational policies (McDonnell, 2004).
In the 1950s the controversy was centred on the questions asked and their detachment from
the curriculum taught, the oral exams (for which appeals were not accepted), and the mistakes
found on the tests.
In the 1970s, before the change from a dictatorship to a democracy in 1974, the exams were
outdated. The immutability of the contents over decades lead students away from the
advancements of science and technology, while new innovative curricula had cropped up, like
Project Physics, in USA, or the Nuffield Project, in England (Ogborn, 2002). This period was
characterized by the growth of the psychometric movement and the international research for
better exam design to measure student’s knowledge and skills at a general level. Due to
disgruntling results, there was a second period when exams were criticized (Valadares & Graça,
1998), which led to new approaches reflected on the Reform of Veiga Simão.
The transitional period between 1974 and 1980 is characterized by: (a) political instability,
(b) constant changes to the legislation, namely the introduction of the Comprehensive
Secondary Education (its implementation was only completed in 1981), and (c) the permanent
change of teachers in schools. Still, national exams for access to higher education were
accepted, and even the strike movement of February 1975 “had as motive not a refusal of the
exams but a refusal of the increase of the exam exemption grade” (Rodrigues, 1978). Another
example was the failed one-day strike by the teachers of the Greater Lisbon area, without a
single echo of solidarity from the Movimento Associativo Estudantil (Associative Student
Movement), even after an unofficial note from the Ministério da Educação e Cultura (MEC)
determining that there would not be another opportunity for students besides the second call –
even if the first did not happen due to a teacher strike – trying to “awaken” in students the desire
to take exams.
The exams of this period were not considered in this study due to several factors. Some of
which are:
4
It is not possible to accurately know the examinees’ grades for the school year of 1973-
1974. For instance, the grades at Liceu Camões were altered as many examinees
benefited from an administrative grade increase both by the decision of the General
Assembly of Teachers of this high school and under memorandum L-T-ES/55/74 of the
MEC. After the exams, students were confronted with the structural failure of higher
education to absorb all the candidates that wished to attend University (Editores, 1977);
In the three following school years, the Student Civil Service was created upon
completion of high school in response to the thousands of candidates that were waiting
for admission to higher education. This year was qualified by several political sectors
as a “fraud year” (Brotas, 1977, p. 8) as it did not increase the students’ academic
knowledge and reflected the “rhythms and contradictions of the democratization
process in Portugal” (Oliveira, 2004, p. 5). The occurrence of several strikes did not
allow for an unbiased analysis of the exam results. An example of this was the student
strike of February 1975, which was fuelled not by a refusal to take exams but a
rejection of the increase of the minimal grade for exam exemption. Another strike that
had consequences on the 1st call of the exams of 1975 was the teacher strike in the
Greater Lisbon area, leading to an informal note from MEC limiting the students who
had not taken the exam due to the teachers strike to only go to the 2nd exam call
(Rodrigues, 1978). In the two following years the 3rd cycle exams happened at the
same time the Comprehensive Education was being introduced, along with the
systematic alteration of objectives and curricula. The Student Civil Service survived for
two more years and was finally suspended in 17/6/1977, with a law from Parliament.
Its suspension happened with the creation of selection and seriation mechanisms for
higher education (it now had numerus clausus for admission to the majors). A direct
consequence of this was the lower number of entering students when compared to the
years before the Revolution of April 25, 1974;
To replace it, the propaedeutic year is created in 1977 surviving until 1980. There were
some difficulties with the pedagogic orientation and the timely definition of the
curriculum for the different subjects during the first year (Brotas, 1977). It became
known as the television year as the classes were being transmitted on television to
address the inability of the schools to accept more students. At the end of the school
year, the students took two benchmarking tests (there were two sets of tests, each one
with three exams designated by the letters A, B, and C), with their results published
“about two months after the last exam was taken” (Telmo, 1978, p. 12). To avoid any

5
“distortion” in the results the correction of these exams was done by computer, which
hinders the analysis of the results. According to one of the Pedagogical Directors of the
Propaedeutic Year, Oliveira Marques, “propaedeutic teaching, in the conditions it was
offered a year ago, can be considered a hastened act as it lacked the necessary
preparation” (Trindade, 1978, p. 10). In the following two years, the wealthiest students
obtained the support of private schools while the remaining students only had the
possibility of attending some high schools in the district capitals. This situation didn’t
offer the examinees an equal opportunity to learn the subject matter tested.
The Educational reorganization was completed in 1981, creating the 12th grade of secondary
school. As a consequence of this reorganization, the Ciências Físico-Químicas (Physics and
Chemical Sciences) exam is divided into two exams, one of Physics and the other of Chemistry,
which replace the 3rd cycle exam in order to end the Secondary School, and survived until
2005. After the implementation and extension phase of the 12th grade to the majority of the
secondary schools, there were no “major changes on the grading system which is generally
characterized by giving greater emphasis to the classification, selection, and certification
procedures, than to the results achieved by the students […]” (Fernandes, 2006, p. 25).
In the 1990s the opinions went from the common sense reaction, based on the progressively
lower qualification of students and consequent reduction of the exams’ difficulty defended by
Filomena Mónica (1997), to the response of Stöer & Magalhães (1998) based on three aspects –
the core of the teaching-learning process is the student, the teaching must be adapted to his
characteristics and there has to be an articulation between the school and the modern concept of
Educational Community.
The study made by Teodoro et al. (1998) found that the Physics exams in 1996 were clearly
more difficult than the exams offered in the four previous decades, going against the opinion of
those that insist that “exams were harder in the old days”.
Towards the end of the 1990s a discussion starts regarding a new reform of secondary school
in which external evaluations should focus on the competences of reasoning, problem solving
and communication (Fernandes, 2008).
It is not the intention of this approach to present a review of the controversial moments of
the educational changes through the years, but to show that the Portuguese educational system
has higher demands nowadays, both in teaching and curriculum, expecting a higher competence
level in abstract thinking along with an increase of curriculum-complementary activities. This
complexity (Phelps, 2005) can deteriorate the credibility of the existing tests as indicators of
6
teaching quality as their results usually fall short from the expected. There are many who
criticize these tests, but usually that just shows a lack of knowledge of the limitations and
benefits of the exams which Popham (2001, p. 26) called “evaluation illiteracy”.
On the other hand, defending the abolition of an external assessment means you will shun an
important indicator of teaching-learning as “evaluation is an intrinsic characteristic of
knowledge” (Bartolomeis, 1981, p. 40).
It is necessary to keep in mind that there are paradoxes in the debate regarding exams and
learning:
I. If the exams are that bad, and if our students do not acquire the required competences,
how can we explain our country’s technological development and progress (even if
it falls short for the expectations of some)?
II. If the examples (like the Physics and Chemistry exams of the 1990s) and the evidence
deny the ever present argument of the lowering difficulty of the exams, how can we explain the
scrounging media diatribe presented every year come exam season?
If on the one hand exams are measuring instruments to get information on the students and
school performance, on the other hand they are also strategies to reach a wide variety of
political goals that affect our educational system. For instance, the curriculum contents subject
to school evaluation become critical elements that support politically driven educational
interventions.
The points mentioned highlight that the issue surrounding evaluation is “more than a
question of pedagogic technique; it is a political problem” (Araújo, 1976, p. 5).
Making exam results public and establishing a school ranking system might work as a
coercion factor, so well exploited by the hortatory political theory, “since all policies embody an
implicit theory of change” (McDonnell, 2004, p. 25). One can identify two big classes of
political instruments: mandates that impose rules and incentives based on financial
compensation for achieving certain goals. But the hortatory theory proposes a much subtler and
effective instrument that is not based on disapproval or compensation, but on persuasion. Its
effectiveness depends on the existence of causal constraints, such as possible penalties. The
publication of the statistical results of the exams, for instance, is one of the ways of increasing
the effectiveness of this instrument. It is obvious that following the persuasion, mandates and
incentives appear for the realization of the educational policies. Still, the line between

7
information (persuasive cries are not enough), and the motivating values and belief in change is
very thin (McDonnell, 2004).
To Pellegrino ( 1999) there were “four major forces that have influenced educational
assessment practice from 1957 to the present: Psychometrics, Cognition, Curriculum, and
Social-political context of education”. These forces were “related with multiple streams of
influence, including social policy and societal goals, theories of the mind, and computational
capacities”(1999, p. 7).
One can never say this too often: it is not possible to reflect on the exams by focusing only
on the students and on the technical concern of measuring their performance, without also
considering the situation in which the learning was done, such as the curriculum, the cultural
characteristics of the region, the organization of the School Community, and the part played by
the Government.
1.3 Goals and structure of the investigation
The main challenge of this study is, primarily, to analyse the performance of the examinees, by
sampling in a set number of schools. The analysis attempts to answer the following questions:
Are there any differences in the internal and external students’ global performance?
Are the results of three different standard setting methods similar?
Are there identical performance behaviours for four selected Physics and Chemistry
contents?
These are important questions since every year the difficulty of the national exams is
discussed alongside with the expectations towards the learning and the performance of the
examinees.
On the other hand, in order to understand to what extent the changes in exam content and
structure, and the adopted techniques influence the degree of difficulty, it is necessary to focus
our reflexion in the social and political contexts, and on the scope of the several educational
reforms that happened throughout the years.

8
One of the goals of this investigation is the creation of a digital archive containing the
Physics and Chemistry national exams, allowing the community to research and analyse them
through the Internet.
This investigation is structured as follows. Chapter Two – Exams Legislation is divided in
two parts and starts with a summary of the national exams legislation in Portugal from 1836 to
1947 and then presents a typical timeline of the legislation regarding exams in Portugal until
2005, as a way to contextualize their evolution.
Chapter Three – Literature Review aims to review and synthesize current findings as well as
theoretical and methodological contributions regarding standard setting methods and evaluate
them according to the guiding concept of items. Psychometric theory and cognitive analysis
presents the foundation for this analysis.
The sampling, treatment and analysis of the data are set out in Chapter Four – Methodology.
The data regarding the exam sheet and results, questionnaires and the cognitive analysis of the
items were extracted, compiled and grouped chronologically, according to the educational
reforms.
The application of the psychometric tools combined several adaptations keeping in mind the
existing statistical data and the format of the items in the exams:
1. in the period between 1950 and 1999,
a) Beuk Method (for the years of 1972, 1982, 1983, 1984), as a holistic method;
b) Contrasting Groups Method, with a variation based on the average of the grades of the
items proposed by Irwin, Bunckendahl, and Poggio (2007).
2. in the period between 2000 and 2005,
a) Beuk Method (for 2004 and 2005), as a holistic method;
b) Extended Angoff Method (for 2003, 2004 and 2005), with the Angoff True/False
variation, suggested by Impara and Plake (1998, p. 69) for multiple choice items, and the
extension of the Angoff Method, proposed by Hambleton & Plake (1995, p. 41), for the
remaining items;
c) Contrasting Groups Method, with the adaptation of the linear regression model
proposed by Cizek and Bunch (2007, p. 109);
9
d) Content and cognition level of exams items (for 2003, 2004 and 2005), following previous
studies (Ding, 2007; Ding, Chabay, Sherwood, & Beichner, 2006).
This research is focused on the pursuit of reciprocal influences between the theoretical
construction and the empirical data, in a constant process of redefinition, re-examination, and
confrontation, believing that the research process, being an iterative process, cannot be limited
to a set of linear and sequential procedures.
The virtues and potential of this study cannot hide the limitations that a methodological
strategy such as this encompasses. Thus we established a triangulation of data, sources, and
methods, as a guarantee of its internal soundness. Not only are the investigational techniques
explained, as the limitations of the study.
The use of a vast and diverse array of conceptual and methodological instruments, allied to a
complex interaction between the problems being investigated, the investigator, and the
examinees, creates a privileged way to the understanding and measurement of the problem of
grading/evaluation.
On Chapter Five – Results and Discussion, an analysis, on a decade-by-decade basis, of the
structure, and content of the exams, and the results of the examinees is presented, as there is a
network of endless intersections and inter-relations between them. This seemed to be the best
option to present and discuss the results obtained, as the goal is not to simply point out possible
differences, but to adequately interpret them so that effective decisions can be made regarding
the learning/teaching process. If, on the one hand, a higher level of demand can have negative
consequences and lead to a lower morale and to the students’ loss of interest on the subject, on
the other hand, the performance level of the examinees should reflect and encourage learning
activities associated with more complex skills so that the evaluation can model the learning. The
exams are analysed as instruments of the educational policies through press articles, with a
special focus on the 1950s through the 1970s, with some fleeting incursions to the 1980s
through the 2000s.
The final chapter, Chapter Six – Conclusions, provides a synthesis of the major findings and
discusses some limitations of the study namely the choice of the psychometric tools and the
curriculum contents included on the exams syllabus, analysed cognitively.
With open minds and realizing that there is still a long way to go and that learning is closely
connected with evaluation, some guidelines and possible research paths are presented in the end
of this study.
10
A synopsis of the digital exam archive was included as Appendix 1. The digital exam
archive can be found online at www.examesfisicaquimica.org. In Appendix 2 you will find the
selected Physics and Chemistry multiple-choice exam items from 2003 to 2005 referred in 4.3.
The examinees’ scores tables to set the performance standards for Contrasting Groups, Beuk
and Extended Angoff Methods are in Appendix 3.
The research on exams is due to the general consensus regarding the influence of external
exams on teaching-learning, as Orden (1982, p. 7) mentions: “it is a commonly known fact
amongst educators that exams (what is demanded of students in exams) define the real
objectives of learning and teaching [...]”.
Considering assessment as a “function of a future, the one that is prepared, ensured,
organized” (Bonboir, 1976, p. 30), this research aims to contribute to that future, without
alienating the whole.

11
2 Exams Legislation
“The means and ends involved in educational policy and practice are the results of
struggles by powerful groups and social movements to make their knowledge
legitimate, to defend or increase their patterns of social mobility, and to increase
their power in the larger social arena.” (Apple, 2000, p. 9)
Educational legislation was one of the starting points for this quest through the history of
education. The interpretation of the legislation is based in its context, as this is the only way to
understand its consequences in students and schools. This chapter is divided in two parts and
starts with a summary of the national exam legislation in Portugal from 1836 to 1947 and then
presents a typical timeline of the legislation regarding exams in Portugal until 2005. Laws,
decrees, bills of law, decree-laws, notices, and ordinances were all considered in this research,
as well as teacher reports, articles written by teachers, and the work of other researchers. All
these sources gave insight into, on the one hand, the official vision of education, and on the
other hand, the vision of the teachers. In the legislation summary, the choice and interpretation
are directed towards the most significant changes in the high school and technical teaching, and
appear accompanied by an analysis focused on certain aspects such as: study plan, elaboration
and types of exams, and their implementation.
A table with a compilation of the resulting educational system reforms and the curricular
reorganizations implemented through legislation during these five decades, where the
12
organization of High School, Basic and Secondary, and the calculation of the weight of the
exam grade towards admission in University have to be highlighted, is presented at the end.
This table allows a better understanding of the changes that happened in this time frame,
particularly the disappearance of the final exams of the 10th and 11th grades in 1983, keeping
only the Assessment Exam (Leal, 1991). Still, even though several different formulae were used
to calculate the High School/Secondary School final grade, the formula used in 2005 is
resembled to the one used in 1947, with the exception of the existence of oral and practical
exams. The absence of a direct evaluation of lab practice can be significant due to the
experimental character of Physics and Chemistry. One argument for this exception is the
standardization of the grading criteria.
The analysis of educational legislation shows the importance of several national and
international historical factors for the development of teaching and learning in Portugal.
2.1 Exploratory analysis of the legislation before 1947
Educational legislation was one of the starting points for this journey through the history of
education. The interpretation of the legislation is based on its contextualization, as only then can
its consequences on students and school in general be fully understood. Educational legislation
seeks to promote the progress of society through the debate and introduction of new models and
pedagogic experiences.
Laws, decrees, ordinances, rulings, and communications, as well as teacher reports, articles
and studies done by other researchers were considered in this research. This abundance of
sources allowed for both the official vision of education as well as the teachers’ vision. The free
online availability of the Portuguese legislation2, since 1910, was of great help towards its
compilation, selection, and digitization. The treatment of other sources, such as the teacher
reports collected at Secretaria-Geral do Ministério da Educação (Secretary General of the
Ministry of Education), was only possible thanks to their conservation and free access to
researchers.
Esteves (1953) did a brief analysis of the legislation starting in 1836 and all the way up to
the Pires de Lima Reform. This analysis, presented below, focuses on the following aspects of
2 http://www.dre.pt/
13
some of the reforms: a) study plan; b) exam types; c) test writing; d) jury formation; e) test
evaluation.
Decree of 1836 – Did not determine the duration of the high school course or, for each
subject, the number of weekly lessons. Teaching was done by field of study distributed into ten
subjects awarded to the same number of teachers. In the event that a teacher would have to
temporarily miss a class the School Council would nominate an advanced student to replace
him, the student would be paid an amount arbitrarily determined by the same Council and paid
from the enrolment treasury. On the subject of “Annual Exams” you can find four extremely
brief and vague articles.
They simply state that, at the end of the school year, the students would be tested on the
subjects they studied; the jury would be formed by the teachers of those subjects and another,
and none of them should ask questions about the subjects they taught; the exams were open to
the public; and that in the judgment of the tests, through a secret vote, each member of the jury
would drop in to the urn the letter A (approved) or the letter R (failed), and that would
determine the examinee’s fate.
Decree of 1844 – Suppressed the teaching of Sciences and of French and English, with the
rest being distributed by only six subjects. This is the first true reform of our high school
teaching but certainly, the selection of students was not the first consideration of the legislator.
Still, for the first time, it is clearly determined that the exams for high school subjects will
have both an oral and a written part.
Decree of 1860 – The legislative shoddiness of the two previous reforms regarding exams
would be followed by the first serious attempt, with implications in the future, of obtaining the
actual performance an exam can give as a way to gauge the knowledge and intellectual capacity
of the students.
This decree from the 10th of April of 1860, alongside its regulation, published around three
years later, allowed that:
a) French, English, Physics, Chemistry and Natural Sciences, which the previous
organization had suppressed, be returned as high school subjects. The course lasted five years
and almost all of the subjects were taken for more than one year;
b) The decree established that each subject would have two kinds of exams: monthly and
annually. The regulation though replaced the former with three exams (Periodic Exams) to be
14
taken in December, February and May. The scores from these exams would become part of the
respective books of terms and each exam would have a grade of good, satisfactory or bad. The
annual exams were partial or final depending on if they were referring to the early parts of a
subject or the final part. In the first year there were only partial exams whereas in the fifth year,
being the final year of the course, there were only final exams;
c) The most interesting innovation of this reform is related to the construction of topics for
the annual exams. According to the decree each school should organize, for each subject, a
series of at least 50 topics to serve as themes for the oral exams and another identical series for
the written exams. After being approved by the respective School Council these topics would be
forwarded by the headmasters to the Direcção-Geral de Instrução Pública (DGIP - General
Directorate of Public Instruction), who in turn would return them to the school after the
Conselho Superior de Instrucão Pública (CSIP - Board of Public Instruction) approved the
topics. The regulation though, restricted the creation of these topics exclusively to the teachers
of 1st class high schools, which were located in Lisbon, Oporto, Coimbra, Braga and Évora.
The headmasters would send their topics for all the subjects to the DGIP (Direcção-Geral de
Instrução Pública). After they were approved by the several school councils, the CSIP
(Conselho Superior de Instrução Pública) would organize a single series that would serve all the
students in all the high-schools in the country’s coming exam season. It was the first step
towards the single test system currently in place for written tests;
d) The jury at the exams be it periodical, partial or final, was formed by three teachers
nominated by the school council. The senior would lead;
e) The exams were taken in shifts with no more than four students at a time. When a group
was called in for an exam for a subject, a topic for the oral test would be randomly selected and
the exam would start immediately. The duration of each oral exam could not be less than 30
minutes and no longer than 60. As soon as the oral exam was completed the written test would
start before the same jury and in the same room. The exam grade of each student would depend
on one or two consecutive votes done in secrecy. The 1st vote is the unique vote mentioned in
article 61 of the reform of Alexandre de Campos. The students that obtained the majority of
favourable votes would pass the exam. The goal of the 2nd vote was to grade the passing
examinees. The grade was obtained by doing the average of the three voted grades in a scale of
10 to 20.
Decree of 1868 – Changed the study plans but kept the examination procedure. The high-
school course, lasting six years, was divided into two classes. The second class included the first
15
three years and the first class included the last three. For that reason the high schools that taught
the first and second classes were designated as high schools of the first and second order. The
1st order high schools were located in Lisbon, Oporto, Coimbra, Braga and Viseu, with all the
privileges enjoyed previously by the 1st class high schools.
Decree of 1872 – Return to the old classification of high schools (1st and 2nd class.) The
course of 1st class high schools, lasting 6 years, integrated the special course and the general
course. The special course, identical to the course taught in 2nd class high schools, included the
first four years and the general course included the last two. An interesting innovation: to enrol
in the College of Medicine or in the College of Mathematics one would need the special course
and exams in Mathematics and Drawing from the special course; to enrol in the College of Law
or the College of Theology one would need the special course and exams in Latin and
Philosophy from the general course.
The legislator of 1872 will be remembered in the history of our high school teaching as the
forefather of the specialized courses regimen adopted nowadays in high schools.
Decree of 1880 – a) The high school course, also lasting six years, now includes the general
course and complementary courses. The general course included the first four years and it was
homogeneous throughout all the high schools, central and national. The complementary course
in Humanities was exclusive to the central high schools (Lisbon, Oporto, and Coimbra) and to
the ones in Braga, Viseu, Évora and Angra do Heroísmo. The complementary course in
Sciences was available at the central high schools and the one in Funchal;
b) There were three types of exams: passing, completion, and singular. The passing exams of
the 1st, 2nd, 3rd, and 5th years were required to enrol in the 2nd, 3rd, 4th, and 6th years,
respectively. The passing exams of the 4th year, last year of the general course, and of the 6th,
last year of the complementary courses, were required for the completion exams of the
corresponding courses;
c) There were no organized topics for the oral tests which were comprised of two
interrogation sessions per subject, per student. The topics for the written passing exams where
written at each high school by the teachers of the subject for the corresponding year. A
Government appointed committee of teachers organized the topics for the written completion
exams, which were then approved by the CSIP (Conselho Superior de Instrucão Pública);
d) The jury for the passing exams was formed by all the teachers of the respective year and,
if needed, one or two more for the oral test interrogations. The jury for the completion exams of
16
the general course was formed by the headmaster and four voting members nominated by the
School Council. The jury of the completion exams of the complementary courses was
Government appointed and was formed by one Higher Education Professor, who presided, and
four voting members (high school teachers or higher education professors);
e) The grading of the written tests (1st series tests) for any subject was done in a scale of 0 to
6, with the extremes corresponding to bad and very good, respectively. The voting was done by
secret vote. Each voting member of the jury (there were just three: the two examining teachers
and the senior amongst the remaining members of the jury) would register the grade he believed
corresponded to the merits of the exam. If the examinee got at least two votes out of three each,
he would then pass the exam. Calculating the average of the voted grades, ignoring fractions
under 0.5 and counting as units the fractions equal or higher, would give the grade of the test.
The same procedure was applied to the oral exams (2nd series tests.) In either the passing exams
or the completion exams the examinee would not go through if he failed: 1.) in two or more 1st
series tests; 2.) in two or more 2nd series tests; 3.) in one 1st series test and a 2nd series test.
The law was harsher for external examinees, who upon failing a single 1st or 2nd series test
would fail the corresponding exam.
Decree of 1886 – a) “Uniform, equal and complete” course in all high schools, divided in
classes: 1st class (1st and 2nd years); 2nd class (3rd and 4th); 3rd
class, humanities (5th and 6th);
3rd class, sciences (5th and 6th). This reform appears to have been inspired more by the wish of
“putting an end to local emulations” than by the superior interests of teaching. Aside from the
unfair treatment given to the Drawing subject and the elimination of the Legislation subject, the
high school course of 1886 is essentially the same as the course of the central high schools of
1880. In fact, the first two classes (four years) and the humanities and sciences courses (two
years) match the general course and the complementary courses of the previous reform. It was a
simple name change, a typical case of “legislation vitis” with no major consequences.
Article 26, on the other hand, had serious consequences by satisfying the wishes of some
school councils and forbidding teachers and high school employees from private tutoring. These
consequences, particularly nefarious for secondary teaching, were perhaps necessary to allow
private teaching to achieve, in the long run, the prestige and dignity it holds nowadays. It was
easy for this kind of teaching, without any restrictions, to get hold of the great majority of
students.
Still, alongside good and very good private schools, truly mercenary teaching companies,
scrupleless and with no competence, emerged throughout the country. Adventurers would arise
17
from this pseudo-teaching come exam season and flock to the high schools where they believed
they would find compassionate and non-demanding juries. One of the most chastised high
schools was in Lamego, a school with a noble tradition. A piece from the newspaper
«Progresso», which was published in that town at the time, reports on it in a humorous way:
«Know this, adventurers, the high school of Lamego is not a meeting place for dumb people. »
It is true that after 1888 (article 9 of that same years decree), external students could only
enrol for exam in the high school of the district or town where they studied for at least the last
four months. The practical result was the demand of a new document to add to the exam
petition: an ordinance authorizing it. Regarding the enrolment of a group of students from Trás-
os-Montes to take their exams at the high school of Lamego, the following melancholic
commentary appeared in the newspaper: «By allowing the ordinance the Government does what
they can, not what they should.» And further ahead: «those who trust the high school of Lamego
to take their exams, should first trust it to come here and study since in Lamego the teaching is
competent, work is done with “unsurpassable zeal”».
The current state of affairs led to the alarming decay in the quality of teaching.
The first reaction was soon felt. Five years after the decree of 1886, Luciano Cordeiro, at that
time interim Director-Geral da Instrução Secundária e Superior (Secondary and Higher
Education Director), ordered that the Inspectors of the three school circles conducted a rigorous
investigation of the life of the private teaching facilities, the qualifications and competence of
the teachers, the hygiene and feeding regime of the board students, etc. Three years later the
first statute, let us call it that, of Private Teaching in Portugal, included in the General
Regulation of Secondary Instruction of August 14, 1895 was published;
b) Four kinds of exams: admission to high school, passing, class and singular. The passing
exams, which always preceded the class exams, were composed of only oral tests. Those exams
were not necessary for internal students that got an attendance grade of at least 10, and only
students whose grade was not under 7 were allowed to take them. The class exams were
composed of written exams on random topics and of oral exams with two interrogations of 15
minutes each. The written tests for Portuguese and Mathematics on the 2nd year where replaced
with exercises on the board during the oral tests;
c) The topics for the written tests of the different subjects were written by the respective
teacher;
18
d) The Government nominated the jury for class exams, formed by teachers of secondary
schools and colleges. For the other exams the School Councils would nominate the jury;
e) The grading of the written and oral exams was done by secret vote.
Decree of 1888 – Each year formed a class with the first three years common to the general
course (four years) and the humanities course, and the other two years common to the general
course and the science course.
Same legislation regarding exams can be found in the applicable part.
Decree of 1895 – a) Reacts against teaching by subjects and replaces with class teaching.
The high school course was, for the first time, seven years long and comprised three sections:
lower (1st and 2nd class); middle (3rd, 4th and 5th) and higher (6th and 7th). The first two
sections formed the general course and the latter the complementary course, exclusive to the
central high schools;
b) Five kinds of exams: passing, completion of the general course and of the complementary
course, admission to class, admission to subject, and singular. The passing exams, as well as the
admission and completion exams, were composed of written and oral tests, the latter with a
single interrogation per subject and the former about randomly drawn topics. The 1st class
students did not take a passing exam; the ones that had at least a grade of satisfactory in all
subjects during the last four months of the school year would move on to 2nd class. The
students from 2nd, 3rd, 4th and 6th classes that had at least a grade of good on more than half
the subjects and satisfactory on the remaining would not have to take these exams. The
legislator gave great importance to the passing exams: «they operate, within reasonably tolerant
limits, a healthy selection; they tend to properly even out the classes; they ensure the
advantageous continuation of the studies and inform the families of the true intellectual worth of
their children »;
c) In each high school the topics for the written tests of all the exams, 30 per subject, were
written by the teachers of each subject and approved by the School Council;
d) The jury for the passing or class admission exams was formed by the teacher of the
corresponding class and presided by the director of that class. The jury for the completion
exams was formed by the teachers of the corresponding class and presided by a higher
education professor. For the other exams, three teachers nominated by the headmaster formed
the jury. An innovation: the president of the jury had the right of vetoing any vote he considered
unfair or not conforming to the legal provisions;
19
e) Once a class finished the exams they would be graded by the examining voting members,
this would be followed by a vote by subject, no longer in secrecy but in conference. In order to
be allowed to take the oral exams, the examinee would have had to get a majority of satisfactory
grades in the written tests. However, one was not allowed to have had a grade of bad in any of
the remaining tests, and these could not include the tests in Portuguese, Latin and Mathematics.
The examinee who had good as the majority of grades on each of the written tests, and had at
least satisfactory as the majority of grades for each of the subjects on the class book, would be
exempt from taking the oral tests.
The grading of the oral tests was also done in conference. In the case of the exams to pass,
the examinee would pass a class if he got at least a majority of satisfactory grades in each of the
oral exams, minus two, which could not be the tests of Portuguese, Latin or Mathematics. On
the completion exams, to pass the examinee would have to achieve at least a vote of satisfactory
on each subject.
Bill of Law of 1896 – Keeps the complementary course without bifurcation and eliminates
the division of the general course in sections. The passing exams, so highly recommended by
the organization of the previous year, were abolished. There were only the completion exams of
the general course and of the complementary course.
Decree of 1905 – a) High school course divided into three sections: lower (1st, 2nd and 3rd
classes); middle (4th and 5th); higher (6th e 7th). The higher section was exclusive to the central
high schools and it was divided into two courses: complementary in Humanities and
complementary in Sciences;
b) Six kinds of exams: of the general course, 1st section; of the general course, 2nd section;
of the complementary course in Sciences, of the complementary course in Humanities,
admission to class and singular. For the first there is no distinction between internal and external
students on the organization of the exam roster, «all will be distributed alphabetically »;
c) The topics for the written tests were written at each high school by the teachers of each
subject and approved by the School Council;
d) The jury of the exams of the general course, 1st section, was formed by all the teachers of
the 3rd class and presided by the corresponding director. The teachers of the 5th class formed
the jury for the exams of the general course, 2nd section, which was presided by a Government
appointed higher education professor or a tenured teacher of a central high school. The teachers
20
of the 7th class formed the jury for the complementary courses exams. Those exams were
presided by a Government appointed higher education professor;
e) The tests were graded in conference. Students would not be admitted to the oral tests if
they had an average grade on the written test lower than 6, for the general course, 1st
section;
lower than 8 for the general course, 2nd section; lower than 10 for any of the complementary
courses. The examinees that achieved an average grade of at least 10 on the oral tests for each
subject would pass. The examinee that failed a single subject would be allowed to take a
singular exam on that subject two months later.
Decree of 1917 – a) Organizational plan of 1905, with slight changes. As an innovation,
several subjects were excluded: Portuguese and Philosophy on the complementary course in
Sciences, and Physical and Natural Sciences on the complementary course in Humanities;
b) The distinction between internal and external students is brought back. For the internal
students, four kinds of exams: of the general course, 2nd section; of the complementary course
in Humanities; of the complementary course in Sciences; and singular. The external students
also had exams for the general course, 1st section, and admission to class;
c) In each high school and for each subject, the teacher council for that subject would
organize at least ten topics for the written tests and the same amount for practical tests, if they
existed. For each test the first student on the roster randomly selected the test;
d) For the internal students the jury for the exams of the general course, 2nd section, was
formed by the teachers of the 5th class, presided by the corresponding director, if it was a
central high school, or by a tenured high school teacher, nominated by the Government and not
from the high school, if it was national. For the external students, the voting members of the
jury were nominated by the School Council and they would be presided by a Government
nominated higher education professor or teacher of the public Secondary School system. The
president of the jury for the exams of both complementary courses was a Government appointed
higher education professor or high school teacher; the voting members were 7th class teachers
for the internal students, and designated by the School Council for the external students;
e) Once the written tests were finished the jury would meet to grade them in one or more
sessions. The examining voting members recorded their proposed grades on the tests and then
all the members of the jury would vote. The grade of each test was the average of all the votes.
An examinee that got an average lower than 10 in two or more subjects would fail. Once the
21
oral tests were completed and voted an examinee that got at least 10 on each subject would pass.
The final grade was the average of the averages of the oral and written tests.
Decree de 1918 – The only noteworthy fact is the composition of the sections forming the
general course. The 1st section now included the first two classes and the 2nd section, the
following three. The passing exam into 2nd grade was compulsory for both internal and external
students.
Regulation of 1921 – Eliminates the subjects of Portuguese and Philosophy from the 7th
class of sciences and replaces the Physical and Natural Sciences on the complementary course
in humanities with six hours of Mathematics in 6th class. Once again, and this time for good,
there is no distinction between internal and external examinees. The topics for the written exams
were created by the examiners of the respective subjects and approved by the juries during their
preparatory meetings.
Decree of 1926 – Corrected in January of the following year, this organization does not offer
any innovations worth of attention. Its most relevant characteristic: the six-year high school
course did not survive.
Decree of 1931 – a) General course divided in two cycles, the first includes the first two
classes and the second the following three. Complementary courses lasting two years;
b) The following exams were available to both internal and external students: of the general
course, 1st cycle; of the general course; of the complementary courses. The external students
also had: admission to class and singular;
c) The topics for the written tests were organized by the high school teachers in collaboration
with the Secondary Teaching Section of the CSIP (Conselho Superior de Instrucão Pública);
d) The jury was nominated in each high school by the headmaster and it was presided by a
Government appointed higher education professor or high school teacher;
e) The written and practical tests were graded by the jury of each exam in conference or by
superiorly appointed examiners. Getting a grade lower than 10 in the majority of subjects, or
lower than 8 in two or more, would result in failing. Students with at least 10 in every subject
and an average not lower than 12 would be exempt from taking the oral tests.
Decree of 1936 – a) Condemns the distinction between general course and complementary
courses, but that does not prevent this organization from considering a general course lasting six
years, divided in two cycles, and a complementary course lasting one year (3rd cycle), divided
22
in two semesters. It condemns the division of teaching in Humanities and Sciences but later on
that division is re-established in 1941. It also condemns the class regime and intends to replace
it with a subject regime, but does so in logical seriation through the years of the course and
recommends a pedagogical coordination in each year, essential characteristics of that regime.
The innovation was simply the following: students that failed in one or two subjects could
enrol, but in the year that didn’t depend on those subjects. After 1943 this rule only concerned
students that failed a single subject;
b) There were cycle and singular exams composed by two written tests per subject and an
oral test for modern languages;
c) Same as the previous legislation. The regime of multiple tests was abolished, though;
d) The headmaster nominated the jury for all the exams;
e) The jury would choose the better of the two written tests. The student with a grade of at
least 10 would pass.
Decree-Law of 1944 – Re-establishes the national exams system with both written and oral
tests on each subject. In each high school the headmaster would nominate teachers who would
write the tests.
Students’ school performance was always bad and the number of students failing the exams
was always extremely high. It got to the point that the Ministry of Education determined that
written exam exclusions could not be over 30% of the total for each subject. This is how it was
in 1939. The exams that exceeded this limitation were once again reviewed and graded as to
satisfy that parameter, in which the students who had been previously approved also benefited
(Carvalho, 2010, p. 343).
During the years before Pires de Lima Reform, the primary purpose of testing was the
individual selection and diagnosis and, to lesser extent, evaluation of programs. Beginning in
the 1950s, national exams took on a new role, that of monitoring the performance of the
educational system.

23
2.2 An outline of exams legislation from 1947 to 2005
This five-decade period (1947-2005) witnessed major changes in national assessment: changes
in the nature of the exams, the delineation of the tested populations, the reporting scores, and the
use of test scores. The implementation of new forms of assessment can be interpreted and
understood from a variety of perspectives. One way is through the analysis of legislation.
In the following legislation digest, the selection and interpretation of the most important
High School and Technical Education legislation changes are supported by the analysis of
certain aspects like study plans, structure and type of exams and their implementation.
Decree nr. 36,507, D.G. nr. 216, September 17, 1947 – High School educational reform of
Fernando Andrade Pires de Lima. The urgent need for a reform of the high school teaching is
acknowledged. The 1947 high school teaching reform brings back the curricular plans of before
1936. The General Course is now five years once again – 1st Cycle (two years,) followed by the
2nd Cycle (three years – with nine subjects), in a class regime, as it can be read on the preamble
of point 11, “in the General Course the teaching regime cannot be class based, as mentioned
before, meaning the coordination of all the several subjects to achieve general knowledge and
preparation for life, independent of the kind of activity each student is destined to do.” There are
24 weekly classes, four sessions and around six hours of Mocidade Portuguesa3 activities. High
school takes each student the same time as 34 classes, weekly. Female students still had to add
two sessions of handicrafts (Almeida, 1955a). A student of the General Course would do written
and oral exams in Physics and Chemistry (the student would be exempt from the oral exams if
their average grade was equal or above 16) and he or she would be able to complete the 2nd
cycle with one failing grade in each section (Humanities and Sciences,) although they would not
be allowed to register for the 6th grade, as that was only possible for students with a single
failing grade. The Complementary Course (two years,) that was split into “Humanities” and
“Sciences,” was based on a subject regime and had the Latin subject eliminated. The students of
the 3rd cycle had to do practical, written, and oral tests as part of the Physics and Chemistry
exam. They could repeat the exam for one subject in October. The study plan prescribed three
weekly time slots for this subject, which was later expanded to four. The practical assignments
were moved from the 2nd to the 3rd year, which led to a reduction from three to two years and
3 Portuguese Youth, was a government mandated youth organisation for all Portuguese youth between
the ages of 7 and 14, and voluntary until the age of 25.

24
less practical assignments, with a single weekly time slot. There was an innovation on the
practical exam, the random draw before the test, which would determine if the practical test was
on Physics or Chemistry. This led to situations like the one of “a student who, by luck of the
draw, had a Chemistry practical exam. The test was comprised of the identification of acids and
bases, and neutralization. Ten minutes into the test, the student called me and asked if there was
any chance of getting another test. When faced with a negative answer he stated he would quit
as he had only studied the Physics practical assignments” (Carmo, 1960a). Note the following
facts regarding the examination of external students: a) “doomed” students in public schools are
allowed to transfer to private schools up until the end of the Easter holidays, with the possibility
of applying to exam as external students; b) students are permitted to transfer between the
different modes of private teaching which typically are only done from a school setting to
private tutoring or home schooling, until the end of May; c) High Schools’ areas of influence
are abolished, which allowed private schools to present their students to exam at any high
school, as long as they had previously registered there the corresponding diplomas. “And thus
the belief in miracles is encouraged: in less than two months, private schools transform students
that had shown their inaptitude in public schools throughout the year in able students” (Soares,
1955). On the other hand, in the technical schools one could find courses in the Services,
Feminine Education, Industry, and Arts. The legislation allowed a student that had passed the
2nd year of high school to do the preparatory cycle exam of the technical schools and enrol in
its professional training courses (article 50.) At the same time, a student who had passed the 2nd
year of the preparatory cycle of the technical schools could be admitted to the 1st cycle exam of
High Schools (High School Statute, article 472) (Almeida, 1955b). The minister nominated
every year a group of teachers amongst the most renowned to write the exams for the different
subjects. When they were done, the tests were composed and printed under the most rigorous
secrecy and unrelenting surveillance, and then distributed to all the High Schools in the country
with the due care.
Decree nr. 36,508, D.G. nr. 216, September 17, 1947 – Statute of High School teaching.
Notice nr. 1,418, D.G. nr. 231, Series I, October 4, 1947 – In it the curricula for the subjects
of the new General Course to be used in the school year of 1947-48 are published. It is stated
that it was not possible to change the existing curricula but hopefully this would be done in the
first half of the starting school year. On the other hand, the curricula from 1936 (DG nr. 27,085
from 14/10/1936) were still in place for the 6th and 7th grades. At the end of the 2nd cycle the
national exams focused on the transitional curriculum, even though the students had not started
the curriculum by the 3rd year and with late clarifications, as the one from February 7, 1948.
25
The transitional regime created the so-called “stuck” of the Pires de Lima Reform – the
emancipated of-age students that having applied for the 2nd cycle exam (6th grade) in 1949,
failed two or more subjects. Even more interesting than the clarification request (sent by the
Liceu de Portalegre and found in book 31, nr. 345) is the fact that Notice nr. 1608, from
September 16, 1949, is issued to solve the matter.
Notice nr. 1,452, D.G. nr. 296, Series I, December 22, 1947 – Clarifications to the transitory
curriculum of the 3rd year of Physical and Chemical Sciences. This kind of clarification was
only issued for this subject due to its complexity and specificity. It imposes a method of
teaching based almost exclusively on experiments, with a minimal use of math, and very simple
exercises, almost exclusively limited to “The Rule of Three.” In Physics, activities regarding
movement and densities were deemed forbidden if they were not direct applications of the
formulae taught in the curriculum. In Chemistry it is stated that one cannot go beyond the
classification of chemical phenomena, and that the teaching of Chemistry should be, essentially,
based on experiments and inductive learning. It is added that most of the time dedicated to
Chemistry should be used in experimental demonstrations, so that the students could draw from
them the appropriate conclusions.
Notice nr. 1,464, D.G. nr. 31, Series I, February 7, 1948 – Clarifications regarding the 4th
and 5th grade curricula for Physical and Chemical Sciences. In it, the considerations of the
previous notice are repeated due to the fact that the Physical-Chemical Sciences curricula for the
3rd and 4th grades are completely new, and also due to the adaptation to the constitution of the
current 2nd cycle. Another critique was the lack of coordination between the teaching of
Physics and Mathematics in the 3rd cycle – “Faced with the incoordination of these two
subjects, how can a Physics teacher demand that the student solves certain exercises that require
the application of the mentioned knowledge?” (Carmo, 1960b), a situation that stayed
unchanged up until 2005!
Decree nr. 37,029, D.G. nr. 198, August 25, 1948 – Reform of the Industrial and
Commercial Professional Teaching. Some examples of these courses are: Training Course for
Metal Workers; Electricians; Carpenters and Woodworkers; Ceramists; Feminine Education
Course (lasting four or three years, depending on the acceptance or not for Primary Teaching,
Embroidery;) Commerce General Course; Preparatory Sections for the Industrial and
Commercial Institutes; Specialization Courses in Automobile Mechanics, Construction
Draftsman and Seamstress. These courses did not have direct access to University, the graduates
were technicians and their working life waited. Later on, articles 307 and 325 were altered
26
respectively by the decrees 37,212, D.G. nr. 288, December 13, 1948, and 37,223, D.G. nr. 294,
December 20, 1948.
Decree nr. 37,112, D.G. nr. 241, Series I, October 22, 1948 – New curricula for High School
teaching, General and Complementary Courses, introducing simplifications that allow the
curricula to adapt to the receptive capacity of the students, and to show not what they should
learn but what they could learn at the age they attended the first five years of High School. It
was enforced on October 1, 1950, keeping the 1936 curricula for the subjects in the transitory
regime.
Decree nr. 39,807, D.G. nr. 198, Series I, September 7, 1954 – Changes to the new High
School curricula, and indication of the official textbooks. In the Physical-Chemical Sciences
specifically, these changes attempted to address the disagreement expressed by several teachers
at the time of the annual reports (Teachers Reports, DGEL Found, AHME, nº 2086
(1947/1948), box nº 2/101; nº 1860 (1947/1948), box nº 2/107; nº 1876 (1950/1951), box
nº12/621; nº 1877(1951/1952), box nº 14/758) or in magazines such as Labor (Teixeira, 1951c),
due to the extension of the curricula, especially on the 5th grade of Physics, as well as in 7th
grade of Physics and Chemistry. There were also several condemnations due to the existence of
only seventeen compulsory Physics assignments (eight in the 6th grade and nine in the 7th
grade) (Carmo, 1959).
Decree nr. 41,192, D.G. nr. 162, Series I, July 18, 1957 – Besides regulating the enrolment
of students in the several modes of private teaching, it allows the execution of national exams in
private institutions with the appropriate ministerial authorization. Upon analysing the exam
roster of a Lisbon high school one will notice that the majority of students coming from private
schools failed the practical exam due to lack of preparation, no knowledge of the labs, and being
in the presence of unfamiliar teachers. On the other hand, there was a lot of criticism regarding
the design of the national exams (Almeida, 1952).
Ministerial Order from August 17, 1963 – This order enforced the following rules for the
writing of the topics for the High School or High School Admission Written Exams:
a) considering the proposal of the High School Teaching Inspection, every year the Minister
will appoint two teachers for each group, of which one is a methodologist, meant to be in charge
of the preparation of the topics for the exam;
27
b) The non-methodologist teachers will do a project of topics to be delivered to the
methodologist teachers who in turn create a supported written opinion, and propose all the
changes deemed necessary;
c) The project and the proposed changes, along with the corresponding written opinion, are
studied by the Inspection. They will then be the subjects of a discussion, in one or more
meetings where the presiding Head-Inspector, the Inspector of the corresponding or similar
group, and the two teachers will take part. The final decision is the responsibility of the
Inspection. In the topics aimed at the High School admission exams a Primary Teaching
Inspector, nominated by the appropriate General Directorate, will also be involved;
d) The whole process of writing topics should be done in a cautious and ponderate manner so
that they absolutely respect the letter and spirit of the law, namely articles 263, nr. 1, 485, and
486 of the Statute of High School teaching, and the instructions that might be issued with
ministerial approval. The methodologist teacher, upon receiving the topics, should answer them
as if he was an examinee, and in his written opinion should note the conclusions from this
experience, taking into account the obvious difference in constraints, namely the time it takes;
e) The review of the typographical proofs will be done with the same ponderation and
caution, as stated in the article 482 of the Statute, by the teachers on duty, according to what is
stated in the article 176, nr. 1 and 2, of the same Statute, under the oversight and responsibility
of the High School Teaching Inspector that participated in the appreciation of those points; f)
The schedule will be announced in a timely manner, following the proposal of the High School
Teaching Inspection; g) The teachers in charge of the topic preparation will have a copy of this
Ministerial Order and of the instructions mentioned above in point d) (Ministério da Educação
Nacional, 1963).
Decree nr. 46,136, D.G. nr. 305, Series I, December 31, 1964, p. 1972 – Creates, in a
dependence of the Instituto de Meios Audiovisuais do Ensino (IMAE, Institute of Audiovisual
Media for Teaching,) a Tele-school aimed at broadcasting radio and television school courses.
The educational part of the original program established that the televised teaching should
follow an equivalent curriculum to the preparatory cycle of technical teaching, with the addition
of French.
Ordinance nr. 21,112, D.G. nr. 40, Series I, February 17, 1965, p. 187 – Determines that
Tele-school, created by Decree nr. 46,136, offers a support course for the adult education
courses.

28
Ordinance nr. 21,358, June 26, 1965, Series I, nr. 140, p. 874 MEN – Designates as
“Comprehensive Tele-school Course,” to be taught in tele-school and followed up in reception
posts, the course formed by the subjects included in the preparatory cycle of the technical-
professional teaching, with the addition of French, as established in Ordinance nr. 21,113.
Ordinance nr. 22,113, July 12, 1966, Series I, nr. 160, p. 1244 – Introduces changes to the
Comprehensive Tele-school Course regime, created by Ordinance nr. 21,113, in accordance
with what is determined in Decrees nr. 46,135 and 46,136.
Decree nr. 47,480, January 2, 1967, Series I, nr. 1, p. 1 – Creates the preparatory cycle of
secondary education, which replaces both the 1st cycle of High School and the preparatory
cycle of technical-professional teaching. The Preparatory Cycle of Secondary Education is two-
years long (5th and 6th class) and is common to both high schools and technical schools. The
admission exams (to high schools and technical schools) are eliminated, allowing the expansion
of all secondary education. The two modes now have identical structures but remain as two
separate paths. In high schools there were little changes. Technical schools, on the other hand,
went through a true revolution: the general courses are now reduced to three years, and two-year
long complementary technical courses are created, similar to the high school complementary
courses. They were composed of five subject sets formed by the following subjects (the weekly
load in hours is indicated in parenthesis): set A – Native Language (5), History and Geography
(3), and Moral and Religion ( 2); set B – Mathematics (3), and Natural Sciences (3); set C –
Drawing (3), and Handicrafts (2); set D –Musical Education (2), and Physical Education (2); set
E – French or English (3). Passing the 2nd year of the preparatory cycle allows enrolment in
either High School or in a Technical-Professional School, per the terms determined by each of
these paths.
Ordinance nr. 22,643, April 21, 1967, Series I nr. 95, p. 781 – Establishes the final exam
regime for the Comprehensive Tele-school Course. The final exams would happen in a single
season and comprised of written and oral exams in Native Language and French and written
exams in National History, Geographic and Natural Sciences, and Mathematics. The exams
were graded by a single jury, in conference, presided by the Director of Tele-school and
comprised of Tele-school teachers. The final grade was calculated through arithmetic average.
Decree nr. 48,038, November 16, 1967, Series I, nr. 267, p. 2019 – Changes the writing of
article 4 of Decree nr. 36,507 establishing the high school education reform, launching the study
plan for the 1st cycle.
29
Decree nr. 48,572, D.G. nr. 213 Supplement, Series I, September 9, 1968, p. 1343 –
Approves the Statute of the Preparatory Cycle of Secondary Education and, in Ordinance nr.
23,601, from September 9, 1968, the curricula for several subjects are published. Ordinance nr.
23,600 creates the preparatory schools of secondary education, determines the denomination
and roster of the faculty, administrative and minor staff for those schools, and defines certain
special provisionally applicable regimes in the first phase of operation.
Presidency of the Council, D.G. nr. 27, Series I, February 1, 1969, p. 113 – Declaration of
rectification of the Statute of the Preparatory Cycle of Secondary Education, approved by
Decree nr. 48,572, so that the final grade is the rounded average of the term grades.
Decree nr. 49,067, D.G. nr. 142, Series I, June 19, 1969, p. 692 – Introduces instructions
aimed at changing the doctrine of article 11, and nr. 1 and 2 of article 15 of Decree nr. 40,591
that changes the services of High School exams. It basically granted exemption from oral exams
for any 3rd year subject to examinees that had a grade of at least 14 on the written exam. On the
other hand, students of the 2nd cycle who passed both sections but with an average lower than
9.5 in a subject would be able to proceed with their studies, as long as that average didn’t apply
both to Portuguese and Mathematics subjects. The indicated average results from the grades of
the written and oral exams for each subject.
Ordinance nr. 24,155, D.G. nr. 153, Series I, July 2, 1969, p. 780 – Creates the transition
exams in the preparatory cycle of secondary education aimed at those students that had
undergone studies of any nature, in Portugal or abroad, which the law did not consider
equivalent to the ones in this cycle and wished to enrol in it.
Decree nr. 49,117, D.G. nr. 160, Series I, July 10, 1969, p. 824 – Introduces changes to
article 554 of Decree nr. 36,508 that approves the Statute of High School Teaching. With a
single article, it allowed the National Board of Education to have powers to establish the
equivalence of knowledge obtained in any given Portuguese school to any year or High School
major, to allow students to continue their studies.
Decree nr. 49,258, D.G. nr. 224, Series I, September 24, 1969, p. 1290 – Introduces changes
to articles 482 and 484 of Decree nr. 37,029, which establish the Statue of Industrial and
Commercial Professional Teaching.
Decree nr. 28, D.G. nr. 12, Series I, January 15, 1970, p. 73 – Presents some changes to the
technical and professional teaching regulations, to point 2 of article 149 of Decree nr. 37,029,
and to article 3 of Decree nr. 47,592.
30
Decree nr. 303, D.G. nr. 149, Series I, June 29, 1970, p. 843 – Introduces changes in
regulations regarding the candidates to teaching positions in all three branches of secondary
education.
Decree nr. 439, D.G. nr. 215, Series I, September 16, 1970, p. 1326 – Simplifies the
admission exams to industrial and commercial institutes taken by applicants that have the
required school qualification. The exams, for each subject, consisted of a written test and the
examinees would pass if they achieved, considering all the exams, an average grade of 10 and
had no grades under 8.
Decree nr. 555, D.G. nr. 264, Series I, November 13, 1970, p. 1709 – Changes point nr. 2 of
article 93 of Decree nr. 36,508, from September 17, 1947, which approved the Statute of High
School Teaching.
Law nr. 5, D.G. nr. 173, Series I, July 25, 1973, p. 1315 – Reform of Veiga Simão. In it the
basics that should rule the reform of the educational system are defined, and its goal is to
democratize learning. Still, due to the restraints consequent of the ruling regime, its only
remaining merit was that it initiated the education mobilization process of the 1970s (Stöer,
1986, p. 259). The main innovations were: creation of an official Pre-school Education;
lowering of the entering age for primary school; extension of compulsory schooling to eight
years (the compulsory basic schooling was comprised by primary and preparatory schools
lasting four years each;) changes to secondary education, adding a year to it; creation of post-
graduate courses and structuring of continuing education. School grading is now done at the end
of each phase, eliminating the possibility of failing at the end of the 1st or 3rd grade. The 5th
and 6th grades, integrated in compulsory schooling, are organized in three branches (primary
complementary cycle, direct preparatory teaching, and TV preparatory teaching.) All contribute
to broaden the student body, as many had serious economic difficulties, and to make use of the
available resources.
From 1974 there were no more admission exams to Higher Education. This situation did not
deserve, in due time, any position from this Minister regarding its pedagogical value or its
social-cultural repercussions, and only in May 30th will there be a decree setting the access
conditions to Higher Education.
The main measures taken after the Revolution of April 25th 1974 regarding Education were:
a) the elimination of the subject of Political and Administrative Organization of the Nation, with
political contents from the previous regime, and replaced it with Introduction to Politics; b) the
extinction of the commercial and industrial education associated with a model set on the
31
reproduction of social inequalities; c) unification of secondary education; d) “introduction of an
interdisciplinary area of Civic and Polytechnic Education in the curricula of the comprehensive
education and of the Student Civic Service as a condition to access university” (Mendes, 2004).
Decree nr. 270, D.G. nr. 124, Series I, May 30, 1975, p. 752 – Creates a national service
named “Student Civic Service.” It was a vestibular year for admission to college; it consisted of
community service activities with the goal of creating socially productive work habits in the
students in a global program to rebuild the country.
“Supposedly in effect for three school years, the Student Civic Service actually just
happened in the 1974/5 and 1975/6 school years. It was completed, in its Year One, when it was
optional, by 8,758 students, and in its Year Two, when it was compulsory, by less than 11,814
students. The path of the Student Civic Service expresses the combination of material, resource
and idea constraints in the field of social experimentation as well as the rhythms and
contradictions of the democratization process in Portugal” (L. Oliveira, 2004, p. 2).
Ordinance nr. 535, D.G. nr. 202, Series I, September 2, 1975 – Defines the courses and
syllabi to be taught in secondary schools. The 1st General Comprehensive Course is created,
formed by the 7th, 8th, and 9th grades of compulsory schooling. It unifies the high school and
technical paths and presents a common branch in the first two. Besides the common branch, the
9th grade includes a vocational area formed of groups of optional pre-vocational subjects.
Decree nr. 127, D.R. nr. 36, Series I, February 12, 1976 – Keeps the Ministério da Educação
e Investigação Científica, (MEIC, Ministry of Education and Scientific Research) as the
superior authority responsible for the Student Civic Service in the school year of 1975-76. Later
on there were some changes to the Student Civic Service: in Decree nr. 270/75, from May 30,
and in Decree nr. 455/76, from June 8, D.R. 134, as a way to supply students enrolled in the
Student Civic Service with a stipend to cover basic needs of food, lodging and transportation, as
well as in Decree nr. 536/76, July 8, D.R. 158, which imposes the approval of the disciplinary
statute of the Student Civic Service, according to an ordinance from MEIC.
The access grade to higher education was calculated as follows: 50% was the grade of the
scientific and cultural level university access exam and the remaining 50% were divided into 5
parts regarding the General Course and Complementary Course of secondary education grades
and also the exam grades of two core subjects.
The terms of access to higher education imposed, in addition to enrolment in the Student
Civic Service, the following:

32
a) A passing grade in six subjects of the High School Complementary Course, of which two
had to be the core subjects corresponding to the exams to be taken; or to have passed the
Complementary Course of the Technical Secondary Education appropriate for the degree they
wished to attend, according to the table attached to Dispatch n. 14/76 from the Secretary of State
for Higher Education, published in the 2nd Series of the Diário da República (Diary of the
Republic) n. 221 from September 20, 1967;
b) A passing grade on the higher education access exams. These exams included a
Portuguese test and a test for assessing the scientific and cultural level of the candidates, with
two written tests, each dealing with one of the core subjects that could be: Natural Sciences,
English, History, Latin, Mathematics, German, Physical- Chemical Sciences, Drawing,
Philosophy, Geography, Portuguese, and French. There were no oral exams and the written
exams took 120 minutes, with the exception of the Drawing exam which lasted 180 minutes;
c) The elaboration of the tests was based on a structure with optional questions since the
syllabi taught to the examinees were different and the secondary qualifications, although
equivalent, could differ;
d) The written exams taken between July 27 and 30, 1977 were graded by a national jury
formed by an ensemble of teachers selected by the public schools. The grades were made public
two months later at the schools in the district capitals where the examinees took their exams;
e) The examinees could not have a grade lower than 10 in the Portuguese exam in order to
apply to higher education. Achieving a grade above 10, either in the Portuguese exam or the
scientific and cultural level assessing exam did not automatically guarantee admission to higher
education.
Decree nr. 397, D.R. nr. 216, September 17, 1977 – Regulates admission to college, in
accordance to the legal rules of the official college admissions in the school year of 1977/78,
mentioned in ordinances 81/77 (published in Series II of DR (Diary of the Republic) on March
8) and 127/77 (published in Series II of DR (Diary of the Republic) on May 17).
Decree nr. 491, D.R. nr. 271, November 23, 1977 – Starting on the 1977-78 school year, it
nationally implements the Propaedeutic Year. The Propaedeutic Year was composed of five
subjects, two of which are compulsory (Portuguese and a foreign language). “The
announcement of the creation of the Propaedeutic Year followed a campaign launched by
several political forces in mid-1976 against the Student Civic Service, at the time considered by
those political forces as an appeal and a swindle” (Redacção, 1977, p. 10).

33
This Decree sets a five subject study plan for access to each major in higher education: a)
Portuguese; b) two nuclear subjects for each major; c) a subject complementary to the nuclear
subjects, deemed essential to the education of the student; d) an optional subject corresponding
to one foreign language. Portuguese is replaced by one of the subjects mentioned in point c) for
the students that have Portuguese as a nuclear subject. For the students that have the optional
foreign language subjects as nuclear, the subject in point d) is replaced by another
complementary subject.
Attending the Propaedeutic Year and passing all the subjects were requirements to enrol in
public higher education. Only students that had completed the complementary course of
secondary school or had an appropriate official equivalent, according to the law, could enrol in
the Propaedeutic Year. However, candidates missing a single subject to complete the
complementary course of secondary school would be allowed to enrol. The Conselho
Orientador (Guidance Council) and the Comissão Pedagógico-Científica (Scientific and
Pedagogical Commission) assured the organization and operation of the Propaedeutic Year, the
logistic and administrative support was provided by the Serviço de Apoio ao Ano Propedêutico
(SAAP, Propaedeutic Year Support Service).
The Propaedeutic Year brought to light some of the shortcomings of our educational system.
Over 27,000 students suffered from the bad reception, in several regions, of the programs
broadcast by the second channel of RTP, and added trouble with some subjects particularly hard
to be taught at a distance (mainly Drawing). The final results showed that of the 27,000 enrolled
students, only around 4,500 passed (Redacção, 1978, p. 10). Since there were 12,000 open spots
for higher education, there was a second round where all the students that fulfilled the following
criteria were approved:
- A total of 32 in the sum of the grades achieved in the four exams of the core subjects or in
the sum of the grades achieved in the exams of the subjects to be indicated in point 2;
- A grade of 4 on each exam for every subject the examinee was enrolled for;
- A grade of 10 in the sum divided by two of the average grade of the Propaedeutic and
complementary cycle subjects (NAP+ MDN).
Numerus Clausus (which will determine each year how many students are allowed to enrol
in the 1st year of each college degree) are also introduced that year through Ordinance nr. 634-
A, D.R. nº 230 – Supplement, October 4, 1977.

34
Normative Order nr. 140-A, D.R. nr. 141 – Supplement, June 22, 1978 – Defines the
structure and determines the curriculum of the complementary courses for the 1978-1979 school
year. The 8th and 9th grade of the Comprehensive General Course are created as part of
secondary education. The complementary course of the unified teaching is organized in five
study areas, which integrate a common branch of subjects, a component of specialized training,
and a component of vocational training. The complementary course (10th and 11th grades),
created in continuity of the general course, essentially aimed to ensure vocational training in the
chosen area as a continuation of education. Some changes are added later on, through
Ordinance nr. 400/78, from July 21, D.R. nr. 166, and in Normative Order nr. 168/78, from July
31, D.R. nr. 174.
Ordinance nr. 333, D.R. nr. 141, June 22, 1978 – Aims to adapt the regime for knowledge
assessment on the Propaedeutic Year to the specific situation of students residing in Macau.
Ordinance nr. 660, D.R. nr. 262, November 14, 1978 – Exceptionally establishes new
conditions to pass students who, in the school year of 1977-1978, took exams of the
Propaedeutic Year, and sets the terms in which they will be admitted for enrolment in college.
Ordinance nr. 455, D.R. nr. 193, August 22, 1979, p. 2044 – Creates a supplemental exam
season for the Propaedeutic Year (appeal season).
Ordinance nr. 572, D.R. nr. 252 Supplement, October 31, 1979, p. 2774 – Approves the
curricula for primary and preparatory education, and for the 7th and 8th grades of the secondary
general course.
Ordinance nr. 128, D.R. nr. 71, March 25, 1980 – Establishes regulations regarding ad hoc
exams to obtain credit for other studies.
Decree nr. 240, D.R. nr. 165, July 19, 1980 – Following Ordinance nr. 414, D.R. nr. 184,
August 10, 1979, p. 1875, this Decree creates the 12th grade and eliminates the Propaedeutic
Year. The 12th grade was created with the goal of being both the ending cycle of High School
and a vestibular year for college education application. It is structured in two paths: the
academic path, aimed at college application, and the professional path, which will also be
appropriate for application to a superior polytechnic school.
Ordinance nr. 537, D.R. nr. 191, August 29, 1980 – Revokes point 6 of Ordinance nr.
455/79, from July 26 (Propaedeutic Year exams).
35
Ordinance nr. 559, D.R. nr. 203, September 3, 1980 – Establishes the terms of access to
college as well as the rules for the application, enrolment and placement in college for all the
students who have the appropriate requisites.
Ordinance nr. 578, D.R. nr. 206, September 6, 1980 – Determines the number of available
spots for application to enrolment in the first year of college for the school year of 1980-1981
(numerus clausus.)
Ordinance nr. 799, D.R. nr. 232, October 7, 1980 – Exceptionally passes, in the
Propaedeutic Year, students that only satisfied the minimum passing requirement for the nuclear
and complementary subjects of a set, for college access.
Ordinance nr. 928, D.R. nr. 254, November 4, 1980 – Establishes precedence between high
school complementary course subjects and 12th grade subjects.
Ordinance nr. 520, D.R. nr. 114, June 26, 1981 – Establishes the terms of access to college
as well as the rules for the application, enrolment and placement in college. It will be changed
later by Ordinance nr. 811/81, D.R. nr. 215, from September 18, 1981.
Ordinance nr. 684, D.R. nr. 183, August 11, 1981 – Establishes rules regarding the general
structure and access conditions to 12th grade. There was a high failing percentage in 11th and
12th grades during the 1980/1981 school year, even after the change in the grading criteria for
the 11th grade exams. In the Physics exam, 1st call of 12th grade, there were around 53% of
failing students. (Rosado, 1982, p. 4) This Ordinance would later on be changed by Ordinance
nr. 824/82, from August 30, D.R. nr. 200, p. 254, which introduced rules for application and
enrolment in colleges, regarding students with special conditions.
Ordinance nr. 825, D.R. nr. 200, August 30, 1982, p. 2547 – Changes Appendixes I and II of
Ordinance nr. 530/82, from May 28, which regulates the terms of application to enrolment in
college. It also regulates the terms for re-entry, changing majors, and transfer between colleges.
Normative Order nr. 194-A, D.R. nr. 243, Series I, October 21, 1983 – Creates technical-
professional and professional courses to be taught after the 9th grade and sets organization and
operation standards for those courses. These courses lasted three years, corresponding to the
10th, 11th, and 12th grade, and they offered a secondary studies completion diploma, which
allowed continuing studies in college, and technical-professional training diplomas to start their
working life. There are now four different types of courses in secondary school: General
Courses (academic ;) Technical-Professional Courses (10th, 11th and 12th grade ;) Professional
Courses (10th grade followed by an internship ;) High School and Technical Complementary
36
Courses, for night school (10th and 11th grade.) This restructuring also includes the teaching of
arts, namely music, dance, theatre, and cinema, in the general modes of the basic, secondary,
and superior schooling. There is an increase of this offer until the year 2000 in secondary
education, not only in the General Courses (group 2 – ARTS,) but also in the courses of the
Specialized Artistic Teaching, Technological Courses, Professional Courses, and in the
Recurrent Education Courses. As a complement to the ’83 legislation, through order
23/ME/1983, it eliminates exams for students of the public schools but keeps them for students
of private and cooperative schools enrolled in institutions with no pedagogical connection. The
continuous grading extends to the secondary school with the school taking charge of the
definition and execution of the internal control mechanisms. The government is responsible for
the external validation of those mechanisms. Actually, a lot changed in a very short period of
time both in schools and their organization, and in their own evaluation, all this without a
corresponding coherent strategy (Jorge, 1996).
Ordinance nr. 21, D.R. nr. 11, January 13, 1984, p. 120 – Adds a point c) to nr. 2 of article 3
of Ordinance nr. 429/80, from July 24, defining regulations regarding extraordinary exams to
determine the capacity to enrol in college.
Ordinance nr. 262/84, from April 24, was published later on and regulated access to higher
education and application to the assessment exam.
Students that completed the 12th grade with a passing grade in the continuous grading
regime in 1982-1983 or 1983-1984 had to take national written assessment exams. For internal
students the grade (G) in each subject was the average of the assessment exam and 3rd term
grades, rounded to the unit. If they were not internal students or had cancelled their enrolment,
the grade in the assessment exam would be the grade of the subject. These and other rules
imposed from 1983-1984 onwards for the 12th grade exam are explained in detail on Teodoro,
Teodoro & Fernandes (1984, p. 127).
Normative Order nr. 71, D.R. nr. 192, August 22, 1986 – Defines an adjustment of the
workload of the complementary courses of secondary school for the school year of 1986-1987.
Law nr. 46, D.R. nr. 237, Series I, October 14, 1986 – Basic Law of the Educational System
– This publication determined the structural reorganization of the educational system, leading to
the extension of compulsory schooling from six to nine years, and the consequent reduction of
secondary education to three years. This Law led to an Educational Reform. In it a universal
basic school, compulsory and free, with the duration of nine years, comprised of three
sequential cycles, is defined. This meant that the 7th, 8th, and 9th grades form the third cycle of
37
this system. Law nr. 115/97, from September 19, and Decree nr. 286/89, from August 29, later
on altered it and defined a curricular reform for the basic and secondary schools starting in the
1989/90 school year. In the 1996/97 school year, fed what was learnt in the meantime, a project
of participatory reflexion on the curricula of basic school is started and leads to the a guiding
document to a Curricular Reorganization that would be executed in 2001-2002 for the 1st and
2nd cycles, and in 2002-2003 for the 3rd cycle (Beato, 2003).
Ordinance nr. 614, D.R. nr. 204, Series I, September 3, 1988 – Changes Ordinance nr.
429/80, from July 24, which regulates the extraordinary exams to determine the capacity to
enrol in college.
Decree nr. 354, D.R. nr. 236, Series I, October 12, 1988 – Defines the general principles of
access to higher education.
Decree nr. 286, D.R. nr. 198, Series I, August 29, 1989 – Approves the curricular plans for
the basic and secondary cycles. A new organization of the secondary schooling appears with the
Secondary Courses Mainly Aimed at Continuing Studies (CSPOPE) and Secondary Courses
Mainly Aimed at Working Life (CSPOVA,) commonly known as technological courses. Fifty
new professional schools are created, promoted by 95 different entities, to support this new
organization. The total number of enrolled students is 2,688 for the 1989/1990 school year.
Recurring Teaching is also created.
Ordinance nr. 421, D.R. nr. 133, Series I, June 9, 1990 – Introduces an exceptional bonus
aimed at applicants that were not placed in previous years, in the 1990 university application
procedure.
Ordinance nr. 1160, D.R. nr. 275, Series I, November 28, 1990 – Regulates the enrolment
for the 1991 general knowledge assessment exam for college application and its execution.
Ordinance nr. 18, D.R. nr. 7, Series I-B, January 9, 1991 – Regulates point 3 of article 6 of
Law nr. 46/86, from October 14 (Basic Law of the Educational System).
Ordinance nr. 466, D.R. nr. 124, Series I-B, May 31, 1991 – Creates a 2nd call in the special
season of the general knowledge assessment exam for college application. Changes Ordinance
nr. 1160/90, from November 28.
Ordinance nr. 476, D.R. nr. 126, Series I-B, June 3, 1991 – Approves the Regulation for the
Review of the General Knowledge Assessment Exam for College Application in 1991.
38
Decree nr. 379, D.R. nr. 232, Series I-A, October 9 1991 – Changes Decree nr. 354/88, from
October 12, which instituted the new regime for college access.
Normative Order nr. 98-A/92, D.R. nr. 140, Series I-B, June 20 1992 – Revokes Order nr.
162/ME/91, from September 9, published in DR (Diary of the Republic,) 2nd Series, nr. 244,
from October 23, 1991, regulating the grading of students of the basic cycle and separating the
legislation referring to the secondary cycle (Boavida & Barreira, 1992). The evaluation of basic
and secondary education became different after the publication of Order nr. 98-A/92, based on a
common norm, of Order nr. 162/ME/91. This order was in place for nine years and three days
and its great acceptance was due to its design based in the cognitive psychology of learning and
supported by a formative conception of grading, giving complete autonomy to teachers and
schools in matters of grading the students’ learning. It would be altered through Order nr.
30/2001, from June 22, where it is stated that, with the necessary changes and improvements,
the same principles and orientations of its predecessor. Actually, in Order 98-A/92, the grading
of the students of the basic cycle is a necessity derived from the principles and goals defined for
this learning level in article of Law nr. 46/86, from October 14, Basic Law of the Educational
System, which allows to assess, at each moment, their level of achievement. Among those
principles and objectives, and regarding which grading system to adopt, the universality,
obligation, and gratuity of basic school, the responsibility of ensuring a general education,
common to all Portuguese, and the creation of an environment that promotes growth and
academic success to all students, should be highlighted.
Ordinance nr. 341, D.R. nr. 87, Series I-B, April 13, 1992 – Changes the Regulation for the
Review of the General Knowledge Assessment Exam for College Application in 1992,
approved by Ordinance nr. 1171/91, of November 15.
Ordinance nr. 8, D.R. nr. 3, Series I-B, January 5, 1993 – Defines the list of specific exams
for college application in 1993.
Ordinance nr. 243, D.R. nr. 49, Series I-B, 2nd
Supplement, February 27, 1993 – Introduces
some additions to Ordinance nr. 1017/92, from October 29, (sets the subjects and curricula of
the assessment exams to be undertaken by college applicants in 1993).
Ordinance nr. 266-A, D.R. nr. 58, Series I-B, 2nd
Supplement, March 10, 1993 – Approves
the Regulation of the Assessment Exam to be undertaken by the 1993 college applicants.
Ordinance nr. 704, D.R. nr. 176, Series I-B, July 29, 1993 – Amends Ordinance nr. 8/93,
from January 5, which approved the list of specific exams for college application in 1993.
39
Normative Order nr. 338, D.R. nr. 247, Series I-B, October 21, 1993 – Approves the grading
regime for secondary school students. Establishes external grading through exams at the end of
secondary school, affecting the students’ final grade, certification, and access to college and the
external grading can also be influenced by assessment exams whenever deemed necessary. The
national exams at the end of secondary school allowed for external grading for the first time in
approximately 20 years. On the other hand, assessment exams were only regulated in 2000
through Order nr. 5437/2000, from February 18, in which the subjects, the school years, and the
application years of the exams are defined. These exams included all students and were
progressively rolled out to students of the 4th, 6th, and 9th years, following a schedule that
extended to the 2001/2002 school year.
Ordinance nr. 1222, D.R. nr. 273, Series I-B, November 22, 1993 – Defines the subjects and
curricula for the assessment exams to be undertaken by college applicants in 1994.
Ordinance nr. 200, D.R. nr. 80, Series I-B, April 6, 1994 – Approves the list of specific
exams for the school year of 1994.
Normative Order nr. 644-A, D.R. nr. 214, Series I-B, September 15, 1994 – This Order made
some amendments to Order 98-A/92 regarding internal grading to "induce higher equity, justice,
and accuracy in grading the students" (p. 5556-2.) There is a clear attempt to standardize the
criteria for student retention as a way to attenuate the grading divergences verified between
schools, the 9th grade sees the introduction of global exams (Barreira, 2001). Others considered
that the announced measures were more than simple “adjustments” to Normative Order nr. 98-
A/92, instead they were “(...) structural changes that could hurt or pervert fundamental vectors
of the model and consequently its global philosophy” (Machado, 1994, p. 45).
The global exams are created. The schools were entirely responsible for them and they weigh
1/3 of the final grade of the 3rd term of the 9th grade. This way, students that in 1995/1996 and
1996/1997 attended the 8th and the 9th grades, respectively, would have to do global written
exams as a part of their internal grading.
The 8th grade students would only do the Natural Sciences exam. There were no
amendments regarding the assessment exams. The grading and curriculum development were
completely under the control of both teachers and schools.
Ordinance nr. 254, D.R. nr. 161, Series I-B, July 13, 1996 – Sets and publishes the
institution/major pairs and vacancies for the national application process for the public colleges
40
for enrolment in the 1996-1997 school year as referred in point 1 of article 21 of Decree nr. 28-
B/96, from April 4.
Ordinance nr. 254-A, D.R. nr. 161, Series I-B, 1st Supplement, July 13, 1996 – Amends
appendix I of the Regulation of the National Application Process to the Public University
System for Enrolment in the 1996-1997 School Year, approved by Ordinance nr. 241/96, from
July 4.
Normative Order nr. 24-D, D.R. nr. 161, Series I-B, 1st Supplement, July 13,1996 – Sets for
the 1995-1996 school year an exceptional regime for the publication of the final grades of
secondary school for subjects that require a national final exam (adds two points to all final
grades).
Normative Order nr. 45, D.R. nr. 253, Series I-B, October 31, 1996 – Amends Normative
Order nr. 338/93, from October 21 (approves the grading regime for secondary school students).
Normative Order nr. 12, D.R. nr. 55, Series I-B, March 6, 1997 – Approves the Regulation
for Secondary School Exams – general courses and technological courses.
The national exams for the 12th grade were compulsory for internal and external students,
and for self-proposed candidates, and consisted of the final subjects of the 12th grade, according
to the general and specific education components. The exam grade was shown as the achieved
grade rounded to the unit and internal students would pass if they achieved a grade of at least
10, calculated according to what is determined in point 42 of Normative Order nr. 338/93, from
October 21, and in Normative Order nr. 45/96, from October 9. It also revokes Normative
Orders nr. 55/95, from September 19, and nr. 20/96, from May 21.
Decree nr. 229, D.R. nr. 200, Series I-A, August 30, 1997 – Creates the Gabinete de
Avaliação Educacional (GAVE - Office of Educational Assessment), the institution in charge of
the preparation and evaluation of the national exams. Its competences are mainly the external
assessment of the students’ learning and knowledge, and the moments of planning,
conceptualizing, coordination, preparation, validation, and the application and control of the
respective instruments.
Law nr. 115, D.R. nr. 217, Series I-A, September 19, 1997 – Amendments to Law nr. 46/86,
from October 14, (Basic Law of the Educational System.)

41
Ordinance nr. 138, D.R. nr. 53, Series I-B, March 4, 1998 – Sets the list of specific subjects
and of national exams to be used as specific exams for application to college in the 1998-1999
school year.
Normative Order nr. 16, D.R. nr. 61, Series I-B, March 13, 1998 – Approves the Regulation
of Secondary School Exams (General Courses and Technological Courses.) Revokes several
2nd series orders and Normative Order nr. 12/97, from March 6.
Normative Order nr. 15, D.R. nr. 67, Series I-B, March 20, 1999 – Approves the Regulation
of Secondary School Exams. The regulation imposes: a) the preparation of the exam is
responsibility of the Office of Educational Assessment (GAVE); b) the 12th grade exams of the
general and technological courses, established by Decree n. 286/89, focus on a relevant core of
objectives and contents which are the subject of the final exam for each 12th grade subject of
the general and technological courses and of the 12th grade of the academic path; c) exams are
graded between 0 and 200 points, with the final grade expressed on a scale of 0 to 20; d) juries
formed by each school are responsible for the correction and grading of the exams and of the
equivalence to attending exams for each subject.
Normative Order nr. 18, D.R. nr. 65, Series I-B, March 17, 2000 – Approves the Regulation
of Secondary School Exams. Revokes Normative Order nr. 15/99, from March 20.
Decree nr. 6, D.R. nr. 15, Series I-A, January 18, 2001 – Approves the curricular
reorganization of basic school.
Decree nr. 7, D.R. nr. 15, Series I-A, January 18, 2001 – Approves the curricular revision of
secondary school in order to make school a more efficient context for student learning. To bring
this proposal of curricular flexibility to life it is crucial that teachers stop seeing their action as
curricular managers at the subject group level and start cooperating with all other teachers
involved in the education of the same group of students (Barreira, 2002). It is necessary then
that the programming of educational activities, which points to the contextualization of a global
project, like national programs (Pacheco, 1996), be thought of in terms of school, team of
teachers, and school community, instead of in terms of the action of each single teacher. It is in
this context that Normative Order nr. 30/2001 is published, revoking all the previous orders of
basic school assessment, and creating the prescriptive framework for the assessment of basic
and secondary school.
Normative Order nr. 15, D.R. nr. 166, Series I-B, March 19, 2001 – Approves the
Regulation of Secondary School Exams (2000-2001).
42
Normative Order nr. 30, D.R. nr. 166, Series I-B, March 19, 2001, p. 4438 – Sets the
principles and procedures for the assessment of learning in basic school and, simultaneously
revokes all the previous orders regarding basic school grading, creating the framework for
grading in both basic and secondary schools. This legislation tried to tackle the great challenge
of assessing the quality of learning and look for new solutions. This orientation was later on
reverted by Normative Order nr. 1/2005 that, even though similar to the previous text,
introduces changes that destroy the openness defended by Normative Order nr. 30/2001.
Examples of this reversal are: the collection of data on the student named “individual student
process” which is nothing but a bureaucratic and administrative process; on the other hand, it
brought back the 9th grade national exams as an assurance of quality and accuracy. In basic
school, as in secondary school, additive grading is now both internal and external. Once again
the controversy regarding exams at the end of cycles as an assurance of quality and grading
appears. The adoption of this model perfectly illustrates the immutability of the grading system,
an eternal return to the past. A 9th grade student is expected to do five 90-minute written exams,
which were later on reduced to two exams: Portuguese and Mathematics. At the same time
Order 30/2001 identifies the need for schools to clearly show the grading procedures and the
regulated self-assessment as an element of grading to be considered. Contrary to all
expectations, the grading moments multiplied: four grading moments, two qualitative in nature
(Christmas and Easter,) and two quantitative (at the end of the first semester and at the end of
the year;) global exams at the end of the 11th and 12th grade and a final exam of Technological
Aptitude at the end of the technological courses. Considering these facts, teachers continued to
privilege the transmission of knowledge that would be the object of the different exams.
Decree nr. 209, D.R. nr. 240, Series I-A, October 17, 2002 – Amends article 13 and
appendixes I, II, and III of Decree nr. 6/2001, from January 18, which sets the guiding
principles of the organization and curricular management of basic school, as well as the learning
and national curricular development process assessments.
Ordinance nr. 1551, D.R. nr. 298, Series I-B, December 26, 2002 – Makes adjustments to
the study plans for the 1st, 2nd, and 3rd cycles of basic school.
Normative Order nr. 11, D.R. nr. 52, Series I-B, March 3, 2003 – Eliminates the global
exams in secondary school as a mandatory grading instrument.
Normative Order nr. 15, D.R. nr. 81, Series I-B, April 5, 2003 – Approves the Regulation of
Secondary School Exams for 2003.
43
Normative Order nr. 18 500, D.R. nr. 223, Series II, September 26, 2003 – Exam
organization – scheduling.
Normative Order nr. 10, D.R. nr. 52, Series I-B, March 3, 2004 – Approves the Regulation
of Secondary School. Revokes Normative Order nr. 15/2003, from April 5.
Decree nr. 74, D.R. nr. 73, Series I-A, March 26, 2004 – Sets the guiding principles of the
organization and curricular management, as well as the learning assessment, for secondary
school.
Ordinance nr. 550-A/B/C/D/E/2004, D.R. nr. 1119, Series I-B, 1st Supplement, May 21, 2004
– Approves the organizational, functional and grading regime for the secondary school
technological courses. Approves the organizational, functional and grading regime for the
secondary school artistic courses in the realm of visual arts and audio-visuals. Approves the
regime for creation, organization, and management of the curriculum of secondary school
professional courses as well as its learning assessment and certification. Approves the
organizational, functional and grading regime for the secondary school scientific-humanistic
courses. Creates several recurring secondary level education and approves the respective study
plans. Approves the administrative and pedagogical organization, and the grading regimes
applicable to the scientific-humanistic courses, the technological courses, and to the specialized
artistic courses, in the realm of visual arts and audio-visuals, for the recurring secondary school.
Table 2.1 shows a summary of the educational system reforms and the curricular
reorganizations implemented through legislation during these five decades, of which the
organization of Basic and Secondary High School schooling, and the calculation of the weight
the exam grade would have on University access can be highlighted.

44
Table 2.1. Types of teaching/training (continuing education course and technological courses)/calculation of the final grade of Basic and Secondary High
School. Adapted from 50 Years of Educational Statistics – Volume I, 2009, INE & GEPE, Lisbon, p. 10]
School
Year
Basic School/2nd Cycle Secondary School/3rd Cycle Calculation Formula for the Exam Grade/Final
Grade/Application Grade to Higher Education
1950/72 Secondary High School – 2nd
cycle (3 years)
Secondary High School – 3rd cycle (2 years) 1947–1968
Exam Grade – 2nd cycle
50% written exam grade
+
50% oral exam grade (students with a grade not lower than 16 are
exempt from the oral exam; this grade went down to 14 in 55/56);
Exam Grade – 3rd cycle
50% written exam grade (average of the written exam with the
practical assignments, if this grade is lower than 14 the student must
do an oral exam)
+
50% oral exam grade
1968/1969
EG – 2nd and 3rd cycle
50% written exam grade (students with a grade not lower than 14
are exempt from the oral exam)
+
50% oral exam grade
Universities set their own access exams until 1974.
1972/73 Preparatory Basic (experimental
3rd grade);
Secondary High School – 2nd
cycle (3 years)
Secondary High School – 3rd cycle (2 years)
1974/ 75
Preparatory Basic (experimental
3rd and 4th grades);
Secondary High School – General
Course (3 years)
Secondary High School– 3rd cycle (2 years)
1975/76 Preparatory Basic (experimental
4th and 5th grades);
Comprehensive Secondary School
(7th grade);
Secondary High School – General
Course (2 years)
Secondary High School– 3rd cycle (2 years);
Student Civic Service
1976/77 Preparatory Basic (experimental
5th grade);
Comprehensive Secondary School
(7th and 8th grades);
Secondary High School – General
Course (1 year)
Secondary High School – 3rd cycle (2 years);
Student Civic Service
Final Grade of Secondary School:
MCG +(2 MCC) +(2 MDN)NAP
5
2
MCG – Average Grade of the General Course of Secondary School
MCC – Average Grade of the Complementary Course of Secondary
School
MDN – Average Grade of the nuclear subjects of the
Complementary Course of Secondary School
NPA – Grade of the scientific and cultural level university access
exam.

45
1977/78 Comprehensive Secondary School
(7th, 8th, and 9th grades);
Secondary High School – General
Course (night school)
Propaedeutic Year;
Secondary High School– Complementary Course
Final Grade of Secondary School:
MCC+MDN+NAP
2
2
MCC – Average Grade of the Complementary Course of Secondary
School
MDN – Average Grade of the nuclear subjects of the
Complementary Course of Secondary School
NPA – Grade of the Propaedeutic Year, calculated by dividing the
sum of the grades in the nuclear subjects by 4.
1978/79 Comprehensive Secondary School
(7th, 8th, and 9th grades);
Secondary High School – General
Course (night school)
Complementary Secondary (10th grade);
Propaedeutic Year
1979/80 Comprehensive Secondary School
(7th, 8th, and 9th grades);
Secondary High School – General
Course (night school)
Complementary Secondary (10th and 11th grades);
Propaedeutic Year;
Secondary High School– Complementary Course
1980/81 Comprehensive Secondary School
(7th, 8th, and 9th grades);
Secondary High School – General
Course (night school)
Complementary Secondary (10th and 11th grades);
12th Grade;
Secondary High School – Complementary Course
1981/82 Comprehensive Secondary School
(7th, 8th, and 9th grades);
Secondary High School – General
Course (night school)
Complementary Secondary (10th and 11th grades);
12th Grade;
Secondary High School – Complementary Course
(night school)
Final Grade of Secondary School:
10/11 12
2
G G
G10/11 – Average grades of the 10th and 11th grades or MCC;
G 12 – is calculated by:
1 22
3
G G
Where G1 and G2 are the exam grades of the subjects for which the
student obtained the highest grades in the 12th grade.
1983/92 Comprehensive Secondary School
(7th, 8th, and 9th grades);
Secondary High School – General
Course (night school)
Complementary Secondary (10th and 11th grades);
12th Grade – Academic Path;
12th Grade – Professional Path;
Secondary High School – Complementary Course
(night school)
1992/93 Basic – 3rd Cycle (7th grade);
Comprehensive Secondary School
(8th and 9th grades);
Secondary High School – General
Course (night school)
General Courses (experimental);
Technological Courses (experimental);
Complementary Secondary (10th and 11th grades);
12th Grade – Academic Path
12th Grade – Professional Path;
Secondary High School – Complementary Course
(night school)
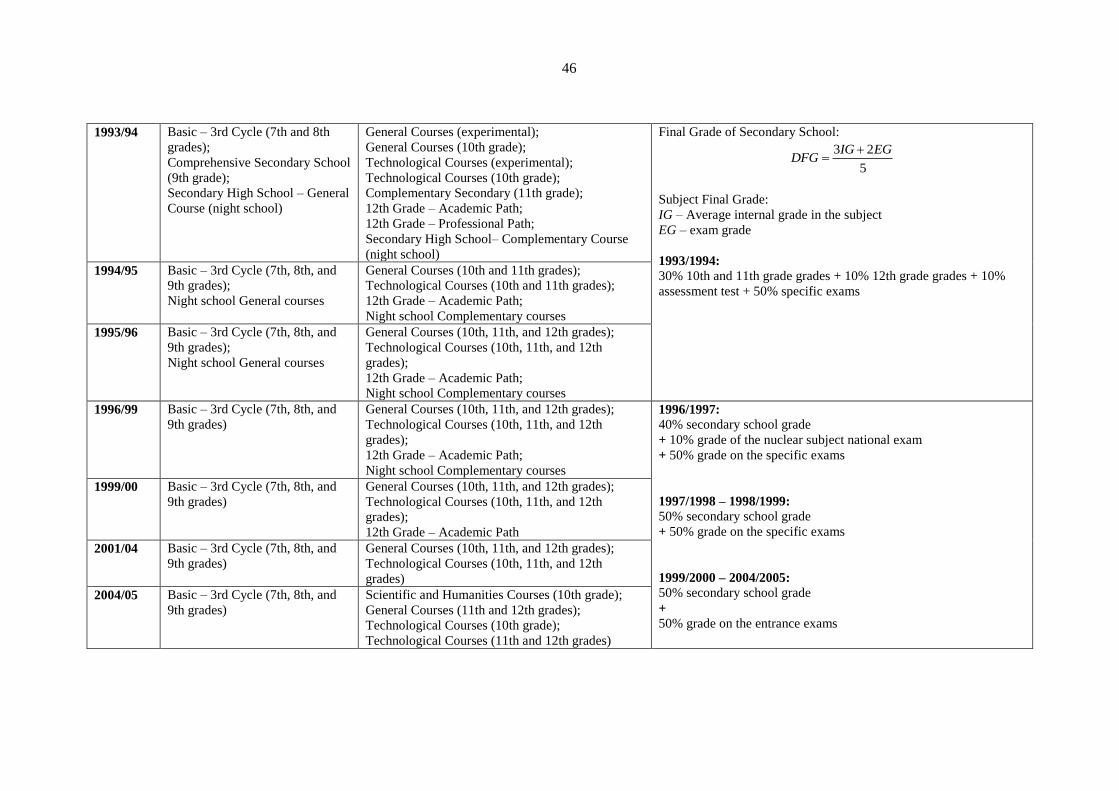
46
1993/94 Basic – 3rd Cycle (7th and 8th
grades);
Comprehensive Secondary School
(9th grade);
Secondary High School – General
Course (night school)
General Courses (experimental);
General Courses (10th grade);
Technological Courses (experimental);
Technological Courses (10th grade);
Complementary Secondary (11th grade);
12th Grade – Academic Path;
12th Grade – Professional Path;
Secondary High School– Complementary Course
(night school)
Final Grade of Secondary School:
3 2
5
IG EGDFG
Subject Final Grade:
IG – Average internal grade in the subject
EG – exam grade
1993/1994:
30% 10th and 11th grade grades + 10% 12th grade grades + 10%
assessment test + 50% specific exams
1994/95 Basic – 3rd Cycle (7th, 8th, and
9th grades);
Night school General courses
General Courses (10th and 11th grades);
Technological Courses (10th and 11th grades);
12th Grade – Academic Path;
Night school Complementary courses
1995/96 Basic – 3rd Cycle (7th, 8th, and
9th grades);
Night school General courses
General Courses (10th, 11th, and 12th grades);
Technological Courses (10th, 11th, and 12th
grades);
12th Grade – Academic Path;
Night school Complementary courses
1996/99
Basic – 3rd Cycle (7th, 8th, and
9th grades)
General Courses (10th, 11th, and 12th grades);
Technological Courses (10th, 11th, and 12th
grades);
12th Grade – Academic Path;
Night school Complementary courses
1996/1997:
40% secondary school grade
+ 10% grade of the nuclear subject national exam
+ 50% grade on the specific exams
1997/1998 – 1998/1999:
50% secondary school grade
+ 50% grade on the specific exams
1999/2000 – 2004/2005:
50% secondary school grade
+
50% grade on the entrance exams
1999/00 Basic – 3rd Cycle (7th, 8th, and
9th grades)
General Courses (10th, 11th, and 12th grades);
Technological Courses (10th, 11th, and 12th
grades);
12th Grade – Academic Path
2001/04
Basic – 3rd Cycle (7th, 8th, and
9th grades)
General Courses (10th, 11th, and 12th grades);
Technological Courses (10th, 11th, and 12th
grades)
2004/05 Basic – 3rd Cycle (7th, 8th, and
9th grades)
Scientific and Humanities Courses (10th grade);
General Courses (11th and 12th grades);
Technological Courses (10th grade);
Technological Courses (11th and 12th grades)
47
This table does not include the exams from technical courses. The introduction of national
exams for high schools in 1950 changed the calculation of the final grades for the 2nd and 3rd
cycles. This change led to a great controversy in the 2nd cycle, mainly due to the absence of lab
exams and the excuse from the oral exam only if a grade above 16 was achieved. The legislation
was changed in 1955 to allow the excuse from the oral exam if a grade above 14 was achieved
and to resize the extensive 2nd cycle Physical and Chemical Sciences curriculum. The lab exam
of the 3rd cycle, abolished in 1968, allowed for some favourable bias in the grading of internal
students, known to the examiners, when compared to the external students. The lab exam could
be either on Chemistry or Physics, and the drawing prior to the exam led to diverging and
inconclusive results.
The Veiga Simão Reform happens, on the one hand, due to the imposition to change the
decontextualized and rigid curricula and, on the other hand, due to the discrimination in the
access to high school education to lower, disadvantaged, classes. It was one of the most
profound reforms in the Portuguese educational system and it led to an increase in literacy and
skills of the Portuguese due to the democratization of access to education, “similarly to other
European countries, where the duration of compulsory schooling was expanded in up to 230%”
(Azevedo, 2000, p. 187). All the students who finished primary education had access to the
“preparatory cycle of secondary school” and, later on, to secondary school or technical courses,
which had become of similar length. The technical courses were aimed at training the student to
enter the work force. Still, the Calculation Formula for the Exam Grade/Final Grade and the
admission exam to University, responsibility of the different Universities, did not undergo any
changes until 1976.
Due to the Revolution of April 25th, 19744, this reform was left unfinished. The 70s were
extremely unstable and spent under a national and international crisis. The explosion in demand
of education supported by policies that tried to solve the increasing unemployment amongst
teenagers, due to the automation of production lines, had profound consequences in a whole
generation. High school and technical courses are unified in 1975 and the Student Civic Service
is created as a palliative for the lack of available seats in University level education. This civic
service encompassed community service activities and concluded with a scientific and cultural
level university access exam. The calculation of the final grade of secondary school was
complex and included not only the exam grade but also the final grades of the 2nd and 3rd
4 Date of the Carnation Revolution, which marked the end of the dictatorship.
48
cycles. Successfully concluding the Student Civic Service did not guarantee access to
University, which led to question the investment around educational and training systems. The
Propaedeutic Year replaced the Student Civic Service in 1977, supplementing the Secondary
High School – Complementary Course. The education of the masses and the return of
Portuguese from the old colonies led to a rupture in the capacity of schools. During the
Propaedeutic Year students would study at home supported by the textbooks published by the
MEIC (Ministry of Education and Scientific Research). It consisted of five classes, two were
compulsory, Portuguese and a foreign language, and the remaining ones, considered core
classes, depended on the University degree chosen. That year also saw the introduction of the
numerus clausus, which determined each year the number of students allowed to enrol on the
1st year of each University degree and is still in place to this day. Secondary school saw the
introduction of continuous assessment and final exams. The Propaedeutic Year was abolished in
1980, and replaced by the 12th grade, which initially included three classes (A. Teodoro, et al.,
1984).
Table 2.1 allows for a better understanding of the changes that happened during this time,
particularly the elimination of final exams for the 10th and 11th grades in 1983, keeping only
the Assessment Exam (Leal, 1991). They were four types of courses in secondary school:
General Courses (Teaching Path); Professional and Technological Courses (10th, 11th, and 12th
grades); Professional Courses (10th grade, followed by an internship); High School and
Technical Complementary Courses, as night school (10th and 11th grades), situation that will
remain unchanged until 2000. There was a common structure to teaching, divided in several
options that allowed for every student to “apply to University, continue their studies, or look for
work” (Azevedo, 2000, p. 207). Compulsory schooling is extended to 9th grade in 1986 and
there was a Curricular Reorganization supported by the Basic Law of the Educational System,
implemented in 2001-2002 for the 1st and 2nd cycles, and in 2002-2003 for the 3rd cycle
(Beato, 2003). Up to 2000 there were several changes to the calculation formula for the final
grade due to the ever-changing number of subjects taught in 12th grade and to the changing
focus on core subjects. However, although there were countless formulas used in the calculation
of the Final Grade of High School/Secondary School, the one from 2000 to 2005 is very similar
to the formula from 1947, with the exception of practical tests.
The interpretation of education legislation can be a fountain of inspiration for reflexions and
help the perception of the dynamics of continuity and ruptures on an educational system.
However, to view the politics of assessment policy as either just another search by politicians
for the magic bullet of education reform, or as their failure to understand the requirements of
49
successful implementation, is to miss a much larger story with implications beyond education
policy.

50
51
3 Literature Review
“Exams can be a means of understanding and promoting the renewal of the
curricula.” (Estrela & Nóvoa, 1983, p. 83)
The development of this chapter is based in two sections:
- a first section including the curricular contents and reforms during these five decades
and their implications in the national exams;
- and a second section which aims to review and synthesize current findings as well as
theoretical and methodological contributions about standard setting methods and
evaluate them according to the guiding concept of items. Psychometric theory and
cognitive analysis present the foundation for this analysis.
The evolution of our society imposes the constant updating of the Sciences curricula. The
updates can be understood through the analysis of the evolution of the national exams. Keeping
in mind the central part national exams have been performing in the design and implementation
of learning and curricula, the analysis of the evolution of the Physics and Chemistry national
exams shows the dynamic implications between the exams (different contents and learning) and
the curricula, in the realm of the curricular reforms that happened in Portugal. This approach
does not aim to show a compilation of the negative moments of the reforms throughout the
decades, but to show that our school system nowadays has a higher demand level, both at the
52
teaching level and the curricular level, highlighting a higher level of competence in abstract
thinking, alongside with the increase of complementary curricular activities.
As it is never too much to highlight, it is not possible to reflect on the exams centring
exclusively around the students and the technical concern of measuring their performance
without keeping in mind the factors in play regarding learning, such as curriculum, cultural
characteristics of the Greater Lisbon area, the organization of the School Community, and the
part the Government plays.
The second section presents a brief summary of the research in this area, exploring the need
to consider several analysis methods of item and test difficulty, followed by a discussion of the
importance of cognitive analysis. The scientific study of the psychopedagogical problems
regarding the evaluation of school knowledge in an exam and contest situation performed in the
last 80 years has allowed the development of theories and methods to estimate the behaviour of
students when faced with the items and the factors that contribute to the item difficulty.
3.1 Exams and curriculum change
The changes that occurred in the exam curricula and structure allowed for a better understanding
of fluctuations in the degree of the exam’s difficulty.
The evolution of our society imposes constant updating of the Science curricula. These
updates can be understood through the analysis of the evolution of national exams since “the
changes in the tests reflect the changes in education, which are a consequence of the evolution
of society”(Patrick, 1996, p. 3).
Keeping in mind the pivotal role that exams perform in formulating and implementing
learning and curricula, one proposes the analysis of the evolution of the national exams in
Physics and Chemistry, showing the dynamic relationship between exams (different content and
learning) and the curricula, within the context of the curricular reforms that happened in
Portugal.
The national exams came out of the Pires de Lima Reform (1947) due to the strong
controversy surrounding the district exams and their wide varying structure and content, making
it impossible to have an unbiased national analysis of the results. During the 1940s Guimarães
(1944) defended that “exams fatefully are what the teaching is, and teaching is what the
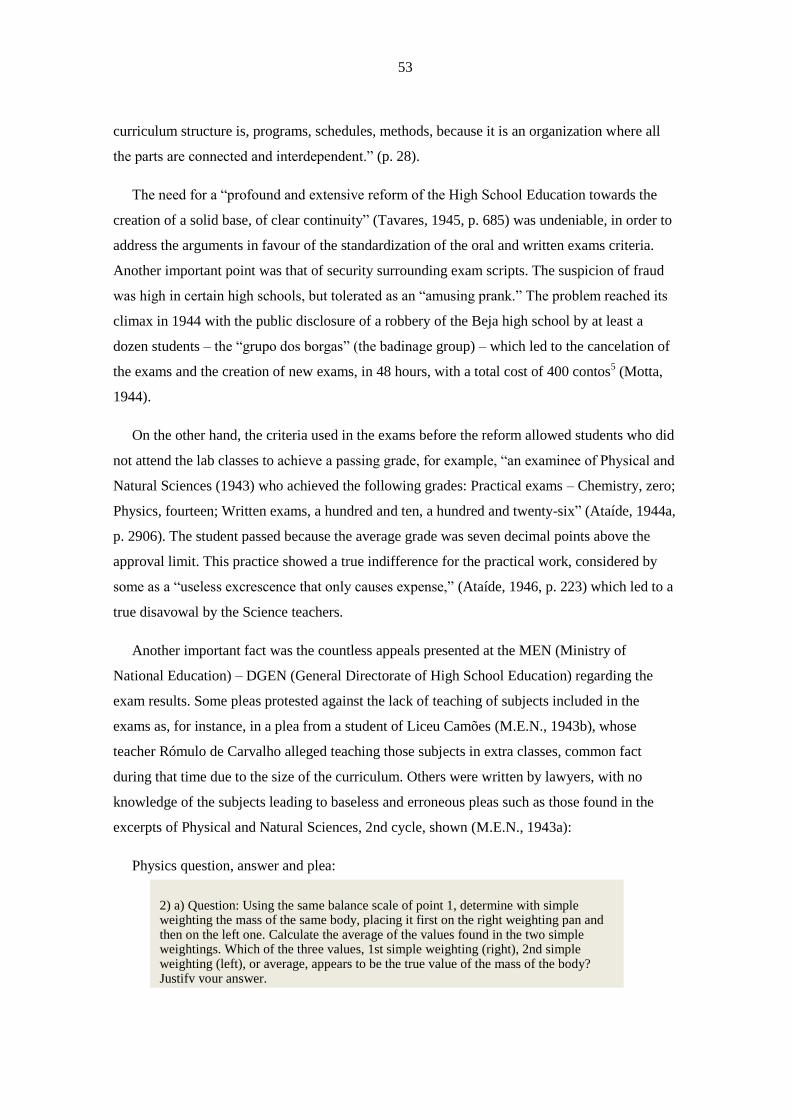
53
curriculum structure is, programs, schedules, methods, because it is an organization where all
the parts are connected and interdependent.” (p. 28).
The need for a “profound and extensive reform of the High School Education towards the
creation of a solid base, of clear continuity” (Tavares, 1945, p. 685) was undeniable, in order to
address the arguments in favour of the standardization of the oral and written exams criteria.
Another important point was that of security surrounding exam scripts. The suspicion of fraud
was high in certain high schools, but tolerated as an “amusing prank.” The problem reached its
climax in 1944 with the public disclosure of a robbery of the Beja high school by at least a
dozen students – the “grupo dos borgas” (the badinage group) – which led to the cancelation of
the exams and the creation of new exams, in 48 hours, with a total cost of 400 contos5 (Motta,
1944).
On the other hand, the criteria used in the exams before the reform allowed students who did
not attend the lab classes to achieve a passing grade, for example, “an examinee of Physical and
Natural Sciences (1943) who achieved the following grades: Practical exams – Chemistry, zero;
Physics, fourteen; Written exams, a hundred and ten, a hundred and twenty-six” (Ataíde, 1944a,
p. 2906). The student passed because the average grade was seven decimal points above the
approval limit. This practice showed a true indifference for the practical work, considered by
some as a “useless excrescence that only causes expense,” (Ataíde, 1946, p. 223) which led to a
true disavowal by the Science teachers.
Another important fact was the countless appeals presented at the MEN (Ministry of
National Education) – DGEN (General Directorate of High School Education) regarding the
exam results. Some pleas protested against the lack of teaching of subjects included in the
exams as, for instance, in a plea from a student of Liceu Camões (M.E.N., 1943b), whose
teacher Rómulo de Carvalho alleged teaching those subjects in extra classes, common fact
during that time due to the size of the curriculum. Others were written by lawyers, with no
knowledge of the subjects leading to baseless and erroneous pleas such as those found in the
excerpts of Physical and Natural Sciences, 2nd cycle, shown (M.E.N., 1943a):
Physics question, answer and plea:
2) a) Question: Using the same balance scale of point 1, determine with simple weighting the mass of the same body, placing it first on the right weighting pan and then on the left one. Calculate the average of the values found in the two simple weightings. Which of the three values, 1st simple weighting (right), 2nd simple weighting (left), or average, appears to be the true value of the mass of the body? Justify your answer.
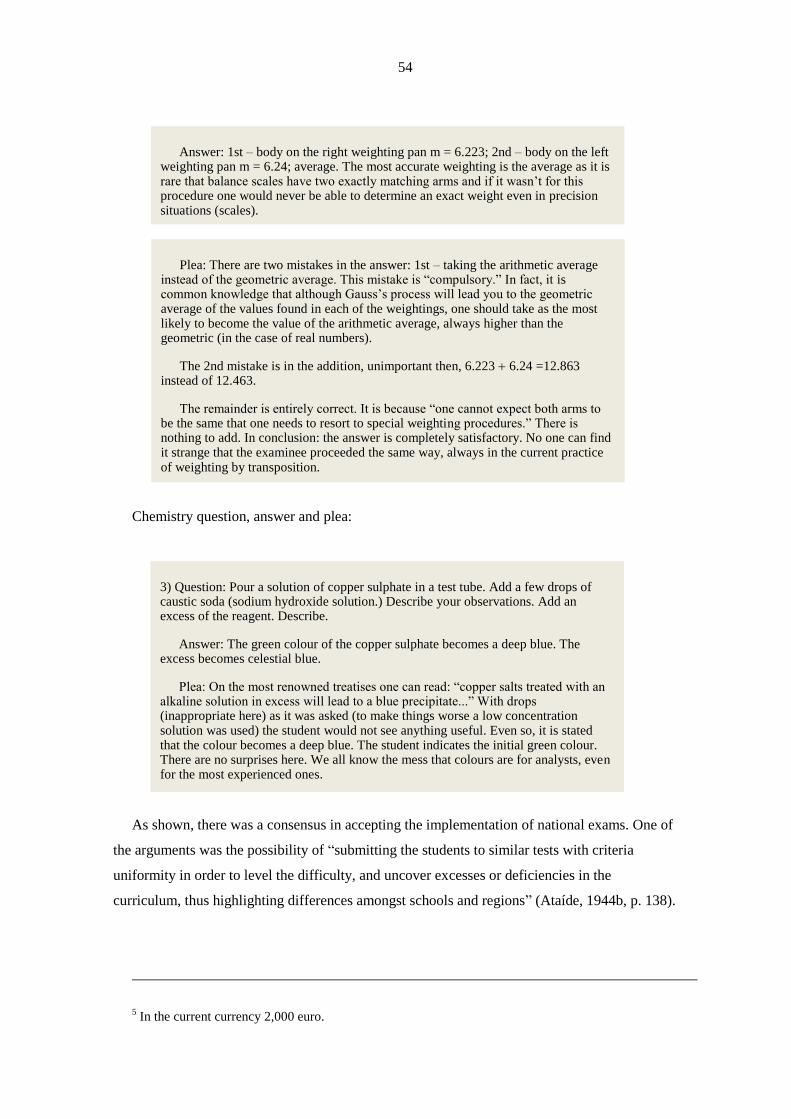
54
Chemistry question, answer and plea:
As shown, there was a consensus in accepting the implementation of national exams. One of
the arguments was the possibility of “submitting the students to similar tests with criteria
uniformity in order to level the difficulty, and uncover excesses or deficiencies in the
curriculum, thus highlighting differences amongst schools and regions” (Ataíde, 1944b, p. 138).
5 In the current currency 2,000 euro.
3) Question: Pour a solution of copper sulphate in a test tube. Add a few drops of caustic soda (sodium hydroxide solution.) Describe your observations. Add an excess of the reagent. Describe.
Answer: The green colour of the copper sulphate becomes a deep blue. The excess becomes celestial blue.
Plea: On the most renowned treatises one can read: “copper salts treated with an alkaline solution in excess will lead to a blue precipitate...” With drops (inappropriate here) as it was asked (to make things worse a low concentration solution was used) the student would not see anything useful. Even so, it is stated that the colour becomes a deep blue. The student indicates the initial green colour. There are no surprises here. We all know the mess that colours are for analysts, even for the most experienced ones.
Plea: There are two mistakes in the answer: 1st – taking the arithmetic average instead of the geometric average. This mistake is “compulsory.” In fact, it is common knowledge that although Gauss’s process will lead you to the geometric average of the values found in each of the weightings, one should take as the most likely to become the value of the arithmetic average, always higher than the geometric (in the case of real numbers).
The 2nd mistake is in the addition, unimportant then, 6.223 6.24 =12.863 instead of 12.463.
The remainder is entirely correct. It is because “one cannot expect both arms to be the same that one needs to resort to special weighting procedures.” There is nothing to add. In conclusion: the answer is completely satisfactory. No one can find it strange that the examinee proceeded the same way, always in the current practice of weighting by transposition.
Answer: 1st – body on the right weighting pan m = 6.223; 2nd – body on the left weighting pan m = 6.24; average. The most accurate weighting is the average as it is rare that balance scales have two exactly matching arms and if it wasn’t for this procedure one would never be able to determine an exact weight even in precision situations (scales).
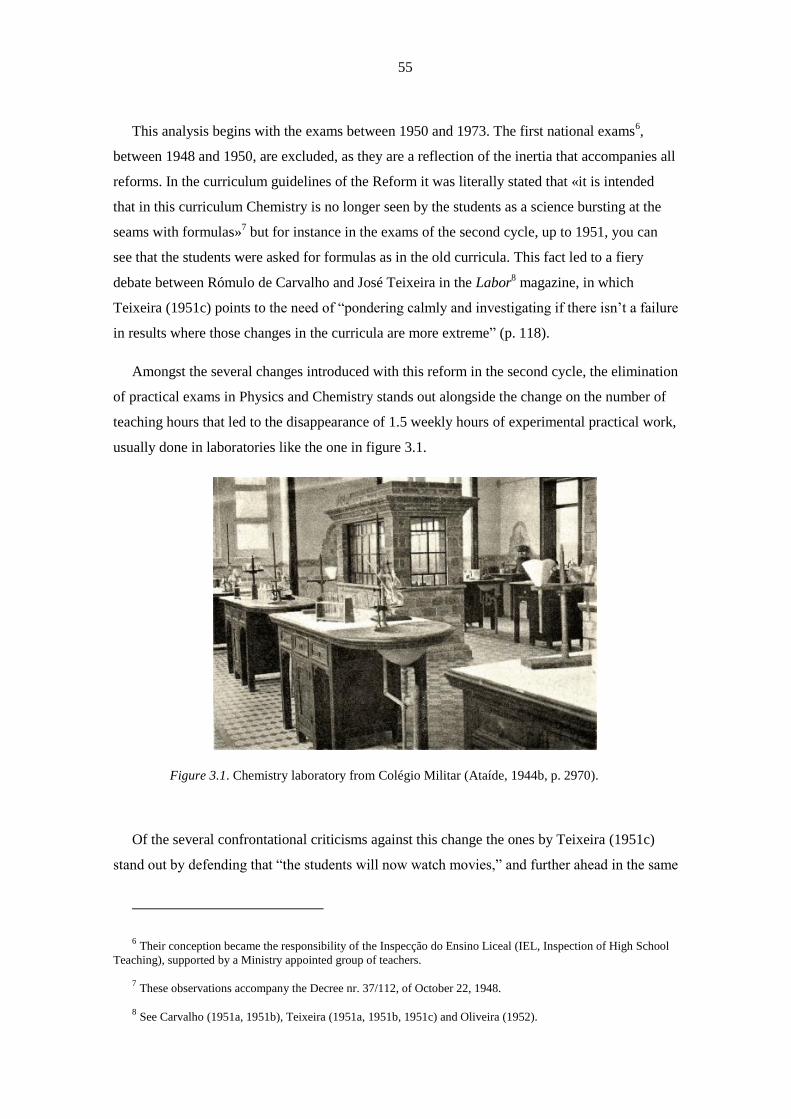
55
This analysis begins with the exams between 1950 and 1973. The first national exams6,
between 1948 and 1950, are excluded, as they are a reflection of the inertia that accompanies all
reforms. In the curriculum guidelines of the Reform it was literally stated that «it is intended
that in this curriculum Chemistry is no longer seen by the students as a science bursting at the
seams with formulas»7 but for instance in the exams of the second cycle, up to 1951, you can
see that the students were asked for formulas as in the old curricula. This fact led to a fiery
debate between Rómulo de Carvalho and José Teixeira in the Labor8 magazine, in which
Teixeira (1951c) points to the need of “pondering calmly and investigating if there isn’t a failure
in results where those changes in the curricula are more extreme” (p. 118).
Amongst the several changes introduced with this reform in the second cycle, the elimination
of practical exams in Physics and Chemistry stands out alongside the change on the number of
teaching hours that led to the disappearance of 1.5 weekly hours of experimental practical work,
usually done in laboratories like the one in figure 3.1.
Figure 3.1. Chemistry laboratory from Colégio Militar (Ataíde, 1944b, p. 2970).
Of the several confrontational criticisms against this change the ones by Teixeira (1951c)
stand out by defending that “the students will now watch movies,” and further ahead in the same
6 Their conception became the responsibility of the Inspecção do Ensino Liceal (IEL, Inspection of High School
Teaching), supported by a Ministry appointed group of teachers.
7 These observations accompany the Decree nr. 37/112, of October 22, 1948.
8 See Carvalho (1951a, 1951b), Teixeira (1951a, 1951b, 1951c) and Oliveira (1952).
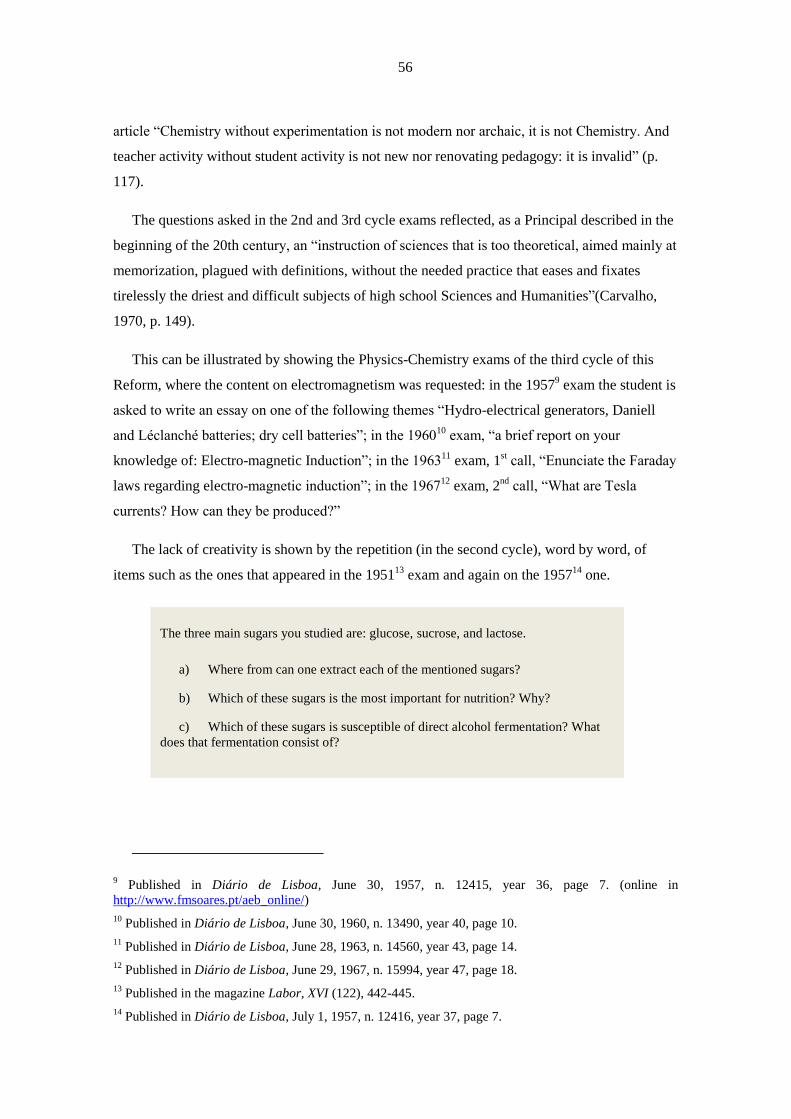
56
article “Chemistry without experimentation is not modern nor archaic, it is not Chemistry. And
teacher activity without student activity is not new nor renovating pedagogy: it is invalid” (p.
117).
The questions asked in the 2nd and 3rd cycle exams reflected, as a Principal described in the
beginning of the 20th century, an “instruction of sciences that is too theoretical, aimed mainly at
memorization, plagued with definitions, without the needed practice that eases and fixates
tirelessly the driest and difficult subjects of high school Sciences and Humanities”(Carvalho,
1970, p. 149).
This can be illustrated by showing the Physics-Chemistry exams of the third cycle of this
Reform, where the content on electromagnetism was requested: in the 19579 exam the student is
asked to write an essay on one of the following themes “Hydro-electrical generators, Daniell
and Léclanché batteries; dry cell batteries”; in the 196010
exam, “a brief report on your
knowledge of: Electro-magnetic Induction”; in the 196311
exam, 1st call, “Enunciate the Faraday
laws regarding electro-magnetic induction”; in the 196712
exam, 2nd
call, “What are Tesla
currents? How can they be produced?”
The lack of creativity is shown by the repetition (in the second cycle), word by word, of
items such as the ones that appeared in the 195113
exam and again on the 195714
one.
9 Published in Diário de Lisboa, June 30, 1957, n. 12415, year 36, page 7. (online in
http://www.fmsoares.pt/aeb_online/)
10 Published in Diário de Lisboa, June 30, 1960, n. 13490, year 40, page 10.
11 Published in Diário de Lisboa, June 28, 1963, n. 14560, year 43, page 14.
12 Published in Diário de Lisboa, June 29, 1967, n. 15994, year 47, page 18.
13 Published in the magazine Labor, XVI (122), 442-445.
14 Published in Diário de Lisboa, July 1, 1957, n. 12416, year 37, page 7.
The three main sugars you studied are: glucose, sucrose, and lactose.
a) Where from can one extract each of the mentioned sugars?
b) Which of these sugars is the most important for nutrition? Why?
c) Which of these sugars is susceptible of direct alcohol fermentation? What
does that fermentation consist of?
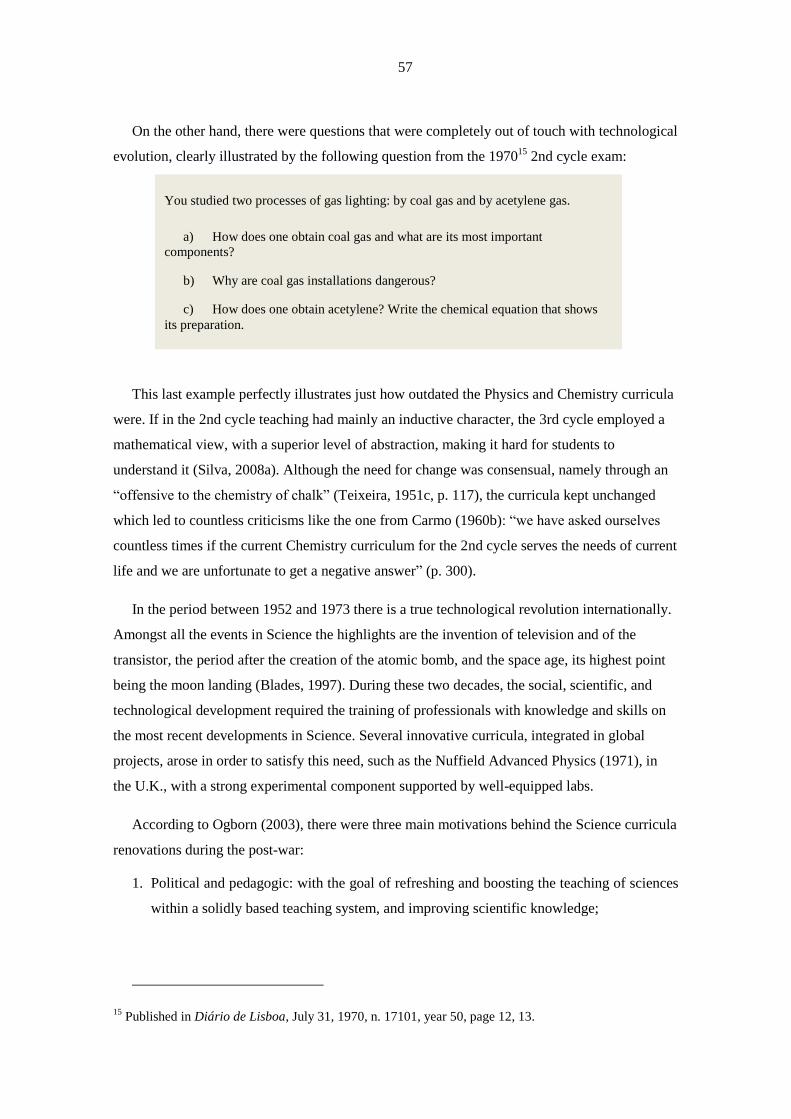
57
On the other hand, there were questions that were completely out of touch with technological
evolution, clearly illustrated by the following question from the 197015
2nd cycle exam:
This last example perfectly illustrates just how outdated the Physics and Chemistry curricula
were. If in the 2nd cycle teaching had mainly an inductive character, the 3rd cycle employed a
mathematical view, with a superior level of abstraction, making it hard for students to
understand it (Silva, 2008a). Although the need for change was consensual, namely through an
“offensive to the chemistry of chalk” (Teixeira, 1951c, p. 117), the curricula kept unchanged
which led to countless criticisms like the one from Carmo (1960b): “we have asked ourselves
countless times if the current Chemistry curriculum for the 2nd cycle serves the needs of current
life and we are unfortunate to get a negative answer” (p. 300).
In the period between 1952 and 1973 there is a true technological revolution internationally.
Amongst all the events in Science the highlights are the invention of television and of the
transistor, the period after the creation of the atomic bomb, and the space age, its highest point
being the moon landing (Blades, 1997). During these two decades, the social, scientific, and
technological development required the training of professionals with knowledge and skills on
the most recent developments in Science. Several innovative curricula, integrated in global
projects, arose in order to satisfy this need, such as the Nuffield Advanced Physics (1971), in
the U.K., with a strong experimental component supported by well-equipped labs.
According to Ogborn (2003), there were three main motivations behind the Science curricula
renovations during the post-war:
1. Political and pedagogic: with the goal of refreshing and boosting the teaching of sciences
within a solidly based teaching system, and improving scientific knowledge;
15 Published in Diário de Lisboa, July 31, 1970, n. 17101, year 50, page 12, 13.
You studied two processes of gas lighting: by coal gas and by acetylene gas.
a) How does one obtain coal gas and what are its most important
components?
b) Why are coal gas installations dangerous?
c) How does one obtain acetylene? Write the chemical equation that shows
its preparation.
58
2. Economical: leading to economical gain through the improvement of the teaching of
sciences;
3. Altruistic: like the Nuffield, in England, that pushed the educational system towards
change.
In the early 1970s, the curriculum can be considered as a mirror of the social changes and of
a relative political openness. During this time the protests against the curricula increased,
boosted by several articles published in magazines on the subject of teaching. Almeida (1971)
justified the poor performance of high school students and the need for a reform the following
way:
(…) keeping the same curriculum for more than 20 years16
... and considering we are
talking about a subject like Physics and Chemistry, with an amazing reach and
actuality, to which some of the most spectacular advances in science are connected,
and of the technique that should stimulate teenage curiosity... thus, a reform in
teaching, is a question of survival.(p. 256)
On the other hand, Carvalho (1970) criticized the evolution, better yet, the slow evolution of
the teaching of Physics, since the Pombal Reform, and at the same time stated: “Will this be a
first relief for alarm inclined spirits: today’s teaching crisis is the same crisis as ever, with the
advantage that the good teachers of nowadays are better that the good ones from times past due
to the excellent resources they have available”(p. 142).
As Alfredo Veiga-Neto (2008) defends, “the curriculum is an artefact of modernity,” as
clearly demonstrated by the Veiga Simão Curricular Reform (1973) which, due to the 1974
Revolution, was not completed. At the time compulsory schooling was seven years long in high
schools, and five years long in industrial and commercial schools. In this Reform there were
certain general points worth noting such as: equal opportunity for all students in a democratic
school, compulsory schooling is extended in order to increase the literacy level of the
Portuguese population alongside the changes in the Physics and Chemistry curricula, with the
introduction of contents such as the structure of matter and force fields.
All were expecting that the National Exams of 1974 reflected the curricular changes of this
Reform, even on its early stages. And so it came to pass but its effects went unfelt as the
national exams and the college aptitude exams were suspended due to student or faculty strikes.
16 The Physics and Chemistry curricula, proposed in 1948, suffered only slight changes in 1954 through the
Decree nr. 39807, from September 7, 1954 (Diário do Governo, 1ª Série, nº198).
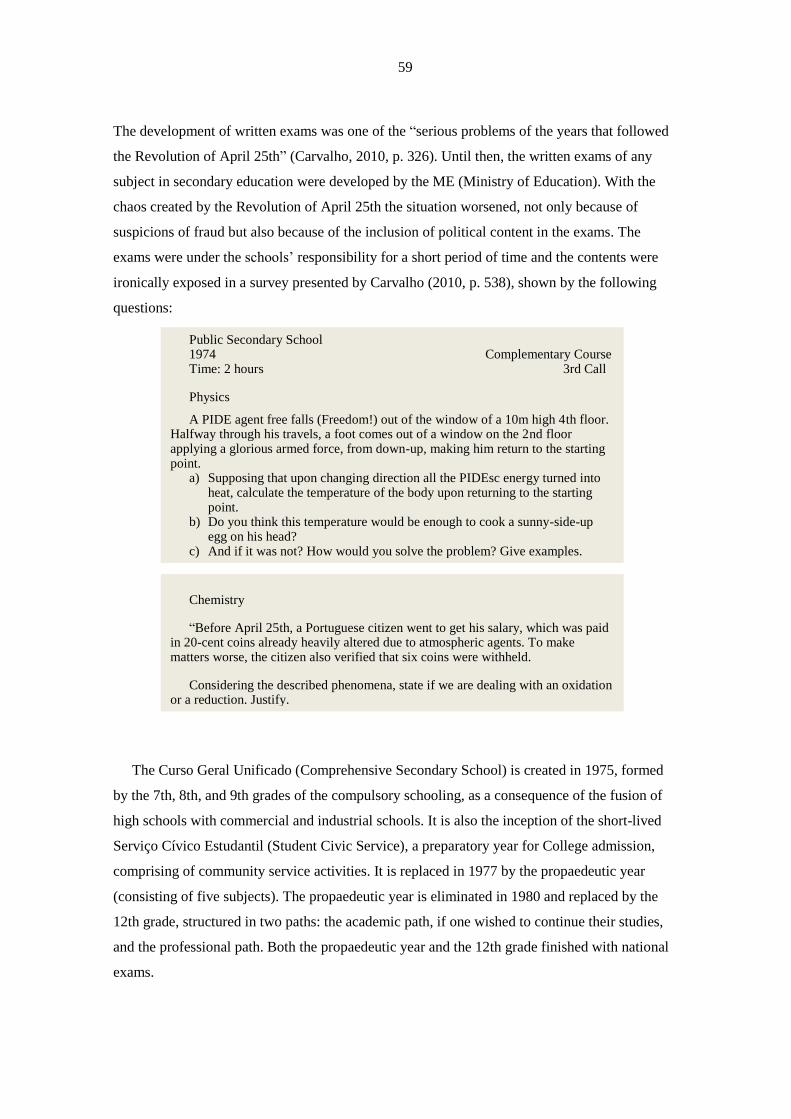
59
The development of written exams was one of the “serious problems of the years that followed
the Revolution of April 25th” (Carvalho, 2010, p. 326). Until then, the written exams of any
subject in secondary education were developed by the ME (Ministry of Education). With the
chaos created by the Revolution of April 25th the situation worsened, not only because of
suspicions of fraud but also because of the inclusion of political content in the exams. The
exams were under the schools’ responsibility for a short period of time and the contents were
ironically exposed in a survey presented by Carvalho (2010, p. 538), shown by the following
questions:
The Curso Geral Unificado (Comprehensive Secondary School) is created in 1975, formed
by the 7th, 8th, and 9th grades of the compulsory schooling, as a consequence of the fusion of
high schools with commercial and industrial schools. It is also the inception of the short-lived
Serviço Cívico Estudantil (Student Civic Service), a preparatory year for College admission,
comprising of community service activities. It is replaced in 1977 by the propaedeutic year
(consisting of five subjects). The propaedeutic year is eliminated in 1980 and replaced by the
12th grade, structured in two paths: the academic path, if one wished to continue their studies,
and the professional path. Both the propaedeutic year and the 12th grade finished with national
exams.
Public Secondary School 1974 Complementary Course Time: 2 hours 3rd Call
Physics
A PIDE agent free falls (Freedom!) out of the window of a 10m high 4th floor. Halfway through his travels, a foot comes out of a window on the 2nd floor applying a glorious armed force, from down-up, making him return to the starting point.
a) Supposing that upon changing direction all the PIDEsc energy turned into heat, calculate the temperature of the body upon returning to the starting point.
b) Do you think this temperature would be enough to cook a sunny-side-up egg on his head?
c) And if it was not? How would you solve the problem? Give examples.
Chemistry
“Before April 25th, a Portuguese citizen went to get his salary, which was paid in 20-cent coins already heavily altered due to atmospheric agents. To make matters worse, the citizen also verified that six coins were withheld.
Considering the described phenomena, state if we are dealing with an oxidation or a reduction. Justify.
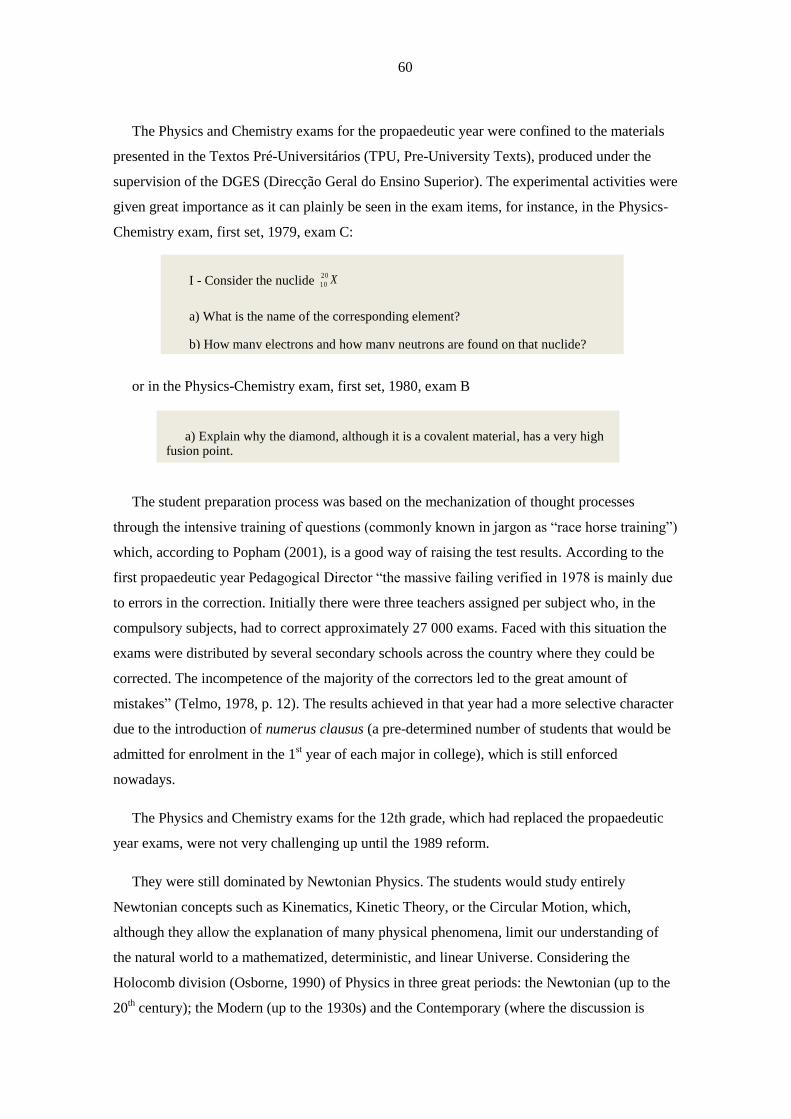
60
The Physics and Chemistry exams for the propaedeutic year were confined to the materials
presented in the Textos Pré-Universitários (TPU, Pre-University Texts), produced under the
supervision of the DGES (Direcção Geral do Ensino Superior). The experimental activities were
given great importance as it can plainly be seen in the exam items, for instance, in the Physics-
Chemistry exam, first set, 1979, exam C:
or in the Physics-Chemistry exam, first set, 1980, exam B
The student preparation process was based on the mechanization of thought processes
through the intensive training of questions (commonly known in jargon as “race horse training”)
which, according to Popham (2001), is a good way of raising the test results. According to the
first propaedeutic year Pedagogical Director “the massive failing verified in 1978 is mainly due
to errors in the correction. Initially there were three teachers assigned per subject who, in the
compulsory subjects, had to correct approximately 27 000 exams. Faced with this situation the
exams were distributed by several secondary schools across the country where they could be
corrected. The incompetence of the majority of the correctors led to the great amount of
mistakes” (Telmo, 1978, p. 12). The results achieved in that year had a more selective character
due to the introduction of numerus clausus (a pre-determined number of students that would be
admitted for enrolment in the 1st year of each major in college), which is still enforced
nowadays.
The Physics and Chemistry exams for the 12th grade, which had replaced the propaedeutic
year exams, were not very challenging up until the 1989 reform.
They were still dominated by Newtonian Physics. The students would study entirely
Newtonian concepts such as Kinematics, Kinetic Theory, or the Circular Motion, which,
although they allow the explanation of many physical phenomena, limit our understanding of
the natural world to a mathematized, deterministic, and linear Universe. Considering the
Holocomb division (Osborne, 1990) of Physics in three great periods: the Newtonian (up to the
20th century); the Modern (up to the 1930s) and the Contemporary (where the discussion is
I - Consider the nuclide 20
10 X
a) What is the name of the corresponding element?
b) How many electrons and how many neutrons are found on that nuclide?
a) Explain why the diamond, although it is a covalent material, has a very high fusion point.
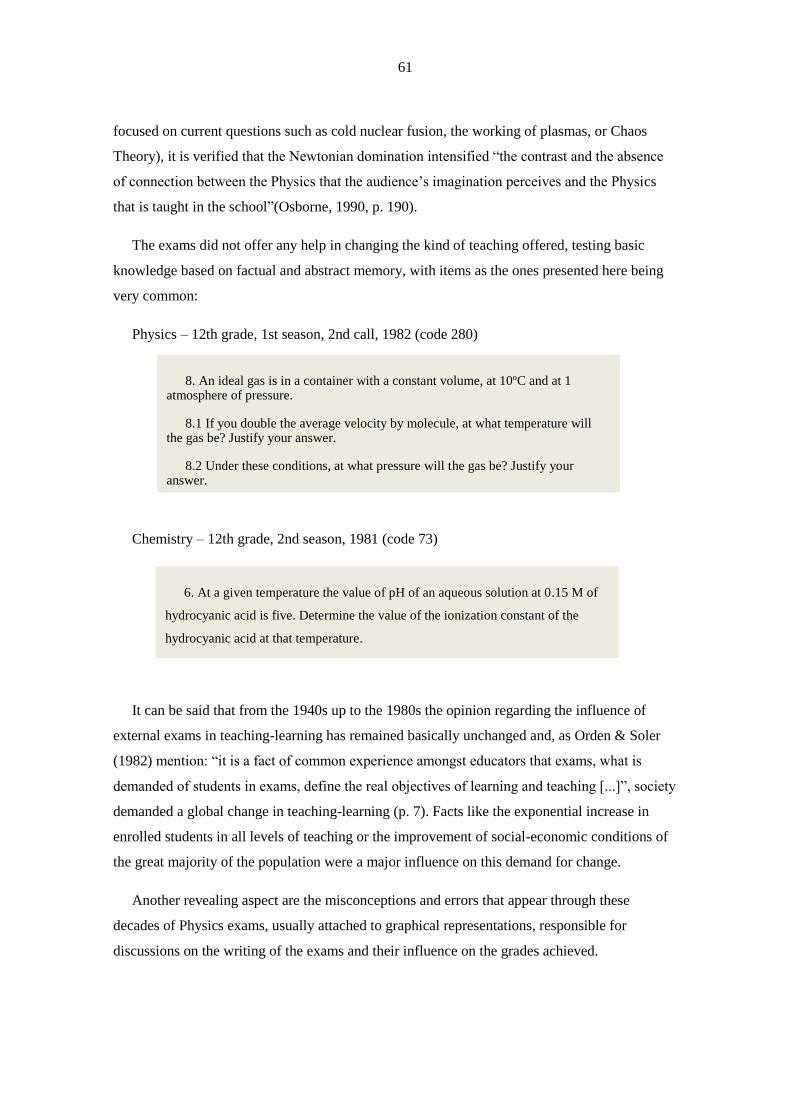
61
focused on current questions such as cold nuclear fusion, the working of plasmas, or Chaos
Theory), it is verified that the Newtonian domination intensified “the contrast and the absence
of connection between the Physics that the audience’s imagination perceives and the Physics
that is taught in the school”(Osborne, 1990, p. 190).
The exams did not offer any help in changing the kind of teaching offered, testing basic
knowledge based on factual and abstract memory, with items as the ones presented here being
very common:
Physics – 12th grade, 1st season, 2nd call, 1982 (code 280)
Chemistry – 12th grade, 2nd season, 1981 (code 73)
It can be said that from the 1940s up to the 1980s the opinion regarding the influence of
external exams in teaching-learning has remained basically unchanged and, as Orden & Soler
(1982) mention: “it is a fact of common experience amongst educators that exams, what is
demanded of students in exams, define the real objectives of learning and teaching [...]”, society
demanded a global change in teaching-learning (p. 7). Facts like the exponential increase in
enrolled students in all levels of teaching or the improvement of social-economic conditions of
the great majority of the population were a major influence on this demand for change.
Another revealing aspect are the misconceptions and errors that appear through these
decades of Physics exams, usually attached to graphical representations, responsible for
discussions on the writing of the exams and their influence on the grades achieved.
8. An ideal gas is in a container with a constant volume, at 10ºC and at 1 atmosphere of pressure.
8.1 If you double the average velocity by molecule, at what temperature will the gas be? Justify your answer.
8.2 Under these conditions, at what pressure will the gas be? Justify your answer.
6. At a given temperature the value of pH of an aqueous solution at 0.15 M of
hydrocyanic acid is five. Determine the value of the ionization constant of the
hydrocyanic acid at that temperature.

62
Physics – 12th grade, 1st season, 1st call, 1982 (code 206)
In this exam the x-axis represents the time variable (expressed in seconds) and has
simultaneously represented on it the wavelength of 12m between two wave crests.
The new Curricular Reform appeared only in 198917
following the publication of the Lei de
Bases do Sistema Educativo (Educational System Law), in 198618
. As with all reforms, it was
supported by a formal body of laws and regulations forming a complex project that set goals for
the teaching-learning. In order to implement a reform, a great commitment from all members of
the educational community is needed as the school, as an institution, does not act, “but only the
individuals in or for the institutions” (Popper, 1992, p. 84).
If the Curriculum is considered a complex social project, its dynamic being dependent on
several conditions that determine the “real curriculum” (Perrenoud, 1995), then the latter was
often out of touch with what was defended on this reform.
On the 12th grade the contents on variable electromagnetic fields were no longer taught (it
was not included in the General Curriculum Guidelines that determined the minimal
compulsory content), mainly due to the deep exploration, and consequent increase in teaching
time, on the teachers behalf, on the field of Mechanics.
17 From August 26, 1989 (Diário do Governo, 1ª Série, nº286).
18 From October 14, 1986 (Diário do Governo, 1ª Série, nº46).
4. Figure 1 shows a wave motion propagating in a given direction.
4.1 What is the wavelength of this wave motion?
4.2 If crest A takes 2 s reaching point B, what is the frequency of the wave motion?
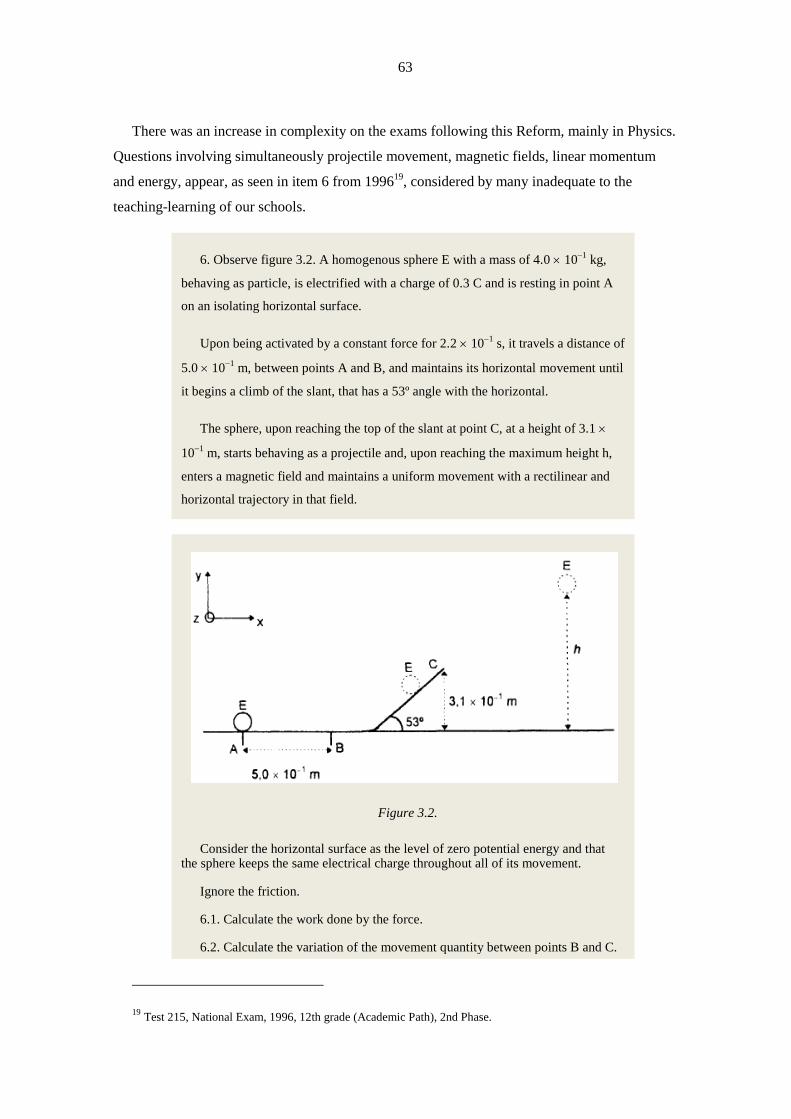
63
There was an increase in complexity on the exams following this Reform, mainly in Physics.
Questions involving simultaneously projectile movement, magnetic fields, linear momentum
and energy, appear, as seen in item 6 from 199619
, considered by many inadequate to the
teaching-learning of our schools.
19 Test 215, National Exam, 1996, 12th grade (Academic Path), 2nd Phase.
6. Observe figure 3.2. A homogenous sphere E with a mass of 4.0 101
kg,
behaving as particle, is electrified with a charge of 0.3 C and is resting in point A
on an isolating horizontal surface.
Upon being activated by a constant force for 2.2 101
s, it travels a distance of
5.0 101
m, between points A and B, and maintains its horizontal movement until
it begins a climb of the slant, that has a 53º angle with the horizontal.
The sphere, upon reaching the top of the slant at point C, at a height of 3.1
101
m, starts behaving as a projectile and, upon reaching the maximum height h,
enters a magnetic field and maintains a uniform movement with a rectilinear and
horizontal trajectory in that field.
Figure 3.2.
Consider the horizontal surface as the level of zero potential energy and that the sphere keeps the same electrical charge throughout all of its movement.
Ignore the friction.
6.1. Calculate the work done by the force.
6.2. Calculate the variation of the movement quantity between points B and C.
64
The most noticeable consequences of this type of question were the increase of failing grades
and transforming Physics in an extremely discriminating subject (alongside Mathematics). With
the introduction in 1997 of a group of multiple-choice questions (Tests with code 115) and a
group regarding one of the twelve compulsory experimental assignments, the results improved.
Still, the exam statistics developed by GAVE20
after 1999 show us that, in general, the average
grade of the Physics exams stayed under 10, unlike Chemistry that, despite some oscillations,
stayed above 10. The Chemistry exams did not demand as many Mathematics concepts as the
Physics ones, which explain the better student performance in items like the one presented in
the 1996 Chemistry exam (1st phase, 1st call, test 242):
The lack of curricular coordination with Mathematics was one of the reasons for the negative
results in Physics. Even before the Veiga Simão Reform, Carvalho (1970) noted that one of the
most concerning issues was “the relationship between the teaching of Physics and Mathematics”
(p. 153). This situation stayed the same for decades. Up to 2005, Physics teachers started the
10th grade by teaching mathematical concepts of vectorial calculus and, in the 12th grade,
derivation rules needed for the mathematical treatment of physics problems.
The exams reflected this deep mismatch. The student was supplied with a cheat sheet with
derivation rules for the Mathematics exam, but for the Physics (code 115) exam students needed
to know those derivation rules, as they were not supplied with any cheat sheet, not even the one
from the Mathematics exam. The Chemistry exams started, in 2003, to offer a small cheat sheet
at the beginning of the exam. It is our belief that “an optimal evaluation method for all
situations is yet to be found” (Cardinet, 1993, p. 49).
After 50 years, standard compliance failures during the exams still happen. According to the
Júri Nacional de Exames (JNE, National Examinations Jury) events like written margins,
20 Gabinete de Avaliação Educacional (Cabinet of Educational Evaluation)
4. An aqueous solution of sulphuric acid at 1.00 mol dm3 contains 4.9 g of acid
and 55.1 g of water.
4.1. Calculate the density of the solution.
4.2. How would you dilute the previous solution to obtain 100 cm3 of a
sulphuric acid solution at 0.80 mol dm3?
6.3. Calculate the height, h, measured from the horizontal plane, where the sphere enters the magnetic field.
6.4. Characterize the magnetic field vector.
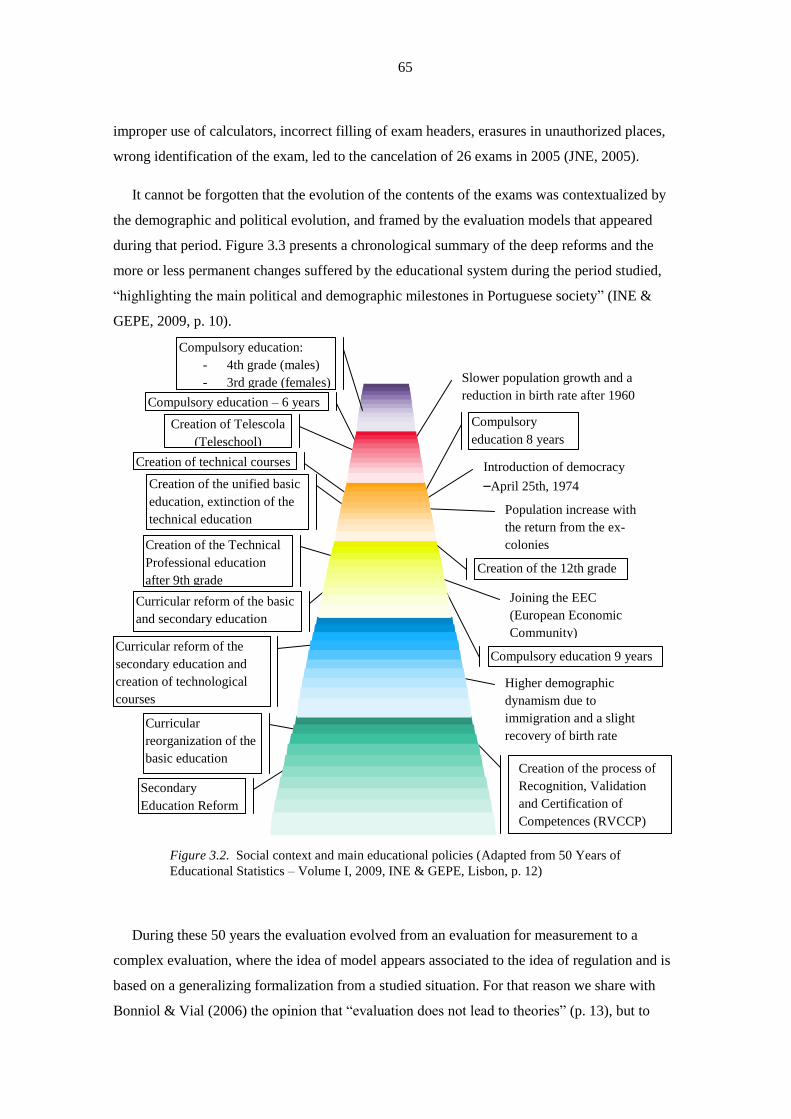
65
improper use of calculators, incorrect filling of exam headers, erasures in unauthorized places,
wrong identification of the exam, led to the cancelation of 26 exams in 2005 (JNE, 2005).
It cannot be forgotten that the evolution of the contents of the exams was contextualized by
the demographic and political evolution, and framed by the evaluation models that appeared
during that period. Figure 3.3 presents a chronological summary of the deep reforms and the
more or less permanent changes suffered by the educational system during the period studied,
“highlighting the main political and demographic milestones in Portuguese society” (INE &
GEPE, 2009, p. 10).
Figure 3.2. Social context and main educational policies (Adapted from 50 Years of
Educational Statistics – Volume I, 2009, INE & GEPE, Lisbon, p. 12)
During these 50 years the evaluation evolved from an evaluation for measurement to a
complex evaluation, where the idea of model appears associated to the idea of regulation and is
based on a generalizing formalization from a studied situation. For that reason we share with
Bonniol & Vial (2006) the opinion that “evaluation does not lead to theories” (p. 13), but to
Creation of the 12th grade
Compulsory
education 8 years
Compulsory education 9 years
Creation of the process of
Recognition, Validation
and Certification of
Competences (RVCCP)
Slower population growth and a
reduction in birth rate after 1960
Introduction of democracy
–April 25th, 1974
Population increase with
the return from the ex-
colonies
Joining the EEC
(European Economic
Community)
Higher demographic
dynamism due to
immigration and a slight
recovery of birth rate
Compulsory education:
- 4th grade (males)
- 3rd grade (females)
Compulsory education – 6 years
Creation of Telescola
(Teleschool)
Creation of technical courses
Creation of the unified basic
education, extinction of the
technical education
Creation of the Technical
Professional education
after 9th grade
Curricular reform of the basic
and secondary education
Curricular reform of the
secondary education and
creation of technological
courses
Curricular
reorganization of the
basic education
Secondary
Education Reform
66
models. Still, only a critical attitude with amplitude framed by a tested model will allow the
development of practical knowledge that can be useful for the creation of integrated items and
exams.
A project to reflect on the curricula of the basic and secondary education was created as a
consequence of the exam results. This project gave birth to guidelines for a Curricular
Reorganization, which was implemented in the years for the 1st and 2nd cycles and in 2002-
2003 for the 3rd cycle (ME/OEI, 2003).
There have been several theories, since 1950 that allow the comparison of the results of the
evaluation of learning in different populations, in distinct places and times. Examples of those
theories are: an Item Response Theory, IRT, the Classical Measurement Theory, and the Model
of Evaluation of the Results of Learning (Modelo da Avaliação dos Resultados da
Aprendizagem), associated to the idea of accountability, i.e., that the production and disclosure
of information concerning the knowledge acquired by students in school are part of the
Government duties regarding its accountability on the quality of the services it offers the
population.
Exploring the role of exams in the curricula regarding its contents, competences developed,
and structure is a controversial approach, as the results achieved depend on the contents taught,
on the pedagogical objectives, on test correction methods, as well as on the behaviour of both
examiners and examinees regarding learning.
3.2 Estimating item and test difficulty using psychometric
methods
One of the goals of this research is to study the difficulty of the exams and items in the national
Physics and Chemistry exams. This section begins with a short summary of the research in this
area, the need to consider several analysis methods of the item and exam difficulty is explored,
and the importance of a content and cognition analysis is defended.
The systematic scientific study of the psycho-pedagogic problems of the knowledge
assessment in exams and applications began in the 1920s with Henri Piéron (Miranda, 1980).
The researches done during the last 80 years allowed for the development of theories and
methods to estimate the student behaviour related with items and factors that contribute to item
difficulty. According to Hambleton and Jirka (2006, p. 401), the countless studies can be
67
grouped in five categories: “a) studies on judging item difficulty; b) studies on other item
characteristics; c) studies on item writing rules; d) research on other attributes affecting item
characteristics; e) mixture of judgment and factor studies.”
Farmer (1928) did one of the first investigations on item difficulty, and it presented two
important points: the existence of a partial agreement between the judges estimates and the
examinees’ results, and the fact that the estimate done by the judges in a group is more reliable
than their individual estimates.
Later on, Burt (1949) published a study on school and mental tests which focused on the
difficulty factor of particular groups and the general population, following an order obtained by
averaging the several rankings just as they stood. This study concluded that to estimate a
general ability from grades in various subjects of the tests, first it should be set that their
difficulty is approximately the same. New versions of the Stanford Achievement Test, a set of
tests written under the supervision of Stanford University and taken by around 35,000 students
in 33 U.S. states, were published. These tests focused on what were considered the most
significant contents of the curricula and they “tried to ensure, as much as possible, the same
level of difficulty” (Planchard, 1945, p. 12).
Lorge and Kruglov (1952) performed several studies to estimate the difficulty of a set of
math items with a limited number of judges. Their task was to estimate the absolute difficulty
(percentage of getting the correct item) and the relative difficulty (ranking of items.) Both the
grading group that received empirical statistical data about the anchor items, and the grading
group that did not get that information estimated the relative difficulty correctly. Still, the group
with the additional information was a better judge of the absolute difficulty of the items. On a
second phase the study included experienced math teachers and revealed a reduction of the
judges’ tendency to underestimate item difficulty when they had the additional information.
Like in several studies, judges tend to underestimate item difficulty and that problem cannot be
avoided. Impara and Plake (1998), in a study using several analysis methods, also concluded
that the 26 judging teachers underestimated the performance of the total group of students as
well as the performance of the minimally competent examinees. These conclusions highlighted
the importance of an effective training with feedback for these judges. Another question raised
was that of the possible dissimilarity in the capacity of judges with different competences to
judge the items. Later on, Lorge and Diamond (1954) decided to study the judges skills
regarding the estimation of item difficulty, and established that the inclusion of anchor items
influences and helps the least qualified judges. These anchor items can be used to adjust
statistically the results of the judges (Thorndike, 1982). Like Hambleton and Jirka emphasized,
68
“(…) if a judge systematically underestimates the item difficulty by 10%, the results of
their estimation for the anchor items can be the support to statistically adjust their difficulty
estimates for the other items in 10% more. In this research on the Physics and Chemistry
exams there were no anchor items supplied to the judges as this would distort the correct
evaluation of the structure and content of each exam, item sequence, and answer time.”
(Hambleton & Jirka, 2006, p. 402)
One interesting work carried out by Chalifour and Powers (1989) identified several content
characteristics that were good predictors of item difficulty, and, to a lesser extent, item
discrimination (Boldt, 1998, p. 6). Among those content characteristics were the usefulness of
illustrations in obtaining a correct answer, number of words, the stimulus material for the item
and the number of rules or conditions in the test item. Besides the characteristics already
mentioned, item difficulty is related to other factors. Some of the specific factors that contribute
to increase item difficulty are: (1) negative statements; (2)the more items in a exam, the higher
its difficulty; (3) vocabulary wise, the use of words with many syllables or uncommon words;
(4) the length of sentences and paragraphs; (5) the level of abstraction, the higher it is, the
higher the difficulty will be; (6) the placement of important information, placing it in the middle
of the text could increase item difficulty; (7) the number and level of cognitive competences
needed; (8) the originality of the item; (9) the placement of the item in the test since the ones
placed last are usually harder and require good time management; and (10) the very similar
distractors in multiple choice items.
Much of the work on specification of educational assessment follows Popham’s prescriptions
for domain, test, and item specifications (Popham, 1984). In Portugal, Valadares and Graça
stressed, beyond these points, “the importance of “aligning” the grading with the methodologies
and strategies used for curriculum development” (1998, p. 5). Unlike content standards, which
have received intensive attention over the past decade, a small amount of research and
development has been devoted to explaining learning progressions (Schmoker, 2006; Shepard,
2006). In a study Wiggins and McTighe (1998), suggested that devising an assessment that
shows the learning goals is central to good teaching, not just a matter of measuring outcomes,
and added the need of an “authentic pedagogy, higher-order thinking and deep-knowledge
approaches” (Wiggins & McTighe, 2005, p. 306).
In Australia, consistent assessment systems with classroom and large-scale assessment
associated to the same essential progress map are relatively well developed (Foster & Masters,
2004). Similarly, in the Netherlands, “learning-teaching trajectories” are being put into practice
to provide much needed pedagogical insights to support the development of students’ thinking
over time (Heuvel-Panhuizen, 2001). On the other hand, the development of instructionally
69
useful learning progressions in Portugal has been limited by the slow development of large-
scale assessment systems over time.
Other interesting aspects regarding discrimination, difficulty, relevance of item content
emerge in a study performed in the area of mathematics (Ryan, 1968). One of the findings
pointed item relevance to the instructional content to be a major factor in determining overall
item quality, but not item difficulty or discrimination. A number of teachers were able to
provide statistically reliable estimates of item difficulties. However, the accuracy of the ratings
varied and was not consistent for all the judges. Teachers did best when the test items were
similar to those they might use on their own tests. There was a positive correlation between
judgmental and empirical difficulty when the test content was perceived to be familiar to their
students. Traditionally, tests often misdirected instruction, if they focused on what was easiest
to measure instead of what was important to learn. This could be the reason why some teachers
prepare their students almost exclusively to answer the typical questions that appear in final
exams. This means that “the classical assessment system makes teachers prefer isolated and
quantifiable competences instead of more complex competences (reasoning, communication),
more difficult to take into consideration in an individual pencil and paper test” (Perrenoud,
1992, p. 3). This way, “teaching becomes restrictive and both the teacher teaching and the
student learning act in accordance to the exam” (Sampaio, 1982, p. 6). Accordingly “assessment
cannot promote learning if it is based on tasks or questions that divert attention from the real
goals of instruction”(Shepard, 2006, p. 629).
Several studies published in recent years have produced explicit examination about the
content knowledge and cognitive processes that test items require of examinees and of the
degree to which these demands are consistent with the content knowledge and procedural
requirements intended in content standards and corresponding item and test specifications
(Linn, 2006). Studies that used statistical regression models to study contributing factors to
examinee behaviour in face of items were discovered, such as the ones by Freedle and Kostin
(1993, 1996), and Rupp, Garcia and Jamieson (2001).
There were other investigations about some detail factors related to item statistics. Two
important studies about validity of judgmental estimates and as other issues effect item
difficulty were carried out by Green (1983) and correlated item complexity with empirical and
judgmental difficulty complexity. The conclusions showed that judges are capable of estimating
relative difficulty, and can also make judgments about other factors. The notion that the
estimation of the discrimination indexes of the items is a very complex task, which usually leads
to unsatisfactory results, is common to all these studies. On the other hand, there are
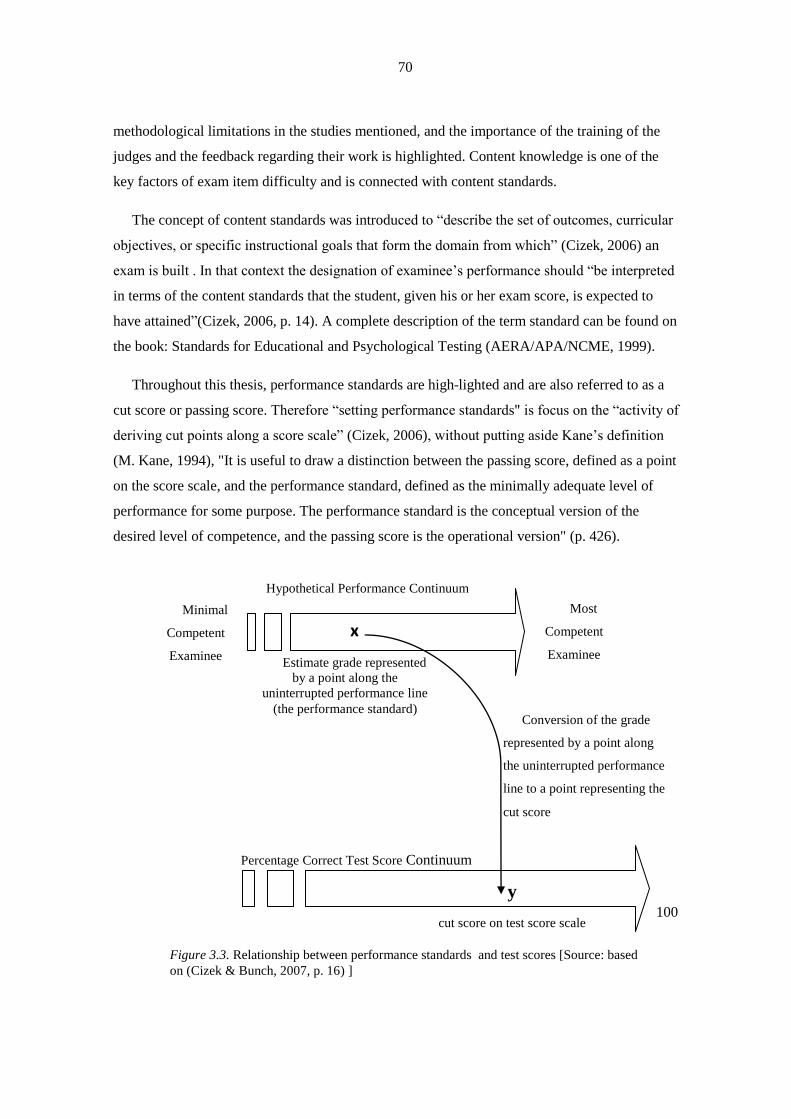
70
methodological limitations in the studies mentioned, and the importance of the training of the
judges and the feedback regarding their work is highlighted. Content knowledge is one of the
key factors of exam item difficulty and is connected with content standards.
The concept of content standards was introduced to “describe the set of outcomes, curricular
objectives, or specific instructional goals that form the domain from which” (Cizek, 2006) an
exam is built . In that context the designation of examinee’s performance should “be interpreted
in terms of the content standards that the student, given his or her exam score, is expected to
have attained”(Cizek, 2006, p. 14). A complete description of the term standard can be found on
the book: Standards for Educational and Psychological Testing (AERA/APA/NCME, 1999).
Throughout this thesis, performance standards are highlighted and are also referred to as a
cut score or passing score. Therefore “setting performance standards" is focus on the “activity of
deriving cut points along a score scale” (Cizek, 2006), without putting aside Kane’s definition
(M. Kane, 1994), "It is useful to draw a distinction between the passing score, defined as a point
on the score scale, and the performance standard, defined as the minimally adequate level of
performance for some purpose. The performance standard is the conceptual version of the
desired level of competence, and the passing score is the operational version" (p. 426).
Figure 3.3. Relationship between performance standards and test scores [Source: based
on (Cizek & Bunch, 2007, p. 16) ]
100 0
Percentage Correct Test Score Continuum
x
Estimate grade represented
by a point along the
uninterrupted performance line
(the performance standard)
Most
Competent
Examinee
Minimal
Competent
Examinee
Hypothetical Performance Continuum
y
cut score on test score scale
Conversion of the grade
represented by a point along
the uninterrupted performance
line to a point representing the
cut score
71
Upper level in the figure shows a supposed uninterrupted performance line and the lower
level shows the test score scale from 0 to 100 points. Teachers in standard setting estimate a
grade represented by a point along the uninterrupted performance line that distinguishes suitable
from unsuitable performance marked in the upper level as “x”. The assignment of cut scores
may be a form in which the performance standard is, via systematic, judgmental means,
converted into a cut score marked as "y" in the lower level of the figure 3.4.
The definition of standard setting proposed by Kane has two constraints. Since the term
performance standard is often interpreted as a cut score or passing score one of the constraints is
the difference between performance standard and passing score. The other one is the absence of
the term inference, which is only implied in Kane’s definition, as the passing score defines two
distinct groups of students: those who achieve a performance standard and those who do not.
That can only be done with inferences about those individuals. The inference notion is therefore
connected to an important psychometric concept called validity, considered “the most
fundamental consideration in developing and evaluating tests”, and regarded as "the degree to
which evidence and theory support the interpretations of test scores entailed by the proposed
uses of tests" (AERA/APN/NCME, 1999, p. 9). Validity was considered "one of the major
deities in the pantheon of the psychometrician" (Ebel, 1961, p. 640) but currently validity is
connected with the inferences accuracy that are made about a student, supported by the
performance of the student - such as on test scores of written exams. According to Kane (2006),
determining validity comprises two aspects: first, the existence of bases that support the
application of tests or inferences based on scores obtained in the tests, and secondly, a concern
about the way inferences regarding scores and also the application of the tests are explored.
To sustain this view Cronbach and Meehl stated that , “one does not validate a test, but only
a principle for making inferences" (1955, p. 300). Therefore, “Exams and exams scores cannot
be said to be valid or not valid”(Cizek, 2006, p. 17).
In few words, “standard setting is the process of establishing one or more cut scores on a
test” (Cizek & Bunch, 2007, p. 13). The role of cut scores is to create two or more contrasting
groups of examinees according to the test scores obtained or related with predefined categories.
The students’ scores in national exams, in conjunction with pressures for uniformity of testing,
raise numerous issues of reliability and validity. According to Messick, “validity, reliability,
comparability, and fairness are not just measurement issues, but social values that have meaning
and force outside of measurement wherever evaluative judgments and decisions are made”
(1994, p. 2).
72
There are three sources in the test content for defining the domain to be tested and the
domain of inference from a test performance: “inferences to a curricular domain, inferences to a
cognitive domain, and inferences to future performances” (Millman & Greene, 1989, p. 336).
Cizek suggested the following definition of standard setting “standard setting as is the
proper following of a prescribed, rational system of rules or procedures resulting in the
assignment of a number to differentiate between two or more states or degrees of performance"
(1993, p. 100). Accordingly, throughout this thesis all the teacher’s work is called “standard
setting”.
The process of standard setting can be divided into two aspects: a set of rules and procedures
necessary to implement the process and the achievement of fair results. But fairness is, “to some
degree, biased and interrelated with “persons' preferences, perspectives, biases, and values”
(Cizek, 2006, p. 15).
Not all the contemporary theorists and practitioners shared the same point of view about
standard setting. Jaeger emphasized that “a right answer - in standard setting - does not exist
except, perhaps, in the minds of those providing judgment” (Jaeger, 1989, p. 492). As Cizek
remarked (2001), “standard setting is perhaps the branch of psychometrics that blends more
artistic, political, and cultural ingredients into the mix of its products than any other” (p. 5).
For many years there were two groups of standard-setting methods considered: test standard
methods and examinee-centred methods (Cizek & Fitzgerald, 1996; Jaeger, 1989; M. Kane,
1998). But with the appearance of new standard-setting methods that classification became
limited. To answer to that limitation, Hambleton, Jaeger, et al. (2000) proposed a new approach
centred in judgments by panellists, divided in four categories:
1. Methods that involve review of test items and scoring rubrics;
2. Methods that involve review of candidates;
3. Methods that involve looking at candidate work;
4. And methods that involve panelist review of score profiles.
Some methods are better suited to certain types of tests or circumstances, but even in this
case there are rules that indicate if a particular method must or must not be used with a
particular type of test in a particular circumstance. Considering these four dimensions and the
data collected, the following three methods were applied in this research: the Angoff Method,
involving review of test items and scoring rubrics; the Contrasting Groups Method, involving a
73
review of candidates; and the Beuk Method, considered a hybrid method. A review of these
methods’ literature can be found in Brandon (2002).
The most commonly used method for setting performance standards is the Angoff Method
and all its variations (M. Kane, 1994; Meara, Hambleton, & Sireci, 2001; Plake, 1998). Mills
and Melican (1988) justified the countless applications of this method with the fact that it is not
“difficult to explain, and data collection and analysis are simpler than other methods in this
category.”
This method was first revealed in the “Scales, Norms, and Equivalent Scores” (Angoff,
1971), with two variations: one in the main text and another in footnote. The version in the main
text is a simple version of the method (that Angoff attributed to Ledyard Tucker), “in which the
standard-setting panellist provides an estimate of whether” (Koretz & Hamilton, 2006) a
minimally competent examinee could give a correct answer or not. This version of the method
is usually mentioned in the literature “as the yes/no method” (Impara & Plake, 1997) or item
score string estimation method (Loomis & Bourque, 2001). Ironically, the method described in
a footnote in the chapter is the one most commonly used and it is known as the Angoff method.
In that method, panellists analyses multiple-choice items and estimate for minimally competent
examinees, the probability of a correct answer in each item. The ratings obtained by each
panellist are the result of sum of the items probabilities in the test. The performance standard is
determined by an average of those ratings. The process can, of course, be repeated to set
multiple performance standards.
According to some researchers Reckase and Bay (1999), the estimation of minimally
competent performance tend to be lower for the lower performance standards and higher for the
higher performance standards.
A great number of implementations of the method use the term “Extended Angoff” or
“Modified Angoff” to reflect the addition of elements such as the provision of empirical item
data to participants, encouragement of discussions among panellists, and the conduct of several
rounds of ratings to enable panellists to revise their estimates (Mills, 1995).
The extended Angoff procedure described above was used in the Portuguese exams due to
the existence of polytomously scored items. Following a study by Hambleton and Plake (1995),
the method was applied to a multidimensional performance assessment. Instead of providing an
estimate of the proportion of minimally competent examinees that would get a multiple-choice
item correct, in this extended version panellists gave an estimate of the expected score a
minimally competent examinee would obtain on a polytomously scored item.

74
In Hambleton and Plake (1995), panellists estimated the scores a borderline examinee would
get on each of the three dimensions used to score, on a four-point scale, each performance task
for the National Board of Professional Teaching Standards (NBPTS) certification exam. Then
these estimates were summed to derive the expected score for the borderline examinee on each
exercise. Similarly to the previous study, in Physics and Chemistry exams two dimensions were
used, on a four-point scale for polytomous items, and a yes/no scale for multiple-choice items,
in each exam.
Hambleton and Plake (1995) observed that although the Angoff method is a fully
compensatory model, in which a high score on one exercise can balance a low score on another
exercise, the standard that was ultimately set was not solidly in line with the panellists’
preferences.
The Contrasting Groups Method is in the second category since it requires direct ratings of a
sample of candidates. For educational assessment, students are placed into performance
categories or on the borderlines of performance categories.
In this method, judges identify one group of examinees whose members are undoubtedly
above a performance standard and another group whose members are below that performance
standard. Then, the test score distributions of these two groups are compared to select the
performance standard.
There are several approaches for determining the performance standards using this method.
On the study of the Portuguese exams the method was applied with two performance categories,
but it is easily extended to more than two categories by asking judges to sort known candidates
into more than two performance categories, with the approach to data analysis being basically
the same as for two categories.
Livingston and Zieky (1982) described dividing the score scale into intervals and calculating
the percentage of examinees at each level who are judged to be qualified; this distribution can
then be smoothed, and the point at which 50% of the candidates were judged qualified was used
as the performance standard. An alternative approach is to select the test score that results in the
fewest “false positive” mistakes (categorizing a below-standard candidate as meeting the
standard) and “false negative” mistakes (categorizing an above-standard candidate as not
meeting the standard) or some weighted combination of the two types of mistakes. Also, logistic
regression can be used to find the test score that minimizes these two types of errors (Livingston
& Zieky, 1989). This approach was also used by Sireci, Rizavi, Dillingham, and Rodriguez
(1999).

75
An expected approach is to use ratters who are familiar with the examinees, which is not
difficult in the context of an educational assessment, where teachers are familiar with the
capabilities of their students. Even in that setting, however, there is the danger of the
performance standards not being generalized beyond the examinee sample used for analysis
(Hambleton, Jaeger, Plake, & Mills, 2000). An additional difficulty may arise in the contrasting
groups approach when score distributions overlap and a clear separation to be used as the
performance standard is not apparent.
The two standard-setting methods considered above could be termed “absolute” methods in
that they attempt to establish a performance standard that is not influenced by normative
information. On the other end, performance standards are called “relative” or “normative”
standards (Nedelsky, 1954) if they reflect norm-referenced procedures, such as setting a
performance standard to establish a certain percentage of passing examinees. As Cizek (1996)
noted, in the 1970s absolute performance standards became more popular and in most cases
replaced normative ones. However, several methods were developed in an attempt to affect a
compromise between relative and absolute standards. One of these methods is the Beuk Method,
described next, and intended for high-stake assessment with a single pass/fail performance
standard, and can be used in several ways. It can be used as an unattached procedure to set
performance standards or it can be used as a paired process to adjust scores obtained by other
standard-setting methods. As such, Cizek observed that these methods can be seen as balancing
two competing perspectives: a cognitive one linked to the judgmental task panellists are asked
to undertake, and a political one tied to the realities resulting from setting a given performance
standard.
In order to implement the Beuk (1984) method, panellists provide two judgments: (1) the
percentage of correct answers that a minimally competent examinee should be able to get, based
on the total possible test score, and (2) the expected pass rate for the examinee population. The
mean and standard deviation of these judgments are calculated over the panellists. An adjusted
value for per cent correct passing score and passing rate is obtained by graphing a line that takes
the panellist values into account and determining its intersection with the curve linking pass
rates (vertical axis) to possible passing scores (horizontal axis) using the distribution of
candidate total test scores. Actually, as noted by Mills, the adjustments to per cent correct and
passing rate will be smaller in the extent to which the panellists agree on their estimates of the
two values. Graphical interpretations of this method may be found in Beuk (1984), Cizek
(1996), and Mills (1995). In this compromise method panellists who do not have a great deal of
76
experience with the performance of examinees may find it difficult to estimate a passing rate for
them.
These three chosen methods “can be applied either before or after the test is administered”
(Livingston & Zieky, 1982, p. 15). This brings one question: “What sort of things do we want to
make inferences about, in order to understand students' learning? Questions like this one
presented significant challenges for psychometricians for decades” (Mills & Melican, 1988, p.
266).
The information about how students learn to integrate structures and patterns into their
perception, understanding, and action are important to build assessment tools.
Since a detailed analysis of cognitive psychology is not the main issue of this thesis, in this
review of literature, only some points of cognitive analysis connected to assessment over the
past years are shown. The cognitive analysis in assessment can be viewed through an
information-processing perspective and a socio-cultural or situational perspective. The focus
information-processing perspective focuses on the rules, principles, and methods for working
with structured information, since
“(…) there exist different integrations of knowledge, different degrees of procedural skill,
and differences in rapid access to memory and in representations of the tasks one is to perform.
The fundamental character, then, of achievement measurement is based upon the assessment of
growing knowledge structures, and related cognitive processes and procedural skills that
develop as a domain of proficiency is acquired. (Glaser, Lesgold, & Lajoie, 1987, p. 77)”
The socio-cultural or situational perspectives connect action and interaction in material and
social situations, in particular
“(…) the situative view of assessment emphasizes questions about the quality of students'
participation in activities of inquiry and sense-making, and considers assessment practices as
integral components of the general systems of activity in which they occur. (Greeno, Collins, &
Resnick, 1997, p. 37)”
There are also two major domains in human cognition: knowledge and learning, revealing
different levels of phenomena and cognitive processes. Assessment depends on all these aspects,
and understanding about which “level a processing model or an assessment argument addresses,
helps sort out issues of design and inference in practical applications” (Mislevy, 2006, p. 269).
A way to understand human behaviour is to analyse the interaction among a “person and a
situation”, and “mediated by the patterns through which the person interprets” the situation,
“both experientially and reflectively”(Mislevy, 2008). There are two modes of cognitive
77
activity: “the experiential mode and the reflective mode” (Norman, 1993, p. 15). The
experiential mode allows seeing illuminated objects in space, including the recognition of
people and objects, and estimates their distance, built in from the visual processing at the retina.
The reflective mode depends on the concentration and the ability of the working memory. The
effectiveness of reflective cognition is related with the nature, the size, and the portions
activated from long-term memory. For instance, remembering nine arbitrary digits is a test,
nevertheless to a Portuguese remembering the sixteen digits “1139164019101974” it is not
difficult; it can be deconstructed in four portions, each a significant date in Portuguese history.
Discussing the performance of patterns in a sequence of situations leads toward the concept
of perception that can be seen as conciliation between patterns detected in the surroundings, and
memorized patterns. According to Mislevy “higher-level knowledge from long-term memory
provides patterns for perception” (2006, p. 274). As Rumelhart stated
“Perceptual experience is shaped by and in turn shapes the ever-accumulating patterns
that constitute long-term memory. If perception is an active process (selecting, building,
and tailoring representations from currently available schemas,) then learning is all the
more dynamic: extending, modifying, and replacing elements to create new structures.”
(1980)
Since “as with other types of experiential learning, aspects of spatial/visual patterns are more
apt to modify long-term memory for subsequent perception” (Mislevy, 2006, p. 274).
Examples of knowledge representations in Physics and Chemistry include graphs, wiring
diagrams, time schedules, mathematical notation and formulas.
A discussion about internal representation of knowledge is always connected with the
knowledge of structures, and the importance of planning optimal instruction, because it is
connected with students’ reasoning about finding experiences that are most likely to move
thinking to the next level, to set the stage “for accommodation, in Piaget’s developmental
terms”. Mislevy also remarked that “an optimal assessment would reveal key facets of a
student’s understanding, to identify the student’s zone of proximal development, in Vygotsky’s
socio-cultural terms” (2006, p. 277).
Many analyses have been carried out in physics in order to reveal students' conceptions and
misconceptions. Misconception research provides backing for assessment warrants. The
targeted inference is “What can this student be thinking of so that what he/she has just said
makes sense to him/her?” (Thompson, 1982) The Force Concept lnventory (FCI) of Hestenes,
Wells, and Swackhamer's (1992) contains multiple choice tasks about conceptions and
78
misconceptions, built around key concepts in introductory mechanics. Another study carried out
by Frederiksen and White (1988) based on “implicit assessment inside an intelligent tutoring
system was designed to bring students through a sequence of increasingly sophisticated models
for electricity”. Minstrell (2000) used open-ended in order to reveal students' thinking about
gravitation effects. Minstrell “has identified common conceptions and misconceptions, facets in
a number of domains by working from responses to open-ended tasks and from his experience
in the classroom”. Like in Frederiksen and White's models ‘sequence Minstrell's facets “reflect
levels of understanding”.
One of the recent studies in Physics about electricity and magnetism (Ding, et al., 2006) is
centred in the assessment of the “reliability and discriminatory power of Brief Electricity and
Magnetism Assessment (BEMA,) and uses statistical tests focusing both on item analysis (item
difficulty index, item discrimination index, and item point biserial coefficient) and on the entire
test (test reliability and Ferguson’s delta)”. Another research concerning energy assessment
(Ding, 2007) encompassed two major components: the first component was the design of a valid
and consistent tool for assessment and the second component concerned the evaluation of
students’ understanding of the topics on energy. The interviews indicated that students were
capable of performing qualitative analysis without using exact formulas and were able to
correctly use the energy principle to tackle physics questions, if they chose to start from the
fundamental principles. It was not possible to interview the Portuguese examinees that
performed the chosen exams in the time period considered to assess common conceptions and
misconceptions. Still, the same dimensions proposed by Ding (2007) were considered:
- Content dimension with three content levels (fact, concept and principal) and
- Cognitive dimension with three cognition levels (recall, comprehend and apply.)
According to Mislevy et al. (2007), assessment can be basically “structured around the
knowledge, relationships, and uses of the domain representations” (recall, comprehend and
apply.) In a higher level, assessment tasks include transforming “information from one
representation to another, using representations to coordinate actions in situations and
interactions” (synthesis and creation.)
Quantitative measurement, to whatever extent and whatever contexts it may be reflected in
patterns of test scores, would be an emergent property of cognitive activities and resulting
actions in particular contexts. A useful approximation may be found when assessing a certain
collection of students with a certain collection of tasks under certain circumstances. But the

79
model should be verified, not presumed, and the interpretation should be through model
parameters, and not only observed scores (Wright & Linacre, 1989).
One way to understand setting standards is to combine cognitive research to design tasks and
define evaluation rules, and the resulting scores to discuss students’ capabilities at the coarse
level of overall proficiency.
The literature review supported the adopted methodology, and its in depth description is
present in the following point.

80
81
4 Methodology
“Method is the attribute which distinguishes research activity from mere
observation and speculation.” (Shulman, 1988, p. 3)
The organization of this chapter is initially focused on the collection of data which led to a
methodology centred firstly on the organization of the exam results and the creation of a
database of national exams, and secondly on the selection of exam items involving Physics and
Chemistry contents.
The close interdependency between learning dynamics and exam results through nearly half
a century led us to a combination of several research methods based on documental techniques,
mainly digital ones; surveys, content and cognition level analysis with the results obtained from
distinct groups, in items with previously selected contents. A verification of the average
difficulty and the item discrimination index was performed simultaneously.
The general methodological choice is closely related to the questions raised and the type of
final product desired. The analysis allows investigating the existence of possible differences
between examinees, and its interpretation can promote improvements in the teaching and
learning process.
Keeping in mind the existing statistical data and the item format in exams, the application of
the psychometric tools combined several adaptations:
82
1. In the period between 1950 and 1999,
a) Beuk Method (1972, 1982, 1983, 1984), as a holistic method;
b) Contrasting Groups Method, with the variation based on the average grades of the items
proposed by Irwin, Bunckendahl, and Poggio (2007).
2. In the period between 2000 and 2005,
a) Beuk Method (2004, 2005), as a holistic method;
b) Extended Angoff Method (2004, 2005), with the True/False Angoff variation, suggested
by Impara and Plake (1998, p. 69) for multiple choice items, and the Angoff Method extension,
proposed by Hambleton and Plake (1995, p. 41) for the remaining items;
c) Contrasting Groups Method, with an adaptation of the linear regression model indicated
by Cizek and Bunch (2007, p. 109).
The study also included an analysis of the content and cognition of exam items. The
selection of the 12 items was based in two criteria: the two Physics and Chemistry contents
belong to different curricular units and, on the other hand, those contents were touched on by
the 2003, 2004, and 2005 1st phase, 1st exams call. The twelve selected multiple-choice items
can be found in Appendix 2 along with the solutions. The statistical analysis of the examinees’
results included a numerical presentation, showing item difficulty and to which point the items
discriminate, and a graphical presentation which relates the grades achieved in the items with
the two dimensions: content and cognition (Ding, 2007).
4.1 Sampling and Data Collection
The data collection led to a methodology centred firstly in the organization of exam results and
creation of a national exam database, followed then by the selection of exam multiple-choice
items regarding subjects of Physics and Chemistry.
The close relationship between learning dynamics and exam results of this last half-century
have led us to formulate several investigative methods based on:
83
A. Documental techniques
Documental techniques, namely digital ones, allow for an intensive approach privileging the
creation of a digital archive of national exams and the consultation of information using, for
example, the Biblioteca do Conhecimento Online (B-on) [Online Library of Knowledge] and
the Estatística Nacional do Ensino Secundário (ENES) [Secondary School National Statistics]
and the Instituto Nacional de Estatística (INE) database. We also employed classical techniques
such as the analysis of educational policy documents (legal diplomas, curricular reforms, and
exam jury reports), the consultation of exam results in more than 20 schools, and the exploration
of chronicles and articles produced by the media regarding exams. Naturally, the documental
research is not limited to the national exams. It extends to studies regarding item content, item
types, and cognitive items level.
The documental analysis embraces very diverse realities and perspectives and allows the
researcher to broaden their theoretical scope, to comparatively localize their problem, find other
results, and clarify ideas. According to Albarello et al. (1997), this analysis encompasses three
great dimensions: a) scientific culture; b) theoretical framework; c) results and operational
techniques; and uses essentially written documents – books, reports, and other sources.
Beyond the previously mentioned, other sources used in this research were:
- The consultation of the Arquivo Histórico do Ministério da Educação (AHME, Historical
Archive of the Ministry of Education) at the Secretaria Geral do Ministério da Educação
(SGME, General Secretariat of the Ministry of Education) was centred in: Direcção Geral do
Ensino Liceal (DGEL, Directorate General of High School Education), series: 3 – Teacher
Reports; 11 – Student Appeals; 12 – Exam tests; 13 – Miscellaneous; 16 – Exams; and 30 –
Curricular Commission, including the scanning of documentation from 139 folders. This survey
allowed for the collection of exams from before the Pires de Lima Reform, grade improvement
appeals, and reports on teacher activity;
- Libraries, such as: Biblioteca Nacional (BN, the Portuguese National Library), Biblioteca
da Escola Superior de Educação de Lisboa ( BESEL, Library of the Lisbon School of
Education), Biblioteca da Faculdade de Ciências e Tecnologia da Universidade Nova de Lisboa
(BFCT-UNL, Library of the College of Sciences and Technology of the New University of
Lisbon), Biblioteca da Faculdade de Ciências e da Faculdade de Psicologia e Ciências da
Educação da Universidade de Lisboa (BFC-UL, Library of the College of Sciences, and FPCE-
84
UL, College of Psychology and Educational Sciences of the University of Lisbon), Centro de
Recursos do Instituto de Inovação Educacional (CR-INE, Resource Centre of the Institute of
Educational Innovation), and Fundação Mário Soares (FMS, Mário Soares Foundation). In
addition to consulting books, this research encompassed the scanning of information regarding
exams in magazines and national periodicals, namely: Arquivo Pedagógico (Pedagogical
Archive), Boletim do Ensino Secundário (Secondary Schooling Bulletin), Boletim do Liceu
Normal de Lisboa (Normal High School of Lisbon Bulletin), Boletim Oficial do Ministério da
Educação (Official Ministry of Education Bulletin), Diário de Lisboa (Lisbon Diary, between
June and September, 1950 to 1980), Gazeta da Física (Physics Gazette), Labor (Labour), Liceus
de Portugal (High Schools of Portugal), O Jornal do Professor (The Teacher’s Newspaper), O
Professor (The Teacher), Palestra (Lecture), Revista da Educação (Education Magazine),
Revista da Pedagogia (Pedagogy Magazine), Revista de Portugal (Portugal Magazine), and
Revista Portuguesa de Pedagogia (Portuguese Magazine of Pedagogy). This systematic
collection of information regarding exams in a period greater than 50 years allowed for a better
understanding of the evolution of exams in Portugal.
To analyse test scores, two levels of comparisons were carried out: per total scores, and per
item scores. The collection of test scores between 1950 and 2000 was done in four schools,
between 2000 and 2003 included 24 schools, and between 2004 and 2005 all students were
considered. The size of the sample constrained the methodology. Tables 3 to 8 show the total
examinees’ test scores collected. Due to the large volume of information collected there was the
need to photograph the exam rosters and the final rosters, with the students’ grades.
To Bell (1991) some “conditions and guarantees proffered for a school based research
project are: all participants should have the opportunity to remain anonymous; all information
should be treated with the strictest confidentiality; and participants will receive a copy of the
final study”. Even though the exam rosters are published at each school come exam time, and
thus cannot be considered confidential, each school’s management organizations were that those
rosters would not be made public to avoid comparisons. Unlike the rosters, the results of the
students’ performance are confidential, and so they were transposed, item-by-item, to a grid for
a later statistic treatment.
According to Bailey (1978), “where simple random sampling is used, the sample size needed
to reflect the population value of a particular variable depends both on the size of the population
and the amount of heterogeneity in the population”. Cohen, Manion and Morrison (2001, p. 93)
stated that “there is no clear-cut answer in support of the correct sample size, as that depends on
the purpose of the study and the characteristics of the population under scrutiny”, but it is
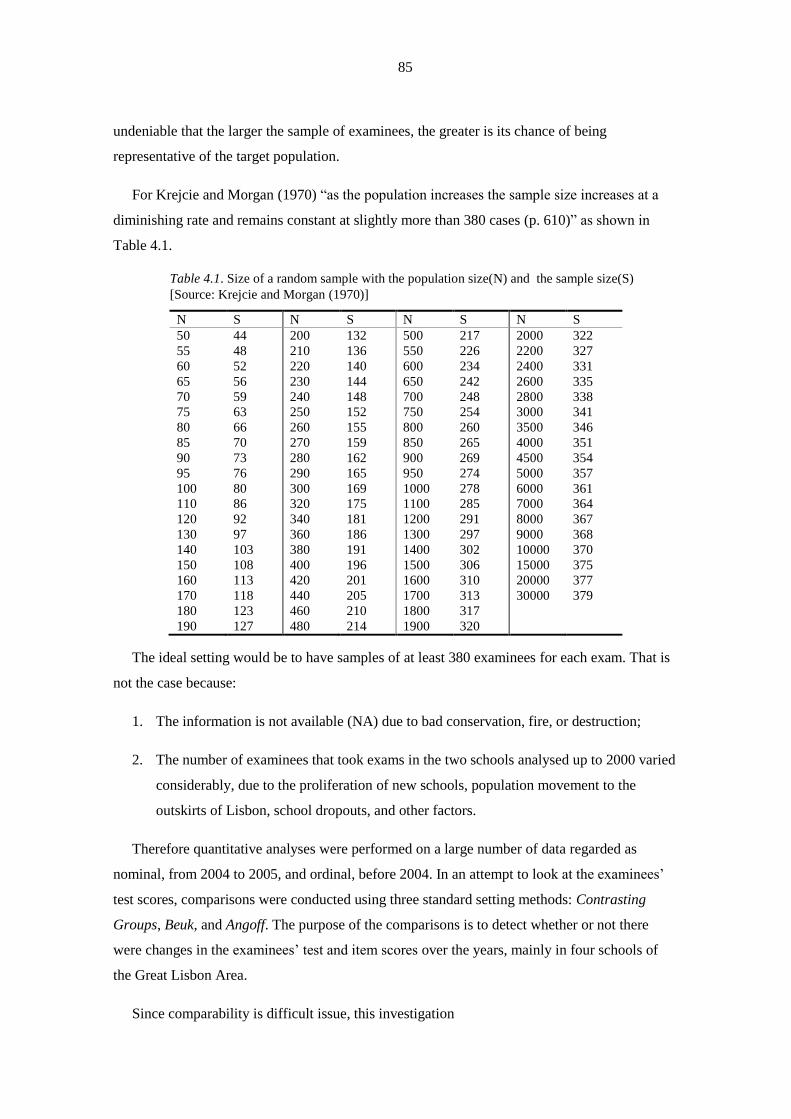
85
undeniable that the larger the sample of examinees, the greater is its chance of being
representative of the target population.
For Krejcie and Morgan (1970) “as the population increases the sample size increases at a
diminishing rate and remains constant at slightly more than 380 cases (p. 610)” as shown in
Table 4.1.
Table 4.1. Size of a random sample with the population size(N) and the sample size(S)
[Source: Krejcie and Morgan (1970)]
N S N S N S N S
50
55
60
65
70
75
80
85
90
95
100
110
120
130
140
150
160
170
180
190
44
48
52
56
59
63
66
70
73
76
80
86
92
97
103
108
113
118
123
127
200
210
220
230
240
250
260
270
280
290
300
320
340
360
380
400
420
440
460
480
132
136
140
144
148
152
155
159
162
165
169
175
181
186
191
196
201
205
210
214
500
550
600
650
700
750
800
850
900
950
1000
1100
1200
1300
1400
1500
1600
1700
1800
1900
217
226
234
242
248
254
260
265
269
274
278
285
291
297
302
306
310
313
317
320
2000
2200
2400
2600
2800
3000
3500
4000
4500
5000
6000
7000
8000
9000
10000
15000
20000
30000
322
327
331
335
338
341
346
351
354
357
361
364
367
368
370
375
377
379
The ideal setting would be to have samples of at least 380 examinees for each exam. That is
not the case because:
1. The information is not available (NA) due to bad conservation, fire, or destruction;
2. The number of examinees that took exams in the two schools analysed up to 2000 varied
considerably, due to the proliferation of new schools, population movement to the
outskirts of Lisbon, school dropouts, and other factors.
Therefore quantitative analyses were performed on a large number of data regarded as
nominal, from 2004 to 2005, and ordinal, before 2004. In an attempt to look at the examinees’
test scores, comparisons were conducted using three standard setting methods: Contrasting
Groups, Beuk, and Angoff. The purpose of the comparisons is to detect whether or not there
were changes in the examinees’ test and item scores over the years, mainly in four schools of
the Great Lisbon Area.
Since comparability is difficult issue, this investigation

86
“will involve comparing examinations in the same subject and at the same level, which
means that the following very strict definition of comparability can be used: Two
examinations are comparable if pupils who demonstrate the same level of achievement
obtain the same grade. In practice, the difficulty is defining and identifying what is meant
by the same level of achievement for a one syllabus.” (Bell & Dexter, 2000)
There is diversity of approaches for this type of research, and three generic approaches were
used to investigate this type of comparability:
Using measures of previous results (internal final grade - IFG);
Using measures of concurrent outcomes (Exam Grade - EG);
Expert judgement of the qualifications (panel of qualified teachers).
To investigate the examinees’ performance the three approaches were applied “but they have
been separated since the advantages and disadvantages are different”(Bell & Dexter, 2000).
Since these methods involved measures of exam grades, the statistical procedure was similar
to the study produced by Giraud et al. (2000), in which information from schools, in the form of
teacher ratings and course information from schools, was triangulated with the results of several
standard-setting methods (Angoff, Contrasting Groups, and Borderline Group). Although one of
their conclusions was that the collection of the criterion information could take the place of
conducting standard setting studies, they also acknowledged that it could be used to support the
findings if such studies were conducted. Jaeger (1989) presented a summary of 12 studies in
which 32 contrasts across methods were made, and suggested that, when possible, several
methods should be used in a given study and their results considered in conjunction with other
factors such as item content and cognition level.
Despite the evidence that different methods usually produce different performance standards,
Zieky (2001) gave evidence that standard-setting comparisons across methods are useful, based
on research findings in the area.
Performance levels are based on cut scores. The cut scores of standard setting are arguable
(Falk, 2000, p. 86) because they depend on judgments made by teachers. A valid approach is
based on standards which can be defined as “expectations for teaching and learning (Wilde,
1998, p. 79).” The setting of a cut score contains subjective elements, however according to
Popham it is incorrect to “equate human judgment with arbitrariness in this negative sense
(Valadares & Graça, 1998),” as Glass (1998) does, since that also involves a judgement.
87
B. Surveys
Since standard setting is a judgmental process, panellists (also occasionally called judges) are
very important. The surveys (combined with groups of exams considered representative of the
different areas studied) were submitted to a qualified panel of guest teachers, including authors
of national exams, consultants, auditors, adjunct teachers, and teachers who grade the national
exams. Knowledge about the content was the most important condition in panel selection since
standard-setting methods often involve “complex judgments and insights into factors such as
school curricula, the abilities of examinee groups, the characteristics of test items that determine
their difficulty, and the demands likely to be placed on examinees later in their education”
(Hambleton & Pitoniak, 2006, p. 451). The goal of these surveys was to apply the Beuk (10
panellists) and Extended Angoff (25 panellists) Methods to the exam results in previously
selected schools. The analysis of the results allowed for the validation of some of the proposed
hypotheses.
C. Analysis of content and cognition level of multiple-choice exams items from
2003 to 2005
The study of the differences of skills and processes in terms of understanding, application and
grades in six exams (3 of Physics and 3 of Chemistry) was centred on 12 multiple-choice items
involving similar contents.
From the analysis content and cognition level of those twelve items, two Physics subject
topics and two Chemistry subject topics have been chosen:
Physics – Rotational Motion and Gravitation;
Chemistry – Intermolecular Bounds and Gas Laws, and Energy and Entropy in chemical
reactions. Over the period between 2003 and 2005 there were no changes in content approach,
since according to Murphy “comparability within a subject is likely to be more feasible,
especially within the context of national secondary education” (Boyle & Christie, 1996, p. 90).
The twelve items were categorized independently by two physics and chemistry teachers
both in content and cognition dimension. According to Ding (2007) in general, the three lower
content levels (facts, concepts, principles) and the three lower cognition levels (recall,
comprehend, apply) are suitable to categorize multiple-choice items. The descriptions used to
categorize the content and the cognition levels are in section 4.3.
88
4.2 Standard Setting Methods
There are several standard-setting methods used to analyse the performance of examinees,
linked with the expectations raised during the school year.
In order to reach the goals, this research starts with the analysis of performance standards,
based on the expectations regarding the students’ performance. Those expectations are
processed in order to reveal competence levels obtained by distinct groups of examinees using
three Methods: Contrasting Groups, Beuk and Extended Angoff.
A. Contrasting Groups Method
One of the goals of this study is to search for distinct examinee groups in examinations since
1949, covering a total of 68 193 examinees.
The global performance of examinees was explored using the Contrasting Groups Method,
which allowed for the maximum distinction between two groups of students, and revealed
deviations from the final internal grade, when compared to the Exam Grade.
This method, proposed by Berk (1976), considered to be examinee-centred (M. Kane, 1995),
was chosen due to its simple implementation and easy understanding.
Initially the examinees are divided in two distinct groups, based on being graded or not by
teachers. Then the graded examinees are divided in two distinct groups, based on an evaluation
of their knowledge and competence. For instance, for internal students the selection was made
by thousands of teachers which, by assigning an Internal Final Grade (IFG) to each student,
allowed for the detection of a group of examinees whose elements are clearly below a given
performance standard, and of another group whose elements are above that level. This is not a
matter of labelling these groups comparatively to their Internal Final Grade, but rather of
observing up to which point this classification matches the Exam Grade (EG).
Since the examinee sample should be large and descriptive of the target examinees, the
universe of examinees was the largest possible in order to obtain more data on the differences
between the IFG score and the Exam Grade of each student, and to lower the risk of the cut
score greatly deviating from the IFG for each examinee.
Keeping this in mind, examinees who took these exams were assigned to the following
groups:

89
Group A – students that applied for examination without being graded by teachers;
Group B – students that received effective instruction with Internal Final Grade scores;
Group B1 – students that received effective instruction with Internal Final Grade scores
between 10 and 13, considered as barely competent;
Group B2 – internal students with Internal Final Grade scores above 13.
In defining Group B1 and Group B2 it is important to remember the following:
a) By considering the IFG to divide the internal students into two groups one assumes that
all their grades are based on the same criteria. The teachers know the examinees personally and
graded them throughout the school year, based on their knowledge and skills of the curricula
contents and, regarding in particular the significant core of objectives and contents of the
curriculum that determined the content syllabus of this examination. Even if we consider that
any grading is susceptible to error, according to Cizek & Husband (Cizek & Husband, 1997, p.
18), “the error rate does not seem to have a substantial effect on the raw score accuracy of the
examinee’s universe”;
b) The students with a IFG between 10 and 13 were considered as barely competent,
meaning they have the basic requirements to take this examination and obtain a passing grade.
This interval was not chosen randomly. Depending on the sample characteristics of each
examination, the choice of this IFG interval is justified by the average of the results achieved by
the examinees and by the Livingston and Zieky’s (1982) proposal to organize two groups with
similar percentage of internal examinees.
This method was applied, between 1949 and 1973, to the Physics-Chemistry exams of the 9th
(2nd cycle) and 11th grade (3rd cycle) in two schools in the Lisbon area.
The three following tables show the distribution of examinees by grade, during the first three
decades.
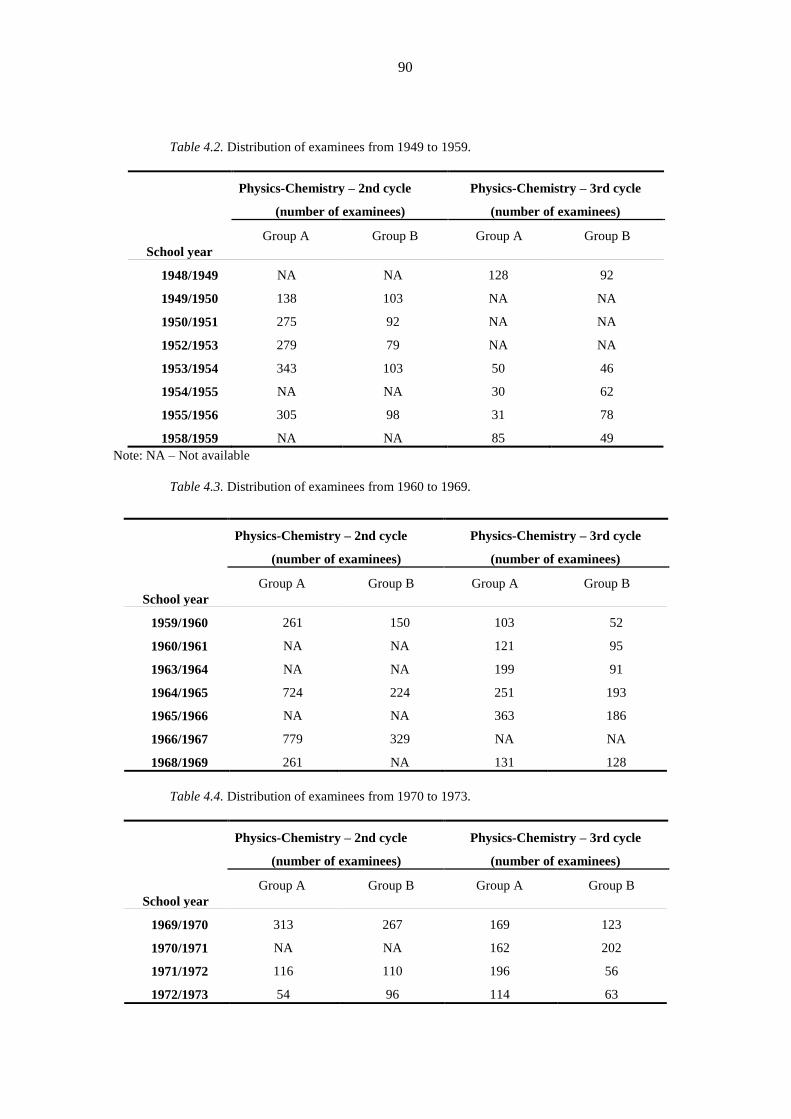
90
Table 4.2. Distribution of examinees from 1949 to 1959.
School year
Physics-Chemistry – 2nd cycle
(number of examinees)
Physics-Chemistry – 3rd cycle
(number of examinees)
Group A Group B Group A Group B
1948/1949 NA NA 128 92
1949/1950 138 103 NA NA
1950/1951 275 92 NA NA
1952/1953 279 79 NA NA
1953/1954 343 103 50 46
1954/1955 NA NA 30 62
1955/1956 305 98 31 78
1958/1959 NA NA 85 49
Note: NA – Not available
Table 4.3. Distribution of examinees from 1960 to 1969.
School year
Physics-Chemistry – 2nd cycle
(number of examinees)
Physics-Chemistry – 3rd cycle
(number of examinees)
Group A Group B Group A Group B
1959/1960 261 150 103 52
1960/1961 NA NA 121 95
1963/1964 NA NA 199 91
1964/1965 724 224 251 193
1965/1966 NA NA 363 186
1966/1967 779 329 NA NA
1968/1969 261 NA 131 128
Table 4.4. Distribution of examinees from 1970 to 1973.
School year
Physics-Chemistry – 2nd cycle
(number of examinees)
Physics-Chemistry – 3rd cycle
(number of examinees)
Group A Group B Group A Group B
1969/1970 313 267 169 123
1970/1971 NA NA 162 202
1971/1972 116 110 196 56
1972/1973 54 96 114 63
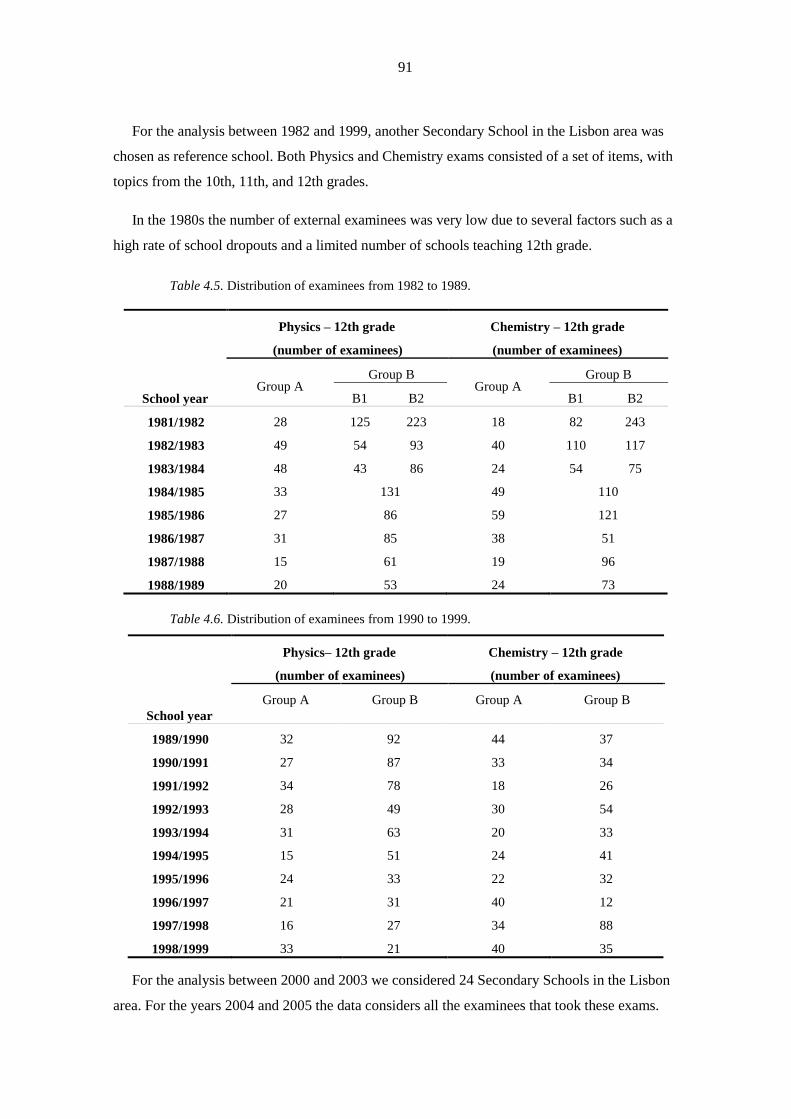
91
For the analysis between 1982 and 1999, another Secondary School in the Lisbon area was
chosen as reference school. Both Physics and Chemistry exams consisted of a set of items, with
topics from the 10th, 11th, and 12th grades.
In the 1980s the number of external examinees was very low due to several factors such as a
high rate of school dropouts and a limited number of schools teaching 12th grade.
Table 4.5. Distribution of examinees from 1982 to 1989.
School year
Physics – 12th grade
(number of examinees)
Chemistry – 12th grade
(number of examinees)
Group A Group B
Group A Group B
B1 B2 B1 B2
1981/1982 28 125 223 18 82 243
1982/1983 49 54 93 40 110 117
1983/1984 48 43 86 24 54 75
1984/1985 33 131 49 110
1985/1986 27 86 59 121
1986/1987 31 85 38 51
1987/1988 15 61 19 96
1988/1989 20 53 24 73
Table 4.6. Distribution of examinees from 1990 to 1999.
School year
Physics– 12th grade
(number of examinees)
Chemistry – 12th grade
(number of examinees)
Group A Group B Group A Group B
1989/1990 32 92 44 37
1990/1991 27 87 33 34
1991/1992 34 78 18 26
1992/1993 28 49 30 54
1993/1994 31 63 20 33
1994/1995 15 51 24 41
1995/1996 24 33 22 32
1996/1997 21 31 40 12
1997/1998 16 27 34 88
1998/1999 33 21 40 35
For the analysis between 2000 and 2003 we considered 24 Secondary Schools in the Lisbon
area. For the years 2004 and 2005 the data considers all the examinees that took these exams.
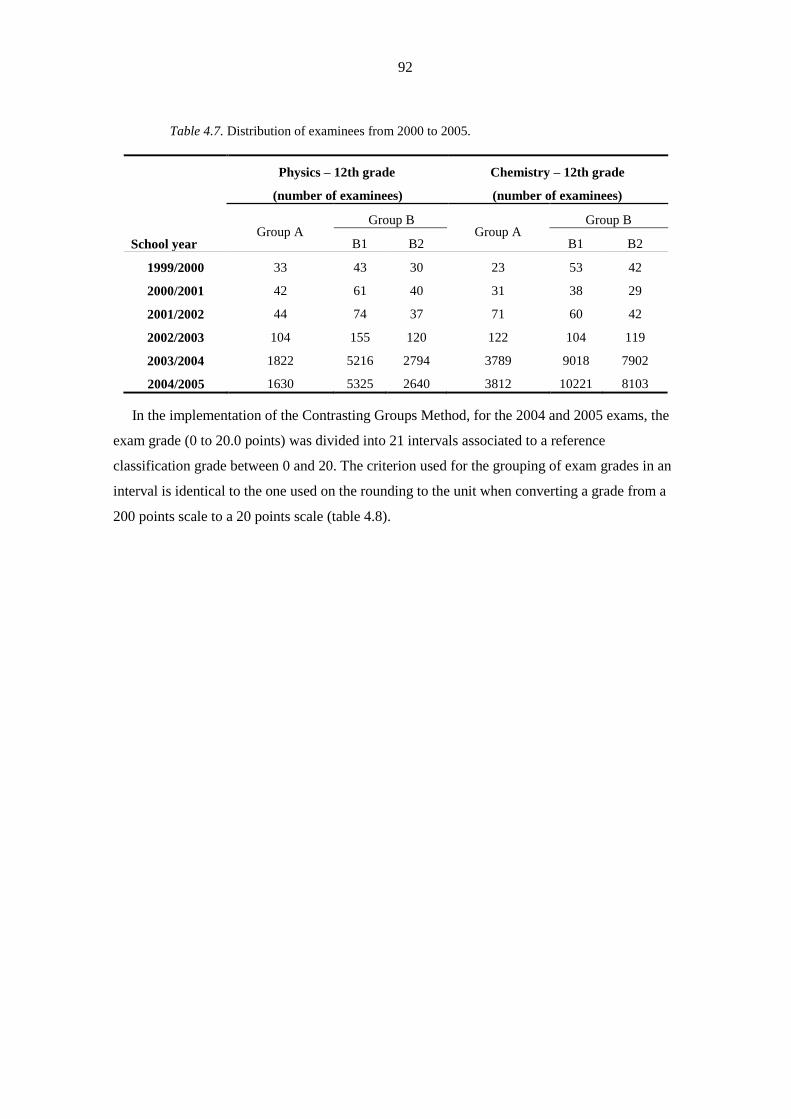
92
Table 4.7. Distribution of examinees from 2000 to 2005.
School year
Physics – 12th grade
(number of examinees)
Chemistry – 12th grade
(number of examinees)
Group A Group B
Group A Group B
B1 B2 B1 B2
1999/2000 33 43 30 23 53 42
2000/2001 42 61 40 31 38 29
2001/2002 44 74 37 71 60 42
2002/2003 104 155 120 122 104 119
2003/2004 1822 5216 2794 3789 9018 7902
2004/2005 1630 5325 2640 3812 10221 8103
In the implementation of the Contrasting Groups Method, for the 2004 and 2005 exams, the
exam grade (0 to 20.0 points) was divided into 21 intervals associated to a reference
classification grade between 0 and 20. The criterion used for the grouping of exam grades in an
interval is identical to the one used on the rounding to the unit when converting a grade from a
200 points scale to a 20 points scale (table 4.8).

93
Table 4.8. Distribution table of the exam grades (EG) in 20 reference grades.
Reference Grade EG Interval
0 [0,4]
1 [5,14]
2 [15,24]
3 [25,34]
4 [35,44]
5 [45,54]
6 [55,64]
7 [65,74]
8 [75,84]
9 [85,94]
10 [95,104]
11 [105,114]
12 [115,124]
13 [125,134]
14 [135,144]
15 [145,154]
16 [155,164]
17 [165,174]
18 [175,184]
19 [185,194]
20 [195,200]
The exam grades (0 to 20.0 points) obtained by examinees before 2004 (smaller samples)
were compressed into ten intervals related to a reference grade (Table 4.9).
Table 4.9. Distribution table of the exam grades (EG) in 10 reference grades.
Reference Grade EG Interval
2 [0,2.4]
4 [2.5,4.4]
6 [4.5,6.4]
8 [6.5,8.4]
10 [8.5,10.4]
12 [10.5,12.4]
14 [12.5,14.4]
16 [14.5,16.4]
18 [16.5,18.4]
20 [18.5,20.0]
94
The reference grade and the frequencies allow for graphical representations, such as the
smoothed distributions of Group A and B and Group B1 and B2 shown in results.
In the statistical analysis there are a few important points to consider regarding student
performance:
1. The cut score precision depends on student achievement, and that performance should
be in accordance with his regular performance (Teodoro, Valadares, Matos, & Caldeira, 1998).
When considering all the examinees as internal we admit that this, on average, is true;
2. Contrary to popular believe, the exam classification does not appear as an absolute fact
but as a value dependent not only on the examinees performance level, but also on the reference
system chosen (measurement scale, correction criteria, etc.) The group of technical factors of
undeniable importance will be discussed in item analysis.
The graphs cut score is an approximate value. There are three different procedures within
this method, known as Modified Contrasting Groups Method 1, Modified Contrasting Groups
Method 2 and Linear Regression, which can be used to more accurately find the grade that best
differentiates between groups.
Modified Contrasting Groups Method 1 (MCGM1)
For the implementation of this procedure, proposed by Irwin, Bunckendahl and Poggio
(2009), one first needs to determine the medians of the exam classifications obtained by
students of groups A and B and then consider the middle point of those two medians. This
method puts the performance of both groups of students at the same level.
To avoid loss of information and increase the accuracy of the measurement, the values of the
medians in both distributions were calculated from the individual exam classifications and not
from the intervals considered in the graphical representation.
A simpler version of this variation (Cizek & Bunch, 2007, p. 107) consists of calculating the
values of the mean exam classification of both groups to obtain the midpoint between the two
means.

95
Modified Contrasting Groups Method 2 (MCGM2)
In this second version of the method (Fernandes, 2009) the grades of the examinees are
studied together, with no group distinction. To determine the raw score that maximizes the
difference between both groups one simply needs to calculate the median of that population.
Any of these two procedures satisfy the method when used with small samples. However, if
the samples contain thousands of elements, according to Cizek & Bunch (2007) it may be
preferable to use a logistic regression.
Linear Regression
The model of logistic regression was used in order to analyse the behaviour of the internal
students in the 2004 and 2005 exams since it requires few assumptions in theory. In this method
the response variable is dichotomous (showing the relationship of belonging or not to a group,)
with the goal of estimating the raw score that distinguishes both groups.
Logistic regression, by default, estimates the highest of the two distributions (designated by
1 – belonging to Group B,) using the lowest (designated by 0 – belonging to Group A) as the
reference distribution.
Statistics software SPSS version 10 and Excel were used for the classical analysis. All the
grades were entered in a single step, causing no variation between step, block and model, when
measuring significance levels with the 2 method.
The results of the Likelihood function to test if an independent variable is or is not related to
the dependent variable are shown in the summary of the model.
The general logistic regression equation used to obtain a Contrasting Groups cut score with
only one independent variable is
y = a + b (x)
where a is a constant, b is the slope of the regression function, x is an examinee’s observed
score and y is the predicted value on the outcome variable for the examinee.
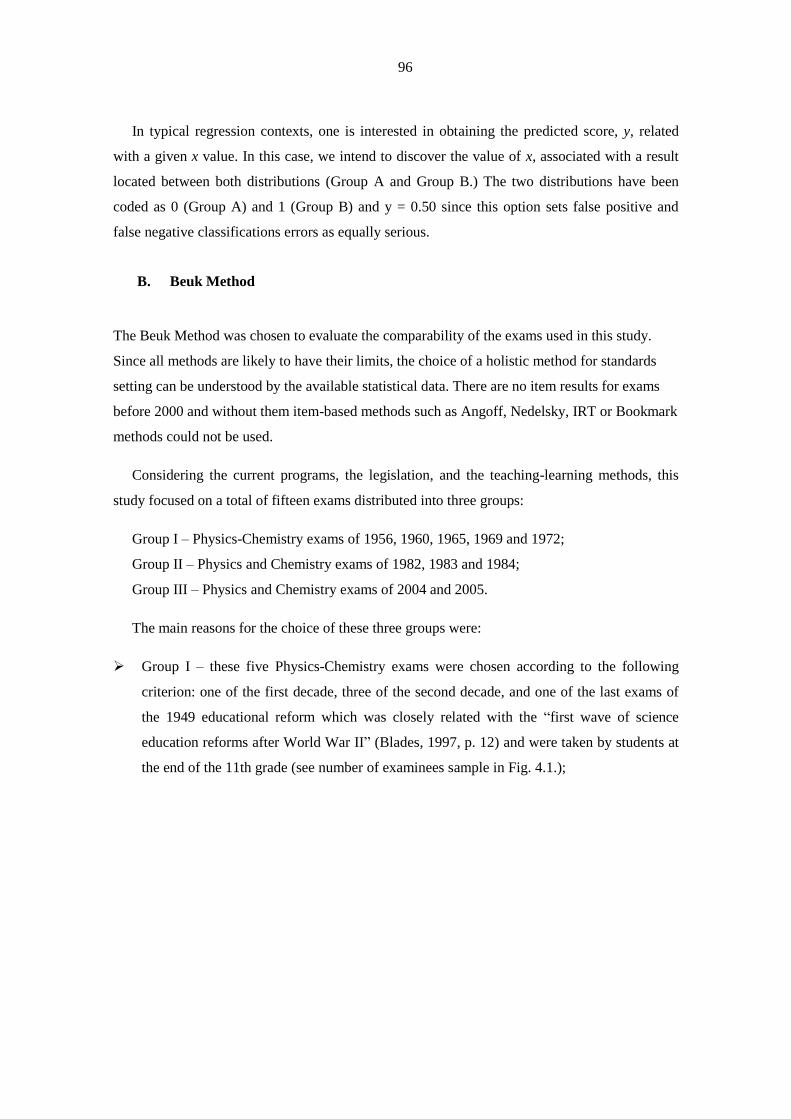
96
In typical regression contexts, one is interested in obtaining the predicted score, y, related
with a given x value. In this case, we intend to discover the value of x, associated with a result
located between both distributions (Group A and Group B.) The two distributions have been
coded as 0 (Group A) and 1 (Group B) and y = 0.50 since this option sets false positive and
false negative classifications errors as equally serious.
B. Beuk Method
The Beuk Method was chosen to evaluate the comparability of the exams used in this study.
Since all methods are likely to have their limits, the choice of a holistic method for standards
setting can be understood by the available statistical data. There are no item results for exams
before 2000 and without them item-based methods such as Angoff, Nedelsky, IRT or Bookmark
methods could not be used.
Considering the current programs, the legislation, and the teaching-learning methods, this
study focused on a total of fifteen exams distributed into three groups:
Group I – Physics-Chemistry exams of 1956, 1960, 1965, 1969 and 1972;
Group II – Physics and Chemistry exams of 1982, 1983 and 1984;
Group III – Physics and Chemistry exams of 2004 and 2005.
The main reasons for the choice of these three groups were:
Group I – these five Physics-Chemistry exams were chosen according to the following
criterion: one of the first decade, three of the second decade, and one of the last exams of
the 1949 educational reform which was closely related with the “first wave of science
education reforms after World War II” (Blades, 1997, p. 12) and were taken by students at
the end of the 11th grade (see number of examinees sample in Fig. 4.1.);
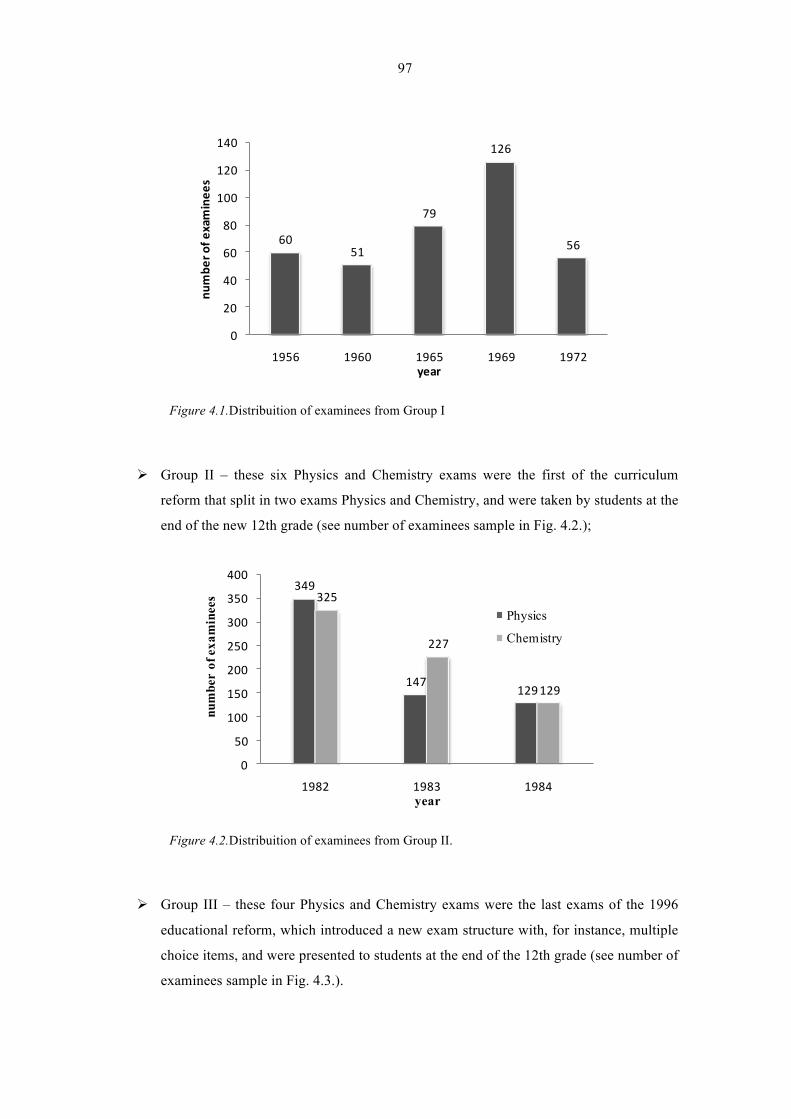
97
6051
79
126
56
0
20
40
60
80
100
120
140
1956 1960 1965 1969 1972
numbe
r of e
xaminee
s
year
Figure 4.1.Distribuition of examinees from Group I
Ø Group II – these six Physics and Chemistry exams were the first of the curriculum
reform that split in two exams Physics and Chemistry, and were taken by students at the
end of the new 12th grade (see number of examinees sample in Fig. 4.2.);
349
147129
325
227
129
0
50
100
150
200
250
300
350
400
1982 1983 1984
num
ber
of ex
amin
ees
year
Physics
Chemistry
Figure 4.2.Distribuition of examinees from Group II.
Ø Group III – these four Physics and Chemistry exams were the last exams of the 1996
educational reform, which introduced a new exam structure with, for instance, multiple
choice items, and were presented to students at the end of the 12th grade (see number of
examinees sample in Fig. 4.3.).
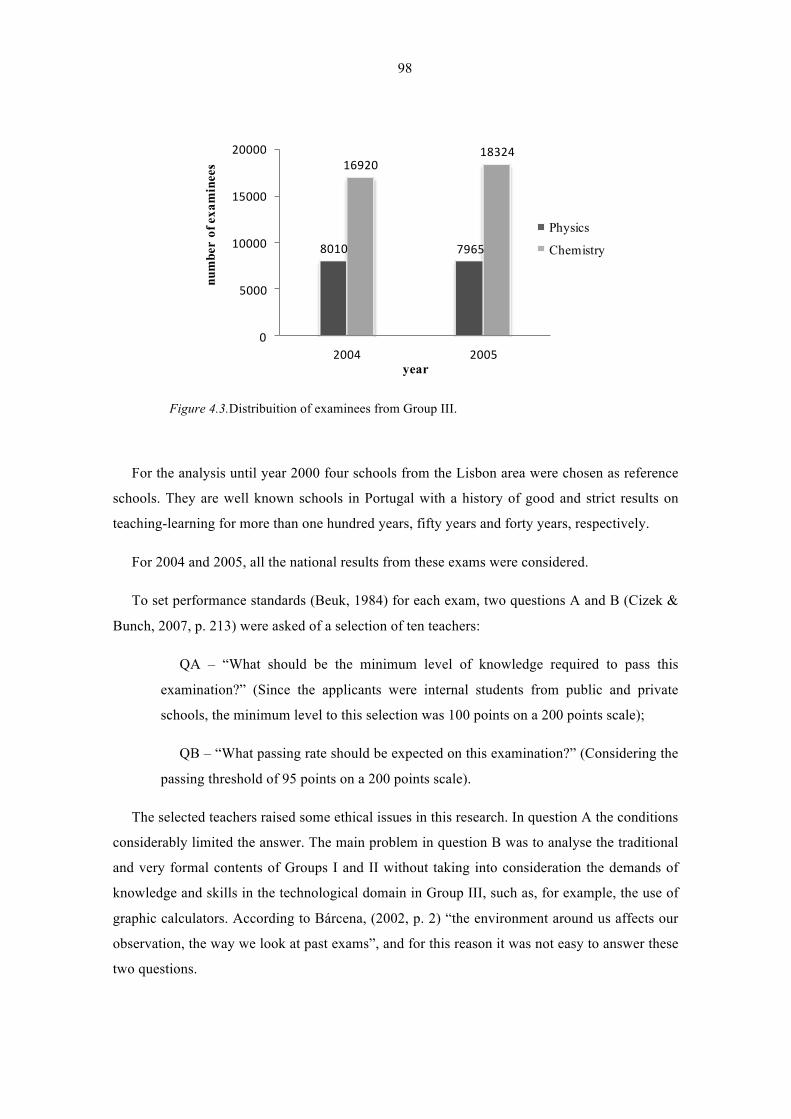
98
8010 7965
1692018324
0
5000
10000
15000
20000
2004 2005
num
ber
of ex
amin
ees
year
Physics
Chemistry
Figure 4.3.Distribuition of examinees from Group III.
For the analysis until year 2000 four schools from the Lisbon area were chosen as reference
schools. They are well known schools in Portugal with a history of good and strict results on
teaching-learning for more than one hundred years, fifty years and forty years, respectively.
For 2004 and 2005, all the national results from these exams were considered.
To set performance standards (Beuk, 1984) for each exam, two questions A and B (Cizek &
Bunch, 2007, p. 213) were asked of a selection of ten teachers:
QA – “What should be the minimum level of knowledge required to pass this
examination?” (Since the applicants were internal students from public and private
schools, the minimum level to this selection was 100 points on a 200 points scale);
QB – “What passing rate should be expected on this examination?” (Considering the
passing threshold of 95 points on a 200 points scale).
The selected teachers raised some ethical issues in this research. In question A the conditions
considerably limited the answer. The main problem in question B was to analyse the traditional
and very formal contents of Groups I and II without taking into consideration the demands of
knowledge and skills in the technological domain in Group III, such as, for example, the use of
graphic calculators. According to Bárcena, (2002, p. 2) “the environment around us affects our
observation, the way we look at past exams”, and for this reason it was not easy to answer these
two questions.
99
In order to apply Beuk's method, the judgments of these ten teachers were compared to
52,525 student’s results. These students were chosen according to the following criteria:
1. External or self-proposed students were not considered;
2. Only students with an internal classification of 50% were selected;
3. The exam classification concerns only the written exams and not the laboratory exam or
oral exam.
The judgments of the teachers on the 2004, 2005 exams were consensual. Reliability in
standardized tests is usually higher. Although after a standardizing meeting all the teachers had
strict recommendations of what the answers to the questions should be, it is possible that the
same teachers would make different judgments because there are only few multiple choice
items.
C. Extended Angoff Method
The goal of this comparison is to analyse the item performance level of examinees in Physics
and Chemistry exams in 2003, 2004, and 2005. The analysis seeks an answer to the following
question:
- Can we detect differences in the global performance of these internal students?
The items are the focus of the Extended Angoff Method. In the simplest implementation of
this method, a panel of teachers estimated the probability of a certain group of students
answering correctly to each item of the exams. The mean of the teachers’ estimates allowed for:
a) An estimate of the cut score to distinguish the performance of two groups of students
(below designated by groups B1 and B2, respectively, students with an IFG between 10 and 12
and students with 13 or more, on a 20 scale);
b) A comparison of the average estimated score for each item with the average scores
achieved by a group of examinees.
The selected students were submitted to those exams at the end of the school year, after
obtaining the IFG score assigned by their own teachers. Only those with the minimum score of
10/20 were considered to have the minimum requisites to take the exam. In this analysis, the
students were divided into two groups B1 and B2 according to their Internal Final Grade
(considering that the teachers grading criteria for calculating the IFG were similar) as shown in
figure 4.4.
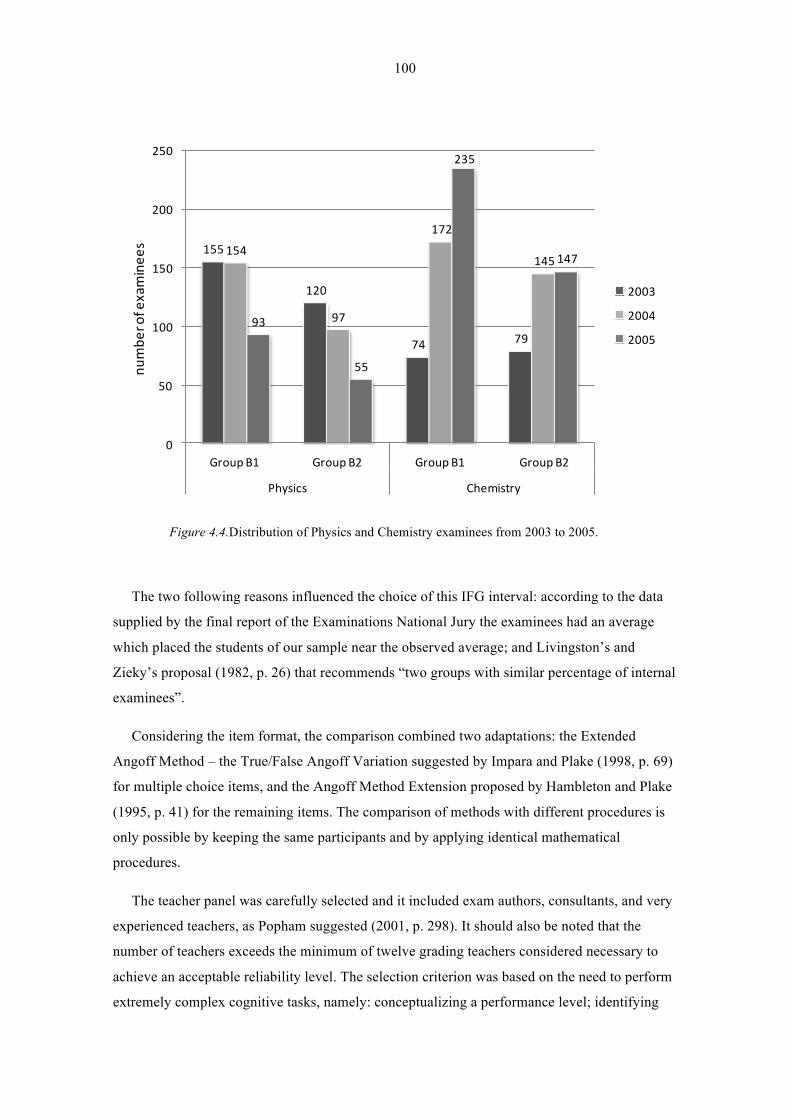
100
155
120
74 79
154
97
172
145
93
55
235
147
0
50
100
150
200
250
Group B1 Group B2 Group B1 Group B2
Physics Chemistry
2003
2004
2005
numbe
r of examinee
s
Figure 4.4.Distribution of Physics and Chemistry examinees from 2003 to 2005.
The two following reasons influenced the choice of this IFG interval: according to the data
supplied by the final report of the Examinations National Jury the examinees had an average
which placed the students of our sample near the observed average; and Livingston’s and
Zieky’s proposal (1982, p. 26) that recommends “two groups with similar percentage of internal
examinees”.
Considering the item format, the comparison combined two adaptations: the Extended
Angoff Method – the True/False Angoff Variation suggested by Impara and Plake (1998, p. 69)
for multiple choice items, and the Angoff Method Extension proposed by Hambleton and Plake
(1995, p. 41) for the remaining items. The comparison of methods with different procedures is
only possible by keeping the same participants and by applying identical mathematical
procedures.
The teacher panel was carefully selected and it included exam authors, consultants, and very
experienced teachers, as Popham suggested (2001, p. 298). It should also be noted that the
number of teachers exceeds the minimum of twelve grading teachers considered necessary to
achieve an acceptable reliability level. The selection criterion was based on the need to perform
extremely complex cognitive tasks, namely: conceptualizing a performance level; identifying
101
the student in that level; “put yourself in the student’s shoes, in exam circumstances; and
estimate that student’s performance in items with different formats” (Giraud, Impara, & Plake,
2005, p. 310). The knowledge and experience of the teachers were deemed sufficient to get a
credible estimate using the Extended Angoff Method.
In both methods the mathematical approach involved:
a) The calculation of the average grades of the items and of the examinees, with the goal
of estimating the cut score that distinguishes both groups and the behaviour of the examinees
when faced with the items;
b) The linear regression model, applied to the examinees (Contrasting Groups Method)
and to the items (Extended Angoff Method).
It is a new approach since it doesn’t focus only on the item answer, as suggested by Brandon
(2002, p. 168), but also on the Exam Grade.
The Angoff Method is frequently used to evaluate the “quality of teaching at a high school
level” (Mills & Melican, 1988, p. 264) since it incorporates complex evaluations involving
items with mixed formats. On the first variation of the method proposed by Angoff in 1971, the
Group C of 25 grading teachers estimated the right answer for each item, for the examinees in
Group A.
In order to reduce the difficulty of the estimate, the True-False variation of the Angoff
Method was applied to the multiple-choice items. Those items had a dichotomous score (0 or
0.5 points out of 20) and the grading teachers, on their estimate, selected 1, for a right answer,
and 0, for a wrong answer. On the remaining nine polytomous constructed-responses the
variation of the Angoff Method was applied. The procedure consisted of estimating on a scale
from 1 to 4 the probable grade of the examinees from Group A, in order to allow its treatment
and later comparison to the results of the examinees.
The mathematical procedure used for the values estimated by the grading teachers was
identical to the one used in the Contrasting Groups Method (O'Connell, 2006), both when
calculating the averages, and on linear regression, as well as on the software used.
Before showing the results there are important details regarding student performance, and the
selection and treatment of the exam grades that should be highlighted:
a) It was considered that the examinees’ performance was similar to their usual
performance, because if this hadn’t been considered “the degree of accuracy of the cut score
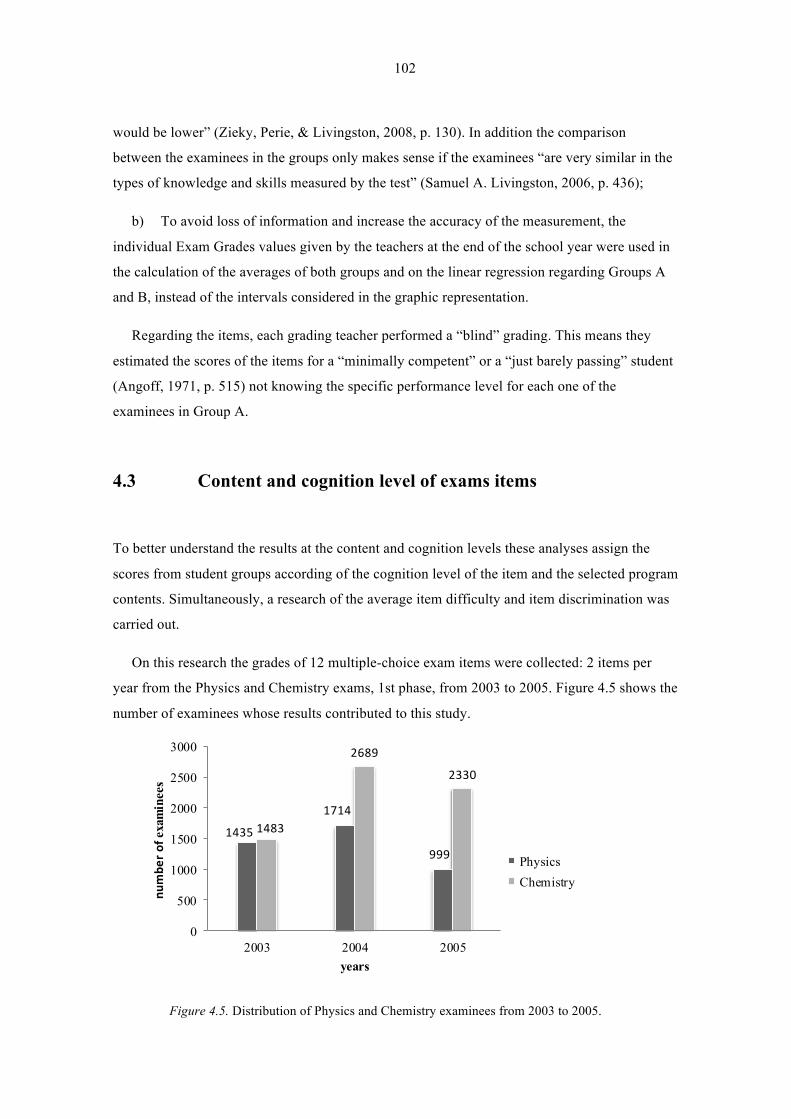
102
would be lower” (Zieky, Perie, & Livingston, 2008, p. 130). In addition the comparison
between the examinees in the groups only makes sense if the examinees “are very similar in the
types of knowledge and skills measured by the test” (Samuel A. Livingston, 2006, p. 436);
b) To avoid loss of information and increase the accuracy of the measurement, the
individual Exam Grades values given by the teachers at the end of the school year were used in
the calculation of the averages of both groups and on the linear regression regarding Groups A
and B, instead of the intervals considered in the graphic representation.
Regarding the items, each grading teacher performed a “blind” grading. This means they
estimated the scores of the items for a “minimally competent” or a “just barely passing” student
(Angoff, 1971, p. 515) not knowing the specific performance level for each one of the
examinees in Group A.
4.3 Content and cognition level of exams items
To better understand the results at the content and cognition levels these analyses assign the
scores from student groups according of the cognition level of the item and the selected program
contents. Simultaneously, a research of the average item difficulty and item discrimination was
carried out.
On this research the grades of 12 multiple-choice exam items were collected: 2 items per
year from the Physics and Chemistry exams, 1st phase, from 2003 to 2005. Figure 4.5 shows the
number of examinees whose results contributed to this study.
1435
1714
999
1483
2689
2330
0
500
1000
1500
2000
2500
3000
2003 2004 2005
numbe
r of examinees
years
PhysicsChemistry
Figure 4.5. Distribution of Physics and Chemistry examinees from 2003 to 2005.
103
The statistical analysis of the examinees’ results encompassed a numerical presentation,
which included the item difficulty and the point up to which the items discriminate, and a
graphical presentation that relates item scores with content and cognition dimensions. The item
difficulty index was obtained from dividing the average grade by the maximum grade assigned
to each item, and subtracting 1. On average, for each item, the values of the sample are in the
interval between 0.3 and 0.9 – an acceptable value interval according to Doran (1980). Once the
results were put in order, the item discriminatory index was calculated, having into
consideration two groups with scores between 25% and 35% regarding the highest and lowest
ranking. Doran (1980) also emphasized that the values of the item discriminatory index must be
equal to or greater than 0.3, which was the case in this sample of twelve items.
The selection of the twelve items was based in two criteria: the two Physics contents and the
two Chemistry contents belong to different curricular units, and those contents were included in
the 1st phase, 1st call exams from 2003 to 2005. The twelve multiple-choice items selected are
found in Appendix 2 along with their solutions.
The 12th grade Physics curriculum starts with an integrated approach to Kinematics and
Dynamics of the material particle moving along a plane and, later on, of a system of particles,
without neglecting the inherent energy aspects. Then, in rotation motion, fundamental aspects
such as variation and conservation of the angular momentum (Newton’s Law of Rotation) are
studied but with no special focus on the kinematics of rotation. The first unit ends with a brief
study of fluid mechanics. The practical applications suggested in the activities give a real
dimension to the concepts approached previously. The second unit begins with the study of
gravitational and electrostatic interactions, emphasising Newton’s theory of universal
gravitation as the first attempt to unify the forces of nature. Next, students are expected to learn
that the interactions between particles can be described using the unifying concept of field,
which requires a greater level of abstraction due to its complexity.
Following this train of thought the study of the conservative, gravitational, and electrostatic
fields continues followed by the study of the non-conservative fields and magnetic fields. It is
important to stress that, regarding an inertial referential, resting electrical charges only create an
electrical field, E (electrostatic field), and moving electrical charges create both an electrical
field, E and a magnetic field, B i.e., an electromagnetic field. This unit deals only with the
electromagnetic field of a stationary current as its negligible E component is reduced to the B
component (stationary magnetic field or magnetostatic field). In a scientific and technological
approach, the historic approach and the study of countless phenomena of the students’ everyday
life are also relevant. Keeping the curriculum in mind, there were six exam items selected
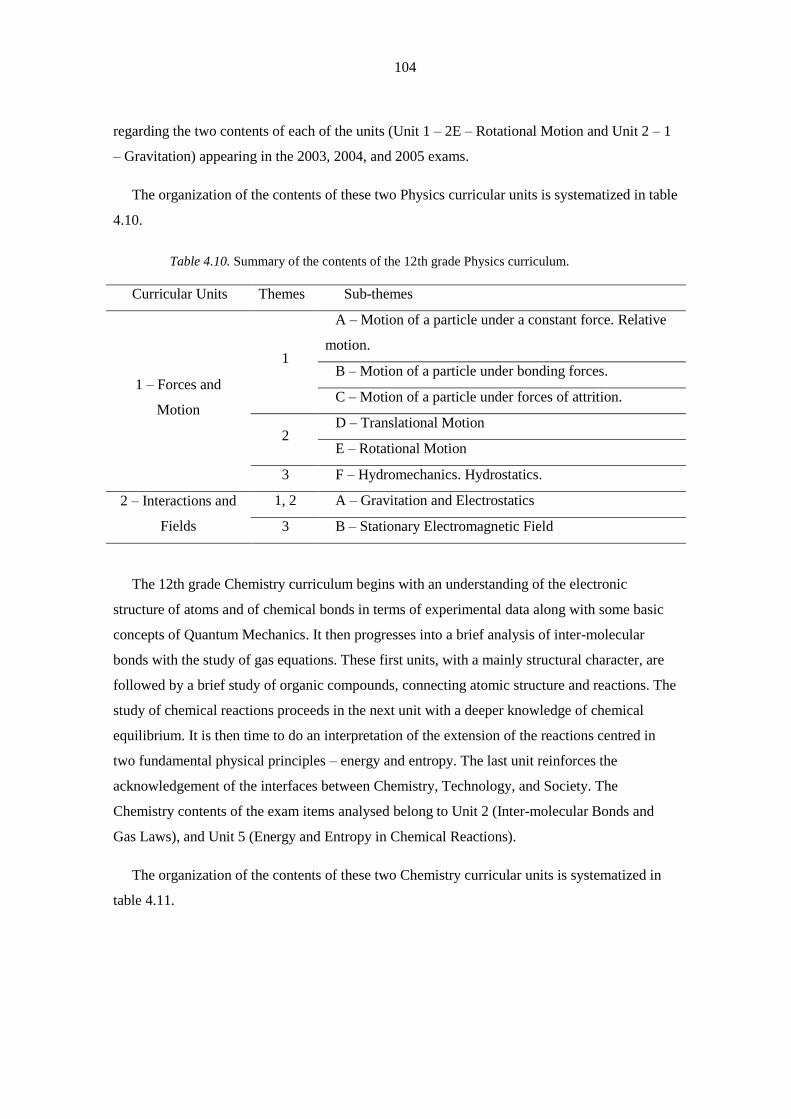
104
regarding the two contents of each of the units (Unit 1 – 2E – Rotational Motion and Unit 2 – 1
– Gravitation) appearing in the 2003, 2004, and 2005 exams.
The organization of the contents of these two Physics curricular units is systematized in table
4.10.
Table 4.10. Summary of the contents of the 12th grade Physics curriculum.
Curricular Units Themes Sub-themes
1 – Forces and
Motion
1
A – Motion of a particle under a constant force. Relative
motion.
B – Motion of a particle under bonding forces.
C – Motion of a particle under forces of attrition.
2 D – Translational Motion
E – Rotational Motion
3 F – Hydromechanics. Hydrostatics.
2 – Interactions and
Fields
1, 2 A – Gravitation and Electrostatics
3 B – Stationary Electromagnetic Field
The 12th grade Chemistry curriculum begins with an understanding of the electronic
structure of atoms and of chemical bonds in terms of experimental data along with some basic
concepts of Quantum Mechanics. It then progresses into a brief analysis of inter-molecular
bonds with the study of gas equations. These first units, with a mainly structural character, are
followed by a brief study of organic compounds, connecting atomic structure and reactions. The
study of chemical reactions proceeds in the next unit with a deeper knowledge of chemical
equilibrium. It is then time to do an interpretation of the extension of the reactions centred in
two fundamental physical principles – energy and entropy. The last unit reinforces the
acknowledgement of the interfaces between Chemistry, Technology, and Society. The
Chemistry contents of the exam items analysed belong to Unit 2 (Inter-molecular Bonds and
Gas Laws), and Unit 5 (Energy and Entropy in Chemical Reactions).
The organization of the contents of these two Chemistry curricular units is systematized in
table 4.11.
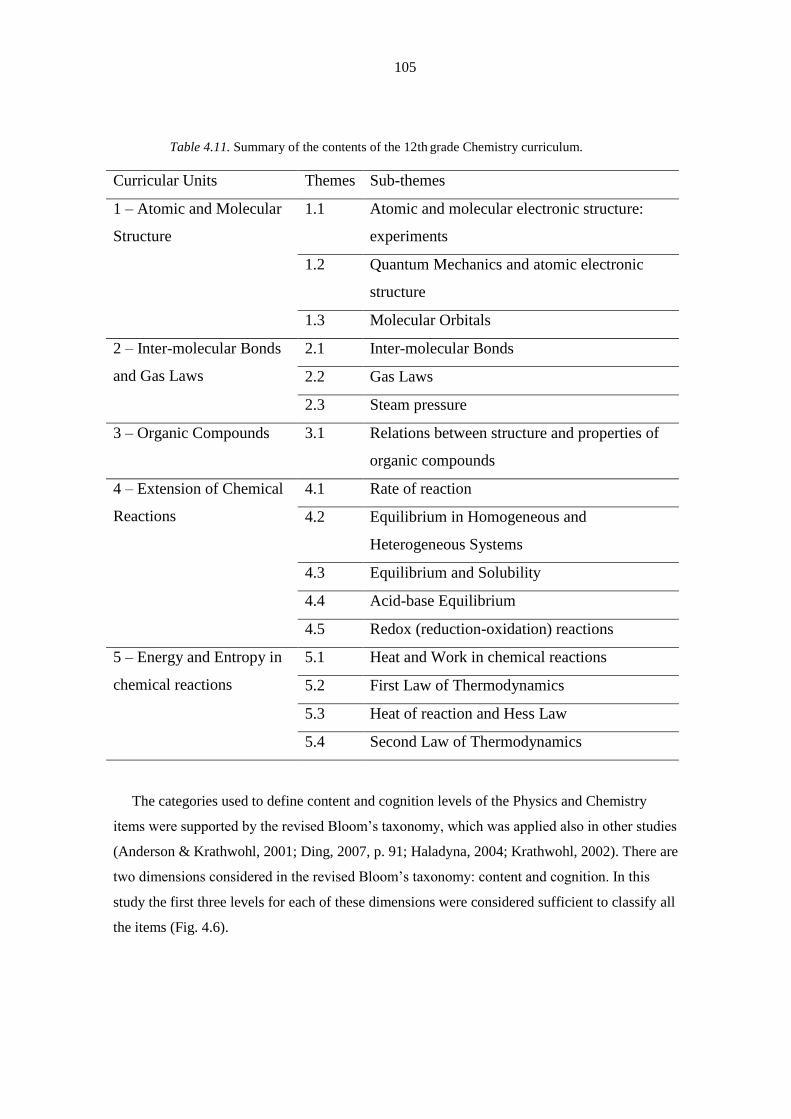
105
Table 4.11. Summary of the contents of the 12th grade Chemistry curriculum.
Curricular Units Themes Sub-themes
1 – Atomic and Molecular
Structure
1.1 Atomic and molecular electronic structure:
experiments
1.2 Quantum Mechanics and atomic electronic
structure
1.3 Molecular Orbitals
2 – Inter-molecular Bonds
and Gas Laws
2.1 Inter-molecular Bonds
2.2 Gas Laws
2.3 Steam pressure
3 – Organic Compounds 3.1 Relations between structure and properties of
organic compounds
4 – Extension of Chemical
Reactions
4.1 Rate of reaction
4.2 Equilibrium in Homogeneous and
Heterogeneous Systems
4.3 Equilibrium and Solubility
4.4 Acid-base Equilibrium
4.5 Redox (reduction-oxidation) reactions
5 – Energy and Entropy in
chemical reactions
5.1 Heat and Work in chemical reactions
5.2 First Law of Thermodynamics
5.3 Heat of reaction and Hess Law
5.4 Second Law of Thermodynamics
The categories used to define content and cognition levels of the Physics and Chemistry
items were supported by the revised Bloom’s taxonomy, which was applied also in other studies
(Anderson & Krathwohl, 2001; Ding, 2007, p. 91; Haladyna, 2004; Krathwohl, 2002). There are
two dimensions considered in the revised Bloom’s taxonomy: content and cognition. In this
study the first three levels for each of these dimensions were considered sufficient to classify all
the items (Fig. 4.6).
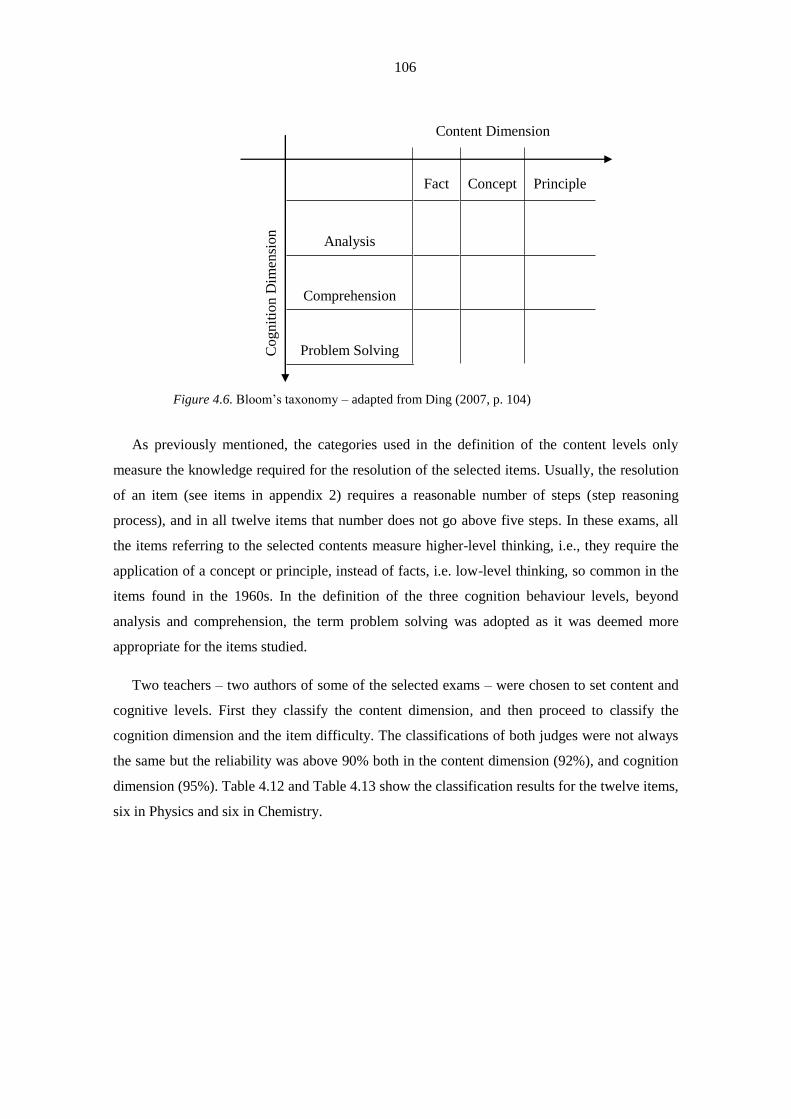
106
Content Dimension
C
og
nit
ion
Dim
ensi
on
Fact
Concept
Principle
Analysis
Comprehension
Problem Solving
Figure 4.6. Bloom’s taxonomy – adapted from Ding (2007, p. 104)
As previously mentioned, the categories used in the definition of the content levels only
measure the knowledge required for the resolution of the selected items. Usually, the resolution
of an item (see items in appendix 2) requires a reasonable number of steps (step reasoning
process), and in all twelve items that number does not go above five steps. In these exams, all
the items referring to the selected contents measure higher-level thinking, i.e., they require the
application of a concept or principle, instead of facts, i.e. low-level thinking, so common in the
items found in the 1960s. In the definition of the three cognition behaviour levels, beyond
analysis and comprehension, the term problem solving was adopted as it was deemed more
appropriate for the items studied.
Two teachers – two authors of some of the selected exams – were chosen to set content and
cognitive levels. First they classify the content dimension, and then proceed to classify the
cognition dimension and the item difficulty. The classifications of both judges were not always
the same but the reliability was above 90% both in the content dimension (92%), and cognition
dimension (95%). Table 4.12 and Table 4.13 show the classification results for the twelve items,
six in Physics and six in Chemistry.
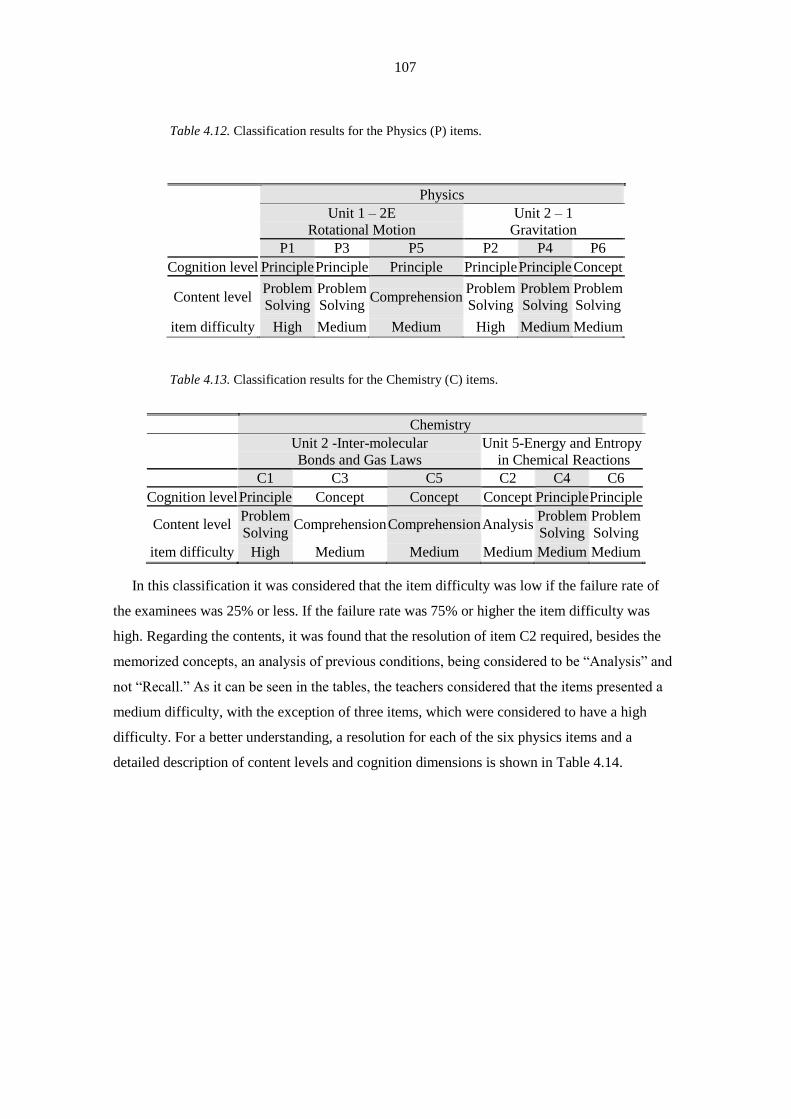
107
Table 4.12. Classification results for the Physics (P) items.
Table 4.13. Classification results for the Chemistry (C) items.
In this classification it was considered that the item difficulty was low if the failure rate of
the examinees was 25% or less. If the failure rate was 75% or higher the item difficulty was
high. Regarding the contents, it was found that the resolution of item C2 required, besides the
memorized concepts, an analysis of previous conditions, being considered to be “Analysis” and
not “Recall.” As it can be seen in the tables, the teachers considered that the items presented a
medium difficulty, with the exception of three items, which were considered to have a high
difficulty. For a better understanding, a resolution for each of the six physics items and a
detailed description of content levels and cognition dimensions is shown in Table 4.14.
Physics
Unit 1 – 2E
Rotational Motion
Unit 2 – 1
Gravitation
P1 P3 P5 P2 P4 P6
Cognition level Principle Principle Principle Principle Principle Concept
Content level Problem
Solving
Problem
Solving Comprehension
Problem
Solving
Problem
Solving
Problem
Solving
item difficulty High Medium Medium High Medium Medium
Chemistry
Unit 2 -Inter-molecular
Bonds and Gas Laws
Unit 5-Energy and Entropy
in Chemical Reactions
C1 C3 C5 C2 C4 C6
Cognition level Principle Concept Concept Concept Principle Principle
Content level Problem
Solving Comprehension Comprehension Analysis
Problem
Solving
Problem
Solving
item difficulty High Medium Medium Medium Medium Medium
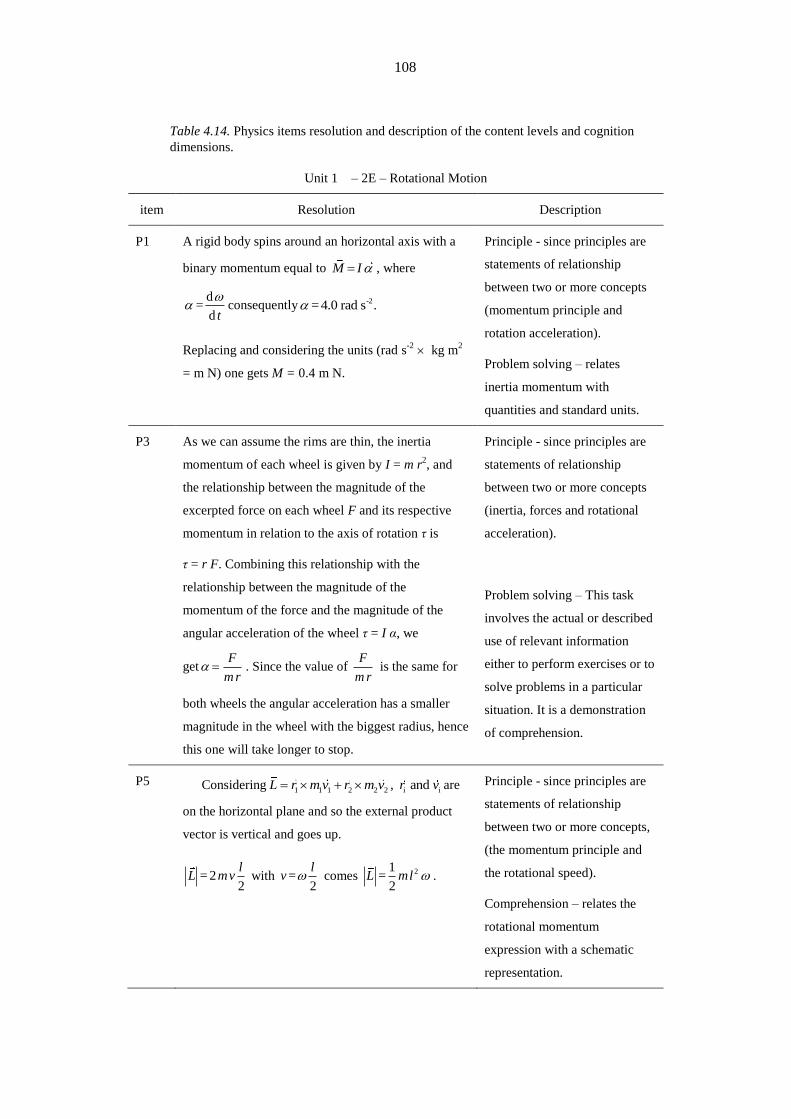
108
Table 4.14. Physics items resolution and description of the content levels and cognition
dimensions.
Unit 1 – 2E – Rotational Motion
item Resolution Description
P1 A rigid body spins around an horizontal axis with a
binary momentum equal to M I , where
d=
d t
consequently -2=4.0 rad s .
Replacing and considering the units (rad s-2 kg m
2
= m N) one gets M = 0.4 m N.
Principle - since principles are
statements of relationship
between two or more concepts
(momentum principle and
rotation acceleration).
Problem solving – relates
inertia momentum with
quantities and standard units.
P3 As we can assume the rims are thin, the inertia
momentum of each wheel is given by I = m r2, and
the relationship between the magnitude of the
excerpted force on each wheel F and its respective
momentum in relation to the axis of rotation τ is
τ = r F. Combining this relationship with the
relationship between the magnitude of the
momentum of the force and the magnitude of the
angular acceleration of the wheel τ = I α, we
getF
m r . Since the value of
F
m r is the same for
both wheels the angular acceleration has a smaller
magnitude in the wheel with the biggest radius, hence
this one will take longer to stop.
Principle - since principles are
statements of relationship
between two or more concepts
(inertia, forces and rotational
acceleration).
Problem solving – This task
involves the actual or described
use of relevant information
either to perform exercises or to
solve problems in a particular
situation. It is a demonstration
of comprehension.
P5 Considering 1 1 1 2 2 2L r m v r m v , i iandr v are
on the horizontal plane and so the external product
vector is vertical and goes up.
= 22
lL mv with =
2
lv comes
21=
2L ml .
Principle - since principles are
statements of relationship
between two or more concepts,
(the momentum principle and
the rotational speed).
Comprehension – relates the
rotational momentum
expression with a schematic
representation.

109
Unit 2 – 1 (Gravitation)
item Resolution Description
P2 The potential difference between A and B is given by
A B
A B
WV V
m
(work performed by the field forces
in the transport of a particle with mass m from A to
B). But for m > 0 the gravitational force is downward
and equal tog gF m a , so
A B gW F h mg h . Therefore,
A BV V g h (or considering P
g
EV
m
with
PE m g h comesgV g h ).
Principle - since principles are
statements of relationship
between two or more concepts,
for example, the gravitation
potential, work and energy.
Problem solving – involves the
use of information such as
gravitation potential, work and
energy to find an equation.
P4 The force acting on the satellite is the force of Earth's
gravity and is centripetal. As the movement is
presumed to be circular, the satellite’s acceleration is,
in magnitude, 2v
ar
, where Er r h . Using the
Newton’s 2nd
Law, in the scalar form sF m a where
F is the force of gravity between Earth and the
satellite, comes E s
s2
m mG m a
r . Replacing,
E
2
E
ma G
r h
.
Principle - since principles are
statements of relationship
between two or more concepts,
for example, Newton’s second
Law, Gravitation and rotation
speed.
Problem solving – involves the
use of information such as
Newton’s second Law and the
rotation speed to find an
equation.
P6 The gravitational potential created by any punctual
body with mass m at distance r is given
by g
G mV
r . Since 0gV at r and
gV decreases when the distance to mass that created it
decreases,
B A
B A
1 1V V Gm
r r
.
Concept – application of a
concept - the gravitation
potential.
Problem solving – involves the
application of the gravitation
potential concept, considering
two points, A and B.
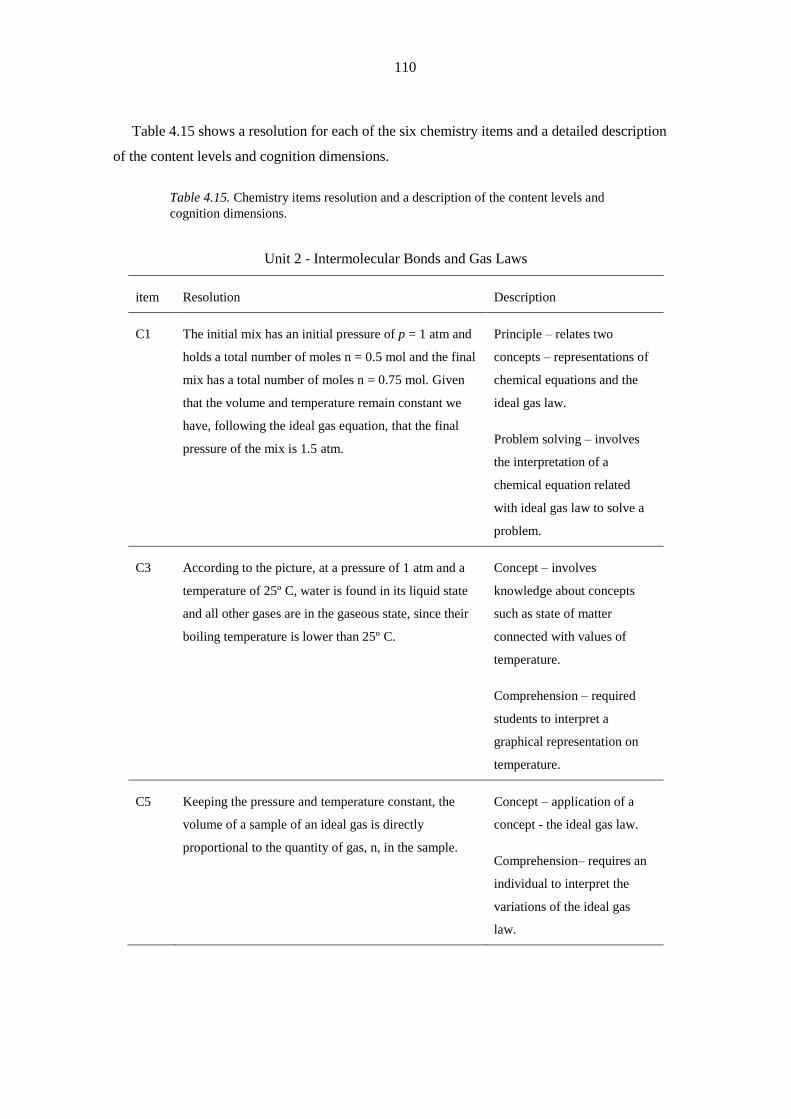
110
Table 4.15 shows a resolution for each of the six chemistry items and a detailed description
of the content levels and cognition dimensions.
Table 4.15. Chemistry items resolution and a description of the content levels and
cognition dimensions.
Unit 2 - Intermolecular Bonds and Gas Laws
item Resolution Description
C1 The initial mix has an initial pressure of p = 1 atm and
holds a total number of moles n = 0.5 mol and the final
mix has a total number of moles n = 0.75 mol. Given
that the volume and temperature remain constant we
have, following the ideal gas equation, that the final
pressure of the mix is 1.5 atm.
Principle – relates two
concepts – representations of
chemical equations and the
ideal gas law.
Problem solving – involves
the interpretation of a
chemical equation related
with ideal gas law to solve a
problem.
C3 According to the picture, at a pressure of 1 atm and a
temperature of 25º C, water is found in its liquid state
and all other gases are in the gaseous state, since their
boiling temperature is lower than 25º C.
Concept – involves
knowledge about concepts
such as state of matter
connected with values of
temperature.
Comprehension – required
students to interpret a
graphical representation on
temperature.
C5 Keeping the pressure and temperature constant, the
volume of a sample of an ideal gas is directly
proportional to the quantity of gas, n, in the sample.
Concept – application of a
concept - the ideal gas law.
Comprehension– requires an
individual to interpret the
variations of the ideal gas
law.
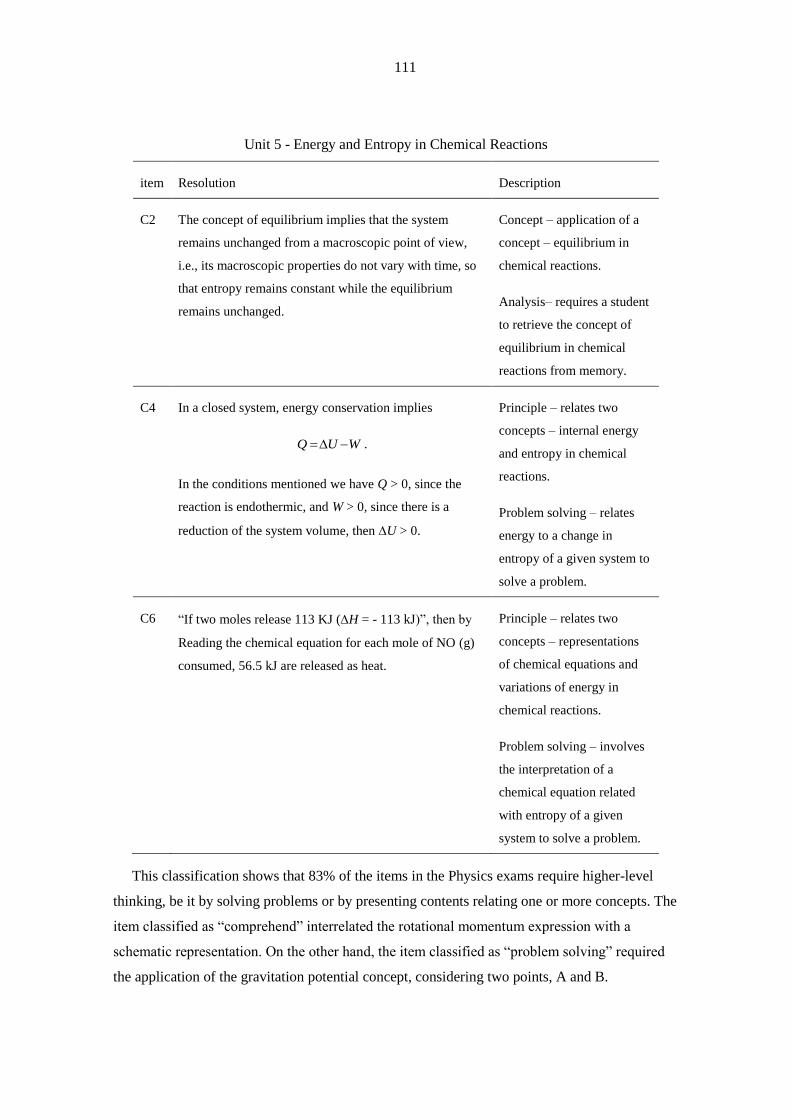
111
Unit 5 - Energy and Entropy in Chemical Reactions
item Resolution Description
C2 The concept of equilibrium implies that the system
remains unchanged from a macroscopic point of view,
i.e., its macroscopic properties do not vary with time, so
that entropy remains constant while the equilibrium
remains unchanged.
Concept – application of a
concept – equilibrium in
chemical reactions.
Analysis– requires a student
to retrieve the concept of
equilibrium in chemical
reactions from memory.
C4 In a closed system, energy conservation implies
Q U W .
In the conditions mentioned we have Q > 0, since the
reaction is endothermic, and W > 0, since there is a
reduction of the system volume, then U > 0.
Principle – relates two
concepts – internal energy
and entropy in chemical
reactions.
Problem solving – relates
energy to a change in
entropy of a given system to
solve a problem.
C6 “If two moles release 113 KJ (H = - 113 kJ)”, then by
Reading the chemical equation for each mole of NO (g)
consumed, 56.5 kJ are released as heat.
Principle – relates two
concepts – representations
of chemical equations and
variations of energy in
chemical reactions.
Problem solving – involves
the interpretation of a
chemical equation related
with entropy of a given
system to solve a problem.
This classification shows that 83% of the items in the Physics exams require higher-level
thinking, be it by solving problems or by presenting contents relating one or more concepts. The
item classified as “comprehend” interrelated the rotational momentum expression with a
schematic representation. On the other hand, the item classified as “problem solving” required
the application of the gravitation potential concept, considering two points, A and B.
112
Even though 50% of the items require problem solving, the analysis of the results shows that,
on the six Chemistry items (figure 4.8), in the content dimension, the classification divides the
items between the concept and principle levels. The item classified as “analysis” required
students to retrieve the concept of equilibrium in chemical reactions from memory.
In summary, the classification of the twelve selected items by the two teachers showed that
those items mainly focus on higher-level thinking, in both content and cognition dimensions.
The use of a vast and diverse range of methodological instruments in conjunction with a
flexible selection, volume and heterogeneity of the collected information, make for some of the
identifying marks of a case study. The triangulation of methods and empirical data leads to an
exploratory initial study of the performance of students in schools from the Greater Lisbon area,
which is then broadened to include all of the national results, thus becoming more than a simple
case study.
The four basic types of triangulation mentioned by Dezin (1978) are highlighted in this
study: data triangulation (resorting to several data sources); researcher triangulation
(participation of several judges/graders); theory triangulation (resorting to multiple perspectives
to analyse item types), and methodological triangulation (resorting to several methods to study a
particular problem).
The potential and the virtues of this study cannot hide the limitations that a methodological
strategy such as this one encompasses. As such, the establishment of triangulation of data,
sources, and methods is the guarantee of its internal legitimacy.
113
5 Results and Discussion
“WYTIWYG: What you test is what you get.” (Resnick & Resnick, 1989)
In this chapter the treatment and analysis of the data tried to integrally respect the assumptions
and objectives attached to the Research Work. The data regarding test questions and exam
results were extracted, compiled, and grouped in regards to timeframe, according to the
proposed methods. There are several methods of analysing the performance of the examinees
compared to the expectations created during the school year.
The choice of the Contrasting Groups Method, proposed by Beuk (1976), “centred on the
student”(Kane, 1995) came from its simple implementation and easy understanding. The
examinees were initially divided into two or more distinct groups, based on an evaluation
centred on their knowledge and skills. For instance, for internal students the selection was done
by thousands of teachers who, by awarding each of them an internal final grade (IFG), allowed
the identification of a group of examinees with a performance clearly below a certain threshold,
and another group of examinees that is above that same threshold. It is not a question of
labelling the groups in regards of their internal final grade, but of observing to which point this
grade is consistent with the exam grade.
Keeping in mind the collected data, the Beuk Method (Beuk, 1984) was applied to a total of
15 exams distributed by three groups and allowed, based on a survey done by ten teachers, to
estimate the minimum performance level for those exams and a grade for the internal students.
The results of the survey, the average achieved, the standard deviation, and a graphical
representation can be found in this chapter.

114
The Extended Angoff Method is commonly used in 12th grade level evaluations (1988, p.
264) as it includes complex evaluations involving mixed format items. In the simplest
implementation of this method, a teacher panel estimated the probability of a certain group of
students answering correctly to each exam item. The average of the teacher estimates allowed
estimating a grade to differentiate the performance of two groups of students and to compare the
estimated average grade for each item with the average grades achieved by a group of
examinees.
The mathematical procedure used for the grading teacher estimates was identical to the
Contrasting Groups Method, both in the calculation of averages and logistic regression model,
and in the software used. At the end of each sub-section there is a comparison of the cut scores
obtained through the different methods.
In the item contents and cognition analysis it is shown that the 12 selected items mainly
require a high reasoning level. The results of the two dimensional classification show that 83%
of the Physics items require a high level of reasoning, both through problem solving and
through the presentation of contents involving one or more concepts. Regarding Chemistry,
even though 50% of the items require problem solving, in the contents dimension the
classification divides the items between the concepts and principles levels. This can be a
possible explanation for the results of the students not satisfying the expectations.
5.1 Contrasting Groups Method
The frequency values shown in Appendix 2 (Tables 6.1 through 6.21) allowed plotting the
graphics below. The horizontal axis gives information regarding the exam grades, distributed
according to the reference grades and, in the vertical axis, the proportion of each group
belonging to the interval represented by each of the reference grades is indicated. The
calculations were made assuming that all the values of a class are tacked as its midpoint.
The graphic representation of external/internal students and, simultaneously, for the years of
1960, 1965, 1969, 1972, 1982, 1983, 1984, 2004, and 2005, of the distribution of the internal
examinees subdivided in barely competent/other internals confirmed the existence of distinct
student groups and allowed to get a cut score graphically. The MCGM1, MCGM2, and linear
regression (every time it was possible) methods were applied and the following tables show the
results with the appropriate comments.
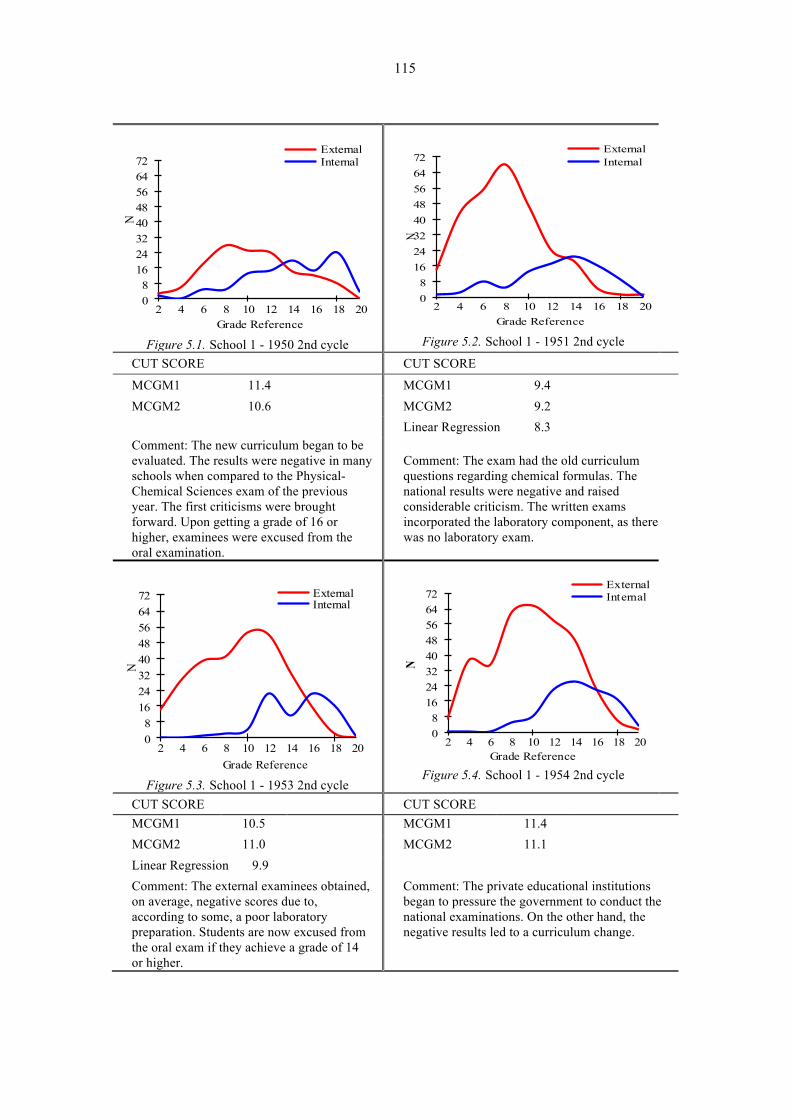
115
08
1624324048566472
2 4 6 8 10 12 14 16 18 20
N
Grade Reference
ExternalInternal
Figure 5.1. School 1 - 1950 2nd cycle
08
1624324048566472
2 4 6 8 10 12 14 16 18 20
N
Grade Reference
ExternalInternal
Figure 5.2. School 1 - 1951 2nd cycle
CUT SCORE CUT SCORE
MCGM1 11.4 MCGM1 9.4 MCGM2 10.6 MCGM2 9.2
Linear Regression 8.3 Comment: The new curriculum began to be evaluated. The results were negative in many schools when compared to the Physical- Chemical Sciences exam of the previous year. The first criticisms were brought forward. Upon getting a grade of 16 or higher, examinees were excused from the oral examination.
Comment: The exam had the old curriculum questions regarding chemical formulas. The national results were negative and raised considerable criticism. The written exams incorporated the laboratory component, as there was no laboratory exam.
08
1624324048566472
2 4 6 8 10 12 14 16 18 20
N
Grade Reference
ExternalInternal
Figure 5.3. School 1 - 1953 2nd cycle
08
1624324048566472
2 4 6 8 10 12 14 16 18 20
N
Grade Reference
ExternalInternal
Figure 5.4. School 1 - 1954 2nd cycle
CUT SCORE CUT SCORE MCGM1 10.5 MCGM1 11.4 MCGM2 11.0 MCGM2 11.1 Linear Regression 9.9 Comment: The external examinees obtained, on average, negative scores due to, according to some, a poor laboratory preparation. Students are now excused from the oral exam if they achieve a grade of 14 or higher.
Comment: The private educational institutions began to pressure the government to conduct the national examinations. On the other hand, the negative results led to a curriculum change.
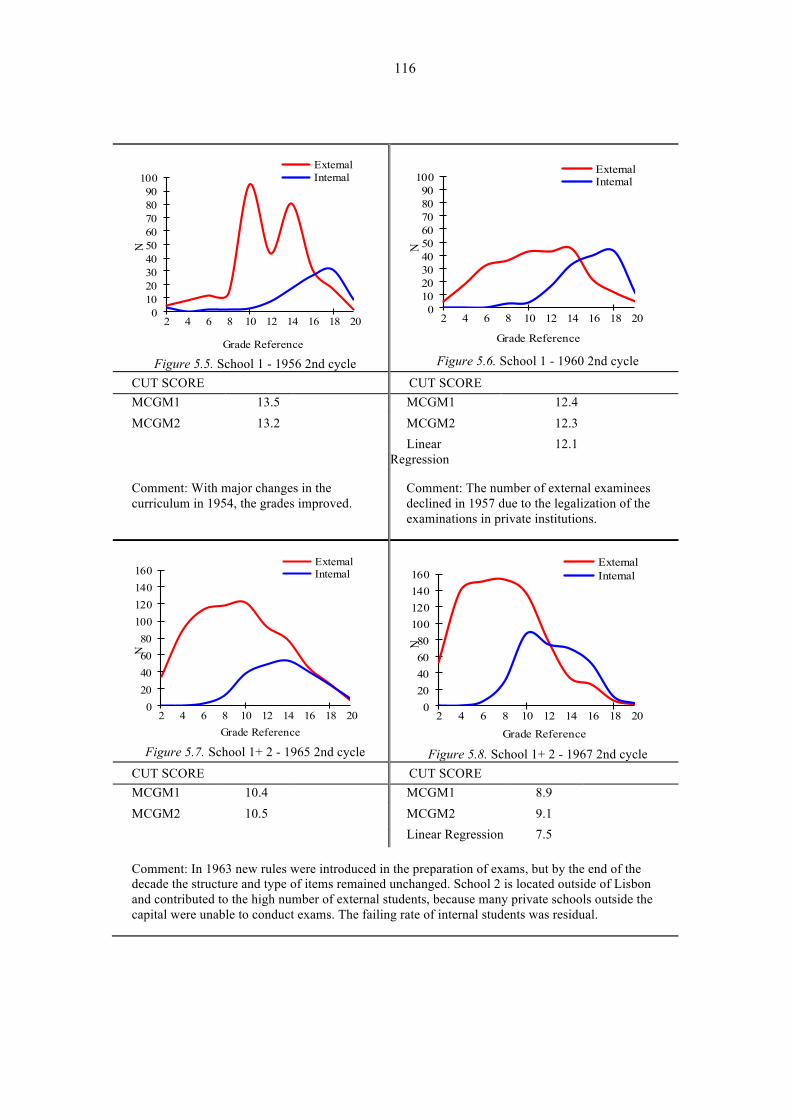
116
0102030405060708090
100
2 4 6 8 10 12 14 16 18 20
N
Grade Reference
ExternalInternal
Figure 5.5. School 1 - 1956 2nd cycle
0102030405060708090
100
2 4 6 8 10 12 14 16 18 20
N
Grade Reference
ExternalInternal
Figure 5.6. School 1 - 1960 2nd cycle
CUT SCORE CUT SCORE MCGM1 13.5 MCGM1 12.4 MCGM2 13.2 MCGM2 12.3
Linear Regression
12.1
Comment: With major changes in the curriculum in 1954, the grades improved.
Comment: The number of external examinees declined in 1957 due to the legalization of the examinations in private institutions.
020406080
100120140160
2 4 6 8 10 12 14 16 18 20
N
Grade Reference
ExternalInternal
Figure 5.7. School 1+ 2 - 1965 2nd cycle
020406080
100120140160
2 4 6 8 10 12 14 16 18 20
N
Grade Reference
ExternalInternal
Figure 5.8. School 1+ 2 - 1967 2nd cycle
CUT SCORE CUT SCORE MCGM1 10.4 MCGM1 8.9 MCGM2 10.5 MCGM2 9.1
Linear Regression 7.5
Comment: In 1963 new rules were introduced in the preparation of exams, but by the end of the decade the structure and type of items remained unchanged. School 2 is located outside of Lisbon and contributed to the high number of external students, because many private schools outside the capital were unable to conduct exams. The failing rate of internal students was residual.

117
08
162432404856647280
2 4 6 8 10 12 14 16 18 20
N
Grade Reference
ExternalInternal
Figure 5.9. School 1 - 1970 2nd cycle
01020304050607080
2 4 6 8 10 12 14 16 18 20
N
Grade Reference
ExternalInternal
Figure 5.10. School 1 - 1972 2nd cycle
CUT SCORE CUT SCORE MCGM1 11.2 MCGM1 12.5 MCGM2 10.8 MCGM2 12.2
Linear Regression 13.1
Comment: From 1969, students could continue their studies even if they had a grade of 9.5. The number of examinees towards the end of the decade shows the beginning of the movement of city dwellers to the outskirts and a selection of the examinees.
048
1216202428323640
2 4 6 8 10 12 14 16 18 20
N
Grade Reference
ExternalInternal
Figure 5.11. School 1 - 1973 2nd cycle
CUT SCORE MCGM1 10.4 MCGM2 10.3
Comment: It was the last exam before the revolution of 1974, with positive results.
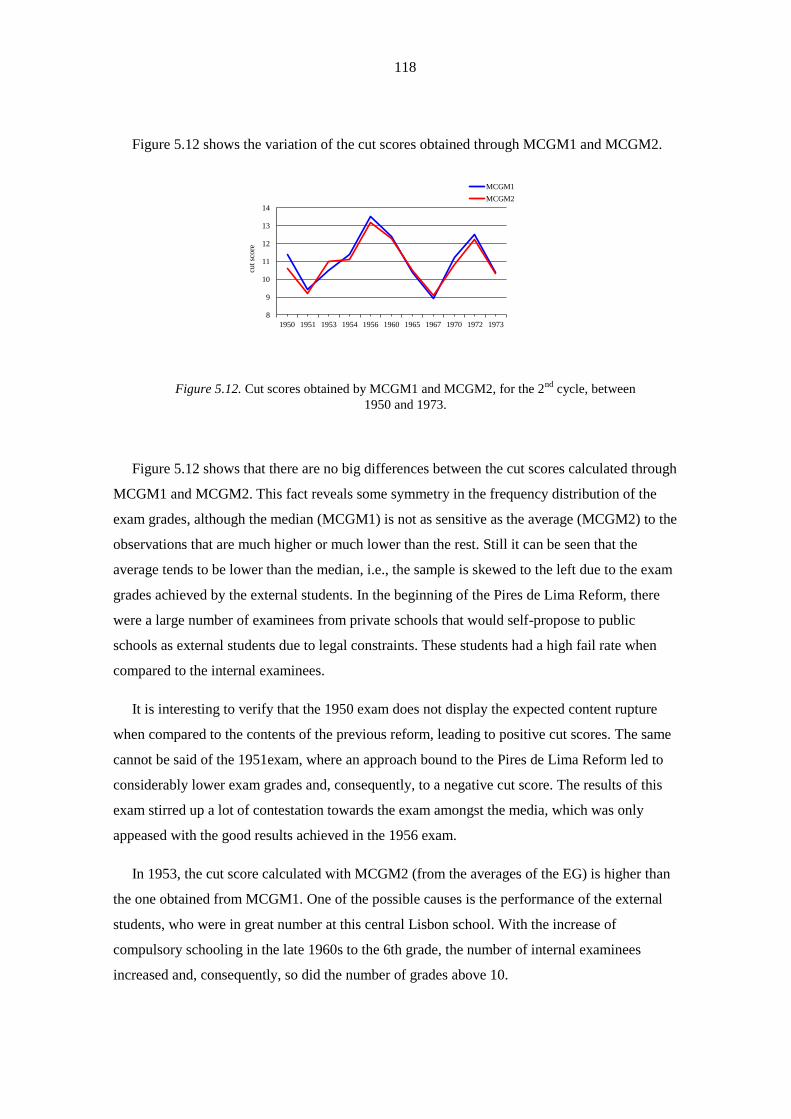
118
Figure 5.12 shows the variation of the cut scores obtained through MCGM1 and MCGM2.
8
9
10
11
12
13
14
1950 1951 1953 1954 1956 1960 1965 1967 1970 1972 1973
cut
score
MCGM1
MCGM2
Figure 5.12. Cut scores obtained by MCGM1 and MCGM2, for the 2nd
cycle, between
1950 and 1973.
Figure 5.12 shows that there are no big differences between the cut scores calculated through
MCGM1 and MCGM2. This fact reveals some symmetry in the frequency distribution of the
exam grades, although the median (MCGM1) is not as sensitive as the average (MCGM2) to the
observations that are much higher or much lower than the rest. Still it can be seen that the
average tends to be lower than the median, i.e., the sample is skewed to the left due to the exam
grades achieved by the external students. In the beginning of the Pires de Lima Reform, there
were a large number of examinees from private schools that would self-propose to public
schools as external students due to legal constraints. These students had a high fail rate when
compared to the internal examinees.
It is interesting to verify that the 1950 exam does not display the expected content rupture
when compared to the contents of the previous reform, leading to positive cut scores. The same
cannot be said of the 1951exam, where an approach bound to the Pires de Lima Reform led to
considerably lower exam grades and, consequently, to a negative cut score. The results of this
exam stirred up a lot of contestation towards the exam amongst the media, which was only
appeased with the good results achieved in the 1956 exam.
In 1953, the cut score calculated with MCGM2 (from the averages of the EG) is higher than
the one obtained from MCGM1. One of the possible causes is the performance of the external
students, who were in great number at this central Lisbon school. With the increase of
compulsory schooling in the late 1960s to the 6th grade, the number of internal examinees
increased and, consequently, so did the number of grades above 10.
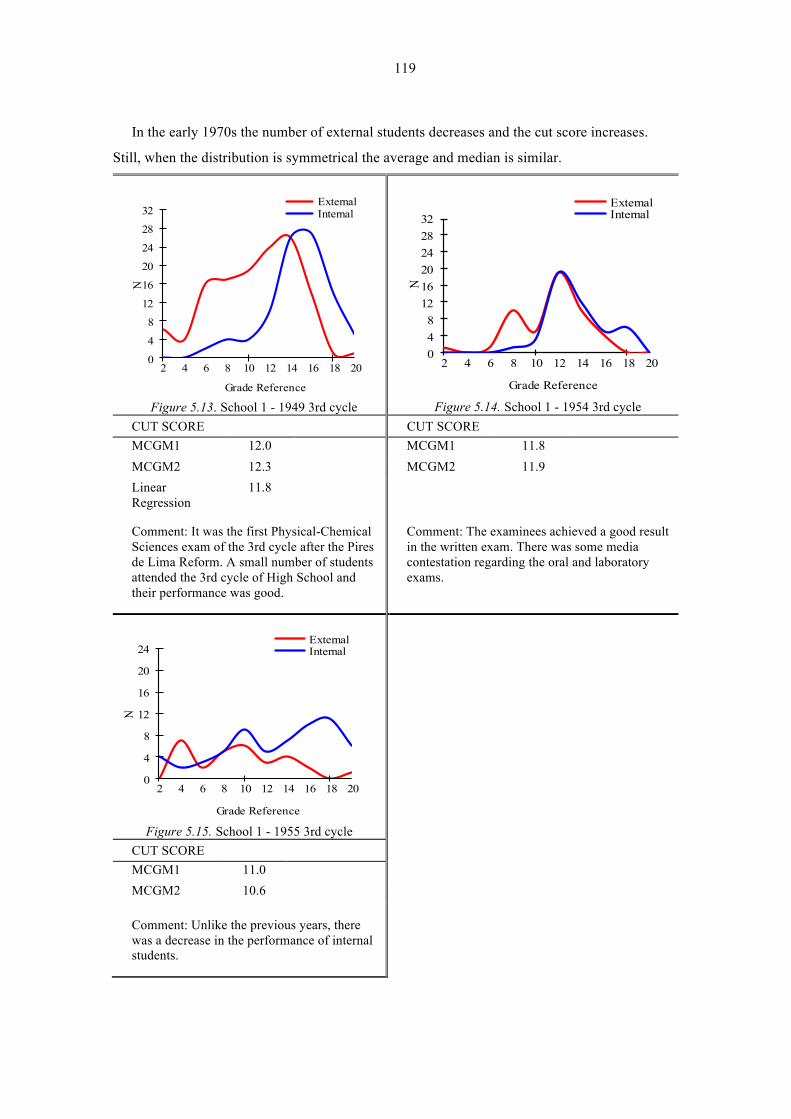
119
In the early 1970s the number of external students decreases and the cut score increases.
Still, when the distribution is symmetrical the average and median is similar.
0
4
8
12
16
20
24
28
32
2 4 6 8 10 12 14 16 18 20
N
Grade Reference
ExternalInternal
Figure 5.13. School 1 - 1949 3rd cycle
048
121620242832
2 4 6 8 10 12 14 16 18 20
N
Grade Reference
ExternalInternal
Figure 5.14. School 1 - 1954 3rd cycle
CUT SCORE CUT SCORE MCGM1 12.0 MCGM1 11.8 MCGM2 12.3 MCGM2 11.9 Linear Regression
11.8
Comment: It was the first Physical-Chemical Sciences exam of the 3rd cycle after the Pires de Lima Reform. A small number of students attended the 3rd cycle of High School and their performance was good.
Comment: The examinees achieved a good result in the written exam. There was some media contestation regarding the oral and laboratory exams.
0
4
8
12
16
20
24
2 4 6 8 10 12 14 16 18 20
N
Grade Reference
ExternalInternal
Figure 5.15. School 1 - 1955 3rd cycle
CUT SCORE MCGM1 11.0 MCGM2 10.6
Comment: Unlike the previous years, there was a decrease in the performance of internal students.

120
0
4
8
12
16
20
24
2 4 6 8 10 12 14 16 18 20
N
Grade Reference
ExternalInternal
Figure 5.16. School 1 - 1956 3rd cycle
0
4
8
12
16
20
24
2 4 6 8 10 12 14 16 18 20
N
Grade Reference
Barely CompetentOther Internal
Figure 5.17. School 1 - 1956 3rd cycle
CUT SCORE CUT SCORE MCGM1 10.7 MCGM1 10.1 MCGM2 10.9 MCGM2 10.1
Comment: The cut scores calculated through the median (MCGM1) and through the average (MCGM2) are very similar. The cut score decreases when only the internal students are considered.
0
4
8
12
16
20
24
28
2 4 6 8 10 12 14 16 18 20
N
Grade Reference
ExternalInternal
Figure 5.18. School 1 - 1959 3rd cycle
CUT SCORE MCGM1 8.7 MCGM2 8.7
Comment: This exam revealed the worse results of the decade. On one hand the number of low performance external examinees increased, on the other hand the internal students had trouble with the calculations and in point II (surface tension of a liquid).
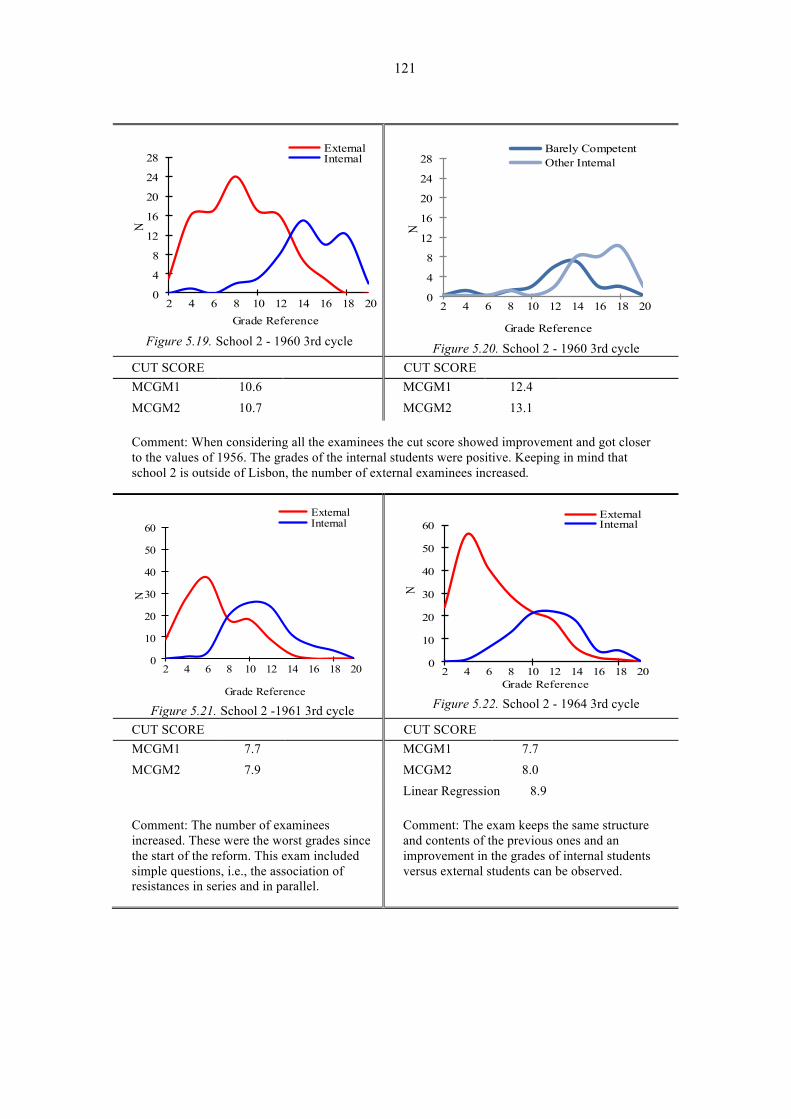
121
0
4
8
12
16
20
24
28
2 4 6 8 10 12 14 16 18 20
N
Grade Reference
ExternalInternal
Figure 5.19. School 2 - 1960 3rd cycle
0
4
8
12
16
20
24
28
2 4 6 8 10 12 14 16 18 20
N
Grade Reference
Barely CompetentOther Internal
Figure 5.20. School 2 - 1960 3rd cycle
CUT SCORE CUT SCORE MCGM1 10.6 MCGM1 12.4 MCGM2 10.7 MCGM2 13.1
Comment: When considering all the examinees the cut score showed improvement and got closer to the values of 1956. The grades of the internal students were positive. Keeping in mind that school 2 is outside of Lisbon, the number of external examinees increased.
0
10
20
30
40
50
60
2 4 6 8 10 12 14 16 18 20
N
Grade Reference
ExternalInternal
Figure 5.21. School 2 -1961 3rd cycle
0
10
20
30
40
50
60
2 4 6 8 10 12 14 16 18 20
N
Grade Reference
ExternalInternal
Figure 5.22. School 2 - 1964 3rd cycle
CUT SCORE CUT SCORE MCGM1 7.7 MCGM1 7.7 MCGM2 7.9 MCGM2 8.0
Linear Regression 8.9
Comment: The number of examinees increased. These were the worst grades since the start of the reform. This exam included simple questions, i.e., the association of resistances in series and in parallel.
Comment: The exam keeps the same structure and contents of the previous ones and an improvement in the grades of internal students versus external students can be observed.

122
08
162432404856647280
2 4 6 8 10 12 14 16 18 20
N
Grade Reference
ExternalInternal
Figure 5.23. School 1+ 2 - 1965 3rd cycle
08
162432404856647280
2 4 6 8 10 12 14 16 18 20
N
Grade Reference
Barely CompetentOther Internal
Figure 5.24. School 1+ 2 - 1965 3rd cycle
CUT SCORE CUT SCORE MCGM1 9.3 MCGM1 11.3 MCGM2 9.3 MCGM2 12.0 Linear Regression 8.8
Comment: In order to include a higher number of examinees, two schools were considered. The cut score for all the examinees improved but was still negative. The cut score for internal students decreased when compared to 1960.
01020304050607080
2 4 6 8 10 12 14 16 18 20
N
Grade Reference
ExternalInternal
Figure 5.25. School 2 - 1966 3rd cycle
CUT SCORE MCGM1 9.5 MCGM2 8.1 Linear Regression 7.0
Comment: The increase of examinees in school 2 continues with mainly external students and the cut score decreases.
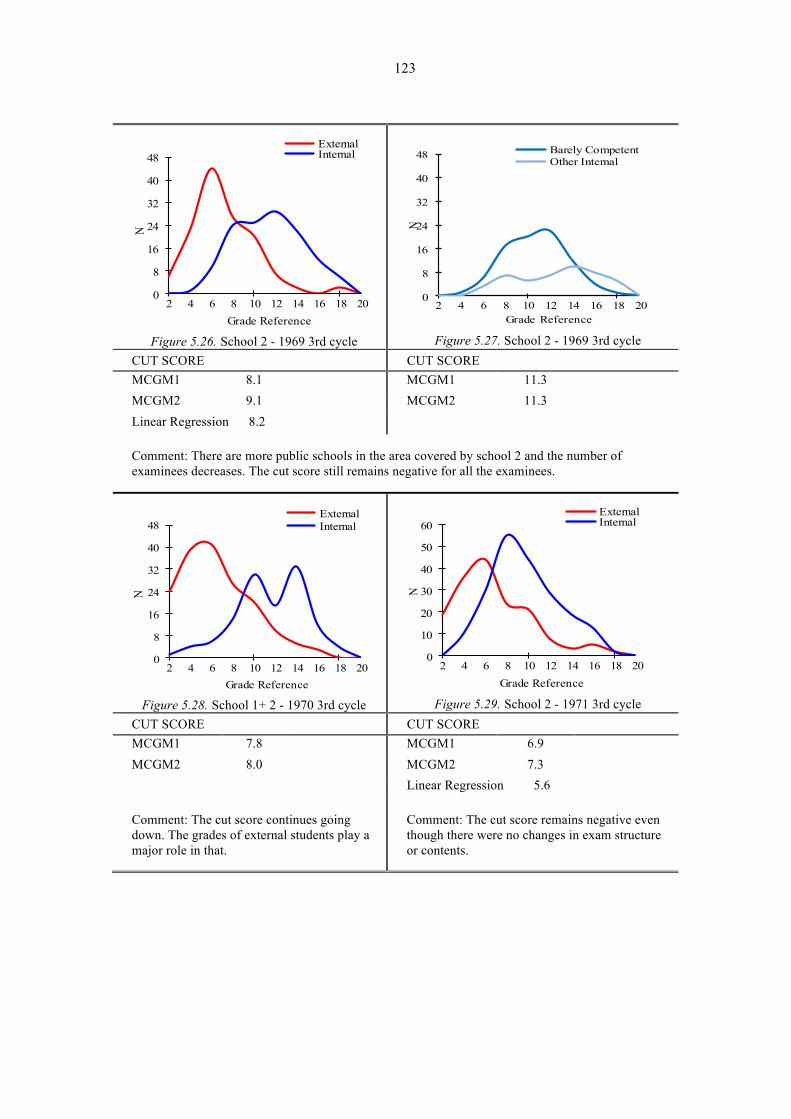
123
0
8
16
24
32
40
48
2 4 6 8 10 12 14 16 18 20
N
Grade Reference
ExternalInternal
Figure 5.26. School 2 - 1969 3rd cycle
0
8
16
24
32
40
48
2 4 6 8 10 12 14 16 18 20
N
Grade Reference
Barely CompetentOther Internal
Figure 5.27. School 2 - 1969 3rd cycle
CUT SCORE CUT SCORE MCGM1 8.1 MCGM1 11.3 MCGM2 9.1 MCGM2 11.3 Linear Regression 8.2
Comment: There are more public schools in the area covered by school 2 and the number of examinees decreases. The cut score still remains negative for all the examinees.
0
8
16
24
32
40
48
2 4 6 8 10 12 14 16 18 20
N
Grade Reference
ExternalInternal
Figure 5.28. School 1+ 2 - 1970 3rd cycle
0
10
20
30
40
50
60
2 4 6 8 10 12 14 16 18 20
N
Grade Reference
ExternalInternal
Figure 5.29. School 2 - 1971 3rd cycle
CUT SCORE CUT SCORE MCGM1 7.8 MCGM1 6.9 MCGM2 8.0 MCGM2 7.3 Linear Regression 5.6
Comment: The cut score continues going down. The grades of external students play a major role in that.
Comment: The cut score remains negative even though there were no changes in exam structure or contents.
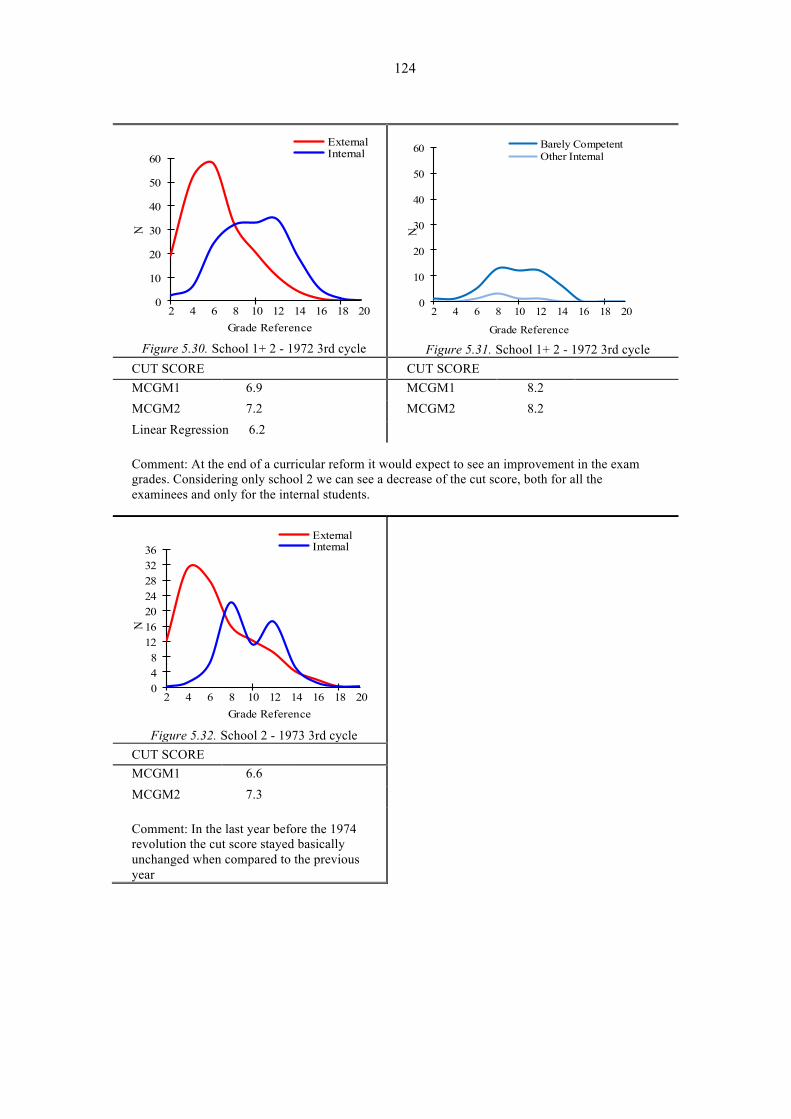
124
0
10
20
30
40
50
60
2 4 6 8 10 12 14 16 18 20
N
Grade Reference
ExternalInternal
Figure 5.30. School 1+ 2 - 1972 3rd cycle
0
10
20
30
40
50
60
2 4 6 8 10 12 14 16 18 20
N
Grade Reference
Barely CompetentOther Internal
Figure 5.31. School 1+ 2 - 1972 3rd cycle
CUT SCORE CUT SCORE MCGM1 6.9 MCGM1 8.2 MCGM2 7.2 MCGM2 8.2 Linear Regression 6.2
Comment: At the end of a curricular reform it would expect to see an improvement in the exam grades. Considering only school 2 we can see a decrease of the cut score, both for all the examinees and only for the internal students.
048
12162024283236
2 4 6 8 10 12 14 16 18 20
N
Grade Reference
ExternalInternal
Figure 5.32. School 2 - 1973 3rd cycle
CUT SCORE MCGM1 6.6 MCGM2 7.3
Comment: In the last year before the 1974 revolution the cut score stayed basically unchanged when compared to the previous year
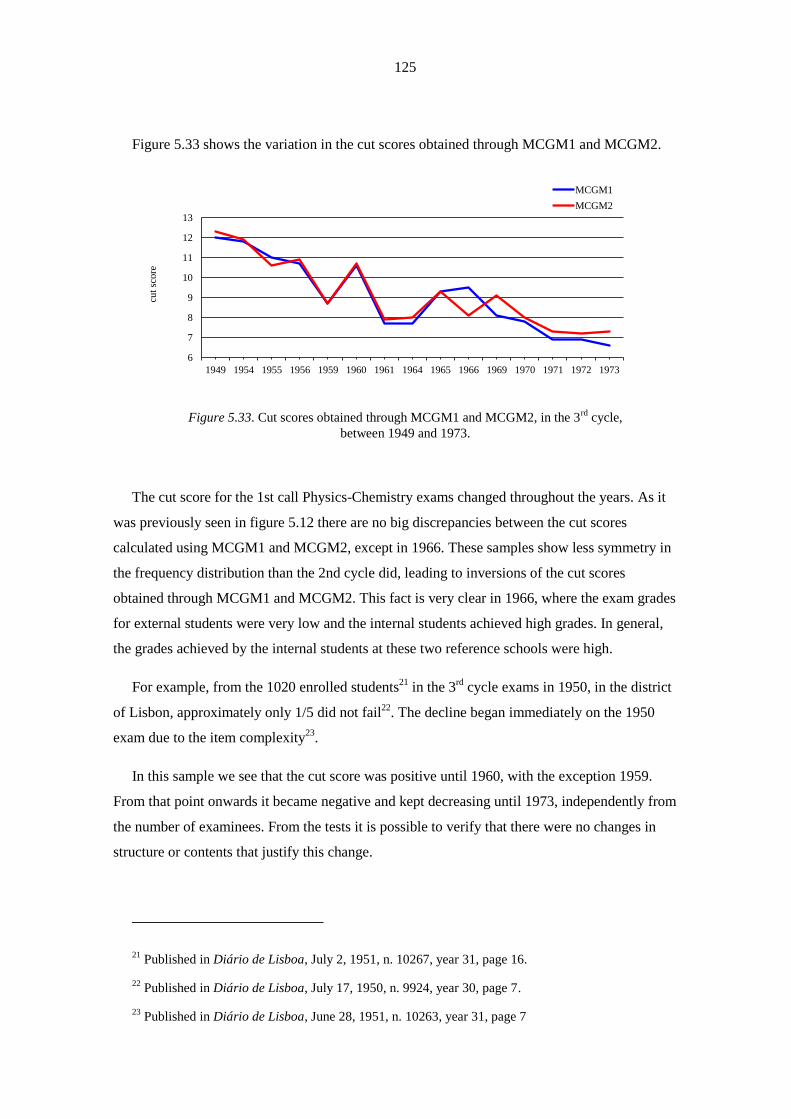
125
Figure 5.33 shows the variation in the cut scores obtained through MCGM1 and MCGM2.
6
7
8
9
10
11
12
13
1949 1954 1955 1956 1959 1960 1961 1964 1965 1966 1969 1970 1971 1972 1973
cut
score
MCGM1
MCGM2
Figure 5.33. Cut scores obtained through MCGM1 and MCGM2, in the 3rd
cycle,
between 1949 and 1973.
The cut score for the 1st call Physics-Chemistry exams changed throughout the years. As it
was previously seen in figure 5.12 there are no big discrepancies between the cut scores
calculated using MCGM1 and MCGM2, except in 1966. These samples show less symmetry in
the frequency distribution than the 2nd cycle did, leading to inversions of the cut scores
obtained through MCGM1 and MCGM2. This fact is very clear in 1966, where the exam grades
for external students were very low and the internal students achieved high grades. In general,
the grades achieved by the internal students at these two reference schools were high.
For example, from the 1020 enrolled students21
in the 3rd
cycle exams in 1950, in the district
of Lisbon, approximately only 1/5 did not fail22
. The decline began immediately on the 1950
exam due to the item complexity23
.
In this sample we see that the cut score was positive until 1960, with the exception 1959.
From that point onwards it became negative and kept decreasing until 1973, independently from
the number of examinees. From the tests it is possible to verify that there were no changes in
structure or contents that justify this change.
21 Published in Diário de Lisboa, July 2, 1951, n. 10267, year 31, page 16.
22 Published in Diário de Lisboa, July 17, 1950, n. 9924, year 30, page 7.
23 Published in Diário de Lisboa, June 28, 1951, n. 10263, year 31, page 7

126
08
1624324048566472
2 4 6 8 10 12 14 16 18 20
N
Grade Reference
ExternalInternal
Figure 5.34. School 3 - Physics 1982 12th grade
08
1624324048566472
2 4 6 8 10 12 14 16 18 20
N
Grade Reference
Barely CompetentOther Internal
Figure 5.35. School 3 - Physics 1982 12th grade
CUT SCORE CUT SCORE MCGM1 7.8 MCGM1 10.4 MCGM2 11.2 MCGM2 10.3 Linear Regression 11.6 Linear Regression 14.7
Comment: This school gathered students from a privileged area of Lisbon and this was a very popular exam after the extinction of the Propaedeutic Year. There were a high percentage of internal students and the cut score was positive both for internal students and all students.
048
1216202428323640
2 4 6 8 10 12 14 16 18 20
N
Grade Reference
ExternalInternal
Figure 5.36. School 3 - Physics 1983 12th grade
048
1216202428323640
2 4 6 8 10 12 14 16 18 20
N
Grade Reference
Barely CompetentOther Internal
Figure 5.37. School 3 - Physics 1983 12th grade
CUT SCORE CUT SCORE MCGM1 7.9 MCGM1 10.5 MCGM2 7.5 MCGM2 8.3 Linear Regression 11.3
Comment: The opening of new schools led to a decrease in the number of examinees at this school. With the increase of external examinees the cut score for all the examinees was located in the interval between 7 and 8.

127
048
121620242832
2 4 6 8 10 12 14 16 18 20
N
Grade Reference
ExternalInternal
Figure 5.38. School 3 - Physics 1984 12th grade
048
121620242832
2 4 6 8 10 12 14 16 18 20
N
Grade Reference
Barely CompetentOther Internal
Figure 5.39. School 3 - Physics 1984 12th grade
CUT SCORE CUT SCORE MCGM1 7.0 MCGM1 10.0 MCGM2 7.6 MCGM2 9.5 Linear Regression 4.8
Comment: The number of examinees continued to decrease and the grades, for both the internal students and all the examinees also went down. The cut score remains in the 7 to 8 interval.
048
121620242832
2 4 6 8 10 12 14 16 18 20
N
Grade Reference
ExternalInternal
Figure 5.40. School 3 - Physics 1985 12th grade
048
121620242832
2 4 6 8 10 12 14 16 18 20
N
Grade Reference
ExternalInternal
Figure 5.41. School 3 - Physics 1986 12th grade
CUT SCORE CUT SCORE MCGM1 7.5 MCGM2 10.3 MCGM2 7.8 MCGM2 10.5 Linear Regression 6.0
Comment: There is greater uniformity of grades when compared to the previous year. The cut score stays in the 7 to 8 interval.
Comment: With the decrease in the number of external examinees there is an increase in the cut score. Many of the external examinees took the exam to improve their grade.
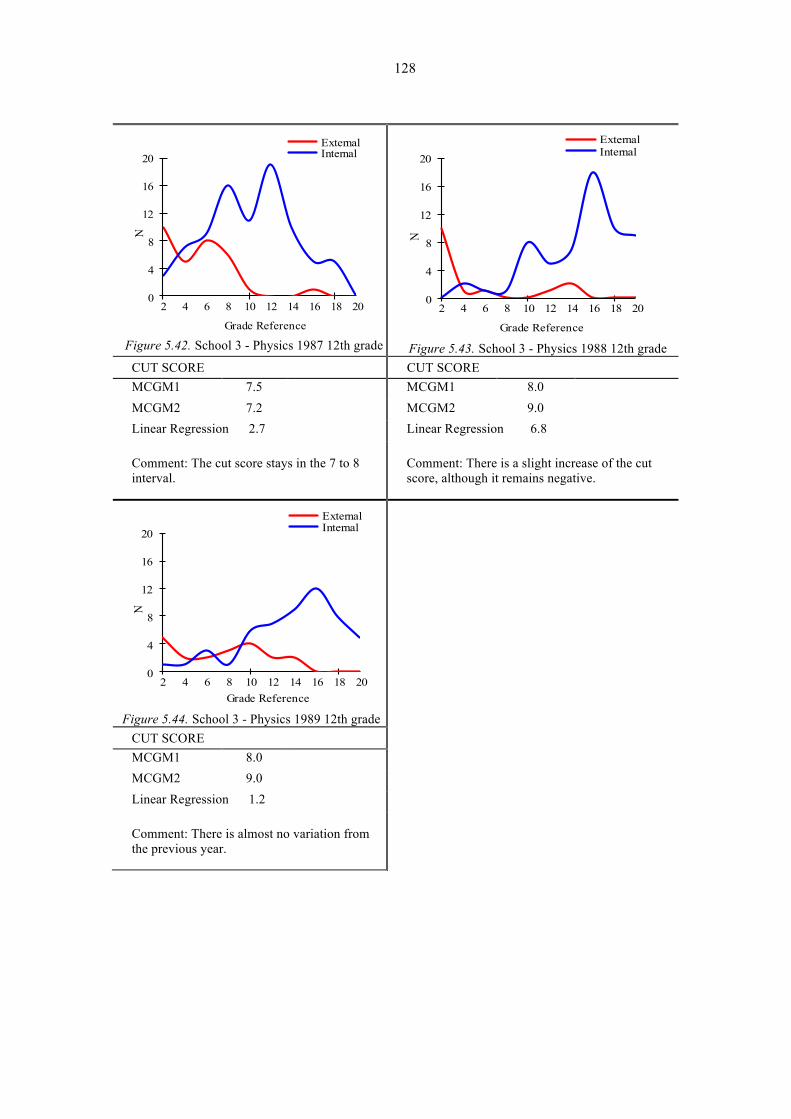
128
0
4
8
12
16
20
2 4 6 8 10 12 14 16 18 20
N
Grade Reference
ExternalInternal
Figure 5.42. School 3 - Physics 1987 12th grade
0
4
8
12
16
20
2 4 6 8 10 12 14 16 18 20
N
Grade Reference
ExternalInternal
Figure 5.43. School 3 - Physics 1988 12th grade
CUT SCORE CUT SCORE MCGM1 7.5 MCGM1 8.0 MCGM2 7.2 MCGM2 9.0 Linear Regression 2.7 Linear Regression 6.8
Comment: The cut score stays in the 7 to 8 interval.
Comment: There is a slight increase of the cut score, although it remains negative.
0
4
8
12
16
20
2 4 6 8 10 12 14 16 18 20
N
Grade Reference
ExternalInternal
Figure 5.44. School 3 - Physics 1989 12th grade
CUT SCORE MCGM1 8.0 MCGM2 9.0 Linear Regression 1.2
Comment: There is almost no variation from the previous year.
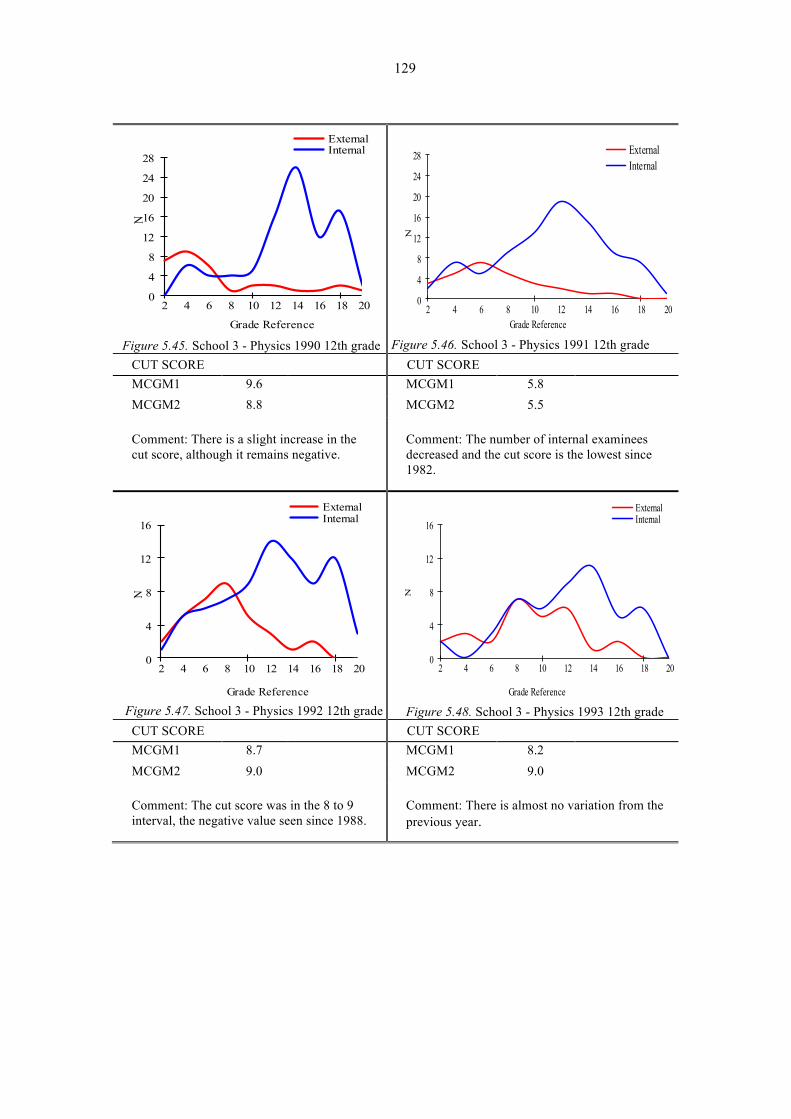
129
0
4
8
12
16
20
24
28
2 4 6 8 10 12 14 16 18 20
N
Grade Reference
ExternalInternal
Figure 5.45. School 3 - Physics 1990 12th grade
0
4
8
12
16
20
24
28
2 4 6 8 10 12 14 16 18 20
N
Grade Reference
ExternalInternal
Figure 5.46. School 3 - Physics 1991 12th grade CUT SCORE CUT SCORE MCGM1 9.6 MCGM1 5.8 MCGM2 8.8 MCGM2 5.5
Comment: There is a slight increase in the cut score, although it remains negative.
Comment: The number of internal examinees decreased and the cut score is the lowest since 1982.
0
4
8
12
16
2 4 6 8 10 12 14 16 18 20
N
Grade Reference
ExternalInternal
Figure 5.47. School 3 - Physics 1992 12th grade
0
4
8
12
16
2 4 6 8 10 12 14 16 18 20
N
Grade Reference
ExternalInternal
Figure 5.48. School 3 - Physics 1993 12th grade CUT SCORE CUT SCORE MCGM1 8.7 MCGM1 8.2 MCGM2 9.0 MCGM2 9.0
Comment: The cut score was in the 8 to 9 interval, the negative value seen since 1988.
Comment: There is almost no variation from the previous year.
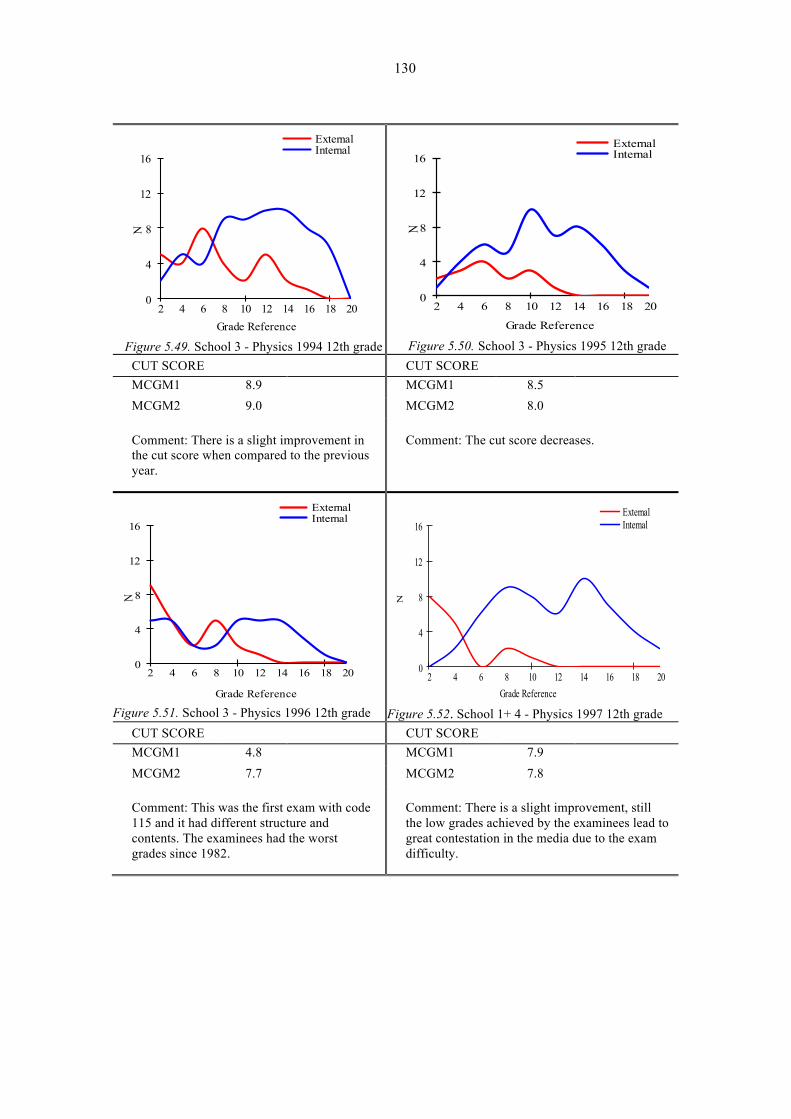
130
0
4
8
12
16
2 4 6 8 10 12 14 16 18 20
N
Grade Reference
ExternalInternal
Figure 5.49. School 3 - Physics 1994 12th grade
0
4
8
12
16
2 4 6 8 10 12 14 16 18 20
N
Grade Reference
ExternalInternal
Figure 5.50. School 3 - Physics 1995 12th grade
CUT SCORE CUT SCORE MCGM1 8.9 MCGM1 8.5 MCGM2 9.0 MCGM2 8.0
Comment: There is a slight improvement in the cut score when compared to the previous year.
Comment: The cut score decreases.
0
4
8
12
16
2 4 6 8 10 12 14 16 18 20
N
Grade Reference
ExternalInternal
Figure 5.51. School 3 - Physics 1996 12th grade
0
4
8
12
16
2 4 6 8 10 12 14 16 18 20
N
Grade Reference
ExternalInternal
Figure 5.52. School 1+ 4 - Physics 1997 12th grade
CUT SCORE CUT SCORE MCGM1 4.8 MCGM1 7.9 MCGM2 7.7 MCGM2 7.8
Comment: This was the first exam with code 115 and it had different structure and contents. The examinees had the worst grades since 1982.
Comment: There is a slight improvement, still the low grades achieved by the examinees lead to great contestation in the media due to the exam difficulty.
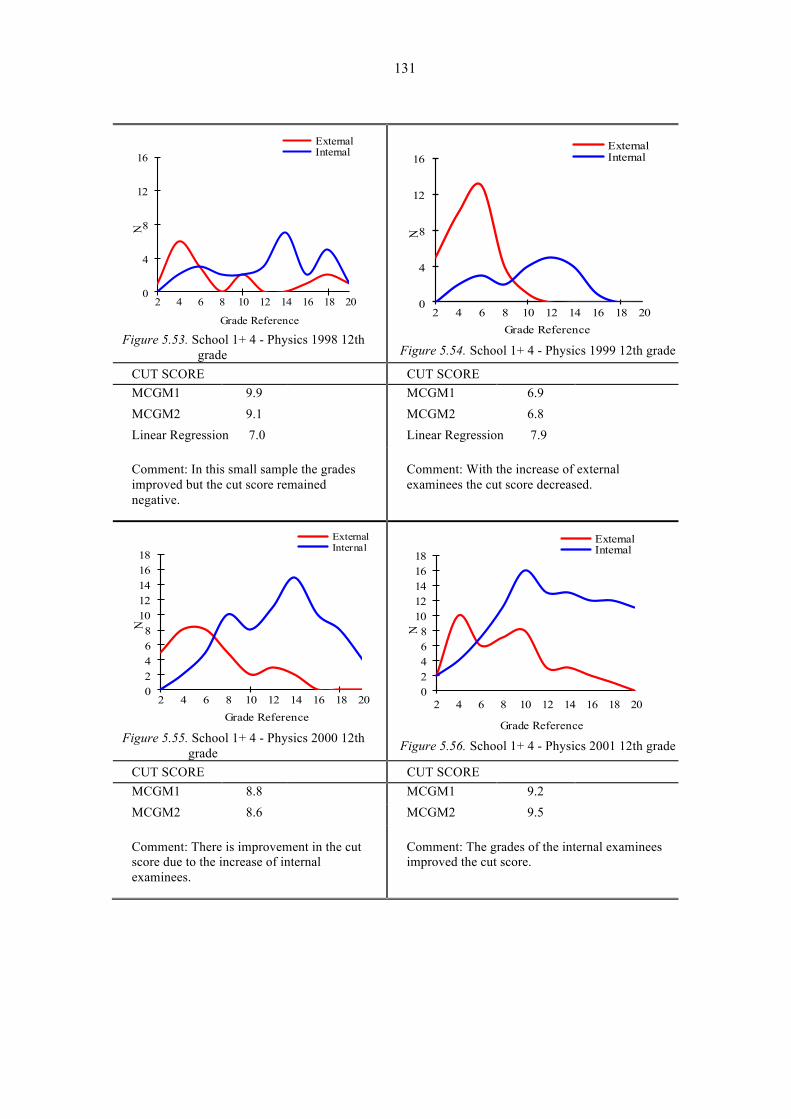
131
0
4
8
12
16
2 4 6 8 10 12 14 16 18 20
N
Grade Reference
ExternalInternal
Figure 5.53. School 1+ 4 - Physics 1998 12th
grade
0
4
8
12
16
2 4 6 8 10 12 14 16 18 20
N
Grade Reference
ExternalInternal
Figure 5.54. School 1+ 4 - Physics 1999 12th grade
CUT SCORE CUT SCORE MCGM1 9.9 MCGM1 6.9 MCGM2 9.1 MCGM2 6.8 Linear Regression 7.0 Linear Regression 7.9
Comment: In this small sample the grades improved but the cut score remained negative.
Comment: With the increase of external examinees the cut score decreased.
02468
1012141618
2 4 6 8 10 12 14 16 18 20
N
Grade Reference
ExternalInternal
Figure 5.55. School 1+ 4 - Physics 2000 12th
grade
02468
1012141618
2 4 6 8 10 12 14 16 18 20
N
Grade Reference
ExternalInternal
Figure 5.56. School 1+ 4 - Physics 2001 12th grade
CUT SCORE CUT SCORE MCGM1 8.8 MCGM1 9.2 MCGM2 8.6 MCGM2 9.5
Comment: There is improvement in the cut score due to the increase of internal examinees.
Comment: The grades of the internal examinees improved the cut score.

132
0
10
20
30
40
50
2 4 6 8 10 12 14 16 18 20
N
Grade Reference
ExternalInternal
Figure 5.57. 6 schools - Physics 2002 12th grade
0
10
20
30
40
50
2 4 6 8 10 12 14 16 18 20
N
Grade Reference
ExternalInternal
Figure 5.58. 9 schools - Physics 2003 12th grade
CUT SCORE CUT SCORE MCGM1 9.0 MCGM1 8.8 MCGM2 9.4 MCGM2 8.8
Comment: The cut score remained negative when considering a bigger number of schools in the Greater Lisbon area.
Comment: There is a significant increase in the number of examinees and the cut score decreased.
0100200300400500600700800
10 30 50 70 90 110130150170190
N
Grade Reference
ExternalInternal
Figure 5.59. ENES Physics 2004 12th grade
0100200300400500600700800
10 30 50 70 90 110 130 150 170 190
N
Grade Reference
Barely CompetentOther internal
Figure 5.60. ENES Physics 2004 12th grade
CUT SCORE CUT SCORE MCGM1 7.9 MCGM1 11.8 MCGM2 10.4 MCGM2 11.4
Comment: Considering all the examinees that did this exam (ENES) [Secondary School National Statistics], the median cut score is negative, while the average cut score is positive for both groups. The cut score for internal students was in the interval between 11 and 12.
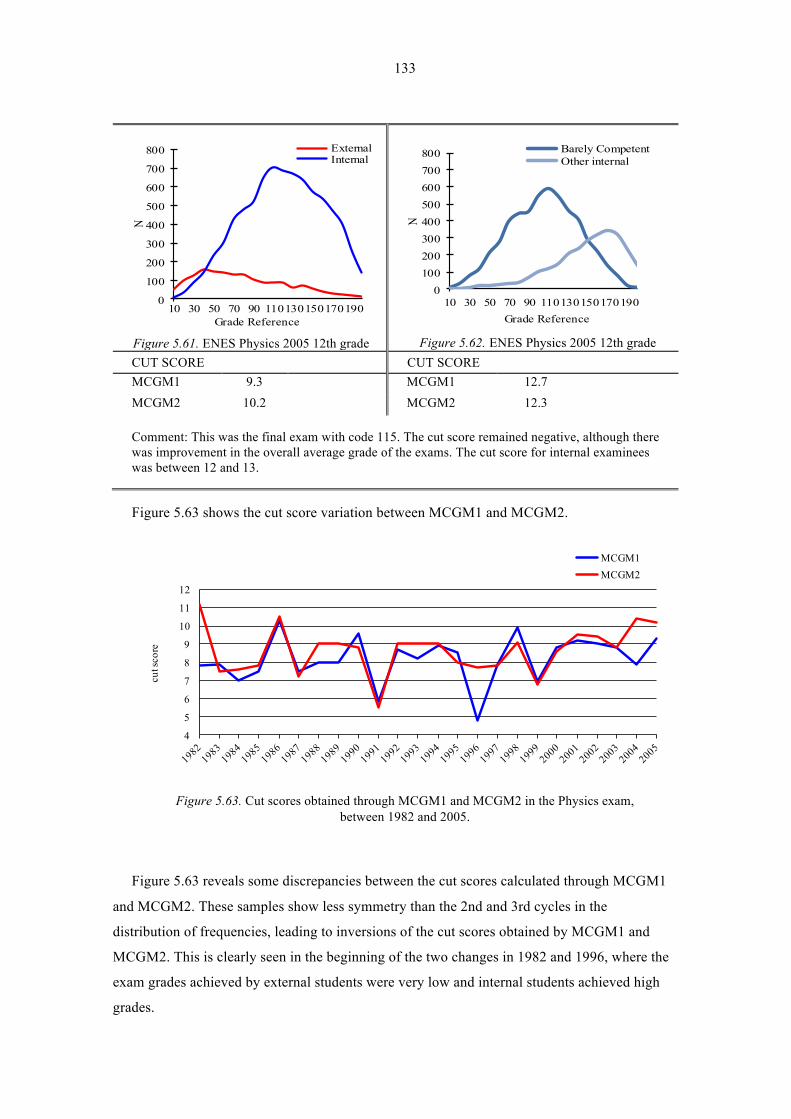
133
0
100
200
300
400
500
600
700
800
10 30 50 70 90 110130150170190
N
Grade Reference
ExternalInternal
Figure 5.61. ENES Physics 2005 12th grade
0100200300400500600700800
10 30 50 70 90 110130150170190
N
Grade Reference
Barely CompetentOther internal
Figure 5.62. ENES Physics 2005 12th grade
CUT SCORE CUT SCORE MCGM1 9.3 MCGM1 12.7 MCGM2 10.2 MCGM2 12.3
Comment: This was the final exam with code 115. The cut score remained negative, although there was improvement in the overall average grade of the exams. The cut score for internal examinees was between 12 and 13.
Figure 5.63 shows the cut score variation between MCGM1 and MCGM2.
4
5
6
7
8
9
10
11
12
cut s
core
MCGM1MCGM2
Figure 5.63. Cut scores obtained through MCGM1 and MCGM2 in the Physics exam, between 1982 and 2005.
Figure 5.63 reveals some discrepancies between the cut scores calculated through MCGM1
and MCGM2. These samples show less symmetry than the 2nd and 3rd cycles in the
distribution of frequencies, leading to inversions of the cut scores obtained by MCGM1 and
MCGM2. This is clearly seen in the beginning of the two changes in 1982 and 1996, where the
exam grades achieved by external students were very low and internal students achieved high
grades.

134
The data sampled from various public schools and from the statistics of the Ministry of
Education point to a negative cut score in the Physics exams between 1982 and 2005, with the
exception of 1982 and 1986. The cut scores for the 1991 and 1999 exams are very low, but the
samples for those years are also very small.
Similarly to 1949 regarding the Physical-Chemical Sciences exam, the first exam following
the creation of 12th grade, in 1982, had the best cut score of the 23 years of Physics exams.
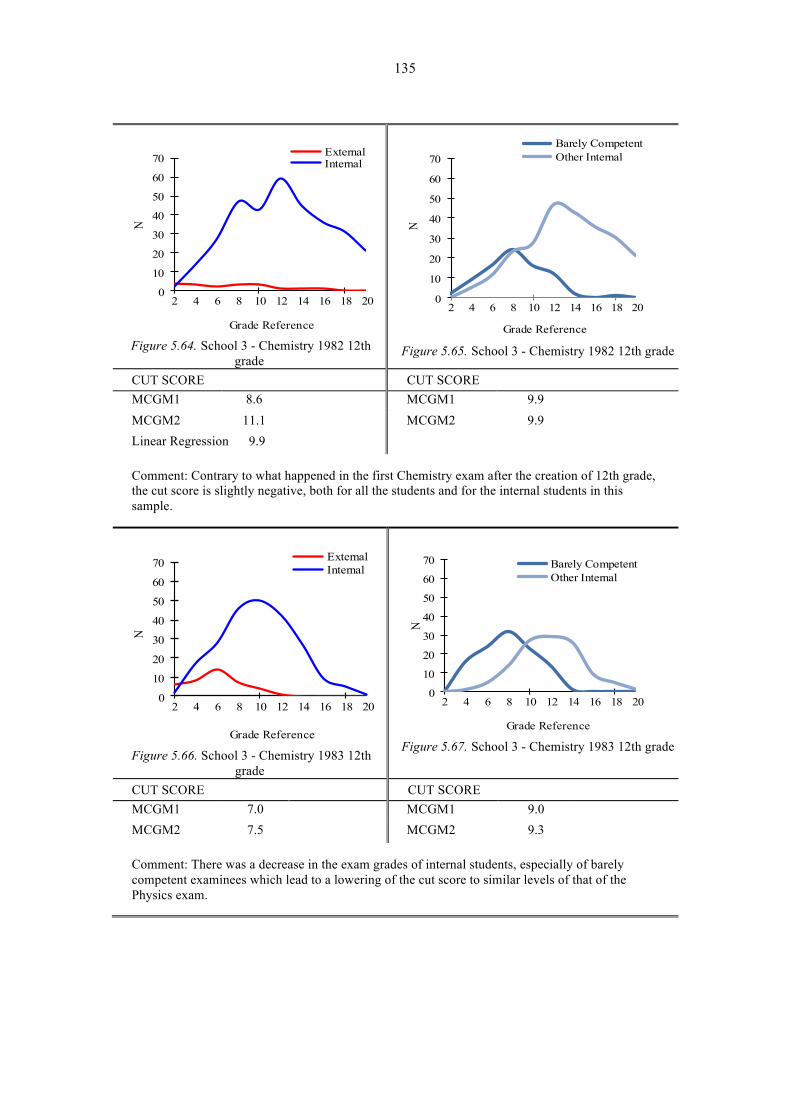
135
0
10
20
30
40
50
60
70
2 4 6 8 10 12 14 16 18 20
N
Grade Reference
ExternalInternal
Figure 5.64. School 3 - Chemistry 1982 12th grade
0
10
20
30
40
50
60
70
2 4 6 8 10 12 14 16 18 20
N
Grade Reference
Barely CompetentOther Internal
Figure 5.65. School 3 - Chemistry 1982 12th grade
CUT SCORE CUT SCORE MCGM1 8.6 MCGM1 9.9 MCGM2 11.1 MCGM2 9.9 Linear Regression 9.9
Comment: Contrary to what happened in the first Chemistry exam after the creation of 12th grade, the cut score is slightly negative, both for all the students and for the internal students in this sample.
0
10
20
30
40
50
60
70
2 4 6 8 10 12 14 16 18 20
N
Grade Reference
ExternalInternal
Figure 5.66. School 3 - Chemistry 1983 12th grade
0
10
20
30
40
50
60
70
2 4 6 8 10 12 14 16 18 20
N
Grade Reference
Barely CompetentOther Internal
Figure 5.67. School 3 - Chemistry 1983 12th grade
CUT SCORE CUT SCORE MCGM1 7.0 MCGM1 9.0 MCGM2 7.5 MCGM2 9.3
Comment: There was a decrease in the exam grades of internal students, especially of barely competent examinees which lead to a lowering of the cut score to similar levels of that of the Physics exam.
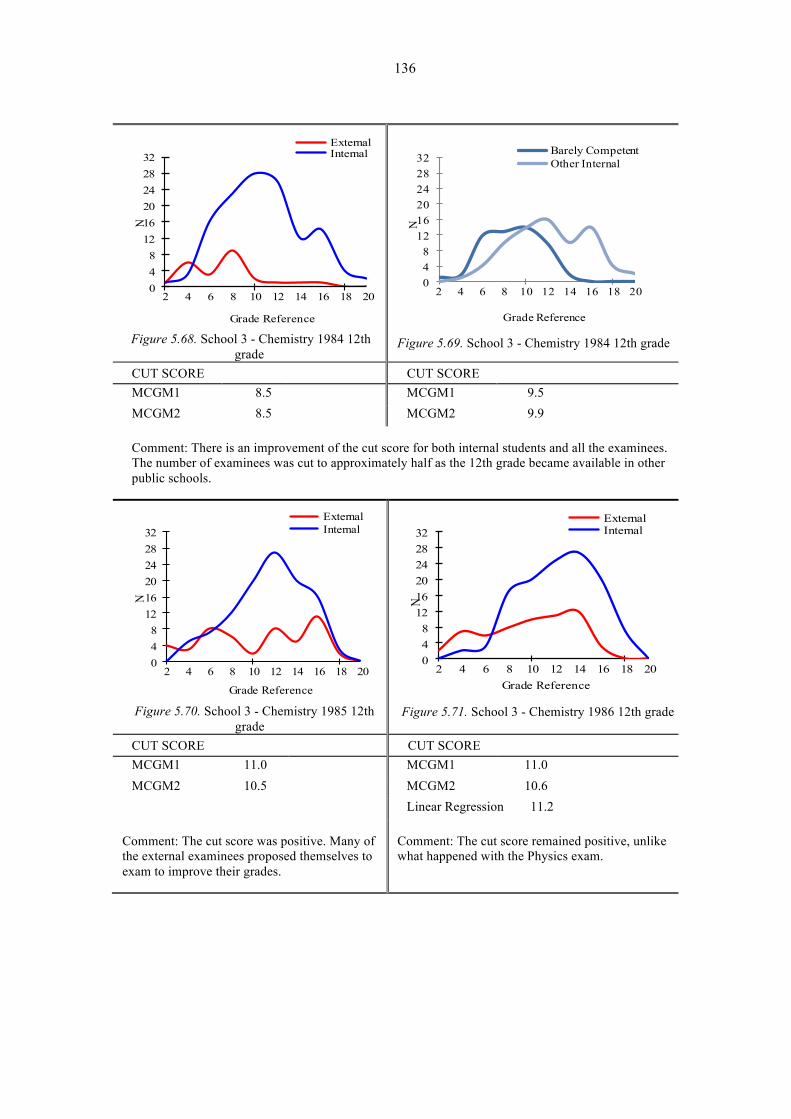
136
048
121620242832
2 4 6 8 10 12 14 16 18 20
N
Grade Reference
ExternalInternal
Figure 5.68. School 3 - Chemistry 1984 12th grade
048
121620242832
2 4 6 8 10 12 14 16 18 20
N
Grade Reference
Barely CompetentOther Internal
Figure 5.69. School 3 - Chemistry 1984 12th grade
CUT SCORE CUT SCORE MCGM1 8.5 MCGM1 9.5 MCGM2 8.5 MCGM2 9.9
Comment: There is an improvement of the cut score for both internal students and all the examinees. The number of examinees was cut to approximately half as the 12th grade became available in other public schools.
048
121620242832
2 4 6 8 10 12 14 16 18 20
N
Grade Reference
ExternalInternal
Figure 5.70. School 3 - Chemistry 1985 12th
grade
048
121620242832
2 4 6 8 10 12 14 16 18 20
N
Grade Reference
ExternalInternal
Figure 5.71. School 3 - Chemistry 1986 12th grade
CUT SCORE CUT SCORE MCGM1 11.0 MCGM1 11.0 MCGM2 10.5 MCGM2 10.6
Linear Regression 11.2
Comment: The cut score was positive. Many of the external examinees proposed themselves to exam to improve their grades.
Comment: The cut score remained positive, unlike what happened with the Physics exam.

137
048
121620242832
2 4 6 8 10 12 14 16 18 20
N
Grade Reference
ExternalInternal
Figure 5.72. School 3 - Chemistry 1987 12th
grade
048
121620242832
2 4 6 8 10 12 14 16 18 20
N
Grade Reference
ExternalInternal
Figure 5.73. School 3 - Chemistry 1988 12th grade
CUT SCORE CUT SCORE MCGM1 8.3 MCGM1 10.5 MCGM2 8.0 MCGM2 10.1 Linear Regression 6.7
Comment: The cut score went back to being negative in this school, in a small sample of students.
Comment: The examinees are mainly internal and the cut score is positive.
048
121620242832
2 4 6 8 10 12 14 16 18 20
N
Grade Reference
ExternalInternal
Figure 5.74. School 3 - Chemistry 1989 12th
grade CUT SCORE MCGM1 11.0 MCGM2 10.6 Linear Regression 11.2
Comment: There isn’t a significant variation when compared with the previous year, with the exception of a lower number of maximum grades.
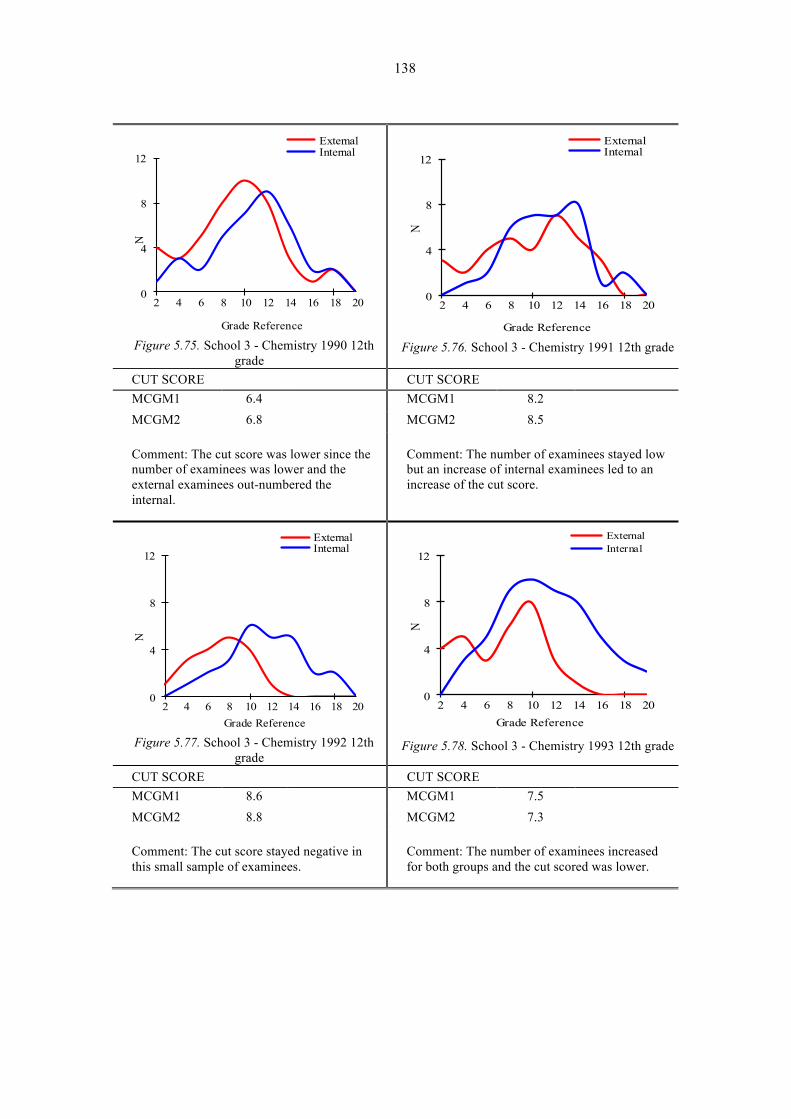
138
0
4
8
12
2 4 6 8 10 12 14 16 18 20
N
Grade Reference
ExternalInternal
Figure 5.75. School 3 - Chemistry 1990 12th
grade
0
4
8
12
2 4 6 8 10 12 14 16 18 20
N
Grade Reference
ExternalInternal
Figure 5.76. School 3 - Chemistry 1991 12th grade
CUT SCORE CUT SCORE MCGM1 6.4 MCGM1 8.2 MCGM2 6.8 MCGM2 8.5
Comment: The cut score was lower since the number of examinees was lower and the external examinees out-numbered the internal.
Comment: The number of examinees stayed low but an increase of internal examinees led to an increase of the cut score.
0
4
8
12
2 4 6 8 10 12 14 16 18 20
N
Grade Reference
ExternalInternal
Figure 5.77. School 3 - Chemistry 1992 12th
grade
0
4
8
12
2 4 6 8 10 12 14 16 18 20
N
Grade Reference
ExternalInternal
Figure 5.78. School 3 - Chemistry 1993 12th grade
CUT SCORE CUT SCORE MCGM1 8.6 MCGM1 7.5 MCGM2 8.8 MCGM2 7.3
Comment: The cut score stayed negative in this small sample of examinees.
Comment: The number of examinees increased for both groups and the cut scored was lower.
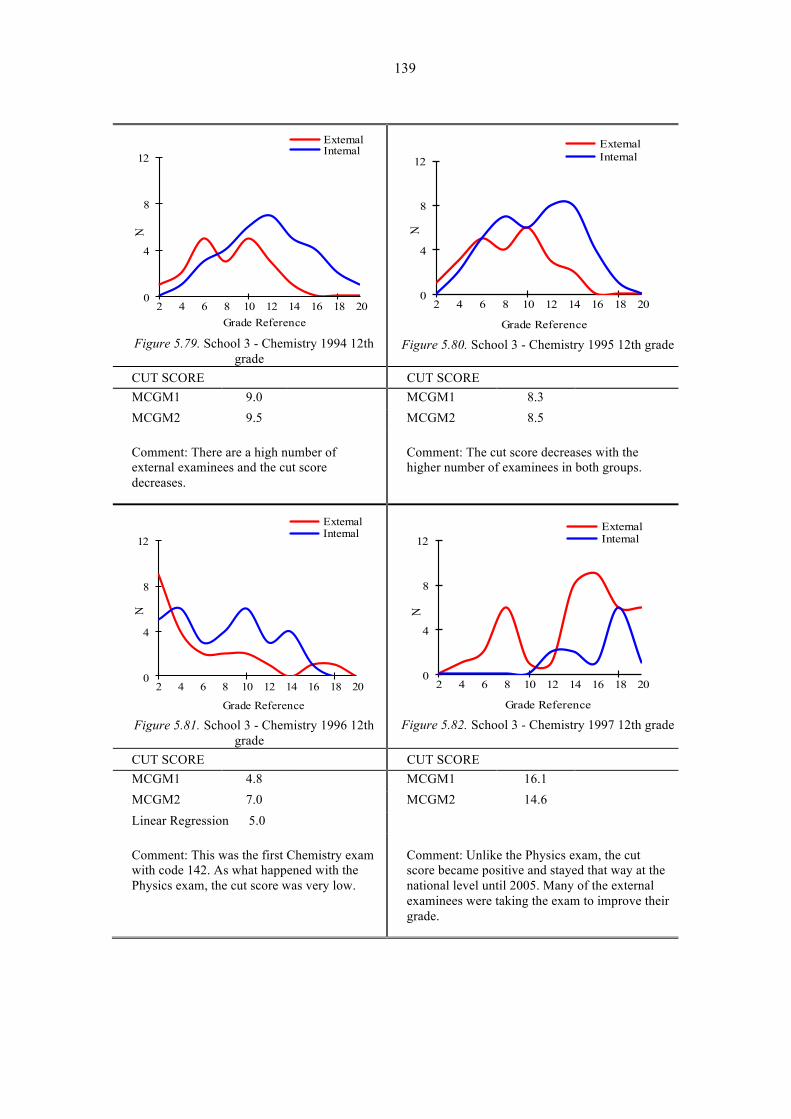
139
0
4
8
12
2 4 6 8 10 12 14 16 18 20
N
Grade Reference
ExternalInternal
Figure 5.79. School 3 - Chemistry 1994 12th
grade
0
4
8
12
2 4 6 8 10 12 14 16 18 20
N
Grade Reference
ExternalInternal
Figure 5.80. School 3 - Chemistry 1995 12th grade
CUT SCORE CUT SCORE MCGM1 9.0 MCGM1 8.3 MCGM2 9.5 MCGM2 8.5
Comment: There are a high number of external examinees and the cut score decreases.
Comment: The cut score decreases with the higher number of examinees in both groups.
0
4
8
12
2 4 6 8 10 12 14 16 18 20
N
Grade Reference
ExternalInternal
Figure 5.81. School 3 - Chemistry 1996 12th
grade
0
4
8
12
2 4 6 8 10 12 14 16 18 20
N
Grade Reference
ExternalInternal
Figure 5.82. School 3 - Chemistry 1997 12th grade
CUT SCORE CUT SCORE MCGM1 4.8 MCGM1 16.1 MCGM2 7.0 MCGM2 14.6 Linear Regression 5.0
Comment: This was the first Chemistry exam with code 142. As what happened with the Physics exam, the cut score was very low.
Comment: Unlike the Physics exam, the cut score became positive and stayed that way at the national level until 2005. Many of the external examinees were taking the exam to improve their grade.
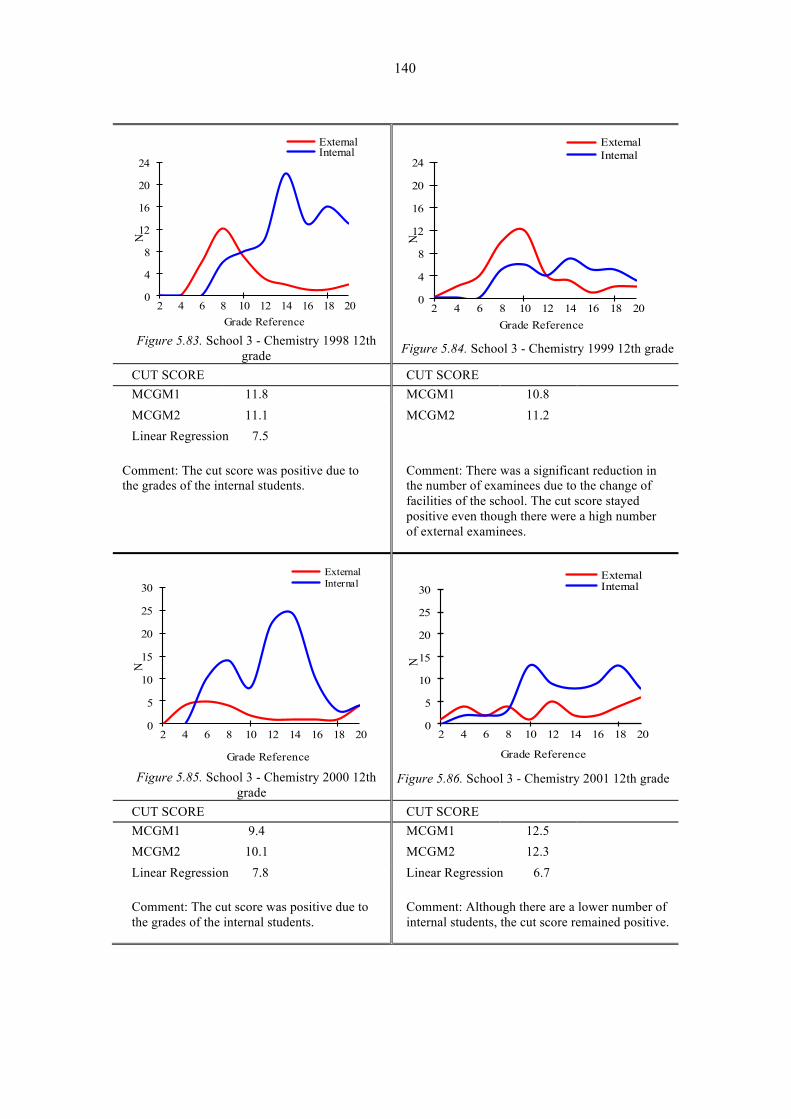
140
0
4
8
12
16
20
24
2 4 6 8 10 12 14 16 18 20
N
Grade Reference
ExternalInternal
Figure 5.83. School 3 - Chemistry 1998 12th
grade
0
4
8
12
16
20
24
2 4 6 8 10 12 14 16 18 20
N
Grade Reference
ExternalInternal
Figure 5.84. School 3 - Chemistry 1999 12th grade
CUT SCORE CUT SCORE MCGM1 11.8 MCGM1 10.8 MCGM2 11.1 MCGM2 11.2 Linear Regression 7.5
Comment: The cut score was positive due to the grades of the internal students.
Comment: There was a significant reduction in the number of examinees due to the change of facilities of the school. The cut score stayed positive even though there were a high number of external examinees.
0
5
10
15
20
25
30
2 4 6 8 10 12 14 16 18 20
N
Grade Reference
ExternalInternal
Figure 5.85. School 3 - Chemistry 2000 12th
grade
0
5
10
15
20
25
30
2 4 6 8 10 12 14 16 18 20
N
Grade Reference
ExternalInternal
Figure 5.86. School 3 - Chemistry 2001 12th grade
CUT SCORE CUT SCORE MCGM1 9.4 MCGM1 12.5 MCGM2 10.1 MCGM2 12.3 Linear Regression 7.8 Linear Regression 6.7
Comment: The cut score was positive due to the grades of the internal students.
Comment: Although there are a lower number of internal students, the cut score remained positive.
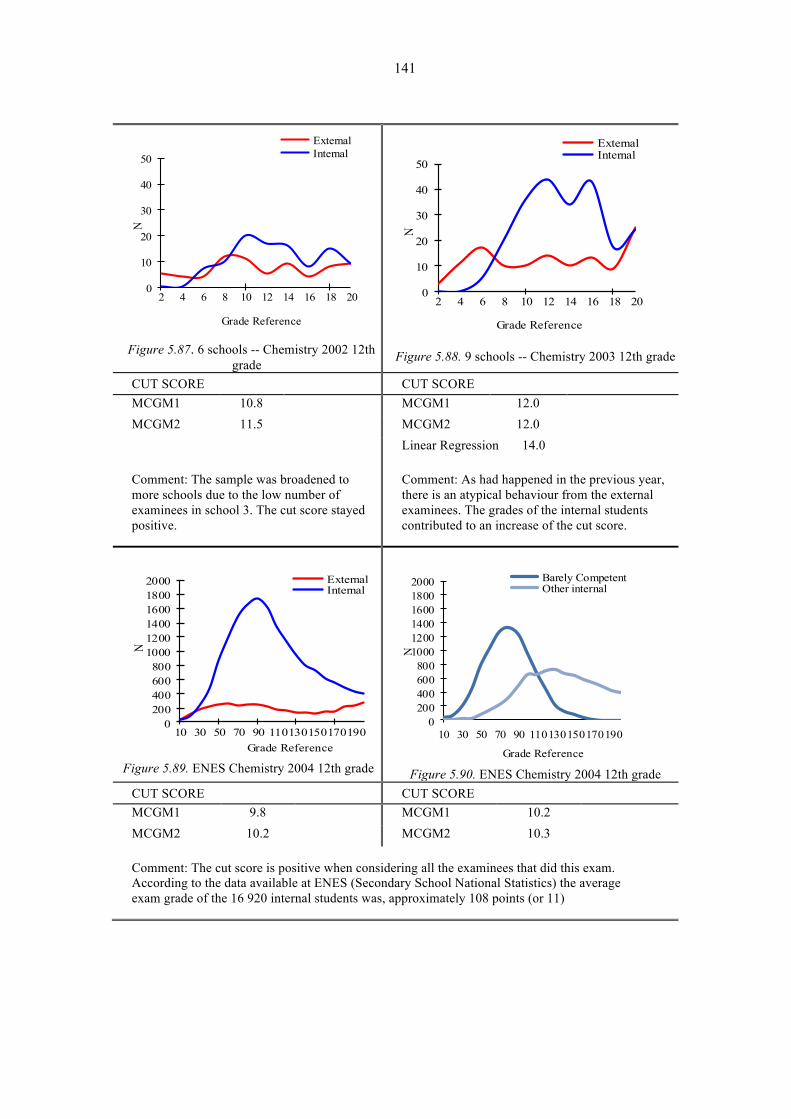
141
0
10
20
30
40
50
2 4 6 8 10 12 14 16 18 20
N
Grade Reference
ExternalInternal
Figure 5.87. 6 schools -- Chemistry 2002 12th
grade
0
10
20
30
40
50
2 4 6 8 10 12 14 16 18 20
N
Grade Reference
ExternalInternal
Figure 5.88. 9 schools -- Chemistry 2003 12th grade
CUT SCORE CUT SCORE MCGM1 10.8 MCGM1 12.0 MCGM2 11.5 MCGM2 12.0
Linear Regression 14.0
Comment: The sample was broadened to more schools due to the low number of examinees in school 3. The cut score stayed positive.
Comment: As had happened in the previous year, there is an atypical behaviour from the external examinees. The grades of the internal students contributed to an increase of the cut score.
0200400600800
100012001400160018002000
10 30 50 70 90 110130150170190
N
Grade Reference
ExternalInternal
Figure 5.89. ENES Chemistry 2004 12th grade
0200400600800
100012001400160018002000
10 30 50 70 90 110130150170190
N
Grade Reference
Barely CompetentOther internal
Figure 5.90. ENES Chemistry 2004 12th grade
CUT SCORE CUT SCORE MCGM1 9.8 MCGM1 10.2 MCGM2 10.2 MCGM2 10.3
Comment: The cut score is positive when considering all the examinees that did this exam. According to the data available at ENES (Secondary School National Statistics) the average exam grade of the 16 920 internal students was, approximately 108 points (or 11)
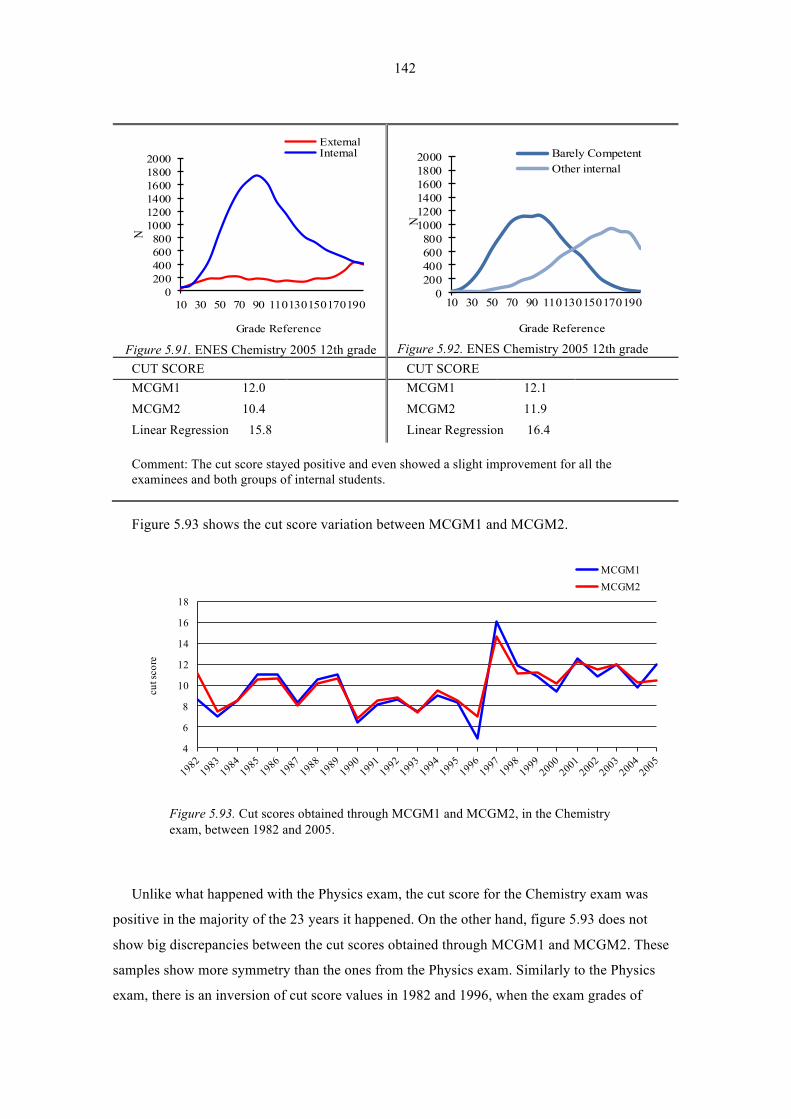
142
0200400600800
100012001400160018002000
10 30 50 70 90 110130150170190
N
Grade Reference
ExternalInternal
Figure 5.91. ENES Chemistry 2005 12th grade
0200400600800
100012001400160018002000
10 30 50 70 90 110130150170190
N
Grade Reference
Barely CompetentOther internal
Figure 5.92. ENES Chemistry 2005 12th grade
CUT SCORE CUT SCORE MCGM1 12.0 MCGM1 12.1 MCGM2 10.4 MCGM2 11.9 Linear Regression 15.8 Linear Regression 16.4
Comment: The cut score stayed positive and even showed a slight improvement for all the examinees and both groups of internal students.
Figure 5.93 shows the cut score variation between MCGM1 and MCGM2.
4
6
8
10
12
14
16
18
cut s
core
MCGM1MCGM2
Figure 5.93. Cut scores obtained through MCGM1 and MCGM2, in the Chemistry exam, between 1982 and 2005.
Unlike what happened with the Physics exam, the cut score for the Chemistry exam was
positive in the majority of the 23 years it happened. On the other hand, figure 5.93 does not
show big discrepancies between the cut scores obtained through MCGM1 and MCGM2. These
samples show more symmetry than the ones from the Physics exam. Similarly to the Physics
exam, there is an inversion of cut score values in 1982 and 1996, when the exam grades of

143
external students were very low and internal students had high grades. The atypical behaviour
from external students is due to a lot of exam applications to improve grades, as students need
high grades to be accepted in healthcare degrees.
Another point that should be highlighted is the variation of the cut scores calculated using
linear regression. The goal was to determine if there was a linear relationship between exam
grades and the groups of internal and external students. This type of analysis is known Potthoff
(1966) analysis and it can be used to predict how test validity varies across different groups of
students. Similarly to what happened with Poteat, Wuensch, and Gregg’s (1988) research, the
results do not allow us to define a clear distinction between internal and external students for all
the exams.
5.2 Beuk Method
The results for each question (QA and QB), total average, standard deviation, ratio of these
standard deviations (stdQA/stdQB) and slope of a line equal to this ratio are presented in
Appendix 2:
Group I – Physics-Chemistry exams of 1956, 1960, 1965, 1969 and 1972 – Table 6.22;
Group II – Physics and Chemistry exams of 1982, 1983 and 1984 – Tables 6.23 to 6.24;
Group III – Physics and Chemistry exams of 2004 and 2005 – Tables 6.25 to 6.26.
The Beuk method is a special case of the Hofstee procedure and rests on two assumptions.
According to Beuk, first, it must be assumed that each teacher “has an opinion of which passing
score should be required, and what pass rate can be expected.” (Beuk, 1984, p. 148) Second,
Beuk alleged that “the relative emphasis given to the two types of judgments should be in
proportion to the extent to which teachers agree with each other.” (Beuk, 1984, p. 148) The ten
chosen teachers are very experienced and got feedback on their answers given.
The students’ results for two High Schools are shown in Appendix 3:
Group I – Tables 6.27 to 6.32;
Group II – Tables 6.32 to 6.34 and Tables 6.37 to 6.39;
Group III – Tables 6.35 to 6.36 and Tables 6.40 to 6.41.
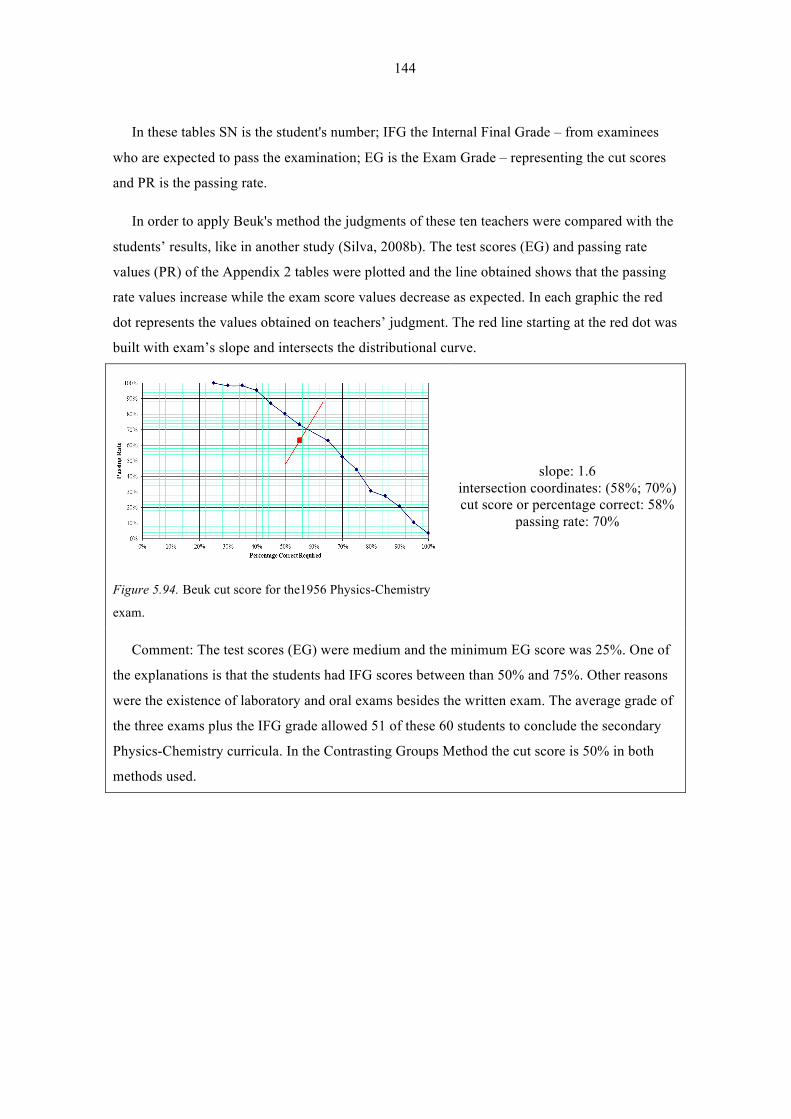
144
In these tables SN is the student's number; IFG the Internal Final Grade – from examinees
who are expected to pass the examination; EG is the Exam Grade – representing the cut scores
and PR is the passing rate.
In order to apply Beuk's method the judgments of these ten teachers were compared with the
students’ results, like in another study (Silva, 2008b). The test scores (EG) and passing rate
values (PR) of the Appendix 2 tables were plotted and the line obtained shows that the passing
rate values increase while the exam score values decrease as expected. In each graphic the red
dot represents the values obtained on teachers’ judgment. The red line starting at the red dot was
built with exam’s slope and intersects the distributional curve.
Figure 5.94. Beuk cut score for the1956 Physics-Chemistry
exam.
slope: 1.6 intersection coordinates: (58%; 70%) cut score or percentage correct: 58%
passing rate: 70%
Comment: The test scores (EG) were medium and the minimum EG score was 25%. One of
the explanations is that the students had IFG scores between than 50% and 75%. Other reasons
were the existence of laboratory and oral exams besides the written exam. The average grade of
the three exams plus the IFG grade allowed 51 of these 60 students to conclude the secondary
Physics-Chemistry curricula. In the Contrasting Groups Method the cut score is 50% in both
methods used.
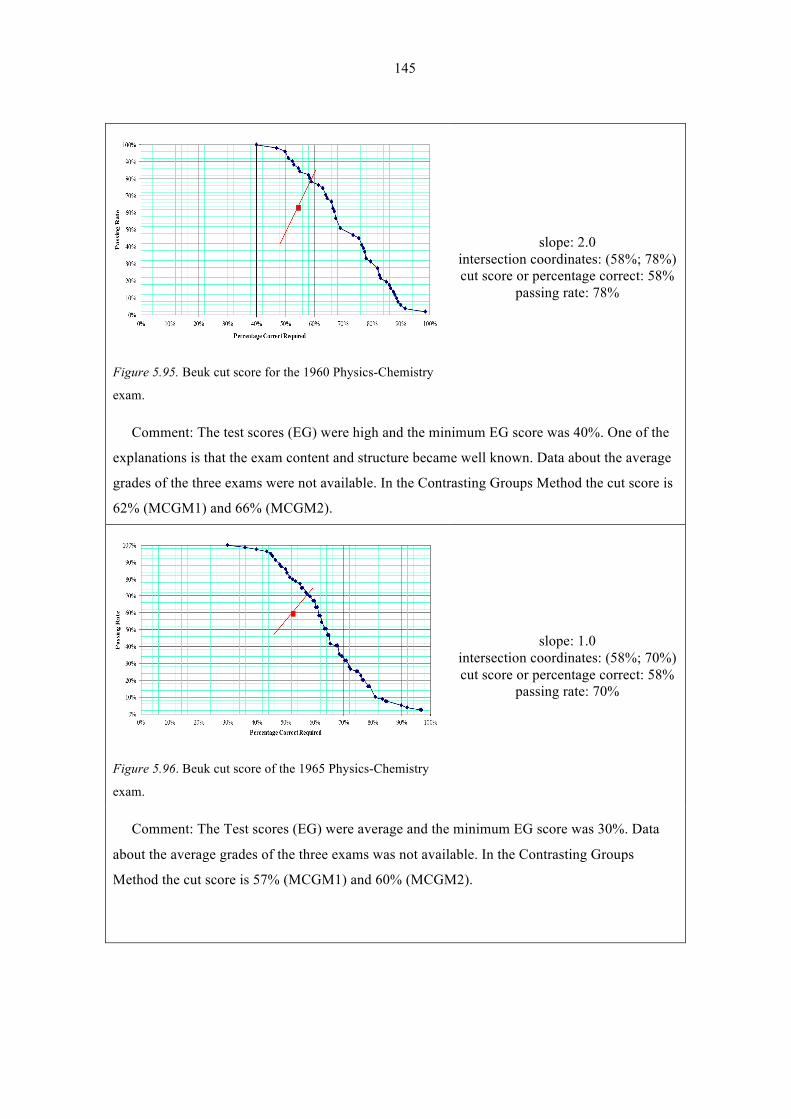
145
Figure 5.95. Beuk cut score for the 1960 Physics-Chemistry
exam.
slope: 2.0 intersection coordinates: (58%; 78%) cut score or percentage correct: 58%
passing rate: 78%
Comment: The test scores (EG) were high and the minimum EG score was 40%. One of the
explanations is that the exam content and structure became well known. Data about the average
grades of the three exams were not available. In the Contrasting Groups Method the cut score is
62% (MCGM1) and 66% (MCGM2).
Figure 5.96. Beuk cut score of the 1965 Physics-Chemistry
exam.
slope: 1.0 intersection coordinates: (58%; 70%) cut score or percentage correct: 58%
passing rate: 70%
Comment: The Test scores (EG) were average and the minimum EG score was 30%. Data
about the average grades of the three exams was not available. In the Contrasting Groups
Method the cut score is 57% (MCGM1) and 60% (MCGM2).

146
Figure 5.97. Beuk cut score for the 1969 Physics-Chemistry
exam.
slope: 0.8 intersection coordinates: (50%; 58%) cut score or percentage correct: 50%
passing rate: 58%
Comment: The test scores (EG) were average and the minimum EG score was 25%. One of
the explanations is that students with IFG scores higher than 70% were exempted from this
exam. Data about the average grades of the three exams was not available. In the Contrasting
Groups Method the cut score is 57% (MCGM1 and MCGM2).
Figure 5.98. Beuk cut score for the 1972 Physics-Chemistry
exam
slope: 0.5 intersection coordinates: (45%; 53%) cut score or percentage correct: 45%
passing rate: 53%
Comment: The test scores (EG) were low and the minimum EG score was 19%. The average
grades of the three exams plus IFG grades allowed for 53 of these 56 students to conclude the
secondary Physics-Chemistry curricula. In the Contrasting Groups Method the cut score is 41%
(MCGM1 and MCGM2).
An identical analysis was made for the exams of Group II.
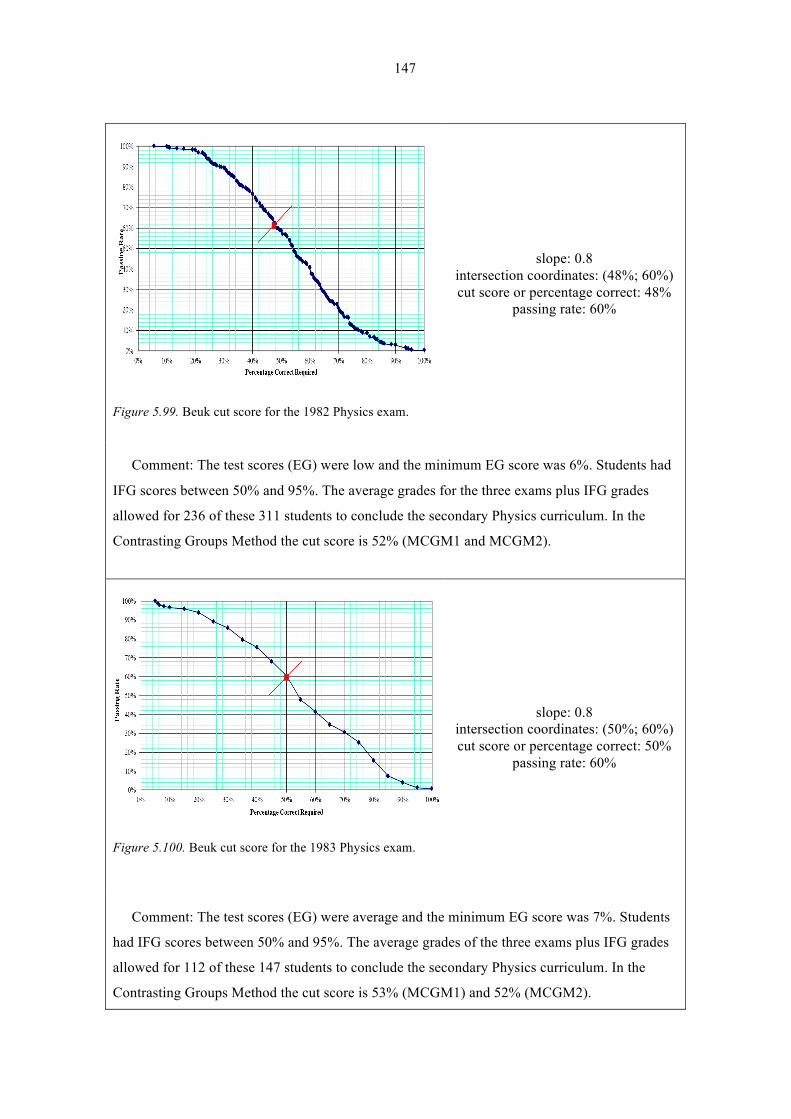
147
Figure 5.99. Beuk cut score for the 1982 Physics exam.
slope: 0.8 intersection coordinates: (48%; 60%) cut score or percentage correct: 48%
passing rate: 60%
Comment: The test scores (EG) were low and the minimum EG score was 6%. Students had
IFG scores between 50% and 95%. The average grades for the three exams plus IFG grades
allowed for 236 of these 311 students to conclude the secondary Physics curriculum. In the
Contrasting Groups Method the cut score is 52% (MCGM1 and MCGM2).
Figure 5.100. Beuk cut score for the 1983 Physics exam.
slope: 0.8 intersection coordinates: (50%; 60%) cut score or percentage correct: 50%
passing rate: 60%
Comment: The test scores (EG) were average and the minimum EG score was 7%. Students
had IFG scores between 50% and 95%. The average grades of the three exams plus IFG grades
allowed for 112 of these 147 students to conclude the secondary Physics curriculum. In the
Contrasting Groups Method the cut score is 53% (MCGM1) and 52% (MCGM2).

148
Figure 5.101. Beuk cut score for the 1984 Physics exam.
slope: 0.8 intersection coordinates: (48%; 58%) cut score or percentage correct: 48%
passing rate: 58%
Comment: The test scores (EG) were low and the minimum EG score was 15%. Students
had IFG scores between 50% and 100 %. The average grades of the three exams plus IFG
grades allowed for 100 of these 129 students to conclude the secondary Physics curriculum. In
the Contrasting Groups Method the cut score is 50% (MCGM1) and 48% (MCGM2).
Figure 5.102. Beuk cut score for the 1982 Chemistry exam.
slope: 0.5 intersection coordinates: (50%; 60%) cut score or percentage correct: 50%
passing rate: 60%
Comment: The test scores (EG) were average and the minimum EG score was 2%. Students
had IFG scores between 50% and 100 %. The average grades of the exam plus IFG grades
allowed for 204 of these 325 students to conclude the secondary Chemistry curriculum. In the
Contrasting Groups Method the cut score is 50% for both the MCGM1 and MCGM2 methods.
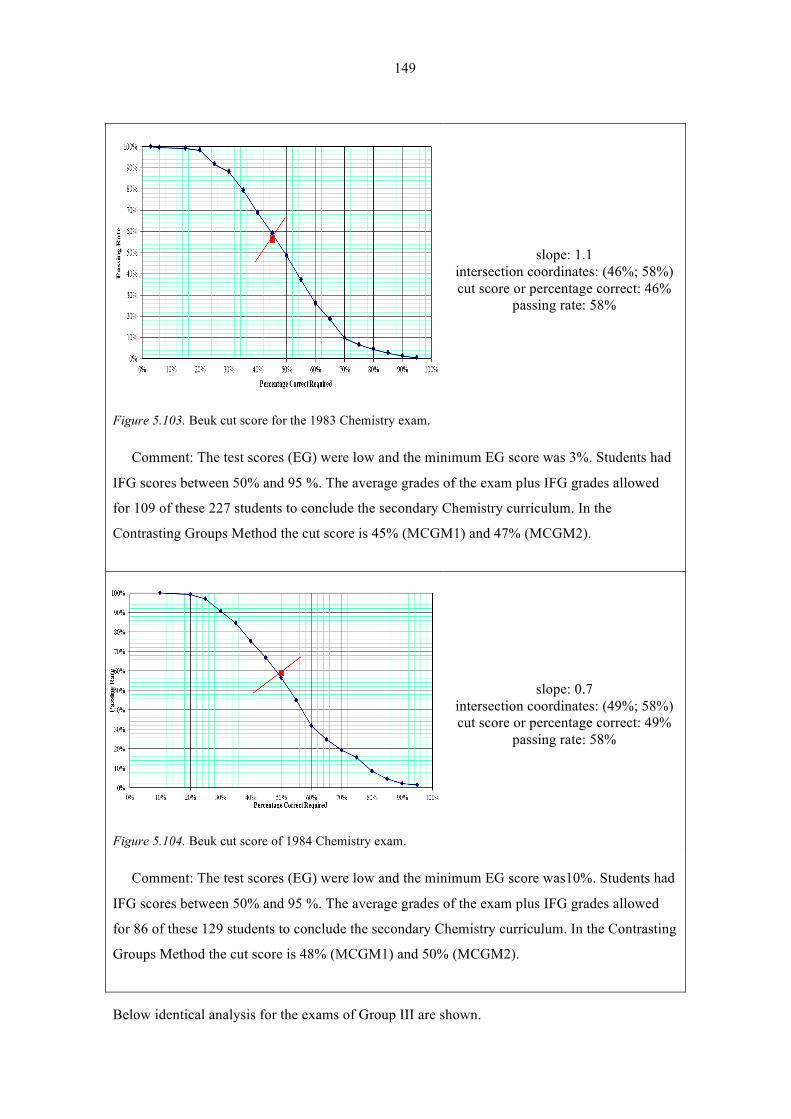
149
Figure 5.103. Beuk cut score for the 1983 Chemistry exam.
slope: 1.1 intersection coordinates: (46%; 58%) cut score or percentage correct: 46%
passing rate: 58%
Comment: The test scores (EG) were low and the minimum EG score was 3%. Students had
IFG scores between 50% and 95 %. The average grades of the exam plus IFG grades allowed
for 109 of these 227 students to conclude the secondary Chemistry curriculum. In the
Contrasting Groups Method the cut score is 45% (MCGM1) and 47% (MCGM2).
Figure 5.104. Beuk cut score of 1984 Chemistry exam.
slope: 0.7 intersection coordinates: (49%; 58%) cut score or percentage correct: 49%
passing rate: 58%
Comment: The test scores (EG) were low and the minimum EG score was10%. Students had
IFG scores between 50% and 95 %. The average grades of the exam plus IFG grades allowed
for 86 of these 129 students to conclude the secondary Chemistry curriculum. In the Contrasting
Groups Method the cut score is 48% (MCGM1) and 50% (MCGM2).
Below identical analysis for the exams of Group III are shown.
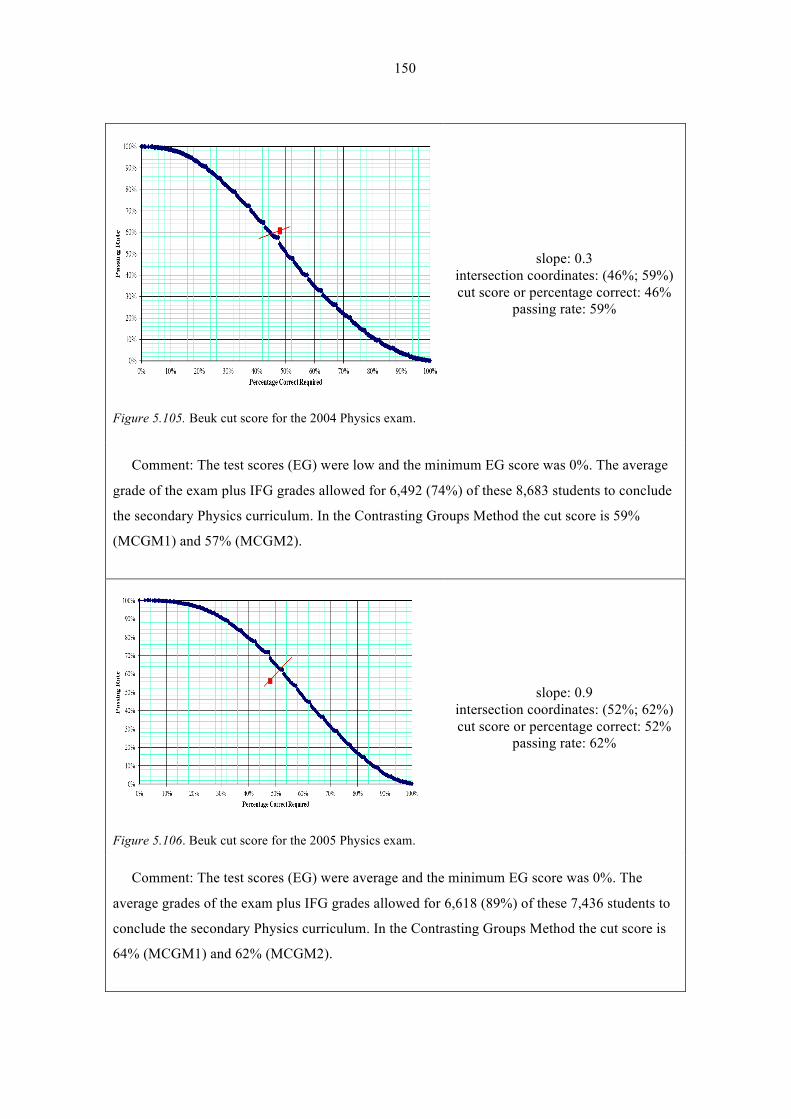
150
Figure 5.105. Beuk cut score for the 2004 Physics exam.
slope: 0.3 intersection coordinates: (46%; 59%) cut score or percentage correct: 46%
passing rate: 59%
Comment: The test scores (EG) were low and the minimum EG score was 0%. The average
grade of the exam plus IFG grades allowed for 6,492 (74%) of these 8,683 students to conclude
the secondary Physics curriculum. In the Contrasting Groups Method the cut score is 59%
(MCGM1) and 57% (MCGM2).
Figure 5.106. Beuk cut score for the 2005 Physics exam.
slope: 0.9 intersection coordinates: (52%; 62%) cut score or percentage correct: 52%
passing rate: 62%
Comment: The test scores (EG) were average and the minimum EG score was 0%. The
average grades of the exam plus IFG grades allowed for 6,618 (89%) of these 7,436 students to
conclude the secondary Physics curriculum. In the Contrasting Groups Method the cut score is
64% (MCGM1) and 62% (MCGM2).
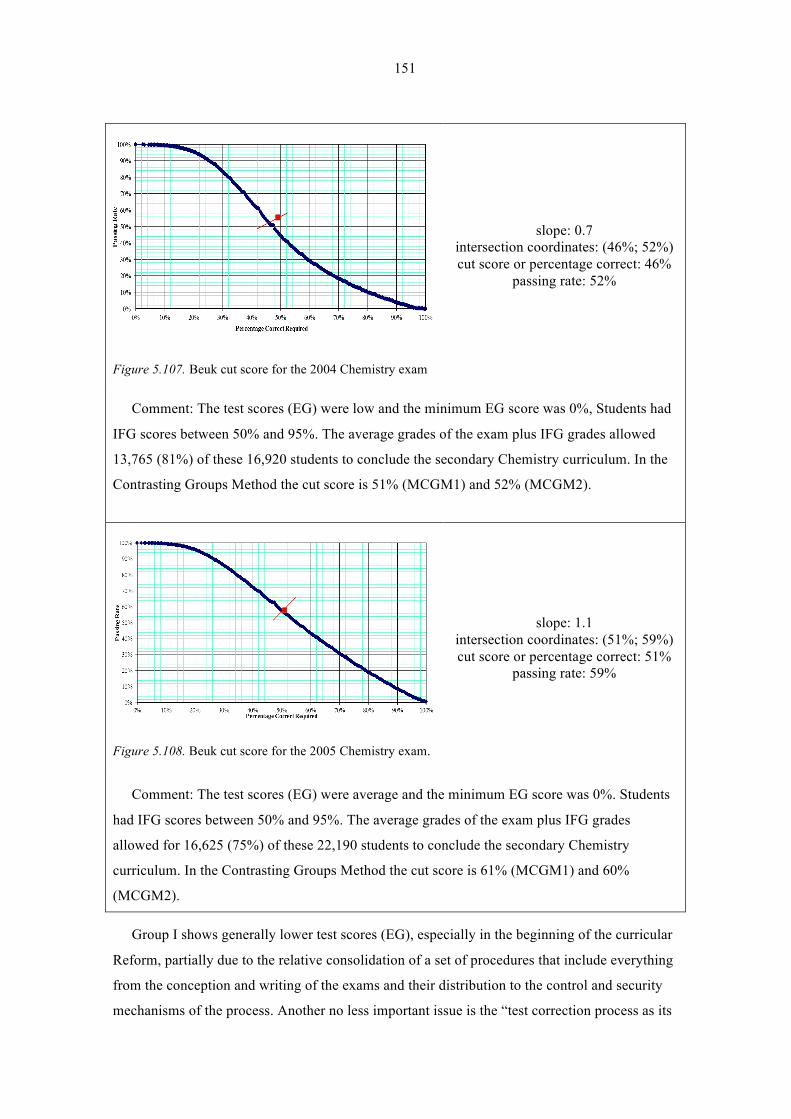
151
Figure 5.107. Beuk cut score for the 2004 Chemistry exam
slope: 0.7 intersection coordinates: (46%; 52%) cut score or percentage correct: 46%
passing rate: 52%
Comment: The test scores (EG) were low and the minimum EG score was 0%, Students had
IFG scores between 50% and 95%. The average grades of the exam plus IFG grades allowed
13,765 (81%) of these 16,920 students to conclude the secondary Chemistry curriculum. In the
Contrasting Groups Method the cut score is 51% (MCGM1) and 52% (MCGM2).
Figure 5.108. Beuk cut score for the 2005 Chemistry exam.
slope: 1.1 intersection coordinates: (51%; 59%) cut score or percentage correct: 51%
passing rate: 59%
Comment: The test scores (EG) were average and the minimum EG score was 0%. Students
had IFG scores between 50% and 95%. The average grades of the exam plus IFG grades
allowed for 16,625 (75%) of these 22,190 students to conclude the secondary Chemistry
curriculum. In the Contrasting Groups Method the cut score is 61% (MCGM1) and 60%
(MCGM2).
Group I shows generally lower test scores (EG), especially in the beginning of the curricular
Reform, partially due to the relative consolidation of a set of procedures that include everything
from the conception and writing of the exams and their distribution to the control and security
mechanisms of the process. Another no less important issue is the “test correction process as its
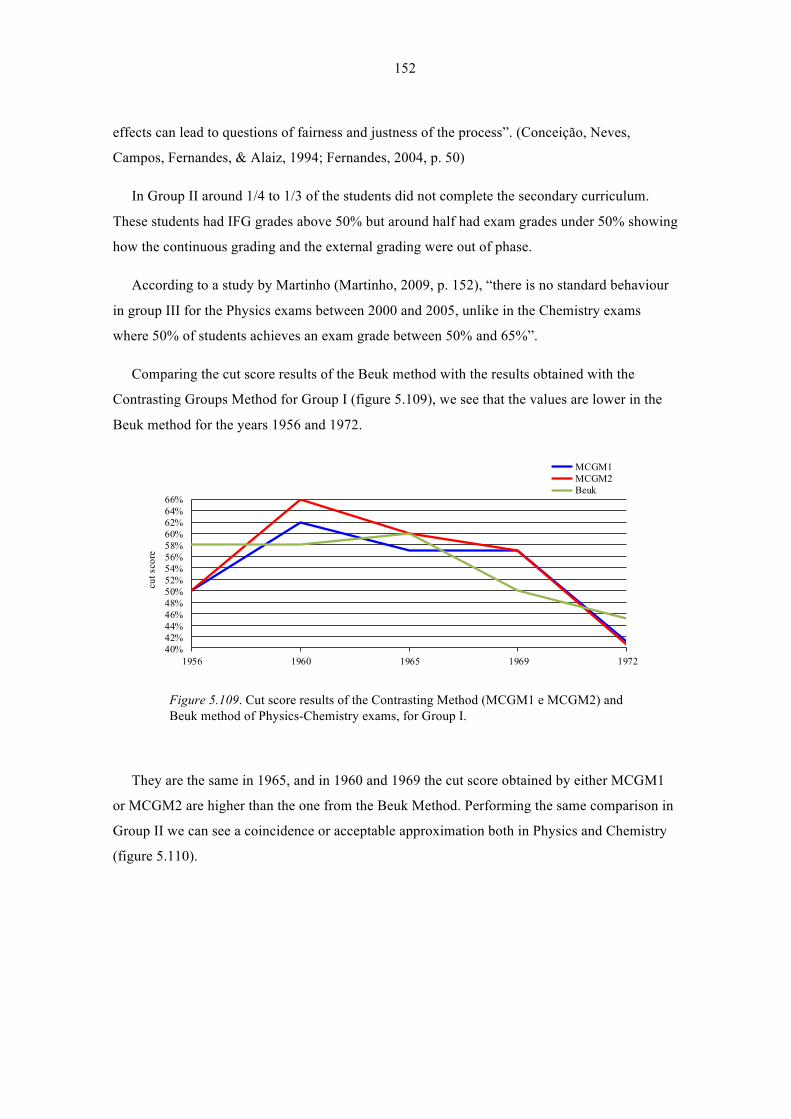
152
effects can lead to questions of fairness and justness of the process”. (Conceição, Neves,
Campos, Fernandes, & Alaiz, 1994; Fernandes, 2004, p. 50)
In Group II around 1/4 to 1/3 of the students did not complete the secondary curriculum.
These students had IFG grades above 50% but around half had exam grades under 50% showing
how the continuous grading and the external grading were out of phase.
According to a study by Martinho (Martinho, 2009, p. 152), “there is no standard behaviour
in group III for the Physics exams between 2000 and 2005, unlike in the Chemistry exams
where 50% of students achieves an exam grade between 50% and 65%”.
Comparing the cut score results of the Beuk method with the results obtained with the
Contrasting Groups Method for Group I (figure 5.109), we see that the values are lower in the
Beuk method for the years 1956 and 1972.
40%42%44%46%48%50%52%54%56%58%60%62%64%66%
1956 1960 1965 1969 1972
cut s
core
MCGM1MCGM2Beuk
Figure 5.109. Cut score results of the Contrasting Method (MCGM1 e MCGM2) and Beuk method of Physics-Chemistry exams, for Group I.
They are the same in 1965, and in 1960 and 1969 the cut score obtained by either MCGM1
or MCGM2 are higher than the one from the Beuk Method. Performing the same comparison in
Group II we can see a coincidence or acceptable approximation both in Physics and Chemistry
(figure 5.110).

153
40%42%44%46%48%50%52%54%56%58%60%62%64%66%
1982 1983 1984 2004 2005
cut s
core
MCGM1MCGM2Beuk
Figure 5.110. Cut score results of the Contrasting Method (MCGM1 e MCGM2) and Beuk method of Physics exams, for Group II and Group III.
In Group III (figure 5.110 and figure 5.111) there is a considerable difference in 2004 (about
10%) between the cut scores obtained by both methods, leading to the conclusion that the
sample size and the distribution of ratings by Grade Reference cannot be ignored.
44%
46%
48%
50%
52%
54%
56%
58%
60%
62%
1982 1983 1984 2004 2005
cut s
core
MCGM1MCGM2Beuk
Figure 5.111. Cut score results of the Contrasting Method (MCGM1 e MCGM2) and Beuk method of Chemistry exams, for Group II and Group III.
One of this method’s limitations is due to the fact that the computation work to obtain cut
scores is approximate or visually estimated, introducing a source of potential error. As Cizeck
(Beuk, 1984) noted the Beuk method can be described as a “compromise method” between
relative and absolute performance standards.
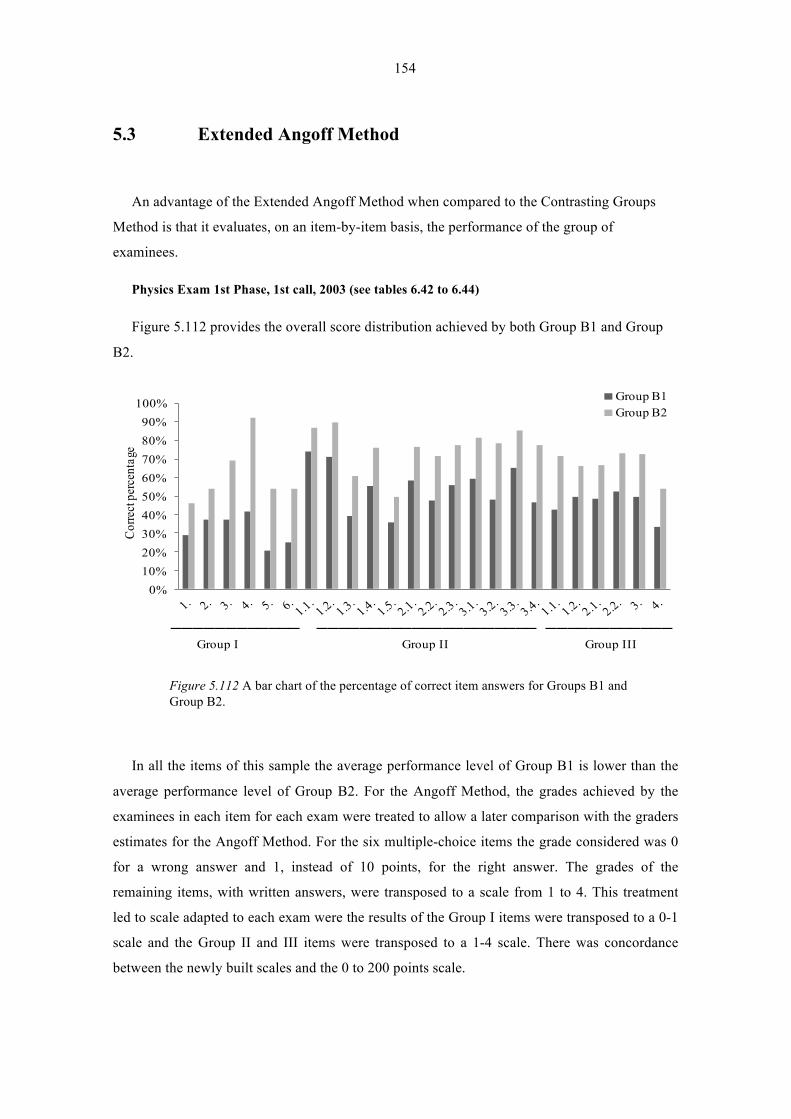
154
5.3 Extended Angoff Method
An advantage of the Extended Angoff Method when compared to the Contrasting Groups
Method is that it evaluates, on an item-by-item basis, the performance of the group of
examinees.
Physics Exam 1st Phase, 1st call, 2003 (see tables 6.42 to 6.44)
Figure 5.112 provides the overall score distribution achieved by both Group B1 and Group
B2.
0%10%20%30%40%50%60%70%80%90%
100%
Corre
ct pe
rcen
tage
Group B1Group B2
──────────── ───────────────────── ────────────Group I Group II Group III
Figure 5.112 A bar chart of the percentage of correct item answers for Groups B1 and Group B2.
In all the items of this sample the average performance level of Group B1 is lower than the
average performance level of Group B2. For the Angoff Method, the grades achieved by the
examinees in each item for each exam were treated to allow a later comparison with the graders
estimates for the Angoff Method. For the six multiple-choice items the grade considered was 0
for a wrong answer and 1, instead of 10 points, for the right answer. The grades of the
remaining items, with written answers, were transposed to a scale from 1 to 4. This treatment
led to scale adapted to each exam were the results of the Group I items were transposed to a 0-1
scale and the Group II and III items were transposed to a 1-4 scale. There was concordance
between the newly built scales and the 0 to 200 points scale.
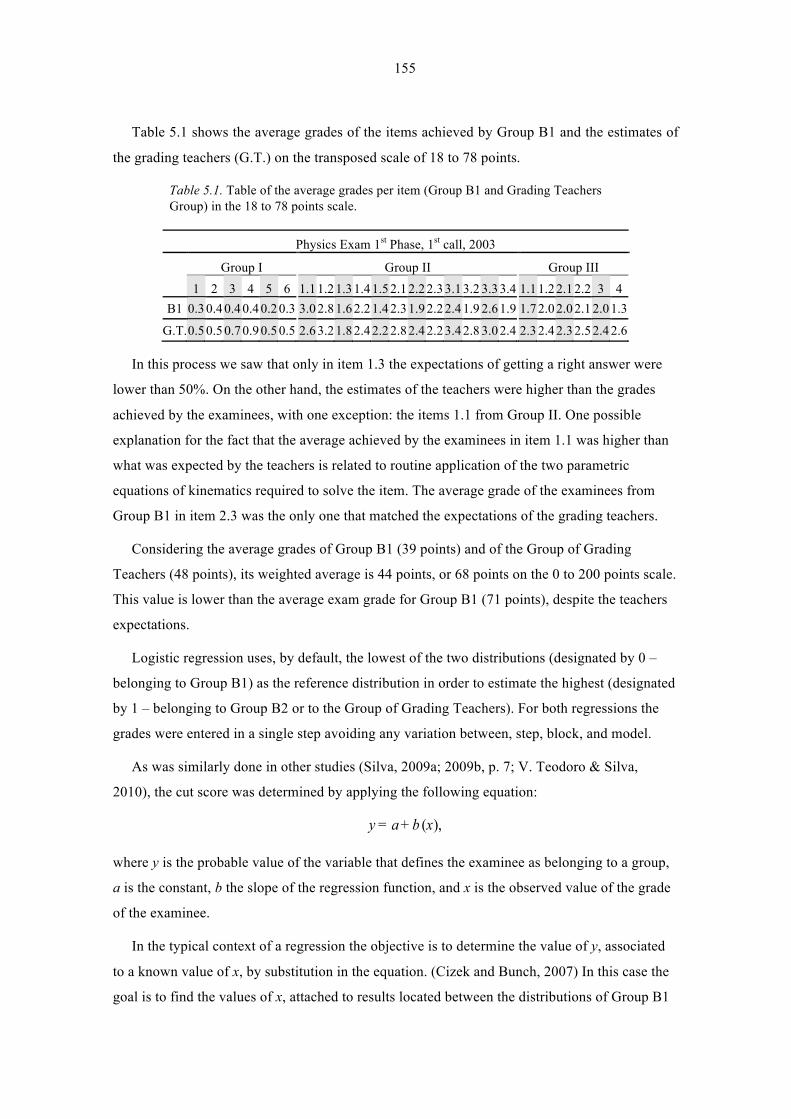
155
Table 5.1 shows the average grades of the items achieved by Group B1 and the estimates of
the grading teachers (G.T.) on the transposed scale of 18 to 78 points.
Table 5.1. Table of the average grades per item (Group B1 and Grading Teachers Group) in the 18 to 78 points scale.
Physics Exam 1st Phase, 1st call, 2003
Group I Group II Group III
1 2 3 4 5 6 1.1 1.2 1.3 1.4 1.5 2.1 2.2 2.3 3.1 3.2 3.3 3.4 1.1 1.2 2.1 2.2 3 4
B1 0.3 0.4 0.4 0.4 0.2 0.3 3.0 2.8 1.6 2.2 1.4 2.3 1.9 2.2 2.4 1.9 2.6 1.9 1.7 2.0 2.0 2.1 2.0 1.3
G.T. 0.5 0.5 0.7 0.9 0.5 0.5 2.6 3.2 1.8 2.4 2.2 2.8 2.4 2.2 3.4 2.8 3.0 2.4 2.3 2.4 2.3 2.5 2.4 2.6
In this process we saw that only in item 1.3 the expectations of getting a right answer were
lower than 50%. On the other hand, the estimates of the teachers were higher than the grades
achieved by the examinees, with one exception: the items 1.1 from Group II. One possible
explanation for the fact that the average achieved by the examinees in item 1.1 was higher than
what was expected by the teachers is related to routine application of the two parametric
equations of kinematics required to solve the item. The average grade of the examinees from
Group B1 in item 2.3 was the only one that matched the expectations of the grading teachers.
Considering the average grades of Group B1 (39 points) and of the Group of Grading
Teachers (48 points), its weighted average is 44 points, or 68 points on the 0 to 200 points scale.
This value is lower than the average exam grade for Group B1 (71 points), despite the teachers
expectations.
Logistic regression uses, by default, the lowest of the two distributions (designated by 0 –
belonging to Group B1) as the reference distribution in order to estimate the highest (designated
by 1 – belonging to Group B2 or to the Group of Grading Teachers). For both regressions the
grades were entered in a single step avoiding any variation between, step, block, and model.
As was similarly done in other studies (Silva, 2009a; 2009b, p. 7; V. Teodoro & Silva,
2010), the cut score was determined by applying the following equation:
( ),y = a+b x
where y is the probable value of the variable that defines the examinee as belonging to a group,
a is the constant, b the slope of the regression function, and x is the observed value of the grade
of the examinee.
In the typical context of a regression the objective is to determine the value of y, associated
to a known value of x, by substitution in the equation. (Cizek and Bunch, 2007) In this case the
goal is to find the values of x, attached to results located between the distributions of Group B1
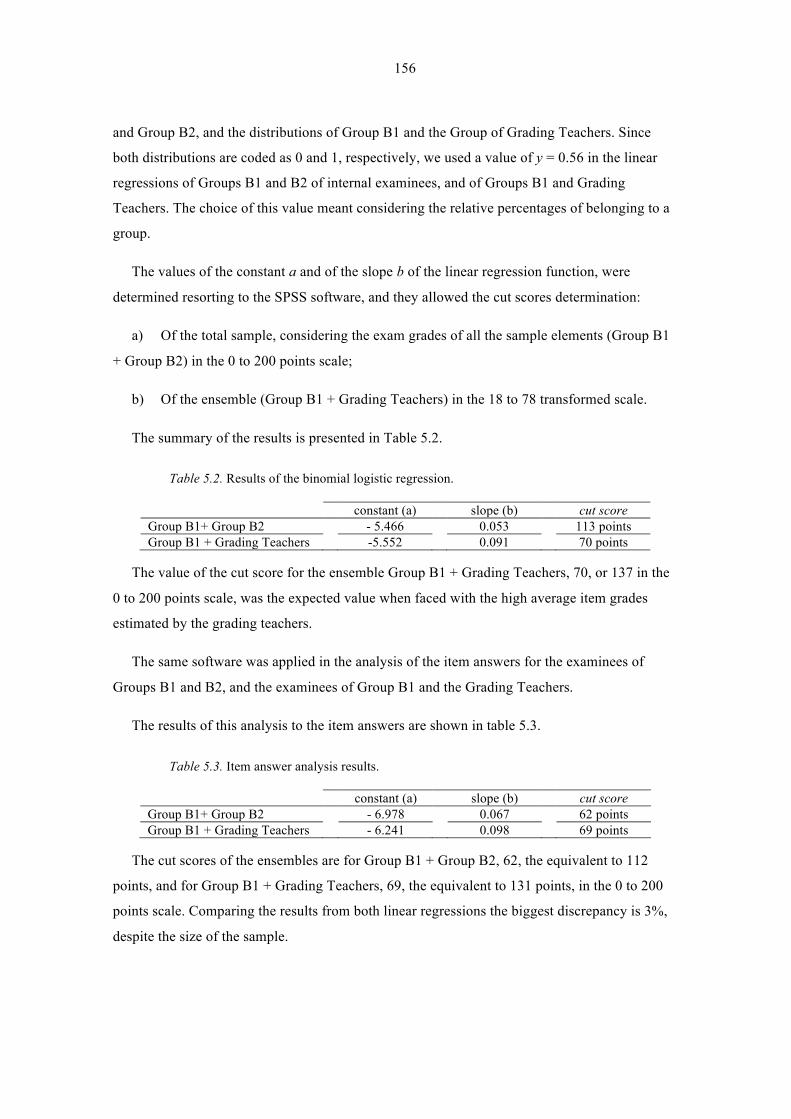
156
and Group B2, and the distributions of Group B1 and the Group of Grading Teachers. Since
both distributions are coded as 0 and 1, respectively, we used a value of y = 0.56 in the linear
regressions of Groups B1 and B2 of internal examinees, and of Groups B1 and Grading
Teachers. The choice of this value meant considering the relative percentages of belonging to a
group.
The values of the constant a and of the slope b of the linear regression function, were
determined resorting to the SPSS software, and they allowed the cut scores determination:
a) Of the total sample, considering the exam grades of all the sample elements (Group B1
+ Group B2) in the 0 to 200 points scale;
b) Of the ensemble (Group B1 + Grading Teachers) in the 18 to 78 transformed scale.
The summary of the results is presented in Table 5.2.
Table 5.2. Results of the binomial logistic regression.
constant (a) slope (b) cut score Group B1+ Group B2 - 5.466 0.053 113 points Group B1 + Grading Teachers -5.552 0.091 70 points
The value of the cut score for the ensemble Group B1 + Grading Teachers, 70, or 137 in the
0 to 200 points scale, was the expected value when faced with the high average item grades
estimated by the grading teachers.
The same software was applied in the analysis of the item answers for the examinees of
Groups B1 and B2, and the examinees of Group B1 and the Grading Teachers.
The results of this analysis to the item answers are shown in table 5.3.
Table 5.3. Item answer analysis results.
constant (a) slope (b) cut score Group B1+ Group B2 - 6.978 0.067 62 points Group B1 + Grading Teachers - 6.241 0.098 69 points
The cut scores of the ensembles are for Group B1 + Group B2, 62, the equivalent to 112
points, and for Group B1 + Grading Teachers, 69, the equivalent to 131 points, in the 0 to 200
points scale. Comparing the results from both linear regressions the biggest discrepancy is 3%,
despite the size of the sample.
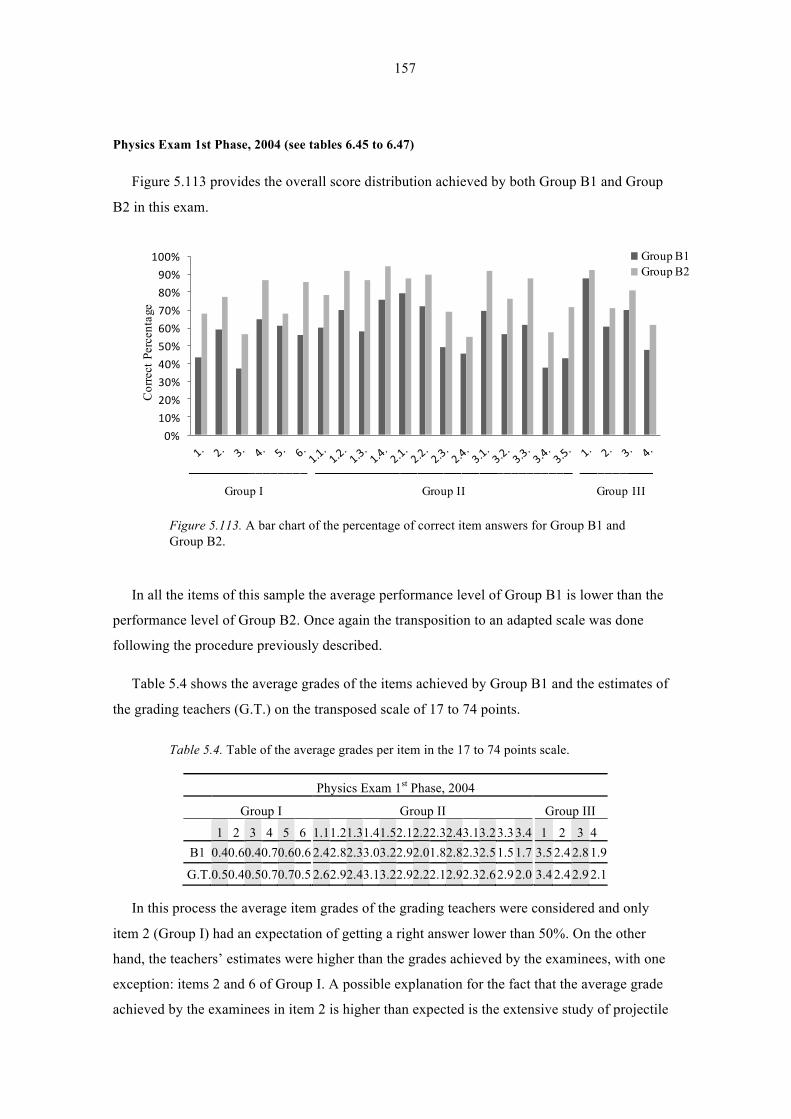
157
Physics Exam 1st Phase, 2004 (see tables 6.45 to 6.47)
Figure 5.113 provides the overall score distribution achieved by both Group B1 and Group
B2 in this exam.
0%10%20%30%40%50%60%70%80%90%
100%
Cor
rect
Per
cent
age
Group B1Group B2
─────────────── ─────────────────────────────── ─────────Group I Group II Group III
Figure 5.113. A bar chart of the percentage of correct item answers for Group B1 and Group B2.
In all the items of this sample the average performance level of Group B1 is lower than the
performance level of Group B2. Once again the transposition to an adapted scale was done
following the procedure previously described.
Table 5.4 shows the average grades of the items achieved by Group B1 and the estimates of
the grading teachers (G.T.) on the transposed scale of 17 to 74 points.
Table 5.4. Table of the average grades per item in the 17 to 74 points scale.
Physics Exam 1st Phase, 2004
Group I Group II Group III 1 2 3 4 5 6 1.1 1.2 1.3 1.4 1.5 2.1 2.2 2.3 2.4 3.1 3.2 3.3 3.4 1 2 3 4
B1 0.4 0.6 0.4 0.7 0.6 0.6 2.4 2.8 2.3 3.0 3.2 2.9 2.0 1.8 2.8 2.3 2.5 1.5 1.7 3.5 2.4 2.8 1.9
G.T. 0.5 0.4 0.5 0.7 0.7 0.5 2.6 2.9 2.4 3.1 3.2 2.9 2.2 2.1 2.9 2.3 2.6 2.9 2.0 3.4 2.4 2.9 2.1
In this process the average item grades of the grading teachers were considered and only
item 2 (Group I) had an expectation of getting a right answer lower than 50%. On the other
hand, the teachers’ estimates were higher than the grades achieved by the examinees, with one
exception: items 2 and 6 of Group I. A possible explanation for the fact that the average grade
achieved by the examinees in item 2 is higher than expected is the extensive study of projectile
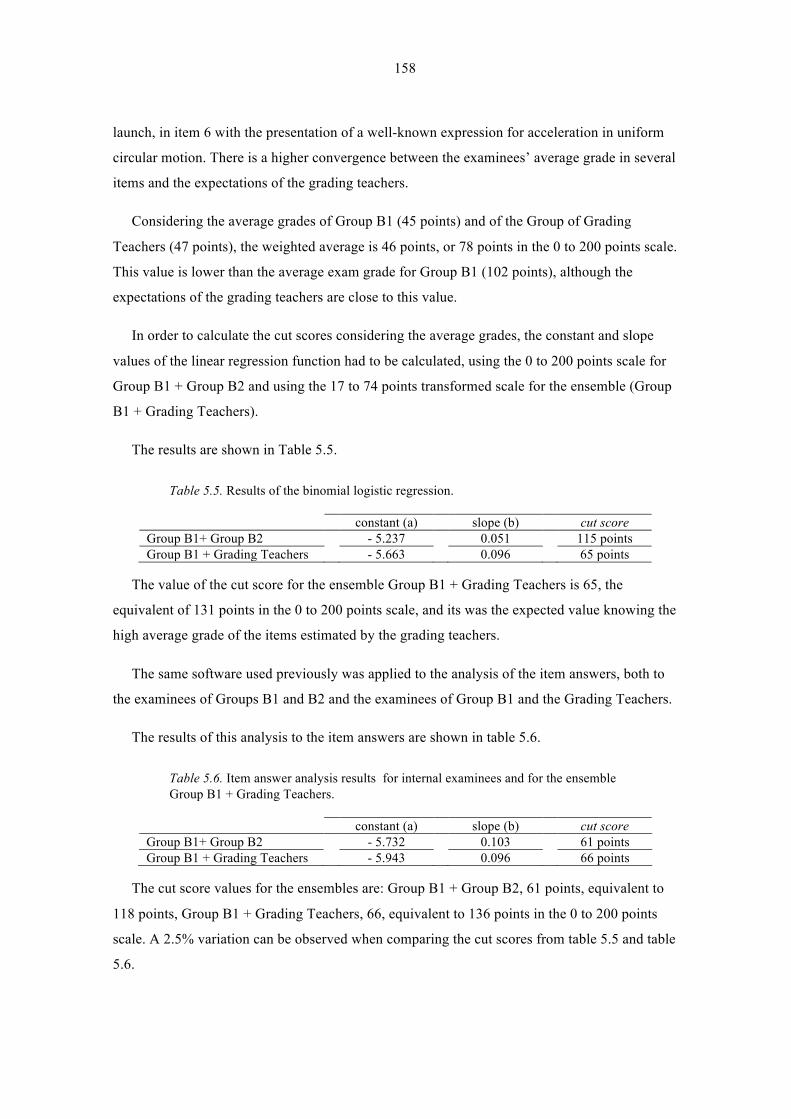
158
launch, in item 6 with the presentation of a well-known expression for acceleration in uniform
circular motion. There is a higher convergence between the examinees’ average grade in several
items and the expectations of the grading teachers.
Considering the average grades of Group B1 (45 points) and of the Group of Grading
Teachers (47 points), the weighted average is 46 points, or 78 points in the 0 to 200 points scale.
This value is lower than the average exam grade for Group B1 (102 points), although the
expectations of the grading teachers are close to this value.
In order to calculate the cut scores considering the average grades, the constant and slope
values of the linear regression function had to be calculated, using the 0 to 200 points scale for
Group B1 + Group B2 and using the 17 to 74 points transformed scale for the ensemble (Group
B1 + Grading Teachers).
The results are shown in Table 5.5.
Table 5.5. Results of the binomial logistic regression.
constant (a) slope (b) cut score Group B1+ Group B2 - 5.237 0.051 115 points Group B1 + Grading Teachers - 5.663 0.096 65 points
The value of the cut score for the ensemble Group B1 + Grading Teachers is 65, the
equivalent of 131 points in the 0 to 200 points scale, and its was the expected value knowing the
high average grade of the items estimated by the grading teachers.
The same software used previously was applied to the analysis of the item answers, both to
the examinees of Groups B1 and B2 and the examinees of Group B1 and the Grading Teachers.
The results of this analysis to the item answers are shown in table 5.6.
Table 5.6. Item answer analysis results for internal examinees and for the ensemble Group B1 + Grading Teachers.
constant (a) slope (b) cut score Group B1+ Group B2 - 5.732 0.103 61 points Group B1 + Grading Teachers - 5.943 0.096 66 points
The cut score values for the ensembles are: Group B1 + Group B2, 61 points, equivalent to
118 points, Group B1 + Grading Teachers, 66, equivalent to 136 points in the 0 to 200 points
scale. A 2.5% variation can be observed when comparing the cut scores from table 5.5 and table
5.6.
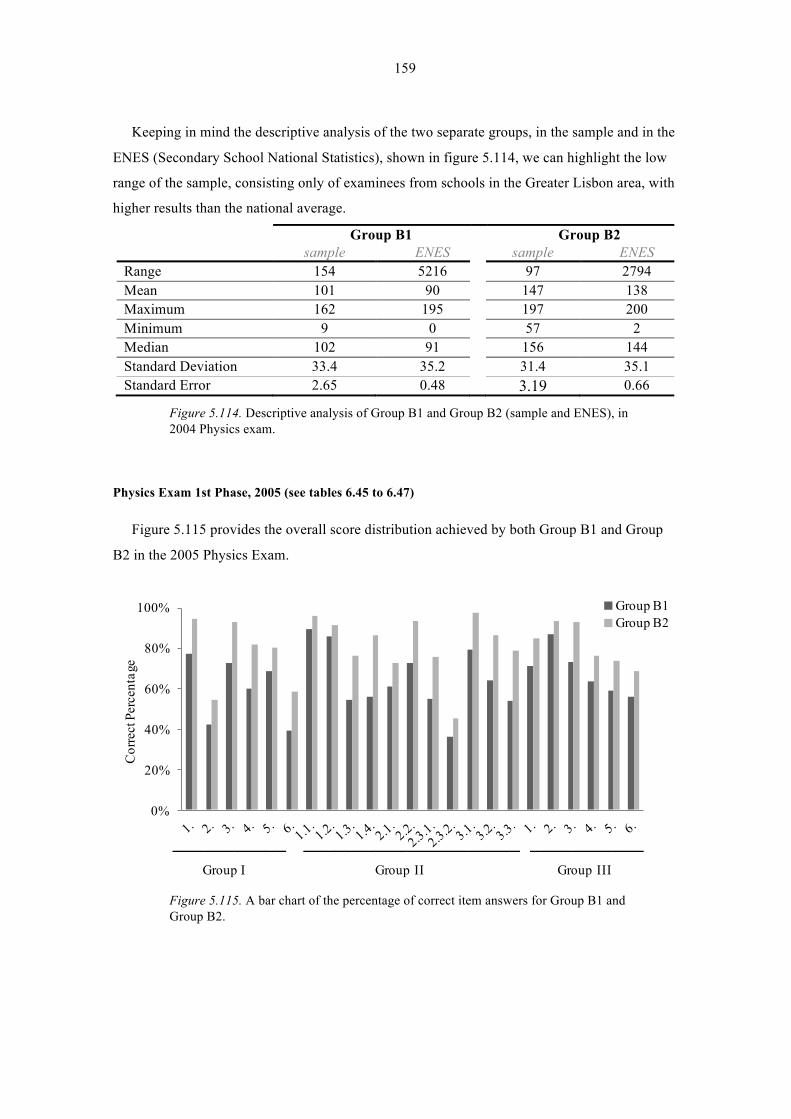
159
Keeping in mind the descriptive analysis of the two separate groups, in the sample and in the
ENES (Secondary School National Statistics), shown in figure 5.114, we can highlight the low
range of the sample, consisting only of examinees from schools in the Greater Lisbon area, with
higher results than the national average.
Group B1 Group B2 sample ENES sample ENES
Range 154 5216 97 2794 Mean 101 90 147 138 Maximum 162 195 197 200 Minimum 9 0 57 2 Median 102 91 156 144 Standard Deviation 33.4 35.2 31.4 35.1 Standard Error 2.65 0.48 3.19 0.66
Figure 5.114. Descriptive analysis of Group B1 and Group B2 (sample and ENES), in 2004 Physics exam.
Physics Exam 1st Phase, 2005 (see tables 6.45 to 6.47)
Figure 5.115 provides the overall score distribution achieved by both Group B1 and Group
B2 in the 2005 Physics Exam.
0%
20%
40%
60%
80%
100%
Cor
rect
Per
cent
age
Group B1Group B2
─────────── ───────────────────── ───────────Group I Group II Group III
Figure 5.115. A bar chart of the percentage of correct item answers for Group B1 and Group B2.
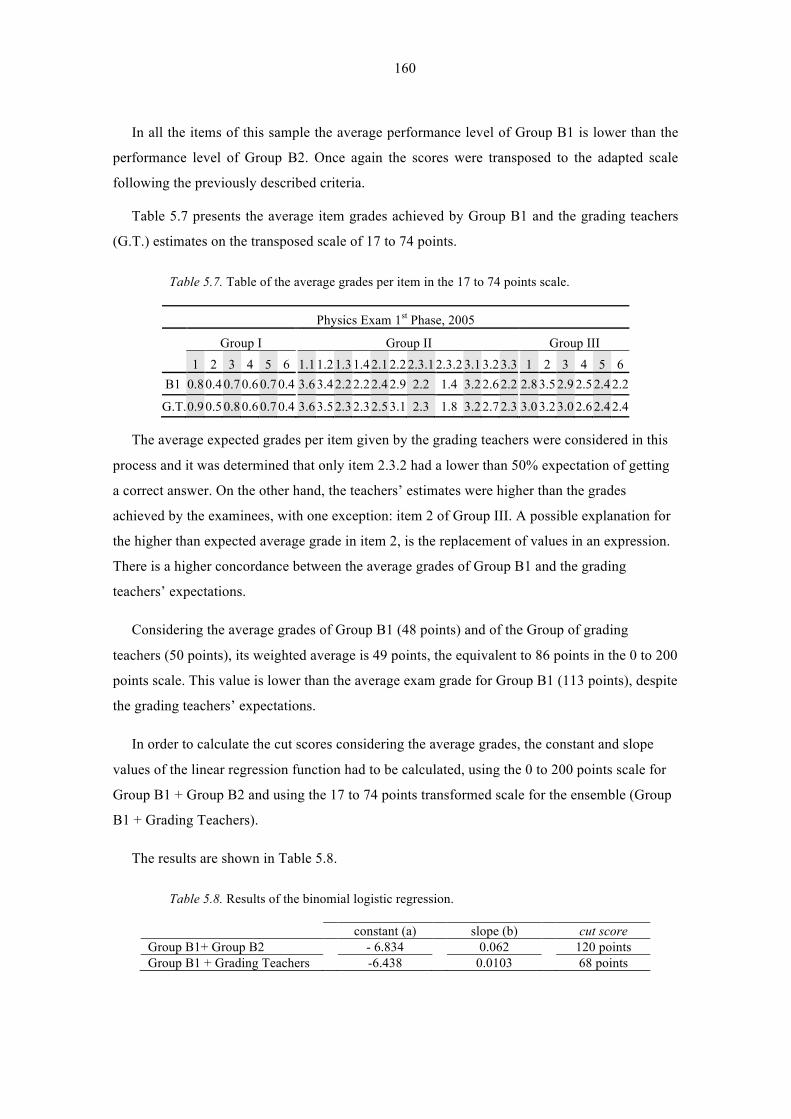
160
In all the items of this sample the average performance level of Group B1 is lower than the
performance level of Group B2. Once again the scores were transposed to the adapted scale
following the previously described criteria.
Table 5.7 presents the average item grades achieved by Group B1 and the grading teachers
(G.T.) estimates on the transposed scale of 17 to 74 points.
Table 5.7. Table of the average grades per item in the 17 to 74 points scale.
Physics Exam 1st Phase, 2005
Group I Group II Group III 1 2 3 4 5 6 1.1 1.2 1.3 1.4 2.1 2.2 2.3.1 2.3.2 3.1 3.2 3.3 1 2 3 4 5 6
B1 0.8 0.4 0.7 0.6 0.7 0.4 3.6 3.4 2.2 2.2 2.4 2.9 2.2 1.4 3.2 2.6 2.2 2.8 3.5 2.9 2.5 2.4 2.2
G.T. 0.9 0.5 0.8 0.6 0.7 0.4 3.6 3.5 2.3 2.3 2.5 3.1 2.3 1.8 3.2 2.7 2.3 3.0 3.2 3.0 2.6 2.4 2.4
The average expected grades per item given by the grading teachers were considered in this
process and it was determined that only item 2.3.2 had a lower than 50% expectation of getting
a correct answer. On the other hand, the teachers’ estimates were higher than the grades
achieved by the examinees, with one exception: item 2 of Group III. A possible explanation for
the higher than expected average grade in item 2, is the replacement of values in an expression.
There is a higher concordance between the average grades of Group B1 and the grading
teachers’ expectations.
Considering the average grades of Group B1 (48 points) and of the Group of grading
teachers (50 points), its weighted average is 49 points, the equivalent to 86 points in the 0 to 200
points scale. This value is lower than the average exam grade for Group B1 (113 points), despite
the grading teachers’ expectations.
In order to calculate the cut scores considering the average grades, the constant and slope
values of the linear regression function had to be calculated, using the 0 to 200 points scale for
Group B1 + Group B2 and using the 17 to 74 points transformed scale for the ensemble (Group
B1 + Grading Teachers).
The results are shown in Table 5.8.
Table 5.8. Results of the binomial logistic regression.
constant (a) slope (b) cut score Group B1+ Group B2 - 6.834 0.062 120 points Group B1 + Grading Teachers -6.438 0.0103 68 points

161
The value of the cut score for the ensemble Group B1 + Grading Teachers, 68 points,
equivalent to 131 points in the 0 to 200 points scale, was the expected value due to the high
average item grades estimated by the grading teachers.
The same software used previously was applied to the analysis of the item answers, both to
the examinees of Groups B1 and B2 and the examinees of Group B1 and the Grading Teachers.
The results of this analysis to the item answers are shown in table 5.9.
Table 5.9. Item answer analysis.
constant (a) slope (b) cut score Group B1+ Group B2 - 6.758 0.113 64 points Group B1 + Grading Teachers - 8.009 0.121 70 points
The cut score values for the ensembles are: Group B1 + Group B2, 64 points, equivalent to
127 points, Group B1 + Grading Teachers, 70, equivalent to 144 points in the 0 to 200 points
scale. A variation of up to 6.5% can be observed when comparing the cut scores from the two
previous tables due to the small number of examinees.
Keeping in mind the descriptive analysis of the two separate groups, in the sample and in the
ENES, shown in figure 5.116, we can highlight the low range of the sample, with higher
average results than the national average.
Group B1 Group B2
sample ENES sample ENES
Range 93 5325 55 2640 Mean 113 101 154 145 Maximum 190 196 197 200 Minimum 31 0 91 14 Median 117 102 158 151 Standard Deviation 33.0 35.5 22.7 34.3 Standard Error 3.43 0.49 3.06 0.67
Figure 5.116. Descriptive analysis of Group B1 and Group B2 (sample and ENES), in 2005 Physics exam.
Chemistry Exam 1st Phase, 1st call, 2003 (see tables 6.51 to 6.53)
Figure 5.117 provides the overall score distribution achieved by both Group B1 and Group
B2 on the 2003 Chemistry Exam.
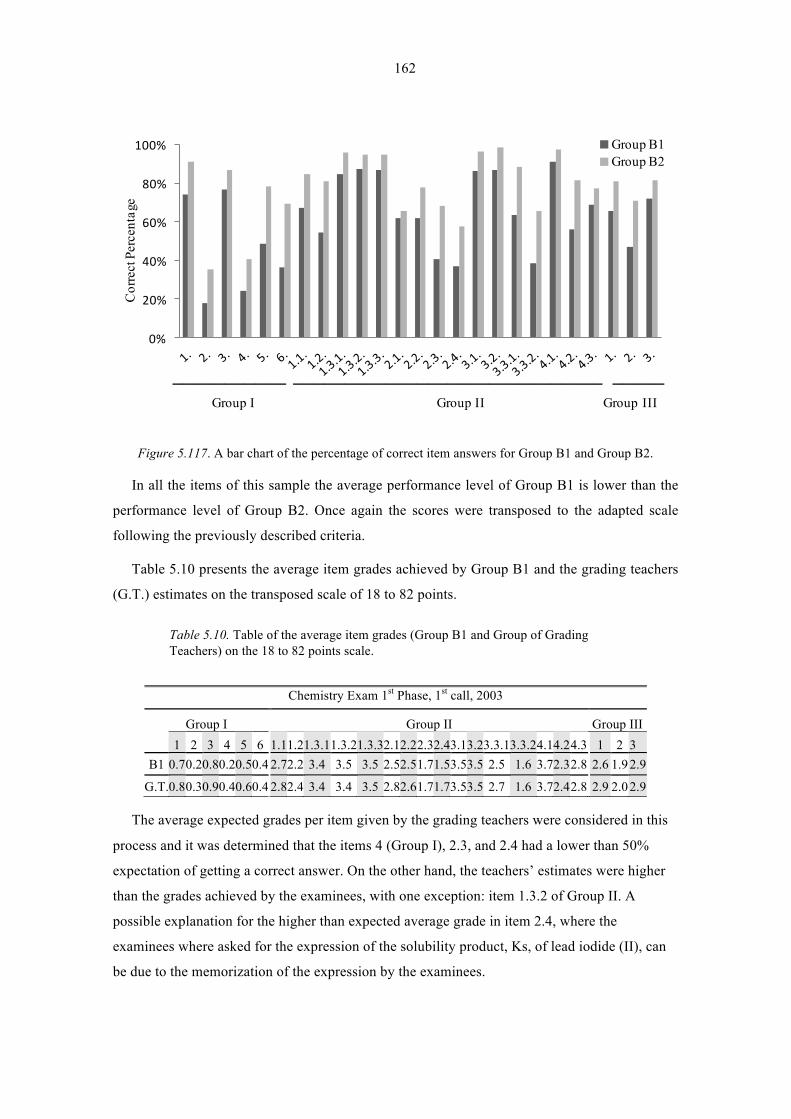
162
0%
20%
40%
60%
80%
100%C
orre
ct P
erce
ntag
e Group B1Group B2
─────────── ────────────────────────────── ─────Group I Group II Group III
Figure 5.117. A bar chart of the percentage of correct item answers for Group B1 and Group B2.
In all the items of this sample the average performance level of Group B1 is lower than the
performance level of Group B2. Once again the scores were transposed to the adapted scale
following the previously described criteria.
Table 5.10 presents the average item grades achieved by Group B1 and the grading teachers
(G.T.) estimates on the transposed scale of 18 to 82 points.
Table 5.10. Table of the average item grades (Group B1 and Group of Grading Teachers) on the 18 to 82 points scale.
The average expected grades per item given by the grading teachers were considered in this
process and it was determined that the items 4 (Group I), 2.3, and 2.4 had a lower than 50%
expectation of getting a correct answer. On the other hand, the teachers’ estimates were higher
than the grades achieved by the examinees, with one exception: item 1.3.2 of Group II. A
possible explanation for the higher than expected average grade in item 2.4, where the
examinees where asked for the expression of the solubility product, Ks, of lead iodide (II), can
be due to the memorization of the expression by the examinees.
Chemistry Exam 1st Phase, 1st call, 2003
Group I Group II Group III 1 2 3 4 5 6 1.1 1.2 1.3.1 1.3.2 1.3.3 2.1 2.2 2.3 2.4 3.1 3.2 3.3.1 3.3.2 4.1 4.2 4.3 1 2 3
B1 0.7 0.2 0.8 0.2 0.5 0.4 2.7 2.2 3.4 3.5 3.5 2.5 2.5 1.7 1.5 3.5 3.5 2.5 1.6 3.7 2.3 2.8 2.6 1.9 2.9
G.T. 0.8 0.3 0.9 0.4 0.6 0.4 2.8 2.4 3.4 3.4 3.5 2.8 2.6 1.7 1.7 3.5 3.5 2.7 1.6 3.7 2.4 2.8 2.9 2.0 2.9
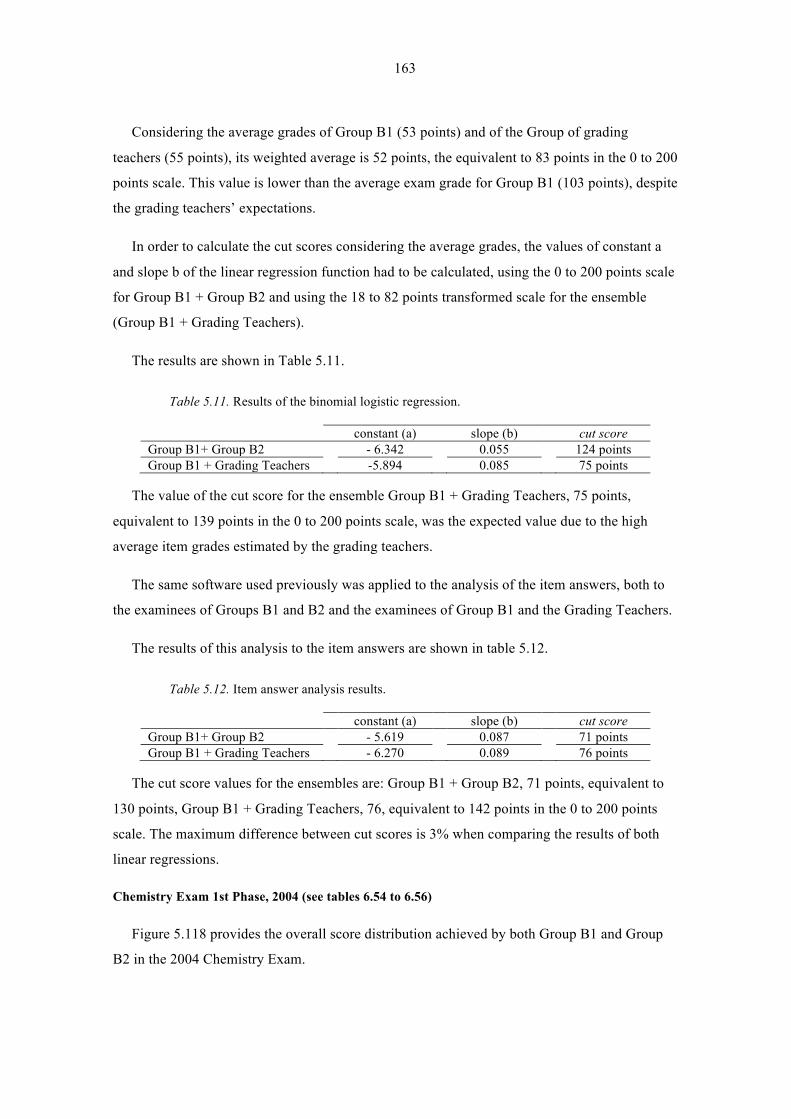
163
Considering the average grades of Group B1 (53 points) and of the Group of grading
teachers (55 points), its weighted average is 52 points, the equivalent to 83 points in the 0 to 200
points scale. This value is lower than the average exam grade for Group B1 (103 points), despite
the grading teachers’ expectations.
In order to calculate the cut scores considering the average grades, the values of constant a
and slope b of the linear regression function had to be calculated, using the 0 to 200 points scale
for Group B1 + Group B2 and using the 18 to 82 points transformed scale for the ensemble
(Group B1 + Grading Teachers).
The results are shown in Table 5.11.
Table 5.11. Results of the binomial logistic regression.
constant (a) slope (b) cut score Group B1+ Group B2 - 6.342 0.055 124 points Group B1 + Grading Teachers -5.894 0.085 75 points
The value of the cut score for the ensemble Group B1 + Grading Teachers, 75 points,
equivalent to 139 points in the 0 to 200 points scale, was the expected value due to the high
average item grades estimated by the grading teachers.
The same software used previously was applied to the analysis of the item answers, both to
the examinees of Groups B1 and B2 and the examinees of Group B1 and the Grading Teachers.
The results of this analysis to the item answers are shown in table 5.12.
Table 5.12. Item answer analysis results.
constant (a) slope (b) cut score Group B1+ Group B2 - 5.619 0.087 71 points Group B1 + Grading Teachers - 6.270 0.089 76 points
The cut score values for the ensembles are: Group B1 + Group B2, 71 points, equivalent to
130 points, Group B1 + Grading Teachers, 76, equivalent to 142 points in the 0 to 200 points
scale. The maximum difference between cut scores is 3% when comparing the results of both
linear regressions.
Chemistry Exam 1st Phase, 2004 (see tables 6.54 to 6.56)
Figure 5.118 provides the overall score distribution achieved by both Group B1 and Group
B2 in the 2004 Chemistry Exam.
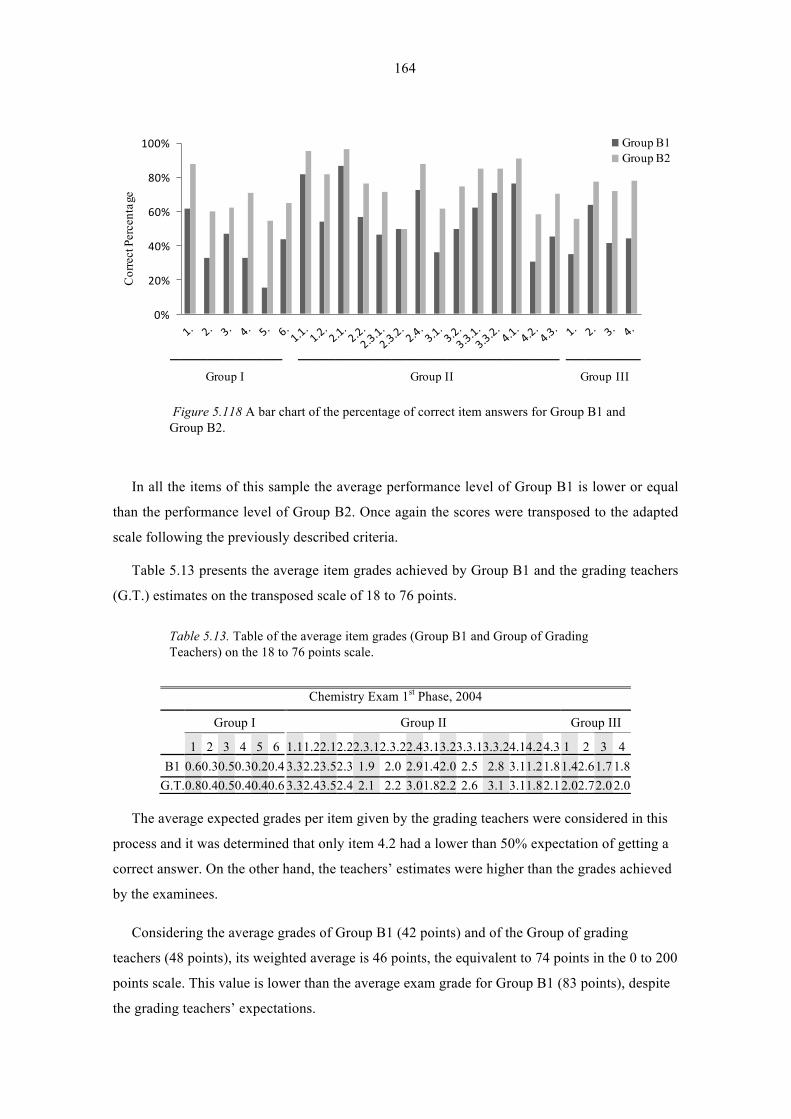
164
0%
20%
40%
60%
80%
100%C
orre
ct P
erce
ntag
eGroup B1Group B2
──────────── ──────────────────────────── ────────Group I Group II Group III
Figure 5.118 A bar chart of the percentage of correct item answers for Group B1 and Group B2.
In all the items of this sample the average performance level of Group B1 is lower or equal
than the performance level of Group B2. Once again the scores were transposed to the adapted
scale following the previously described criteria.
Table 5.13 presents the average item grades achieved by Group B1 and the grading teachers
(G.T.) estimates on the transposed scale of 18 to 76 points.
Table 5.13. Table of the average item grades (Group B1 and Group of Grading Teachers) on the 18 to 76 points scale.
The average expected grades per item given by the grading teachers were considered in this
process and it was determined that only item 4.2 had a lower than 50% expectation of getting a
correct answer. On the other hand, the teachers’ estimates were higher than the grades achieved
by the examinees.
Considering the average grades of Group B1 (42 points) and of the Group of grading
teachers (48 points), its weighted average is 46 points, the equivalent to 74 points in the 0 to 200
points scale. This value is lower than the average exam grade for Group B1 (83 points), despite
the grading teachers’ expectations.
Chemistry Exam 1st Phase, 2004
Group I Group II Group III 1 2 3 4 5 6 1.1 1.2 2.1 2.2 2.3.1 2.3.2 2.4 3.1 3.2 3.3.1 3.3.2 4.1 4.2 4.3 1 2 3 4
B1 0.6 0.3 0.5 0.3 0.2 0.4 3.3 2.2 3.5 2.3 1.9 2.0 2.9 1.4 2.0 2.5 2.8 3.1 1.2 1.8 1.4 2.6 1.7 1.8 G.T. 0.8 0.4 0.5 0.4 0.4 0.6 3.3 2.4 3.5 2.4 2.1 2.2 3.0 1.8 2.2 2.6 3.1 3.1 1.8 2.1 2.0 2.7 2.0 2.0
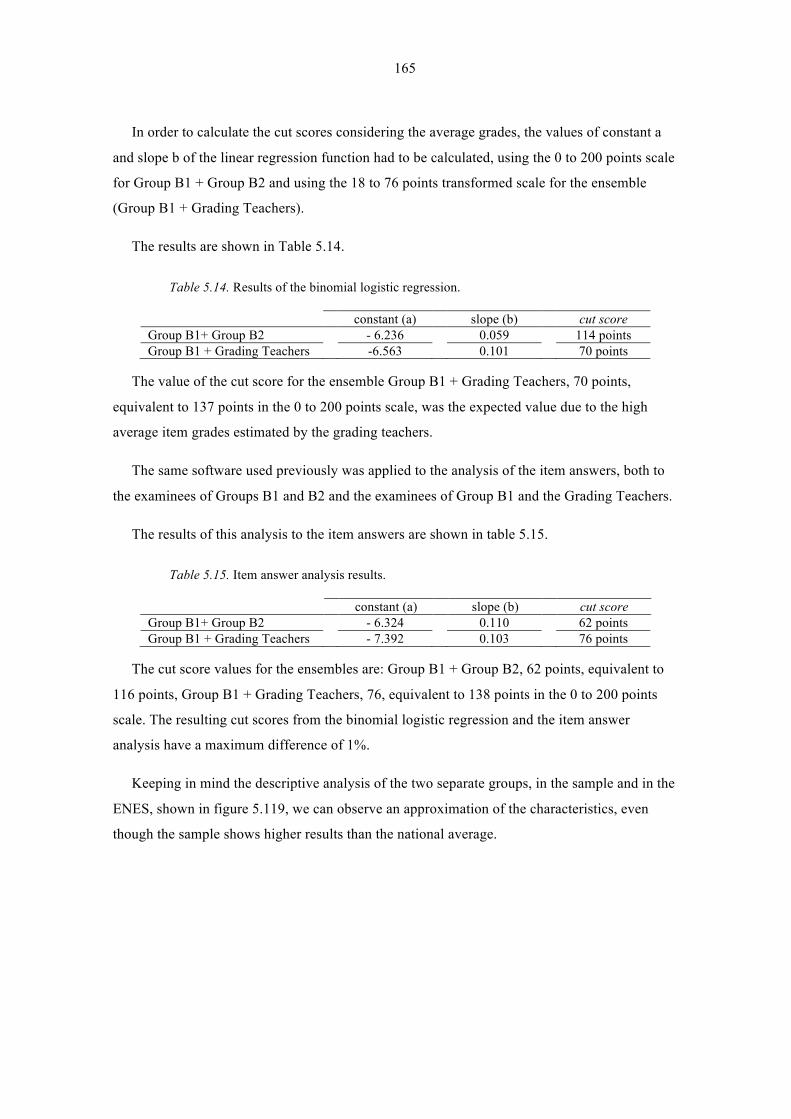
165
In order to calculate the cut scores considering the average grades, the values of constant a
and slope b of the linear regression function had to be calculated, using the 0 to 200 points scale
for Group B1 + Group B2 and using the 18 to 76 points transformed scale for the ensemble
(Group B1 + Grading Teachers).
The results are shown in Table 5.14.
Table 5.14. Results of the binomial logistic regression.
constant (a) slope (b) cut score Group B1+ Group B2 - 6.236 0.059 114 points Group B1 + Grading Teachers -6.563 0.101 70 points
The value of the cut score for the ensemble Group B1 + Grading Teachers, 70 points,
equivalent to 137 points in the 0 to 200 points scale, was the expected value due to the high
average item grades estimated by the grading teachers.
The same software used previously was applied to the analysis of the item answers, both to
the examinees of Groups B1 and B2 and the examinees of Group B1 and the Grading Teachers.
The results of this analysis to the item answers are shown in table 5.15.
Table 5.15. Item answer analysis results.
constant (a) slope (b) cut score Group B1+ Group B2 - 6.324 0.110 62 points Group B1 + Grading Teachers - 7.392 0.103 76 points
The cut score values for the ensembles are: Group B1 + Group B2, 62 points, equivalent to
116 points, Group B1 + Grading Teachers, 76, equivalent to 138 points in the 0 to 200 points
scale. The resulting cut scores from the binomial logistic regression and the item answer
analysis have a maximum difference of 1%.
Keeping in mind the descriptive analysis of the two separate groups, in the sample and in the
ENES, shown in figure 5.119, we can observe an approximation of the characteristics, even
though the sample shows higher results than the national average.
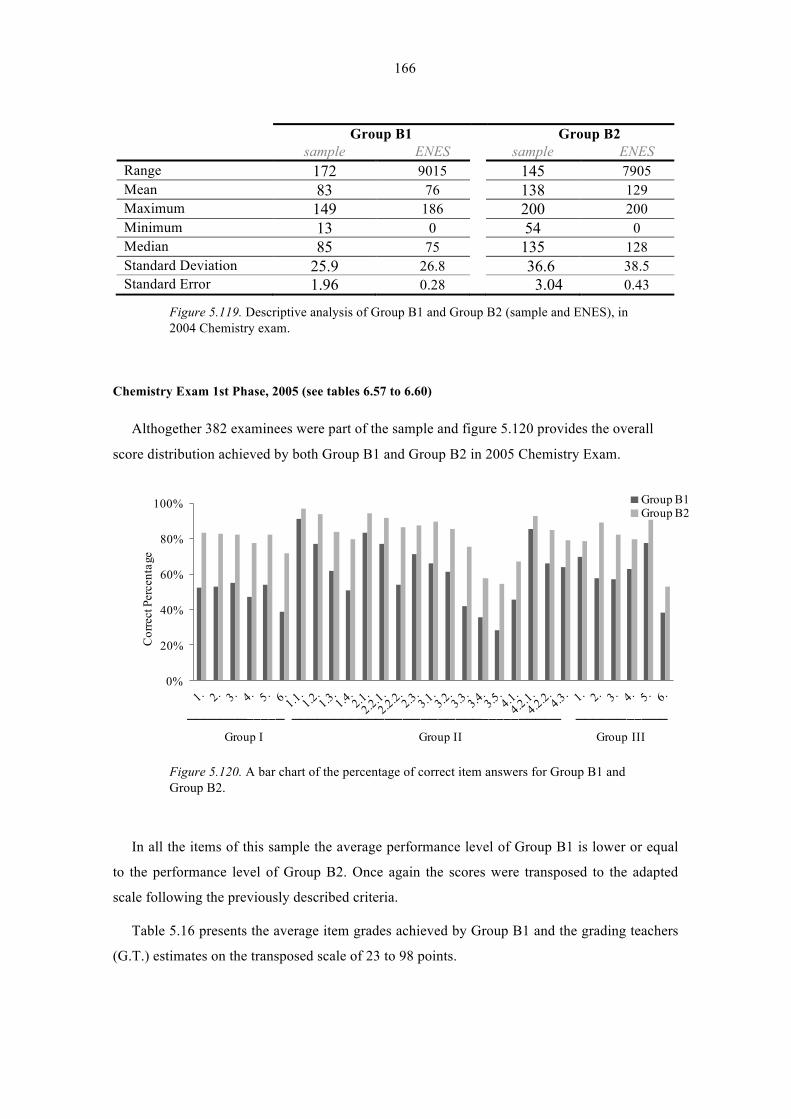
166
Group B1 Group B2 sample ENES sample ENES
Range 172 9015 145 7905 Mean 83 76 138 129 Maximum 149 186 200 200 Minimum 13 0 54 0 Median 85 75 135 128 Standard Deviation 25.9 26.8 36.6 38.5 Standard Error 1.96 0.28 3.04 0.43
Figure 5.119. Descriptive analysis of Group B1 and Group B2 (sample and ENES), in 2004 Chemistry exam.
Chemistry Exam 1st Phase, 2005 (see tables 6.57 to 6.60)
Althogether 382 examinees were part of the sample and figure 5.120 provides the overall
score distribution achieved by both Group B1 and Group B2 in 2005 Chemistry Exam.
0%
20%
40%
60%
80%
100%
Cor
rect
Per
cent
age
Group B1Group B2
──────────── ──────────────────────────────── ───────────Group I Group II Group III
Figure 5.120. A bar chart of the percentage of correct item answers for Group B1 and Group B2.
In all the items of this sample the average performance level of Group B1 is lower or equal
to the performance level of Group B2. Once again the scores were transposed to the adapted
scale following the previously described criteria.
Table 5.16 presents the average item grades achieved by Group B1 and the grading teachers
(G.T.) estimates on the transposed scale of 23 to 98 points.
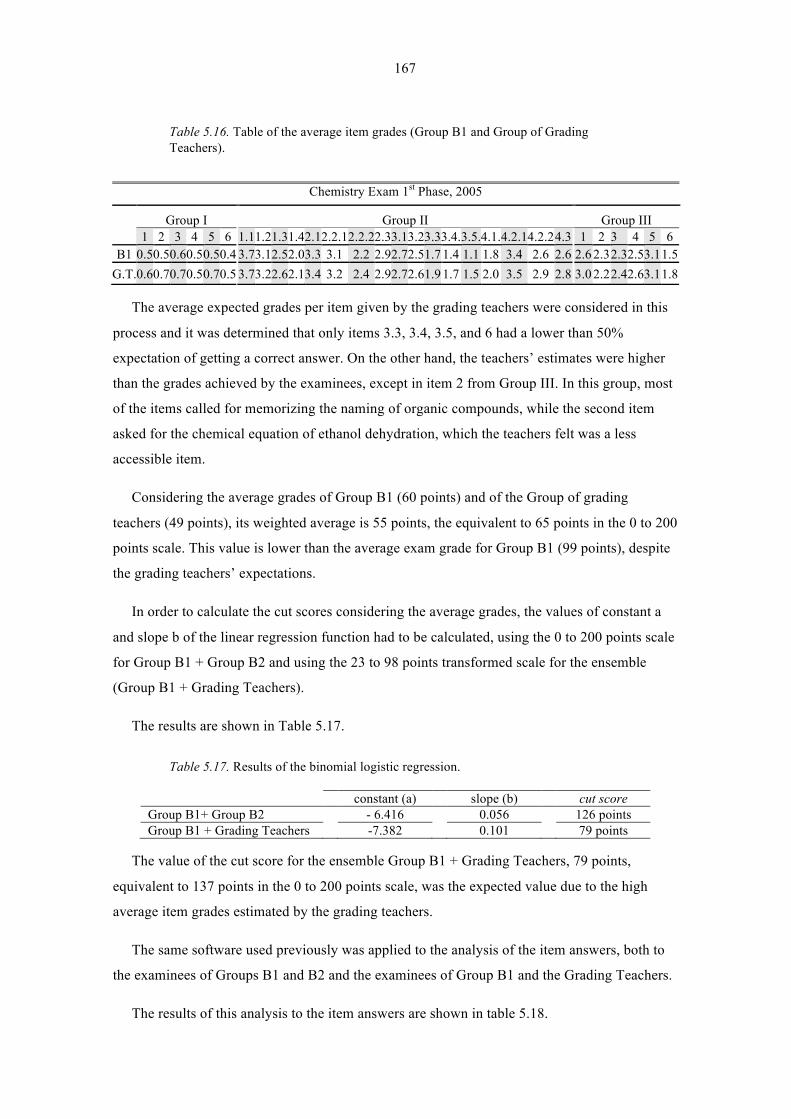
167
Table 5.16. Table of the average item grades (Group B1 and Group of Grading Teachers).
The average expected grades per item given by the grading teachers were considered in this
process and it was determined that only items 3.3, 3.4, 3.5, and 6 had a lower than 50%
expectation of getting a correct answer. On the other hand, the teachers’ estimates were higher
than the grades achieved by the examinees, except in item 2 from Group III. In this group, most
of the items called for memorizing the naming of organic compounds, while the second item
asked for the chemical equation of ethanol dehydration, which the teachers felt was a less
accessible item.
Considering the average grades of Group B1 (60 points) and of the Group of grading
teachers (49 points), its weighted average is 55 points, the equivalent to 65 points in the 0 to 200
points scale. This value is lower than the average exam grade for Group B1 (99 points), despite
the grading teachers’ expectations.
In order to calculate the cut scores considering the average grades, the values of constant a
and slope b of the linear regression function had to be calculated, using the 0 to 200 points scale
for Group B1 + Group B2 and using the 23 to 98 points transformed scale for the ensemble
(Group B1 + Grading Teachers).
The results are shown in Table 5.17.
Table 5.17. Results of the binomial logistic regression.
constant (a) slope (b) cut score Group B1+ Group B2 - 6.416 0.056 126 points Group B1 + Grading Teachers -7.382 0.101 79 points
The value of the cut score for the ensemble Group B1 + Grading Teachers, 79 points,
equivalent to 137 points in the 0 to 200 points scale, was the expected value due to the high
average item grades estimated by the grading teachers.
The same software used previously was applied to the analysis of the item answers, both to
the examinees of Groups B1 and B2 and the examinees of Group B1 and the Grading Teachers.
The results of this analysis to the item answers are shown in table 5.18.
Chemistry Exam 1st Phase, 2005
Group I Group II Group III 1 2 3 4 5 6 1.1 1.2 1.3 1.4 2.1 2.2.1 2.2.2 2.3 3.1 3.2 3.3 3.4. 3.5. 4.1. 4.2.1 4.2.2 4.3 1 2 3 4 5 6
B1 0.5 0.5 0.6 0.5 0.5 0.4 3.7 3.1 2.5 2.0 3.3 3.1 2.2 2.9 2.7 2.5 1.7 1.4 1.1 1.8 3.4 2.6 2.6 2.6 2.3 2.3 2.5 3.1 1.5 G.T. 0.6 0.7 0.7 0.5 0.7 0.5 3.7 3.2 2.6 2.1 3.4 3.2 2.4 2.9 2.7 2.6 1.9 1.7 1.5 2.0 3.5 2.9 2.8 3.0 2.2 2.4 2.6 3.1 1.8
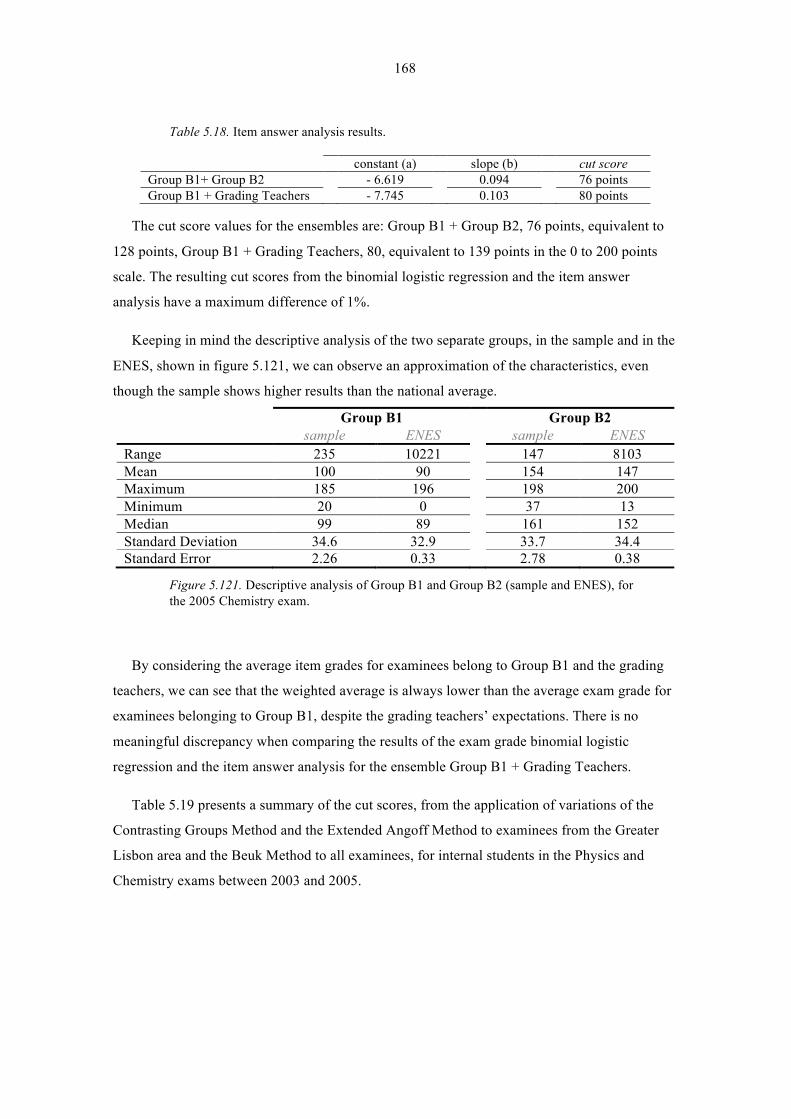
168
Table 5.18. Item answer analysis results.
constant (a) slope (b) cut score Group B1+ Group B2 - 6.619 0.094 76 points Group B1 + Grading Teachers - 7.745 0.103 80 points
The cut score values for the ensembles are: Group B1 + Group B2, 76 points, equivalent to
128 points, Group B1 + Grading Teachers, 80, equivalent to 139 points in the 0 to 200 points
scale. The resulting cut scores from the binomial logistic regression and the item answer
analysis have a maximum difference of 1%.
Keeping in mind the descriptive analysis of the two separate groups, in the sample and in the
ENES, shown in figure 5.121, we can observe an approximation of the characteristics, even
though the sample shows higher results than the national average.
Group B1 Group B2 sample ENES sample ENES
Range 235 10221 147 8103 Mean 100 90 154 147 Maximum 185 196 198 200 Minimum 20 0 37 13 Median 99 89 161 152 Standard Deviation 34.6 32.9 33.7 34.4 Standard Error 2.26 0.33 2.78 0.38
Figure 5.121. Descriptive analysis of Group B1 and Group B2 (sample and ENES), for the 2005 Chemistry exam.
By considering the average item grades for examinees belong to Group B1 and the grading
teachers, we can see that the weighted average is always lower than the average exam grade for
examinees belonging to Group B1, despite the grading teachers’ expectations. There is no
meaningful discrepancy when comparing the results of the exam grade binomial logistic
regression and the item answer analysis for the ensemble Group B1 + Grading Teachers.
Table 5.19 presents a summary of the cut scores, from the application of variations of the
Contrasting Groups Method and the Extended Angoff Method to examinees from the Greater
Lisbon area and the Beuk Method to all examinees, for internal students in the Physics and
Chemistry exams between 2003 and 2005.
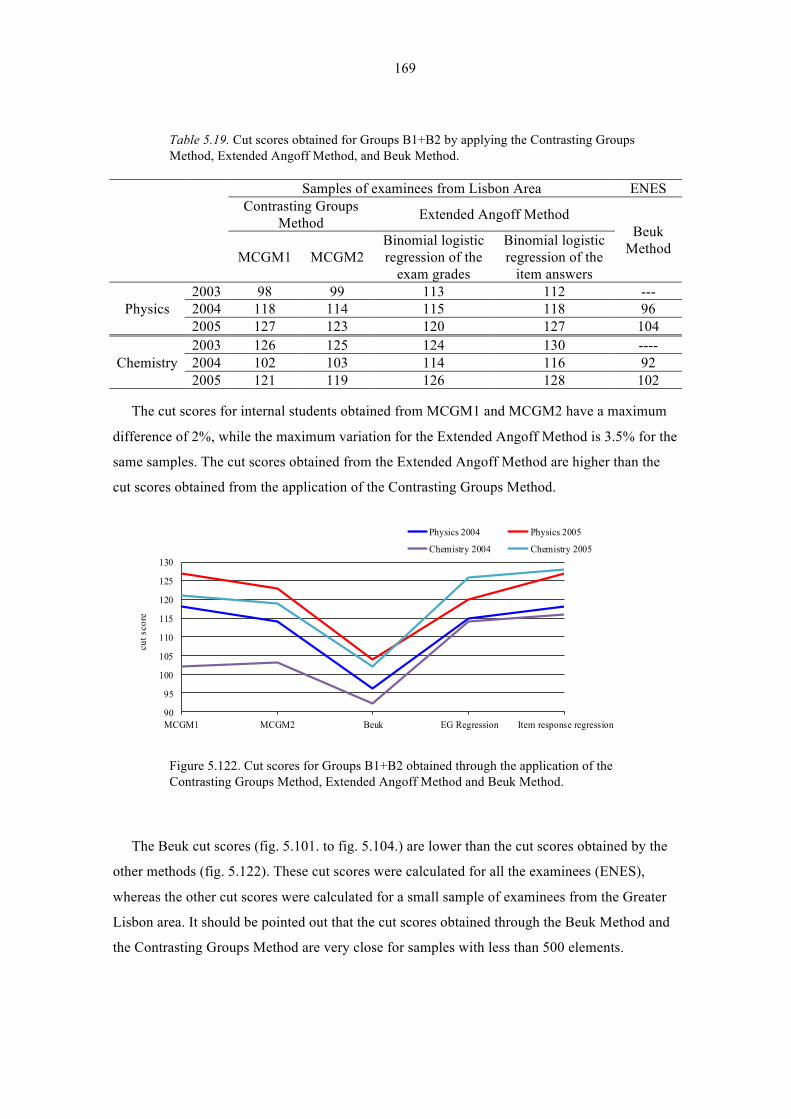
169
Table 5.19. Cut scores obtained for Groups B1+B2 by applying the Contrasting Groups Method, Extended Angoff Method, and Beuk Method.
Samples of examinees from Lisbon Area ENES Contrasting Groups
Method Extended Angoff Method Beuk
Method MCGM1 MCGM2 Binomial logistic regression of the
exam grades
Binomial logistic regression of the
item answers
Physics 2003 98 99 113 112 --- 2004 118 114 115 118 96 2005 127 123 120 127 104
Chemistry 2003 126 125 124 130 ---- 2004 102 103 114 116 92 2005 121 119 126 128 102
The cut scores for internal students obtained from MCGM1 and MCGM2 have a maximum
difference of 2%, while the maximum variation for the Extended Angoff Method is 3.5% for the
same samples. The cut scores obtained from the Extended Angoff Method are higher than the
cut scores obtained from the application of the Contrasting Groups Method.
90
95
100
105
110
115
120
125
130
MCGM1 MCGM2 Beuk EG Regression Item response regression
cut s
core
Physics 2004 Physics 2005
Chemistry 2004 Chemistry 2005
Figure 5.122. Cut scores for Groups B1+B2 obtained through the application of the Contrasting Groups Method, Extended Angoff Method and Beuk Method.
The Beuk cut scores (fig. 5.101. to fig. 5.104.) are lower than the cut scores obtained by the
other methods (fig. 5.122). These cut scores were calculated for all the examinees (ENES),
whereas the other cut scores were calculated for a small sample of examinees from the Greater
Lisbon area. It should be pointed out that the cut scores obtained through the Beuk Method and
the Contrasting Groups Method are very close for samples with less than 500 elements.
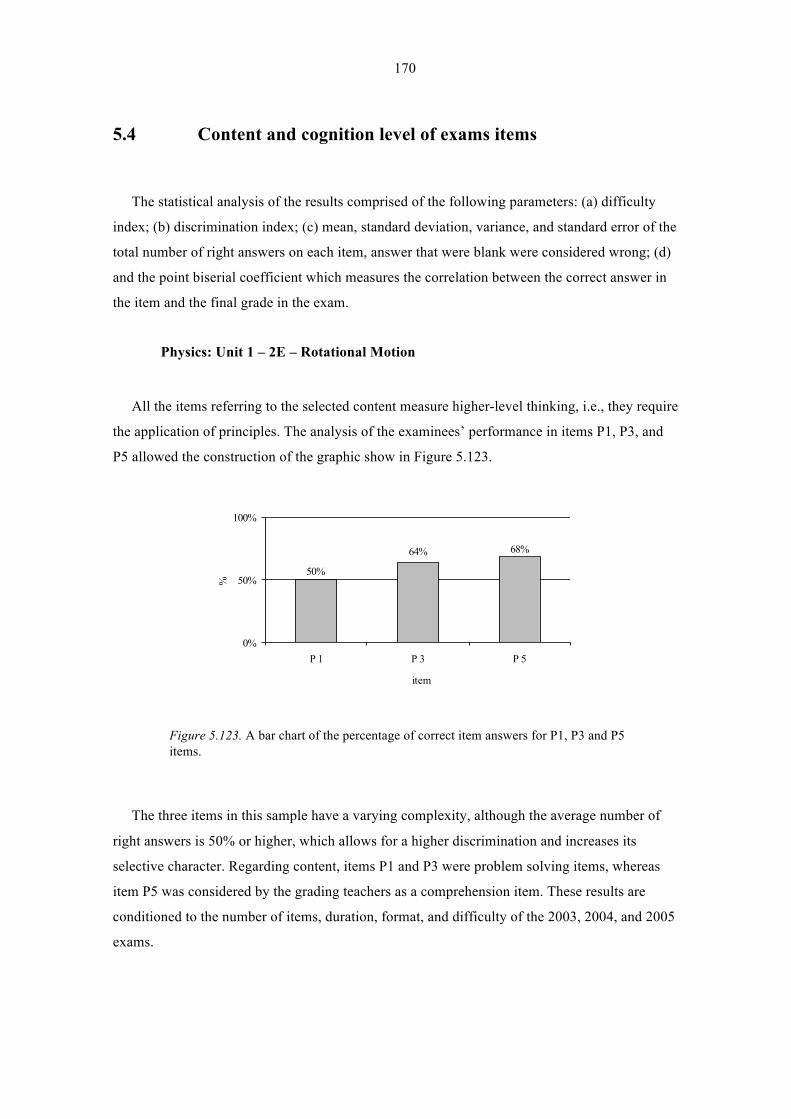
170
5.4 Content and cognition level of exams items
The statistical analysis of the results comprised of the following parameters: (a) difficulty
index; (b) discrimination index; (c) mean, standard deviation, variance, and standard error of the
total number of right answers on each item, answer that were blank were considered wrong; (d)
and the point biserial coefficient which measures the correlation between the correct answer in
the item and the final grade in the exam.
Physics: Unit 1 – 2E – Rotational Motion
All the items referring to the selected content measure higher-level thinking, i.e., they require
the application of principles. The analysis of the examinees’ performance in items P1, P3, and
P5 allowed the construction of the graphic show in Figure 5.123.
64%
50%
68%
0%
50%
100%
P 1 P 3 P 5
item
%
Figure 5.123. A bar chart of the percentage of correct item answers for P1, P3 and P5 items.
The three items in this sample have a varying complexity, although the average number of
right answers is 50% or higher, which allows for a higher discrimination and increases its
selective character. Regarding content, items P1 and P3 were problem solving items, whereas
item P5 was considered by the grading teachers as a comprehension item. These results are
conditioned to the number of items, duration, format, and difficulty of the 2003, 2004, and 2005
exams.
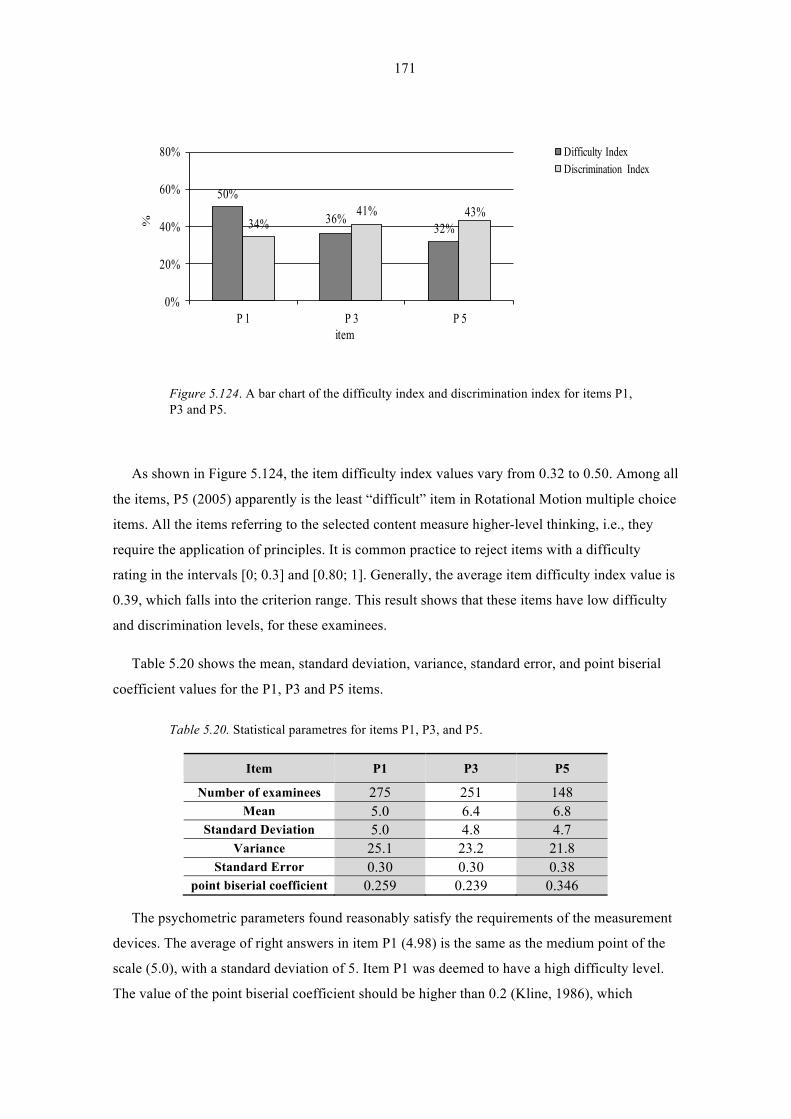
171
50%
36%32%34%
41% 43%
0%
20%
40%
60%
80%
P 1 P 3 P 5
%
item
Difficulty IndexDiscrimination Index
Figure 5.124. A bar chart of the difficulty index and discrimination index for items P1, P3 and P5.
As shown in Figure 5.124, the item difficulty index values vary from 0.32 to 0.50. Among all
the items, P5 (2005) apparently is the least “difficult” item in Rotational Motion multiple choice
items. All the items referring to the selected content measure higher-level thinking, i.e., they
require the application of principles. It is common practice to reject items with a difficulty
rating in the intervals [0; 0.3] and [0.80; 1]. Generally, the average item difficulty index value is
0.39, which falls into the criterion range. This result shows that these items have low difficulty
and discrimination levels, for these examinees.
Table 5.20 shows the mean, standard deviation, variance, standard error, and point biserial
coefficient values for the P1, P3 and P5 items.
Table 5.20. Statistical parametres for items P1, P3, and P5.
Item P1 P3 P5
Number of examinees 275 251 148 Mean 5.0 6.4 6.8
Standard Deviation 5.0 4.8 4.7 Variance 25.1 23.2 21.8
Standard Error 0.30 0.30 0.38 point biserial coefficient 0.259 0.239 0.346
The psychometric parameters found reasonably satisfy the requirements of the measurement
devices. The average of right answers in item P1 (4.98) is the same as the medium point of the
scale (5.0), with a standard deviation of 5. Item P1 was deemed to have a high difficulty level.
The value of the point biserial coefficient should be higher than 0.2 (Kline, 1986), which
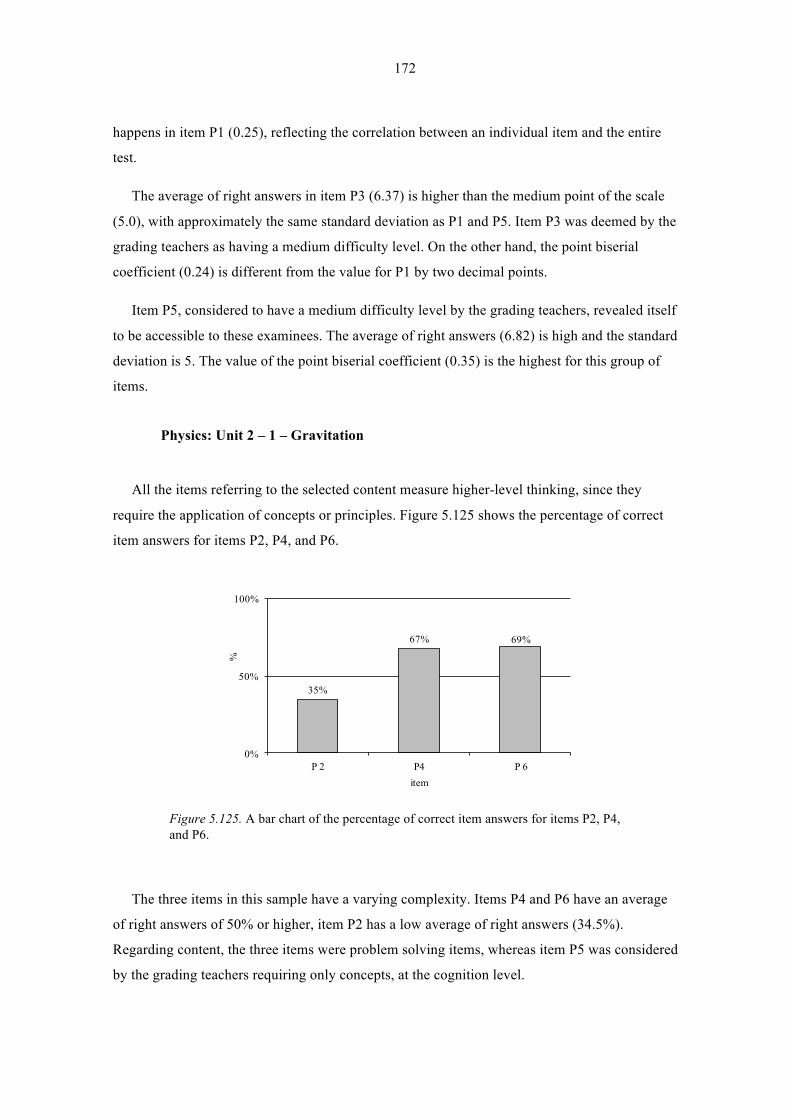
172
happens in item P1 (0.25), reflecting the correlation between an individual item and the entire
test.
The average of right answers in item P3 (6.37) is higher than the medium point of the scale
(5.0), with approximately the same standard deviation as P1 and P5. Item P3 was deemed by the
grading teachers as having a medium difficulty level. On the other hand, the point biserial
coefficient (0.24) is different from the value for P1 by two decimal points.
Item P5, considered to have a medium difficulty level by the grading teachers, revealed itself
to be accessible to these examinees. The average of right answers (6.82) is high and the standard
deviation is 5. The value of the point biserial coefficient (0.35) is the highest for this group of
items.
Physics: Unit 2 – 1 – Gravitation
All the items referring to the selected content measure higher-level thinking, since they
require the application of concepts or principles. Figure 5.125 shows the percentage of correct
item answers for items P2, P4, and P6.
35%
67% 69%
0%
50%
100%
P 2 P4 P 6
%
item
Figure 5.125. A bar chart of the percentage of correct item answers for items P2, P4, and P6.
The three items in this sample have a varying complexity. Items P4 and P6 have an average
of right answers of 50% or higher, item P2 has a low average of right answers (34.5%).
Regarding content, the three items were problem solving items, whereas item P5 was considered
by the grading teachers requiring only concepts, at the cognition level.
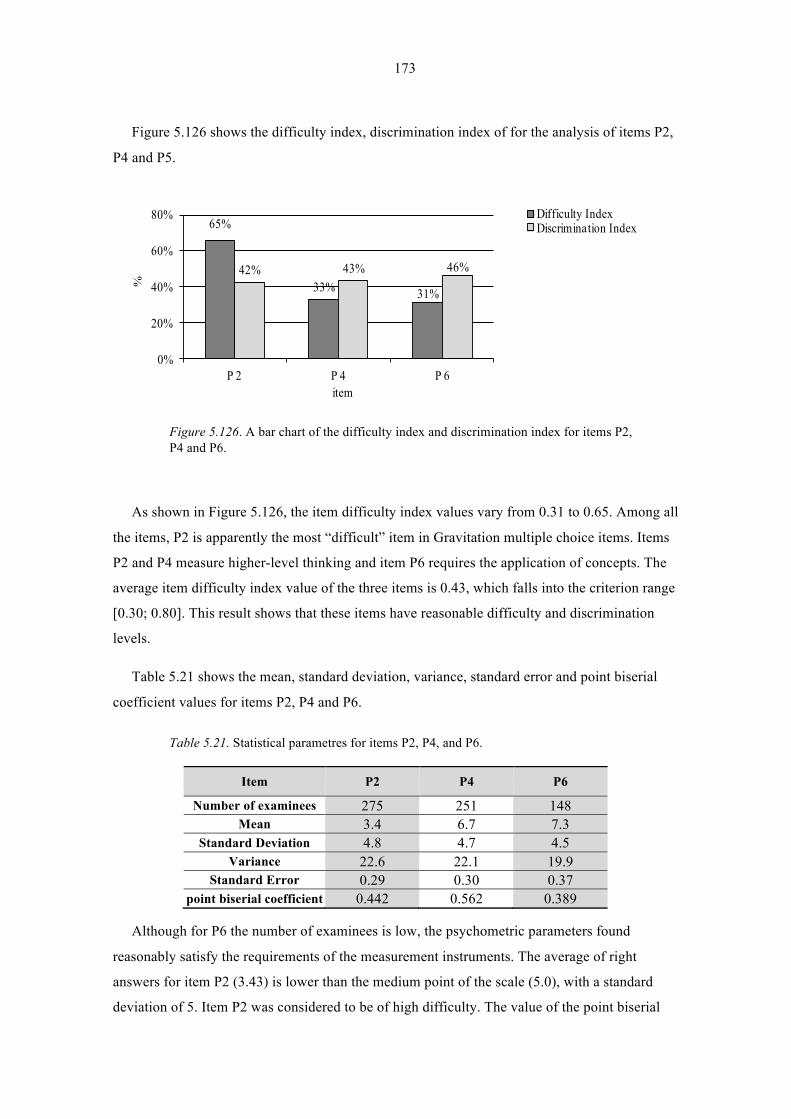
173
Figure 5.126 shows the difficulty index, discrimination index of for the analysis of items P2,
P4 and P5.
65%
33% 31%
42% 43% 46%
0%
20%
40%
60%
80%
P 2 P 4 P 6
%
item
Difficulty IndexDiscrimination Index
Figure 5.126. A bar chart of the difficulty index and discrimination index for items P2, P4 and P6.
As shown in Figure 5.126, the item difficulty index values vary from 0.31 to 0.65. Among all
the items, P2 is apparently the most “difficult” item in Gravitation multiple choice items. Items
P2 and P4 measure higher-level thinking and item P6 requires the application of concepts. The
average item difficulty index value of the three items is 0.43, which falls into the criterion range
[0.30; 0.80]. This result shows that these items have reasonable difficulty and discrimination
levels.
Table 5.21 shows the mean, standard deviation, variance, standard error and point biserial
coefficient values for items P2, P4 and P6.
Table 5.21. Statistical parametres for items P2, P4, and P6.
Item P2 P4 P6
Number of examinees 275 251 148 Mean 3.4 6.7 7.3
Standard Deviation 4.8 4.7 4.5 Variance 22.6 22.1 19.9
Standard Error 0.29 0.30 0.37 point biserial coefficient 0.442 0.562 0.389
Although for P6 the number of examinees is low, the psychometric parameters found
reasonably satisfy the requirements of the measurement instruments. The average of right
answers for item P2 (3.43) is lower than the medium point of the scale (5.0), with a standard
deviation of 5. Item P2 was considered to be of high difficulty. The value of the point biserial
174
coefficient should be higher than 0.2 (Kline, 1986), which happens for item P2 (0.44), reflecting
an acceptable correlation between an individual item and the entire test.
The average of right answers for item P4 (6.73) is higher than the medium point of the scale
(5.0), with a standard deviation of approximately 5. The grading teachers considered item P4 as
being of medium difficulty. On the other hand, the point biserial coefficient (0.56) is the highest
of all the physics items. It was not possible to do biserial point correlations due to the lack of
data regarding the answer to each descriptor.
Item P6 (2005), considered by the grading teachers as being of medium difficulty, turned out
to be the most accessible Physics item. The average of right answers (7.30) is high and the
standard deviation is 4.5. The value of the point biserial coefficient (0.39) is the lowest for this
group of items.
The examinees’ performance in this sample varied considerably in the six chosen items
chosen from the 2003 to 2005 Physics exams. There was also, in Physics, a great variation at the
national level of the “difference of results of the national average between the IFG and EG, with
their behaviour disagreeing with that of other subjects” (Martinho, 2009, p. 158). It was verified
that the highest values of the difficulty level were found in 2003 (items P1 and P2), in line with
the grading teachers’ expectations as they considered the items from that year to be harder. As a
consequence the values of the discrimination index were lower for both items. In 2005, items P5
and P6 presented lower difficulty index values, although the discrimination index values stayed
basically the same.
In both the 2004 and 2005 Physics exams the percentage of correct item answers was higher
than 60%. The guessing factor was not considered in this analysis of multiple choice items. The
choice of a wrong answer was not penalized so there could be certain random adjustments that
are difficult to detect as there is no justification required for the choice of one of the five
possible answers presented on each item.
There was a unique situation detected in school 8 for the 2005 exam (items P5 and P6).
Upon analysing the results it was verified that more than 20 examinees taking the Physics exam
in 2005 had an IFG lower than 130 points in the 200 points scale (minimally competent
students). All these examinees achieved a higher than 130 points EG, with one of the examinees
who had an IFG of 110 points achieving the maximum grade of 200 points. The analysis of the
resolution of this test revealed that the examinee had a great creative capacity for problem
solving. According to the school board, a possible explanation for this point difference between
the IFG and the EG was the extremely high demand level of one the faculty members who

175
taught at the school, leading the majority of students to take the exam as external students. As
this study focuses exclusively on internal students, it led to a very small sample of examinees
for the 2005 Physics exam.
Chemistry: Unit 2 – Inter-molecular Bonds and Gas Laws
All of the items referring to the selected content measure higher-level thinking, since they
require the application of concepts or principles. Figure 5.127 shows the percentage of correct
item answers for items C1, C3, and C5.
33%
54%65%
0%
50%
100%
C1 C3 C5
%
item
Figure 5.127. A bar chart of the percentage of correcte item answers for items C1, C3, and C5.
The three items in this sample presented different complexity levels. Item C1 presented a
low percentage of correct answers (32.7%), while items C3 and C5 showed a percentage of
correct answers higher than 50%. Taking a look at content, item C1 required problem solving,
while items C3 and C5 where considered by the grading teachers to simply require concepts, at
the cognitive level.
Figure 5.128 shows the difficulty index and discrimination index for the analysis of items
C1, C3, and C5.

176
67%
49%
35%43%
56%
42%
0%
20%
40%
60%
80%
C1 C3 C5
%
item
Difficulty IndexDiscrimination Index
Figure 5.128. A bar chart of the difficulty index and discrimination index for items C1, C3, and C5.
As shown in Figure 5.128, the item difficulty index values vary from 0.35 to 0.67. Similarly
to what happened with the Physics contents, item C5 (2005) is apparently the least “difficult”
item of these multiple-choice items. All the items referring to the selected content measure
higher-level thinking, i.e., they require the application of concepts or principles. The average
item difficulty index value is 0.50, which falls into the criterion range. This result shows that
these items have a reasonable difficulty and discrimination levels, for these examinees.
Table 5.22 shows the mean, standard deviation, variance, standard error and point-bi serial
coefficient values for the items C1, C3, and C5.
Table 5.22. Statistical parametres for items C1, C3, and C5.
Item C1 C3 C5
Number of examinees 153 317 382 Mean 3.3 5.4 6.5
Standard Deviation 4.7 5.0 4.8 Variance 22.1 24.9 22.9
Standard Error 0.38 0.28 0.245 point biserial coefficient 0.424 0.442 0.510
Although for C1 the number of examinees is low, the psychometric parameters found
reasonably satisfy the requirements of the measurement instruments. The average of right
answers for item C1 (3.27) is lower than the medium point of the scale (5.0), with a standard
deviation of 5. Item C1 was considered to be of high difficulty. The value of the point biserial
coefficient for item C1 (0.42), reflects an acceptable correlation between an individual item and
the entire test.

177
The average of right answers for item C3 (5.39) is higher than the medium point of the scale
(5.0), with a standard deviation of approximately 5. The grading teachers considered item C3 as
being of medium difficulty. On the other hand, the point biserial coefficient (0.44) is higher than
the required minimum (0.2).
Item C5 (2005) considered by the grading teachers, similarly to item C3, as being of medium
difficulty, was the most accessible of these contents. The average of right answers (6.47) is high
with a standard deviation of 5. The value of the point biserial coefficient (0.51) is the highest for
this group of items.
Chemistry: Unit 5 – Energy and Entropy in Chemical Reactions
Items C2, C4, and C6 measure higher-level thinking requiring both concepts and principles.
Figure 5.129 shows the percentage of correct item answers for items C2, C4, and C6.
54% 53%
65%
0%
50%
100%
C2 C4 C6
%
item
Figure 5.129. A bar chart of the percentage of correcte item answers for items C2, C4, and C6.
The three items in this sample presented different complexity levels, although the average of
right answers is 50% or higher, which allows for better discrimination and increases its selective
character. Regarding content, items C4 and C6 required problem solving, while item C2 was
considered by the grading teachers as an analysis item.
Figure 5.130 shows the difficulty and discrimination indexes for the analysis of items C2,
C4, and C6.
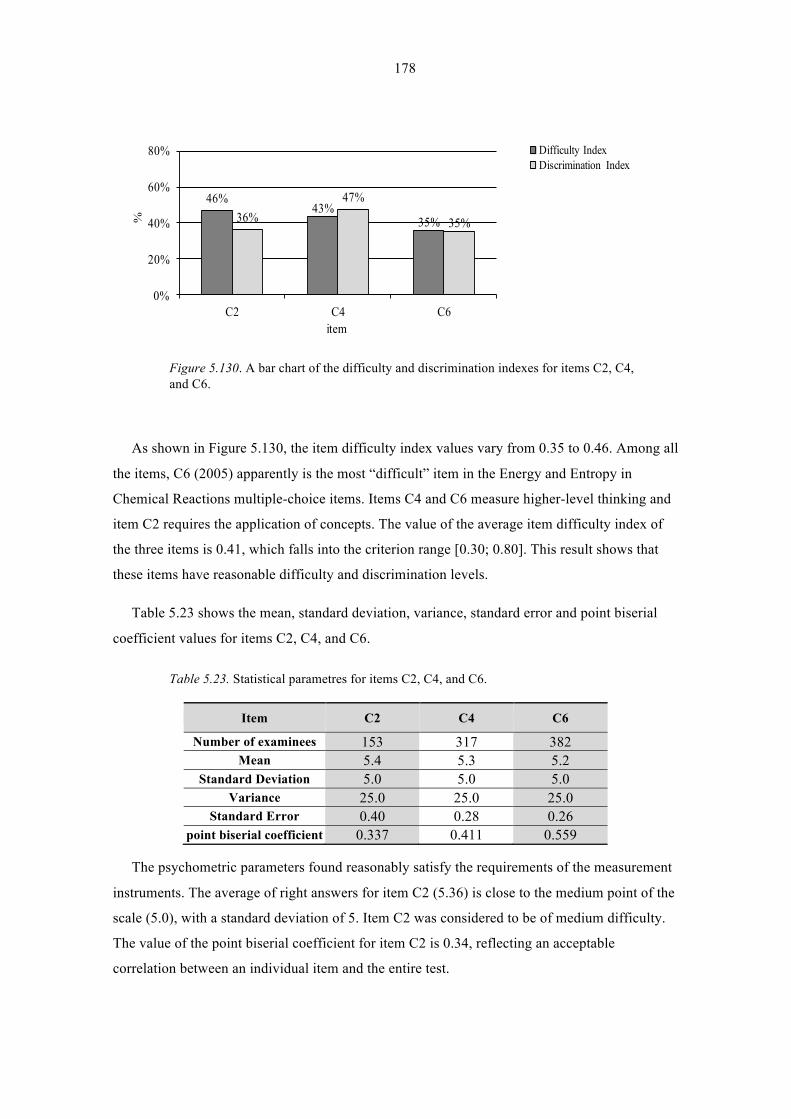
178
46%43%
35%36%47%
35%
0%
20%
40%
60%
80%
C2 C4 C6
%
item
Difficulty IndexDiscrimination Index
Figure 5.130. A bar chart of the difficulty and discrimination indexes for items C2, C4, and C6.
As shown in Figure 5.130, the item difficulty index values vary from 0.35 to 0.46. Among all
the items, C6 (2005) apparently is the most “difficult” item in the Energy and Entropy in
Chemical Reactions multiple-choice items. Items C4 and C6 measure higher-level thinking and
item C2 requires the application of concepts. The value of the average item difficulty index of
the three items is 0.41, which falls into the criterion range [0.30; 0.80]. This result shows that
these items have reasonable difficulty and discrimination levels.
Table 5.23 shows the mean, standard deviation, variance, standard error and point biserial
coefficient values for items C2, C4, and C6.
Table 5.23. Statistical parametres for items C2, C4, and C6.
Item C2 C4 C6
Number of examinees 153 317 382 Mean 5.4 5.3 5.2
Standard Deviation 5.0 5.0 5.0 Variance 25.0 25.0 25.0
Standard Error 0.40 0.28 0.26 point biserial coefficient 0.337 0.411 0.559
The psychometric parameters found reasonably satisfy the requirements of the measurement
instruments. The average of right answers for item C2 (5.36) is close to the medium point of the
scale (5.0), with a standard deviation of 5. Item C2 was considered to be of medium difficulty.
The value of the point biserial coefficient for item C2 is 0.34, reflecting an acceptable
correlation between an individual item and the entire test.
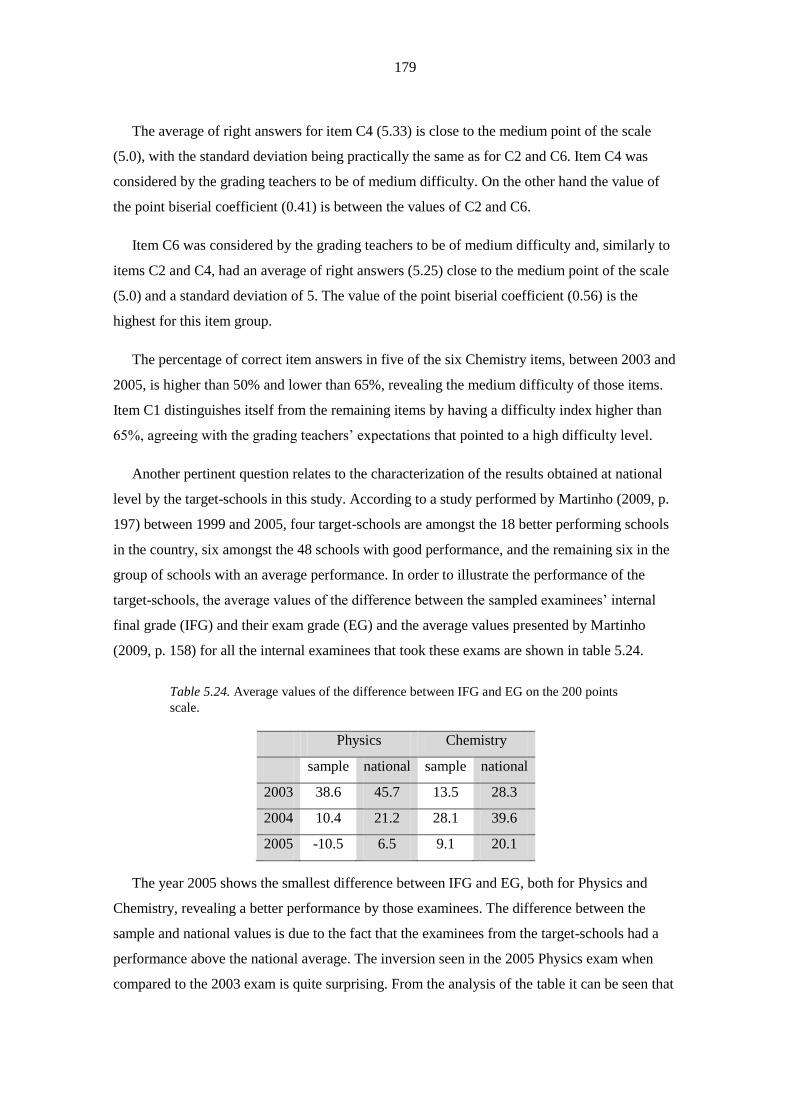
179
The average of right answers for item C4 (5.33) is close to the medium point of the scale
(5.0), with the standard deviation being practically the same as for C2 and C6. Item C4 was
considered by the grading teachers to be of medium difficulty. On the other hand the value of
the point biserial coefficient (0.41) is between the values of C2 and C6.
Item C6 was considered by the grading teachers to be of medium difficulty and, similarly to
items C2 and C4, had an average of right answers (5.25) close to the medium point of the scale
(5.0) and a standard deviation of 5. The value of the point biserial coefficient (0.56) is the
highest for this item group.
The percentage of correct item answers in five of the six Chemistry items, between 2003 and
2005, is higher than 50% and lower than 65%, revealing the medium difficulty of those items.
Item C1 distinguishes itself from the remaining items by having a difficulty index higher than
65%, agreeing with the grading teachers’ expectations that pointed to a high difficulty level.
Another pertinent question relates to the characterization of the results obtained at national
level by the target-schools in this study. According to a study performed by Martinho (2009, p.
197) between 1999 and 2005, four target-schools are amongst the 18 better performing schools
in the country, six amongst the 48 schools with good performance, and the remaining six in the
group of schools with an average performance. In order to illustrate the performance of the
target-schools, the average values of the difference between the sampled examinees’ internal
final grade (IFG) and their exam grade (EG) and the average values presented by Martinho
(2009, p. 158) for all the internal examinees that took these exams are shown in table 5.24.
Table 5.24. Average values of the difference between IFG and EG on the 200 points
scale.
Physics Chemistry
sample national sample national
2003 38.6 45.7 13.5 28.3
2004 10.4 21.2 28.1 39.6
2005 -10.5 6.5 9.1 20.1
The year 2005 shows the smallest difference between IFG and EG, both for Physics and
Chemistry, revealing a better performance by those examinees. The difference between the
sample and national values is due to the fact that the examinees from the target-schools had a
performance above the national average. The inversion seen in the 2005 Physics exam when
compared to the 2003 exam is quite surprising. From the analysis of the table it can be seen that
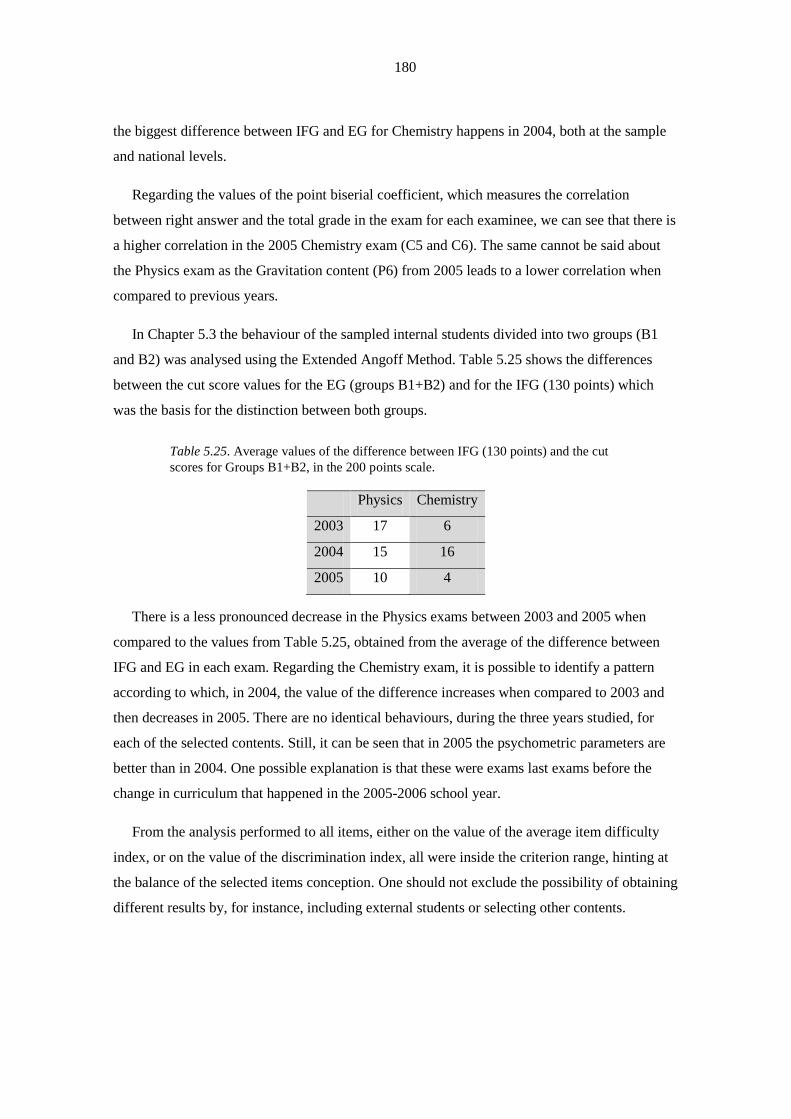
180
the biggest difference between IFG and EG for Chemistry happens in 2004, both at the sample
and national levels.
Regarding the values of the point biserial coefficient, which measures the correlation
between right answer and the total grade in the exam for each examinee, we can see that there is
a higher correlation in the 2005 Chemistry exam (C5 and C6). The same cannot be said about
the Physics exam as the Gravitation content (P6) from 2005 leads to a lower correlation when
compared to previous years.
In Chapter 5.3 the behaviour of the sampled internal students divided into two groups (B1
and B2) was analysed using the Extended Angoff Method. Table 5.25 shows the differences
between the cut score values for the EG (groups B1+B2) and for the IFG (130 points) which
was the basis for the distinction between both groups.
Table 5.25. Average values of the difference between IFG (130 points) and the cut
scores for Groups B1+B2, in the 200 points scale.
Physics Chemistry
2003 17 6
2004 15 16
2005 10 4
There is a less pronounced decrease in the Physics exams between 2003 and 2005 when
compared to the values from Table 5.25, obtained from the average of the difference between
IFG and EG in each exam. Regarding the Chemistry exam, it is possible to identify a pattern
according to which, in 2004, the value of the difference increases when compared to 2003 and
then decreases in 2005. There are no identical behaviours, during the three years studied, for
each of the selected contents. Still, it can be seen that in 2005 the psychometric parameters are
better than in 2004. One possible explanation is that these were exams last exams before the
change in curriculum that happened in the 2005-2006 school year.
From the analysis performed to all items, either on the value of the average item difficulty
index, or on the value of the discrimination index, all were inside the criterion range, hinting at
the balance of the selected items conception. One should not exclude the possibility of obtaining
different results by, for instance, including external students or selecting other contents.
181
6 Conclusions
“Students need ideas - not a single view but discussions of views - concerning:
laws in science, the relationship between experiment and theory, and the strong
distinction between theory and simple hypotheses. For these benefits students must
be carried through actual examples, not just harangued or given put
definitions.”(Rogers, 1960, p. 30)
The results of this study suggest a higher specialization of the grading teachers to promote the
attainment of cut scores closer to the values of the examinees, as well as the application of other
mixed methods, considering different samples.
The goal of grading should not be only to highlight eventual differences but to properly
interpret them so that effective decisions in the teaching and learning process can be taken. If,
on one hand, a higher level of demand can have negative consequences and lead to deception
and indifference in the subject by the students, on the other hand, the performance level of the
examinees should reflect and encourage learning activities associated to more complex skills so
that evaluation can model the learning.
In the spirit of openness and of a road to be travelled and understanding that learning
practices are inseparable from evaluation and their social use, some research orientations and
horizons are presented which can eventually emerge from this study.
182
6.1 Major Findings
The brief analysis of the legislation starting in 1836 allowed understanding the evolution of the
norms regulating exams, in general, and national exams, particularly. Although the national
exams have contributed to better know “the students’ understanding of school subject curricula,
signal educational goals to work toward, and provide instructionally valuable feedback”
(Chudowsky & Pellegrino, 2003), the low results obtained by the students should lead to a
reflection about what exams should be measuring. Changes in the Physics and Chemistry
curricula complicate the study of educational performance trends. To study trends, it is
important to keep the assessment constant (Beaton & Zwick, 1990) but to maintain validity the
assessment should be congruent with current educational practices. There are countless
personal, material, and institutional obstacles that influence teaching practices. For many years
encyclopaedic teaching, directed towards an elite, was incapable of considering the different
interests and values of those who attended it. Nowadays, “teachers are asked to assume multiple
and often contradictory roles, including, among other things, providing academic instruction;
maintaining order in the classroom; attending to the social and emotional well-being of students;
and meeting sometimes conflicting expectations of students, administrators, parents, and the
community” (Smylie, 1999, p. 66).
The Portuguese educational system is based on, according to Valente (2011), “regimen of
intensive exam correction, an unavoidable regulatory instrument, of accountability and incentive
to all school life, which will finally generate good results.” Still, these good results, expected for
years, are still missing both in Physics and Chemistry. The students study to reach goals, if the
probabilities of success are minimal, there is no motivation to study these subjects. The practice
of lowering the demand level is usually evoked to justify some academic success, hence the
importance of analysing the items and the curricular contents found in the exams (Chapter 3)
and the results achieved by the students (Chapter 4).
The grading, once seen by the teachers as a dialogical instrument, leads to a reflection of the
daily practices, allowing for change both in the grading as in the curricula. Phillips (1996, p. 19)
referred the relationship of test content with the underlying curriculum as an evidence of
curricular validity, and is often labelled “opportunity to learn” (OTL). According to Fernandes
(2004, p. 14) and Valadares & Graça (1998, p. 41) there is an ever greater tendency in the
European educational systems regarding the “«inevitability of coexistence» of the psychometric
paradigm, in the field of external grading with effect on the student progression, with the
paradigm of the so called alternative, authentic, educational, or contextualized grading, of
183
constructivist and cognitive inspiration” (Gipps & Stobart, 2003; Horn et al., 2000; Kellaghan &
Madaus, 2003; Mislevy, Wilson, Ercikan, & Chudowsky, 2003). It’s a hard task but “a teacher,
who can record a pupil’s performance over time and in several contexts, and who can discuss
idiosyncratic answers in order to understand the thinking behind them, can build up a record of
far better reliability than any external exam can achieve” (Jennison & Ogborn, 1994, p. 69). It is
urgent to examine the current policy and practice since
“… the national exams of Secondary School are a task that mobilizes a significant
quantity of resources, both human and economical, and the fact that a policy for the
assessment test was never clearly defined, can explain why the discussion about assessment
as a regular element in classroom work was never heard of again.” (Carvalho, 2010, p. 123)
Another fact that should be highlighted in these five decades is the extension and
incoherence of the curricula, not only due to the lack of articulation with the subject of
Mathematics, but also due to the juxtaposition of different notions from several time periods and
cultural models (Duarte, 1997, p. 496). The presentation of examples of items (fig.3.2, and p.
51, p. 54 and p.56) with undesirable psychometric properties and revealing these problems
helped illustrating the selective qualities of the national exams. Another revealing issue is the
interest for lab work: for students, both in Physics as in Chemistry, the lab component was
mainly a nasty exercise, devoid of any intrinsic interest. The student followed a set of prescribed
stages, and aroused a little wiser. The end of the experimental component in the national exams
was an escape from this problem. But, according to Jennison and Ogborn, “our students need to
come to grips with the real physical world, not to base their knowledge of it on lectures (even
with demonstrations) and textbooks.” (1994, p. 86) Teachers should be vigilant “in the use of
their content knowledge, whether in the laboratory or in the classroom”(Thorndike & Hagen,
1977). The scientific skills mean “critical thinking, imagination, intuition, playfulness, and
thinking on your feet and with your hands that are essential to success in scientific research.”
According to Bower,
“There is no more effective means to convey the excitement of science than to let teachers
and their students really do science where doing is dependent on involvement in an open-
ended, inquiry-based, student-driven exploration of almost any subject.” (2001, p. 9)
The comparison between the results of different exams has been done for over a hundred
years and since then much has been learned. There is clear progress regarding the objectivity of
the grading in the period studied, not only through the improvement of technical aspects such as
test writing and the agreement amongst examiners as to grading criteria and point distribution,
184
but also through the importance given to the development of psychometric tools to gauge
student performance.
The application of the Contrasting Groups Method allowed seeing two distinct groups of
students: internal and externals students (fig. 5.12, fig. 5.33, fig. 5.63, and fig. 5.93), and also
internal students with internal final grades generally higher than the exam grades. The cut scores
for internal students obtained from MCGM1 and MCGM2 have a maximum difference of 2%,
while the maximum variation for the Extended Angoff Method is 3.5% for the same samples.
(Table 6.1) The cut scores obtained from the Extended Angoff Method were higher than the cut
scores obtained from the application of the Contrasting Groups Method.
The Beuk cut scores (fig. 5.101. to fig. 5.104.) are lower than the cut scores obtained by the
other methods (fig. 5.121). These cut scores were calculated for all the examinees (ENES),
whereas the other cut scores were calculated for a small sample of examinees from the Greater
Lisbon area. It should be pointed out that the cut scores obtained through the Beuk Method and
the Contrasting Groups Method are very close for samples with less than 500 elements.
The cognitive analysis showed that there are no identical behaviours, during the three years
studied, for each of the selected contents (p. 172).
Other conclusions also emerged:
A - A similarity between the results achieved by these three methods, namely when the
sample includes more than 250 individuals;
B - The teacher expectations are generally very high compared to the results achieved;
C - In this study, the statistical methods gave results suggesting that Physics had been
harshly graded, especially in the late 90s, and consistent results of all examinees have
not been observed from 2003 to 2005;
D - There are differences in the average grade of the polytomous items. The lower grades in
the items related to the experimental component of the curriculum is an indicator of the
need to promote the development of skills in that area. The basis of this kind of studies
is the concept that the primordial reason for the evaluation of the quality of teaching is
to improve learning.
The evolution in cognitive sciences aroused skills that distinguish barely competent from
competent examinees in particularly “subject domains, and advances in measurement and
technology have extended the capability to collect and interpret more complex forms of
185
evidence about student performance” (Minstrell, 2000). This study suggests also that is worthy
to analyse cognitively items of Physics or Chemistry exams before and after the exams in order
to understand the scores obtained by the examinees.
Concluding, this study is a pro-active and reactive reflection on the Physics and Chemistry
national exams up to 2005, providing a vast source of information and opening avenues for
future studies, such as:
- Studies on the curricular reforms in Physics and Chemistry;
- Studies on the writing of items;
- Comparative studies of the European and Non-European grading policies.
In future years, some of the recent advances will be viewed from a broader perspective, with
new approaches surrounding score comparison. Comparable scores are, and always will be
essential to help answer many questions of interest in education and society (Holland & Dorans,
2006, p. 217).
6.2 Limitation of the Study and Suggestions for Further
Research
To research this theme through such a broad time period, even with some methodological and
information constraints, presented an opportunity to reflect on and deepen the understanding the
different competences mobilised in grading and provide knowledge for those who wish to
maximize educational outcomes.
Globally, the testing Portuguese regime is characterised for “emphasizing the grading,
selection, and certification processes, as well as the results achieved by the students”,
(Fernandes, 2007, p. 123) and “is oriented toward the generation of items that can fulfil limited
purposes”, are only used one time and then are discarded. This option is one of the limitations of
this longitudinal study regarding national exams, as to its relative weight and its
interdependence.
The main problem in this study of comparability of grades is what is meant by "comparable."
There are several definitions of comparability and the selection and application of several
statistical methods aimed to include psychometric tools consistent with the collected data. It was
186
also aimed to have the available judges validate reliable judgments of appropriate cutting scores.
This approach based on judgments was not completely successful since the expected scores by
the teachers were always higher that the ones achieved by the examinees. It is possible that with
further refinement of the procedures and special training of judges, the difficulties brought about
by different standards in grading might be overcome. It is important to provide score feedback
on an annual basis, and make systematic judgments and statistical comparisons to improve
future scores.
On the other hand, the analysis is limited to a sample that includes a group of schools from
the Lisbon area (p.171), where examinees had a superior average performance to the national
average (Martinho, 2009 ). This choice is controversial because there are demographic and
economic differences between populations, (Finn, 2004) suggesting further study of differences
in educational performance in other areas of Portugal. In the period this investigation focuses in
there was an increase in the education of the population and, consequently, an increase in
literacy. Still, it was not possible to find interdependence between the increase of compulsory
schooling and the results of the national exams.
An exam centred perspective is a particularly reductive view, as it doesn’t question the
contribution of other factors in the promotion of the teaching-learning process. As Shepard
remarked, “assessment cannot promote learning if it is based on tasks or questions that divert
attention from the real goals of instruction”(2006, p. 629). Traditionally, exam items often
misdirected teaching focusing what was easiest to measure instead of what was important to
learn. Classroom teaching should engage students in learning activities, should be as directly as
possible focused on mental representations of the real goals for learning. On the other hand, “it
is a shame that the socialising character of school, the informal experiences lived there, forming
or deforming, is neglected. One talks almost exclusively of the teaching of contents.” (Freire,
1997, p. 47) Some “efforts to change science teaching in public schools” (Beichner, 1994)had
success when connected with new technologies. Technology could create over time a database
about how students achieved their goals “while engaged in important learning activities.
Information for assessment purposes could be extracted from this database and used to serve
both classroom and external assessment needs”(Pellegrino, 2006).
Teachers play a key part in the renovation of teaching-learning and,
“(...) among other methods, being part of a network allows them to improve the quality of
their teaching and supports their motivation. Networks can be used as an effective
component of teachers’ professional development, are complementary to more traditional

187
forms of in-service teacher training and stimulate morale and motivation.” (Report, 2007, p.
3)
Without question, improvements in the grading process will face some challenges. The
grading reform process can begin with a bottom up approach, starting from the student. One of
these tasks is organizing a coherent and more coordinated global grading system based on
analytic procedures and tools suitable for the task. Another no less important task is a reflexion
on the part exams and grading play in society. The national exam scores have real effects on
college admission, performance, and course choice, and improved performance will have an
impact not only in increased literacy but also in the country’s development. The realization of
this problem is essential to creating a public debate regarding the social and public goals of
academic achievement. No less important is the alteration of the item building and single-use
exam paradigm, and the investment in designing trustworthy instruments, following Rasch’s
models, for instance, that will be reusable. The family of Rasch models (Rasch, 1977) provides
a compatible basis for quantitative measurement in a probabilistic framework (Fischer, 1995;
Perline, Wright, & Wainer, 1979). It will be necessary to analyse the cost-benefit and to discuss
the “long-term benefits of a new model of assessment”, and particularly “assessment practices
that can directly support enhanced outcomes for individual students”(Pellegrino, 1999).
Computers have been used for over half a century for scoring and analysing test results. In
some countries however, they are used to administer tests as well. The computer offers the
capability of presenting item formats that go well beyond those used for paper and pencil (P&P)
tests; for instance, it is possible to use computers to test how examinees perform in simulated
scenarios. Using
“new assessment technologies, schools might no longer have to interrupt the normal
instruction process at various times during the year to administer external tests to students,
let alone spend large amounts of time preparing to take such tests.”(Chudowsky &
Pellegrino, 2003)
Like in the United States, the recent Portuguese legislation emphasizes the setting of high
academic standards and measuring students’ attainment of those standards, reinforces the needs
to clarify and focus educational goals. Unfortunately, the new requirements for assessment tests
for multiple grades, such as testing all students in 4th grade in Mathematics and Portuguese and
also in 9th, 10th, and 11th grades in Physics and Chemistry among other subjects present some
real dangers such as Popham remarked (Popham, 2004). Hopefully, education leaders might
accept the need to invest “time and resources to pursue the improvement of large-scale”
188
assessments “so it can provide the information needed to help all students learn and succeed in
school” (Popham, 2001).
Consequently, the conclusion of this study represents, besides the personal gain and
improvement, the opportunity to implement teaching based on broadening the learning
possibilities, considering grading as one more instrument providing individual feedback on a
student to reflect on their level of knowledge and understanding.

189
Bibliography
Albarello, L., Digneffe, F., Hiernaux, J. P., Maroy, C., Ruquoy, D., & Saint-Georges, P. (1997).
Práticas e Métodos de Investigação em Ciências Sociais. Lisboa: Gradiva.
Almeida, A. (1952). Pontos de Exame. Labor, XVI(120), 484-489.
Almeida, F. (1955a). O fraco rendimento do Ensino Liceal e as suas causas. Labor, XIX(146),
348-353.
Almeida, F. (1955b). A selecção escolar. Labor, XIX (148), 510-517.
Almeida, F. (1971). O baixo nível dos estudantes liceais,a sua sucessiva descida e algumas
sugestões para um combate profícuo. Labor, XXXV(291), 256-279.
Anderson, L., & Krathwohl, D. (2001). A taxonomy for learning, teaching, and assessing: A
revision of Bloom's taxonomy of educational objectives. New York: Longman.
Angoff, W. H. (1971). Scales, norms, and equivalent scores. In R. L. Thorndike (Ed.),
Educational Measurement (pp. 508-600). Washington, D.C.: American Council on
Education.
Apple, M. W. (2000). Official knowledge , democratic education in a conservative age (2nd ed.
ed.). New York: Routledge.
Araújo, M. d. C. (1976). Avaliação, acto político. O Professor(14), 5-6.
Ataíde, Á. d. (1944a). Sobre Exames(Reflexões de um professor velho). Liceus de Portugal(36),
2905-2908.
Ataíde, Á. d. (1944b). Sobre Exames.(Reflexões de um professor velho). Liceus de
Portugal(38), 101-103.
Ataíde, Á. d. (1946). Exames de 1945 - Notas sobre os resultados. Liceus de Portugal(49), 223-
226.
Azevedo, J. (2000). O ensino secundário na Europa. Porto: Edições ASA.
Bailey, K. D. (1978). Methods of Social Research. Basingstoke: Collier-Macmillan.
Baker, F. B. (2001). The Basics of Item Response Theory. New York: Marcel Dekler Inc.
Bárcena, F. (2002). El aprendizaje de lo Nuevo - Reflexiones sobre la tragedia del comienzo.
Revista Española de Pedagogía, 60(223).
190
Barreira, C. (2001). Avaliação das aprendizagens em contexto escolar_ Estudo das atitudes dos
docentes face ao modelo de avaliação do ensino básico. Universidade de Coimbra,
Coimbra.
Barreira, C. (2002). Reorganização dos currículos no ensino básico e suas implicações na
avaliação das aprendizagens. Revista Portuguesa de Pedagogia, 36, 89-106.
Bartolomeis, F. (1981). Avaliação e orientação: objectivos, instrumentos, métodos. Lisboa:
Livros Horizonte.
Beato, C. (2003). A disciplina de ciências físico-químicas na reforma liceal de 1947.
Universidade de Lisboa, Lisboa.
Beaton, A. E., & Zwick, R. (1990). Disentangling the NAEP 1985-86 reading anomaly (NAEP
Rep. No. 17-TR-21).Princeton, NJ: Educational Testing Service.
Beichner, R. J. (1994). Testing student interpretation of kinematics graphs.Computer Graphics
28, 40-43.
Bell, J. (1991). Doing Your Research Project. Milton Keynes: Open University Press.
Bell, J. F., & Dexter, T. (2000). Using Multilevel Models To Assess The Comparability of
Examinations.
Berk, R. A. (1976). Determination of optimal cutting scores in criterion-referenced
measurement. Journal of Experimental Education, 45(2), 4-9.
Beuk, C. (1984). A method for reaching a compromised between absolute and relative standards
in examinations. Journal of Educational Measurement, 21(2), 147-152.
Blades, D. (1997). Procedures of power and curriculum change: Foucault and the quest for
possibilities in science education. New York Peter Lang Publisher, Inc.
Boavida, J., & Barreira, C. (1992). Nova avaliação no ensino básico - Análise dos Despachos
162/ME/91 e 98-A/92. Revista Portuguesa de Pedagogia, XXVI(2), 345-366.
Boldt, R. F. (1998). GRE Analytical Reasoning Item Statistics Predication Study.
Bonboir, A. (1976). Como avaliar os alunos. Lisboa: Seara Nova.
Bonniol, J.-J., & Vial, M. (2006). Les Modèles De L’Évaluation. Bruxelles: De Boeck-Wesmael
S.A.
Bower, J. M. (2001). Scientists and Science Education Reform: Myths, Methods, and Madness.
http://www.nas.edu/rise/backg2a.htm, 1-10
Boyle, B., & Christie, T. (1996). Issues in setting Standards: Establishing Comparabilities.
London: Routledge Falmer.
Brandon, P. R. (2002). Two versions of the contrasting-groups standard-setting method: A
review. Measurement and Evaluation in Counseling and Development, 35, 167-181.
Brotas, A. (1977). Como está a ser preparado o “ano propedêutico”? O Jornal da Educação, I
(4), 8.
Burt, C. (1949). Mental and Scholastic Tests (third edition ed.). London: Staples Press
Cardinet, J. (1993). Avaliar é medir? Porto: Edições ASA.
191
Carmo, A. S. d. (1959). Acerca do ensino das Ciências Físico-Químicas. Labor, XXIV(189),
206-210.
Carmo, A. S. d. (1960a). Acerca do ensino das Ciências Físico-Químicas. Labor, XXIV(191),
330 - 335.
Carmo, A. S. d. (1960b). Acerca do ensino das Ciências Físico-Químicas. Labor, XXIV(190),
296 - 301.
Carvalho, R. d. (1951a). Esclarecimento. Labor, XVI(115), 55-57.
Carvalho, R. d. (1951b). O ensino das fórmulas e das equações químicas no 2º ciclo do ensino
liceal. Labor, XV(113), 198-205.
Carvalho, R. d. (1970). Sobre o estado actual do ensino da Física. Palestra(37-38-39), 141-155.
Carvalho, R. d. (2010). Memórias. Lisboa: Fundação Calouste Gulbenkian.
Chalifour, C. L., & Powers, D. E. (1989). The relationship of content characteristics of GRE
analytical reasoning items to their difficulties and discriminations. Journal of
Educational Measurement, 26(2), 120-132.
Chudowsky, N., & Pellegrino, J. (2003). Large-Scale Assessments That Support Learning:
What Will It Take? Theory into Practice, 42(1).
Cizek, G. J. (1993). Reconsidering standards and criteria. Journal of Educational Measurement,
30(2), 93-106.
Cizek, G. J. (1996). Setting passing scores. Educational Measurement: Issues and Practice,
15(2), 20-31.
Cizek, G. J. (2001). More unintended consequences of high-stakes testing. Educational
Measurement: Issues and Practice, 20(4), 19-27.
Cizek, G. J. (2006). Standard Setting. In S. M. Downing & S. M. Haladyna (Eds.), Handbook of
Test Development. New York London: Routledge.
Cizek, G. J., & Bunch, M. B. (2007). Standard Setting. Thousand Oaks, London and New
Delhi: Sage Publications.
Cizek, G. J., & Fitzgerald, S. M. (1996). A comparison of group and independent standard
setting. Paper presented at the meeting of the American Educational Research
Association.
Cizek, G. J., & Husband, T. H. (1997). A Monte-Carlo investigations of the contrasting groups
standard-setting method. Paper presented at the meeting of the American Educational
Research Association.
Cohen, L., Manion, L., & Morrison, K. (2001). Research Methods in Education. London and
New York: RoutledgeFalmer.
Conceição, J. M., Neves, A., Campos, C., Fernandes, D., & Alaiz, V. (1994). Testes: objectivos
ou não objectivos, eis a questão! In IIE (Ed.), Pensar avaliação, melhorar a
aprendizagem. Lisboa: IIE.
Cronbach, L. J., & Meehl, P. E. (1955). Construct validity in psychological tests. Psychological
Bulletin, 52, 281-302.
DeMars, C. (2010). Item Response Theory. Oxford, New York.: Oxford University Press, Inc.
192
Denzin, N. K. (1978). The Research Act: a theorethical introduction to sociological methods (2ª
ed.). New York: McGraw-Hill.
Ding, L. (2007). Designing an Energy Assessment to Evaluate Student Understanding of Energy
Topics North Carolina State University Raleigh, North Carolina
Ding, L., Chabay, R., Sherwood, B., & Beichner, R. (2006). Evaluating an electricity and
magnetism assessment tool: Brief electricity and magnetism assessment. Physical
Review Special Topics - Physics Education Research, 2, 010105.
Doran, R. (1980). Basic measurement and evaluation of science instruction. Washington D.C.:
National Science Teachers Association.
Editores. (1977). Sobre problemas do ensino: 3. O acesso à Universidade. O Professor(17), 19.
Esteves, A. (1953). A propósito de exames. Labor, XVII(129), 374- 389.
Estrela, A., & Nóvoa, A. (1983). Avaliações em Educação: novas perspectivas. Porto: Porto
Editora.
Falk, B. (2000). The Heart of the Matter - Using Standards and Assessment to Learn.
Portsmouth, NH: Heinemann.
Farmer, E. (1928). Concerning subjective judgment of difficulty. British Journal of Psychology,
18, 438-442.
Fernandes, D. (2004). Avaliação das Aprendizagens: Uma Agenda, Muitos Desafios. Lisboa:
Texto Editora.
Fernandes, D. (2006). Para uma teoria da avaliação formativa. Revista Portuguesa de Educação,
19(2), 21-50.
Fernandes, D. (2007). A avaliação das aprendizagens no Sistema Educativo Português.
Educação e Pesquisa, São Paulo, 33(3), 581-600.
Fernandes, D. (2008). Para uma teoria da avaliação no domínio das aprendizagens. Estudos em
Avaliação Educacional, 19 (41), 347-372.
Fernandes, D. (2009). Learning Assessment in Portugal: Research and Activity Theory Sísifo.
Educational Sciences Journal(9), 87-98.
Ferro, M. d. R. N. (1970). Exames – alguns aspectos de crítica não completamente destrutiva.
Labor, XXXIV(285), 416-421.
Finn, C. E., Jr. (2004). Education in urban America. Hoover Instituiton weekley essays.
Retrieved from http://www.hoover.stanford.edu/pubaffairs/we/2004/finn02.html
Fischer, G. H. (1995). Derivations of the Rasch model. In G. Fischer & I. W. Molenaar (Eds.),
Rasch models: Foundations, recent developments, and applications (pp. 15-38). New
York: Springer.
Foster, M., & Masters, G. (2004). Bridging the conceptual gap between classroom assessment
and system accountability. In M. Wilson (Ed.), Towards coherence between classroom
assessment and accountability:103rd Yearbook of the National Society for the Study of
Education (Vol. 2, pp. 51-73). Chicago: University of Chicago Press.
Frederiksen, J. R., & White, B. Y. (1988). Implicit testing within an intelligent tutoring system.
Machine-Mediated Learning, 2, 351-372.

193
Freedle, R., & Kostin, I. (1993). The prediction of TOEFL reading comprehension item
difficulty for expository prose passages for three item types: main idea, inference, and
supporting ideas items. Princeton, N. J.: Educational Testing Service.
Freedle, R., & Kostin, I. (1996). The prediction of TOEFL listening comprehension item
difficulty for minitalk passages: Implications for construct validaty. Princeton, N. J.:
Educational Testing Service.
Freire, P. (1997). Pedagogia da Autonomia: Saberes necessários à prática educativa. São
Paulo: Paz e Terra.
Gipps, C., & Stobart, G. (2003). Alternative assessment. In T. Kellaghan & D. Stufflebeam
(Eds.), International handbook of educational evaluation (pp. 549-576). Dordrecht:
Kluwer.
Giraud, G., Impara, J. C., & Buckendahl, C. W. (2000). Making a cut in school districts:
Alternatives methods for setting cut-scores. Educational Assessment, 6, 291-304.
Giraud, G., Impara, J. C., & Plake, B. S. (2005). Research Articles: Teachers' Conceptions of
the Target Examinee in Angoff Standard Setting. Applied Measurement in Education,
18(3), 223 - 232.
Glaser, R., Lesgold, A., & Lajoie, S. (1987). Toward a cognitive theory for the measurement of
achievement. In R. Ronning, J. Glover, J. C. Conoley & J. Witt (Eds.), The influence of
cognitive psychology on testing and measurement: The Buros-Nebraska symposion on
measurement and testing (Vol. 3, pp. 41-85). Hillsdale, NJ: Erlbaum.
Grácio, R. (1996). Vol. II – Do Ensino Obra Completa. Lisboa: Fundação Calouste
Gulbenkian.
Green, K. (1983). Multiple-choice item difficulty: the effects of language and distracter set
similarity. Paper presented at the meeting of AERA, Montreal.
Greeno, J. G., Collins, A. M., & Resnick, L. B. (1997). Cognition and learning. In D. Berliner &
R. Calfee (Eds.), Handbook of educational psychology (pp. 15-47). New York: Simon
& Schuster Macmillan.
Guimarães, O. (1944). Exames. Boletim do Instituto de Orientação Profissional, Separata do
nº 5.
Haladyna, T. M. (2004). Developing and Validating Multiple-Choice Items. New Jersey:
Lawrence Erlbaum Associates, Publishers.
Hambleton, R. K., Jaeger, R. M., Plake, B. S., & Mills, C. (2000). Setting Performance
Standards on Complex Educational Assessments. Applied Psychological Measurement,
24, 355.
Hambleton, R. K., & Jirka, S. (2006). Anchor-Based Methods for Judgmentally Estimating Item
Statistics. In S. M. Downing & T. M. Haladyna (Eds.), Handbook of Test Development.
Mahwah, New Jersey: Lawrence Erlbaum Associates.
Hambleton, R. K., & Pitoniak, M. J. (2006). Setting Performance Standards. In R. L. Brennan
(Ed.), Educational Measurement (pp. 433-470). Westport, CT: ACE/Praeger.
Hambleton, R. K., & Plake, B. S. (1995). Using an Extended Angoff Procedure to Set Standards
on Complex Performance Assessments. Applied Measurement in Education, 8(1),
41-55.
194
Hestenes, D., Wells, M., & Swackhamer, G. (1992). Force concept inventory. The Physics
Teacher, 30, 141-151.
Heuvel-Panhuizen, M. V. (2001). A learning-teaching trajectory description as a hold for
mathematics teaching in primary schools in the Neederlands. Paper presented at the
Didactics of mathematics and informatics in education. 5th Panhellenic Conference
with International Participation, Thessaloniki.
Holland, P. W., & Dorans, N. J. (2006). Linking and Equating. In R. L. Brennan (Ed.),
Educational Measurement (pp. 187-220). Westport, CT: Praeger.
Horn, C., Ramos, M., Blumer, I., Madaus, G., Policy, N. B. o. E. T. a. P., S., P., et al. (2000).
Cut Scores: Results May Vary. NBETPP, 1(1), 1-32.
Impara, J. C., & Plake, B. S. (1997). Standard setting: An alternative approach. Journal of
Educational Measurement, 34(4), 353-366.
Impara, J. C., & Plake, B. S. (1998). Teachers’ ability to estimate item difficulty: A test
assumptions in the Angoff standard setting method. Journal of Educational
Measurement, 35(1), 69-81.
INE, & GEPE. (2009). 50 Years of Educational Statistics (Vol. 1). Lisboa.
Irwin, P., Buckendahl, C. W., & Poggio, A. (2007). Examinee-Centered Standard Setting: An
Alternative Approach. Paper presented at the Annual Meeting of the National Council
on Measurement in Education.
Jaeger, R. M. (1989). Certification of student competence. In R. Linn (Ed.), Educational
Measurement (pp. 485-514). Englewood Cliffs, N. J. : Prentice-Hall.
Jennison, B., & Ogborn, J. (Eds.). (1994). Wonder and delight, Essays in science education in
honour of the life and work of Eric Rogers 1902-1990. Bristol and Philadelphia:
Institute of Physics Publishing.
Jorge, H. (1996). A avaliação escolar. Evolução e descontinuidades desde 1836 até aos nossos
dias. Universidade de Lisboa, Lisboa.
Kane, M. (1994). Validating the performance standards associated with passing scores Review
of Educational Research, 64, 425-461.
Kane, M. (1995). Examinee-centered vs. task-centered standard setting. In the Proceedings of
the Joint Conference on Standard Setting in Large-Scale Assessments (Vol. 2, pp. 119-
139). Washington, DC: National Assessment Governing Board and National Center for
Education Statistics.
Kane, M. (1998). Choosing between examinee-centered and test-centered standard-setting
methods. Educacional Assessment, 5, 129-145.
Kane, M. (2006). Validation. In R. L. Brennan (Ed.), Educational Measurement (4th ed., pp. 17-
64). Westport, CT: American Council on Education/Praeger.
Kellaghan, T., & Madaus, G. (2003). External (public) examinations. In T. Kellaghan & D.
Stufflebeam (Eds.), International handbook of educational evaluation (pp. 577-602).
Dordrecht: Kluwer.
Kolb, D. A. (1984). The Process of Experiencial Learning. Englewood Cliffs, New Jersey:
Prentice-Hall, Inc.
195
Koretz, D. M., & Hamilton, L. S. (2006). Testing for Accountability in K-12. In R. L. Brennan
(Ed.), Educational Measurement. Westport, CT: Praeger.
Krathwohl, D. (2002). A Revision of Bloom’s Taxonomy: An Overview. Theory into Practice,
41(4), 212-218.
Krejcie, R. V., & Morgan, D. W. (1970). Determining sample size for research activities.
Educational and Psychological Measurement, 30, 607-610.
Leal, L. (1991). Evolução e Problemática do Sistema de Avaliação em Portugal. In H. M.
Guimarães, L. C. Leal & P. Abrantes (Eds.), Avaliação: uma questão a enfrentar.
Lisboa: APM.
Linn, R. L. (2006). The Standards for Educational and Psychological Testing: Guidance in Test
Development. In S. M. Downing & T. M. Haladyna (Eds.), Handbook of Test
Development (pp. 27-38). New York London: Routledge.
Livingston, S. A. (2006). Item Analysis. In S. M. D. T. M. Haladyna (Ed.), Handbook of Test
Development (pp. 421-441). Mahwah, NJ: Erlbaum.
Livingston, S. A., & Zieky, M. J. (1982). Passing Scores: A Manual for Setting Standards of
Performance on Educational and Occupational Tests. Princeton: N. J.: Educational
Testing Service.
Livingston, S. A., & Zieky, M. J. (1989). A comparative study of standard-setting methods.
Applied Measurement in Education, 2, 121-141.
Loomis, S. C., & Bourque, M. L. (2001). From tradition to innovation: Standard setting on the
National Assessment of Educational Progress. In G. J. Cizek (Ed.), Standard setting:
Concepts, methods ans perspectives (pp. 175-217). Mahwah, N. J.: Erlbaum.
Lord, F. M., & Novick, M. R. (1968). Statistical theories of mental test scores. Reading,
Massachusetts: Addison-Wesley Publishing Company, Inc.
Lorge, L., & Diamond, L. (1954). The value of information to good and poor judges of item
difficulty. Educational & Psychological Measurement, 14, 29-33.
Lorge, L., & Kruglov, L. (1952). A suggested technique for the improvement of difficulty
prediction of test items. Educational & Psychological Measurement, 14, 554-561.
M.E.N. (1943a). Série 11 - Recursos de alunos; Pasta 1915.
M.E.N. (1943b). Série 11 - Recursos de alunos; Pasta 2131.
Machado, F. A. (1994). A avaliação em tempo de mudança - Projectos e práticas nos ensinos
básico e secundário. Cadernos Correio Pedagógico, 28.
Martinho, C. A. L. (2009). Uma Abordagem Quantitativa Longitudinal do Desempenho dos
alunos no 12º Ano (2000-2005). Universidade Nova de Lisboa, Lisboa.
Martinho, C. A. L. (2009 ). Uma Abordagem Quantitativa Longitudinal do Desempenho dos
Alunos do 12 ano. UNL, Lisboa.
McDonnell, L. M. (2004). Politics, Persuasion and Educational Testing. Cambridge,
Massachusetts: Harvard University Press.

196
Meara, K., C., Hambleton, R. K., & Sireci, S. G. (2001). Setting and validating standards on
professional licensure and certification exams: A survey of current practices. CLEAR
Exam Reviews, 7(2), 17-23.
Mendes, M. M. C. (2004). As Faces de Janus. As Políticas Educativas em Matéria de
Cidadania nos Anos 90 em Portugal. Universidade Lusófona de Humanidades e
Tecnologias, Lisboa.
Messick, S. (1994). The interplay of evidence and consequences in the validation of
performance assessments. Educational Researcher, 23(2), 13-23.
Millman, J., & Greene, J. (1989). The specifications and development of tests of achievement
and ability. In R. L. Linn (Ed.), Educational Measurement (3rd ed., pp. 335-366). New
York: Macmillan.
Mills, C. (1995). Establishing passing standards. In J. C. Impara (Ed.), Licensure testing:
Purposes, procedures, and practices (pp. 219-252). Lincoln, NE: Buros Institute of
Mental Measurements.
Mills, C., & Melican, G. J. (1988). Comparative Review: Estimating and Adjusting Cutoff
Scores: Features of Selected Methods. Applied Measurement in Education, 1(3), 261 -
275.
Ministério da Educação Nacional. (1963). A elaboração de pontos das provas escritas de exames
liceais. Labor, XXVIII (225), 192-193.
Minstrell, J. (2000). Student thinking and related assement: Creating a facet assessment-based
learning enviroment. In J. Pellegrino, L. Jones & K. Mitchell (Eds.), Grading the
nation's report card: Research from the evaluation of NAEP (pp. 44-73). Washington,
DC: National Academy Press.
Miranda, M. J. C. (1980). A Docimologia em Perspectiva. UL, Lisboa.
Mislevy, R. (2006). Cognitive Psychology and Educational Assessment. In R. L. Brennan (Ed.),
Educational Measurement (4th ed., pp. 257-305). Westport, CT: ACE/Praeger.
Mislevy, R. (2008). Some Implications of Expertise Research for Educational Assessment.
Paper presented at the 34th International Association for Educational Assessment
(IAEA) Conference.
Mislevy, R., Behrens, J. T., Bennett, R. E., Demark, S. F., Frezzo, D. C., Levy, R., et al. (2007).
On the Roles of External Knowledge Representations in Assessment Design.
Mislevy, R., Wilson, M., Ercikan, K., & Chudowsky, N. (2003). Psychometric principles in
student assessment. In T. Kellaghan & D. Stufflebeam (Eds.), International handbook
of educational evaluation (pp. 489-532). Dordrecht: Kluwer.
Mónica, F. (1997). Os Filhos de Rousseau - ensaios sobre os exames. Lisboa: Relógio D’Água
Editores e autora.
Motta, A. A. R. d. (1944). O caso dos pontos. Liceus de Portugal(38), 99-100.
Nedelsky, L. (1954). Absolute grading standards for objective tests. Educational &
Psychological Measurement, 14, 3-19.
Neto, A. V. (2008). Currículo e cotidiano escolar: novos desafios. Paper presented at the
Simpósio Diálogo sobre Diálogos, Universidade Federal Fluminense (UFF), Brasil.
197
Norman, D. A. (1993). Things that make us smart. Boston: Addison-Wesley.
O'Connell, A. (2006). Logistic regression models for ordinal response variables. Thousand
Oaks, C.A.: Sage.
Ogborn, J. (2002). Physics Education for the Future. in Revitalising Physics Education.
International Journal of Science Education, 23(3), 212-214.
Ogborn, J. (2003, August). Forty Years of Curriculum Development. Paper presented at the
ESERA Conference, Noordwijkerhout, Netherlands.
Oliveira, L. (2004). Estudantes e Povo na Revolução. O Serviço Cívico Estudantil (1974-1977).
Oeiras: Celta Editora.
Oliveira, O. (1952). Hoje como ontem. Labor, XVI(118), 347- 354.
Orden, A. d. l., & Soler, A. G. (1982). Análisis de Las Pruebas Finales de E.G.B. Revista
Española de Pedagogía, 40(156), 7-40.
Osborne, J. (1990). Sacred cows in physics towards a redefinition of physics education. Physics
Education, 25, 189-196.
Pacheco, J. A. (1996). Currículo: Teoria e Práxis. Porto: Porto Editora.
Parameters, E. A. I. A. I. i. t. E. o. R. I. D., Mislevy, R. J., & Applied Psychological
Measurement, S. v. p.-. (1988). Exploiting Auxiliary Information About Items in the
Estimation of Rasch Item Difficulty Parameters. Applied Psychological Measurement,
12, 281-296.
Patrick, H. (1996). Comparing Public Examination Standards over Time. Paper presented at the
BERA Conference. Retrieved from
http://www.cambridgeassessment.org.uk/research/confproceedingsetc/BERA1996HP/fil
e
Pellegrino, J. (2006). Rethinking and Redesigning Curriculum, Instruction and Assessment:
What contemporary research and theory suggest. National Center of Education and the
Economy for New Commission on the Skills of the American Workforce,
Pellegrino, J. ( 1999). The Evolution of Educational Assessment: considering the past and
imagining the future. Princeton, New Jersey: Educational Testing Service.
Perline, R., Wright, B. D., & Wainer, H. (1979). The Rash model as additive conjoint
measurement. Applied Psychological Measurement, 3, 237-255.
Perrenoud, P. (1992). Les Procédures ordinaires d’évaluation, freins au changement des
pratiques pédagogiques. Paper presented at the Innover ETIOU évaluer, Université de
Neuchâtel.
Perrenoud, P. (1995). Ofício de aluno e sentido do trabalho escolar. Porto: Porto Editora.
Phelps, R. P. (2005). Defending Standardized Testing. Mahwah, New Jersey, London:
Lawrence Erbaum Associates Publishers.
Phillips, S. E. (1996). Legal defensibility of standards: Issues and policy perspectives.
Educational Measurement: Issues and Practice, 15(2), 5-13.
Plake, B. S. (1998). Setting performance standards for professional licensure and certification.
Applied Measurement in Education, 11, 65-80.
198
Planchard, E. (1945). Exames escolares e o seu valor de selecção. Separata da Revista Brotéria,
XL.
Popham, W. J. (1984). Specifying the domain of content behaviors. In R. A. Berk (Ed.), A guide
to criterion-referenced test construction. Baltimore: John Hopkins University Press.
Popham, W. J. (2001). Truth about Testing _ an educator’s call to action. Alexandria, Virgínia,
USA: Association for Supervision and Curriculum Development.
Popham, W. J. (2004). All about accountability: Tawdry tests and AYP. Educational
Leadership, 62(2), 85-86.
Popper, K. (1992). Em busca de um mundo melhor. Paper presented at the Conferência "A
lógica das ciências sociais", Lisboa.
Poteat, G. M., Wuensch, K. L., & Gregg, N. B. (1988). An investigation of differential
prediction with the WISC-R. Journal of School Psychology, 26, 59-68.
Potthoff, R. F. (1966). Statistical aspects of the problem of biases in psychological tests. In C.
Hill (Ed.), Institute of Statistics Mimeo (Vol. Series No. 479): University of North
Carolina, Department of Statistics.
Rasch, G. (1977). On specific objectivity: An attempt at formalinzing the request for generality
and validity of scientific statements. Danish Yearbook of Philosophy, 14, 58-94.
Reckase, M. D., & Bay, L. (1999). Comparing two methods for collecting test-based judgments.
Paper presented at the meeting of the National Council on Measurement in Education.
Redacção. (1977). Ano Propedêutico: a Universidade segue dentro de momentos. O Jornal da
Educação, I(7), 10-11.
Redacção. (1978). Propedêutico em 1977/1978: um acto precipitado. O Jornal da Educação,
1(18), 10.
Report, E. R. (2007). Science Education Now: A Renewed Pedagogy for the Future of Europe.
Resnick, L. B., & Resnick, D. P. (1989). Assessing the thinking curriculum: New tolls for
educational reform. Prepared for the National Commission on Testing and Public
Policy. Unpublished manuscript. . Learning Research and Development Center,
University of Pittsburgh, & Department of History, Carnegie-Mellon University,.
Rodrigues, R. (1978). Exames: dores de cabeça aos milhares. O Jornal da Educação, II(14), 8.
Rogers, E. (1960). Teaching Physics for the Inquiring Mind: Princeton University Press.
Rosado, P. G. (1982). Acabar com os exames é uma questão de com senso. O Jornal da
Educação, VI (59), 3-4.
Rumelhart, D. A. (1980). Schemata: The building blocks of cognition. In R. Spiro, B. Bruce &
W. Brewer (Eds.), Theoretical issues in reading comprehension (pp. 33-58). Hillsdale,
NJ: Erlbaum.
Rupp, A. A., Garcia, P., & Jamieson, J. (2001). Combining multiple regression and CART to
understand item difficulty in second language reading and listening comprehension test
items. International Journal of Testing, 1, 185-216.
Ryan, J. J. (1968). Teacher judgment of test item properties. Journal of Educational
Measurement, 5, 301-306.
199
Sampaio, J. S. (1982). Exames e avaliação- algumas reflexões. O Professor(47), 5-10.
Schmoker, M. J. (2006). Results now : how we can achieve unprecedented improvements in
teaching
and learning. Alexandria, VA: Association for Supervision and Curriculum Development.
Shepard, L. (2006). Classroom assessment. In R. L. Brennan (Ed.), Educational Measurement.
Westport, CT: ACE/Praeger.
Shulman, L. S. (1988). Disciplines of Inquiry in Education: An Overview. In R. M. Jaeger
(Ed.), Complementary Methods for Research in Education. Washington, DC: AERA.
Silva, M. C. (2008a). Análise da Evolução dos Currículos nos Exames Nacionais de Físico-
Química entre 1952-2005. Paper presented at the Congresso Luso-Brasileiro da História
da Educação.
Silva, M. C. (2008b). Standards at Physics-Chemistry Exams in Portugal: 1972 and 2006.
Paper presented at the First ISA Forum of Sociology.
Silva, M. C. (2009a). Comparando Dois Métodos: Angoff Modificado e Grupos Distintos. Paper
presented at the X Congresso Internacional Galego-Português de Psicopedagogia.
Silva, M. C. (2009b). Standards: Aplicação do Método de Grupos Distintos no Exame Nacional
de Química-2004 Paper presented at the X Congresso da Sociedade Portuguesa de
Ciências da Educação.
Sireci, S. G., Rizavi, S. M., Dillingham, A., & Rodriguez, G. (1999). Setting performance
standards on the ACCUPLACER Elementary Algebra Test (Report nº 368). Amherst:
University of Massachusetts, Center for Educational Assessment Research
Smylie, M. (1999). Teacher Stress In a Time of Reform. In R. Vandenberghe & A. M.
Huberman (Eds.), Understanding and Preventing Teacher Burnout: Cambridge
University Press.
Soares, J. P. (1955). Considerações sobre problemas do ensino liceal (cont.). Labor, XX(151),
49-54.
Stöer, S. (1986). Educação e Mudança Social em Portugal. 1970-1980, uma Década de
Transição. Porto: Edições Afrontamento.
Stöer, S., & Magalhães, A. (1998). Orgulhosamente Filhos de Rousseau. Porto: Profedições
Tavares, G. (1945). << Post-Scriptum>> À margem das provas orais. Liceus de Portugal(45),
685-687.
Teixeira, J. A. (1951a). Comentando um esclarecimento. Labor, XVI(116), 223-230.
Teixeira, J. A. (1951b). De novo os programas. Labor, XV(114), 273-284.
Teixeira, J. A. (1951c). Programas e pontos de exame. Labor, XV(112), 115-120.
Telmo, I. M. C. (1978). Propedêutico: o absurdo e a angústia. O Jornal da Educação, II(17), 12-
13.
Teodoro, A., Teodoro, V. D., & Fernandes, G. (1984). Guia Pratico do Sistema Educativo.
Lisboa: Plátano Editora.

200
Teodoro, V., & Silva, M. C. (2010). Examining Physics Exams using Extended Angoff and
Contrasting Groups methods. Paper presented at the XVII ISA World Congress of
Sociology, Sociology on the Move.
Teodoro, V. D., Valadares, J. A., Matos, A., & Caldeira, C. (1998). Análise curricular da prova
e dos resultados da 1.ª chamada da 1.ª fase do exame nacional da disciplina de Física do
12.º ano (novos cursos), realizado em 1996 (Ponto 115).
Therer, J. (1999). Evaluer pour Evoluer- Eléments de docimologie. Retrieved from
http://www.ulg.ac.be/lem/documents/THERER1999EVALUER.pdf
Thorndike, R. L. (1982). Item and score conversion by pooled judgment. In P. W. Holland & D.
B. Rubin (Eds.), Test equating (pp. 309-317). New York: Academic Press.
Thorndike, R. L., & Hagen, E. P. (1977). Measurement and evaluation in psychology and
education (4th ed.). New York: Wiley.
Trindade, R. (1978). Computador “corrigiu” distorções. O Jornal da Educação, II(18), 10-11.
Valadares, J., & Graça, M. (1998). avaliando...para melhorar a aprendizagem. Lisboa: Plátano
Edições Técnicas.
Valente, G. (2011, 24/7/2011). Na Finlândia há exames e retenções, estúpida! Público.
Wiggins, G. P., & McTigh, J. (1998). Understanding by design. Alexandria, VA: Association
for Supervision and Curriculum Development.
Wiggins, G. P., & McTighe, J. (2005). Understanding by Design (2nd edition ed.). Alexandria,
VA: Association for Supervision and Curriculum Development.
Wilde, S. (1998). Testing and Standards - a Brief Encyclopedia. Portsmouth, NH: Heinemann.
Wright, B. D., & Linacre, J. M. (1989). Observations are always ordinal; measurements,
however, must be interval. Archives of Physical Medicine and Rehabilitation, 70, 857-
867.
Zieky, M. (2001). So much has changed: How the setting of cutscores has evolved since the
1980s. In C. J. Cizek (Ed.), Standard setting: Concepts, methods, and perspectives.
Mahwah, NJ: Erlbaum.
Zieky, M., Perie, M., & Livingston, S. (2008). Cutscores: A manual for setting performance
standards on educational and occupational tests. Princeton, NJ: Educational Testing
Service.
201
Index
Extended Angoff Method, 8, 10, 70, 71, 72,
79, 82, 83, 84, 85, 93, 96, 97, 98, 111,
151, 165, 166, 177, 181, 256
assessment, 6, 7, 10, 23, 34, 36, 37, 38, 39,
40, 41, 43, 46, 48, 64, 66, 67, 71, 72, 73,
74, 75, 76, 179, 180, 183, 184, 189, 190,
193, 196
Beuk Method, 8, 10, 71, 73, 79, 82, 84, 85,
93, 96, 110, 140, 141, 142, 143, 144,
145, 146, 147, 148, 149, 150, 165,
166, 181, 231
Chemistry, 2, 5, 6, 7, 10, 12, 13, 23, 25, 26,
47, 49, 50, 51, 52, 53, 54, 55, 56, 58, 59,
62, 64, 66, 72, 75, 78, 79, 84, 86, 87, 88,
89, 93, 94, 96, 97, 99, 100, 101, 102,
103, 104, 107, 109, 111, 122, 132, 133,
134, 135, 136, 137, 138, 139, 140, 141,
142, 143, 145, 146, 148, 149, 150, 158,
159, 160, 161, 163, 164, 165, 166, 176,
177, 179, 180, 182, 184, 207, 210, 215,
216, 217, 219, 220, 221, 222, 227, 231,
232, 233, 234, 235, 236, 237, 238, 239,
240, 249, 251, 253, 254, 255, 256, 314,
318, 324, 328, 336, 347, 355, 365, 379
Cognition, 7, 103, 104, 190
Competence, 5, 16, 17, 50, 68, 85, 191
Comprehensive Secondary Education, 3
Contrasting Groups Method, iv, vi, vii, ix,
xiv, xvii, 8, 70, 72, 79, 82, 83, 85, 89, 91,
92, 98, 110, 111, 141, 142, 143, 144,
145, 146, 147, 148, 149, 151, 165, 166,
181, 194, 195, 196, 197, 219
curriculum, 7
curricula, vi, xvi, 2, 3, 4, 5, 6, 7, 9, 24, 25,
27, 33, 39, 43, 47, 50, 51, 52, 53, 55,
56, 60, 66, 86, 94, 100, 101, 102, 112,
113, 144, 145, 146, 147, 148, 149,
177, 179, 181, 187, 195
cut score, 68, 69, 83, 85, 91, 92, 96, 98,
111, 115, 116, 117, 118, 119, 120, 121,
122, 123, 124, 125, 126, 127, 128, 129,
130, 131, 132, 133, 134, 135, 136, 137,
138, 139, 141, 142, 143, 144, 145, 146,
147, 148, 149, 152, 153, 155, 157, 158,
160, 162, 164, 165, 177
degree of difficullty, 2, 5, 6, 7, 50, 52, 64,
65, 66, 67, 68, 73, 76, 78, 79, 83, 84,
98, 99, 100, 103, 104, 127, 167, 168,
169, 170, 171, 172, 173, 174, 175,
176, 177
evaluation, 1, 6, 9, 12, 13, 22, 36, 38, 40,
50, 62, 63, 64, 66, 76, 77, 85, 110, 178,
181, 189, 190, 191, 193, 197
examinees, 1, 4, 5, 7, 9, 10, 14, 16, 20, 21,
29, 30, 32, 64, 65, 67, 69, 71, 72, 73, 74,
76, 78, 79, 81, 82, 83, 84, 85, 86, 87, 88,
89, 90, 91, 92, 93, 94, 95, 96, 97, 98, 99,
100, 104, 110, 111, 112, 113, 114, 115,
116, 117, 118, 119, 120,121, 122, 123,
124, 126, 127, 128, 129, 130, 132, 133,
134, 135, 136, 137, 138, 139, 141, 151,
152, 153, 154, 155, 156, 157, 158, 159,
160, 161, 162, 163, 164, 165, 166, 167,
168, 169, 170, 171, 173, 175, 176, 178,
202
181, 183, 184, 219, 256, 262, 272, 278,
285, 294, 300, 304, 310, 314, 318, 324,
328, 336, 347, 355, 365, 379
exams, 1, 2, 3, 4, 5, 6, 7, 8, 9, 10, 11, 12,
13, 14, 15, 16, 17, 18, 19, 20, 21, 22, 23,
24, 26, 27, 28, 29, 30, 31, 32, 33, 34, 35,
36, 37, 38, 39, 40, 41, 42, 44, 46, 47, 48,
49, 50, 51, 52, 53, 54, 56, 57, 58, 59, 61,
62, 63, 64, 66,67, 69, 71, 72, 76, 78, 79,
80, 81, 82, 84, 85, 86, 88, 89, 92, 93, 94,
95, 96, 99, 100, 101, 103, 108, 110, 112,
113, 116, 122, 130, 131, 140, 141, 142,
143, 144, 145, 146, 148, 149, 150, 165,
167, 171, 176, 177, 179, 180, 182, 183,
184, 192, 207, 209, 219, 220, 221, 222,
223, 224, 225, 226, 227, 228, 229, 230,
231, 232, 234, 236
items, 7, 50, 61, 64, 65, 66, 67, 68, 71, 76,
78, 79, 80, 81, 82, 83, 91, 93, 96, 97,
98, 99, 100, 103, 104, 105, 106, 107,
108, 109, 111, 122, 151, 152, 153,
154, 155, 156, 157, 158, 159, 160,
161, 162, 163, 164, 165, 166, 167,
168, 169, 170, 171, 172, 173, 174,
175, 176, 177, 184, 256, 261, 271,
277, 284, 293, 299, 303, 309, 313,
317, 323, 327, 335, 346, 354, 364,
378, 387
Item Response Theory, ix, 1, 64, 186, 189
legislation, v, 3, 8, 11, 12, 16, 18, 22, 23,
24, 36, 38, 42, 43, 47, 48, 93, 179, 184
logistic regression, 72, 92, 111, 153, 155,
157, 160, 162, 164, 165, 166
minimally competent examinee, 71, 73
passing score, 68, 69, 73, 140
performance, 2, 6, 7, 9, 10, 13, 22, 50, 56,
62, 65, 68, 69, 70, 71, 72, 73, 74, 75, 81,
83, 85, 91, 95, 96, 97, 98, 99, 109, 110,
111, 115, 116, 117, 150, 151, 154, 157,
159, 161, 163, 167, 171, 176, 178, 179,
180, 181, 183, 184, 191, 193, 194, 196,
197
Physics, 2, 3, 5, 6, 7, 10, 12, 13, 23, 25, 26,
35, 47, 49, 50, 51, 53, 54, 55, 56, 58, 59,
60, 61, 62, 64, 66, 72, 75, 76, 78, 79, 81,
84, 86, 87, 88, 89, 93, 94, 96, 97, 99,
100, 101, 102, 103, 104, 105, 108,111,
122, 123, 124, 125, 126, 127, 128, 129,
130, 131, 132, 133, 136, 139, 140, 141,
142, 143, 144, 145, 147, 149, 150, 151,
152, 154, 156, 157, 158, 165, 166, 171,
173, 176, 177, 179, 180, 181, 182, 184,
207, 210, 211, 213, 219, 220, 221, 222,
223, 224, 225, 226, 231, 232, 233, 234,
235, 236, 237, 238, 239, 240, 241, 243,
244, 245, 247, 256, 262, 272, 278, 285,
294, 300, 304, 310
Pires de Lima reform, 2, 12, 22, 23, 25, 50,
80, 115, 116, 207, 209
propaedeutic year, 4, 57, 58
Propaedeutic Year, ix, 5, 32, 33, 34, 35, 45,
47, 123
Psychometrics
psychometrics, 7
Reform of Veiga Simão, 3, 30
reliability, 69, 76, 97, 103, 180
Secondary School, ii, 12, 20, 48
standard setting methods, iv, 7, 8, 49, 69,
70, 82, 83, 84
Student Civic Service, 4, 30, 31, 32, 44, 47,
57
203
teaching-learning, 5, 6, 10, 59, 60, 61, 93,
95, 183
tests, 3, 4, 5, 13, 14, 15, 16, 17, 18, 19, 20,
21, 22, 23, 32, 48, 50, 52, 65, 67, 69, 70,
76, 80, 96, 122, 184, 188, 193, 195, 197,
209
validity, 67, 69, 140, 179, 188, 195

204
205
Appendix
Appendix 1 – Digital Exam Archive
When it came time to build the website two questions needed to be answered:
1. What is the best structure to make the information easily accessible?
2. Which software/programming language will be best to build the website?
To address the first question the website was structured to make the search as intuitive as
possible. The menu was organized by decades according to the type of exam and the Reforms of
the Educational System: 1931-1949; 1950-1959; 1960-1974; 1975-1979; 1980-1990; 1991-
2000; and 2001-2005. There is no explicit separation on the menu between the district level
exams and national exams before the Reform of Pires de Lima. That information is given on the
introduction, transcribed here:
“This website is meant to offer access to all the Physics and Chemistry exam sheets
from 1931 to 1949 at a district level, as well as all the national exams from 1950 to
2005. The research and scanning of these exams, which span over 50 years, was
only possible due to the much-appreciated help of several institutions as well as to
a number of Physics and Chemistry teachers.
This online digital archive is part of a study on Physics and Chemistry national
exams, by Cecília Silva, under the guidance of Professor Vítor D. Teodoro.”
To make the division clearer, the 1948 Physics and Chemistry 2nd
cycle National Exam (the
first of the previously mentioned reform, prior to 1950) in the 1950-1959 folder, as to avoid
confusion with the district level exams, since the transitional phase lasted until 1949.
Figure 13 shows the four-level structure of the website. In each terminal folder the
corresponding exam listing can be found, in PDF format, with a total of around 900 exams.
These exams are not attached to this thesis as the website www.examesfisicaquimica.org is
available online.
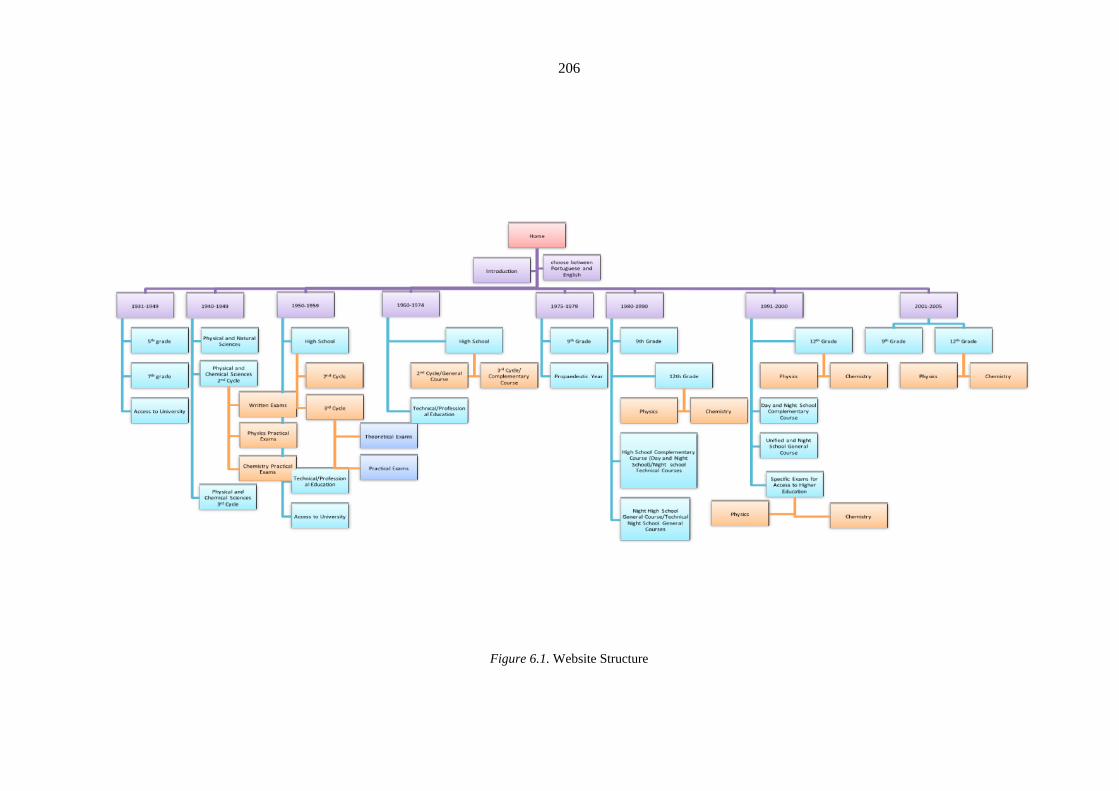
206
Figure 6.1. Website Structure
207
During the 1930s and 1940s the tests were answered on the question sheet. For this reason it
was chosen to present the whole exam with security restrictions and without the identification of
the author. Notes and commentaries (in Portuguese) were added to the exams as to make it
easier for interested parties to find them. When it was not possible to show the original exams,
the question sheets were transcribed from periodicals and magazines, citing the source. The
majority of question sheets were scanned using optical character recognition (OCR) software to
allow more functionality to the user. Some of the question sheets were damaged, making it
necessary to use colour scanning to facilitate their viewing, leading to a slower download.
Building the website required the professional collaboration of designer Sónia Teixeira. The
requirements were: an accessible website, with easy maintenance, which can be updated at any
time.
Softpress Freeway 5.5 Pro, a visual web design application for the Macintosh, was used to build
the website due to its simplicity and focus on design. The opening image shown is a composite
of exams prior to the Reform of Pires de Lima. CSS was used on the layout of the website to
define colours, styles, sizes, text and image position. The advantage of choosing CSS is that it
allows for a short download time and simultaneously for the website to be easily updated.
In addition, a PHP script was added to indicate the user’s position in the website map wherever
he or she may be, which makes the navigation effortless. PHP (recursive acronym for Hypertext
Preprocessor) is a computer programming language commonly used to generate quick dynamic,
simple and effective contents connected to databases. The programming of this language is done
on the server side, i.e. a web server interprets it before it reaches the browser. This dynamic
allows organizing, updating, and searching the exams more easily. In order for the website to
update its contents, i.e. automatically create a new exam listing, one simply needs to update the
information stored in the data bank. In short, the website is programmed to load the information
of the digital archive every time it is accessed. On the other hand, PHP is freeware, its source
code is freely available to all making it commonly used in such websites as Wikipedia.
The site is hosted on a European server for the next three years. However, the possibility of
migrating to a national server is not put aside, if financial support is made available.

208
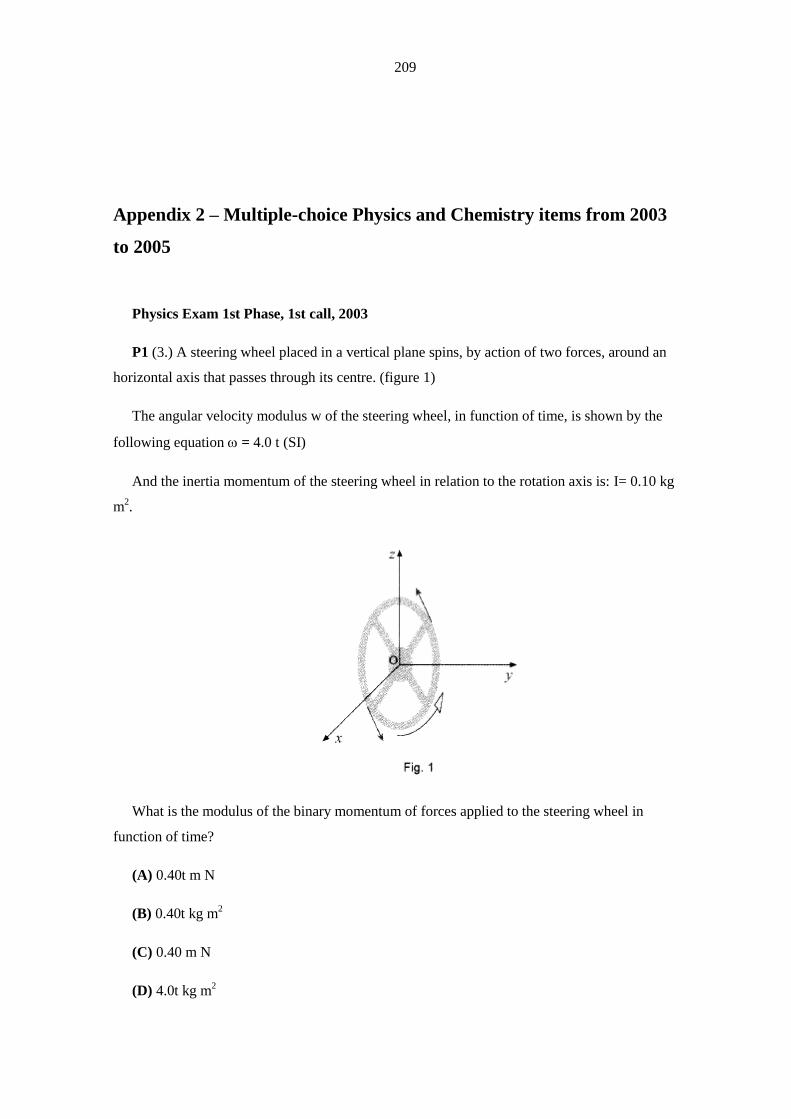
209
Appendix 2 – Multiple-choice Physics and Chemistry items from 2003
to 2005
Physics Exam 1st Phase, 1st call, 2003
P1 (3.) A steering wheel placed in a vertical plane spins, by action of two forces, around an
horizontal axis that passes through its centre. (figure 1)
The angular velocity modulus w of the steering wheel, in function of time, is shown by the
following equation = 4.0 t (SI)
And the inertia momentum of the steering wheel in relation to the rotation axis is: I= 0.10 kg
m2.
What is the modulus of the binary momentum of forces applied to the steering wheel in
function of time?
(A) 0.40t m N
(B) 0.40t kg m2
(C) 0.40 m N
(D) 4.0t kg m2
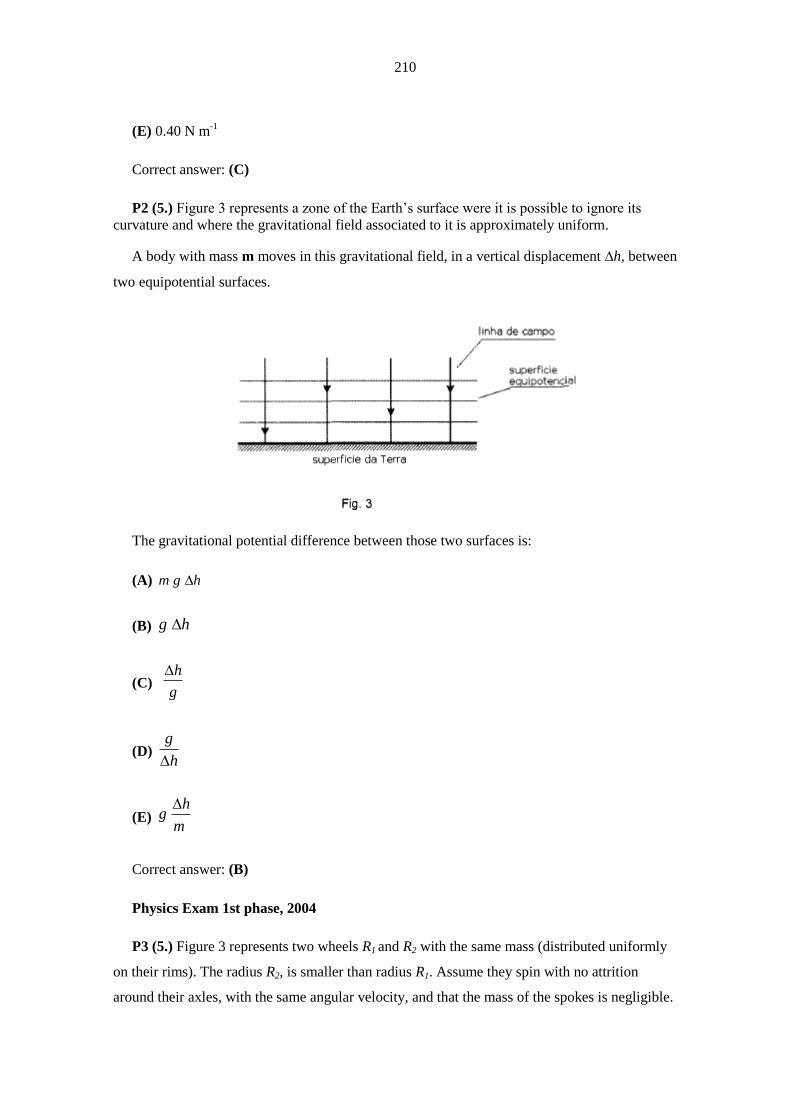
210
(E) 0.40 N m-1
Correct answer: (C)
P2 (5.) Figure 3 represents a zone of the Earth’s surface were it is possible to ignore its
curvature and where the gravitational field associated to it is approximately uniform.
A body with mass m moves in this gravitational field, in a vertical displacement h, between
two equipotential surfaces.
The gravitational potential difference between those two surfaces is:
(A) m g h
(B) g h
(C) h
g
(D) g
h
(E) h
gm
Correct answer: (B)
Physics Exam 1st phase, 2004
P3 (5.) Figure 3 represents two wheels R1 and R2 with the same mass (distributed uniformly
on their rims). The radius R2, is smaller than radius R1. Assume they spin with no attrition
around their axles, with the same angular velocity, and that the mass of the spokes is negligible.
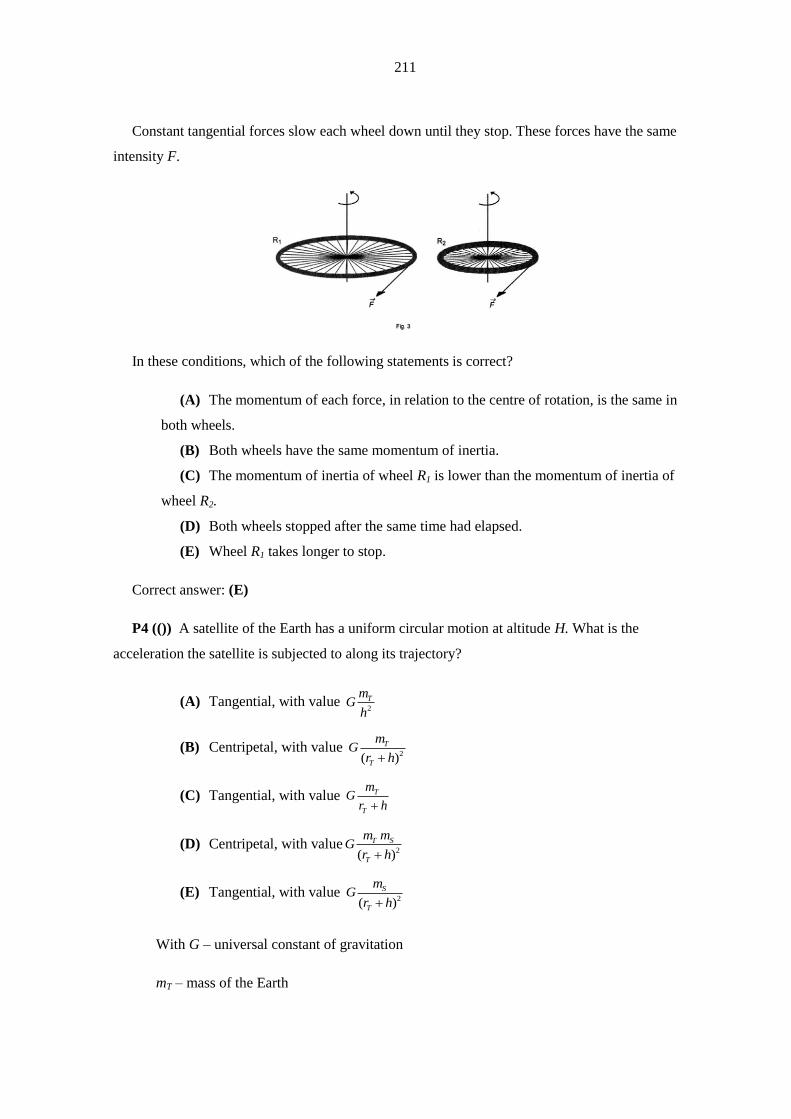
211
Constant tangential forces slow each wheel down until they stop. These forces have the same
intensity F.
In these conditions, which of the following statements is correct?
(A) The momentum of each force, in relation to the centre of rotation, is the same in
both wheels.
(B) Both wheels have the same momentum of inertia.
(C) The momentum of inertia of wheel R1 is lower than the momentum of inertia of
wheel R2.
(D) Both wheels stopped after the same time had elapsed.
(E) Wheel R1 takes longer to stop.
Correct answer: (E)
P4 (()) A satellite of the Earth has a uniform circular motion at altitude H. What is the
acceleration the satellite is subjected to along its trajectory?
(A) Tangential, with value 2
TmG
h
(B) Centripetal, with value 2( )
T
T
mG
r h
(C) Tangential, with value T
T
mG
r h
(D) Centripetal, with value2( )
T S
T
m mG
r h
(E) Tangential, with value 2( )
S
T
mG
r h
With G – universal constant of gravitation
mT – mass of the Earth
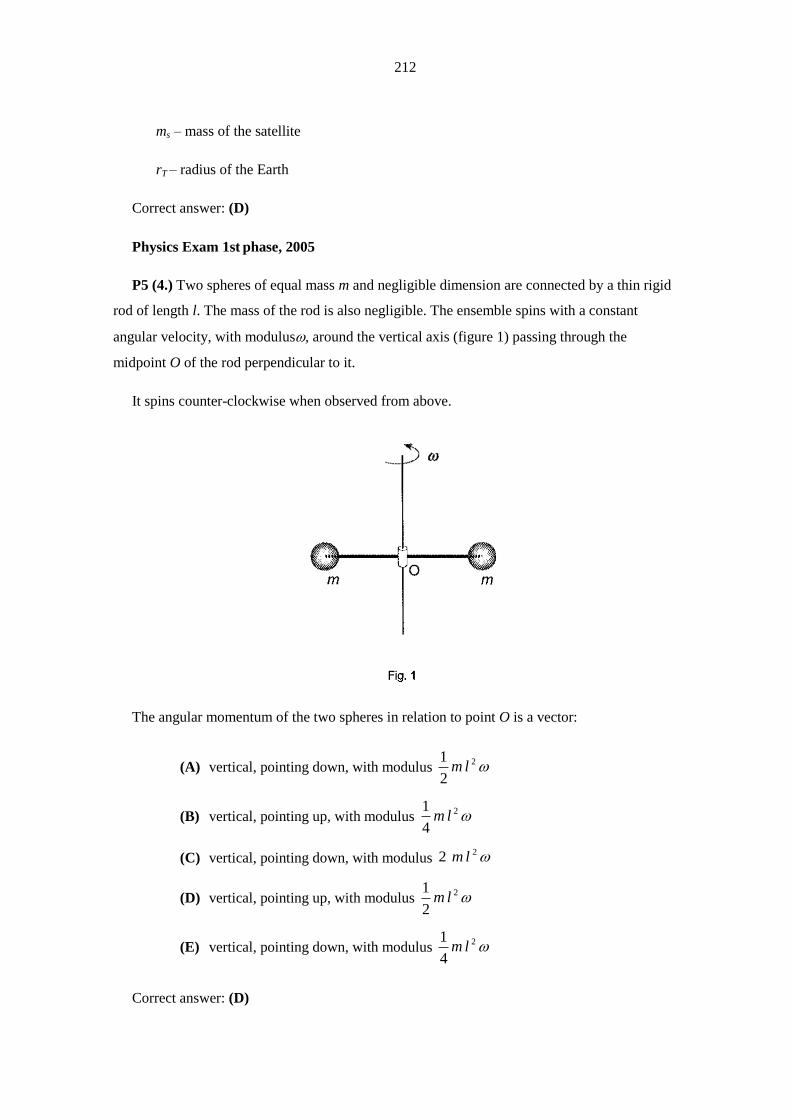
212
ms – mass of the satellite
rT – radius of the Earth
Correct answer: (D)
Physics Exam 1st phase, 2005
P5 (4.) Two spheres of equal mass m and negligible dimension are connected by a thin rigid
rod of length l. The mass of the rod is also negligible. The ensemble spins with a constant
angular velocity, with modulus, around the vertical axis (figure 1) passing through the
midpoint O of the rod perpendicular to it.
It spins counter-clockwise when observed from above.
The angular momentum of the two spheres in relation to point O is a vector:
(A) vertical, pointing down, with modulus 2
2
1lm
(B) vertical, pointing up, with modulus 2
4
1lm
(C) vertical, pointing down, with modulus 22 lm
(D) vertical, pointing up, with modulus 2
2
1lm
(E) vertical, pointing down, with modulus 2
4
1lm
Correct answer: (D)
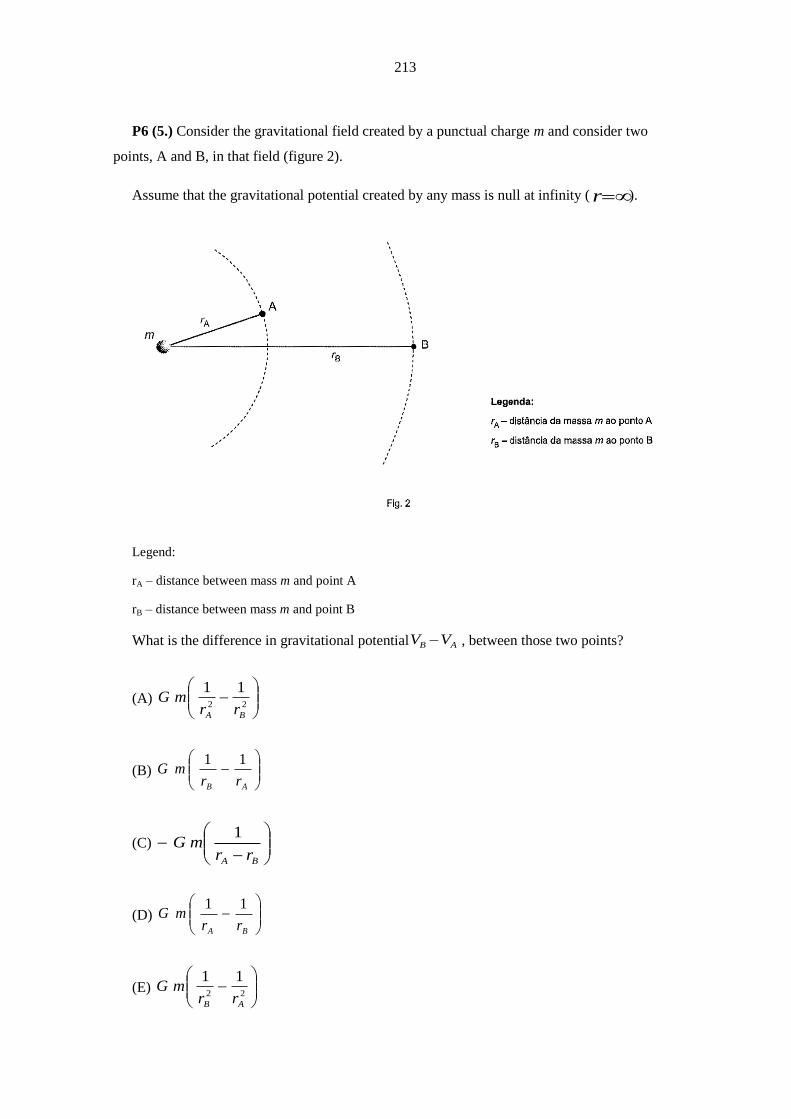
213
P6 (5.) Consider the gravitational field created by a punctual charge m and consider two
points, A and B, in that field (figure 2).
Assume that the gravitational potential created by any mass is null at infinity ( r ).
Legend:
rA – distance between mass m and point A
rB – distance between mass m and point B
What is the difference in gravitational potential AB VV , between those two points?
(A)
22
11
BA rrmG
(B)
AB rrmG
11
(C)
BA rrmG
1
(D)
BA rrmG
11
(E)
22
11
AB rrmG
214
Correct answer: (D)
Chemistry Exam 1st phase, 1st call, 2003
C1 (4.) A container with a fixed capacity contains a mix of 11.0 g of carbon dioxide, CO2(g),
and 7.00 g of nitrogen, N2(g), at a pressure of 1.0 atm.
8.00 g of oxygen, O2(g), are added with no change in temperature.
Assuming that there is no chemical reaction between the three gases at the given
temperature, select the true statement.
(A) The mole fraction of carbon dioxide in the final mix is 11
26 .
(B) By adding oxygen, the partial pressure of nitrogen decreases.
(C) The final total pressure of the mix is 1.5 atm.
(D) In the initial mix the partial pressure of nitrogen is lower than the partial pressure of
carbon dioxide.
(E) In the final mix, the gas found in the least quantity (expressed in mol) is nitrogen.
M(N2) = 28.0 g mol–1
M(O2) = 32.0 g mol–1
M(CO2) = 44.0 g mol–1
Correct answer: (C)
C2 (()) For the most part, chemical reactions are accompanied by variation in energy and
entropy.
These variations depend on the reaction system and on the conditions it is subject to.
Select the true statement.
(A) In any chemical reaction in a closed system, the system entropy increases.
(B) In any chemical reaction in an isolated system, the temperature is constant.
(C) In a closed system, an endothermic reaction can only be spontaneous if the entropy of
the exterior increases.
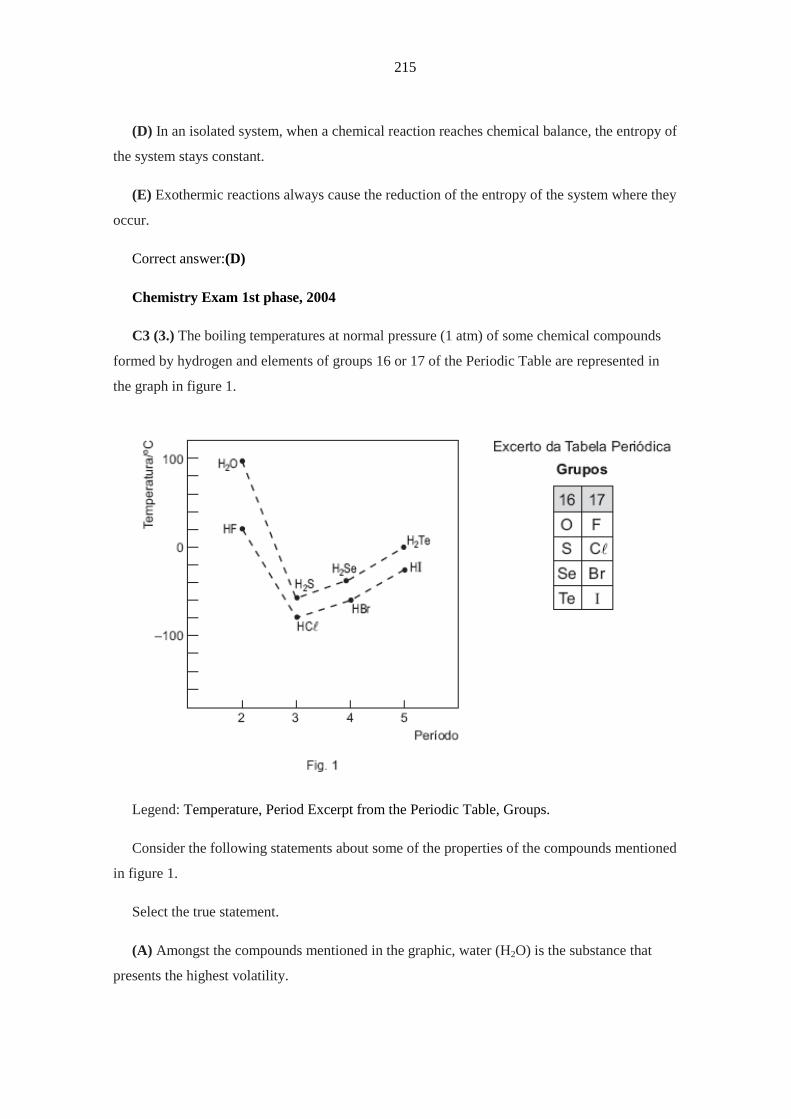
215
(D) In an isolated system, when a chemical reaction reaches chemical balance, the entropy of
the system stays constant.
(E) Exothermic reactions always cause the reduction of the entropy of the system where they
occur.
Correct answer:(D)
Chemistry Exam 1st phase, 2004
C3 (3.) The boiling temperatures at normal pressure (1 atm) of some chemical compounds
formed by hydrogen and elements of groups 16 or 17 of the Periodic Table are represented in
the graph in figure 1.
Legend: Temperature, Period Excerpt from the Periodic Table, Groups.
Consider the following statements about some of the properties of the compounds mentioned
in figure 1.
Select the true statement.
(A) Amongst the compounds mentioned in the graphic, water (H2O) is the substance that
presents the highest volatility.
216
(B) The H2O and HF compounds have much higher boiling temperatures than the other
compounds due to the existence of very intense London dispersion forces between their
molecules.
(C) The increase in boiling temperature in the HCl, HBr, and HI sequence is due to the
variation of the permanent dipole of the respective molecules.
(D) The difference between the boiling points of H2O and HF is due to the difference in the
electronegativity values presented by the oxygen and fluorine atoms.
(E) At a pressure of 1 atm and at a temperature of 25 ºC, not all the mentioned compounds
present themselves in liquid state.
Correct answer: (E)
C4 (()) Chemical reactions are, generally, accompanied by variation of the internal energy
(U) and entropy (S). Select the true statement.
(A) An exoenergetic reaction is always exothermic.
(B) When there is a transformation in an isolated system, ∆S< 0.
(C) In an isolated system there is no temperature variation due to chemical transformations.
(D) In a closed system, the temperature increases due to an exothermic reaction is
accompanied by a decrease in external temperature.
(E) An endothermic reaction happening in a closed system with a decrease in volume
presents ∆U> 0.
Correct answer: (E)
Chemistry Exam 1st phase, 2005
C5 (2.) Regarding the behaviour of ideal gases, select the true statement.
(A) For any ideal gas, the value of the constant (R) in the equation PV = nRT, does not
depend of the units of pressure (P) or volume (V).
(B) Keeping the volume constant, the pressure of a sample of an ideal gas is directly
proportional to the temperature in Celsius.

217
(C) Keeping the temperature constant, the volume of a sample of ideal gas is directly
proportional to the gas quantity (n) in the sample, whatever the pressure of the gas may be.
(D) Keeping the pressure and temperature constant, the volume of a sample of ideal gas is
directly proportional to the gas quantity (n) in the sample.
(E) At the pressure of 1 atm, the volume occupied by 1 mol of any ideal gas is 22.4 dm3,
independently of the temperature of the sample.
Correct answer: (D)
C6 (()) Nitrogen monoxide (NO(g)) can be transformed into nitrogen dioxide (NO2(g))
according to the following chemical equation:
2 NO(g) + O2(g) 2 NO2(g) ΔH = –113 kJ
Considering the reaction at normal temperature and pressure, in a closed recipient with
variable capacity, select the correct statement.
(A) During the reaction there is no work produced.
(B) For each mole of NO2(g) formed the reaction system absorbs 113 kJ in the form of heat.
(C) During the reaction the external entropy decreases.
(D) During the reaction the entropy of the reaction system increases.
(E) For each mole of NO(g) used, 56.5 kJ are released as heat.
Correct answer: (E)

218
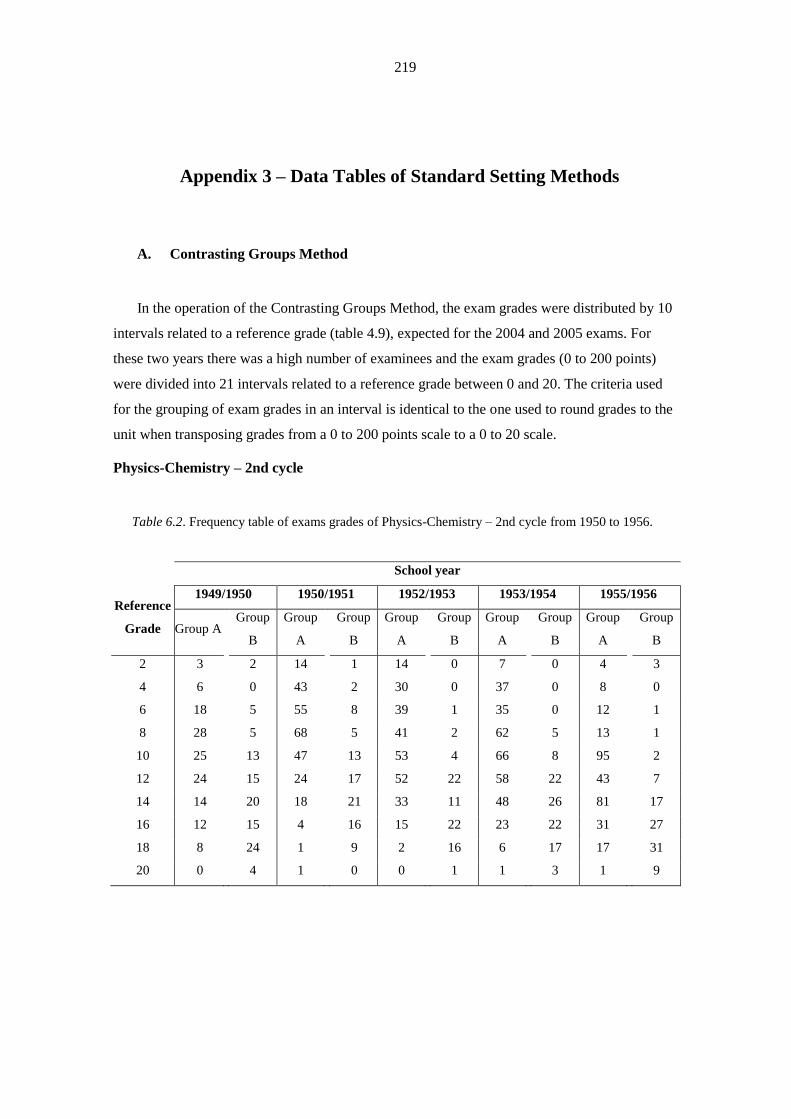
219
Appendix 3 – Data Tables of Standard Setting Methods
A. Contrasting Groups Method
In the operation of the Contrasting Groups Method, the exam grades were distributed by 10
intervals related to a reference grade (table 4.9), expected for the 2004 and 2005 exams. For
these two years there was a high number of examinees and the exam grades (0 to 200 points)
were divided into 21 intervals related to a reference grade between 0 and 20. The criteria used
for the grouping of exam grades in an interval is identical to the one used to round grades to the
unit when transposing grades from a 0 to 200 points scale to a 0 to 20 scale.
Physics-Chemistry – 2nd cycle
Table 6.2. Frequency table of exams grades of Physics-Chemistry – 2nd cycle from 1950 to 1956.
School year
Reference
Grade
1949/1950 1950/1951 1952/1953 1953/1954 1955/1956
Group A Group
B
Group
A
Group
B
Group
A
Group
B
Group
A
Group
B
Group
A
Group
B
2 3 2 14 1 14 0 7 0 4 3
4 6 0 43 2 30 0 37 0 8 0
6 18 5 55 8 39 1 35 0 12 1
8 28 5 68 5 41 2 62 5 13 1
10 25 13 47 13 53 4 66 8 95 2
12 24 15 24 17 52 22 58 22 43 7
14 14 20 18 21 33 11 48 26 81 17
16 12 15 4 16 15 22 23 22 31 27
18 8 24 1 9 2 16 6 17 17 31
20 0 4 1 0 0 1 1 3 1 9
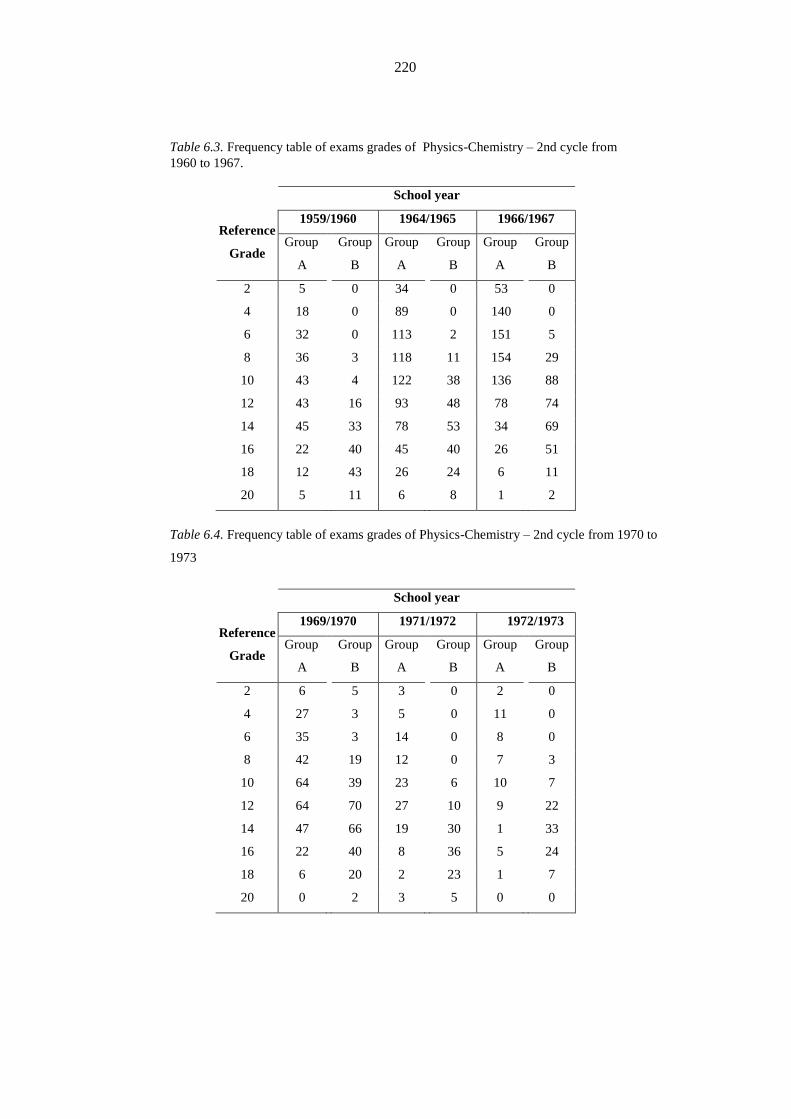
220
Table 6.3. Frequency table of exams grades of Physics-Chemistry – 2nd cycle from
1960 to 1967.
School year
Reference
Grade
1959/1960 1964/1965 1966/1967
Group
A
Group
B
Group
A
Group
B
Group
A
Group
B
2 5 0 34 0 53 0
4 18 0 89 0 140 0
6 32 0 113 2 151 5
8 36 3 118 11 154 29
10 43 4 122 38 136 88
12 43 16 93 48 78 74
14 45 33 78 53 34 69
16 22 40 45 40 26 51
18 12 43 26 24 6 11
20 5 11 6 8 1 2
Table 6.4. Frequency table of exams grades of Physics-Chemistry – 2nd cycle from 1970 to
1973
School year
Reference
Grade
1969/1970 1971/1972 1972/1973
Group
A
Group
B
Group
A
Group
B
Group
A
Group
B
2 6 5 3 0 2 0
4 27 3 5 0 11 0
6 35 3 14 0 8 0
8 42 19 12 0 7 3
10 64 39 23 6 10 7
12 64 70 27 10 9 22
14 47 66 19 30 1 33
16 22 40 8 36 5 24
18 6 20 2 23 1 7
20 0 2 3 5 0 0
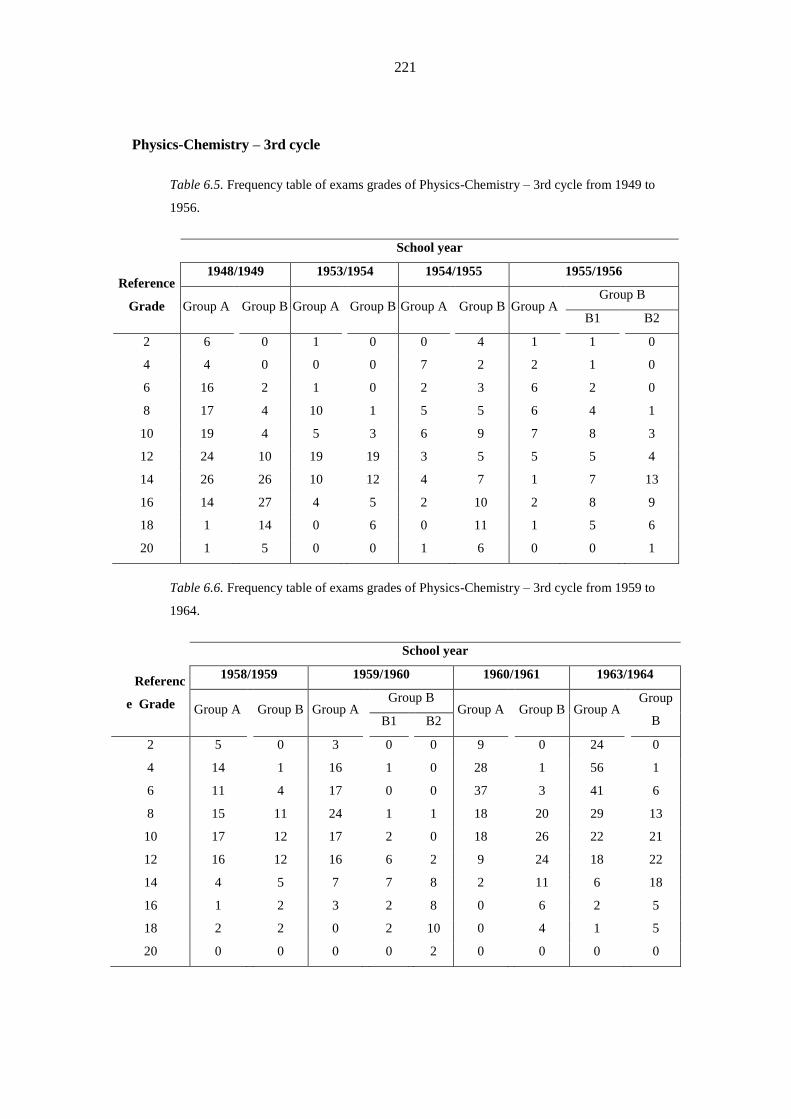
221
Physics-Chemistry – 3rd cycle
Table 6.5. Frequency table of exams grades of Physics-Chemistry – 3rd cycle from 1949 to
1956.
School year
Reference
Grade
1948/1949 1953/1954 1954/1955 1955/1956
Group A Group B Group A
Group B Group A
Group B Group A
Group B
B1 B2
2 6 0 1 0 0 4 1 1 0
4 4 0 0 0 7 2 2 1 0
6 16 2 1 0 2 3 6 2 0
8 17 4 10 1 5 5 6 4 1
10 19 4 5 3 6 9 7 8 3
12 24 10 19 19 3 5 5 5 4
14 26 26 10 12 4 7 1 7 13
16 14 27 4 5 2 10 2 8 9
18 1 14 0 6 0 11 1 5 6
20 1 5 0 0 1 6 0 0 1
Table 6.6. Frequency table of exams grades of Physics-Chemistry – 3rd cycle from 1959 to
1964.
Referenc
e Grade
School year
1958/1959 1959/1960 1960/1961 1963/1964
Group A
Group B Group A Group B
Group A
Group B Group A Group
B B1 B2
2 5 0 3 0 0 9 0 24 0
4 14 1 16 1 0 28 1 56 1
6 11 4 17 0 0 37 3 41 6
8 15 11 24 1 1 18 20 29 13
10 17 12 17 2 0 18 26 22 21
12 16 12 16 6 2 9 24 18 22
14 4 5 7 7 8 2 11 6 18
16 1 2 3 2 8 0 6 2 5
18 2 2 0 2 10 0 4 1 5
20 0 0 0 0 2 0 0 0 0
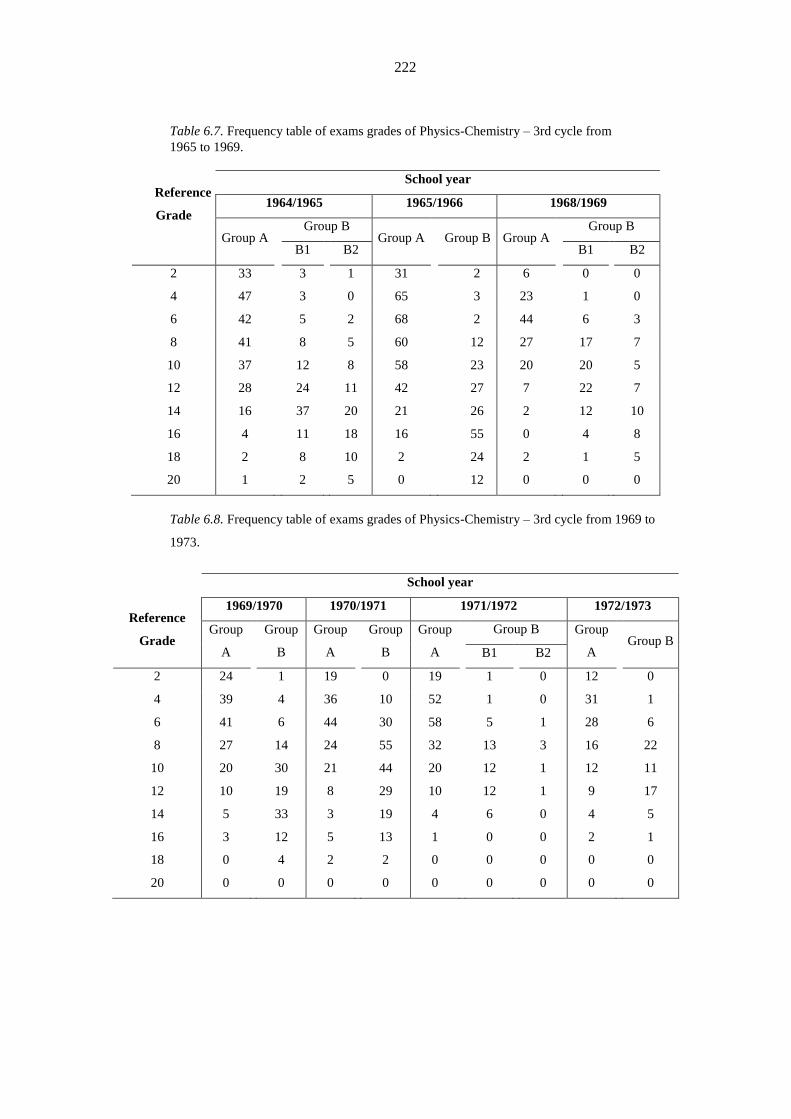
222
Table 6.7. Frequency table of exams grades of Physics-Chemistry – 3rd cycle from
1965 to 1969.
Reference
Grade
School year
1964/1965 1965/1966 1968/1969
Group A Group B
Group A
Group B Group A Group B
B1 B2 B1 B2
2 33 3 1 31 2 6 0 0
4 47 3 0 65 3 23 1 0
6 42 5 2 68 2 44 6 3
8 41 8 5 60 12 27 17 7
10 37 12 8 58 23 20 20 5
12 28 24 11 42 27 7 22 7
14 16 37 20 21 26 2 12 10
16 4 11 18 16 55 0 4 8
18 2 8 10 2 24 2 1 5
20 1 2 5 0 12 0 0 0
Table 6.8. Frequency table of exams grades of Physics-Chemistry – 3rd cycle from 1969 to
1973.
School year
Reference
Grade
1969/1970 1970/1971 1971/1972 1972/1973
Group
A
Group
B
Group
A
Group
B
Group
A
Group B Group
A
Group B
B1 B2
2 24 1 19 0 19 1 0 12 0
4 39 4 36 10 52 1 0 31 1
6 41 6 44 30 58 5 1 28 6
8 27 14 24 55 32 13 3 16 22
10 20 30 21 44 20 12 1 12 11
12 10 19 8 29 10 12 1 9 17
14 5 33 3 19 4 6 0 4 5
16 3 12 5 13 1 0 0 2 1
18 0 4 2 2 0 0 0 0 0
20 0 0 0 0 0 0 0 0 0
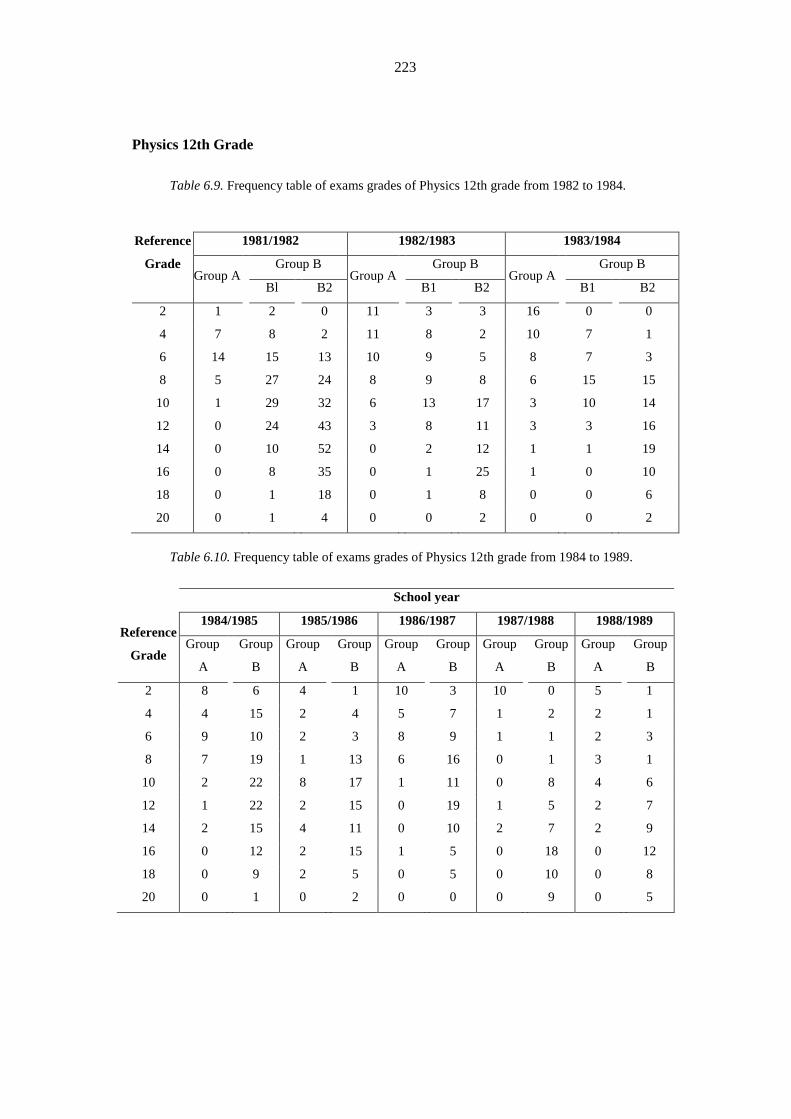
223
Physics 12th Grade
Table 6.9. Frequency table of exams grades of Physics 12th grade from 1982 to 1984.
Reference
Grade
1981/1982 1982/1983 1983/1984
Group A Group B
Group A Group B
Group A Group B
Bl B2 B1 B2 B1 B2
2 1 2 0 11 3 3 16 0 0
4 7 8 2 11 8 2 10 7 1
6 14 15 13 10 9 5 8 7 3
8 5 27 24 8 9 8 6 15 15
10 1 29 32 6 13 17 3 10 14
12 0 24 43 3 8 11 3 3 16
14 0 10 52 0 2 12 1 1 19
16 0 8 35 0 1 25 1 0 10
18 0 1 18 0 1 8 0 0 6
20 0 1 4 0 0 2 0 0 2
Table 6.10. Frequency table of exams grades of Physics 12th grade from 1984 to 1989.
School year
Reference
Grade
1984/1985 1985/1986 1986/1987 1987/1988 1988/1989
Group
A
Group
B
Group
A
Group
B
Group
A
Group
B
Group
A
Group
B
Group
A
Group
B
2 8 6 4 1 10 3 10 0 5 1
4 4 15 2 4 5 7 1 2 2 1
6 9 10 2 3 8 9 1 1 2 3
8 7 19 1 13 6 16 0 1 3 1
10 2 22 8 17 1 11 0 8 4 6
12 1 22 2 15 0 19 1 5 2 7
14 2 15 4 11 0 10 2 7 2 9
16 0 12 2 15 1 5 0 18 0 12
18 0 9 2 5 0 5 0 10 0 8
20 0 1 0 2 0 0 0 9 0 5

224
Table 6.11. Frequency table of exams grades of Physics 12th grade from 1990 to 1994.
School year
Reference
Grade
1989/1990 1990/1991 1991/1992 1992/1993 1993/1994
Group
A
Group
B
Group
A
Group
B
Group
A
Group
B
Group
A
Group
B
Group
A
Group
B
2 7 0 3 2 2 1 2 2 5 2
4 9 6 5 7 5 5 3 0 4 5
6 6 4 7 5 7 6 2 3 8 4
8 1 4 5 9 9 7 7 7 4 9
10 2 5 3 13 5 9 5 6 2 9
12 2 16 2 19 3 14 6 9 5 10
14 1 26 1 15 1 12 1 11 2 10
16 1 12 1 9 2 9 2 5 1 8
18 2 17 0 7 0 12 0 6 0 6
20 1 2 0 1 0 3 0 0 0 0
Table 6.12. Frequency table of exams grades of Physics 12th grade from 1995 to 1999.
School year
Reference
Grade
1994/1995 1995/1996 1996/1997 1997/1998 1998/1999
Group A Group
B
Group
A
Group
B
Group
A
Group
B
Group
A
Group
B
Group
A
Group
B
2 2 1 9 5 8 0 1 0 5 0
4 3 4 5 5 5 2 6 2 10 2
6 4 6 2 2 0 6 3 3 13 3
8 2 5 5 2 2 9 0 2 4 2
10 3 10 2 5 1 8 2 2 1 4
12 1 7 1 5 0 6 0 3 0 5
14 0 8 0 5 0 10 0 7 0 4
16 0 6 0 3 0 7 1 2 0 1
18 0 3 0 1 0 4 2 5 0 0
20 0 1 0 0 0 2 1 1 0 0
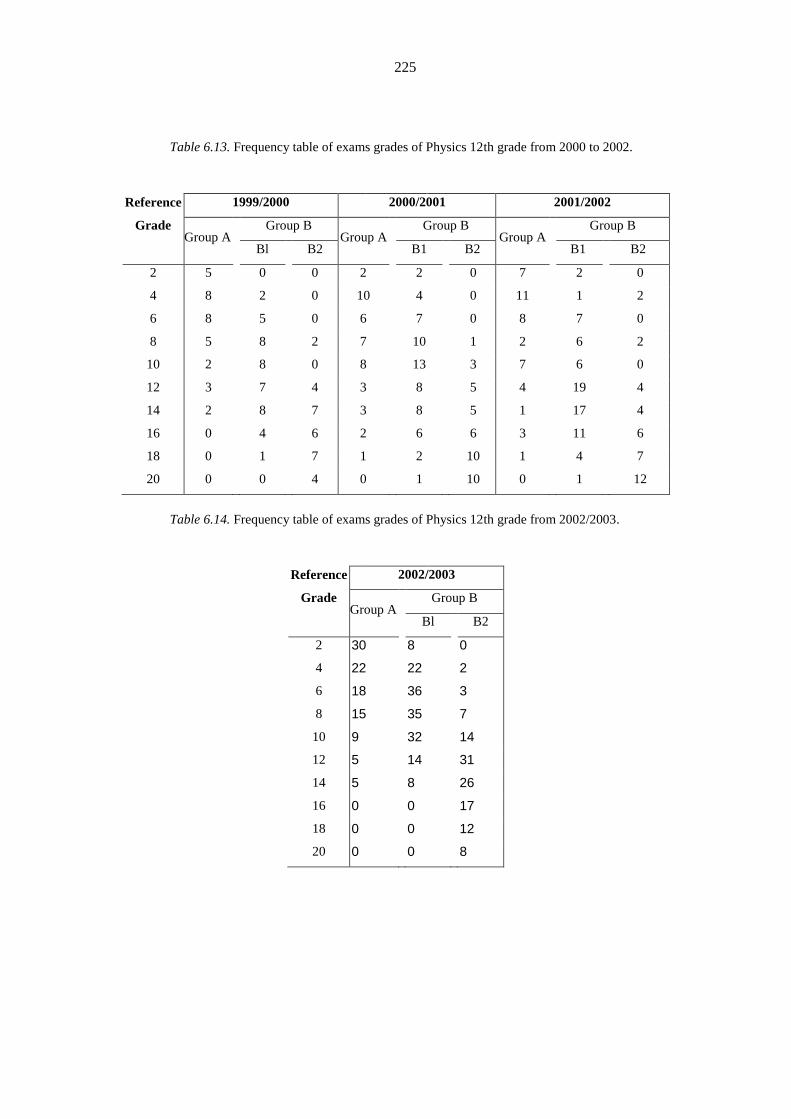
225
Table 6.13. Frequency table of exams grades of Physics 12th grade from 2000 to 2002.
Reference
Grade
1999/2000 2000/2001 2001/2002
Group A Group B
Group A Group B
Group A Group B
Bl B2 B1 B2 B1 B2
2 5 0 0 2 2 0 7 2 0
4 8 2 0 10 4 0 11 1 2
6 8 5 0 6 7 0 8 7 0
8 5 8 2 7 10 1 2 6 2
10 2 8 0 8 13 3 7 6 0
12 3 7 4 3 8 5 4 19 4
14 2 8 7 3 8 5 1 17 4
16 0 4 6 2 6 6 3 11 6
18 0 1 7 1 2 10 1 4 7
20 0 0 4 0 1 10 0 1 12
Table 6.14. Frequency table of exams grades of Physics 12th grade from 2002/2003.
Reference
Grade
2002/2003
Group A Group B
Bl B2
2 30 8 0
4 22 22 2
6 18 36 3
8 15 35 7
10 9 32 14
12 5 14 31
14 5 8 26
16 0 0 17
18 0 0 12
20 0 0 8
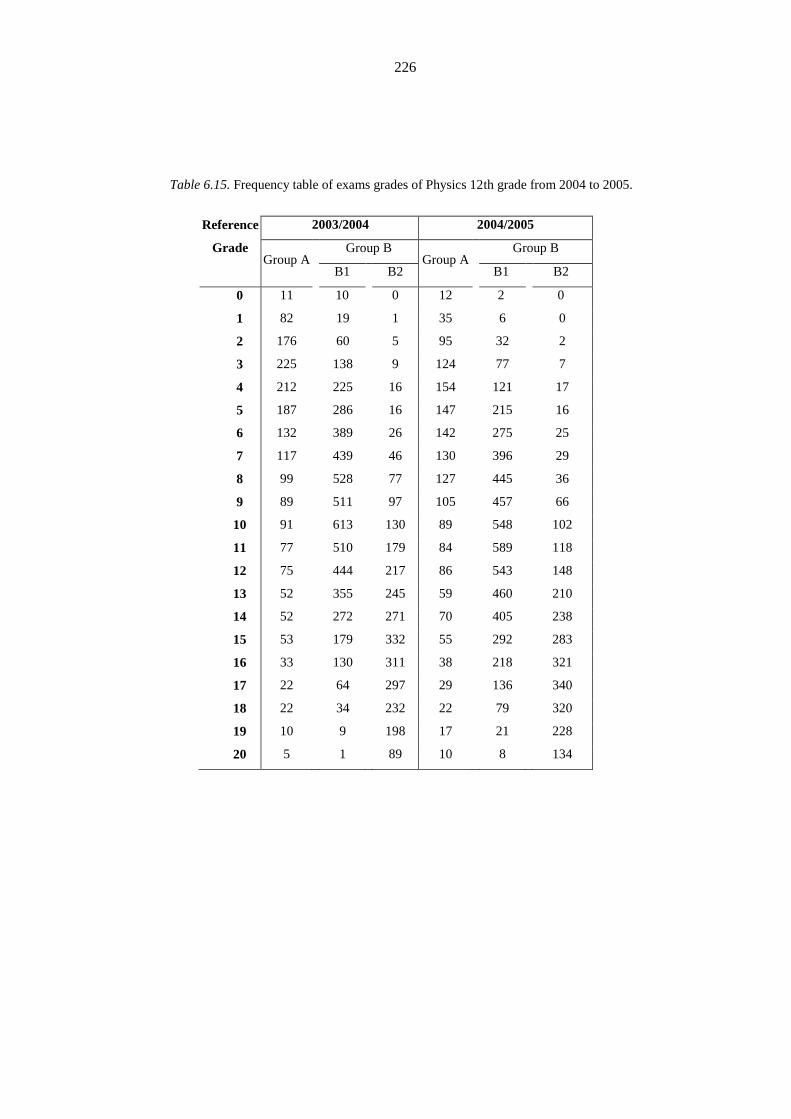
226
Table 6.15. Frequency table of exams grades of Physics 12th grade from 2004 to 2005.
Reference
Grade
2003/2004 2004/2005
Group A Group B
Group A Group B
B1 B2 B1 B2
0 11 10 0 12 2 0
1 82 19 1 35 6 0
2 176 60 5 95 32 2
3 225 138 9 124 77 7
4 212 225 16 154 121 17
5 187 286 16 147 215 16
6 132 389 26 142 275 25
7 117 439 46 130 396 29
8 99 528 77 127 445 36
9 89 511 97 105 457 66
10 91 613 130 89 548 102
11 77 510 179 84 589 118
12 75 444 217 86 543 148
13 52 355 245 59 460 210
14 52 272 271 70 405 238
15 53 179 332 55 292 283
16 33 130 311 38 218 321
17 22 64 297 29 136 340
18 22 34 232 22 79 320
19 10 9 198 17 21 228
20 5 1 89 10 8 134
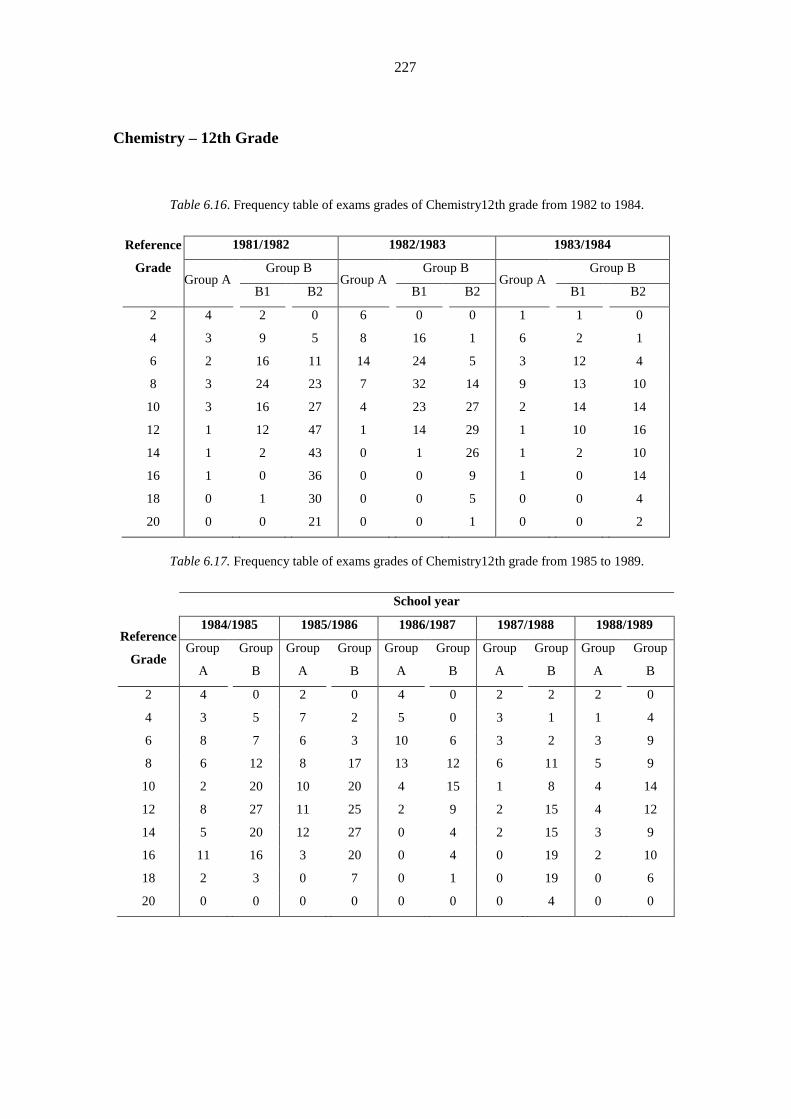
227
Chemistry – 12th Grade
Table 6.16. Frequency table of exams grades of Chemistry12th grade from 1982 to 1984.
Reference
Grade
1981/1982 1982/1983 1983/1984
Group A Group B
Group A Group B
Group A Group B
B1 B2 B1 B2 B1 B2
2 4 2 0 6 0 0 1 1 0
4 3 9 5 8 16 1 6 2 1
6 2 16 11 14 24 5 3 12 4
8 3 24 23 7 32 14 9 13 10
10 3 16 27 4 23 27 2 14 14
12 1 12 47 1 14 29 1 10 16
14 1 2 43 0 1 26 1 2 10
16 1 0 36 0 0 9 1 0 14
18 0 1 30 0 0 5 0 0 4
20 0 0 21 0 0 1 0 0 2
Table 6.17. Frequency table of exams grades of Chemistry12th grade from 1985 to 1989.
School year
Reference
Grade
1984/1985 1985/1986 1986/1987 1987/1988 1988/1989
Group
A
Group
B
Group
A
Group
B
Group
A
Group
B
Group
A
Group
B
Group
A
Group
B
2 4 0 2 0 4 0 2 2 2 0
4 3 5 7 2 5 0 3 1 1 4
6 8 7 6 3 10 6 3 2 3 9
8 6 12 8 17 13 12 6 11 5 9
10 2 20 10 20 4 15 1 8 4 14
12 8 27 11 25 2 9 2 15 4 12
14 5 20 12 27 0 4 2 15 3 9
16 11 16 3 20 0 4 0 19 2 10
18 2 3 0 7 0 1 0 19 0 6
20 0 0 0 0 0 0 0 4 0 0
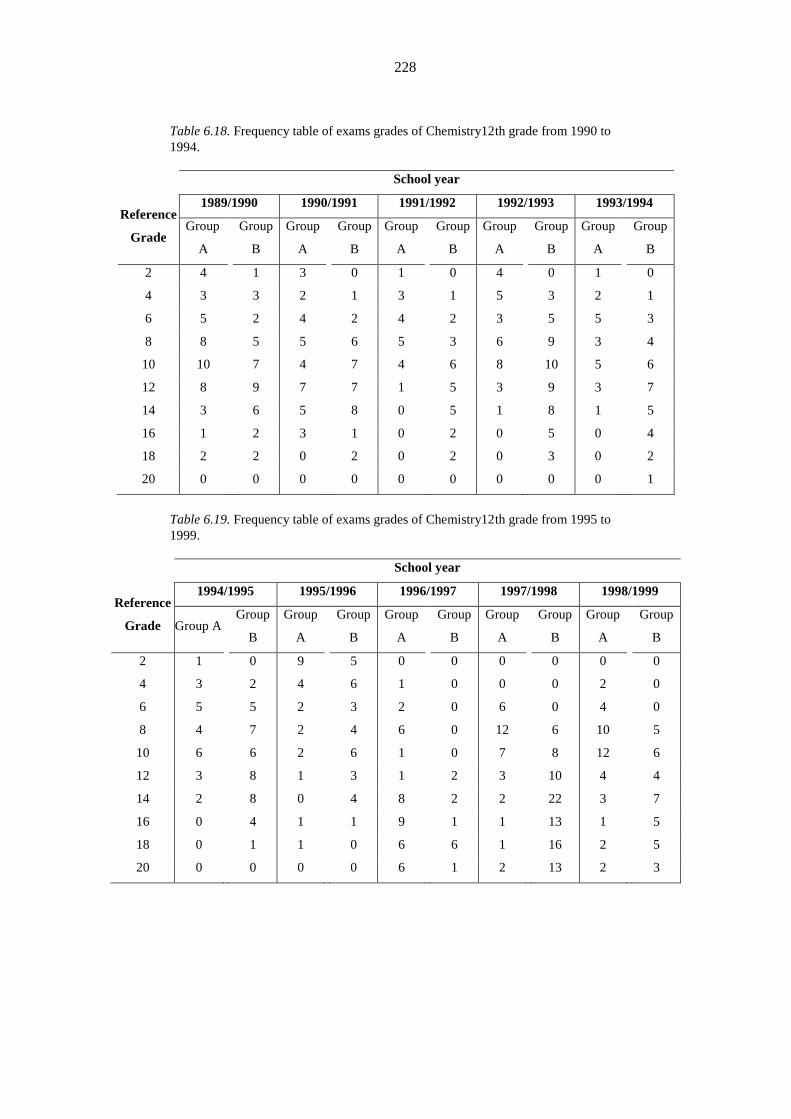
228
Table 6.18. Frequency table of exams grades of Chemistry12th grade from 1990 to
1994.
School year
Reference
Grade
1989/1990 1990/1991 1991/1992 1992/1993 1993/1994
Group
A
Group
B
Group
A
Group
B
Group
A
Group
B
Group
A
Group
B
Group
A
Group
B
2 4 1 3 0 1 0 4 0 1 0
4 3 3 2 1 3 1 5 3 2 1
6 5 2 4 2 4 2 3 5 5 3
8 8 5 5 6 5 3 6 9 3 4
10 10 7 4 7 4 6 8 10 5 6
12 8 9 7 7 1 5 3 9 3 7
14 3 6 5 8 0 5 1 8 1 5
16 1 2 3 1 0 2 0 5 0 4
18 2 2 0 2 0 2 0 3 0 2
20 0 0 0 0 0 0 0 0 0 1
Table 6.19. Frequency table of exams grades of Chemistry12th grade from 1995 to
1999.
School year
Reference
Grade
1994/1995 1995/1996 1996/1997 1997/1998 1998/1999
Group A Group
B
Group
A
Group
B
Group
A
Group
B
Group
A
Group
B
Group
A
Group
B
2 1 0 9 5 0 0 0 0 0 0
4 3 2 4 6 1 0 0 0 2 0
6 5 5 2 3 2 0 6 0 4 0
8 4 7 2 4 6 0 12 6 10 5
10 6 6 2 6 1 0 7 8 12 6
12 3 8 1 3 1 2 3 10 4 4
14 2 8 0 4 8 2 2 22 3 7
16 0 4 1 1 9 1 1 13 1 5
18 0 1 1 0 6 6 1 16 2 5
20 0 0 0 0 6 1 2 13 2 3
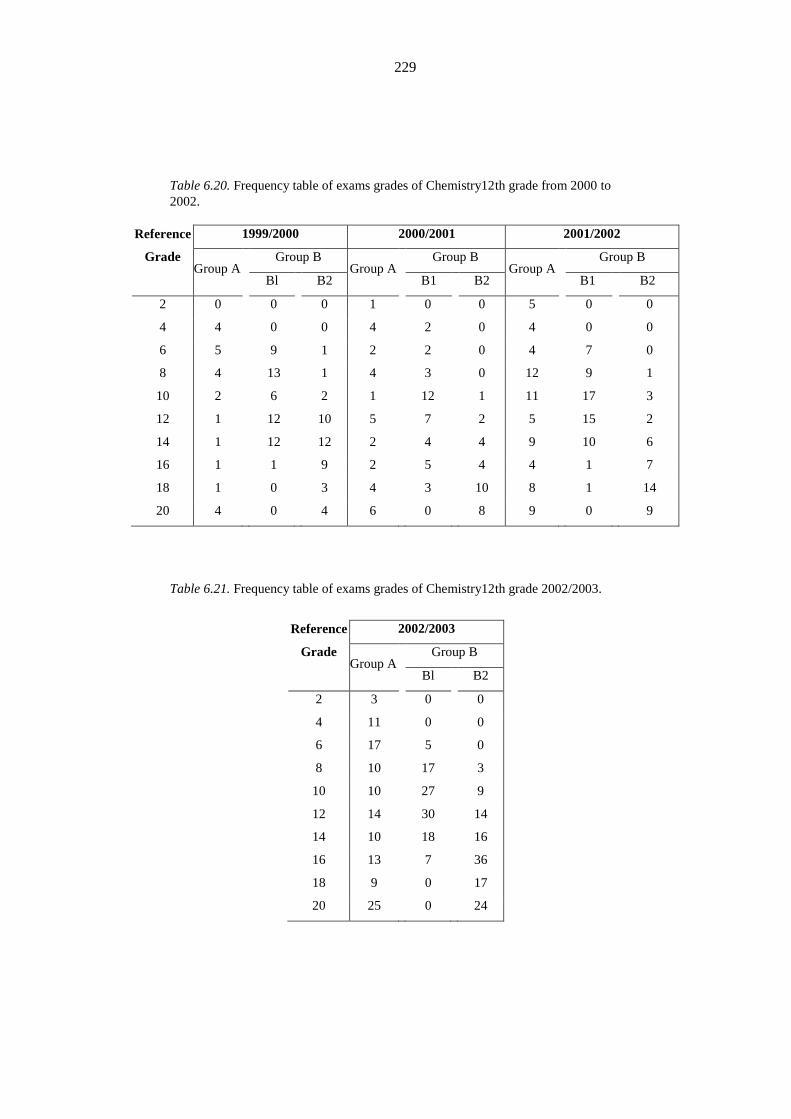
229
Table 6.20. Frequency table of exams grades of Chemistry12th grade from 2000 to
2002.
Reference
Grade
1999/2000 2000/2001 2001/2002
Group A Group B
Group A Group B
Group A Group B
Bl B2 B1 B2 B1 B2
2 0 0 0 1 0 0 5 0 0
4 4 0 0 4 2 0 4 0 0
6 5 9 1 2 2 0 4 7 0
8 4 13 1 4 3 0 12 9 1
10 2 6 2 1 12 1 11 17 3
12 1 12 10 5 7 2 5 15 2
14 1 12 12 2 4 4 9 10 6
16 1 1 9 2 5 4 4 1 7
18 1 0 3 4 3 10 8 1 14
20 4 0 4 6 0 8 9 0 9
Table 6.21. Frequency table of exams grades of Chemistry12th grade 2002/2003.
Reference
Grade
2002/2003
Group A Group B
Bl B2
2 3 0 0
4 11 0 0
6 17 5 0
8 10 17 3
10 10 27 9
12 14 30 14
14 10 18 16
16 13 7 36
18 9 0 17
20 25 0 24
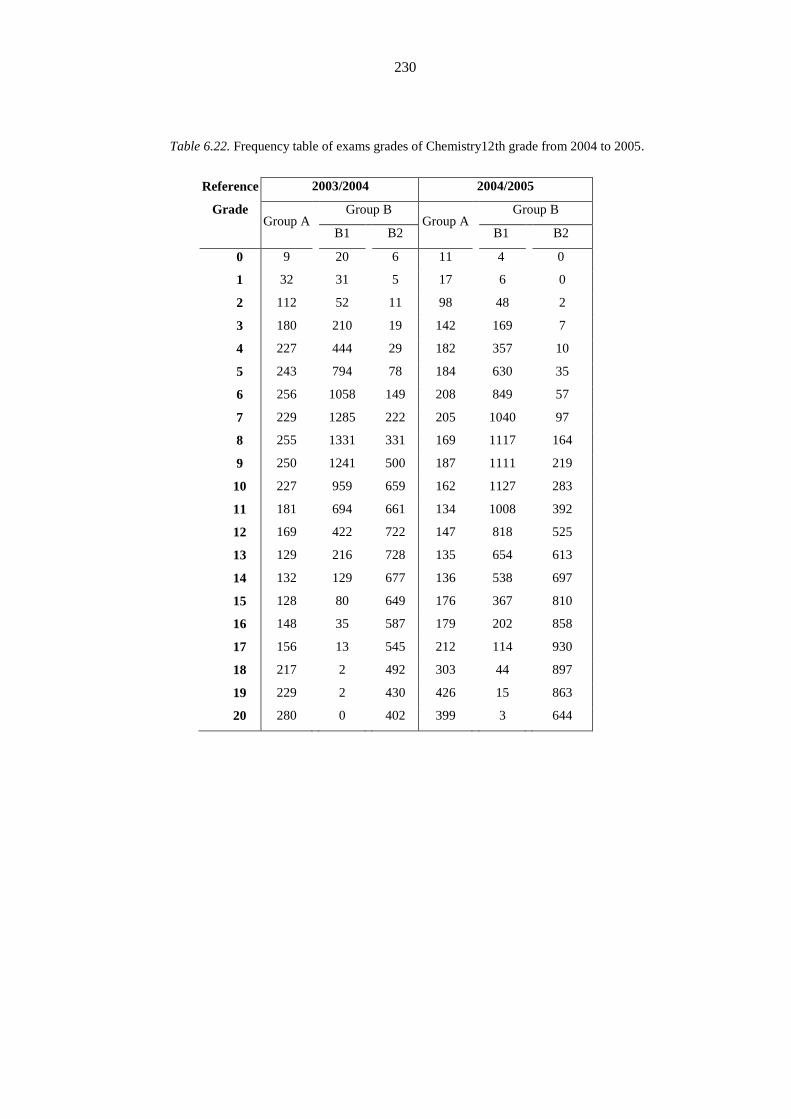
230
Table 6.22. Frequency table of exams grades of Chemistry12th grade from 2004 to 2005.
Reference
Grade
2003/2004 2004/2005
Group A Group B
Group A Group B
B1 B2 B1 B2
0 9 20 6 11 4 0
1 32 31 5 17 6 0
2 112 52 11 98 48 2
3 180 210 19 142 169 7
4 227 444 29 182 357 10
5 243 794 78 184 630 35
6 256 1058 149 208 849 57
7 229 1285 222 205 1040 97
8 255 1331 331 169 1117 164
9 250 1241 500 187 1111 219
10 227 959 659 162 1127 283
11 181 694 661 134 1008 392
12 169 422 722 147 818 525
13 129 216 728 135 654 613
14 132 129 677 136 538 697
15 128 80 649 176 367 810
16 148 35 587 179 202 858
17 156 13 545 212 114 930
18 217 2 492 303 44 897
19 229 2 430 426 15 863
20 280 0 402 399 3 644
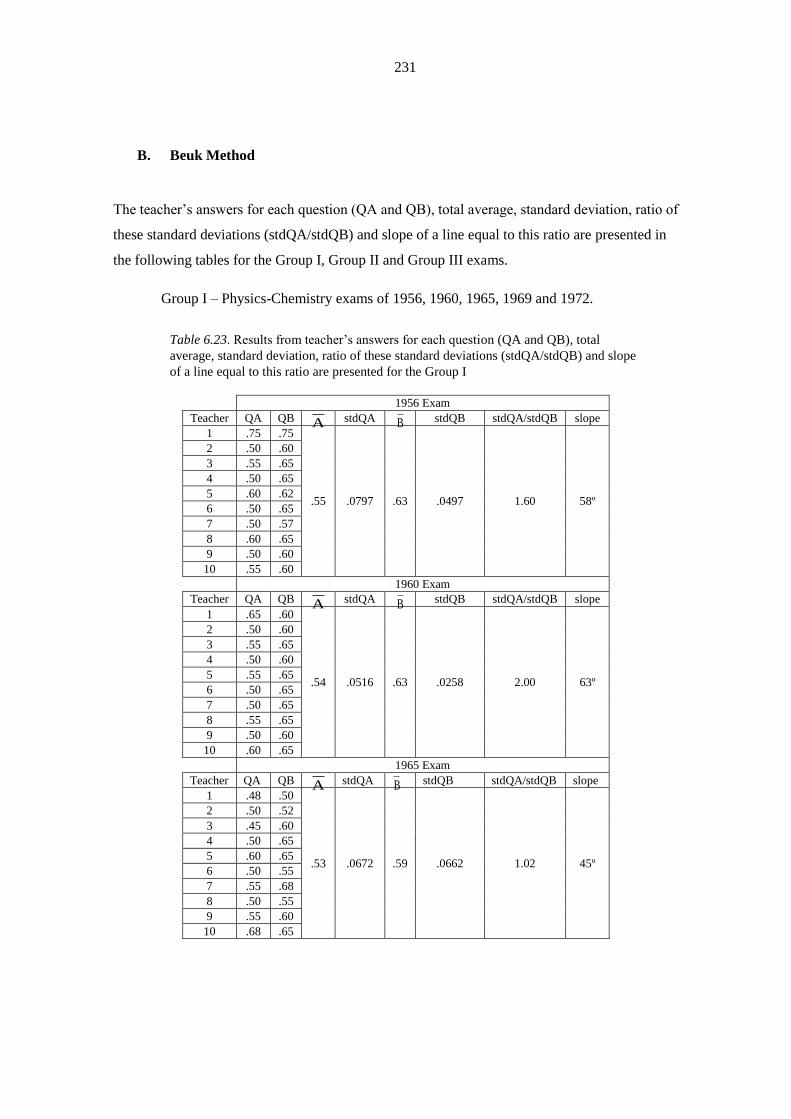
231
B. Beuk Method
The teacher’s answers for each question (QA and QB), total average, standard deviation, ratio of
these standard deviations (stdQA/stdQB) and slope of a line equal to this ratio are presented in
the following tables for the Group I, Group II and Group III exams.
Group I – Physics-Chemistry exams of 1956, 1960, 1965, 1969 and 1972.
Table 6.23. Results from teacher’s answers for each question (QA and QB), total
average, standard deviation, ratio of these standard deviations (stdQA/stdQB) and slope
of a line equal to this ratio are presented for the Group I
1956 Exam
Teacher QA QB A stdQA B
stdQB stdQA/stdQB slope
1 .75 .75
.55 .0797 .63 .0497 1.60 58º
2 .50 .60
3 .55 .65
4 .50 .65
5 .60 .62
6 .50 .65
7 .50 .57
8 .60 .65
9 .50 .60
10 .55 .60
1960 Exam
Teacher QA QB A stdQA B
stdQB stdQA/stdQB slope
1 .65 .60
.54 .0516 .63 .0258 2.00 63º
2 .50 .60
3 .55 .65
4 .50 .60
5 .55 .65
6 .50 .65
7 .50 .65
8 .55 .65
9 .50 .60
10 .60 .65
1965 Exam
Teacher QA QB A stdQA B
stdQB stdQA/stdQB slope
1 .48 .50
.53 .0672 .59 .0662 1.02 45º
2 .50 .52
3 .45 .60
4 .50 .65
5 .60 .65
6 .50 .55
7 .55 .68
8 .50 .55
9 .55 .60
10 .68 .65

232
1969 Exam
Teacher QA QB A stdQA B
stdQB stdQA/stdQB slope 1 .55 .62
.52 .0363 .60 .0445 .82 39º
2 .50 .55 3 .50 .60
4 .55 .65
5 .60 .65 6 .50 .55
7 .50 .55 8 .50 .60
9 .50 .55 10 .50 .65
1972 Exam
Teacher QA QB A stdQA B
stdQB stdQA/stdQB slope
1 .50 .62
.52 .0242 .59 .0496 .49 26º
2 .50 .57
3 .55 .68
4 .50 .58
5 .55 .53
6 .50 .56
7 .50 .57
8 .50 .66
9 .50 .61
10 .55 .54
Group II – Physics and Chemistry exams of 1982, 1983 and 1984
Table 6.24. Results from teacher’s answers for each question (QA and QB), total average,
standard deviation, ratio of these standard deviations (stdQA/stdQB) and slope of a line equal
to this ratio are presented for Group II – Physics.
1982 Physics Exam
Teacher QA QB A stdQA B
stdQB stdQA/stdQB slope
1 .40 .60
.48 .0334 .61 .0333 0.78 38º
2 .50 .65
3 .48 .55
4 .50 .65
5 .50 .65
6 .48 .60
7 .50 .60
8 .45 .60
9 .50 .60
10 .45 .55

233
1983 Physics Exam
Teacher QA QB A stdQA B
stdQB stdQA/stdQB slope
1 .45 .55
.49 .0242 .60 .0369 0.815 39º
2 .50 .60
3 .50 .65
4 .45 .60
5 .50 .65
6 .45 .55
7 .50 .60
8 .50 .55
9 .50 .60
10 .50 .60
1984 Physics Exam
Teacher QA QB A stdQA B
stdQB stdQA/stdQB slope
1 .50 .55
.49 .0211 .59 .0427 0.832 39º
2 .50 .55
3 .50 .60
4 .50 .60
5 .45 .55
6 .50 .65
7 .50 .60
8 .50 .65
9 .50 .60
10 .45 .55
Table 6.25. Results from teacher’s answers for each question (QA and QB), total
average, standard deviation, ratio of these standard deviations (stdQA/stdQB) and slope
of a line equal to this ratio are presented for Group II – Chemistry.
1982 Chemistry Exam
Teacher QA QB A stdQA B
stdQB stdQA/stdQB slope
1 .50 .60
.49 .0242 .58 .0483 0.50 27º
2 .50 .50
3 .45 .60
4 .50 .65
5 .45 .55
6 .50 .55
7 .50 .60
8 .50 .55
9 .50 .65
10 .45 .55

234
1983 Chemistry Exam
Teacher QA QB A stdQA B
stdQB stdQA/stdQB slope
1 .45 .55
.47 .0258 .57 .0242 1.07 47º
2 .50 .55
3 .45 .55
4 .45 .60
5 .50 .60
6 .50 .55
7 .45 .60
8 .45 .55
9 .50 .55
10 .45 .55
1984 Chemistry Exam
Teacher QA QB A stdQA B
stdQB stdQA/stdQB slope
1 .50 .60
.49 .0211 .59 .0316 0.67 34º
2 .50 .60
3 .45 .55
4 .50 .60
5 .50 .60
6 .50 .55
7 .50 .60
8 .50 .60
9 .50 .65
10 .45 .55
Group III – Physics and Chemistry exams of 2004 and 2005;
Table 6.26. Results from teacher’s answers for each question (QA and QB), total
average, standard deviation, ratio of these standard deviations (stdQA/stdQB) and slope
of a line equal to this ratio are presented for Group III - Physics.
2004 Physics Exam
Teacher QA QB A stdQA B
stdQB stdQA/stdQB slope
1 .48 .65
.48 .0175 .61 .0552 0.317 17º
2 .48 .63
3 .48 .66
4 .48 .53
5 .46 .58
6 .48 .58
7 .46 .54
8 .52 .66
9 .50 .68
10 .48 .56
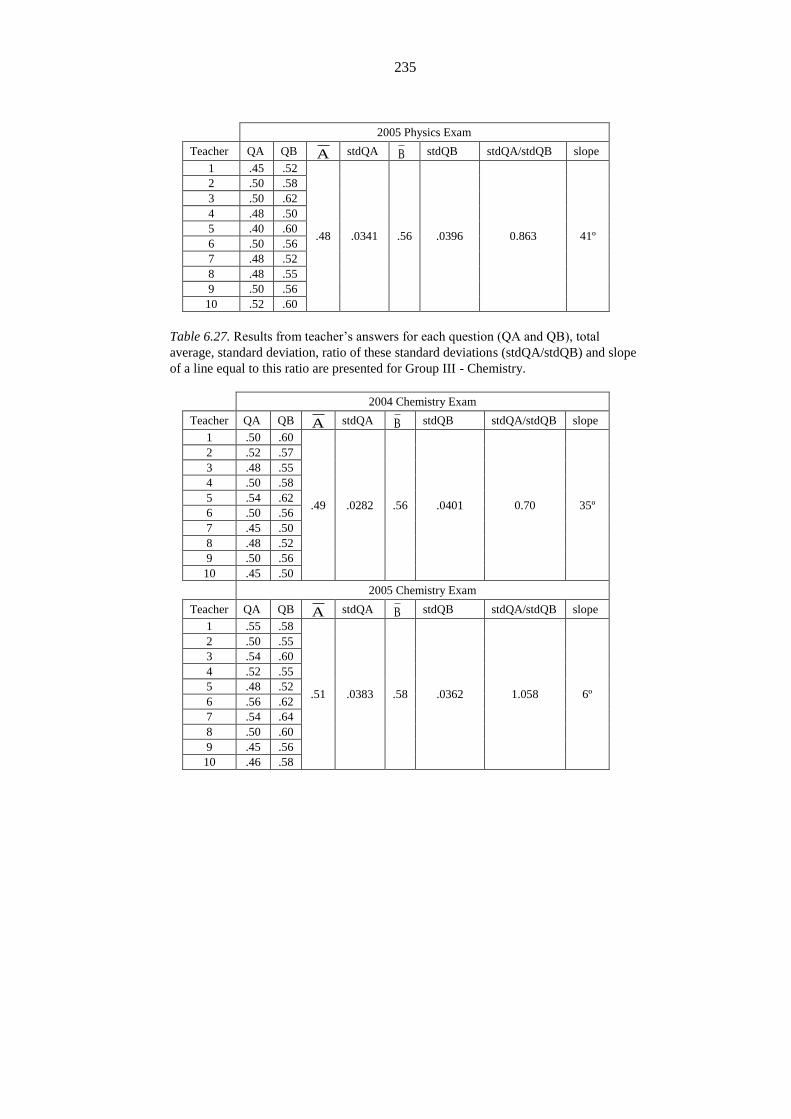
235
2005 Physics Exam
Teacher QA QB A stdQA B
stdQB stdQA/stdQB slope
1 .45 .52
.48 .0341 .56 .0396 0.863 41º
2 .50 .58
3 .50 .62
4 .48 .50
5 .40 .60
6 .50 .56
7 .48 .52
8 .48 .55
9 .50 .56
10 .52 .60
Table 6.27. Results from teacher’s answers for each question (QA and QB), total
average, standard deviation, ratio of these standard deviations (stdQA/stdQB) and slope
of a line equal to this ratio are presented for Group III - Chemistry.
2004 Chemistry Exam
Teacher QA QB A stdQA B
stdQB stdQA/stdQB slope
1 .50 .60
.49 .0282 .56 .0401 0.70 35º
2 .52 .57
3 .48 .55
4 .50 .58
5 .54 .62
6 .50 .56
7 .45 .50
8 .48 .52
9 .50 .56
10 .45 .50
2005 Chemistry Exam
Teacher QA QB A stdQA B
stdQB stdQA/stdQB slope
1 .55 .58
.51 .0383 .58 .0362 1.058 6º
2 .50 .55
3 .54 .60
4 .52 .55
5 .48 .52
6 .56 .62
7 .54 .64
8 .50 .60
9 .45 .56
10 .46 .58
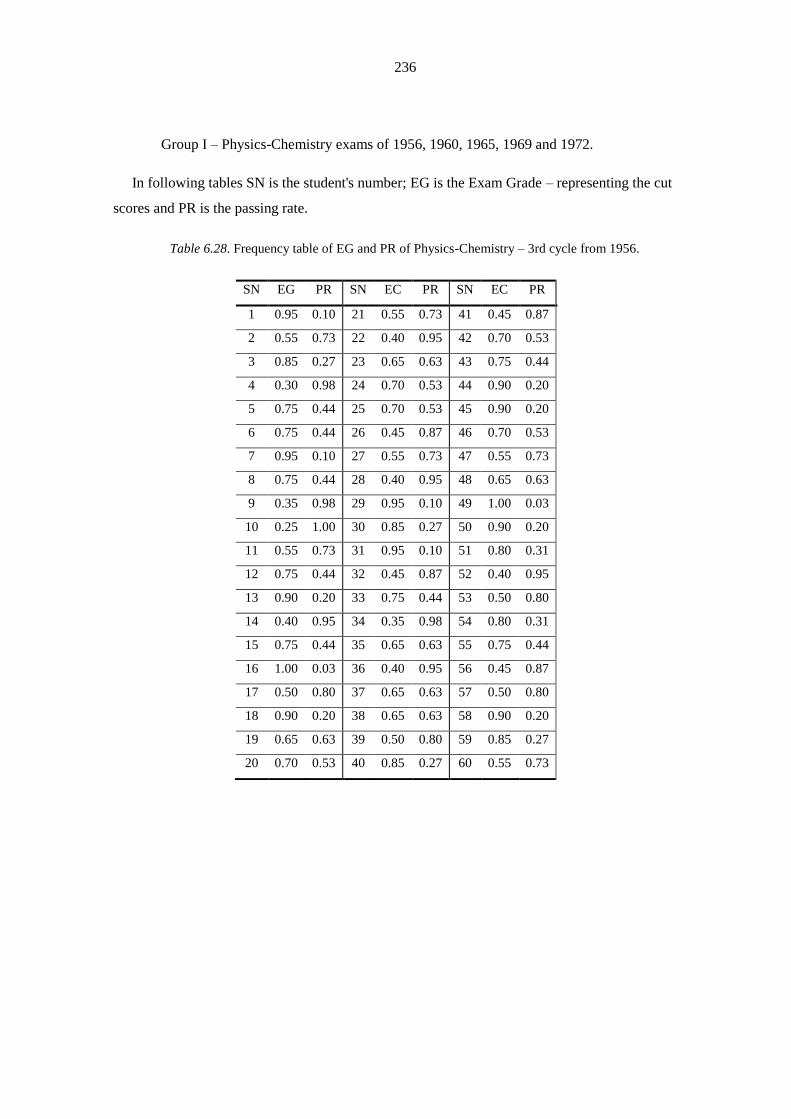
236
Group I – Physics-Chemistry exams of 1956, 1960, 1965, 1969 and 1972.
In following tables SN is the student's number; EG is the Exam Grade – representing the cut
scores and PR is the passing rate.
Table 6.28. Frequency table of EG and PR of Physics-Chemistry – 3rd cycle from 1956.
SN EG PR SN EC PR SN EC PR
1 0.95 0.10 21 0.55 0.73 41 0.45 0.87
2 0.55 0.73 22 0.40 0.95 42 0.70 0.53
3 0.85 0.27 23 0.65 0.63 43 0.75 0.44
4 0.30 0.98 24 0.70 0.53 44 0.90 0.20
5 0.75 0.44 25 0.70 0.53 45 0.90 0.20
6 0.75 0.44 26 0.45 0.87 46 0.70 0.53
7 0.95 0.10 27 0.55 0.73 47 0.55 0.73
8 0.75 0.44 28 0.40 0.95 48 0.65 0.63
9 0.35 0.98 29 0.95 0.10 49 1.00 0.03
10 0.25 1.00 30 0.85 0.27 50 0.90 0.20
11 0.55 0.73 31 0.95 0.10 51 0.80 0.31
12 0.75 0.44 32 0.45 0.87 52 0.40 0.95
13 0.90 0.20 33 0.75 0.44 53 0.50 0.80
14 0.40 0.95 34 0.35 0.98 54 0.80 0.31
15 0.75 0.44 35 0.65 0.63 55 0.75 0.44
16 1.00 0.03 36 0.40 0.95 56 0.45 0.87
17 0.50 0.80 37 0.65 0.63 57 0.50 0.80
18 0.90 0.20 38 0.65 0.63 58 0.90 0.20
19 0.65 0.63 39 0.50 0.80 59 0.85 0.27
20 0.70 0.53 40 0.85 0.27 60 0.55 0.73
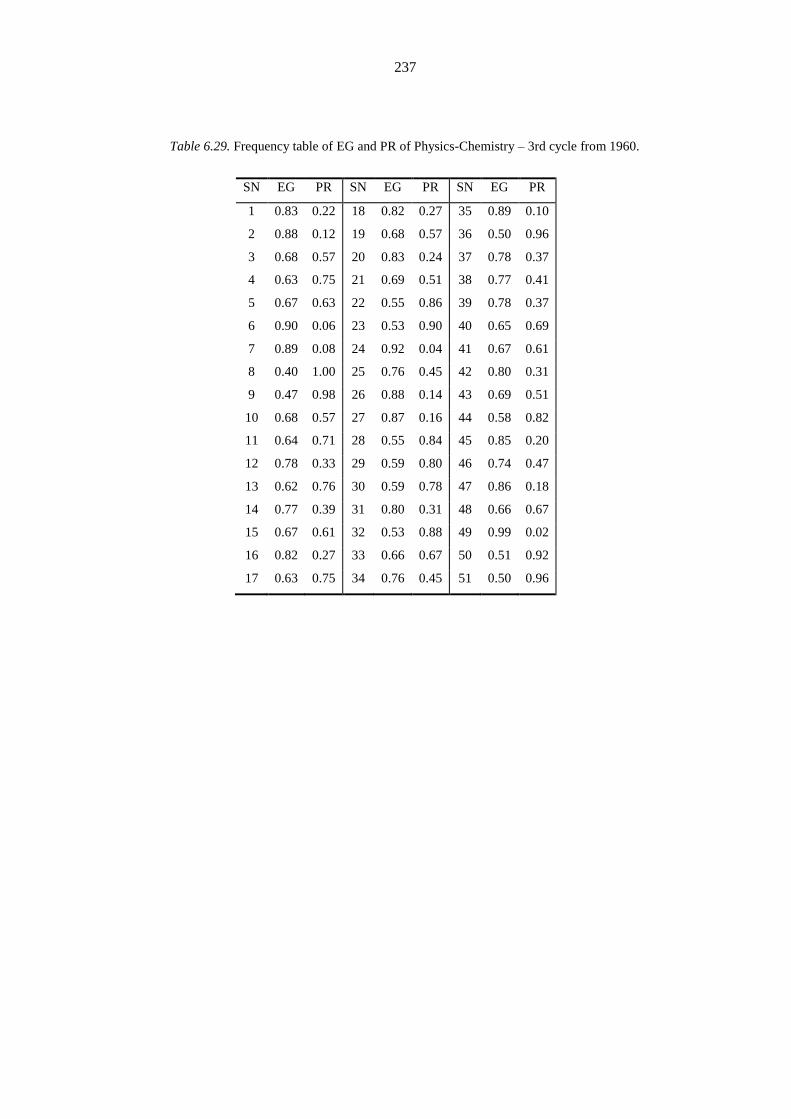
237
Table 6.29. Frequency table of EG and PR of Physics-Chemistry – 3rd cycle from 1960.
SN EG PR SN EG PR SN EG PR
1 0.83 0.22 18 0.82 0.27 35 0.89 0.10
2 0.88 0.12 19 0.68 0.57 36 0.50 0.96
3 0.68 0.57 20 0.83 0.24 37 0.78 0.37
4 0.63 0.75 21 0.69 0.51 38 0.77 0.41
5 0.67 0.63 22 0.55 0.86 39 0.78 0.37
6 0.90 0.06 23 0.53 0.90 40 0.65 0.69
7 0.89 0.08 24 0.92 0.04 41 0.67 0.61
8 0.40 1.00 25 0.76 0.45 42 0.80 0.31
9 0.47 0.98 26 0.88 0.14 43 0.69 0.51
10 0.68 0.57 27 0.87 0.16 44 0.58 0.82
11 0.64 0.71 28 0.55 0.84 45 0.85 0.20
12 0.78 0.33 29 0.59 0.80 46 0.74 0.47
13 0.62 0.76 30 0.59 0.78 47 0.86 0.18
14 0.77 0.39 31 0.80 0.31 48 0.66 0.67
15 0.67 0.61 32 0.53 0.88 49 0.99 0.02
16 0.82 0.27 33 0.66 0.67 50 0.51 0.92
17 0.63 0.75 34 0.76 0.45 51 0.50 0.96
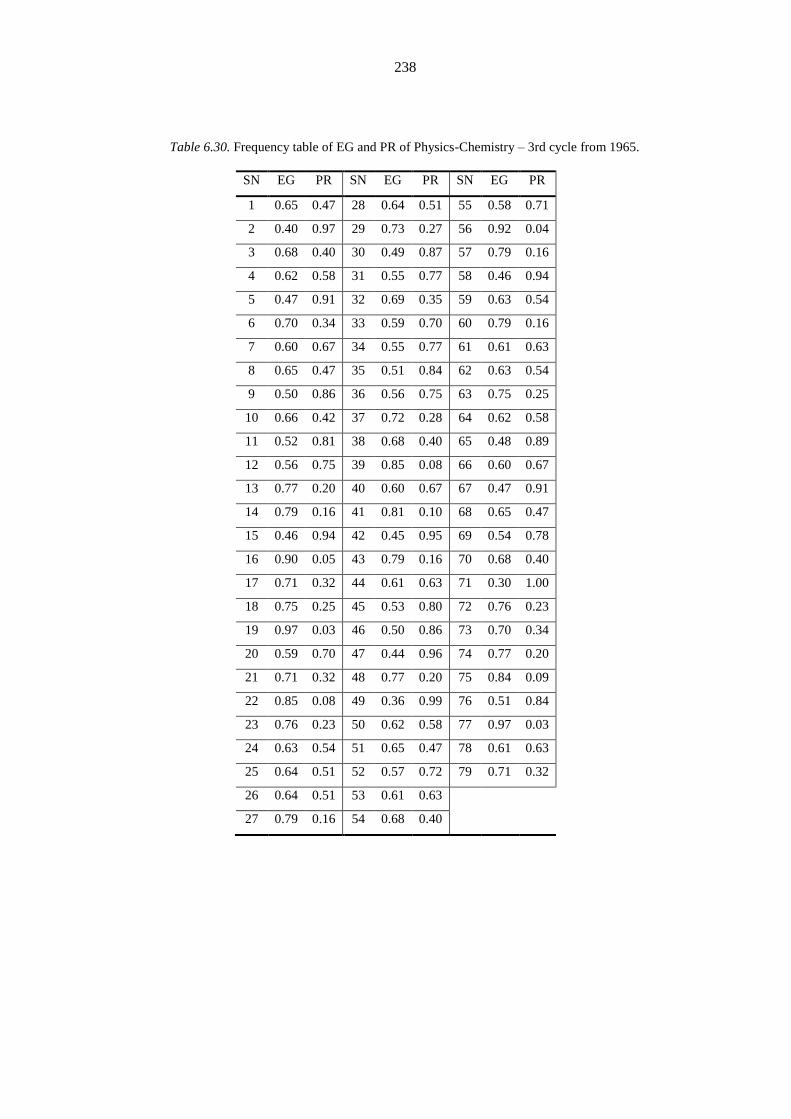
238
Table 6.30. Frequency table of EG and PR of Physics-Chemistry – 3rd cycle from 1965.
SN EG PR SN EG PR SN EG PR
1 0.65 0.47 28 0.64 0.51 55 0.58 0.71
2 0.40 0.97 29 0.73 0.27 56 0.92 0.04
3 0.68 0.40 30 0.49 0.87 57 0.79 0.16
4 0.62 0.58 31 0.55 0.77 58 0.46 0.94
5 0.47 0.91 32 0.69 0.35 59 0.63 0.54
6 0.70 0.34 33 0.59 0.70 60 0.79 0.16
7 0.60 0.67 34 0.55 0.77 61 0.61 0.63
8 0.65 0.47 35 0.51 0.84 62 0.63 0.54
9 0.50 0.86 36 0.56 0.75 63 0.75 0.25
10 0.66 0.42 37 0.72 0.28 64 0.62 0.58
11 0.52 0.81 38 0.68 0.40 65 0.48 0.89
12 0.56 0.75 39 0.85 0.08 66 0.60 0.67
13 0.77 0.20 40 0.60 0.67 67 0.47 0.91
14 0.79 0.16 41 0.81 0.10 68 0.65 0.47
15 0.46 0.94 42 0.45 0.95 69 0.54 0.78
16 0.90 0.05 43 0.79 0.16 70 0.68 0.40
17 0.71 0.32 44 0.61 0.63 71 0.30 1.00
18 0.75 0.25 45 0.53 0.80 72 0.76 0.23
19 0.97 0.03 46 0.50 0.86 73 0.70 0.34
20 0.59 0.70 47 0.44 0.96 74 0.77 0.20
21 0.71 0.32 48 0.77 0.20 75 0.84 0.09
22 0.85 0.08 49 0.36 0.99 76 0.51 0.84
23 0.76 0.23 50 0.62 0.58 77 0.97 0.03
24 0.63 0.54 51 0.65 0.47 78 0.61 0.63
25 0.64 0.51 52 0.57 0.72 79 0.71 0.32
26 0.64 0.51 53 0.61 0.63
27 0.79 0.16 54 0.68 0.40
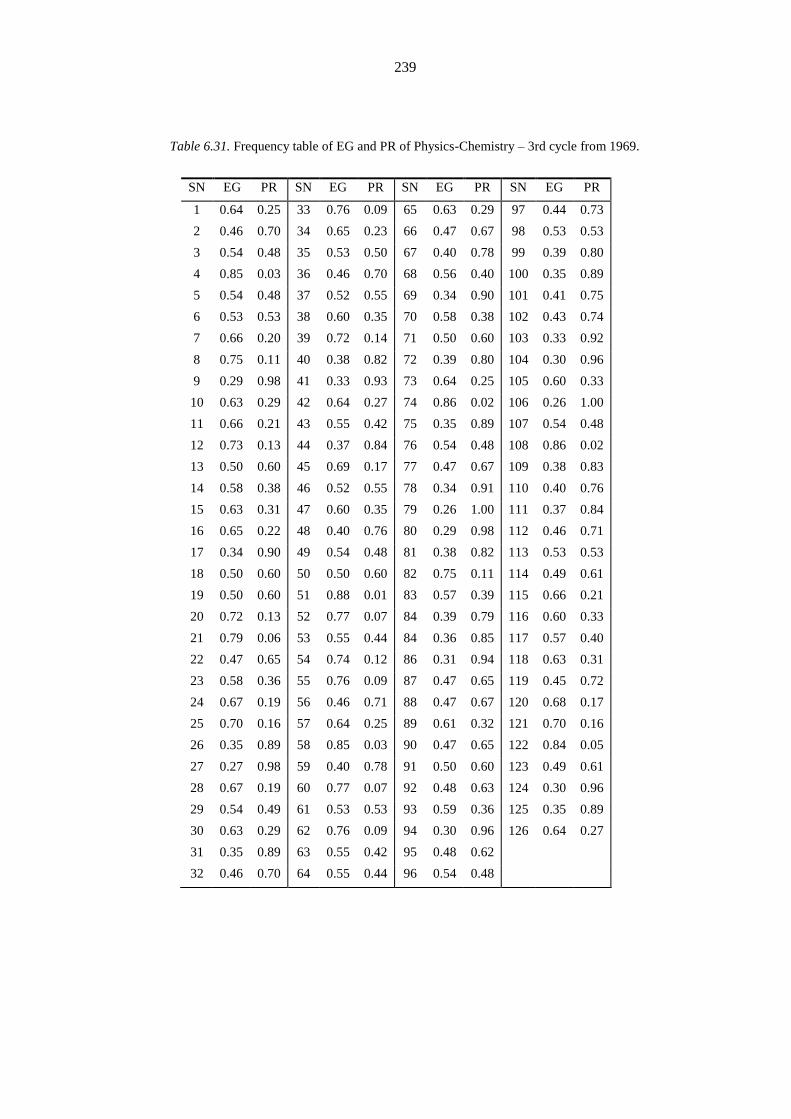
239
Table 6.31. Frequency table of EG and PR of Physics-Chemistry – 3rd cycle from 1969.
SN EG PR SN EG PR SN EG PR SN EG PR
1 0.64 0.25 33 0.76 0.09 65 0.63 0.29 97 0.44 0.73
2 0.46 0.70 34 0.65 0.23 66 0.47 0.67 98 0.53 0.53
3 0.54 0.48 35 0.53 0.50 67 0.40 0.78 99 0.39 0.80
4 0.85 0.03 36 0.46 0.70 68 0.56 0.40 100 0.35 0.89
5 0.54 0.48 37 0.52 0.55 69 0.34 0.90 101 0.41 0.75
6 0.53 0.53 38 0.60 0.35 70 0.58 0.38 102 0.43 0.74
7 0.66 0.20 39 0.72 0.14 71 0.50 0.60 103 0.33 0.92
8 0.75 0.11 40 0.38 0.82 72 0.39 0.80 104 0.30 0.96
9 0.29 0.98 41 0.33 0.93 73 0.64 0.25 105 0.60 0.33
10 0.63 0.29 42 0.64 0.27 74 0.86 0.02 106 0.26 1.00
11 0.66 0.21 43 0.55 0.42 75 0.35 0.89 107 0.54 0.48
12 0.73 0.13 44 0.37 0.84 76 0.54 0.48 108 0.86 0.02
13 0.50 0.60 45 0.69 0.17 77 0.47 0.67 109 0.38 0.83
14 0.58 0.38 46 0.52 0.55 78 0.34 0.91 110 0.40 0.76
15 0.63 0.31 47 0.60 0.35 79 0.26 1.00 111 0.37 0.84
16 0.65 0.22 48 0.40 0.76 80 0.29 0.98 112 0.46 0.71
17 0.34 0.90 49 0.54 0.48 81 0.38 0.82 113 0.53 0.53
18 0.50 0.60 50 0.50 0.60 82 0.75 0.11 114 0.49 0.61
19 0.50 0.60 51 0.88 0.01 83 0.57 0.39 115 0.66 0.21
20 0.72 0.13 52 0.77 0.07 84 0.39 0.79 116 0.60 0.33
21 0.79 0.06 53 0.55 0.44 84 0.36 0.85 117 0.57 0.40
22 0.47 0.65 54 0.74 0.12 86 0.31 0.94 118 0.63 0.31
23 0.58 0.36 55 0.76 0.09 87 0.47 0.65 119 0.45 0.72
24 0.67 0.19 56 0.46 0.71 88 0.47 0.67 120 0.68 0.17
25 0.70 0.16 57 0.64 0.25 89 0.61 0.32 121 0.70 0.16
26 0.35 0.89 58 0.85 0.03 90 0.47 0.65 122 0.84 0.05
27 0.27 0.98 59 0.40 0.78 91 0.50 0.60 123 0.49 0.61
28 0.67 0.19 60 0.77 0.07 92 0.48 0.63 124 0.30 0.96
29 0.54 0.49 61 0.53 0.53 93 0.59 0.36 125 0.35 0.89
30 0.63 0.29 62 0.76 0.09 94 0.30 0.96 126 0.64 0.27
31 0.35 0.89 63 0.55 0.42 95 0.48 0.62
32 0.46 0.70 64 0.55 0.44 96 0.54 0.48
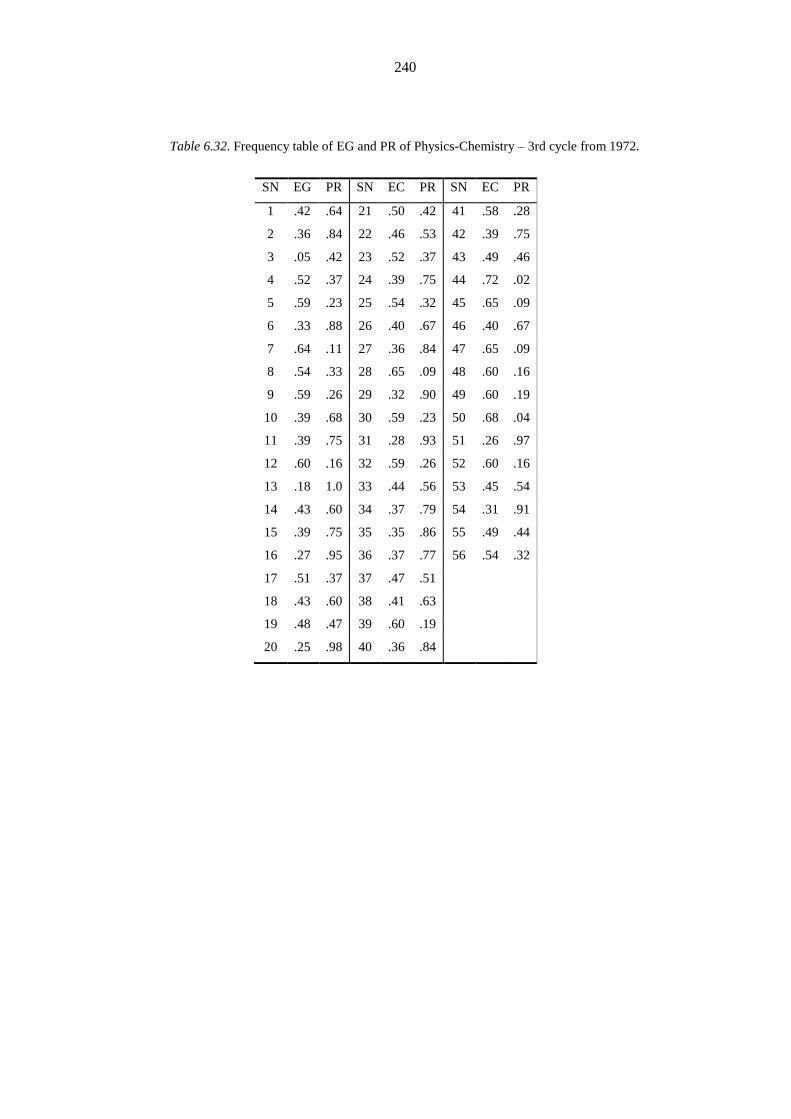
240
Table 6.32. Frequency table of EG and PR of Physics-Chemistry – 3rd cycle from 1972.
SN EG PR SN EC PR SN EC PR
1 .42 .64 21 .50 .42 41 .58 .28
2 .36 .84 22 .46 .53 42 .39 .75
3 .05 .42 23 .52 .37 43 .49 .46
4 .52 .37 24 .39 .75 44 .72 .02
5 .59 .23 25 .54 .32 45 .65 .09
6 .33 .88 26 .40 .67 46 .40 .67
7 .64 .11 27 .36 .84 47 .65 .09
8 .54 .33 28 .65 .09 48 .60 .16
9 .59 .26 29 .32 .90 49 .60 .19
10 .39 .68 30 .59 .23 50 .68 .04
11 .39 .75 31 .28 .93 51 .26 .97
12 .60 .16 32 .59 .26 52 .60 .16
13 .18 1.0 33 .44 .56 53 .45 .54
14 .43 .60 34 .37 .79 54 .31 .91
15 .39 .75 35 .35 .86 55 .49 .44
16 .27 .95 36 .37 .77 56 .54 .32
17 .51 .37 37 .47 .51
18 .43 .60 38 .41 .63
19 .48 .47 39 .60 .19
20 .25 .98 40 .36 .84
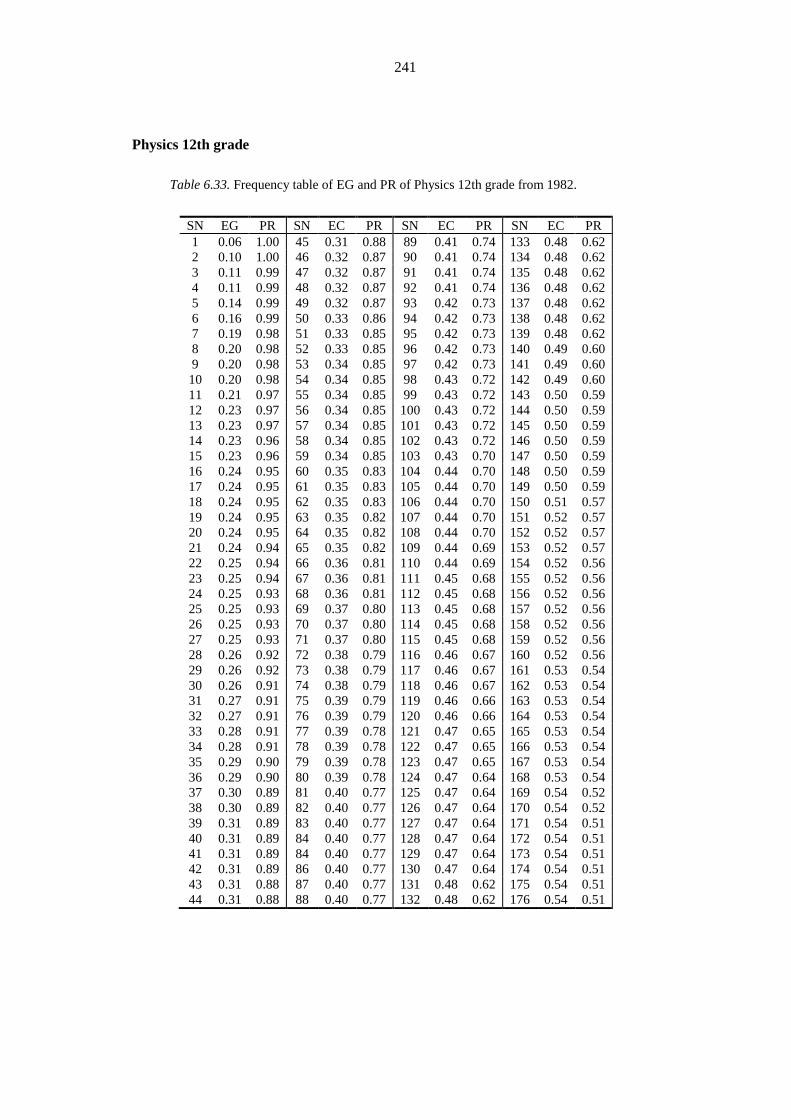
241
Physics 12th grade
Table 6.33. Frequency table of EG and PR of Physics 12th grade from 1982.
SN EG PR SN EC PR SN EC PR SN EC PR
1 0.06 1.00 45 0.31 0.88 89 0.41 0.74 133 0.48 0.62
2 0.10 1.00 46 0.32 0.87 90 0.41 0.74 134 0.48 0.62
3 0.11 0.99 47 0.32 0.87 91 0.41 0.74 135 0.48 0.62
4 0.11 0.99 48 0.32 0.87 92 0.41 0.74 136 0.48 0.62
5 0.14 0.99 49 0.32 0.87 93 0.42 0.73 137 0.48 0.62
6 0.16 0.99 50 0.33 0.86 94 0.42 0.73 138 0.48 0.62
7 0.19 0.98 51 0.33 0.85 95 0.42 0.73 139 0.48 0.62
8 0.20 0.98 52 0.33 0.85 96 0.42 0.73 140 0.49 0.60
9 0.20 0.98 53 0.34 0.85 97 0.42 0.73 141 0.49 0.60
10 0.20 0.98 54 0.34 0.85 98 0.43 0.72 142 0.49 0.60
11 0.21 0.97 55 0.34 0.85 99 0.43 0.72 143 0.50 0.59
12 0.23 0.97 56 0.34 0.85 100 0.43 0.72 144 0.50 0.59
13 0.23 0.97 57 0.34 0.85 101 0.43 0.72 145 0.50 0.59
14 0.23 0.96 58 0.34 0.85 102 0.43 0.72 146 0.50 0.59
15 0.23 0.96 59 0.34 0.85 103 0.43 0.70 147 0.50 0.59
16 0.24 0.95 60 0.35 0.83 104 0.44 0.70 148 0.50 0.59
17 0.24 0.95 61 0.35 0.83 105 0.44 0.70 149 0.50 0.59
18 0.24 0.95 62 0.35 0.83 106 0.44 0.70 150 0.51 0.57
19 0.24 0.95 63 0.35 0.82 107 0.44 0.70 151 0.52 0.57
20 0.24 0.95 64 0.35 0.82 108 0.44 0.70 152 0.52 0.57
21 0.24 0.94 65 0.35 0.82 109 0.44 0.69 153 0.52 0.57
22 0.25 0.94 66 0.36 0.81 110 0.44 0.69 154 0.52 0.56
23 0.25 0.94 67 0.36 0.81 111 0.45 0.68 155 0.52 0.56
24 0.25 0.93 68 0.36 0.81 112 0.45 0.68 156 0.52 0.56
25 0.25 0.93 69 0.37 0.80 113 0.45 0.68 157 0.52 0.56
26 0.25 0.93 70 0.37 0.80 114 0.45 0.68 158 0.52 0.56
27 0.25 0.93 71 0.37 0.80 115 0.45 0.68 159 0.52 0.56
28 0.26 0.92 72 0.38 0.79 116 0.46 0.67 160 0.52 0.56
29 0.26 0.92 73 0.38 0.79 117 0.46 0.67 161 0.53 0.54
30 0.26 0.91 74 0.38 0.79 118 0.46 0.67 162 0.53 0.54
31 0.27 0.91 75 0.39 0.79 119 0.46 0.66 163 0.53 0.54
32 0.27 0.91 76 0.39 0.79 120 0.46 0.66 164 0.53 0.54
33 0.28 0.91 77 0.39 0.78 121 0.47 0.65 165 0.53 0.54
34 0.28 0.91 78 0.39 0.78 122 0.47 0.65 166 0.53 0.54
35 0.29 0.90 79 0.39 0.78 123 0.47 0.65 167 0.53 0.54
36 0.29 0.90 80 0.39 0.78 124 0.47 0.64 168 0.53 0.54
37 0.30 0.89 81 0.40 0.77 125 0.47 0.64 169 0.54 0.52
38 0.30 0.89 82 0.40 0.77 126 0.47 0.64 170 0.54 0.52
39 0.31 0.89 83 0.40 0.77 127 0.47 0.64 171 0.54 0.51
40 0.31 0.89 84 0.40 0.77 128 0.47 0.64 172 0.54 0.51
41 0.31 0.89 84 0.40 0.77 129 0.47 0.64 173 0.54 0.51
42 0.31 0.89 86 0.40 0.77 130 0.47 0.64 174 0.54 0.51
43 0.31 0.88 87 0.40 0.77 131 0.48 0.62 175 0.54 0.51
44 0.31 0.88 88 0.40 0.77 132 0.48 0.62 176 0.54 0.51
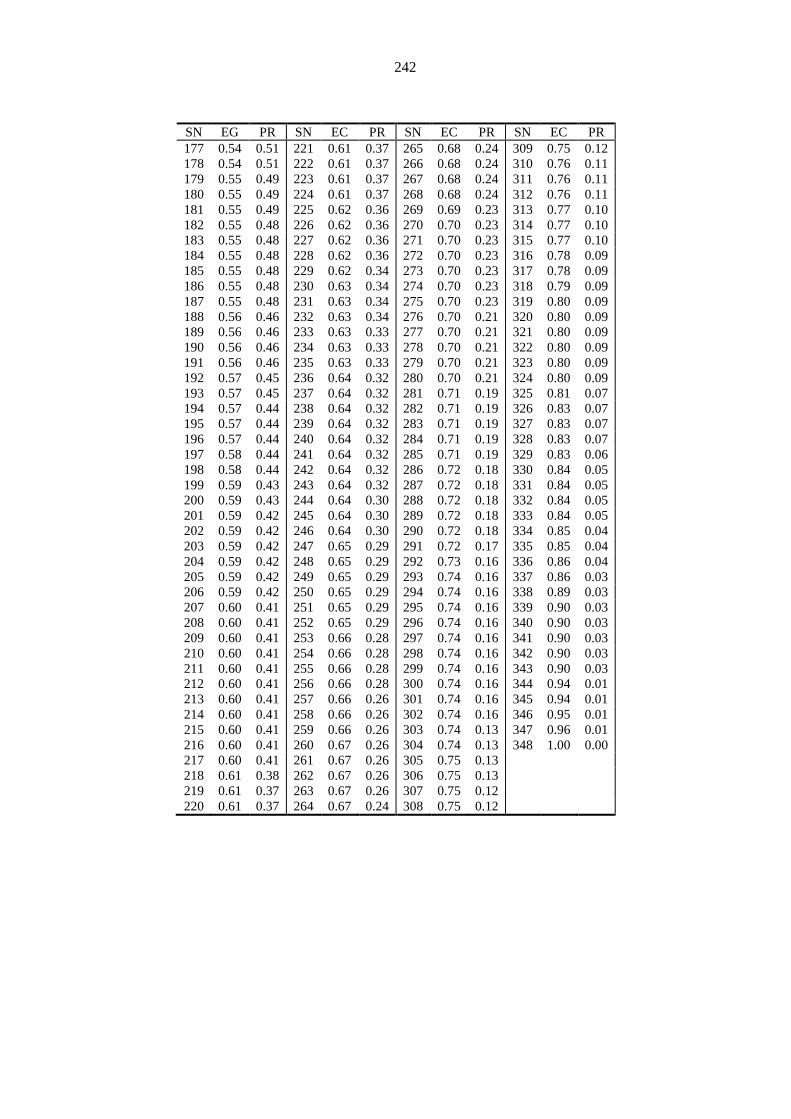
242
SN EG PR SN EC PR SN EC PR SN EC PR
177 0.54 0.51 221 0.61 0.37 265 0.68 0.24 309 0.75 0.12
178 0.54 0.51 222 0.61 0.37 266 0.68 0.24 310 0.76 0.11
179 0.55 0.49 223 0.61 0.37 267 0.68 0.24 311 0.76 0.11
180 0.55 0.49 224 0.61 0.37 268 0.68 0.24 312 0.76 0.11
181 0.55 0.49 225 0.62 0.36 269 0.69 0.23 313 0.77 0.10
182 0.55 0.48 226 0.62 0.36 270 0.70 0.23 314 0.77 0.10
183 0.55 0.48 227 0.62 0.36 271 0.70 0.23 315 0.77 0.10
184 0.55 0.48 228 0.62 0.36 272 0.70 0.23 316 0.78 0.09
185 0.55 0.48 229 0.62 0.34 273 0.70 0.23 317 0.78 0.09
186 0.55 0.48 230 0.63 0.34 274 0.70 0.23 318 0.79 0.09
187 0.55 0.48 231 0.63 0.34 275 0.70 0.23 319 0.80 0.09
188 0.56 0.46 232 0.63 0.34 276 0.70 0.21 320 0.80 0.09
189 0.56 0.46 233 0.63 0.33 277 0.70 0.21 321 0.80 0.09
190 0.56 0.46 234 0.63 0.33 278 0.70 0.21 322 0.80 0.09
191 0.56 0.46 235 0.63 0.33 279 0.70 0.21 323 0.80 0.09
192 0.57 0.45 236 0.64 0.32 280 0.70 0.21 324 0.80 0.09
193 0.57 0.45 237 0.64 0.32 281 0.71 0.19 325 0.81 0.07
194 0.57 0.44 238 0.64 0.32 282 0.71 0.19 326 0.83 0.07
195 0.57 0.44 239 0.64 0.32 283 0.71 0.19 327 0.83 0.07
196 0.57 0.44 240 0.64 0.32 284 0.71 0.19 328 0.83 0.07
197 0.58 0.44 241 0.64 0.32 285 0.71 0.19 329 0.83 0.06
198 0.58 0.44 242 0.64 0.32 286 0.72 0.18 330 0.84 0.05
199 0.59 0.43 243 0.64 0.32 287 0.72 0.18 331 0.84 0.05
200 0.59 0.43 244 0.64 0.30 288 0.72 0.18 332 0.84 0.05
201 0.59 0.42 245 0.64 0.30 289 0.72 0.18 333 0.84 0.05
202 0.59 0.42 246 0.64 0.30 290 0.72 0.18 334 0.85 0.04
203 0.59 0.42 247 0.65 0.29 291 0.72 0.17 335 0.85 0.04
204 0.59 0.42 248 0.65 0.29 292 0.73 0.16 336 0.86 0.04
205 0.59 0.42 249 0.65 0.29 293 0.74 0.16 337 0.86 0.03
206 0.59 0.42 250 0.65 0.29 294 0.74 0.16 338 0.89 0.03
207 0.60 0.41 251 0.65 0.29 295 0.74 0.16 339 0.90 0.03
208 0.60 0.41 252 0.65 0.29 296 0.74 0.16 340 0.90 0.03
209 0.60 0.41 253 0.66 0.28 297 0.74 0.16 341 0.90 0.03
210 0.60 0.41 254 0.66 0.28 298 0.74 0.16 342 0.90 0.03
211 0.60 0.41 255 0.66 0.28 299 0.74 0.16 343 0.90 0.03
212 0.60 0.41 256 0.66 0.28 300 0.74 0.16 344 0.94 0.01
213 0.60 0.41 257 0.66 0.26 301 0.74 0.16 345 0.94 0.01
214 0.60 0.41 258 0.66 0.26 302 0.74 0.16 346 0.95 0.01
215 0.60 0.41 259 0.66 0.26 303 0.74 0.13 347 0.96 0.01
216 0.60 0.41 260 0.67 0.26 304 0.74 0.13 348 1.00 0.00
217 0.60 0.41 261 0.67 0.26 305 0.75 0.13
218 0.61 0.38 262 0.67 0.26 306 0.75 0.13
219 0.61 0.37 263 0.67 0.26 307 0.75 0.12
220 0.61 0.37 264 0.67 0.24 308 0.75 0.12

243
Table 6.34. Frequency table of EG and PR of Physics 12th grade from 1983.
SN EG PR SN EG PR SN EG PR SN EG PR
1 0.05 1.00 38 0.40 0.76 75 0.50 0.61 112 0.75 0.25
2 0.05 1.00 39 0.40 0.76 76 0.50 0.61 113 0.75 0.25
3 0.06 0.99 40 0.40 0.76 77 0.50 0.61 114 0.75 0.25
4 0.07 0.98 41 0.40 0.76 78 0.55 0.48 115 0.75 0.25
5 0.08 0.97 42 0.40 0.76 79 0.55 0.48 116 0.75 0.25
6 0.10 0.97 43 0.40 0.76 80 0.55 0.48 117 0.75 0.25
7 0.15 0.96 44 0.40 0.76 81 0.55 0.48 118 0.75 0.25
8 0.15 0.96 45 0.40 0.76 82 0.55 0.48 119 0.75 0.25
9 0.15 0.96 46 0.40 0.76 83 0.55 0.48 120 0.75 0.25
10 0.20 0.94 47 0.40 0.76 84 0.55 0.48 121 0.75 0.25
11 0.20 0.94 48 0.45 0.68 84 0.55 0.48 122 0.75 0.25
12 0.20 0.94 49 0.45 0.68 86 0.55 0.48 123 0.75 0.25
13 0.20 0.94 50 0.45 0.68 87 0.60 0.41 124 0.75 0.25
14 0.20 0.94 51 0.45 0.68 88 0.60 0.41 125 0.80 0.16
15 0.20 0.94 52 0.45 0.68 89 0.60 0.41 126 0.80 0.16
16 0.20 0.94 53 0.45 0.68 90 0.60 0.41 127 0.80 0.16
17 0.25 0.89 54 0.45 0.68 91 0.60 0.41 128 0.80 0.16
18 0.25 0.89 55 0.45 0.68 92 0.60 0.41 129 0.80 0.16
19 0.25 0.89 56 0.45 0.68 93 0.60 0.41 130 0.80 0.16
20 0.25 0.89 57 0.45 0.68 94 0.60 0.41 131 0.80 0.16
21 0.25 0.89 58 0.45 0.68 95 0.60 0.41 132 0.80 0.16
22 0.30 0.86 59 0.50 0.61 96 0.60 0.41 133 0.80 0.16
23 0.30 0.86 60 0.50 0.61 97 0.65 0.35 134 0.80 0.16
24 0.30 0.86 61 0.50 0.61 98 0.65 0.35 135 0.80 0.16
25 0.30 0.86 62 0.50 0.61 99 0.65 0.35 136 0.80 0.16
26 0.30 0.86 63 0.50 0.61 100 0.65 0.35 137 0.85 0.07
27 0.30 0.86 64 0.50 0.61 101 0.65 0.35 138 0.85 0.07
28 0.30 0.86 65 0.50 0.61 102 0.65 0.35 139 0.85 0.07
29 0.30 0.86 66 0.50 0.61 103 0.70 0.31 140 0.85 0.07
30 0.30 0.86 67 0.50 0.61 104 0.70 0.31 141 0.85 0.07
31 0.35 0.80 68 0.50 0.61 105 0.70 0.31 142 0.90 0.04
32 0.35 0.80 69 0.50 0.61 106 0.70 0.31 143 0.90 0.04
33 0.35 0.80 70 0.50 0.61 107 0.70 0.31 144 0.90 0.04
34 0.35 0.80 71 0.50 0.61 108 0.70 0.31 145 0.90 0.04
35 0.35 0.80 72 0.50 0.61 109 0.70 0.31 146 0.95 0.01
36 0.35 0.80 73 0.50 0.61 110 0.70 0.31 147 1.00 0.01
37 0.40 0.76 74 0.50 0.61 111 0.75 0.25
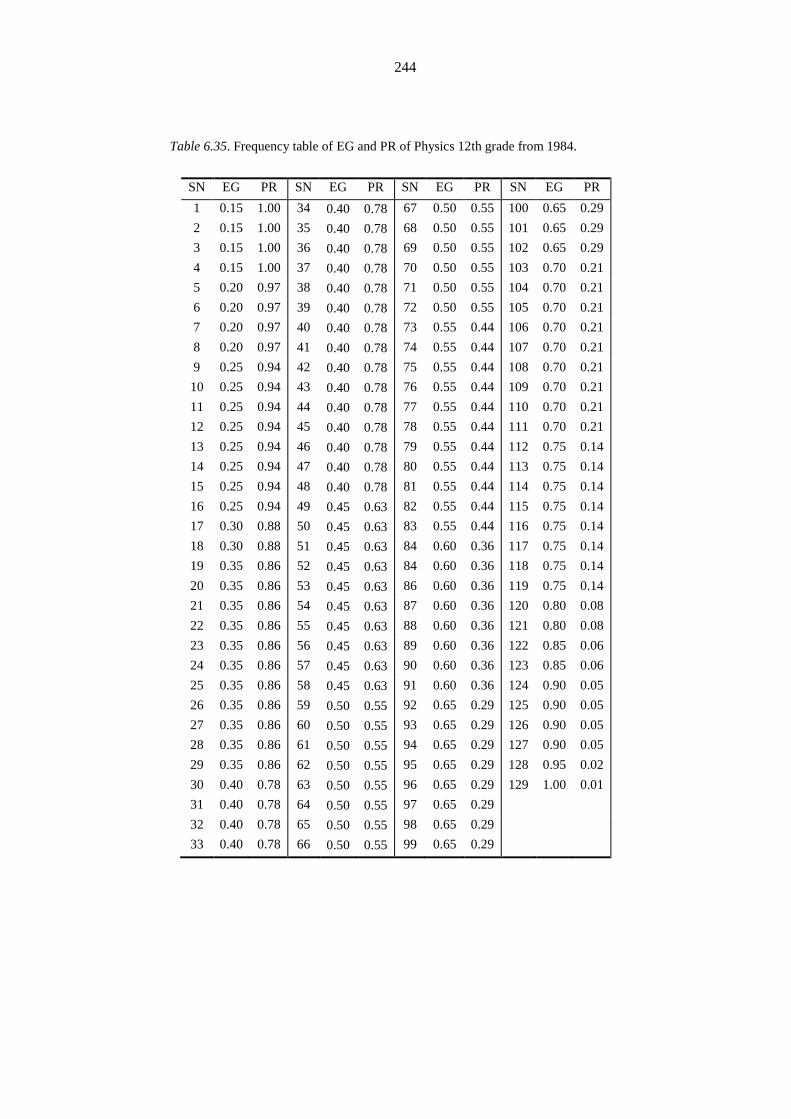
244
Table 6.35. Frequency table of EG and PR of Physics 12th grade from 1984.
SN EG PR SN EG PR SN EG PR SN EG PR
1 0.15 1.00 34 0.40 0.78 67 0.50 0.55 100 0.65 0.29
2 0.15 1.00 35 0.40 0.78 68 0.50 0.55 101 0.65 0.29
3 0.15 1.00 36 0.40 0.78 69 0.50 0.55 102 0.65 0.29
4 0.15 1.00 37 0.40 0.78 70 0.50 0.55 103 0.70 0.21
5 0.20 0.97 38 0.40 0.78 71 0.50 0.55 104 0.70 0.21
6 0.20 0.97 39 0.40 0.78 72 0.50 0.55 105 0.70 0.21
7 0.20 0.97 40 0.40 0.78 73 0.55 0.44 106 0.70 0.21
8 0.20 0.97 41 0.40 0.78 74 0.55 0.44 107 0.70 0.21
9 0.25 0.94 42 0.40 0.78 75 0.55 0.44 108 0.70 0.21
10 0.25 0.94 43 0.40 0.78 76 0.55 0.44 109 0.70 0.21
11 0.25 0.94 44 0.40 0.78 77 0.55 0.44 110 0.70 0.21
12 0.25 0.94 45 0.40 0.78 78 0.55 0.44 111 0.70 0.21
13 0.25 0.94 46 0.40 0.78 79 0.55 0.44 112 0.75 0.14
14 0.25 0.94 47 0.40 0.78 80 0.55 0.44 113 0.75 0.14
15 0.25 0.94 48 0.40 0.78 81 0.55 0.44 114 0.75 0.14
16 0.25 0.94 49 0.45 0.63 82 0.55 0.44 115 0.75 0.14
17 0.30 0.88 50 0.45 0.63 83 0.55 0.44 116 0.75 0.14
18 0.30 0.88 51 0.45 0.63 84 0.60 0.36 117 0.75 0.14
19 0.35 0.86 52 0.45 0.63 84 0.60 0.36 118 0.75 0.14
20 0.35 0.86 53 0.45 0.63 86 0.60 0.36 119 0.75 0.14
21 0.35 0.86 54 0.45 0.63 87 0.60 0.36 120 0.80 0.08
22 0.35 0.86 55 0.45 0.63 88 0.60 0.36 121 0.80 0.08
23 0.35 0.86 56 0.45 0.63 89 0.60 0.36 122 0.85 0.06
24 0.35 0.86 57 0.45 0.63 90 0.60 0.36 123 0.85 0.06
25 0.35 0.86 58 0.45 0.63 91 0.60 0.36 124 0.90 0.05
26 0.35 0.86 59 0.50 0.55 92 0.65 0.29 125 0.90 0.05
27 0.35 0.86 60 0.50 0.55 93 0.65 0.29 126 0.90 0.05
28 0.35 0.86 61 0.50 0.55 94 0.65 0.29 127 0.90 0.05
29 0.35 0.86 62 0.50 0.55 95 0.65 0.29 128 0.95 0.02
30 0.40 0.78 63 0.50 0.55 96 0.65 0.29 129 1.00 0.01
31 0.40 0.78 64 0.50 0.55 97 0.65 0.29
32 0.40 0.78 65 0.50 0.55 98 0.65 0.29
33 0.40 0.78 66 0.50 0.55 99 0.65 0.29
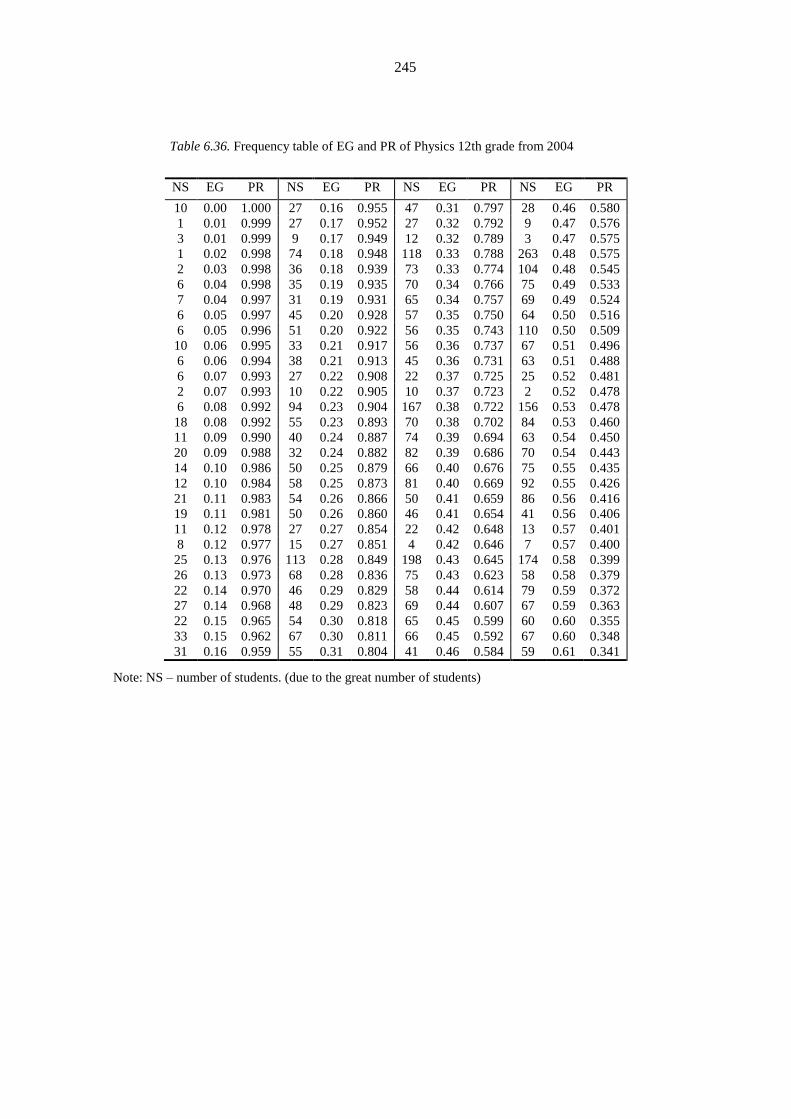
245
Table 6.36. Frequency table of EG and PR of Physics 12th grade from 2004
NS EG PR NS EG PR NS EG PR NS EG PR
10 0.00 1.000 27 0.16 0.955 47 0.31 0.797 28 0.46 0.580
1 0.01 0.999 27 0.17 0.952 27 0.32 0.792 9 0.47 0.576
3 0.01 0.999 9 0.17 0.949 12 0.32 0.789 3 0.47 0.575
1 0.02 0.998 74 0.18 0.948 118 0.33 0.788 263 0.48 0.575
2 0.03 0.998 36 0.18 0.939 73 0.33 0.774 104 0.48 0.545
6 0.04 0.998 35 0.19 0.935 70 0.34 0.766 75 0.49 0.533
7 0.04 0.997 31 0.19 0.931 65 0.34 0.757 69 0.49 0.524
6 0.05 0.997 45 0.20 0.928 57 0.35 0.750 64 0.50 0.516
6 0.05 0.996 51 0.20 0.922 56 0.35 0.743 110 0.50 0.509
10 0.06 0.995 33 0.21 0.917 56 0.36 0.737 67 0.51 0.496
6 0.06 0.994 38 0.21 0.913 45 0.36 0.731 63 0.51 0.488
6 0.07 0.993 27 0.22 0.908 22 0.37 0.725 25 0.52 0.481
2 0.07 0.993 10 0.22 0.905 10 0.37 0.723 2 0.52 0.478
6 0.08 0.992 94 0.23 0.904 167 0.38 0.722 156 0.53 0.478
18 0.08 0.992 55 0.23 0.893 70 0.38 0.702 84 0.53 0.460
11 0.09 0.990 40 0.24 0.887 74 0.39 0.694 63 0.54 0.450
20 0.09 0.988 32 0.24 0.882 82 0.39 0.686 70 0.54 0.443
14 0.10 0.986 50 0.25 0.879 66 0.40 0.676 75 0.55 0.435
12 0.10 0.984 58 0.25 0.873 81 0.40 0.669 92 0.55 0.426
21 0.11 0.983 54 0.26 0.866 50 0.41 0.659 86 0.56 0.416
19 0.11 0.981 50 0.26 0.860 46 0.41 0.654 41 0.56 0.406
11 0.12 0.978 27 0.27 0.854 22 0.42 0.648 13 0.57 0.401
8 0.12 0.977 15 0.27 0.851 4 0.42 0.646 7 0.57 0.400
25 0.13 0.976 113 0.28 0.849 198 0.43 0.645 174 0.58 0.399
26 0.13 0.973 68 0.28 0.836 75 0.43 0.623 58 0.58 0.379
22 0.14 0.970 46 0.29 0.829 58 0.44 0.614 79 0.59 0.372
27 0.14 0.968 48 0.29 0.823 69 0.44 0.607 67 0.59 0.363
22 0.15 0.965 54 0.30 0.818 65 0.45 0.599 60 0.60 0.355
33 0.15 0.962 67 0.30 0.811 66 0.45 0.592 67 0.60 0.348
31 0.16 0.959 55 0.31 0.804 41 0.46 0.584 59 0.61 0.341
Note: NS – number of students. (due to the great number of students)
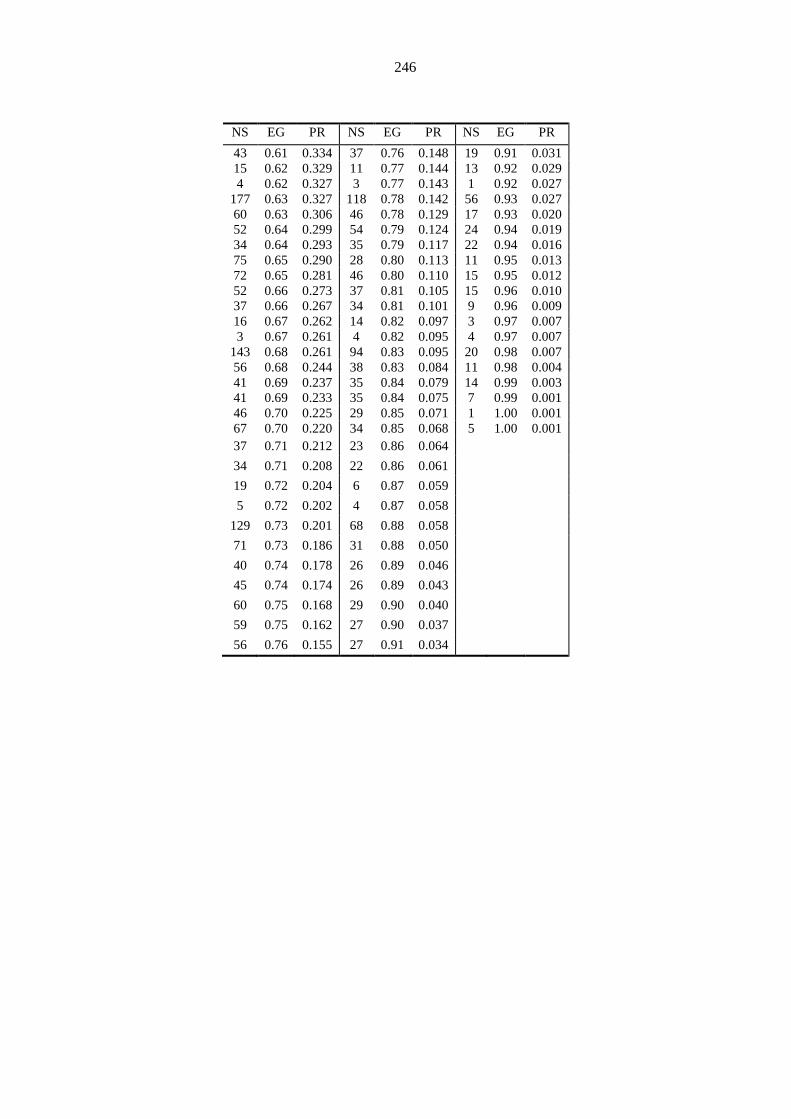
246
NS EG PR NS EG PR NS EG PR
43 0.61 0.334 37 0.76 0.148 19 0.91 0.031
15 0.62 0.329 11 0.77 0.144 13 0.92 0.029
4 0.62 0.327 3 0.77 0.143 1 0.92 0.027
177 0.63 0.327 118 0.78 0.142 56 0.93 0.027
60 0.63 0.306 46 0.78 0.129 17 0.93 0.020
52 0.64 0.299 54 0.79 0.124 24 0.94 0.019
34 0.64 0.293 35 0.79 0.117 22 0.94 0.016
75 0.65 0.290 28 0.80 0.113 11 0.95 0.013
72 0.65 0.281 46 0.80 0.110 15 0.95 0.012
52 0.66 0.273 37 0.81 0.105 15 0.96 0.010
37 0.66 0.267 34 0.81 0.101 9 0.96 0.009
16 0.67 0.262 14 0.82 0.097 3 0.97 0.007
3 0.67 0.261 4 0.82 0.095 4 0.97 0.007
143 0.68 0.261 94 0.83 0.095 20 0.98 0.007
56 0.68 0.244 38 0.83 0.084 11 0.98 0.004
41 0.69 0.237 35 0.84 0.079 14 0.99 0.003
41 0.69 0.233 35 0.84 0.075 7 0.99 0.001
46 0.70 0.225 29 0.85 0.071 1 1.00 0.001
67 0.70 0.220 34 0.85 0.068 5 1.00 0.001
37 0.71 0.212 23 0.86 0.064
34 0.71 0.208 22 0.86 0.061
19 0.72 0.204 6 0.87 0.059
5 0.72 0.202 4 0.87 0.058
129 0.73 0.201 68 0.88 0.058
71 0.73 0.186 31 0.88 0.050
40 0.74 0.178 26 0.89 0.046
45 0.74 0.174 26 0.89 0.043
60 0.75 0.168 29 0.90 0.040
59 0.75 0.162 27 0.90 0.037
56 0.76 0.155 27 0.91 0.034
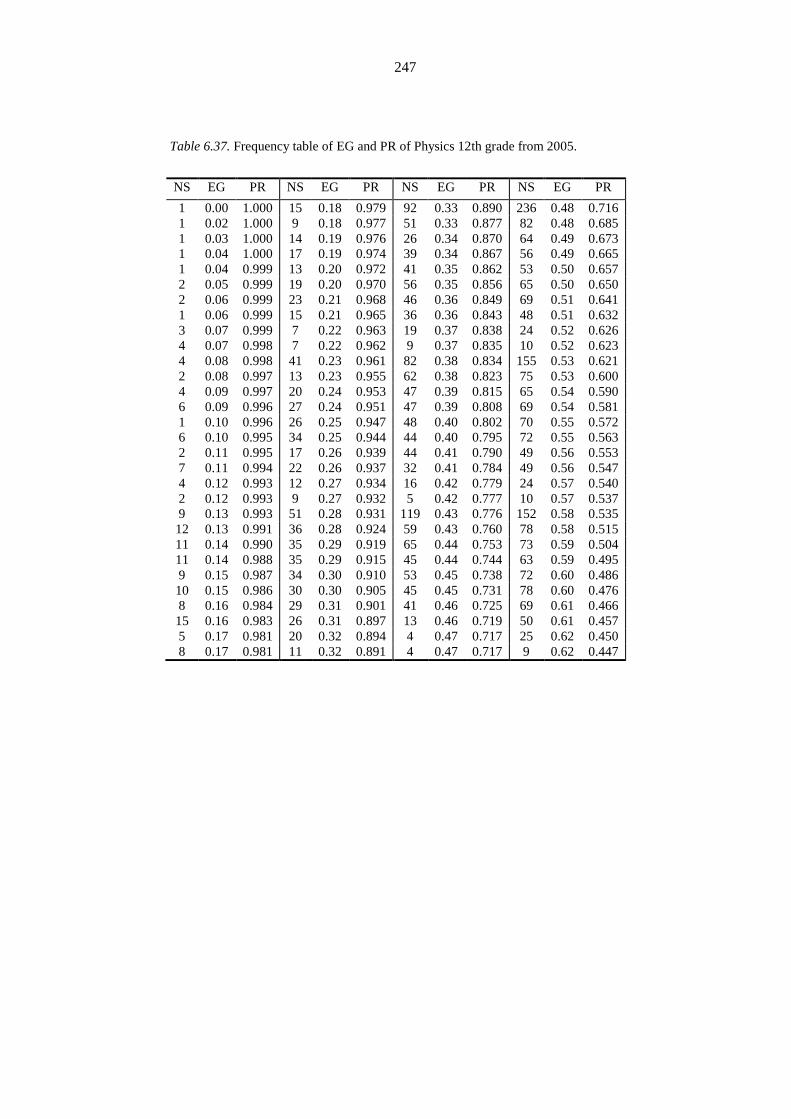
247
Table 6.37. Frequency table of EG and PR of Physics 12th grade from 2005.
NS EG PR NS EG PR NS EG PR NS EG PR
1 0.00 1.000 15 0.18 0.979 92 0.33 0.890 236 0.48 0.716
1 0.02 1.000 9 0.18 0.977 51 0.33 0.877 82 0.48 0.685
1 0.03 1.000 14 0.19 0.976 26 0.34 0.870 64 0.49 0.673
1 0.04 1.000 17 0.19 0.974 39 0.34 0.867 56 0.49 0.665
1 0.04 0.999 13 0.20 0.972 41 0.35 0.862 53 0.50 0.657
2 0.05 0.999 19 0.20 0.970 56 0.35 0.856 65 0.50 0.650
2 0.06 0.999 23 0.21 0.968 46 0.36 0.849 69 0.51 0.641
1 0.06 0.999 15 0.21 0.965 36 0.36 0.843 48 0.51 0.632
3 0.07 0.999 7 0.22 0.963 19 0.37 0.838 24 0.52 0.626
4 0.07 0.998 7 0.22 0.962 9 0.37 0.835 10 0.52 0.623
4 0.08 0.998 41 0.23 0.961 82 0.38 0.834 155 0.53 0.621
2 0.08 0.997 13 0.23 0.955 62 0.38 0.823 75 0.53 0.600
4 0.09 0.997 20 0.24 0.953 47 0.39 0.815 65 0.54 0.590
6 0.09 0.996 27 0.24 0.951 47 0.39 0.808 69 0.54 0.581
1 0.10 0.996 26 0.25 0.947 48 0.40 0.802 70 0.55 0.572
6 0.10 0.995 34 0.25 0.944 44 0.40 0.795 72 0.55 0.563
2 0.11 0.995 17 0.26 0.939 44 0.41 0.790 49 0.56 0.553
7 0.11 0.994 22 0.26 0.937 32 0.41 0.784 49 0.56 0.547
4 0.12 0.993 12 0.27 0.934 16 0.42 0.779 24 0.57 0.540
2 0.12 0.993 9 0.27 0.932 5 0.42 0.777 10 0.57 0.537
9 0.13 0.993 51 0.28 0.931 119 0.43 0.776 152 0.58 0.535
12 0.13 0.991 36 0.28 0.924 59 0.43 0.760 78 0.58 0.515
11 0.14 0.990 35 0.29 0.919 65 0.44 0.753 73 0.59 0.504
11 0.14 0.988 35 0.29 0.915 45 0.44 0.744 63 0.59 0.495
9 0.15 0.987 34 0.30 0.910 53 0.45 0.738 72 0.60 0.486
10 0.15 0.986 30 0.30 0.905 45 0.45 0.731 78 0.60 0.476
8 0.16 0.984 29 0.31 0.901 41 0.46 0.725 69 0.61 0.466
15 0.16 0.983 26 0.31 0.897 13 0.46 0.719 50 0.61 0.457
5 0.17 0.981 20 0.32 0.894 4 0.47 0.717 25 0.62 0.450
8 0.17 0.981 11 0.32 0.891 4 0.47 0.717 9 0.62 0.447
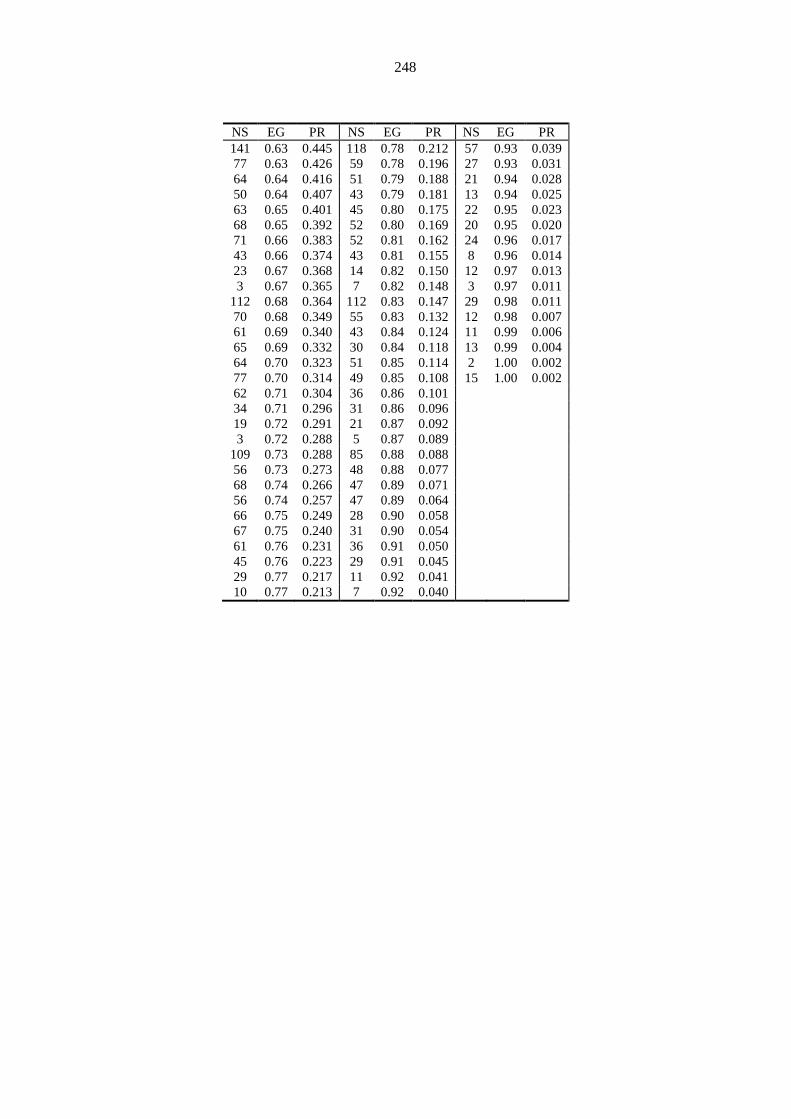
248
NS EG PR NS EG PR NS EG PR
141 0.63 0.445 118 0.78 0.212 57 0.93 0.039
77 0.63 0.426 59 0.78 0.196 27 0.93 0.031
64 0.64 0.416 51 0.79 0.188 21 0.94 0.028
50 0.64 0.407 43 0.79 0.181 13 0.94 0.025
63 0.65 0.401 45 0.80 0.175 22 0.95 0.023
68 0.65 0.392 52 0.80 0.169 20 0.95 0.020
71 0.66 0.383 52 0.81 0.162 24 0.96 0.017
43 0.66 0.374 43 0.81 0.155 8 0.96 0.014
23 0.67 0.368 14 0.82 0.150 12 0.97 0.013
3 0.67 0.365 7 0.82 0.148 3 0.97 0.011
112 0.68 0.364 112 0.83 0.147 29 0.98 0.011
70 0.68 0.349 55 0.83 0.132 12 0.98 0.007
61 0.69 0.340 43 0.84 0.124 11 0.99 0.006
65 0.69 0.332 30 0.84 0.118 13 0.99 0.004
64 0.70 0.323 51 0.85 0.114 2 1.00 0.002
77 0.70 0.314 49 0.85 0.108 15 1.00 0.002
62 0.71 0.304 36 0.86 0.101
34 0.71 0.296 31 0.86 0.096
19 0.72 0.291 21 0.87 0.092
3 0.72 0.288 5 0.87 0.089
109 0.73 0.288 85 0.88 0.088
56 0.73 0.273 48 0.88 0.077
68 0.74 0.266 47 0.89 0.071
56 0.74 0.257 47 0.89 0.064
66 0.75 0.249 28 0.90 0.058
67 0.75 0.240 31 0.90 0.054
61 0.76 0.231 36 0.91 0.050
45 0.76 0.223 29 0.91 0.045
29 0.77 0.217 11 0.92 0.041
10 0.77 0.213 7 0.92 0.040
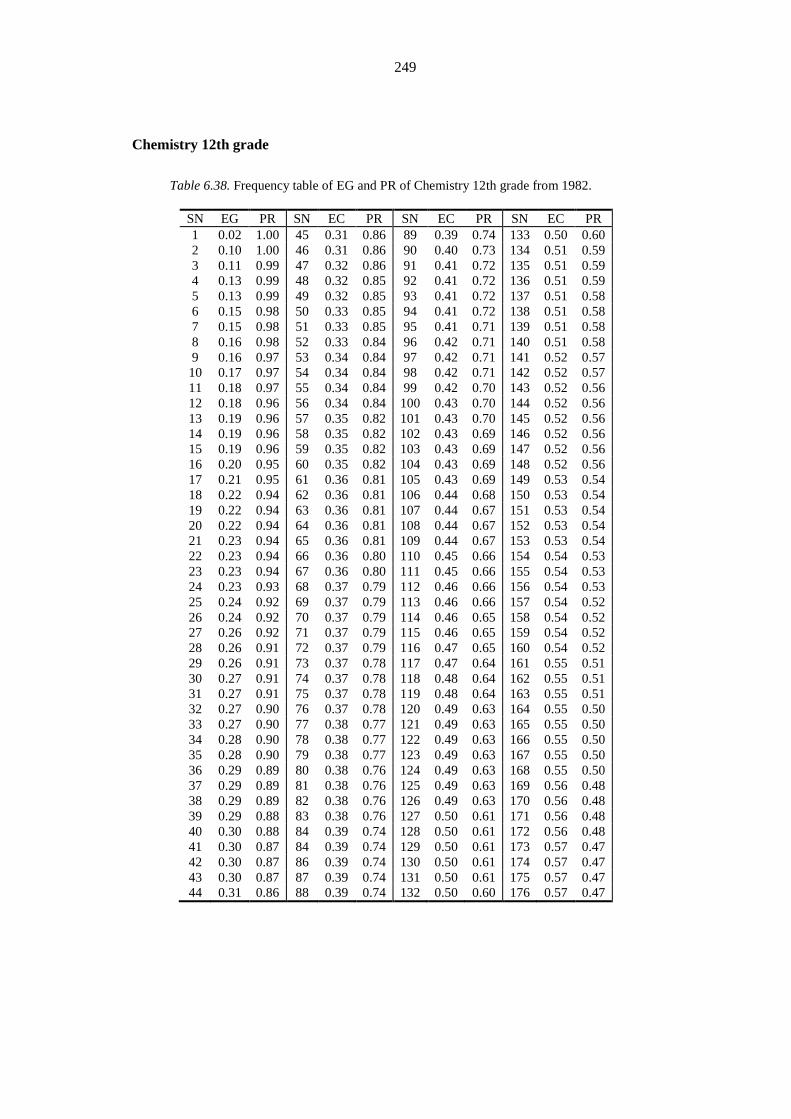
249
Chemistry 12th grade
Table 6.38. Frequency table of EG and PR of Chemistry 12th grade from 1982.
SN EG PR SN EC PR SN EC PR SN EC PR
1 0.02 1.00 45 0.31 0.86 89 0.39 0.74 133 0.50 0.60
2 0.10 1.00 46 0.31 0.86 90 0.40 0.73 134 0.51 0.59
3 0.11 0.99 47 0.32 0.86 91 0.41 0.72 135 0.51 0.59
4 0.13 0.99 48 0.32 0.85 92 0.41 0.72 136 0.51 0.59
5 0.13 0.99 49 0.32 0.85 93 0.41 0.72 137 0.51 0.58
6 0.15 0.98 50 0.33 0.85 94 0.41 0.72 138 0.51 0.58
7 0.15 0.98 51 0.33 0.85 95 0.41 0.71 139 0.51 0.58
8 0.16 0.98 52 0.33 0.84 96 0.42 0.71 140 0.51 0.58
9 0.16 0.97 53 0.34 0.84 97 0.42 0.71 141 0.52 0.57
10 0.17 0.97 54 0.34 0.84 98 0.42 0.71 142 0.52 0.57
11 0.18 0.97 55 0.34 0.84 99 0.42 0.70 143 0.52 0.56
12 0.18 0.96 56 0.34 0.84 100 0.43 0.70 144 0.52 0.56
13 0.19 0.96 57 0.35 0.82 101 0.43 0.70 145 0.52 0.56
14 0.19 0.96 58 0.35 0.82 102 0.43 0.69 146 0.52 0.56
15 0.19 0.96 59 0.35 0.82 103 0.43 0.69 147 0.52 0.56
16 0.20 0.95 60 0.35 0.82 104 0.43 0.69 148 0.52 0.56
17 0.21 0.95 61 0.36 0.81 105 0.43 0.69 149 0.53 0.54
18 0.22 0.94 62 0.36 0.81 106 0.44 0.68 150 0.53 0.54
19 0.22 0.94 63 0.36 0.81 107 0.44 0.67 151 0.53 0.54
20 0.22 0.94 64 0.36 0.81 108 0.44 0.67 152 0.53 0.54
21 0.23 0.94 65 0.36 0.81 109 0.44 0.67 153 0.53 0.54
22 0.23 0.94 66 0.36 0.80 110 0.45 0.66 154 0.54 0.53
23 0.23 0.94 67 0.36 0.80 111 0.45 0.66 155 0.54 0.53
24 0.23 0.93 68 0.37 0.79 112 0.46 0.66 156 0.54 0.53
25 0.24 0.92 69 0.37 0.79 113 0.46 0.66 157 0.54 0.52
26 0.24 0.92 70 0.37 0.79 114 0.46 0.65 158 0.54 0.52
27 0.26 0.92 71 0.37 0.79 115 0.46 0.65 159 0.54 0.52
28 0.26 0.91 72 0.37 0.79 116 0.47 0.65 160 0.54 0.52
29 0.26 0.91 73 0.37 0.78 117 0.47 0.64 161 0.55 0.51
30 0.27 0.91 74 0.37 0.78 118 0.48 0.64 162 0.55 0.51
31 0.27 0.91 75 0.37 0.78 119 0.48 0.64 163 0.55 0.51
32 0.27 0.90 76 0.37 0.78 120 0.49 0.63 164 0.55 0.50
33 0.27 0.90 77 0.38 0.77 121 0.49 0.63 165 0.55 0.50
34 0.28 0.90 78 0.38 0.77 122 0.49 0.63 166 0.55 0.50
35 0.28 0.90 79 0.38 0.77 123 0.49 0.63 167 0.55 0.50
36 0.29 0.89 80 0.38 0.76 124 0.49 0.63 168 0.55 0.50
37 0.29 0.89 81 0.38 0.76 125 0.49 0.63 169 0.56 0.48
38 0.29 0.89 82 0.38 0.76 126 0.49 0.63 170 0.56 0.48
39 0.29 0.88 83 0.38 0.76 127 0.50 0.61 171 0.56 0.48
40 0.30 0.88 84 0.39 0.74 128 0.50 0.61 172 0.56 0.48
41 0.30 0.87 84 0.39 0.74 129 0.50 0.61 173 0.57 0.47
42 0.30 0.87 86 0.39 0.74 130 0.50 0.61 174 0.57 0.47
43 0.30 0.87 87 0.39 0.74 131 0.50 0.61 175 0.57 0.47
44 0.31 0.86 88 0.39 0.74 132 0.50 0.60 176 0.57 0.47

250
SN EG PR SN EC PR SN EC PR SN EC PR
177 0.58 0.46 216 0.68 0.33 255 0.78 0.19 294 0.92 0.05
178 0.58 0.46 217 0.68 0.32 256 0.79 0.18 295 0.92 0.05
179 0.58 0.46 218 0.68 0.32 257 0.79 0.18 296 0.92 0.05
180 0.58 0.46 219 0.68 0.32 258 0.79 0.18 297 0.92 0.04
181 0.58 0.45 220 0.68 0.32 259 0.79 0.18 298 0.92 0.04
182 0.58 0.45 221 0.69 0.31 260 0.79 0.18 299 0.93 0.04
183 0.59 0.44 222 0.69 0.31 261 0.80 0.17 300 0.94 0.03
184 0.59 0.44 223 0.69 0.30 262 0.80 0.17 301 0.94 0.03
185 0.59 0.44 224 0.69 0.30 263 0.80 0.17 302 0.94 0.03
186 0.59 0.44 225 0.70 0.30 264 0.81 0.16 303 0.94 0.02
187 0.59 0.44 226 0.70 0.30 265 0.81 0.16 304 0.95 0.02
188 0.59 0.44 227 0.70 0.30 266 0.81 0.15 305 0.95 0.02
189 0.60 0.42 228 0.70 0.29 267 0.81 0.15 306 0.95 0.02
190 0.60 0.42 229 0.70 0.29 268 0.81 0.15 307 0.96 0.01
191 0.60 0.42 230 0.70 0.29 269 0.82 0.14 308 0.96 0.01
192 0.60 0.41 231 0.70 0.29 270 0.82 0.14 309 0.97 0.01
193 0.61 0.41 232 0.70 0.29 271 0.82 0.14 310 0.99 0.00
194 0.61 0.41 233 0.71 0.27 272 0.82 0.14 311 0.92 0.05
195 0.61 0.41 234 0.71 0.27 273 0.83 0.13 309 0.92 0.05
196 0.62 0.40 235 0.72 0.26 274 0.84 0.13 310 0.92 0.05
197 0.62 0.40 236 0.72 0.26 275 0.84 0.13 309 0.92 0.04
198 0.62 0.40 237 0.73 0.26 276 0.84 0.13 310 0.92 0.04
199 0.62 0.40 238 0.73 0.26 277 0.84 0.13 311 0.93 0.04
200 0.63 0.39 239 0.73 0.26 278 0.85 0.12 312 0.94 0.03
201 0.63 0.39 240 0.74 0.25 279 0.85 0.11 313 0.94 0.03
202 0.63 0.38 241 0.74 0.25 280 0.85 0.11 314 0.94 0.03
203 0.64 0.38 242 0.74 0.24 281 0.85 0.11 315 0.94 0.02
204 0.64 0.38 243 0.74 0.24 282 0.86 0.10 316 0.95 0.02
205 0.65 0.37 244 0.74 0.24 283 0.86 0.10 317 0.95 0.02
206 0.65 0.37 245 0.74 0.24 284 0.87 0.10 318 0.95 0.02
207 0.65 0.37 246 0.74 0.24 285 0.87 0.10 319 0.96 0.01
208 0.65 0.37 247 0.75 0.23 286 0.87 0.10 320 0.96 0.01
209 0.65 0.37 248 0.75 0.23 287 0.87 0.10 321 0.97 0.01
210 0.65 0.36 249 0.75 0.23 288 0.87 0.09 322 0.99 0.00
211 0.66 0.35 250 0.75 0.22 289 0.88 0.08 323 0.92 0.05
212 0.66 0.35 251 0.75 0.22 290 0.88 0.08 324 0.92 0.05
213 0.66 0.35 252 0.75 0.22 291 0.88 0.08 325 0.92 0.05
214 0.66 0.35 253 0.76 0.21 292 0.88 0.07
215 0.67 0.34 254 0.76 0.21 293 0.90 0.07
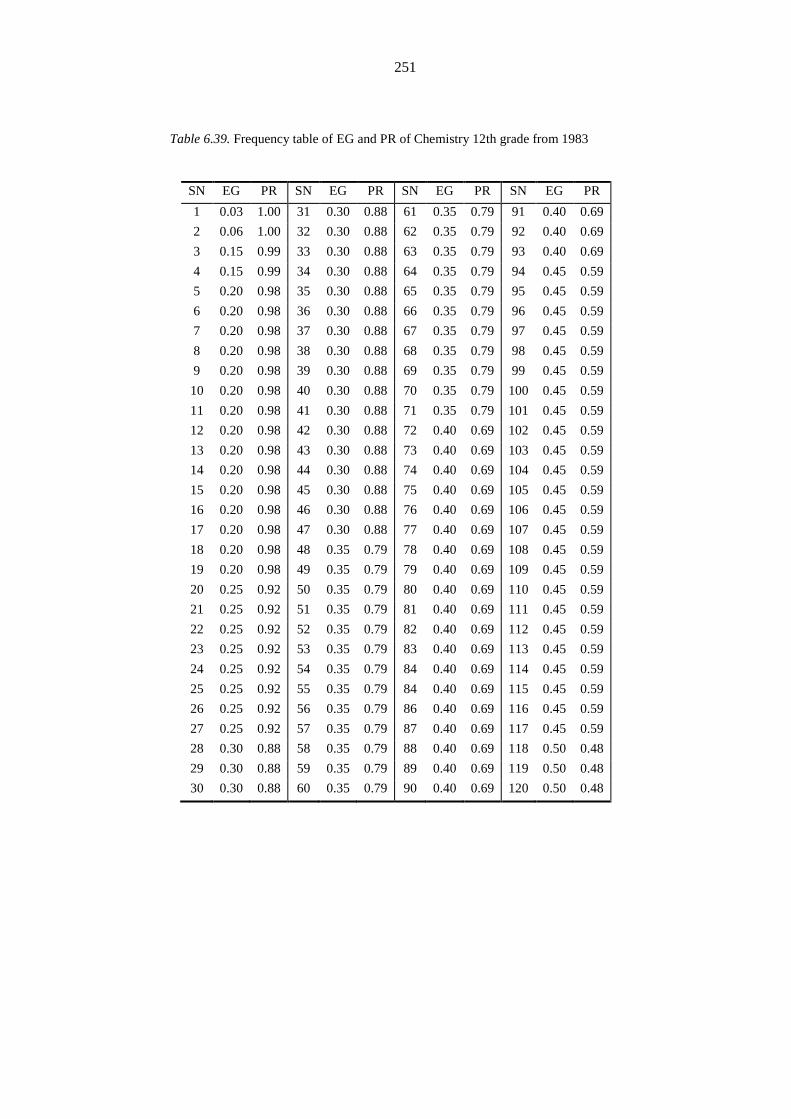
251
Table 6.39. Frequency table of EG and PR of Chemistry 12th grade from 1983
SN EG PR SN EG PR SN EG PR SN EG PR
1 0.03 1.00 31 0.30 0.88 61 0.35 0.79 91 0.40 0.69
2 0.06 1.00 32 0.30 0.88 62 0.35 0.79 92 0.40 0.69
3 0.15 0.99 33 0.30 0.88 63 0.35 0.79 93 0.40 0.69
4 0.15 0.99 34 0.30 0.88 64 0.35 0.79 94 0.45 0.59
5 0.20 0.98 35 0.30 0.88 65 0.35 0.79 95 0.45 0.59
6 0.20 0.98 36 0.30 0.88 66 0.35 0.79 96 0.45 0.59
7 0.20 0.98 37 0.30 0.88 67 0.35 0.79 97 0.45 0.59
8 0.20 0.98 38 0.30 0.88 68 0.35 0.79 98 0.45 0.59
9 0.20 0.98 39 0.30 0.88 69 0.35 0.79 99 0.45 0.59
10 0.20 0.98 40 0.30 0.88 70 0.35 0.79 100 0.45 0.59
11 0.20 0.98 41 0.30 0.88 71 0.35 0.79 101 0.45 0.59
12 0.20 0.98 42 0.30 0.88 72 0.40 0.69 102 0.45 0.59
13 0.20 0.98 43 0.30 0.88 73 0.40 0.69 103 0.45 0.59
14 0.20 0.98 44 0.30 0.88 74 0.40 0.69 104 0.45 0.59
15 0.20 0.98 45 0.30 0.88 75 0.40 0.69 105 0.45 0.59
16 0.20 0.98 46 0.30 0.88 76 0.40 0.69 106 0.45 0.59
17 0.20 0.98 47 0.30 0.88 77 0.40 0.69 107 0.45 0.59
18 0.20 0.98 48 0.35 0.79 78 0.40 0.69 108 0.45 0.59
19 0.20 0.98 49 0.35 0.79 79 0.40 0.69 109 0.45 0.59
20 0.25 0.92 50 0.35 0.79 80 0.40 0.69 110 0.45 0.59
21 0.25 0.92 51 0.35 0.79 81 0.40 0.69 111 0.45 0.59
22 0.25 0.92 52 0.35 0.79 82 0.40 0.69 112 0.45 0.59
23 0.25 0.92 53 0.35 0.79 83 0.40 0.69 113 0.45 0.59
24 0.25 0.92 54 0.35 0.79 84 0.40 0.69 114 0.45 0.59
25 0.25 0.92 55 0.35 0.79 84 0.40 0.69 115 0.45 0.59
26 0.25 0.92 56 0.35 0.79 86 0.40 0.69 116 0.45 0.59
27 0.25 0.92 57 0.35 0.79 87 0.40 0.69 117 0.45 0.59
28 0.30 0.88 58 0.35 0.79 88 0.40 0.69 118 0.50 0.48
29 0.30 0.88 59 0.35 0.79 89 0.40 0.69 119 0.50 0.48
30 0.30 0.88 60 0.35 0.79 90 0.40 0.69 120 0.50 0.48

252
SN EG PR SN EG PR SN EG PR SN EG PR
121 0.50 0.48 151 0.55 0.37 181 0.60 0.26 211 0.70 0.10
122 0.50 0.48 152 0.55 0.37 182 0.60 0.26 212 0.70 0.10
123 0.50 0.48 153 0.55 0.37 183 0.60 0.26 213 0.75 0.07
124 0.50 0.48 154 0.55 0.37 184 0.60 0.26 214 0.75 0.07
125 0.50 0.48 155 0.55 0.37 185 0.60 0.26 215 0.75 0.07
126 0.50 0.48 156 0.55 0.37 186 0.65 0.19 216 0.75 0.07
127 0.50 0.48 157 0.55 0.37 187 0.65 0.19 217 0.75 0.07
128 0.50 0.48 158 0.55 0.37 188 0.65 0.19 218 0.80 0.04
129 0.50 0.48 159 0.55 0.37 189 0.65 0.19 219 0.80 0.04
130 0.50 0.48 160 0.55 0.37 190 0.65 0.19 220 0.80 0.04
131 0.50 0.48 161 0.55 0.37 191 0.65 0.19 221 0.80 0.04
132 0.50 0.48 162 0.55 0.37 192 0.65 0.19 222 0.85 0.03
133 0.50 0.48 163 0.55 0.37 193 0.65 0.19 223 0.85 0.03
134 0.50 0.48 164 0.55 0.37 194 0.65 0.19 224 0.85 0.03
135 0.50 0.48 165 0.55 0.37 195 0.65 0.19 225 0.90 0.01
136 0.50 0.48 166 0.55 0.37 196 0.65 0.19 226 0.90 0.01
137 0.50 0.48 167 0.55 0.37 197 0.65 0.19 227 0.95 0.00
138 0.50 0.48 168 0.55 0.37 198 0.65 0.19
139 0.50 0.48 169 0.60 0.26 199 0.65 0.19
140 0.50 0.48 170 0.60 0.26 200 0.65 0.19
141 0.50 0.48 171 0.60 0.26 201 0.65 0.19
142 0.50 0.48 172 0.60 0.26 202 0.65 0.19
143 0.50 0.48 173 0.60 0.26 203 0.65 0.19
144 0.55 0.37 174 0.60 0.26 204 0.65 0.19
145 0.55 0.37 175 0.60 0.26 205 0.65 0.19
146 0.55 0.37 176 0.60 0.26 206 0.70 0.10
147 0.55 0.37 177 0.60 0.26 207 0.70 0.10
148 0.55 0.37 178 0.60 0.26 208 0.70 0.10
149 0.55 0.37 179 0.60 0.26 209 0.70 0.10
150 0,55 0,37 180 0,60 0,26 210 0,70 0,10
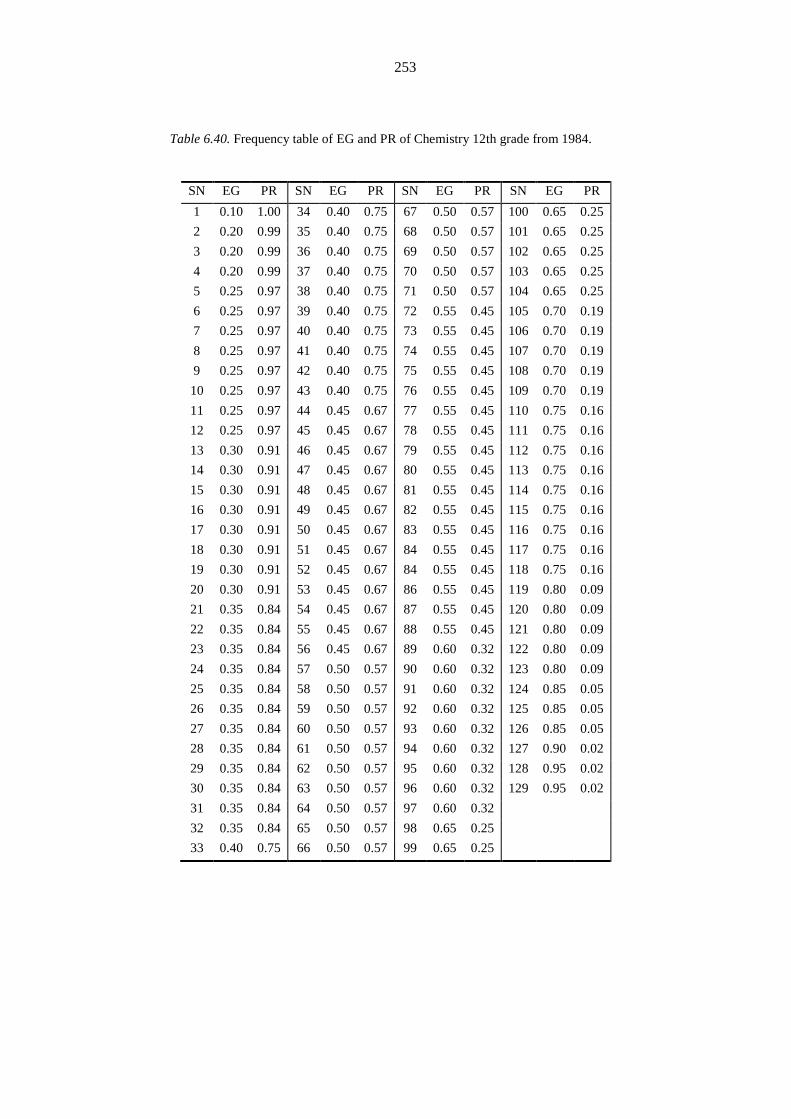
253
Table 6.40. Frequency table of EG and PR of Chemistry 12th grade from 1984.
SN EG PR SN EG PR SN EG PR SN EG PR
1 0.10 1.00 34 0.40 0.75 67 0.50 0.57 100 0.65 0.25
2 0.20 0.99 35 0.40 0.75 68 0.50 0.57 101 0.65 0.25
3 0.20 0.99 36 0.40 0.75 69 0.50 0.57 102 0.65 0.25
4 0.20 0.99 37 0.40 0.75 70 0.50 0.57 103 0.65 0.25
5 0.25 0.97 38 0.40 0.75 71 0.50 0.57 104 0.65 0.25
6 0.25 0.97 39 0.40 0.75 72 0.55 0.45 105 0.70 0.19
7 0.25 0.97 40 0.40 0.75 73 0.55 0.45 106 0.70 0.19
8 0.25 0.97 41 0.40 0.75 74 0.55 0.45 107 0.70 0.19
9 0.25 0.97 42 0.40 0.75 75 0.55 0.45 108 0.70 0.19
10 0.25 0.97 43 0.40 0.75 76 0.55 0.45 109 0.70 0.19
11 0.25 0.97 44 0.45 0.67 77 0.55 0.45 110 0.75 0.16
12 0.25 0.97 45 0.45 0.67 78 0.55 0.45 111 0.75 0.16
13 0.30 0.91 46 0.45 0.67 79 0.55 0.45 112 0.75 0.16
14 0.30 0.91 47 0.45 0.67 80 0.55 0.45 113 0.75 0.16
15 0.30 0.91 48 0.45 0.67 81 0.55 0.45 114 0.75 0.16
16 0.30 0.91 49 0.45 0.67 82 0.55 0.45 115 0.75 0.16
17 0.30 0.91 50 0.45 0.67 83 0.55 0.45 116 0.75 0.16
18 0.30 0.91 51 0.45 0.67 84 0.55 0.45 117 0.75 0.16
19 0.30 0.91 52 0.45 0.67 84 0.55 0.45 118 0.75 0.16
20 0.30 0.91 53 0.45 0.67 86 0.55 0.45 119 0.80 0.09
21 0.35 0.84 54 0.45 0.67 87 0.55 0.45 120 0.80 0.09
22 0.35 0.84 55 0.45 0.67 88 0.55 0.45 121 0.80 0.09
23 0.35 0.84 56 0.45 0.67 89 0.60 0.32 122 0.80 0.09
24 0.35 0.84 57 0.50 0.57 90 0.60 0.32 123 0.80 0.09
25 0.35 0.84 58 0.50 0.57 91 0.60 0.32 124 0.85 0.05
26 0.35 0.84 59 0.50 0.57 92 0.60 0.32 125 0.85 0.05
27 0.35 0.84 60 0.50 0.57 93 0.60 0.32 126 0.85 0.05
28 0.35 0.84 61 0.50 0.57 94 0.60 0.32 127 0.90 0.02
29 0.35 0.84 62 0.50 0.57 95 0.60 0.32 128 0.95 0.02
30 0.35 0.84 63 0.50 0.57 96 0.60 0.32 129 0.95 0.02
31 0.35 0.84 64 0.50 0.57 97 0.60 0.32
32 0.35 0.84 65 0.50 0.57 98 0.65 0.25
33 0.40 0.75 66 0.50 0.57 99 0.65 0.25
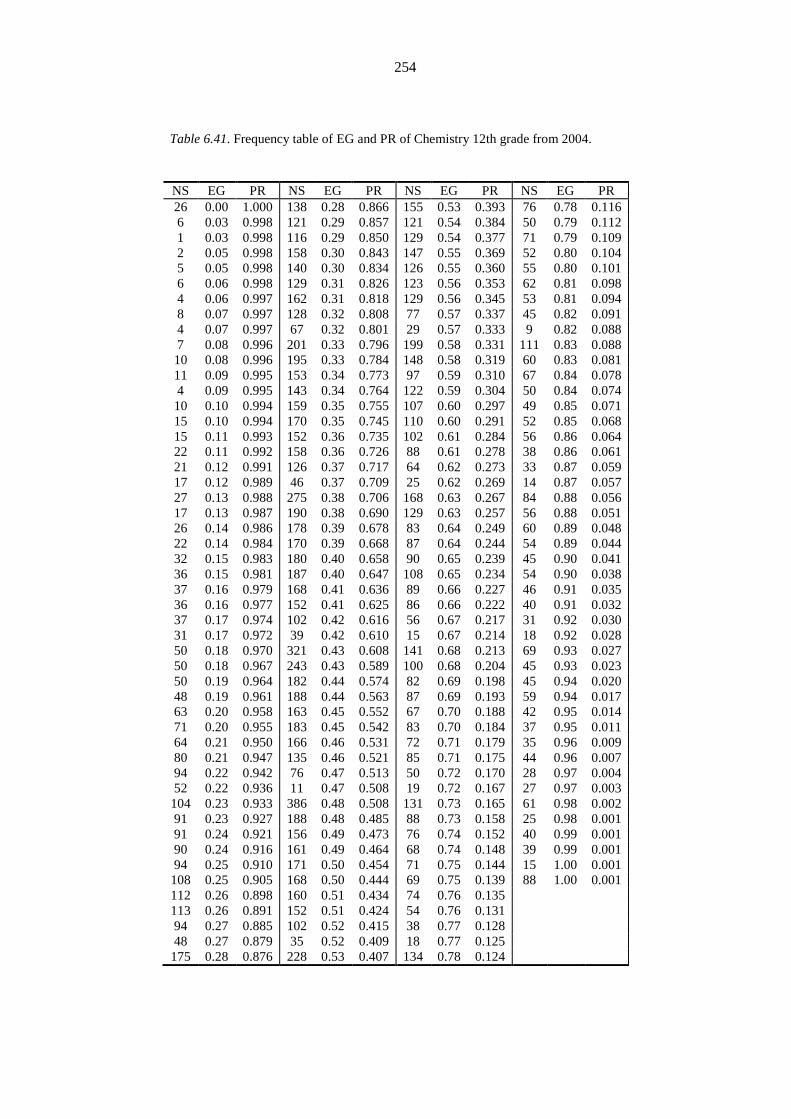
254
Table 6.41. Frequency table of EG and PR of Chemistry 12th grade from 2004.
NS EG PR NS EG PR NS EG PR NS EG PR
26 0.00 1.000 138 0.28 0.866 155 0.53 0.393 76 0.78 0.116
6 0.03 0.998 121 0.29 0.857 121 0.54 0.384 50 0.79 0.112
1 0.03 0.998 116 0.29 0.850 129 0.54 0.377 71 0.79 0.109
2 0.05 0.998 158 0.30 0.843 147 0.55 0.369 52 0.80 0.104
5 0.05 0.998 140 0.30 0.834 126 0.55 0.360 55 0.80 0.101
6 0.06 0.998 129 0.31 0.826 123 0.56 0.353 62 0.81 0.098
4 0.06 0.997 162 0.31 0.818 129 0.56 0.345 53 0.81 0.094
8 0.07 0.997 128 0.32 0.808 77 0.57 0.337 45 0.82 0.091
4 0.07 0.997 67 0.32 0.801 29 0.57 0.333 9 0.82 0.088
7 0.08 0.996 201 0.33 0.796 199 0.58 0.331 111 0.83 0.088
10 0.08 0.996 195 0.33 0.784 148 0.58 0.319 60 0.83 0.081
11 0.09 0.995 153 0.34 0.773 97 0.59 0.310 67 0.84 0.078
4 0.09 0.995 143 0.34 0.764 122 0.59 0.304 50 0.84 0.074
10 0.10 0.994 159 0.35 0.755 107 0.60 0.297 49 0.85 0.071
15 0.10 0.994 170 0.35 0.745 110 0.60 0.291 52 0.85 0.068
15 0.11 0.993 152 0.36 0.735 102 0.61 0.284 56 0.86 0.064
22 0.11 0.992 158 0.36 0.726 88 0.61 0.278 38 0.86 0.061
21 0.12 0.991 126 0.37 0.717 64 0.62 0.273 33 0.87 0.059
17 0.12 0.989 46 0.37 0.709 25 0.62 0.269 14 0.87 0.057
27 0.13 0.988 275 0.38 0.706 168 0.63 0.267 84 0.88 0.056
17 0.13 0.987 190 0.38 0.690 129 0.63 0.257 56 0.88 0.051
26 0.14 0.986 178 0.39 0.678 83 0.64 0.249 60 0.89 0.048
22 0.14 0.984 170 0.39 0.668 87 0.64 0.244 54 0.89 0.044
32 0.15 0.983 180 0.40 0.658 90 0.65 0.239 45 0.90 0.041
36 0.15 0.981 187 0.40 0.647 108 0.65 0.234 54 0.90 0.038
37 0.16 0.979 168 0.41 0.636 89 0.66 0.227 46 0.91 0.035
36 0.16 0.977 152 0.41 0.625 86 0.66 0.222 40 0.91 0.032
37 0.17 0.974 102 0.42 0.616 56 0.67 0.217 31 0.92 0.030
31 0.17 0.972 39 0.42 0.610 15 0.67 0.214 18 0.92 0.028
50 0.18 0.970 321 0.43 0.608 141 0.68 0.213 69 0.93 0.027
50 0.18 0.967 243 0.43 0.589 100 0.68 0.204 45 0.93 0.023
50 0.19 0.964 182 0.44 0.574 82 0.69 0.198 45 0.94 0.020
48 0.19 0.961 188 0.44 0.563 87 0.69 0.193 59 0.94 0.017
63 0.20 0.958 163 0.45 0.552 67 0.70 0.188 42 0.95 0.014
71 0.20 0.955 183 0.45 0.542 83 0.70 0.184 37 0.95 0.011
64 0.21 0.950 166 0.46 0.531 72 0.71 0.179 35 0.96 0.009
80 0.21 0.947 135 0.46 0.521 85 0.71 0.175 44 0.96 0.007
94 0.22 0.942 76 0.47 0.513 50 0.72 0.170 28 0.97 0.004
52 0.22 0.936 11 0.47 0.508 19 0.72 0.167 27 0.97 0.003
104 0.23 0.933 386 0.48 0.508 131 0.73 0.165 61 0.98 0.002
91 0.23 0.927 188 0.48 0.485 88 0.73 0.158 25 0.98 0.001
91 0.24 0.921 156 0.49 0.473 76 0.74 0.152 40 0.99 0.001
90 0.24 0.916 161 0.49 0.464 68 0.74 0.148 39 0.99 0.001
94 0.25 0.910 171 0.50 0.454 71 0.75 0.144 15 1.00 0.001
108 0.25 0.905 168 0.50 0.444 69 0.75 0.139 88 1.00 0.001
112 0.26 0.898 160 0.51 0.434 74 0.76 0.135
113 0.26 0.891 152 0.51 0.424 54 0.76 0.131
94 0.27 0.885 102 0.52 0.415 38 0.77 0.128
48 0.27 0.879 35 0.52 0.409 18 0.77 0.125
175 0.28 0.876 228 0.53 0.407 134 0.78 0.124
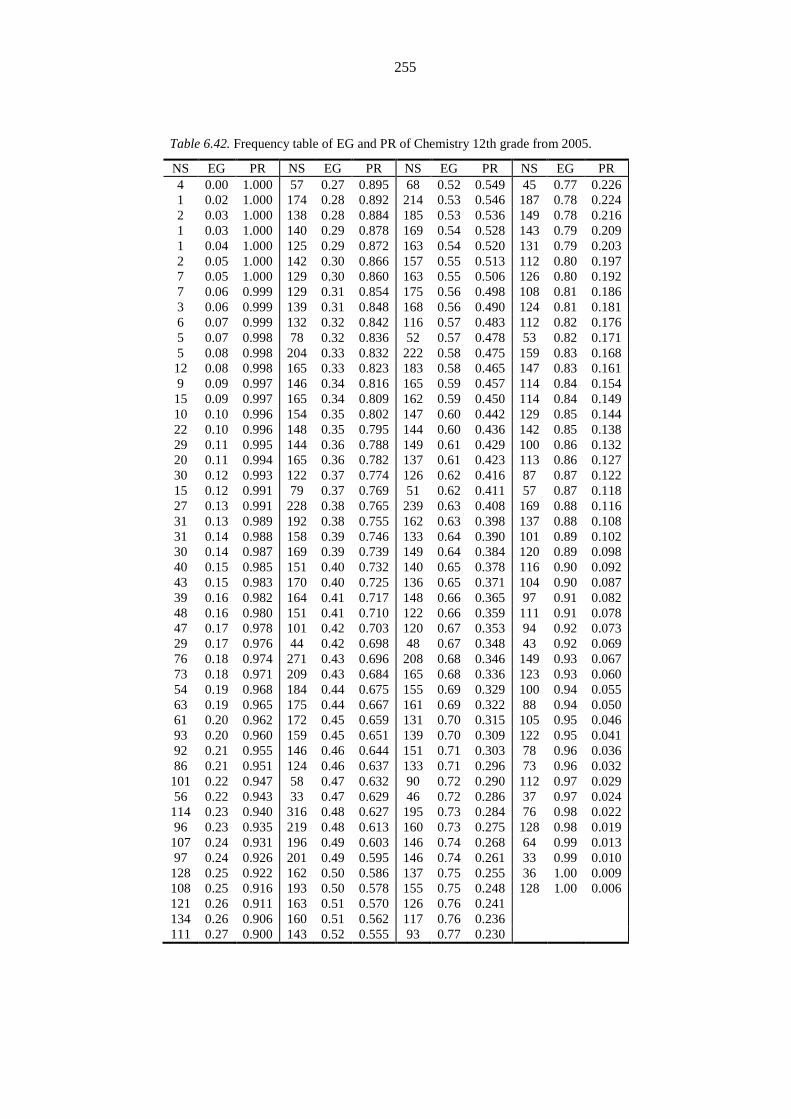
255
Table 6.42. Frequency table of EG and PR of Chemistry 12th grade from 2005.
NS EG PR NS EG PR NS EG PR NS EG PR
4 0.00 1.000 57 0.27 0.895 68 0.52 0.549 45 0.77 0.226
1 0.02 1.000 174 0.28 0.892 214 0.53 0.546 187 0.78 0.224
2 0.03 1.000 138 0.28 0.884 185 0.53 0.536 149 0.78 0.216
1 0.03 1.000 140 0.29 0.878 169 0.54 0.528 143 0.79 0.209
1 0.04 1.000 125 0.29 0.872 163 0.54 0.520 131 0.79 0.203
2 0.05 1.000 142 0.30 0.866 157 0.55 0.513 112 0.80 0.197
7 0.05 1.000 129 0.30 0.860 163 0.55 0.506 126 0.80 0.192
7 0.06 0.999 129 0.31 0.854 175 0.56 0.498 108 0.81 0.186
3 0.06 0.999 139 0.31 0.848 168 0.56 0.490 124 0.81 0.181
6 0.07 0.999 132 0.32 0.842 116 0.57 0.483 112 0.82 0.176
5 0.07 0.998 78 0.32 0.836 52 0.57 0.478 53 0.82 0.171
5 0.08 0.998 204 0.33 0.832 222 0.58 0.475 159 0.83 0.168
12 0.08 0.998 165 0.33 0.823 183 0.58 0.465 147 0.83 0.161
9 0.09 0.997 146 0.34 0.816 165 0.59 0.457 114 0.84 0.154
15 0.09 0.997 165 0.34 0.809 162 0.59 0.450 114 0.84 0.149
10 0.10 0.996 154 0.35 0.802 147 0.60 0.442 129 0.85 0.144
22 0.10 0.996 148 0.35 0.795 144 0.60 0.436 142 0.85 0.138
29 0.11 0.995 144 0.36 0.788 149 0.61 0.429 100 0.86 0.132
20 0.11 0.994 165 0.36 0.782 137 0.61 0.423 113 0.86 0.127
30 0.12 0.993 122 0.37 0.774 126 0.62 0.416 87 0.87 0.122
15 0.12 0.991 79 0.37 0.769 51 0.62 0.411 57 0.87 0.118
27 0.13 0.991 228 0.38 0.765 239 0.63 0.408 169 0.88 0.116
31 0.13 0.989 192 0.38 0.755 162 0.63 0.398 137 0.88 0.108
31 0.14 0.988 158 0.39 0.746 133 0.64 0.390 101 0.89 0.102
30 0.14 0.987 169 0.39 0.739 149 0.64 0.384 120 0.89 0.098
40 0.15 0.985 151 0.40 0.732 140 0.65 0.378 116 0.90 0.092
43 0.15 0.983 170 0.40 0.725 136 0.65 0.371 104 0.90 0.087
39 0.16 0.982 164 0.41 0.717 148 0.66 0.365 97 0.91 0.082
48 0.16 0.980 151 0.41 0.710 122 0.66 0.359 111 0.91 0.078
47 0.17 0.978 101 0.42 0.703 120 0.67 0.353 94 0.92 0.073
29 0.17 0.976 44 0.42 0.698 48 0.67 0.348 43 0.92 0.069
76 0.18 0.974 271 0.43 0.696 208 0.68 0.346 149 0.93 0.067
73 0.18 0.971 209 0.43 0.684 165 0.68 0.336 123 0.93 0.060
54 0.19 0.968 184 0.44 0.675 155 0.69 0.329 100 0.94 0.055
63 0.19 0.965 175 0.44 0.667 161 0.69 0.322 88 0.94 0.050
61 0.20 0.962 172 0.45 0.659 131 0.70 0.315 105 0.95 0.046
93 0.20 0.960 159 0.45 0.651 139 0.70 0.309 122 0.95 0.041
92 0.21 0.955 146 0.46 0.644 151 0.71 0.303 78 0.96 0.036
86 0.21 0.951 124 0.46 0.637 133 0.71 0.296 73 0.96 0.032
101 0.22 0.947 58 0.47 0.632 90 0.72 0.290 112 0.97 0.029
56 0.22 0.943 33 0.47 0.629 46 0.72 0.286 37 0.97 0.024
114 0.23 0.940 316 0.48 0.627 195 0.73 0.284 76 0.98 0.022
96 0.23 0.935 219 0.48 0.613 160 0.73 0.275 128 0.98 0.019
107 0.24 0.931 196 0.49 0.603 146 0.74 0.268 64 0.99 0.013
97 0.24 0.926 201 0.49 0.595 146 0.74 0.261 33 0.99 0.010
128 0.25 0.922 162 0.50 0.586 137 0.75 0.255 36 1.00 0.009
108 0.25 0.916 193 0.50 0.578 155 0.75 0.248 128 1.00 0.006
121 0.26 0.911 163 0.51 0.570 126 0.76 0.241
134 0.26 0.906 160 0.51 0.562 117 0.76 0.236
111 0.27 0.900 143 0.52 0.555 93 0.77 0.230
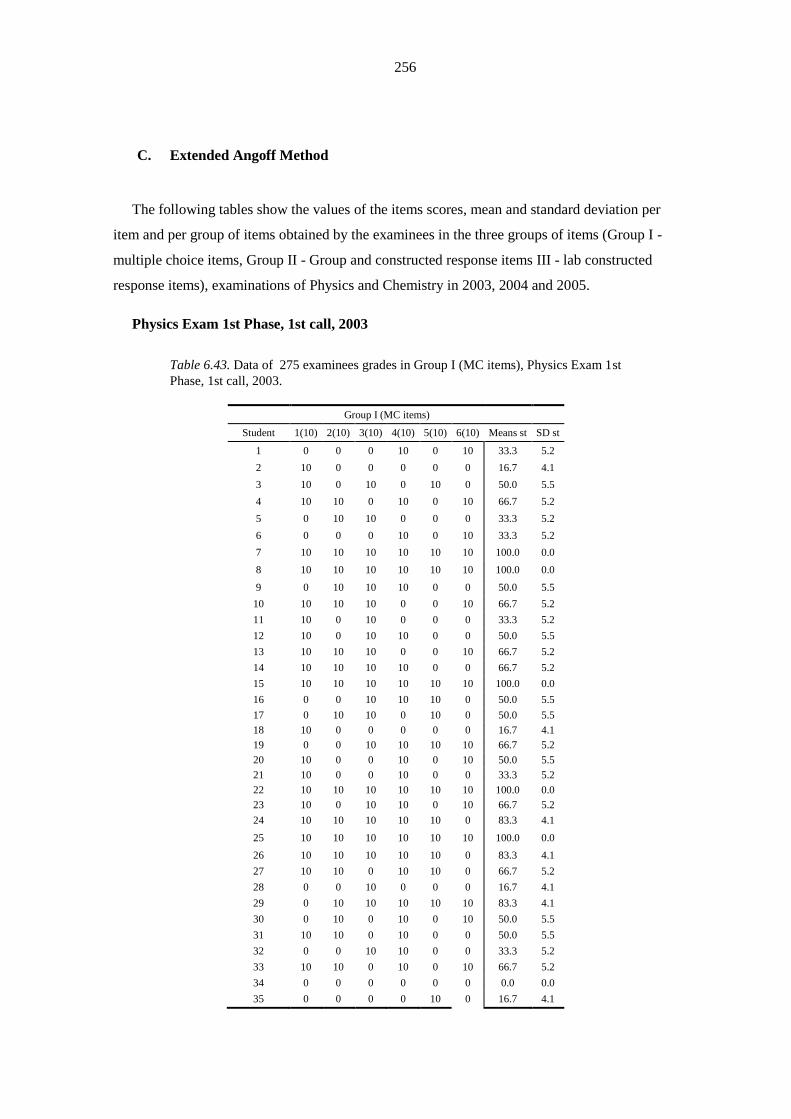
256
C. Extended Angoff Method
The following tables show the values of the items scores, mean and standard deviation per
item and per group of items obtained by the examinees in the three groups of items (Group I -
multiple choice items, Group II - Group and constructed response items III - lab constructed
response items), examinations of Physics and Chemistry in 2003, 2004 and 2005.
Physics Exam 1st Phase, 1st call, 2003
Table 6.43. Data of 275 examinees grades in Group I (MC items), Physics Exam 1st
Phase, 1st call, 2003.
Group I (MC items)
Student 1(10) 2(10) 3(10) 4(10) 5(10) 6(10) Means st SD st
1 0 0 0 10 0 10 33.3 5.2
2 10 0 0 0 0 0 16.7 4.1
3 10 0 10 0 10 0 50.0 5.5
4 10 10 0 10 0 10 66.7 5.2
5 0 10 10 0 0 0 33.3 5.2
6 0 0 0 10 0 10 33.3 5.2
7 10 10 10 10 10 10 100.0 0.0
8 10 10 10 10 10 10 100.0 0.0
9 0 10 10 10 0 0 50.0 5.5
10 10 10 10 0 0 10 66.7 5.2
11 10 0 10 0 0 0 33.3 5.2
12 10 0 10 10 0 0 50.0 5.5
13 10 10 10 0 0 10 66.7 5.2
14 10 10 10 10 0 0 66.7 5.2
15 10 10 10 10 10 10 100.0 0.0
16 0 0 10 10 10 0 50.0 5.5
17 0 10 10 0 10 0 50.0 5.5
18 10 0 0 0 0 0 16.7 4.1
19 0 0 10 10 10 10 66.7 5.2
20 10 0 0 10 0 10 50.0 5.5
21 10 0 0 10 0 0 33.3 5.2
22 10 10 10 10 10 10 100.0 0.0
23 10 0 10 10 0 10 66.7 5.2
24 10 10 10 10 10 0 83.3 4.1
25 10 10 10 10 10 10 100.0 0.0
26 10 10 10 10 10 0 83.3 4.1
27 10 10 0 10 10 0 66.7 5.2
28 0 0 10 0 0 0 16.7 4.1
29 0 10 10 10 10 10 83.3 4.1
30 0 10 0 10 0 10 50.0 5.5
31 10 10 0 10 0 0 50.0 5.5
32 0 0 10 10 0 0 33.3 5.2
33 10 10 0 10 0 10 66.7 5.2
34 0 0 0 0 0 0 0.0 0.0
35 0 0 0 0 10 0 16.7 4.1
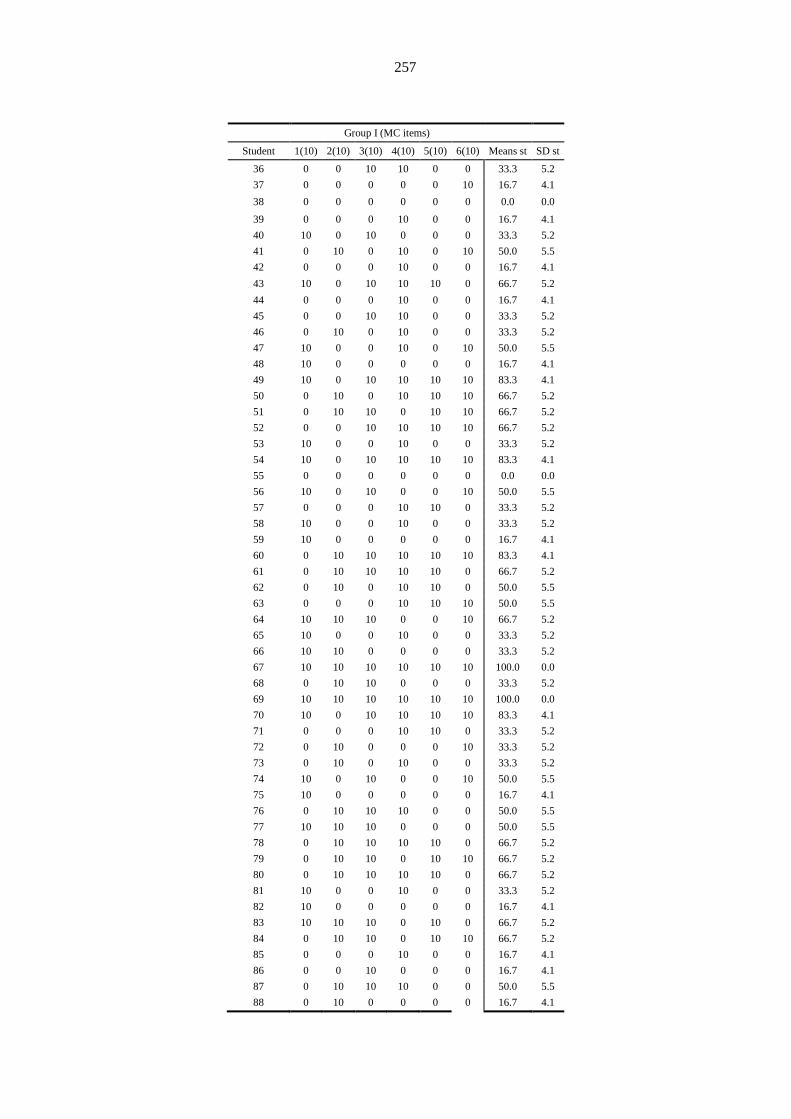
257
Group I (MC items)
Student 1(10) 2(10) 3(10) 4(10) 5(10) 6(10) Means st SD st
36 0 0 10 10 0 0 33.3 5.2
37 0 0 0 0 0 10 16.7 4.1
38 0 0 0 0 0 0 0.0 0.0
39 0 0 0 10 0 0 16.7 4.1
40 10 0 10 0 0 0 33.3 5.2
41 0 10 0 10 0 10 50.0 5.5
42 0 0 0 10 0 0 16.7 4.1
43 10 0 10 10 10 0 66.7 5.2
44 0 0 0 10 0 0 16.7 4.1
45 0 0 10 10 0 0 33.3 5.2
46 0 10 0 10 0 0 33.3 5.2
47 10 0 0 10 0 10 50.0 5.5
48 10 0 0 0 0 0 16.7 4.1
49 10 0 10 10 10 10 83.3 4.1
50 0 10 0 10 10 10 66.7 5.2
51 0 10 10 0 10 10 66.7 5.2
52 0 0 10 10 10 10 66.7 5.2
53 10 0 0 10 0 0 33.3 5.2
54 10 0 10 10 10 10 83.3 4.1
55 0 0 0 0 0 0 0.0 0.0
56 10 0 10 0 0 10 50.0 5.5
57 0 0 0 10 10 0 33.3 5.2
58 10 0 0 10 0 0 33.3 5.2
59 10 0 0 0 0 0 16.7 4.1
60 0 10 10 10 10 10 83.3 4.1
61 0 10 10 10 10 0 66.7 5.2
62 0 10 0 10 10 0 50.0 5.5
63 0 0 0 10 10 10 50.0 5.5
64 10 10 10 0 0 10 66.7 5.2
65 10 0 0 10 0 0 33.3 5.2
66 10 10 0 0 0 0 33.3 5.2
67 10 10 10 10 10 10 100.0 0.0
68 0 10 10 0 0 0 33.3 5.2
69 10 10 10 10 10 10 100.0 0.0
70 10 0 10 10 10 10 83.3 4.1
71 0 0 0 10 10 0 33.3 5.2
72 0 10 0 0 0 10 33.3 5.2
73 0 10 0 10 0 0 33.3 5.2
74 10 0 10 0 0 10 50.0 5.5
75 10 0 0 0 0 0 16.7 4.1
76 0 10 10 10 0 0 50.0 5.5
77 10 10 10 0 0 0 50.0 5.5
78 0 10 10 10 10 0 66.7 5.2
79 0 10 10 0 10 10 66.7 5.2
80 0 10 10 10 10 0 66.7 5.2
81 10 0 0 10 0 0 33.3 5.2
82 10 0 0 0 0 0 16.7 4.1
83 10 10 10 0 10 0 66.7 5.2
84 0 10 10 0 10 10 66.7 5.2
85 0 0 0 10 0 0 16.7 4.1
86 0 0 10 0 0 0 16.7 4.1
87 0 10 10 10 0 0 50.0 5.5
88 0 10 0 0 0 0 16.7 4.1
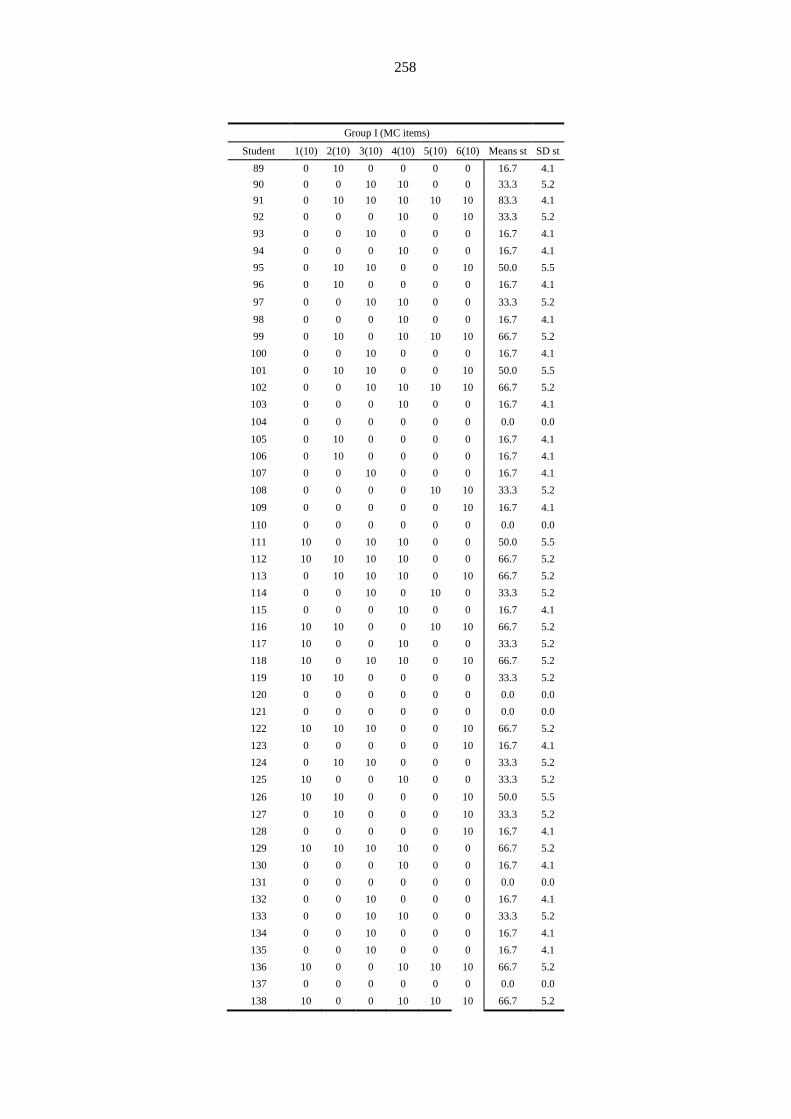
258
Group I (MC items)
Student 1(10) 2(10) 3(10) 4(10) 5(10) 6(10) Means st SD st
89 0 10 0 0 0 0 16.7 4.1
90 0 0 10 10 0 0 33.3 5.2
91 0 10 10 10 10 10 83.3 4.1
92 0 0 0 10 0 10 33.3 5.2
93 0 0 10 0 0 0 16.7 4.1
94 0 0 0 10 0 0 16.7 4.1
95 0 10 10 0 0 10 50.0 5.5
96 0 10 0 0 0 0 16.7 4.1
97 0 0 10 10 0 0 33.3 5.2
98 0 0 0 10 0 0 16.7 4.1
99 0 10 0 10 10 10 66.7 5.2
100 0 0 10 0 0 0 16.7 4.1
101 0 10 10 0 0 10 50.0 5.5
102 0 0 10 10 10 10 66.7 5.2
103 0 0 0 10 0 0 16.7 4.1
104 0 0 0 0 0 0 0.0 0.0
105 0 10 0 0 0 0 16.7 4.1
106 0 10 0 0 0 0 16.7 4.1
107 0 0 10 0 0 0 16.7 4.1
108 0 0 0 0 10 10 33.3 5.2
109 0 0 0 0 0 10 16.7 4.1
110 0 0 0 0 0 0 0.0 0.0
111 10 0 10 10 0 0 50.0 5.5
112 10 10 10 10 0 0 66.7 5.2
113 0 10 10 10 0 10 66.7 5.2
114 0 0 10 0 10 0 33.3 5.2
115 0 0 0 10 0 0 16.7 4.1
116 10 10 0 0 10 10 66.7 5.2
117 10 0 0 10 0 0 33.3 5.2
118 10 0 10 10 0 10 66.7 5.2
119 10 10 0 0 0 0 33.3 5.2
120 0 0 0 0 0 0 0.0 0.0
121 0 0 0 0 0 0 0.0 0.0
122 10 10 10 0 0 10 66.7 5.2
123 0 0 0 0 0 10 16.7 4.1
124 0 10 10 0 0 0 33.3 5.2
125 10 0 0 10 0 0 33.3 5.2
126 10 10 0 0 0 10 50.0 5.5
127 0 10 0 0 0 10 33.3 5.2
128 0 0 0 0 0 10 16.7 4.1
129 10 10 10 10 0 0 66.7 5.2
130 0 0 0 10 0 0 16.7 4.1
131 0 0 0 0 0 0 0.0 0.0
132 0 0 10 0 0 0 16.7 4.1
133 0 0 10 10 0 0 33.3 5.2
134 0 0 10 0 0 0 16.7 4.1
135 0 0 10 0 0 0 16.7 4.1
136 10 0 0 10 10 10 66.7 5.2
137 0 0 0 0 0 0 0.0 0.0
138 10 0 0 10 10 10 66.7 5.2
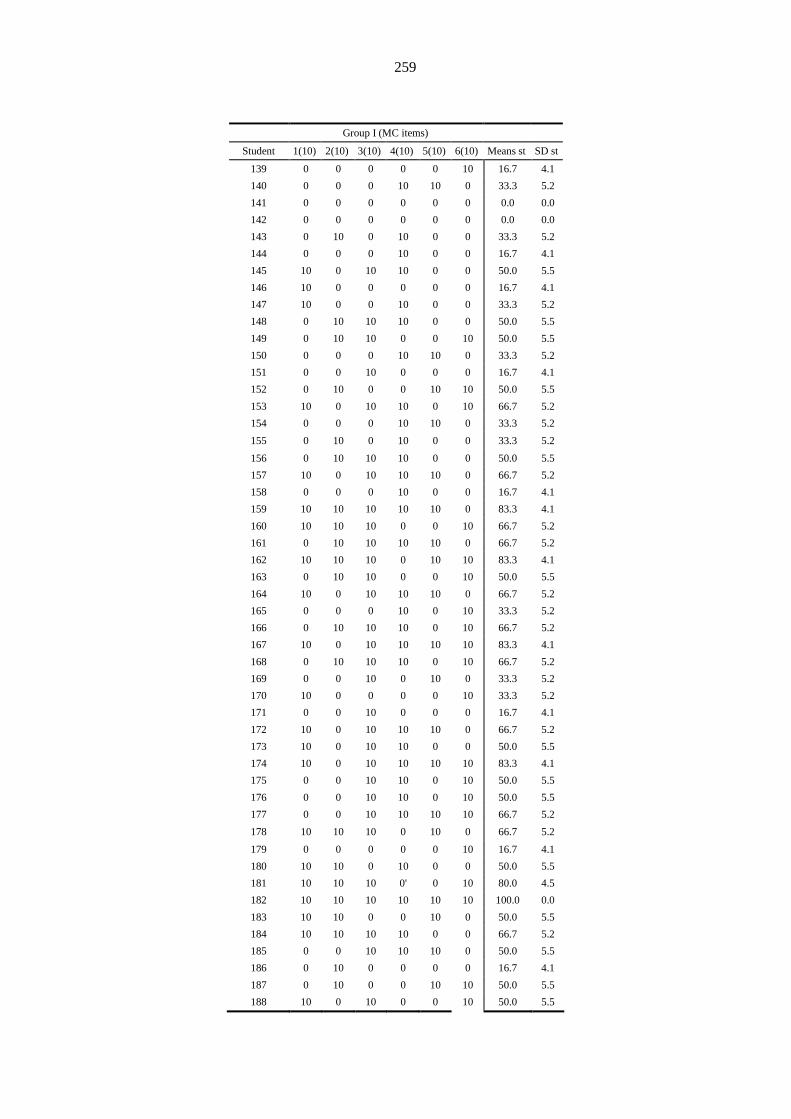
259
Group I (MC items)
Student 1(10) 2(10) 3(10) 4(10) 5(10) 6(10) Means st SD st
139 0 0 0 0 0 10 16.7 4.1
140 0 0 0 10 10 0 33.3 5.2
141 0 0 0 0 0 0 0.0 0.0
142 0 0 0 0 0 0 0.0 0.0
143 0 10 0 10 0 0 33.3 5.2
144 0 0 0 10 0 0 16.7 4.1
145 10 0 10 10 0 0 50.0 5.5
146 10 0 0 0 0 0 16.7 4.1
147 10 0 0 10 0 0 33.3 5.2
148 0 10 10 10 0 0 50.0 5.5
149 0 10 10 0 0 10 50.0 5.5
150 0 0 0 10 10 0 33.3 5.2
151 0 0 10 0 0 0 16.7 4.1
152 0 10 0 0 10 10 50.0 5.5
153 10 0 10 10 0 10 66.7 5.2
154 0 0 0 10 10 0 33.3 5.2
155 0 10 0 10 0 0 33.3 5.2
156 0 10 10 10 0 0 50.0 5.5
157 10 0 10 10 10 0 66.7 5.2
158 0 0 0 10 0 0 16.7 4.1
159 10 10 10 10 10 0 83.3 4.1
160 10 10 10 0 0 10 66.7 5.2
161 0 10 10 10 10 0 66.7 5.2
162 10 10 10 0 10 10 83.3 4.1
163 0 10 10 0 0 10 50.0 5.5
164 10 0 10 10 10 0 66.7 5.2
165 0 0 0 10 0 10 33.3 5.2
166 0 10 10 10 0 10 66.7 5.2
167 10 0 10 10 10 10 83.3 4.1
168 0 10 10 10 0 10 66.7 5.2
169 0 0 10 0 10 0 33.3 5.2
170 10 0 0 0 0 10 33.3 5.2
171 0 0 10 0 0 0 16.7 4.1
172 10 0 10 10 10 0 66.7 5.2
173 10 0 10 10 0 0 50.0 5.5
174 10 0 10 10 10 10 83.3 4.1
175 0 0 10 10 0 10 50.0 5.5
176 0 0 10 10 0 10 50.0 5.5
177 0 0 10 10 10 10 66.7 5.2
178 10 10 10 0 10 0 66.7 5.2
179 0 0 0 0 0 10 16.7 4.1
180 10 10 0 10 0 0 50.0 5.5
181 10 10 10 0' 0 10 80.0 4.5
182 10 10 10 10 10 10 100.0 0.0
183 10 10 0 0 10 0 50.0 5.5
184 10 10 10 10 0 0 66.7 5.2
185 0 0 10 10 10 0 50.0 5.5
186 0 10 0 0 0 0 16.7 4.1
187 0 10 0 0 10 10 50.0 5.5
188 10 0 10 0 0 10 50.0 5.5
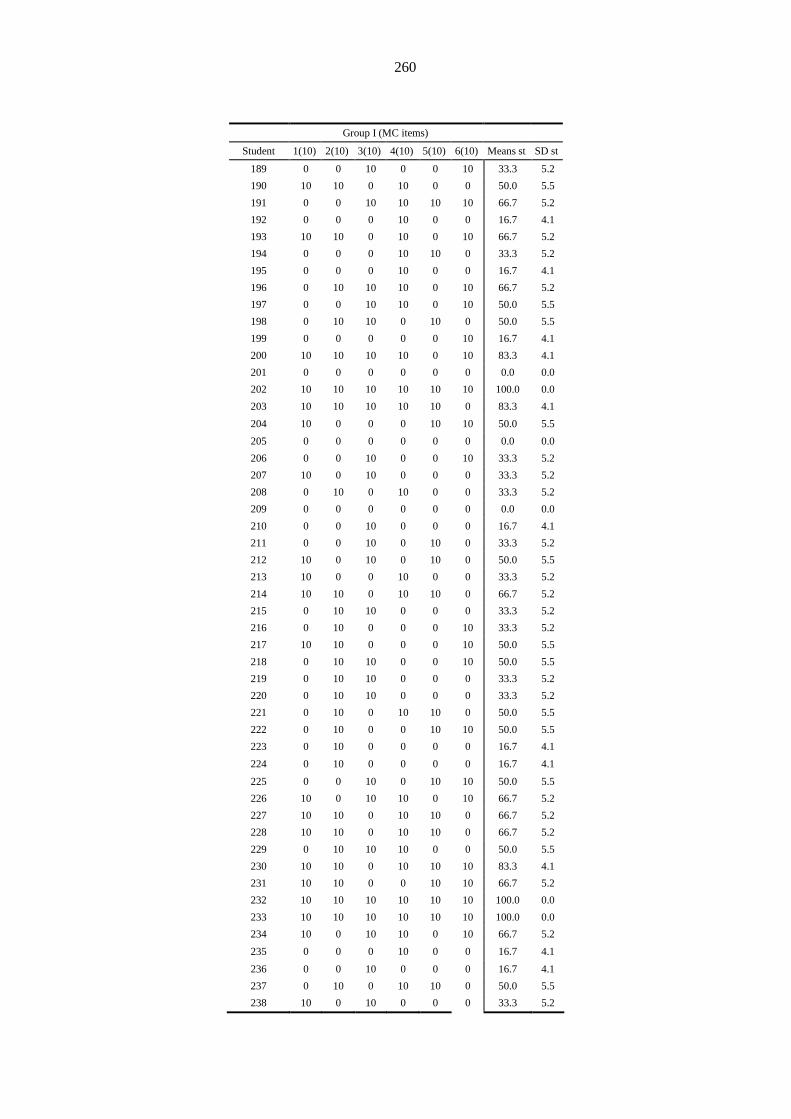
260
Group I (MC items)
Student 1(10) 2(10) 3(10) 4(10) 5(10) 6(10) Means st SD st
189 0 0 10 0 0 10 33.3 5.2
190 10 10 0 10 0 0 50.0 5.5
191 0 0 10 10 10 10 66.7 5.2
192 0 0 0 10 0 0 16.7 4.1
193 10 10 0 10 0 10 66.7 5.2
194 0 0 0 10 10 0 33.3 5.2
195 0 0 0 10 0 0 16.7 4.1
196 0 10 10 10 0 10 66.7 5.2
197 0 0 10 10 0 10 50.0 5.5
198 0 10 10 0 10 0 50.0 5.5
199 0 0 0 0 0 10 16.7 4.1
200 10 10 10 10 0 10 83.3 4.1
201 0 0 0 0 0 0 0.0 0.0
202 10 10 10 10 10 10 100.0 0.0
203 10 10 10 10 10 0 83.3 4.1
204 10 0 0 0 10 10 50.0 5.5
205 0 0 0 0 0 0 0.0 0.0
206 0 0 10 0 0 10 33.3 5.2
207 10 0 10 0 0 0 33.3 5.2
208 0 10 0 10 0 0 33.3 5.2
209 0 0 0 0 0 0 0.0 0.0
210 0 0 10 0 0 0 16.7 4.1
211 0 0 10 0 10 0 33.3 5.2
212 10 0 10 0 10 0 50.0 5.5
213 10 0 0 10 0 0 33.3 5.2
214 10 10 0 10 10 0 66.7 5.2
215 0 10 10 0 0 0 33.3 5.2
216 0 10 0 0 0 10 33.3 5.2
217 10 10 0 0 0 10 50.0 5.5
218 0 10 10 0 0 10 50.0 5.5
219 0 10 10 0 0 0 33.3 5.2
220 0 10 10 0 0 0 33.3 5.2
221 0 10 0 10 10 0 50.0 5.5
222 0 10 0 0 10 10 50.0 5.5
223 0 10 0 0 0 0 16.7 4.1
224 0 10 0 0 0 0 16.7 4.1
225 0 0 10 0 10 10 50.0 5.5
226 10 0 10 10 0 10 66.7 5.2
227 10 10 0 10 10 0 66.7 5.2
228 10 10 0 10 10 0 66.7 5.2
229 0 10 10 10 0 0 50.0 5.5
230 10 10 0 10 10 10 83.3 4.1
231 10 10 0 0 10 10 66.7 5.2
232 10 10 10 10 10 10 100.0 0.0
233 10 10 10 10 10 10 100.0 0.0
234 10 0 10 10 0 10 66.7 5.2
235 0 0 0 10 0 0 16.7 4.1
236 0 0 10 0 0 0 16.7 4.1
237 0 10 0 10 10 0 50.0 5.5
238 10 0 10 0 0 0 33.3 5.2

261
Group I (MC items)
Student 1(10) 2(10) 3(10) 4(10) 5(10) 6(10) Means st SD st
239 10 0 0 10 10 10 66.7 5.2
240 0 10 0 10 0 10 50.0 5.5
241 10 0 0 0 0 0 16.7 4.1
242 0 0 0 10 0 0 16.7 4.1
243 0 0 10 10 0 0 33.3 5.2
244 0 10 0 0 10 0 33.3 5.2
245 10 0 0 0 0 0 16.7 4.1
246 0 0 0 0 0 0 0.0 0.0
247 10 0 0 0 0 0 16.7 4.1
248 0 0 0 10 10 0 33.3 5.2
249 0 0 10 0 0 10 33.3 5.2
250 10 0 10 10 0 10 66.7 5.2
251 0 0 10 10 10 0 50.0 5.5
252 0 10 0 10 10 0 50.0 5.5
253 10 10 10 0 10 10 83.3 4.1
254 0 10 0 10 10 0 50.0 5.5
255 10 0 10 0 0 10 50.0 5.5
256 10 10 0 0 0 0 33.3 5.2
257 0 0 10 0 0 0 16.7 4.1
258 0 0 10 0 0 0 16.7 4.1
259 10 0 0 10 0 0 33.3 5.2
260 10 0 10 0 10 0 50.0 5.5
261 10 10 0 10 10 0 66.7 5.2
262 0 10 10 0 0 0 33.3 5.2
263 0 10 0 10 0 10 50.0 5.5
264 10 10 0 0 0 10 50.0 5.5
265 0 0 0 0 0 0 0.0 0.0
266 0 10 0 0 10 10 50.0 5.5
267 0 10 0 0 0 0 16.7 4.1
268 10 0 0 10 0 0 33.3 5.2
269 10 0 0 10 10 10 66.7 5.2
270 10 10 0 10 10 0 66.7 5.2
271 10 0 0 10 10 0 50.0 5.5
272 0 10 10 10 0 0 50.0 5.5
273 10 10 0 10 10 10 83.3 4.1
274 0 10 10 0 0 0 33.3 5.2
275 10 0 10 10 0 10 66.7 5.2
Means item 41.8 44.7 49.8 55.1 34.2 38.9 44.1 0.1
SD item 4.9 5.0 5.0 5.0 4.8 4.9
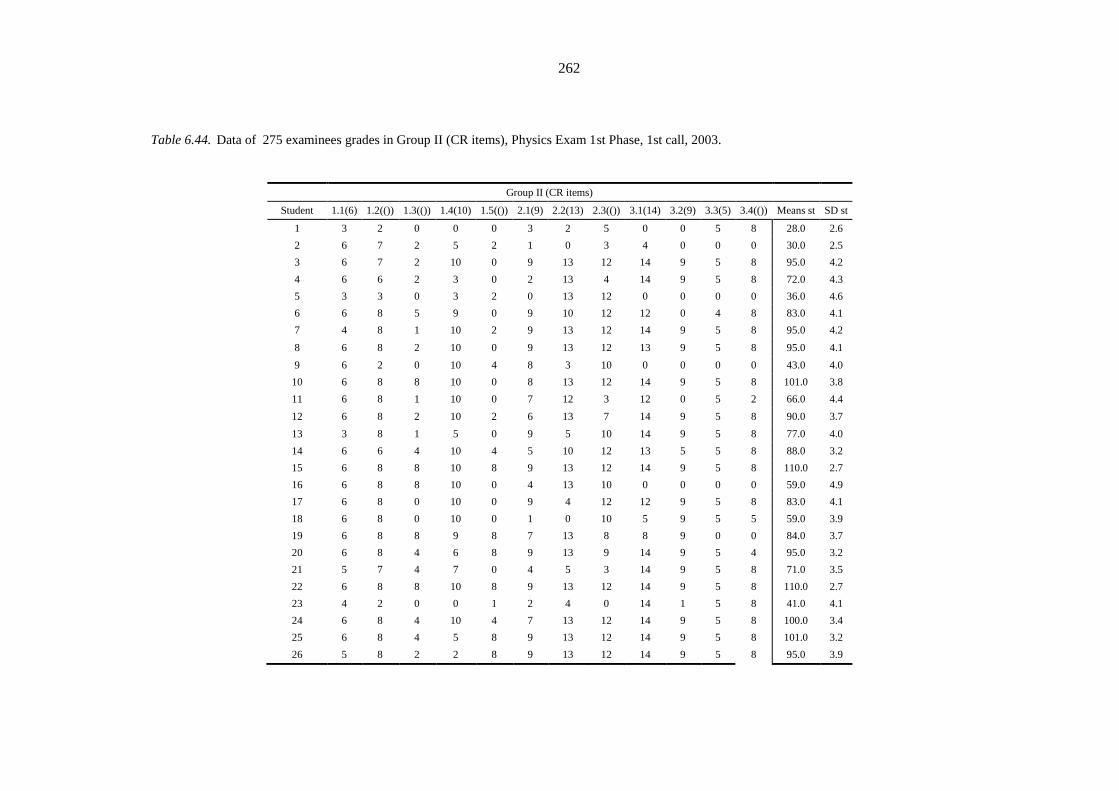
262
Table 6.44. Data of 275 examinees grades in Group II (CR items), Physics Exam 1st Phase, 1st call, 2003.
Group II (CR items)
Student 1.1(6) 1.2(()) 1.3(()) 1.4(10) 1.5(()) 2.1(9) 2.2(13) 2.3(()) 3.1(14) 3.2(9) 3.3(5) 3.4(()) Means st SD st
1 3 2 0 0 0 3 2 5 0 0 5 8 28.0 2.6
2 6 7 2 5 2 1 0 3 4 0 0 0 30.0 2.5
3 6 7 2 10 0 9 13 12 14 9 5 8 95.0 4.2
4 6 6 2 3 0 2 13 4 14 9 5 8 72.0 4.3
5 3 3 0 3 2 0 13 12 0 0 0 0 36.0 4.6
6 6 8 5 9 0 9 10 12 12 0 4 8 83.0 4.1
7 4 8 1 10 2 9 13 12 14 9 5 8 95.0 4.2
8 6 8 2 10 0 9 13 12 13 9 5 8 95.0 4.1
9 6 2 0 10 4 8 3 10 0 0 0 0 43.0 4.0
10 6 8 8 10 0 8 13 12 14 9 5 8 101.0 3.8
11 6 8 1 10 0 7 12 3 12 0 5 2 66.0 4.4
12 6 8 2 10 2 6 13 7 14 9 5 8 90.0 3.7
13 3 8 1 5 0 9 5 10 14 9 5 8 77.0 4.0
14 6 6 4 10 4 5 10 12 13 5 5 8 88.0 3.2
15 6 8 8 10 8 9 13 12 14 9 5 8 110.0 2.7
16 6 8 8 10 0 4 13 10 0 0 0 0 59.0 4.9
17 6 8 0 10 0 9 4 12 12 9 5 8 83.0 4.1
18 6 8 0 10 0 1 0 10 5 9 5 5 59.0 3.9
19 6 8 8 9 8 7 13 8 8 9 0 0 84.0 3.7
20 6 8 4 6 8 9 13 9 14 9 5 4 95.0 3.2
21 5 7 4 7 0 4 5 3 14 9 5 8 71.0 3.5
22 6 8 8 10 8 9 13 12 14 9 5 8 110.0 2.7
23 4 2 0 0 1 2 4 0 14 1 5 8 41.0 4.1
24 6 8 4 10 4 7 13 12 14 9 5 8 100.0 3.4
25 6 8 4 5 8 9 13 12 14 9 5 8 101.0 3.2
26 5 8 2 2 8 9 13 12 14 9 5 8 95.0 3.9
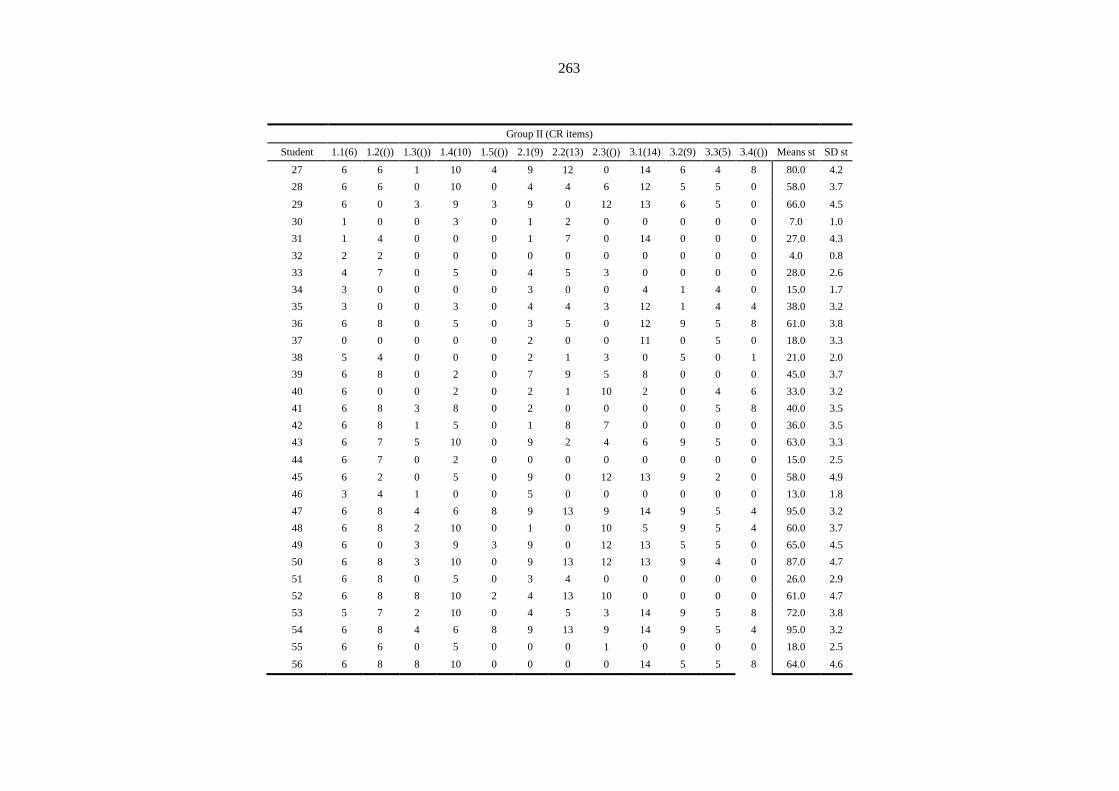
263
Group II (CR items)
Student 1.1(6) 1.2(()) 1.3(()) 1.4(10) 1.5(()) 2.1(9) 2.2(13) 2.3(()) 3.1(14) 3.2(9) 3.3(5) 3.4(()) Means st SD st
27 6 6 1 10 4 9 12 0 14 6 4 8 80.0 4.2
28 6 6 0 10 0 4 4 6 12 5 5 0 58.0 3.7
29 6 0 3 9 3 9 0 12 13 6 5 0 66.0 4.5
30 1 0 0 3 0 1 2 0 0 0 0 0 7.0 1.0
31 1 4 0 0 0 1 7 0 14 0 0 0 27.0 4.3
32 2 2 0 0 0 0 0 0 0 0 0 0 4.0 0.8
33 4 7 0 5 0 4 5 3 0 0 0 0 28.0 2.6
34 3 0 0 0 0 3 0 0 4 1 4 0 15.0 1.7
35 3 0 0 3 0 4 4 3 12 1 4 4 38.0 3.2
36 6 8 0 5 0 3 5 0 12 9 5 8 61.0 3.8
37 0 0 0 0 0 2 0 0 11 0 5 0 18.0 3.3
38 5 4 0 0 0 2 1 3 0 5 0 1 21.0 2.0
39 6 8 0 2 0 7 9 5 8 0 0 0 45.0 3.7
40 6 0 0 2 0 2 1 10 2 0 4 6 33.0 3.2
41 6 8 3 8 0 2 0 0 0 0 5 8 40.0 3.5
42 6 8 1 5 0 1 8 7 0 0 0 0 36.0 3.5
43 6 7 5 10 0 9 2 4 6 9 5 0 63.0 3.3
44 6 7 0 2 0 0 0 0 0 0 0 0 15.0 2.5
45 6 2 0 5 0 9 0 12 13 9 2 0 58.0 4.9
46 3 4 1 0 0 5 0 0 0 0 0 0 13.0 1.8
47 6 8 4 6 8 9 13 9 14 9 5 4 95.0 3.2
48 6 8 2 10 0 1 0 10 5 9 5 4 60.0 3.7
49 6 0 3 9 3 9 0 12 13 5 5 0 65.0 4.5
50 6 8 3 10 0 9 13 12 13 9 4 0 87.0 4.7
51 6 8 0 5 0 3 4 0 0 0 0 0 26.0 2.9
52 6 8 8 10 2 4 13 10 0 0 0 0 61.0 4.7
53 5 7 2 10 0 4 5 3 14 9 5 8 72.0 3.8
54 6 8 4 6 8 9 13 9 14 9 5 4 95.0 3.2
55 6 6 0 5 0 0 0 1 0 0 0 0 18.0 2.5
56 6 8 8 10 0 0 0 0 14 5 5 8 64.0 4.6
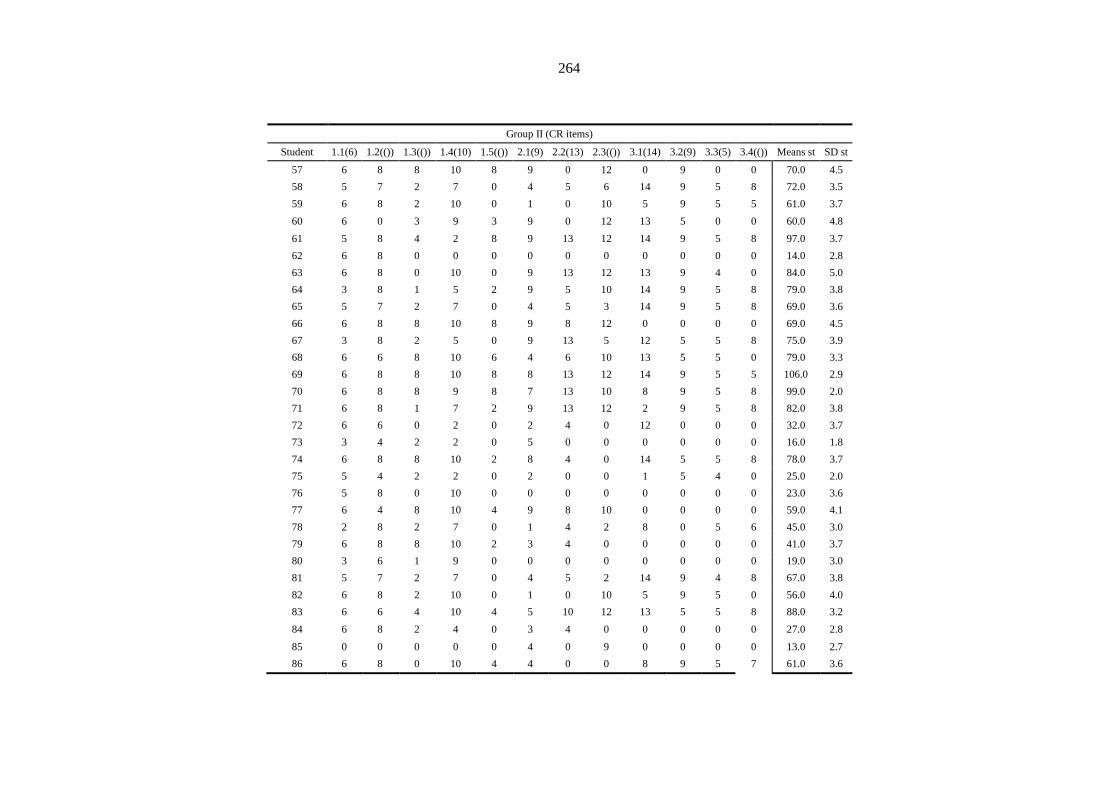
264
Group II (CR items)
Student 1.1(6) 1.2(()) 1.3(()) 1.4(10) 1.5(()) 2.1(9) 2.2(13) 2.3(()) 3.1(14) 3.2(9) 3.3(5) 3.4(()) Means st SD st
57 6 8 8 10 8 9 0 12 0 9 0 0 70.0 4.5
58 5 7 2 7 0 4 5 6 14 9 5 8 72.0 3.5
59 6 8 2 10 0 1 0 10 5 9 5 5 61.0 3.7
60 6 0 3 9 3 9 0 12 13 5 0 0 60.0 4.8
61 5 8 4 2 8 9 13 12 14 9 5 8 97.0 3.7
62 6 8 0 0 0 0 0 0 0 0 0 0 14.0 2.8
63 6 8 0 10 0 9 13 12 13 9 4 0 84.0 5.0
64 3 8 1 5 2 9 5 10 14 9 5 8 79.0 3.8
65 5 7 2 7 0 4 5 3 14 9 5 8 69.0 3.6
66 6 8 8 10 8 9 8 12 0 0 0 0 69.0 4.5
67 3 8 2 5 0 9 13 5 12 5 5 8 75.0 3.9
68 6 6 8 10 6 4 6 10 13 5 5 0 79.0 3.3
69 6 8 8 10 8 8 13 12 14 9 5 5 106.0 2.9
70 6 8 8 9 8 7 13 10 8 9 5 8 99.0 2.0
71 6 8 1 7 2 9 13 12 2 9 5 8 82.0 3.8
72 6 6 0 2 0 2 4 0 12 0 0 0 32.0 3.7
73 3 4 2 2 0 5 0 0 0 0 0 0 16.0 1.8
74 6 8 8 10 2 8 4 0 14 5 5 8 78.0 3.7
75 5 4 2 2 0 2 0 0 1 5 4 0 25.0 2.0
76 5 8 0 10 0 0 0 0 0 0 0 0 23.0 3.6
77 6 4 8 10 4 9 8 10 0 0 0 0 59.0 4.1
78 2 8 2 7 0 1 4 2 8 0 5 6 45.0 3.0
79 6 8 8 10 2 3 4 0 0 0 0 0 41.0 3.7
80 3 6 1 9 0 0 0 0 0 0 0 0 19.0 3.0
81 5 7 2 7 0 4 5 2 14 9 4 8 67.0 3.8
82 6 8 2 10 0 1 0 10 5 9 5 0 56.0 4.0
83 6 6 4 10 4 5 10 12 13 5 5 8 88.0 3.2
84 6 8 2 4 0 3 4 0 0 0 0 0 27.0 2.8
85 0 0 0 0 0 4 0 9 0 0 0 0 13.0 2.7
86 6 8 0 10 4 4 0 0 8 9 5 7 61.0 3.6
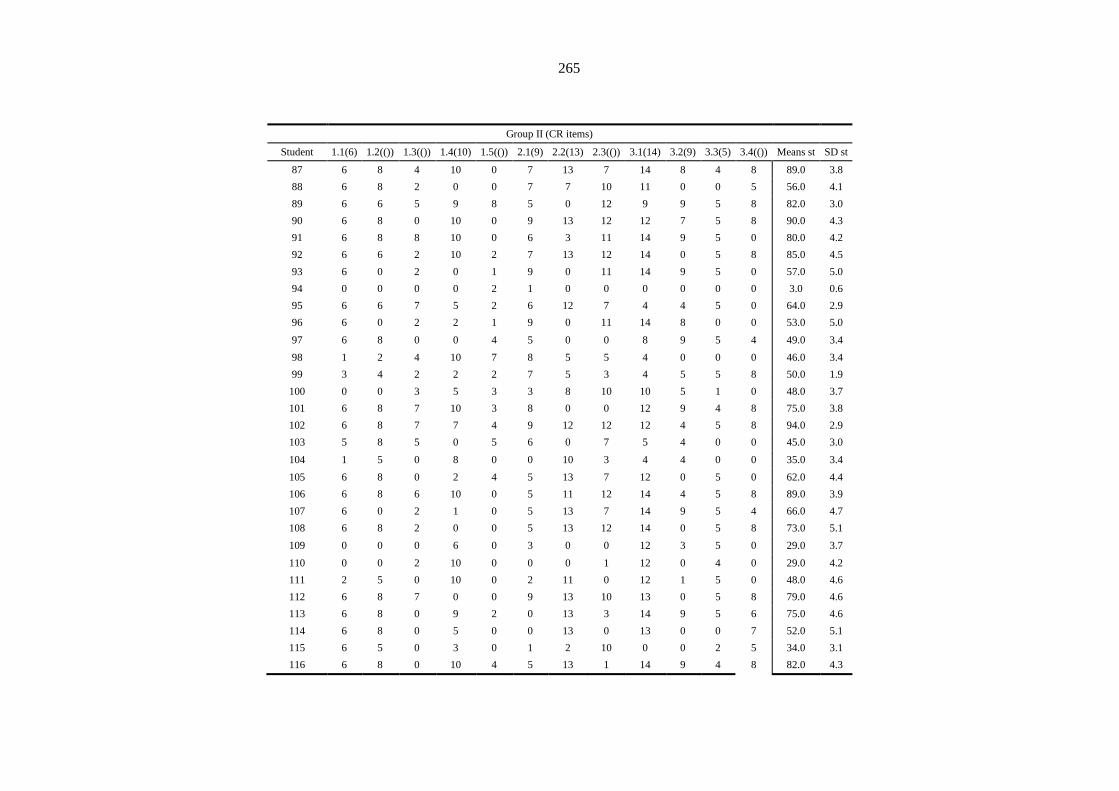
265
Group II (CR items)
Student 1.1(6) 1.2(()) 1.3(()) 1.4(10) 1.5(()) 2.1(9) 2.2(13) 2.3(()) 3.1(14) 3.2(9) 3.3(5) 3.4(()) Means st SD st
87 6 8 4 10 0 7 13 7 14 8 4 8 89.0 3.8
88 6 8 2 0 0 7 7 10 11 0 0 5 56.0 4.1
89 6 6 5 9 8 5 0 12 9 9 5 8 82.0 3.0
90 6 8 0 10 0 9 13 12 12 7 5 8 90.0 4.3
91 6 8 8 10 0 6 3 11 14 9 5 0 80.0 4.2
92 6 6 2 10 2 7 13 12 14 0 5 8 85.0 4.5
93 6 0 2 0 1 9 0 11 14 9 5 0 57.0 5.0
94 0 0 0 0 2 1 0 0 0 0 0 0 3.0 0.6
95 6 6 7 5 2 6 12 7 4 4 5 0 64.0 2.9
96 6 0 2 2 1 9 0 11 14 8 0 0 53.0 5.0
97 6 8 0 0 4 5 0 0 8 9 5 4 49.0 3.4
98 1 2 4 10 7 8 5 5 4 0 0 0 46.0 3.4
99 3 4 2 2 2 7 5 3 4 5 5 8 50.0 1.9
100 0 0 3 5 3 3 8 10 10 5 1 0 48.0 3.7
101 6 8 7 10 3 8 0 0 12 9 4 8 75.0 3.8
102 6 8 7 7 4 9 12 12 12 4 5 8 94.0 2.9
103 5 8 5 0 5 6 0 7 5 4 0 0 45.0 3.0
104 1 5 0 8 0 0 10 3 4 4 0 0 35.0 3.4
105 6 8 0 2 4 5 13 7 12 0 5 0 62.0 4.4
106 6 8 6 10 0 5 11 12 14 4 5 8 89.0 3.9
107 6 0 2 1 0 5 13 7 14 9 5 4 66.0 4.7
108 6 8 2 0 0 5 13 12 14 0 5 8 73.0 5.1
109 0 0 0 6 0 3 0 0 12 3 5 0 29.0 3.7
110 0 0 2 10 0 0 0 1 12 0 4 0 29.0 4.2
111 2 5 0 10 0 2 11 0 12 1 5 0 48.0 4.6
112 6 8 7 0 0 9 13 10 13 0 5 8 79.0 4.6
113 6 8 0 9 2 0 13 3 14 9 5 6 75.0 4.6
114 6 8 0 5 0 0 13 0 13 0 0 7 52.0 5.1
115 6 5 0 3 0 1 2 10 0 0 2 5 34.0 3.1
116 6 8 0 10 4 5 13 1 14 9 4 8 82.0 4.3

266
Group II (CR items)
Student 1.1(6) 1.2(()) 1.3(()) 1.4(10) 1.5(()) 2.1(9) 2.2(13) 2.3(()) 3.1(14) 3.2(9) 3.3(5) 3.4(()) Means st SD st
117 6 8 0 3 0 9 0 1 2 0 0 0 29.0 3.4
118 6 8 8 10 8 9 13 12 14 9 5 8 110.0 2.7
119 6 8 5 7 6 9 13 12 14 9 5 8 102.0 3.1
120 6 8 5 10 4 7 10 0 12 9 5 0 76.0 3.8
121 6 0 0 8 0 5 2 8 12 1 5 4 51.0 3.8
122 6 8 6 10 0 7 13 12 14 9 5 8 98.0 3.9
123 3 8 0 10 0 2 4 0 12 5 5 8 57.0 4.0
124 0 4 2 0 2 5 2 3 0 0 0 0 18.0 1.8
125 0 0 1 2 2 7 13 3 12 0 4 7 51.0 4.6
126 6 6 5 8 2 9 2 12 12 9 5 8 84.0 3.3
127 0 6 0 0 7 0 0 2 7 0 4 0 26.0 3.0
128 2 0 0 10 2 6 5 12 13 0 5 0 55.0 4.8
129 6 6 0 5 2 0 8 0 14 0 5 0 46.0 4.4
130 3 8 0 10 2 3 0 0 14 4 5 8 57.0 4.4
131 6 8 8 8 0 6 2 2 12 9 0 0 61.0 4.1
132 3 0 0 10 0 3 6 12 5 4 5 0 48.0 4.0
133 6 8 0 10 0 0 13 0 12 0 4 0 53.0 5.2
134 6 8 0 5 0 9 13 9 2 0 5 6 63.0 4.2
135 0 2 2 8 0 3 7 3 0 0 0 6 31.0 2.9
136 6 8 0 9 0 7 13 12 14 5 4 8 86.0 4.5
137 0 0 0 0 0 2 1 0 14 5 5 0 27.0 4.2
138 6 8 6 6 0 9 11 12 14 8 5 7 92.0 3.7
139 0 2 3 0 2 5 2 0 2 8 5 0 29.0 2.5
140 6 7 3 5 0 3 2 7 1 0 0 0 34.0 2.8
141 2 2 0 0 0 5 2 0 0 3 6 0 20.0 2.1
142 6 0 0 2 0 3 3 0 14 0 0 0 28.0 4.1
143 3 6 0 8 0 3 3 3 0 0 5 8 39.0 3.0
144 2 0 0 8 0 3 0 12 1 0 5 6 37.0 3.9
145 6 8 0 7 0 9 5 0 14 9 5 0 63.0 4.5
146 0 5 0 0 2 0 0 0 0 0 0 0 7.0 1.5
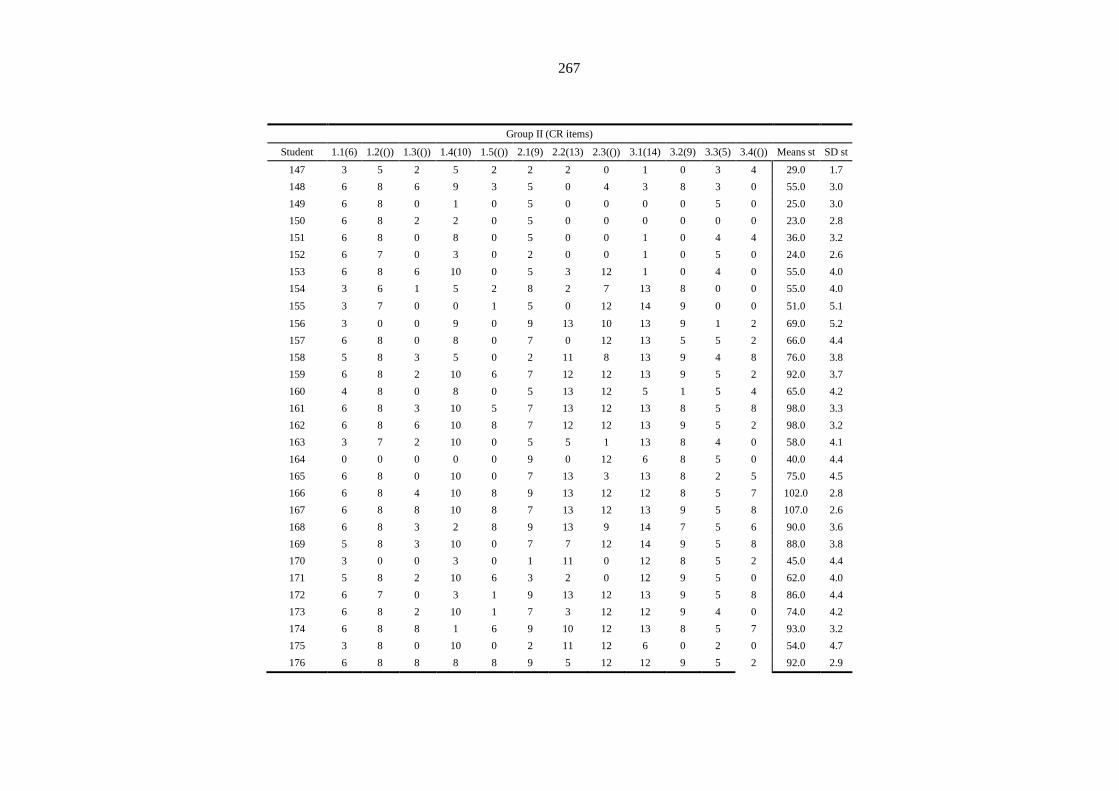
267
Group II (CR items)
Student 1.1(6) 1.2(()) 1.3(()) 1.4(10) 1.5(()) 2.1(9) 2.2(13) 2.3(()) 3.1(14) 3.2(9) 3.3(5) 3.4(()) Means st SD st
147 3 5 2 5 2 2 2 0 1 0 3 4 29.0 1.7
148 6 8 6 9 3 5 0 4 3 8 3 0 55.0 3.0
149 6 8 0 1 0 5 0 0 0 0 5 0 25.0 3.0
150 6 8 2 2 0 5 0 0 0 0 0 0 23.0 2.8
151 6 8 0 8 0 5 0 0 1 0 4 4 36.0 3.2
152 6 7 0 3 0 2 0 0 1 0 5 0 24.0 2.6
153 6 8 6 10 0 5 3 12 1 0 4 0 55.0 4.0
154 3 6 1 5 2 8 2 7 13 8 0 0 55.0 4.0
155 3 7 0 0 1 5 0 12 14 9 0 0 51.0 5.1
156 3 0 0 9 0 9 13 10 13 9 1 2 69.0 5.2
157 6 8 0 8 0 7 0 12 13 5 5 2 66.0 4.4
158 5 8 3 5 0 2 11 8 13 9 4 8 76.0 3.8
159 6 8 2 10 6 7 12 12 13 9 5 2 92.0 3.7
160 4 8 0 8 0 5 13 12 5 1 5 4 65.0 4.2
161 6 8 3 10 5 7 13 12 13 8 5 8 98.0 3.3
162 6 8 6 10 8 7 12 12 13 9 5 2 98.0 3.2
163 3 7 2 10 0 5 5 1 13 8 4 0 58.0 4.1
164 0 0 0 0 0 9 0 12 6 8 5 0 40.0 4.4
165 6 8 0 10 0 7 13 3 13 8 2 5 75.0 4.5
166 6 8 4 10 8 9 13 12 12 8 5 7 102.0 2.8
167 6 8 8 10 8 7 13 12 13 9 5 8 107.0 2.6
168 6 8 3 2 8 9 13 9 14 7 5 6 90.0 3.6
169 5 8 3 10 0 7 7 12 14 9 5 8 88.0 3.8
170 3 0 0 3 0 1 11 0 12 8 5 2 45.0 4.4
171 5 8 2 10 6 3 2 0 12 9 5 0 62.0 4.0
172 6 7 0 3 1 9 13 12 13 9 5 8 86.0 4.4
173 6 8 2 10 1 7 3 12 12 9 4 0 74.0 4.2
174 6 8 8 1 6 9 10 12 13 8 5 7 93.0 3.2
175 3 8 0 10 0 2 11 12 6 0 2 0 54.0 4.7
176 6 8 8 8 8 9 5 12 12 9 5 2 92.0 2.9
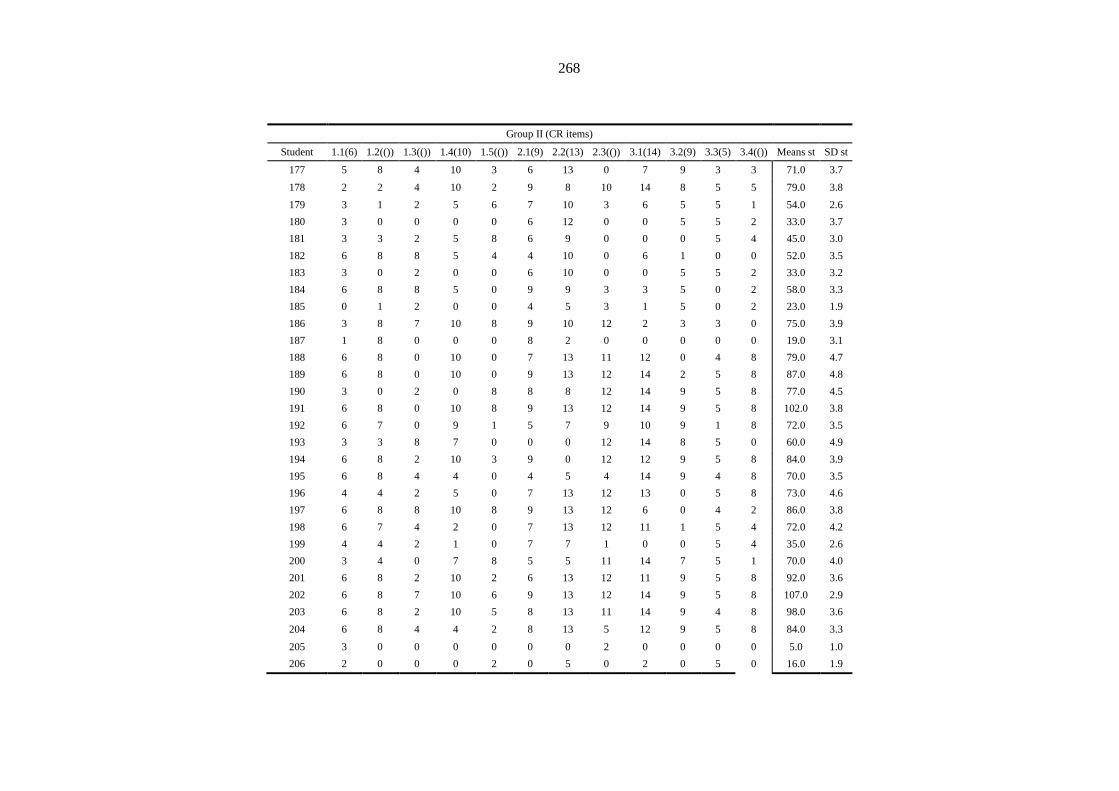
268
Group II (CR items)
Student 1.1(6) 1.2(()) 1.3(()) 1.4(10) 1.5(()) 2.1(9) 2.2(13) 2.3(()) 3.1(14) 3.2(9) 3.3(5) 3.4(()) Means st SD st
177 5 8 4 10 3 6 13 0 7 9 3 3 71.0 3.7
178 2 2 4 10 2 9 8 10 14 8 5 5 79.0 3.8
179 3 1 2 5 6 7 10 3 6 5 5 1 54.0 2.6
180 3 0 0 0 0 6 12 0 0 5 5 2 33.0 3.7
181 3 3 2 5 8 6 9 0 0 0 5 4 45.0 3.0
182 6 8 8 5 4 4 10 0 6 1 0 0 52.0 3.5
183 3 0 2 0 0 6 10 0 0 5 5 2 33.0 3.2
184 6 8 8 5 0 9 9 3 3 5 0 2 58.0 3.3
185 0 1 2 0 0 4 5 3 1 5 0 2 23.0 1.9
186 3 8 7 10 8 9 10 12 2 3 3 0 75.0 3.9
187 1 8 0 0 0 8 2 0 0 0 0 0 19.0 3.1
188 6 8 0 10 0 7 13 11 12 0 4 8 79.0 4.7
189 6 8 0 10 0 9 13 12 14 2 5 8 87.0 4.8
190 3 0 2 0 8 8 8 12 14 9 5 8 77.0 4.5
191 6 8 0 10 8 9 13 12 14 9 5 8 102.0 3.8
192 6 7 0 9 1 5 7 9 10 9 1 8 72.0 3.5
193 3 3 8 7 0 0 0 12 14 8 5 0 60.0 4.9
194 6 8 2 10 3 9 0 12 12 9 5 8 84.0 3.9
195 6 8 4 4 0 4 5 4 14 9 4 8 70.0 3.5
196 4 4 2 5 0 7 13 12 13 0 5 8 73.0 4.6
197 6 8 8 10 8 9 13 12 6 0 4 2 86.0 3.8
198 6 7 4 2 0 7 13 12 11 1 5 4 72.0 4.2
199 4 4 2 1 0 7 7 1 0 0 5 4 35.0 2.6
200 3 4 0 7 8 5 5 11 14 7 5 1 70.0 4.0
201 6 8 2 10 2 6 13 12 11 9 5 8 92.0 3.6
202 6 8 7 10 6 9 13 12 14 9 5 8 107.0 2.9
203 6 8 2 10 5 8 13 11 14 9 4 8 98.0 3.6
204 6 8 4 4 2 8 13 5 12 9 5 8 84.0 3.3
205 3 0 0 0 0 0 0 2 0 0 0 0 5.0 1.0
206 2 0 0 0 2 0 5 0 2 0 5 0 16.0 1.9
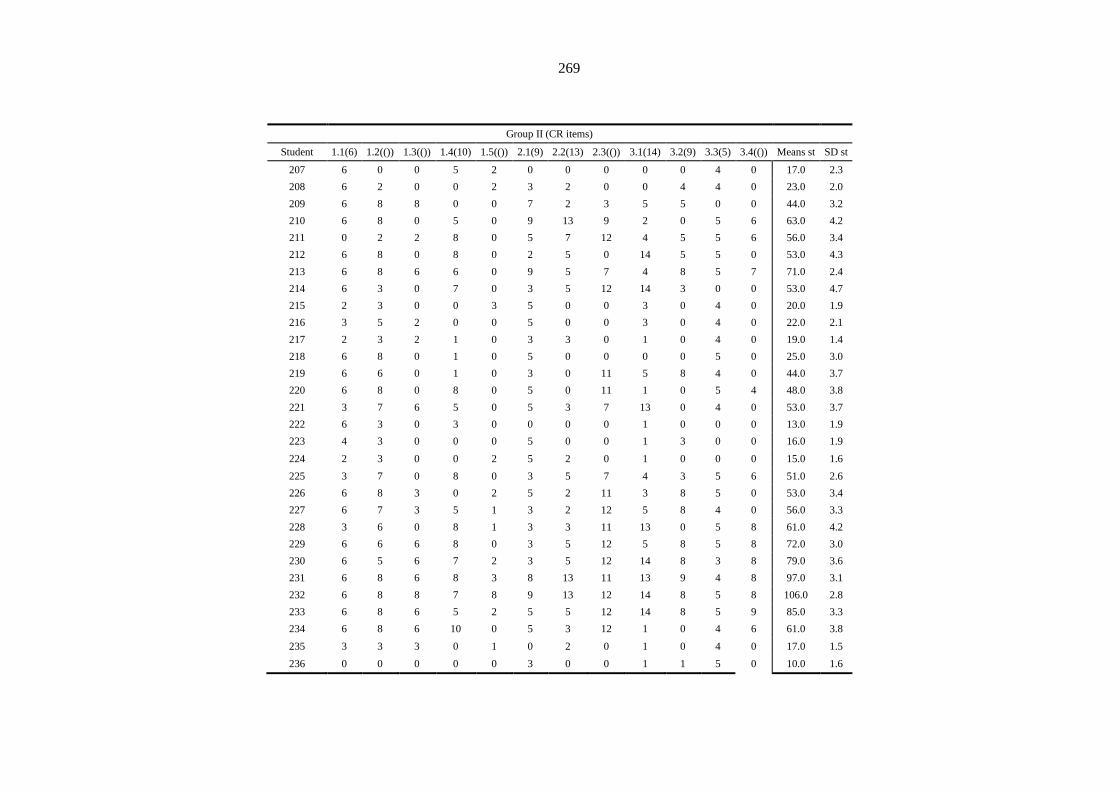
269
Group II (CR items)
Student 1.1(6) 1.2(()) 1.3(()) 1.4(10) 1.5(()) 2.1(9) 2.2(13) 2.3(()) 3.1(14) 3.2(9) 3.3(5) 3.4(()) Means st SD st
207 6 0 0 5 2 0 0 0 0 0 4 0 17.0 2.3
208 6 2 0 0 2 3 2 0 0 4 4 0 23.0 2.0
209 6 8 8 0 0 7 2 3 5 5 0 0 44.0 3.2
210 6 8 0 5 0 9 13 9 2 0 5 6 63.0 4.2
211 0 2 2 8 0 5 7 12 4 5 5 6 56.0 3.4
212 6 8 0 8 0 2 5 0 14 5 5 0 53.0 4.3
213 6 8 6 6 0 9 5 7 4 8 5 7 71.0 2.4
214 6 3 0 7 0 3 5 12 14 3 0 0 53.0 4.7
215 2 3 0 0 3 5 0 0 3 0 4 0 20.0 1.9
216 3 5 2 0 0 5 0 0 3 0 4 0 22.0 2.1
217 2 3 2 1 0 3 3 0 1 0 4 0 19.0 1.4
218 6 8 0 1 0 5 0 0 0 0 5 0 25.0 3.0
219 6 6 0 1 0 3 0 11 5 8 4 0 44.0 3.7
220 6 8 0 8 0 5 0 11 1 0 5 4 48.0 3.8
221 3 7 6 5 0 5 3 7 13 0 4 0 53.0 3.7
222 6 3 0 3 0 0 0 0 1 0 0 0 13.0 1.9
223 4 3 0 0 0 5 0 0 1 3 0 0 16.0 1.9
224 2 3 0 0 2 5 2 0 1 0 0 0 15.0 1.6
225 3 7 0 8 0 3 5 7 4 3 5 6 51.0 2.6
226 6 8 3 0 2 5 2 11 3 8 5 0 53.0 3.4
227 6 7 3 5 1 3 2 12 5 8 4 0 56.0 3.3
228 3 6 0 8 1 3 3 11 13 0 5 8 61.0 4.2
229 6 6 6 8 0 3 5 12 5 8 5 8 72.0 3.0
230 6 5 6 7 2 3 5 12 14 8 3 8 79.0 3.6
231 6 8 6 8 3 8 13 11 13 9 4 8 97.0 3.1
232 6 8 8 7 8 9 13 12 14 8 5 8 106.0 2.8
233 6 8 6 5 2 5 5 12 14 8 5 9 85.0 3.3
234 6 8 6 10 0 5 3 12 1 0 4 6 61.0 3.8
235 3 3 3 0 1 0 2 0 1 0 4 0 17.0 1.5
236 0 0 0 0 0 3 0 0 1 1 5 0 10.0 1.6
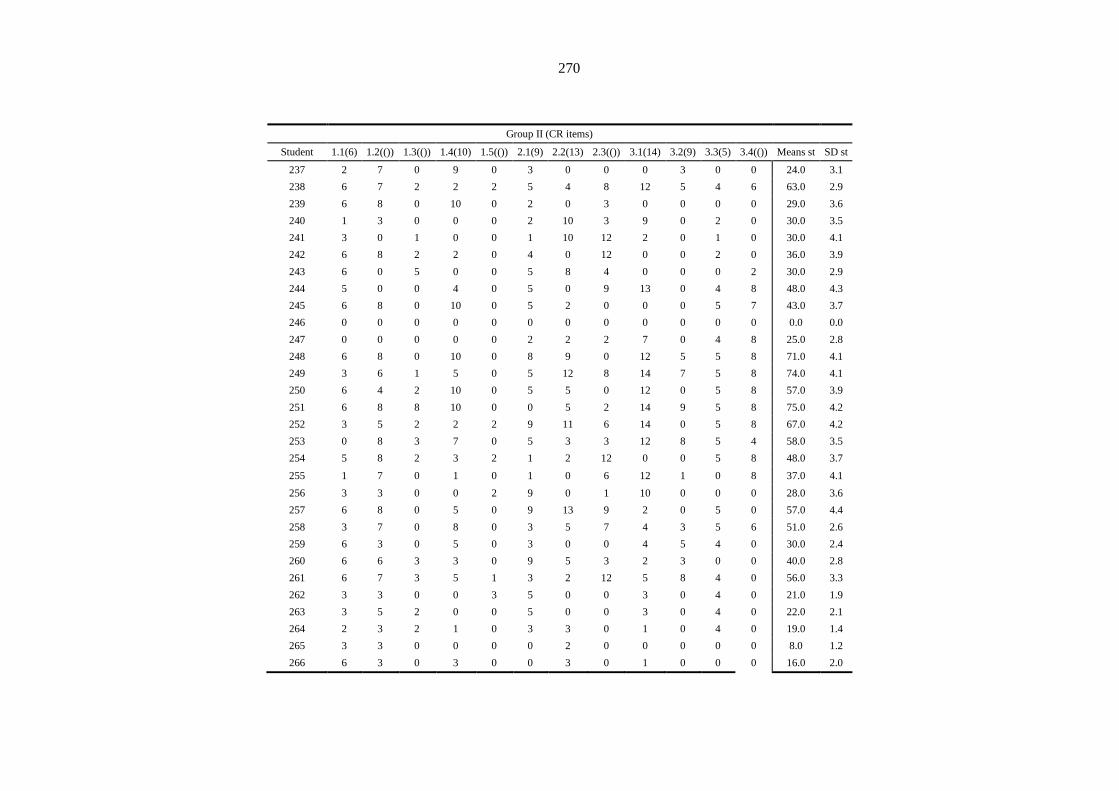
270
Group II (CR items)
Student 1.1(6) 1.2(()) 1.3(()) 1.4(10) 1.5(()) 2.1(9) 2.2(13) 2.3(()) 3.1(14) 3.2(9) 3.3(5) 3.4(()) Means st SD st
237 2 7 0 9 0 3 0 0 0 3 0 0 24.0 3.1
238 6 7 2 2 2 5 4 8 12 5 4 6 63.0 2.9
239 6 8 0 10 0 2 0 3 0 0 0 0 29.0 3.6
240 1 3 0 0 0 2 10 3 9 0 2 0 30.0 3.5
241 3 0 1 0 0 1 10 12 2 0 1 0 30.0 4.1
242 6 8 2 2 0 4 0 12 0 0 2 0 36.0 3.9
243 6 0 5 0 0 5 8 4 0 0 0 2 30.0 2.9
244 5 0 0 4 0 5 0 9 13 0 4 8 48.0 4.3
245 6 8 0 10 0 5 2 0 0 0 5 7 43.0 3.7
246 0 0 0 0 0 0 0 0 0 0 0 0 0.0 0.0
247 0 0 0 0 0 2 2 2 7 0 4 8 25.0 2.8
248 6 8 0 10 0 8 9 0 12 5 5 8 71.0 4.1
249 3 6 1 5 0 5 12 8 14 7 5 8 74.0 4.1
250 6 4 2 10 0 5 5 0 12 0 5 8 57.0 3.9
251 6 8 8 10 0 0 5 2 14 9 5 8 75.0 4.2
252 3 5 2 2 2 9 11 6 14 0 5 8 67.0 4.2
253 0 8 3 7 0 5 3 3 12 8 5 4 58.0 3.5
254 5 8 2 3 2 1 2 12 0 0 5 8 48.0 3.7
255 1 7 0 1 0 1 0 6 12 1 0 8 37.0 4.1
256 3 3 0 0 2 9 0 1 10 0 0 0 28.0 3.6
257 6 8 0 5 0 9 13 9 2 0 5 0 57.0 4.4
258 3 7 0 8 0 3 5 7 4 3 5 6 51.0 2.6
259 6 3 0 5 0 3 0 0 4 5 4 0 30.0 2.4
260 6 6 3 3 0 9 5 3 2 3 0 0 40.0 2.8
261 6 7 3 5 1 3 2 12 5 8 4 0 56.0 3.3
262 3 3 0 0 3 5 0 0 3 0 4 0 21.0 1.9
263 3 5 2 0 0 5 0 0 3 0 4 0 22.0 2.1
264 2 3 2 1 0 3 3 0 1 0 4 0 19.0 1.4
265 3 3 0 0 0 0 2 0 0 0 0 0 8.0 1.2
266 6 3 0 3 0 0 3 0 1 0 0 0 16.0 2.0
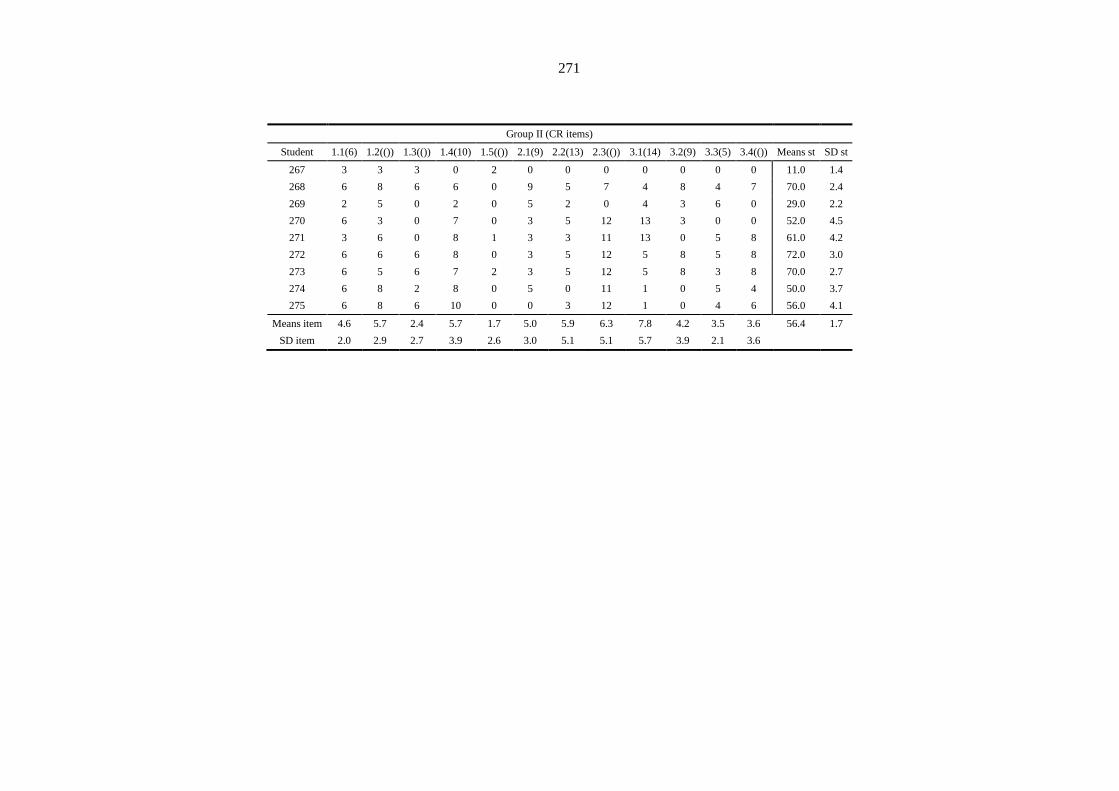
271
Group II (CR items)
Student 1.1(6) 1.2(()) 1.3(()) 1.4(10) 1.5(()) 2.1(9) 2.2(13) 2.3(()) 3.1(14) 3.2(9) 3.3(5) 3.4(()) Means st SD st
267 3 3 3 0 2 0 0 0 0 0 0 0 11.0 1.4
268 6 8 6 6 0 9 5 7 4 8 4 7 70.0 2.4
269 2 5 0 2 0 5 2 0 4 3 6 0 29.0 2.2
270 6 3 0 7 0 3 5 12 13 3 0 0 52.0 4.5
271 3 6 0 8 1 3 3 11 13 0 5 8 61.0 4.2
272 6 6 6 8 0 3 5 12 5 8 5 8 72.0 3.0
273 6 5 6 7 2 3 5 12 5 8 3 8 70.0 2.7
274 6 8 2 8 0 5 0 11 1 0 5 4 50.0 3.7
275 6 8 6 10 0 0 3 12 1 0 4 6 56.0 4.1
Means item 4.6 5.7 2.4 5.7 1.7 5.0 5.9 6.3 7.8 4.2 3.5 3.6 56.4 1.7
SD item 2.0 2.9 2.7 3.9 2.6 3.0 5.1 5.1 5.7 3.9 2.1 3.6
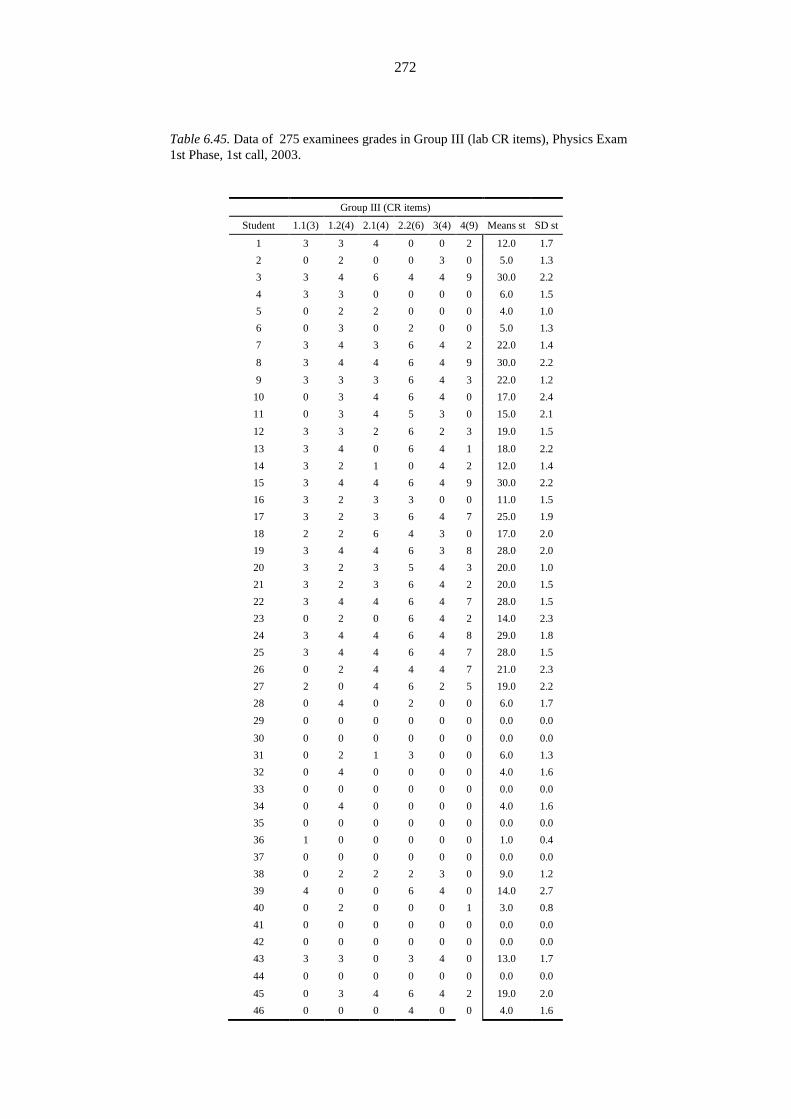
272
Table 6.45. Data of 275 examinees grades in Group III (lab CR items), Physics Exam
1st Phase, 1st call, 2003.
Group III (CR items)
Student 1.1(3) 1.2(4) 2.1(4) 2.2(6) 3(4) 4(9) Means st SD st
1 3 3 4 0 0 2 12.0 1.7
2 0 2 0 0 3 0 5.0 1.3
3 3 4 6 4 4 9 30.0 2.2
4 3 3 0 0 0 0 6.0 1.5
5 0 2 2 0 0 0 4.0 1.0
6 0 3 0 2 0 0 5.0 1.3
7 3 4 3 6 4 2 22.0 1.4
8 3 4 4 6 4 9 30.0 2.2
9 3 3 3 6 4 3 22.0 1.2
10 0 3 4 6 4 0 17.0 2.4
11 0 3 4 5 3 0 15.0 2.1
12 3 3 2 6 2 3 19.0 1.5
13 3 4 0 6 4 1 18.0 2.2
14 3 2 1 0 4 2 12.0 1.4
15 3 4 4 6 4 9 30.0 2.2
16 3 2 3 3 0 0 11.0 1.5
17 3 2 3 6 4 7 25.0 1.9
18 2 2 6 4 3 0 17.0 2.0
19 3 4 4 6 3 8 28.0 2.0
20 3 2 3 5 4 3 20.0 1.0
21 3 2 3 6 4 2 20.0 1.5
22 3 4 4 6 4 7 28.0 1.5
23 0 2 0 6 4 2 14.0 2.3
24 3 4 4 6 4 8 29.0 1.8
25 3 4 4 6 4 7 28.0 1.5
26 0 2 4 4 4 7 21.0 2.3
27 2 0 4 6 2 5 19.0 2.2
28 0 4 0 2 0 0 6.0 1.7
29 0 0 0 0 0 0 0.0 0.0
30 0 0 0 0 0 0 0.0 0.0
31 0 2 1 3 0 0 6.0 1.3
32 0 4 0 0 0 0 4.0 1.6
33 0 0 0 0 0 0 0.0 0.0
34 0 4 0 0 0 0 4.0 1.6
35 0 0 0 0 0 0 0.0 0.0
36 1 0 0 0 0 0 1.0 0.4
37 0 0 0 0 0 0 0.0 0.0
38 0 2 2 2 3 0 9.0 1.2
39 4 0 0 6 4 0 14.0 2.7
40 0 2 0 0 0 1 3.0 0.8
41 0 0 0 0 0 0 0.0 0.0
42 0 0 0 0 0 0 0.0 0.0
43 3 3 0 3 4 0 13.0 1.7
44 0 0 0 0 0 0 0.0 0.0
45 0 3 4 6 4 2 19.0 2.0
46 0 0 0 4 0 0 4.0 1.6
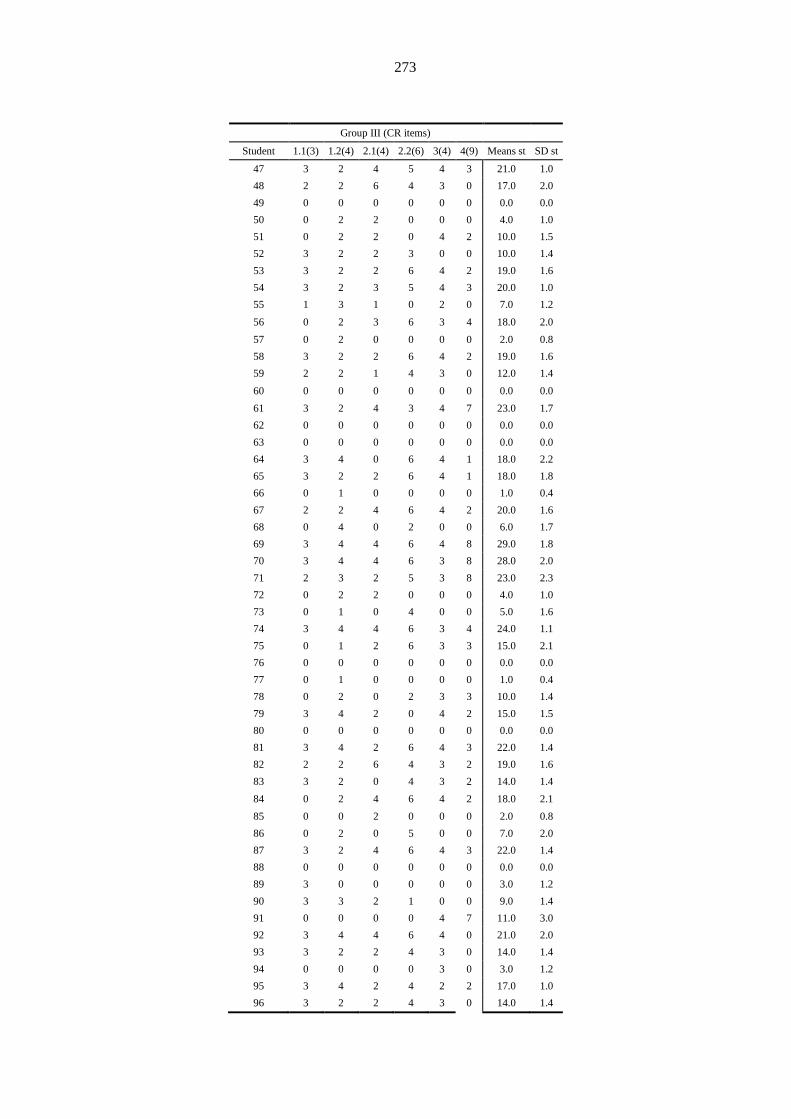
273
Group III (CR items)
Student 1.1(3) 1.2(4) 2.1(4) 2.2(6) 3(4) 4(9) Means st SD st
47 3 2 4 5 4 3 21.0 1.0
48 2 2 6 4 3 0 17.0 2.0
49 0 0 0 0 0 0 0.0 0.0
50 0 2 2 0 0 0 4.0 1.0
51 0 2 2 0 4 2 10.0 1.5
52 3 2 2 3 0 0 10.0 1.4
53 3 2 2 6 4 2 19.0 1.6
54 3 2 3 5 4 3 20.0 1.0
55 1 3 1 0 2 0 7.0 1.2
56 0 2 3 6 3 4 18.0 2.0
57 0 2 0 0 0 0 2.0 0.8
58 3 2 2 6 4 2 19.0 1.6
59 2 2 1 4 3 0 12.0 1.4
60 0 0 0 0 0 0 0.0 0.0
61 3 2 4 3 4 7 23.0 1.7
62 0 0 0 0 0 0 0.0 0.0
63 0 0 0 0 0 0 0.0 0.0
64 3 4 0 6 4 1 18.0 2.2
65 3 2 2 6 4 1 18.0 1.8
66 0 1 0 0 0 0 1.0 0.4
67 2 2 4 6 4 2 20.0 1.6
68 0 4 0 2 0 0 6.0 1.7
69 3 4 4 6 4 8 29.0 1.8
70 3 4 4 6 3 8 28.0 2.0
71 2 3 2 5 3 8 23.0 2.3
72 0 2 2 0 0 0 4.0 1.0
73 0 1 0 4 0 0 5.0 1.6
74 3 4 4 6 3 4 24.0 1.1
75 0 1 2 6 3 3 15.0 2.1
76 0 0 0 0 0 0 0.0 0.0
77 0 1 0 0 0 0 1.0 0.4
78 0 2 0 2 3 3 10.0 1.4
79 3 4 2 0 4 2 15.0 1.5
80 0 0 0 0 0 0 0.0 0.0
81 3 4 2 6 4 3 22.0 1.4
82 2 2 6 4 3 2 19.0 1.6
83 3 2 0 4 3 2 14.0 1.4
84 0 2 4 6 4 2 18.0 2.1
85 0 0 2 0 0 0 2.0 0.8
86 0 2 0 5 0 0 7.0 2.0
87 3 2 4 6 4 3 22.0 1.4
88 0 0 0 0 0 0 0.0 0.0
89 3 0 0 0 0 0 3.0 1.2
90 3 3 2 1 0 0 9.0 1.4
91 0 0 0 0 4 7 11.0 3.0
92 3 4 4 6 4 0 21.0 2.0
93 3 2 2 4 3 0 14.0 1.4
94 0 0 0 0 3 0 3.0 1.2
95 3 4 2 4 2 2 17.0 1.0
96 3 2 2 4 3 0 14.0 1.4
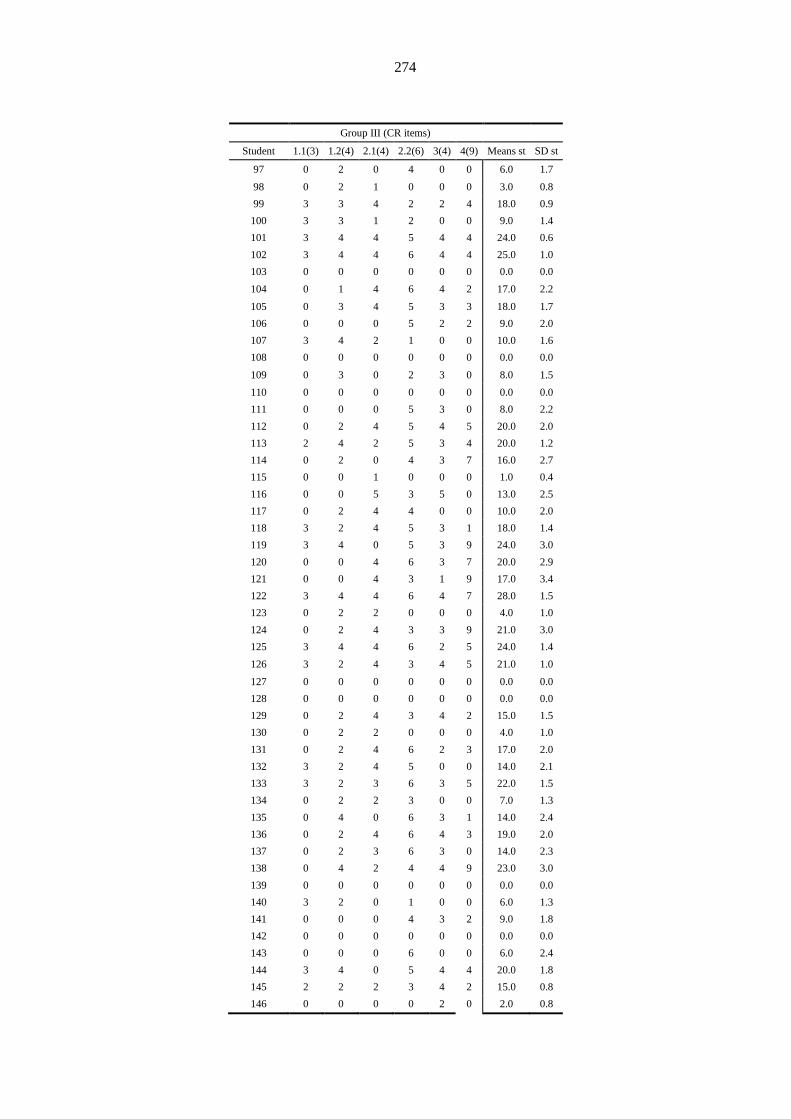
274
Group III (CR items)
Student 1.1(3) 1.2(4) 2.1(4) 2.2(6) 3(4) 4(9) Means st SD st
97 0 2 0 4 0 0 6.0 1.7
98 0 2 1 0 0 0 3.0 0.8
99 3 3 4 2 2 4 18.0 0.9
100 3 3 1 2 0 0 9.0 1.4
101 3 4 4 5 4 4 24.0 0.6
102 3 4 4 6 4 4 25.0 1.0
103 0 0 0 0 0 0 0.0 0.0
104 0 1 4 6 4 2 17.0 2.2
105 0 3 4 5 3 3 18.0 1.7
106 0 0 0 5 2 2 9.0 2.0
107 3 4 2 1 0 0 10.0 1.6
108 0 0 0 0 0 0 0.0 0.0
109 0 3 0 2 3 0 8.0 1.5
110 0 0 0 0 0 0 0.0 0.0
111 0 0 0 5 3 0 8.0 2.2
112 0 2 4 5 4 5 20.0 2.0
113 2 4 2 5 3 4 20.0 1.2
114 0 2 0 4 3 7 16.0 2.7
115 0 0 1 0 0 0 1.0 0.4
116 0 0 5 3 5 0 13.0 2.5
117 0 2 4 4 0 0 10.0 2.0
118 3 2 4 5 3 1 18.0 1.4
119 3 4 0 5 3 9 24.0 3.0
120 0 0 4 6 3 7 20.0 2.9
121 0 0 4 3 1 9 17.0 3.4
122 3 4 4 6 4 7 28.0 1.5
123 0 2 2 0 0 0 4.0 1.0
124 0 2 4 3 3 9 21.0 3.0
125 3 4 4 6 2 5 24.0 1.4
126 3 2 4 3 4 5 21.0 1.0
127 0 0 0 0 0 0 0.0 0.0
128 0 0 0 0 0 0 0.0 0.0
129 0 2 4 3 4 2 15.0 1.5
130 0 2 2 0 0 0 4.0 1.0
131 0 2 4 6 2 3 17.0 2.0
132 3 2 4 5 0 0 14.0 2.1
133 3 2 3 6 3 5 22.0 1.5
134 0 2 2 3 0 0 7.0 1.3
135 0 4 0 6 3 1 14.0 2.4
136 0 2 4 6 4 3 19.0 2.0
137 0 2 3 6 3 0 14.0 2.3
138 0 4 2 4 4 9 23.0 3.0
139 0 0 0 0 0 0 0.0 0.0
140 3 2 0 1 0 0 6.0 1.3
141 0 0 0 4 3 2 9.0 1.8
142 0 0 0 0 0 0 0.0 0.0
143 0 0 0 6 0 0 6.0 2.4
144 3 4 0 5 4 4 20.0 1.8
145 2 2 2 3 4 2 15.0 0.8
146 0 0 0 0 2 0 2.0 0.8
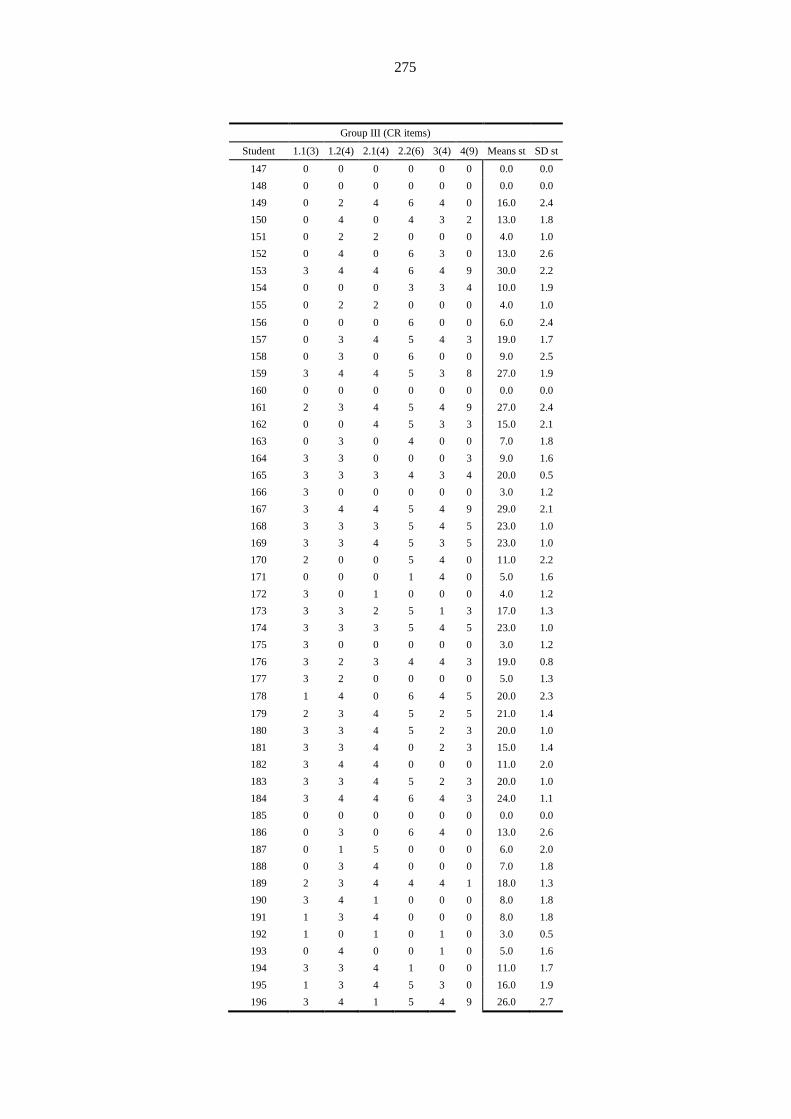
275
Group III (CR items)
Student 1.1(3) 1.2(4) 2.1(4) 2.2(6) 3(4) 4(9) Means st SD st
147 0 0 0 0 0 0 0.0 0.0
148 0 0 0 0 0 0 0.0 0.0
149 0 2 4 6 4 0 16.0 2.4
150 0 4 0 4 3 2 13.0 1.8
151 0 2 2 0 0 0 4.0 1.0
152 0 4 0 6 3 0 13.0 2.6
153 3 4 4 6 4 9 30.0 2.2
154 0 0 0 3 3 4 10.0 1.9
155 0 2 2 0 0 0 4.0 1.0
156 0 0 0 6 0 0 6.0 2.4
157 0 3 4 5 4 3 19.0 1.7
158 0 3 0 6 0 0 9.0 2.5
159 3 4 4 5 3 8 27.0 1.9
160 0 0 0 0 0 0 0.0 0.0
161 2 3 4 5 4 9 27.0 2.4
162 0 0 4 5 3 3 15.0 2.1
163 0 3 0 4 0 0 7.0 1.8
164 3 3 0 0 0 3 9.0 1.6
165 3 3 3 4 3 4 20.0 0.5
166 3 0 0 0 0 0 3.0 1.2
167 3 4 4 5 4 9 29.0 2.1
168 3 3 3 5 4 5 23.0 1.0
169 3 3 4 5 3 5 23.0 1.0
170 2 0 0 5 4 0 11.0 2.2
171 0 0 0 1 4 0 5.0 1.6
172 3 0 1 0 0 0 4.0 1.2
173 3 3 2 5 1 3 17.0 1.3
174 3 3 3 5 4 5 23.0 1.0
175 3 0 0 0 0 0 3.0 1.2
176 3 2 3 4 4 3 19.0 0.8
177 3 2 0 0 0 0 5.0 1.3
178 1 4 0 6 4 5 20.0 2.3
179 2 3 4 5 2 5 21.0 1.4
180 3 3 4 5 2 3 20.0 1.0
181 3 3 4 0 2 3 15.0 1.4
182 3 4 4 0 0 0 11.0 2.0
183 3 3 4 5 2 3 20.0 1.0
184 3 4 4 6 4 3 24.0 1.1
185 0 0 0 0 0 0 0.0 0.0
186 0 3 0 6 4 0 13.0 2.6
187 0 1 5 0 0 0 6.0 2.0
188 0 3 4 0 0 0 7.0 1.8
189 2 3 4 4 4 1 18.0 1.3
190 3 4 1 0 0 0 8.0 1.8
191 1 3 4 0 0 0 8.0 1.8
192 1 0 1 0 1 0 3.0 0.5
193 0 4 0 0 1 0 5.0 1.6
194 3 3 4 1 0 0 11.0 1.7
195 1 3 4 5 3 0 16.0 1.9
196 3 4 1 5 4 9 26.0 2.7

276
Group III (CR items)
Student 1.1(3) 1.2(4) 2.1(4) 2.2(6) 3(4) 4(9) Means st SD st
197 3 4 4 6 4 3 24.0 1.1
198 3 1 1 1 2 0 8.0 1.0
199 0 3 4 1 0 2 10.0 1.6
200 0 4 1 6 3 5 19.0 2.3
201 1 4 4 3 4 1 17.0 1.5
202 1 3 1 6 4 7 22.0 2.5
203 0 0 2 6 0 2 10.0 2.3
204 3 3 4 5 3 3 21.0 0.8
205 0 0 0 0 0 0 0.0 0.0
206 3 0 0 0 0 0 3.0 1.2
207 2 2 0 0 0 0 4.0 1.0
208 0 2 2 0 0 0 4.0 1.0
209 0 2 4 6 2 3 17.0 2.0
210 0 2 2 3 0 0 7.0 1.3
211 0 4 2 6 3 1 16.0 2.2
212 0 2 3 6 3 0 14.0 2.3
213 0 2 2 4 2 0 10.0 1.5
214 2 4 3 6 4 0 19.0 2.0
215 0 0 0 0 0 0 0.0 0.0
216 1 2 3 0 0 0 6.0 1.3
217 0 4 2 0 0 0 6.0 1.7
218 0 2 4 6 4 0 16.0 2.4
219 0 0 3 5 3 0 11.0 2.1
220 3 4 2 6 2 0 17.0 2.0
221 0 2 4 5 3 0 14.0 2.1
222 0 0 0 0 0 0 0.0 0.0
223 3 2 2 3 4 0 14.0 1.4
224 0 0 0 0 0 0 0.0 0.0
225 0 2 4 6 2 0 14.0 2.3
226 0 4 2 1 2 0 9.0 1.5
227 3 2 2 4 0 0 11.0 1.6
228 0 2 3 6 3 0 14.0 2.3
229 3 4 0 5 4 4 20.0 1.8
230 0 4 4 6 4 0 18.0 2.4
231 1 4 4 6 4 9 28.0 2.7
232 3 4 4 6 4 9 30.0 2.2
233 3 4 4 6 4 9 30.0 2.2
234 3 4 4 6 4 9 30.0 2.2
235 0 2 2 0 3 4 11.0 1.6
236 0 0 0 0 0 3 3.0 1.2
237 0 2 0 2 0 0 4.0 1.0
238 2 3 4 6 4 5 24.0 1.4
239 0 0 0 0 0 0 0.0 0.0
240 0 2 0 5 3 0 10.0 2.1
241 3 2 0 0 0 3 8.0 1.5
242 0 0 0 0 0 0 0.0 0.0
243 3 0 2 0 0 0 5.0 1.3
244 0 2 1 0 4 0 7.0 1.6
245 0 3 0 5 4 0 12.0 2.3
246 0 0 4 4 0 0 8.0 2.1
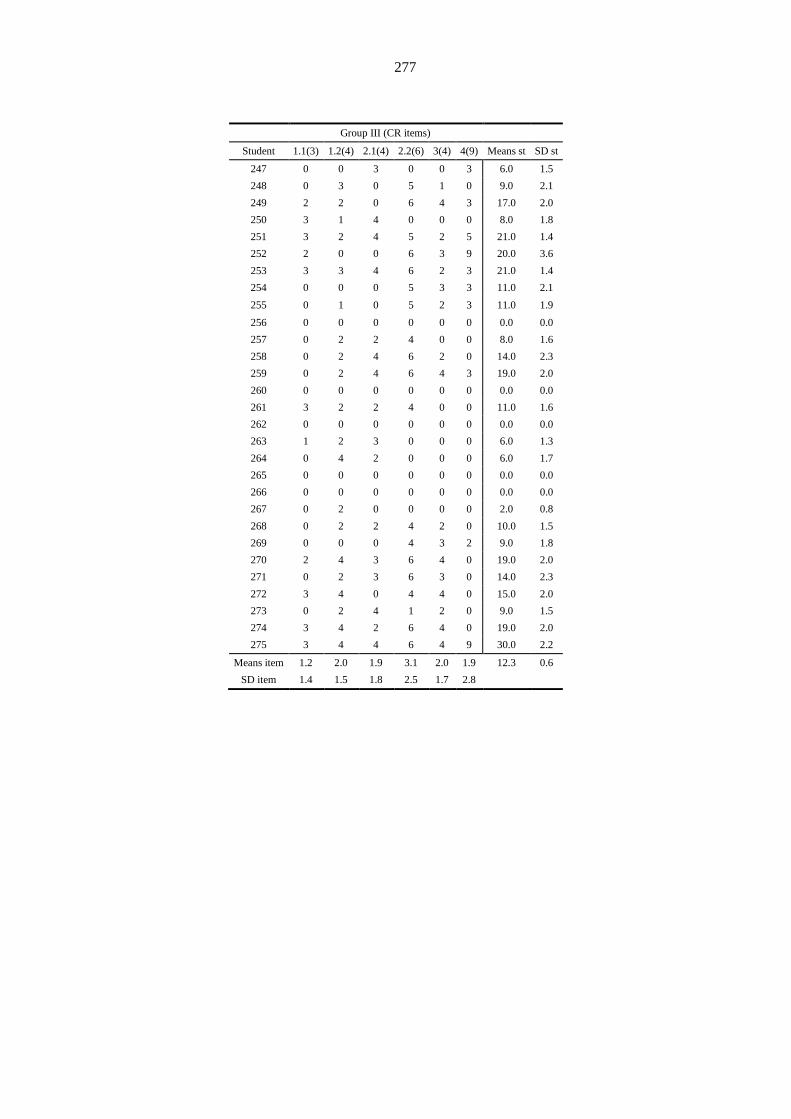
277
Group III (CR items)
Student 1.1(3) 1.2(4) 2.1(4) 2.2(6) 3(4) 4(9) Means st SD st
247 0 0 3 0 0 3 6.0 1.5
248 0 3 0 5 1 0 9.0 2.1
249 2 2 0 6 4 3 17.0 2.0
250 3 1 4 0 0 0 8.0 1.8
251 3 2 4 5 2 5 21.0 1.4
252 2 0 0 6 3 9 20.0 3.6
253 3 3 4 6 2 3 21.0 1.4
254 0 0 0 5 3 3 11.0 2.1
255 0 1 0 5 2 3 11.0 1.9
256 0 0 0 0 0 0 0.0 0.0
257 0 2 2 4 0 0 8.0 1.6
258 0 2 4 6 2 0 14.0 2.3
259 0 2 4 6 4 3 19.0 2.0
260 0 0 0 0 0 0 0.0 0.0
261 3 2 2 4 0 0 11.0 1.6
262 0 0 0 0 0 0 0.0 0.0
263 1 2 3 0 0 0 6.0 1.3
264 0 4 2 0 0 0 6.0 1.7
265 0 0 0 0 0 0 0.0 0.0
266 0 0 0 0 0 0 0.0 0.0
267 0 2 0 0 0 0 2.0 0.8
268 0 2 2 4 2 0 10.0 1.5
269 0 0 0 4 3 2 9.0 1.8
270 2 4 3 6 4 0 19.0 2.0
271 0 2 3 6 3 0 14.0 2.3
272 3 4 0 4 4 0 15.0 2.0
273 0 2 4 1 2 0 9.0 1.5
274 3 4 2 6 4 0 19.0 2.0
275 3 4 4 6 4 9 30.0 2.2
Means item 1.2 2.0 1.9 3.1 2.0 1.9 12.3 0.6
SD item 1.4 1.5 1.8 2.5 1.7 2.8
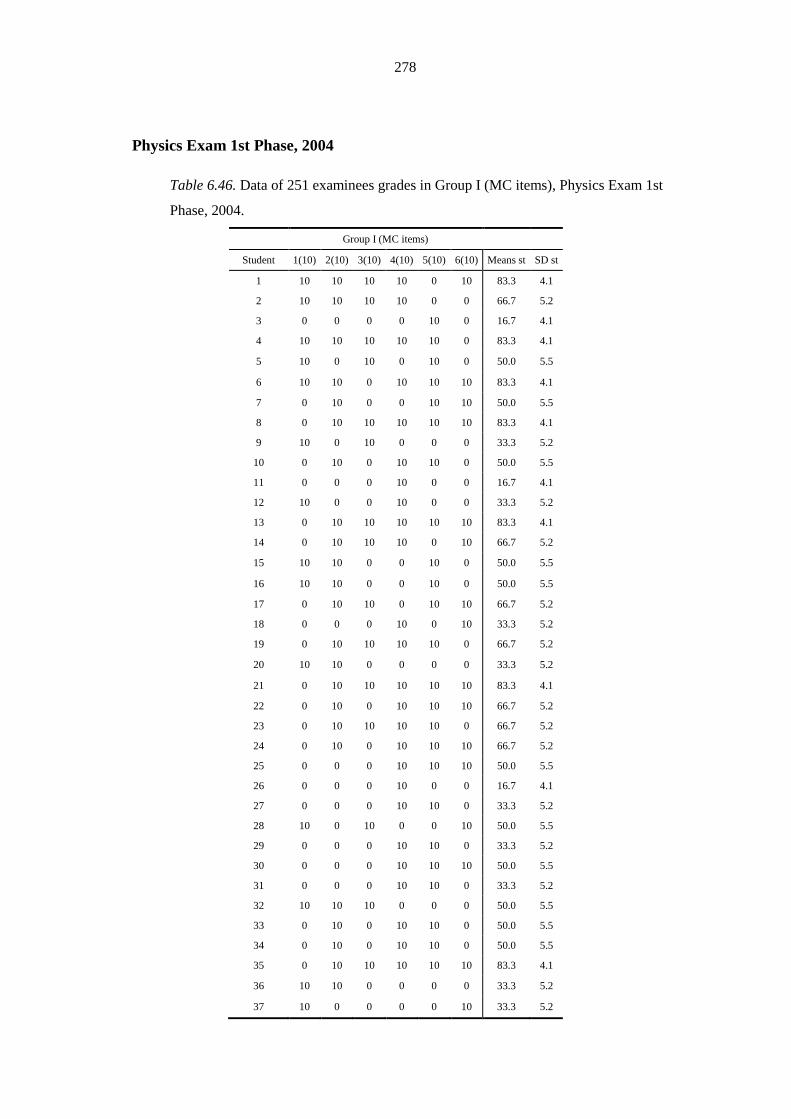
278
Physics Exam 1st Phase, 2004
Table 6.46. Data of 251 examinees grades in Group I (MC items), Physics Exam 1st
Phase, 2004.
Group I (MC items)
Student 1(10) 2(10) 3(10) 4(10) 5(10) 6(10) Means st SD st
1 10 10 10 10 0 10 83.3 4.1
2 10 10 10 10 0 0 66.7 5.2
3 0 0 0 0 10 0 16.7 4.1
4 10 10 10 10 10 0 83.3 4.1
5 10 0 10 0 10 0 50.0 5.5
6 10 10 0 10 10 10 83.3 4.1
7 0 10 0 0 10 10 50.0 5.5
8 0 10 10 10 10 10 83.3 4.1
9 10 0 10 0 0 0 33.3 5.2
10 0 10 0 10 10 0 50.0 5.5
11 0 0 0 10 0 0 16.7 4.1
12 10 0 0 10 0 0 33.3 5.2
13 0 10 10 10 10 10 83.3 4.1
14 0 10 10 10 0 10 66.7 5.2
15 10 10 0 0 10 0 50.0 5.5
16 10 10 0 0 10 0 50.0 5.5
17 0 10 10 0 10 10 66.7 5.2
18 0 0 0 10 0 10 33.3 5.2
19 0 10 10 10 10 0 66.7 5.2
20 10 10 0 0 0 0 33.3 5.2
21 0 10 10 10 10 10 83.3 4.1
22 0 10 0 10 10 10 66.7 5.2
23 0 10 10 10 10 0 66.7 5.2
24 0 10 0 10 10 10 66.7 5.2
25 0 0 0 10 10 10 50.0 5.5
26 0 0 0 10 0 0 16.7 4.1
27 0 0 0 10 10 0 33.3 5.2
28 10 0 10 0 0 10 50.0 5.5
29 0 0 0 10 10 0 33.3 5.2
30 0 0 0 10 10 10 50.0 5.5
31 0 0 0 10 10 0 33.3 5.2
32 10 10 10 0 0 0 50.0 5.5
33 0 10 0 10 10 0 50.0 5.5
34 0 10 0 10 10 0 50.0 5.5
35 0 10 10 10 10 10 83.3 4.1
36 10 10 0 0 0 0 33.3 5.2
37 10 0 0 0 0 10 33.3 5.2
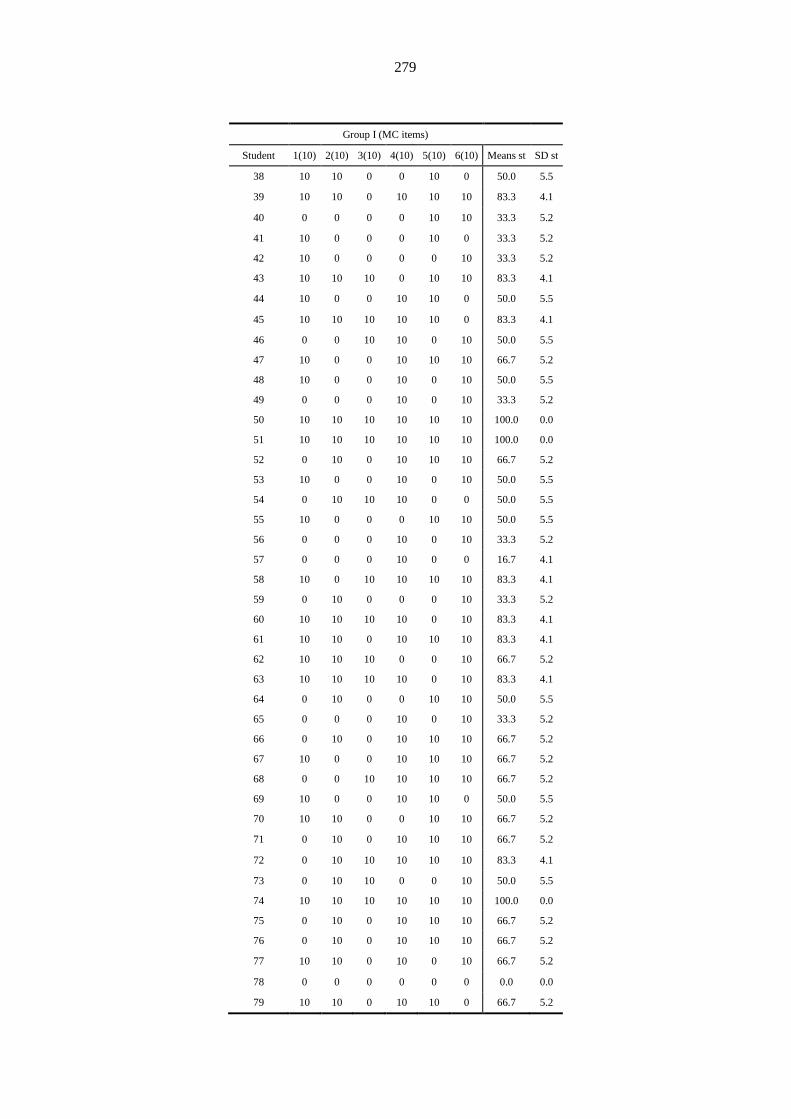
279
Group I (MC items)
Student 1(10) 2(10) 3(10) 4(10) 5(10) 6(10) Means st SD st
38 10 10 0 0 10 0 50.0 5.5
39 10 10 0 10 10 10 83.3 4.1
40 0 0 0 0 10 10 33.3 5.2
41 10 0 0 0 10 0 33.3 5.2
42 10 0 0 0 0 10 33.3 5.2
43 10 10 10 0 10 10 83.3 4.1
44 10 0 0 10 10 0 50.0 5.5
45 10 10 10 10 10 0 83.3 4.1
46 0 0 10 10 0 10 50.0 5.5
47 10 0 0 10 10 10 66.7 5.2
48 10 0 0 10 0 10 50.0 5.5
49 0 0 0 10 0 10 33.3 5.2
50 10 10 10 10 10 10 100.0 0.0
51 10 10 10 10 10 10 100.0 0.0
52 0 10 0 10 10 10 66.7 5.2
53 10 0 0 10 0 10 50.0 5.5
54 0 10 10 10 0 0 50.0 5.5
55 10 0 0 0 10 10 50.0 5.5
56 0 0 0 10 0 10 33.3 5.2
57 0 0 0 10 0 0 16.7 4.1
58 10 0 10 10 10 10 83.3 4.1
59 0 10 0 0 0 10 33.3 5.2
60 10 10 10 10 0 10 83.3 4.1
61 10 10 0 10 10 10 83.3 4.1
62 10 10 10 0 0 10 66.7 5.2
63 10 10 10 10 0 10 83.3 4.1
64 0 10 0 0 10 10 50.0 5.5
65 0 0 0 10 0 10 33.3 5.2
66 0 10 0 10 10 10 66.7 5.2
67 10 0 0 10 10 10 66.7 5.2
68 0 0 10 10 10 10 66.7 5.2
69 10 0 0 10 10 0 50.0 5.5
70 10 10 0 0 10 10 66.7 5.2
71 0 10 0 10 10 10 66.7 5.2
72 0 10 10 10 10 10 83.3 4.1
73 0 10 10 0 0 10 50.0 5.5
74 10 10 10 10 10 10 100.0 0.0
75 0 10 0 10 10 10 66.7 5.2
76 0 10 0 10 10 10 66.7 5.2
77 10 10 0 10 0 10 66.7 5.2
78 0 0 0 0 0 0 0.0 0.0
79 10 10 0 10 10 0 66.7 5.2
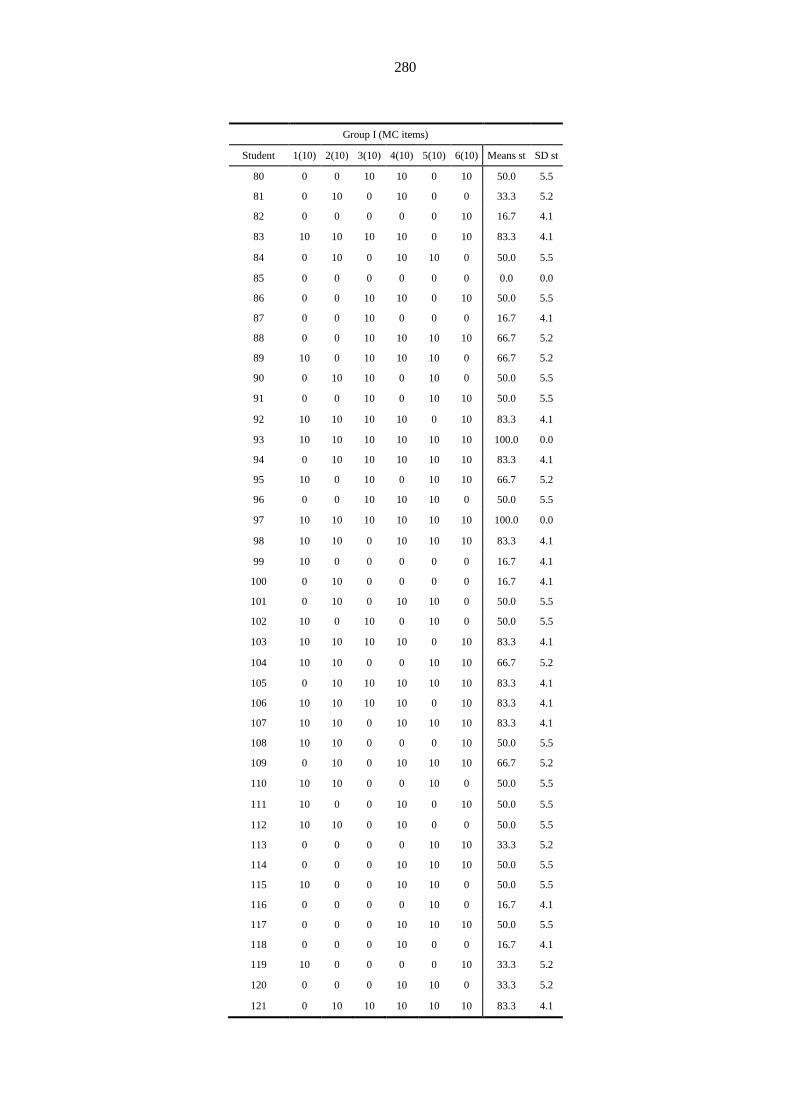
280
Group I (MC items)
Student 1(10) 2(10) 3(10) 4(10) 5(10) 6(10) Means st SD st
80 0 0 10 10 0 10 50.0 5.5
81 0 10 0 10 0 0 33.3 5.2
82 0 0 0 0 0 10 16.7 4.1
83 10 10 10 10 0 10 83.3 4.1
84 0 10 0 10 10 0 50.0 5.5
85 0 0 0 0 0 0 0.0 0.0
86 0 0 10 10 0 10 50.0 5.5
87 0 0 10 0 0 0 16.7 4.1
88 0 0 10 10 10 10 66.7 5.2
89 10 0 10 10 10 0 66.7 5.2
90 0 10 10 0 10 0 50.0 5.5
91 0 0 10 0 10 10 50.0 5.5
92 10 10 10 10 0 10 83.3 4.1
93 10 10 10 10 10 10 100.0 0.0
94 0 10 10 10 10 10 83.3 4.1
95 10 0 10 0 10 10 66.7 5.2
96 0 0 10 10 10 0 50.0 5.5
97 10 10 10 10 10 10 100.0 0.0
98 10 10 0 10 10 10 83.3 4.1
99 10 0 0 0 0 0 16.7 4.1
100 0 10 0 0 0 0 16.7 4.1
101 0 10 0 10 10 0 50.0 5.5
102 10 0 10 0 10 0 50.0 5.5
103 10 10 10 10 0 10 83.3 4.1
104 10 10 0 0 10 10 66.7 5.2
105 0 10 10 10 10 10 83.3 4.1
106 10 10 10 10 0 10 83.3 4.1
107 10 10 0 10 10 10 83.3 4.1
108 10 10 0 0 0 10 50.0 5.5
109 0 10 0 10 10 10 66.7 5.2
110 10 10 0 0 10 0 50.0 5.5
111 10 0 0 10 0 10 50.0 5.5
112 10 10 0 10 0 0 50.0 5.5
113 0 0 0 0 10 10 33.3 5.2
114 0 0 0 10 10 10 50.0 5.5
115 10 0 0 10 10 0 50.0 5.5
116 0 0 0 0 10 0 16.7 4.1
117 0 0 0 10 10 10 50.0 5.5
118 0 0 0 10 0 0 16.7 4.1
119 10 0 0 0 0 10 33.3 5.2
120 0 0 0 10 10 0 33.3 5.2
121 0 10 10 10 10 10 83.3 4.1
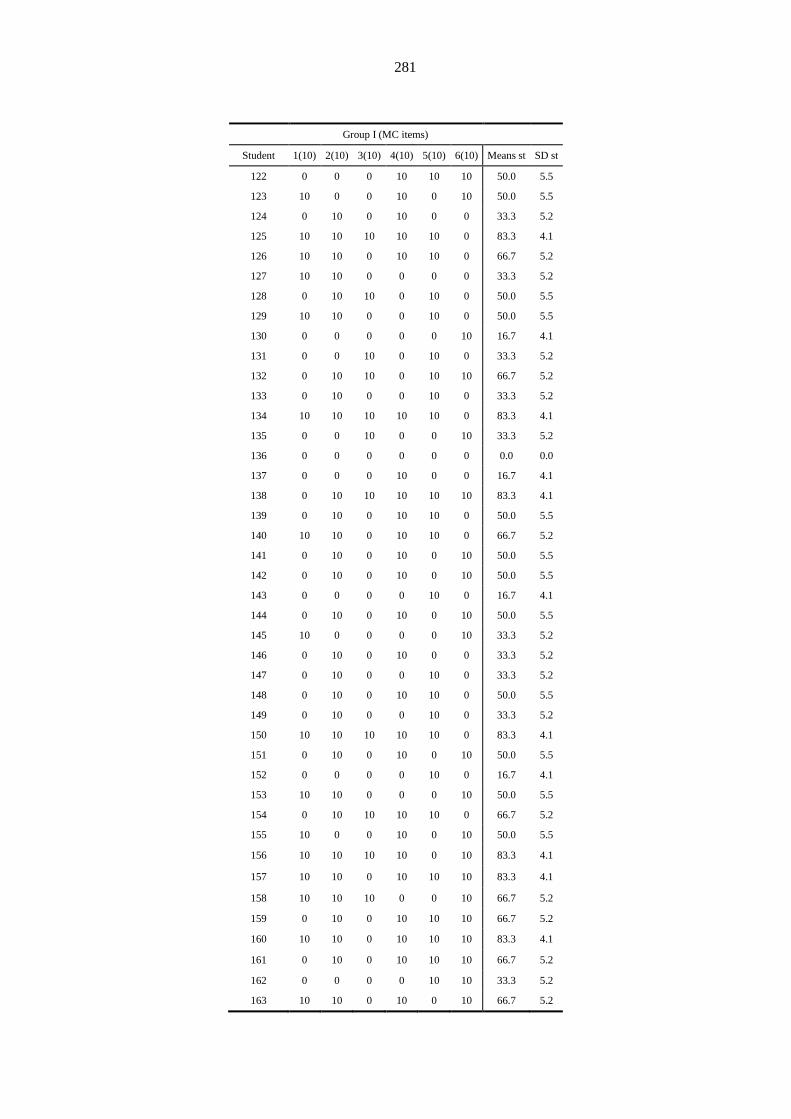
281
Group I (MC items)
Student 1(10) 2(10) 3(10) 4(10) 5(10) 6(10) Means st SD st
122 0 0 0 10 10 10 50.0 5.5
123 10 0 0 10 0 10 50.0 5.5
124 0 10 0 10 0 0 33.3 5.2
125 10 10 10 10 10 0 83.3 4.1
126 10 10 0 10 10 0 66.7 5.2
127 10 10 0 0 0 0 33.3 5.2
128 0 10 10 0 10 0 50.0 5.5
129 10 10 0 0 10 0 50.0 5.5
130 0 0 0 0 0 10 16.7 4.1
131 0 0 10 0 10 0 33.3 5.2
132 0 10 10 0 10 10 66.7 5.2
133 0 10 0 0 10 0 33.3 5.2
134 10 10 10 10 10 0 83.3 4.1
135 0 0 10 0 0 10 33.3 5.2
136 0 0 0 0 0 0 0.0 0.0
137 0 0 0 10 0 0 16.7 4.1
138 0 10 10 10 10 10 83.3 4.1
139 0 10 0 10 10 0 50.0 5.5
140 10 10 0 10 10 0 66.7 5.2
141 0 10 0 10 0 10 50.0 5.5
142 0 10 0 10 0 10 50.0 5.5
143 0 0 0 0 10 0 16.7 4.1
144 0 10 0 10 0 10 50.0 5.5
145 10 0 0 0 0 10 33.3 5.2
146 0 10 0 10 0 0 33.3 5.2
147 0 10 0 0 10 0 33.3 5.2
148 0 10 0 10 10 0 50.0 5.5
149 0 10 0 0 10 0 33.3 5.2
150 10 10 10 10 10 0 83.3 4.1
151 0 10 0 10 0 10 50.0 5.5
152 0 0 0 0 10 0 16.7 4.1
153 10 10 0 0 0 10 50.0 5.5
154 0 10 10 10 10 0 66.7 5.2
155 10 0 0 10 0 10 50.0 5.5
156 10 10 10 10 0 10 83.3 4.1
157 10 10 0 10 10 10 83.3 4.1
158 10 10 10 0 0 10 66.7 5.2
159 0 10 0 10 10 10 66.7 5.2
160 10 10 0 10 10 10 83.3 4.1
161 0 10 0 10 10 10 66.7 5.2
162 0 0 0 0 10 10 33.3 5.2
163 10 10 0 10 0 10 66.7 5.2
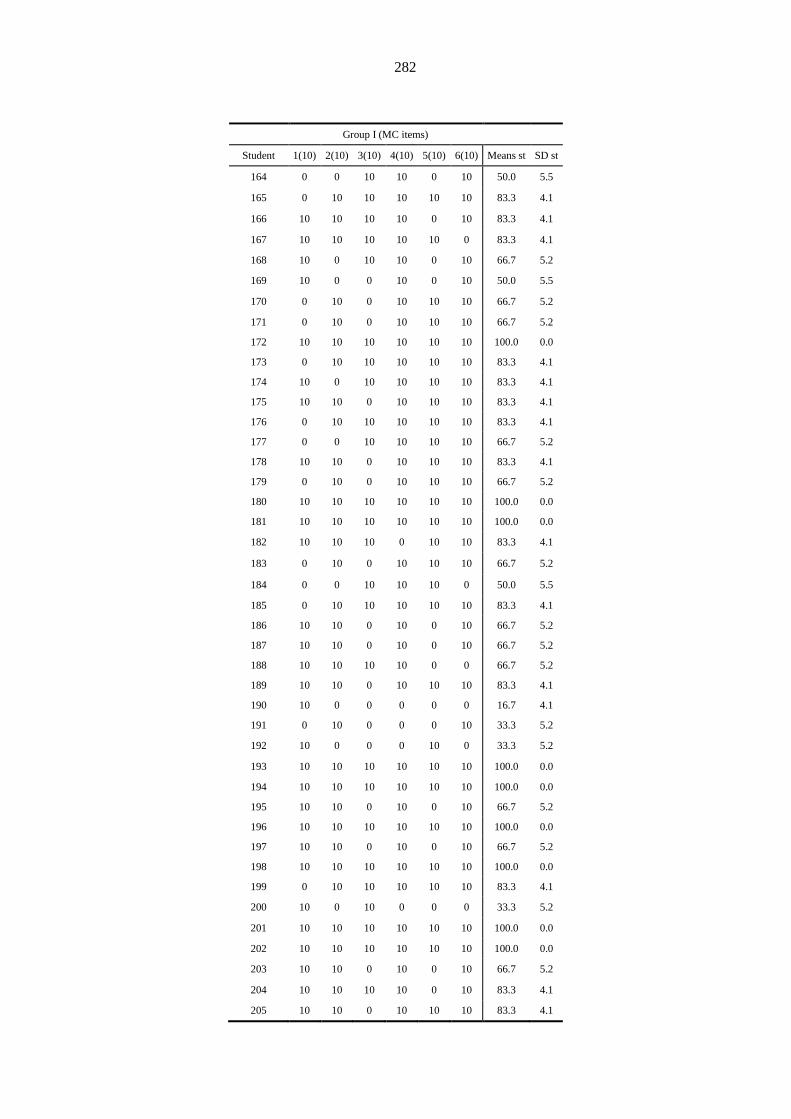
282
Group I (MC items)
Student 1(10) 2(10) 3(10) 4(10) 5(10) 6(10) Means st SD st
164 0 0 10 10 0 10 50.0 5.5
165 0 10 10 10 10 10 83.3 4.1
166 10 10 10 10 0 10 83.3 4.1
167 10 10 10 10 10 0 83.3 4.1
168 10 0 10 10 0 10 66.7 5.2
169 10 0 0 10 0 10 50.0 5.5
170 0 10 0 10 10 10 66.7 5.2
171 0 10 0 10 10 10 66.7 5.2
172 10 10 10 10 10 10 100.0 0.0
173 0 10 10 10 10 10 83.3 4.1
174 10 0 10 10 10 10 83.3 4.1
175 10 10 0 10 10 10 83.3 4.1
176 0 10 10 10 10 10 83.3 4.1
177 0 0 10 10 10 10 66.7 5.2
178 10 10 0 10 10 10 83.3 4.1
179 0 10 0 10 10 10 66.7 5.2
180 10 10 10 10 10 10 100.0 0.0
181 10 10 10 10 10 10 100.0 0.0
182 10 10 10 0 10 10 83.3 4.1
183 0 10 0 10 10 10 66.7 5.2
184 0 0 10 10 10 0 50.0 5.5
185 0 10 10 10 10 10 83.3 4.1
186 10 10 0 10 0 10 66.7 5.2
187 10 10 0 10 0 10 66.7 5.2
188 10 10 10 10 0 0 66.7 5.2
189 10 10 0 10 10 10 83.3 4.1
190 10 0 0 0 0 0 16.7 4.1
191 0 10 0 0 0 10 33.3 5.2
192 10 0 0 0 10 0 33.3 5.2
193 10 10 10 10 10 10 100.0 0.0
194 10 10 10 10 10 10 100.0 0.0
195 10 10 0 10 0 10 66.7 5.2
196 10 10 10 10 10 10 100.0 0.0
197 10 10 0 10 0 10 66.7 5.2
198 10 10 10 10 10 10 100.0 0.0
199 0 10 10 10 10 10 83.3 4.1
200 10 0 10 0 0 0 33.3 5.2
201 10 10 10 10 10 10 100.0 0.0
202 10 10 10 10 10 10 100.0 0.0
203 10 10 0 10 0 10 66.7 5.2
204 10 10 10 10 0 10 83.3 4.1
205 10 10 0 10 10 10 83.3 4.1
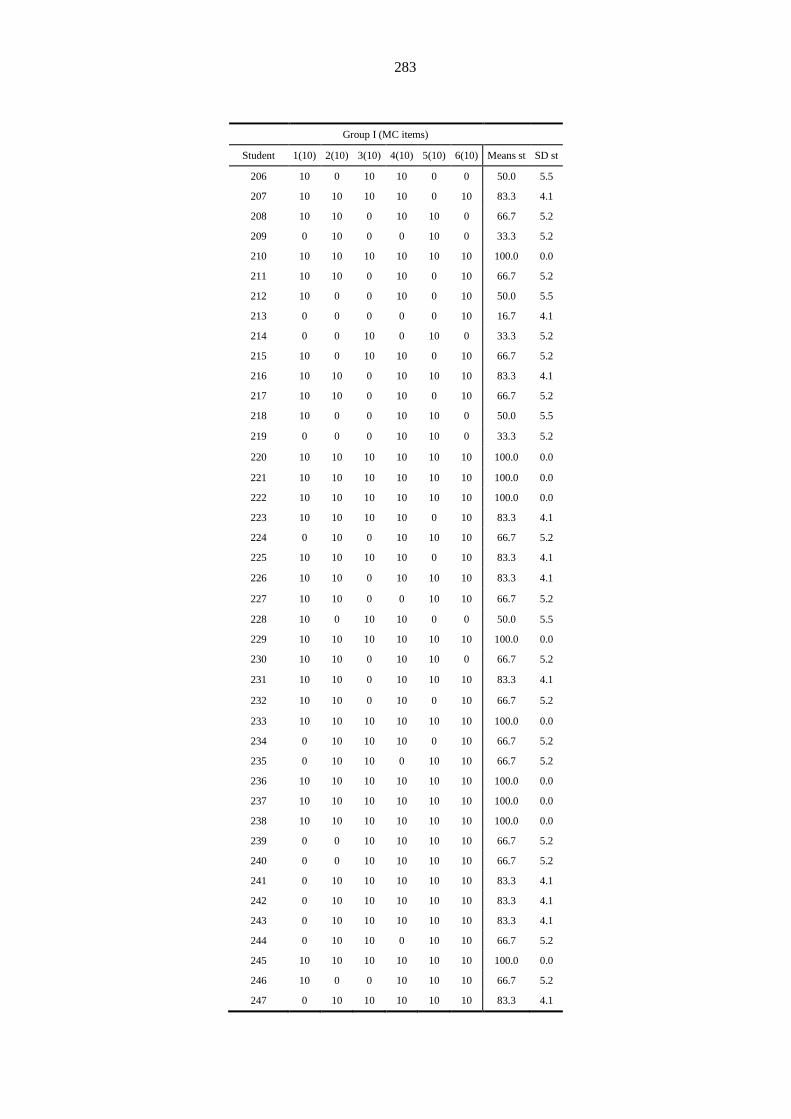
283
Group I (MC items)
Student 1(10) 2(10) 3(10) 4(10) 5(10) 6(10) Means st SD st
206 10 0 10 10 0 0 50.0 5.5
207 10 10 10 10 0 10 83.3 4.1
208 10 10 0 10 10 0 66.7 5.2
209 0 10 0 0 10 0 33.3 5.2
210 10 10 10 10 10 10 100.0 0.0
211 10 10 0 10 0 10 66.7 5.2
212 10 0 0 10 0 10 50.0 5.5
213 0 0 0 0 0 10 16.7 4.1
214 0 0 10 0 10 0 33.3 5.2
215 10 0 10 10 0 10 66.7 5.2
216 10 10 0 10 10 10 83.3 4.1
217 10 10 0 10 0 10 66.7 5.2
218 10 0 0 10 10 0 50.0 5.5
219 0 0 0 10 10 0 33.3 5.2
220 10 10 10 10 10 10 100.0 0.0
221 10 10 10 10 10 10 100.0 0.0
222 10 10 10 10 10 10 100.0 0.0
223 10 10 10 10 0 10 83.3 4.1
224 0 10 0 10 10 10 66.7 5.2
225 10 10 10 10 0 10 83.3 4.1
226 10 10 0 10 10 10 83.3 4.1
227 10 10 0 0 10 10 66.7 5.2
228 10 0 10 10 0 0 50.0 5.5
229 10 10 10 10 10 10 100.0 0.0
230 10 10 0 10 10 0 66.7 5.2
231 10 10 0 10 10 10 83.3 4.1
232 10 10 0 10 0 10 66.7 5.2
233 10 10 10 10 10 10 100.0 0.0
234 0 10 10 10 0 10 66.7 5.2
235 0 10 10 0 10 10 66.7 5.2
236 10 10 10 10 10 10 100.0 0.0
237 10 10 10 10 10 10 100.0 0.0
238 10 10 10 10 10 10 100.0 0.0
239 0 0 10 10 10 10 66.7 5.2
240 0 0 10 10 10 10 66.7 5.2
241 0 10 10 10 10 10 83.3 4.1
242 0 10 10 10 10 10 83.3 4.1
243 0 10 10 10 10 10 83.3 4.1
244 0 10 10 0 10 10 66.7 5.2
245 10 10 10 10 10 10 100.0 0.0
246 10 0 0 10 10 10 66.7 5.2
247 0 10 10 10 10 10 83.3 4.1
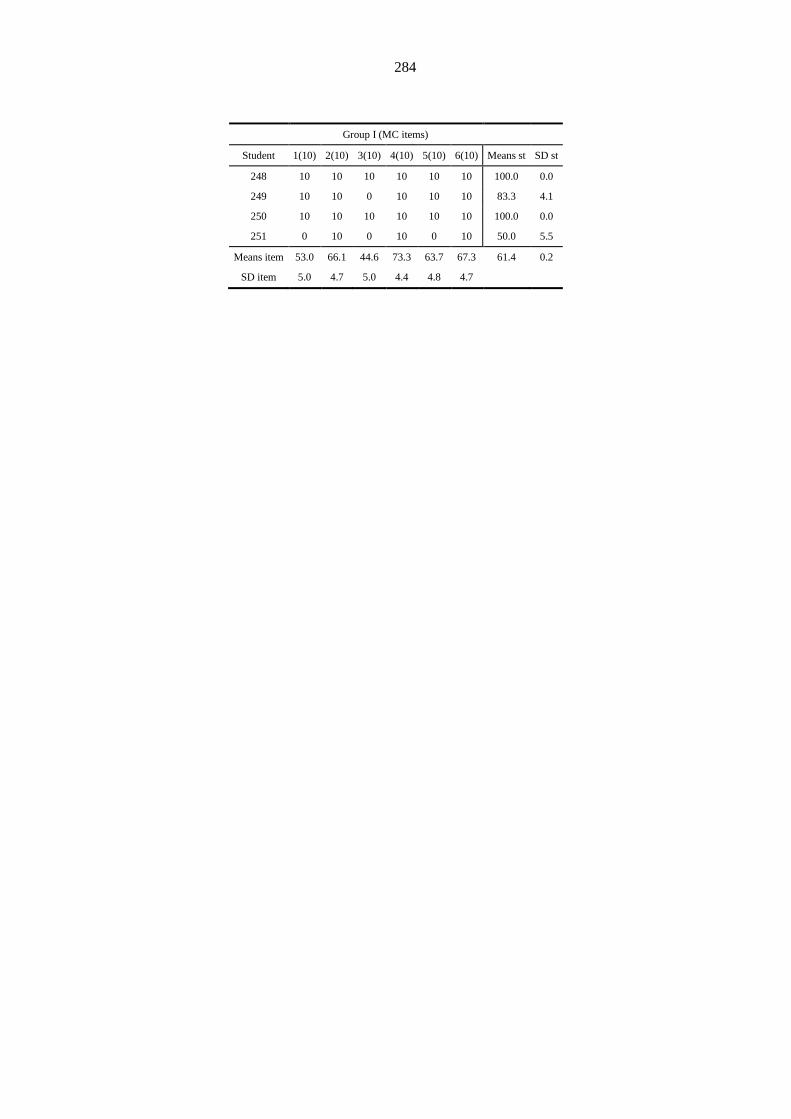
284
Group I (MC items)
Student 1(10) 2(10) 3(10) 4(10) 5(10) 6(10) Means st SD st
248 10 10 10 10 10 10 100.0 0.0
249 10 10 0 10 10 10 83.3 4.1
250 10 10 10 10 10 10 100.0 0.0
251 0 10 0 10 0 10 50.0 5.5
Means item 53.0 66.1 44.6 73.3 63.7 67.3 61.4 0.2
SD item 5.0 4.7 5.0 4.4 4.8 4.7

285
Table 6.47. Data of 251 examinees grades in Group II (CR items), Physics Exam 1st Phase, 2004.
Group II (CR items)
Student 1.1(4) 1.2(11) 1.3(4) 1.4(15) 2.1(6) 2.2(14) 2.3(()) 2.4(6) 3.1(10) 3.2(4) 3.3(6) 3.4(()) 3.5(10) Means st SD st
1 3 11 4 5 6 14 11 4 6 0 0 1 0 65.0 4.6
2 4 11 4 14 3 0 0 0 9 0 6 0 0 53.0 4.9
3 2 11 0 12 5 9 0 4 0 0 0 0 0 43.0 4.6
4 3 2 4 5 3 14 0 0 5 4 0 0 0 40.0 3.8
5 3 11 4 12 5 1 1 5 8 1 0 0 0 51.0 4.2
6 2 11 4 2 5 13 12 2 6 3 0 3 2 65.0 4.3
7 0 11 0 15 6 14 0 2 9 0 0 0 10 67.0 5.9
8 0 11 0 15 4 14 8 4 6 3 6 2 8 81.0 4.9
9 0 6 4 0 5 11 9 4 8 3 5 0 0 55.0 3.7
10 2 7 0 14 5 14 0 6 6 0 0 0 6 60.0 5.0
11 0 2 2 15 5 2 1 2 7 0 3 0 7 46.0 4.2
12 0 0 0 6 5 1 4 2 0 0 0 0 0 18.0 2.2
13 2 2 0 12 5 6 12 3 6 1 0 6 0 56.0 4.2
14 0 5 0 14 2 14 5 2 6 1 0 0 2 51.0 4.9
15 0 10 4 14 6 14 0 0 9 4 0 0 0 61.0 5.4
16 4 11 4 15 4 1 3 2 10 2 0 0 0 56.0 4.8
17 4 2 0 2 5 2 3 0 6 4 3 0 6 37.0 2.1
18 2 2 0 15 4 14 0 0 10 2 6 0 10 65.0 5.5
19 4 8 2 8 5 14 1 4 0 4 0 0 0 50.0 4.2
20 0 2 0 0 5 1 3 0 0 0 0 0 0 11.0 1.6
21 4 8 2 9 5 2 9 3 8 0 0 0 0 50.0 3.6
22 0 11 4 15 4 1 6 0 10 4 6 0 0 61.0 4.8
23 2 7 5 5 2 0 1 0 0 0 0 0 0 22.0 2.4
24 0 0 0 8 5 8 0 3 6 0 6 2 6 44.0 3.2
25 4 8 4 9 6 14 0 0 8 4 6 4 4 71.0 3.8
26 2 3 0 11 6 14 0 0 3 6 1 0 0 46.0 4.6

286
Group II (CR items)
Student 1.1(4) 1.2(11) 1.3(4) 1.4(15) 2.1(6) 2.2(14) 2.3(()) 2.4(6) 3.1(10) 3.2(4) 3.3(6) 3.4(()) 3.5(10) Means st SD st
27 2 3 0 5 5 14 0 3 10 4 6 0 6 58.0 4.1
28 4 11 4 13 6 2 3 2 8 4 6 6 6 75.0 3.3
29 2 11 2 15 6 14 0 0 7 1 6 0 0 64.0 5.5
30 2 2 4 3 4 6 8 0 8 4 6 8 10 65.0 2.9
31 2 11 4 12 3 1 0 3 0 2 3 0 2 43.0 3.9
32 4 5 4 0 4 10 0 2 8 4 6 0 6 53.0 3.1
33 4 10 0 15 5 9 3 1 8 4 6 8 0 73.0 4.4
34 4 11 0 14 4 14 6 3 9 4 6 8 8 91.0 4.2
35 0 0 4 15 5 14 0 1 8 0 3 0 0 50.0 5.4
36 4 3 0 15 4 14 0 0 7 2 6 4 4 63.0 4.8
37 4 11 1 13 5 12 10 0 9 1 1 0 0 67.0 5.1
38 4 2 0 0 5 3 2 1 0 0 0 0 0 17.0 1.8
39 4 11 0 0 6 0 4 1 9 2 0 0 0 37.0 3.8
40 0 0 0 5 5 0 0 6 6 0 0 0 0 22.0 2.7
41 1 5 2 15 5 0 1 2 8 0 0 0 0 39.0 4.4
42 2 2 0 7 5 14 0 2 10 4 6 6 0 58.0 4.2
43 2 0 0 0 5 14 10 3 10 4 6 0 10 64.0 4.8
44 4 10 2 0 5 6 0 0 8 4 4 0 2 45.0 3.2
45 2 9 2 12 6 6 0 6 4 4 6 6 5 68.0 3.1
46 4 9 4 15 4 1 0 4 0 6 0 0 8 55.0 4.5
47 2 10 2 12 5 14 10 0 6 0 6 0 8 75.0 4.8
48 0 2 4 4 5 10 6 0 7 0 3 0 4 45.0 3.1
49 0 9 0 15 6 8 8 3 10 0 6 6 6 77.0 4.4
50 4 9 2 12 6 14 3 0 10 0 6 0 5 71.0 4.6
51 4 10 2 12 6 14 10 3 0 0 6 0 6 73.0 4.7
52 0 6 0 12 6 10 10 3 8 0 6 0 0 61.0 4.5
53 0 9 0 14 6 14 2 0 4 4 6 0 5 64.0 4.9
54 4 5 4 12 6 14 12 6 7 4 6 0 10 90.0 4.0
55 2 7 0 7 4 2 3 0 10 0 6 0 0 41.0 3.4
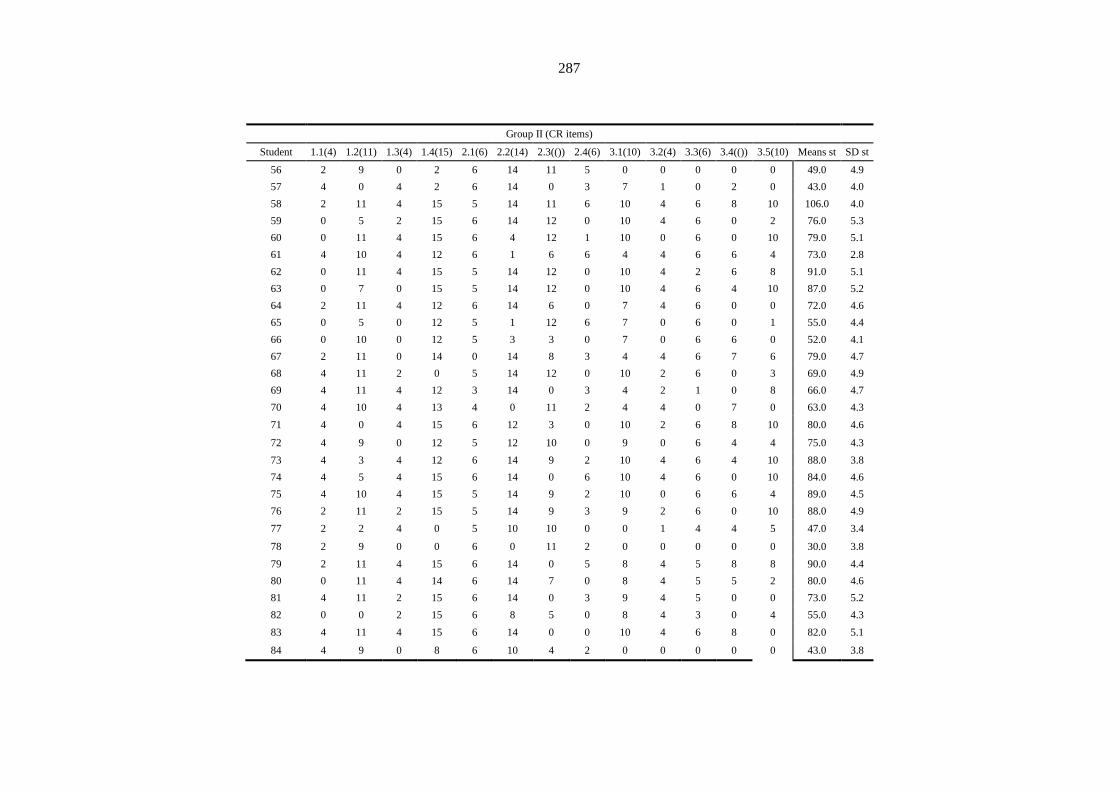
287
Group II (CR items)
Student 1.1(4) 1.2(11) 1.3(4) 1.4(15) 2.1(6) 2.2(14) 2.3(()) 2.4(6) 3.1(10) 3.2(4) 3.3(6) 3.4(()) 3.5(10) Means st SD st
56 2 9 0 2 6 14 11 5 0 0 0 0 0 49.0 4.9
57 4 0 4 2 6 14 0 3 7 1 0 2 0 43.0 4.0
58 2 11 4 15 5 14 11 6 10 4 6 8 10 106.0 4.0
59 0 5 2 15 6 14 12 0 10 4 6 0 2 76.0 5.3
60 0 11 4 15 6 4 12 1 10 0 6 0 10 79.0 5.1
61 4 10 4 12 6 1 6 6 4 4 6 6 4 73.0 2.8
62 0 11 4 15 5 14 12 0 10 4 2 6 8 91.0 5.1
63 0 7 0 15 5 14 12 0 10 4 6 4 10 87.0 5.2
64 2 11 4 12 6 14 6 0 7 4 6 0 0 72.0 4.6
65 0 5 0 12 5 1 12 6 7 0 6 0 1 55.0 4.4
66 0 10 0 12 5 3 3 0 7 0 6 6 0 52.0 4.1
67 2 11 0 14 0 14 8 3 4 4 6 7 6 79.0 4.7
68 4 11 2 0 5 14 12 0 10 2 6 0 3 69.0 4.9
69 4 11 4 12 3 14 0 3 4 2 1 0 8 66.0 4.7
70 4 10 4 13 4 0 11 2 4 4 0 7 0 63.0 4.3
71 4 0 4 15 6 12 3 0 10 2 6 8 10 80.0 4.6
72 4 9 0 12 5 12 10 0 9 0 6 4 4 75.0 4.3
73 4 3 4 12 6 14 9 2 10 4 6 4 10 88.0 3.8
74 4 5 4 15 6 14 0 6 10 4 6 0 10 84.0 4.6
75 4 10 4 15 5 14 9 2 10 0 6 6 4 89.0 4.5
76 2 11 2 15 5 14 9 3 9 2 6 0 10 88.0 4.9
77 2 2 4 0 5 10 10 0 0 1 4 4 5 47.0 3.4
78 2 9 0 0 6 0 11 2 0 0 0 0 0 30.0 3.8
79 2 11 4 15 6 14 0 5 8 4 5 8 8 90.0 4.4
80 0 11 4 14 6 14 7 0 8 4 5 5 2 80.0 4.6
81 4 11 2 15 6 14 0 3 9 4 5 0 0 73.0 5.2
82 0 0 2 15 6 8 5 0 8 4 3 0 4 55.0 4.3
83 4 11 4 15 6 14 0 0 10 4 6 8 0 82.0 5.1
84 4 9 0 8 6 10 4 2 0 0 0 0 0 43.0 3.8
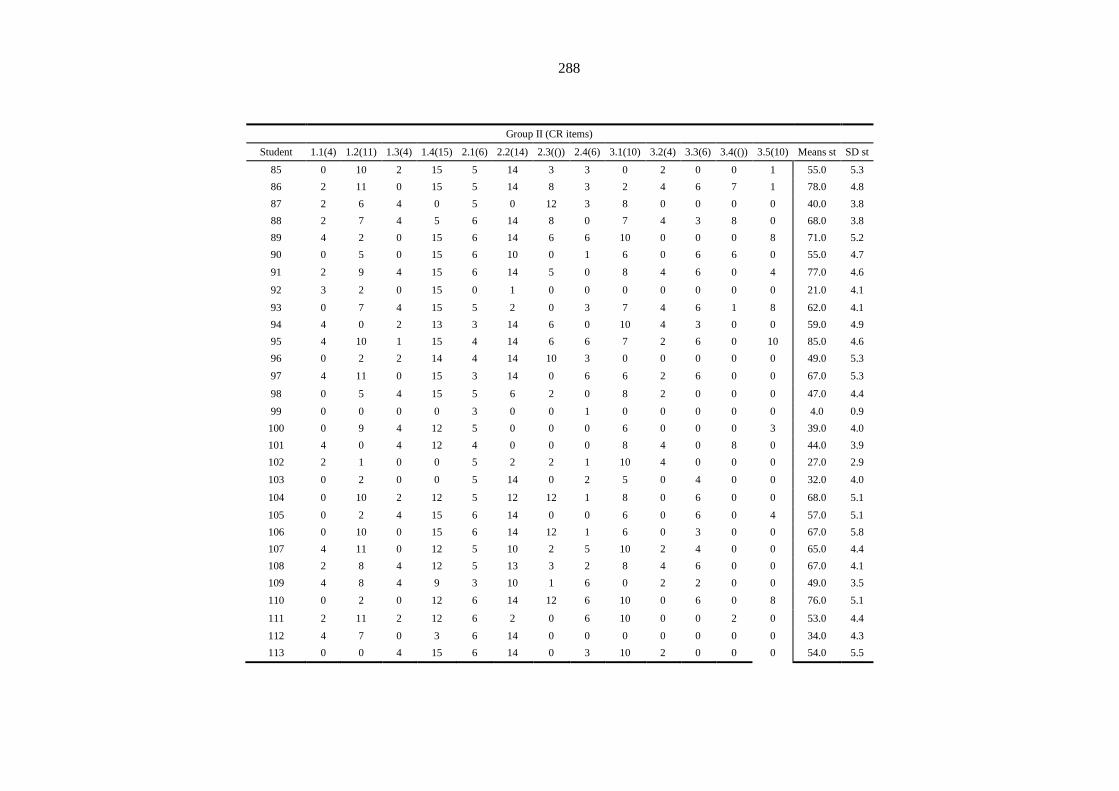
288
Group II (CR items)
Student 1.1(4) 1.2(11) 1.3(4) 1.4(15) 2.1(6) 2.2(14) 2.3(()) 2.4(6) 3.1(10) 3.2(4) 3.3(6) 3.4(()) 3.5(10) Means st SD st
85 0 10 2 15 5 14 3 3 0 2 0 0 1 55.0 5.3
86 2 11 0 15 5 14 8 3 2 4 6 7 1 78.0 4.8
87 2 6 4 0 5 0 12 3 8 0 0 0 0 40.0 3.8
88 2 7 4 5 6 14 8 0 7 4 3 8 0 68.0 3.8
89 4 2 0 15 6 14 6 6 10 0 0 0 8 71.0 5.2
90 0 5 0 15 6 10 0 1 6 0 6 6 0 55.0 4.7
91 2 9 4 15 6 14 5 0 8 4 6 0 4 77.0 4.6
92 3 2 0 15 0 1 0 0 0 0 0 0 0 21.0 4.1
93 0 7 4 15 5 2 0 3 7 4 6 1 8 62.0 4.1
94 4 0 2 13 3 14 6 0 10 4 3 0 0 59.0 4.9
95 4 10 1 15 4 14 6 6 7 2 6 0 10 85.0 4.6
96 0 2 2 14 4 14 10 3 0 0 0 0 0 49.0 5.3
97 4 11 0 15 3 14 0 6 6 2 6 0 0 67.0 5.3
98 0 5 4 15 5 6 2 0 8 2 0 0 0 47.0 4.4
99 0 0 0 0 3 0 0 1 0 0 0 0 0 4.0 0.9
100 0 9 4 12 5 0 0 0 6 0 0 0 3 39.0 4.0
101 4 0 4 12 4 0 0 0 8 4 0 8 0 44.0 3.9
102 2 1 0 0 5 2 2 1 10 4 0 0 0 27.0 2.9
103 0 2 0 0 5 14 0 2 5 0 4 0 0 32.0 4.0
104 0 10 2 12 5 12 12 1 8 0 6 0 0 68.0 5.1
105 0 2 4 15 6 14 0 0 6 0 6 0 4 57.0 5.1
106 0 10 0 15 6 14 12 1 6 0 3 0 0 67.0 5.8
107 4 11 0 12 5 10 2 5 10 2 4 0 0 65.0 4.4
108 2 8 4 12 5 13 3 2 8 4 6 0 0 67.0 4.1
109 4 8 4 9 3 10 1 6 0 2 2 0 0 49.0 3.5
110 0 2 0 12 6 14 12 6 10 0 6 0 8 76.0 5.1
111 2 11 2 12 6 2 0 6 10 0 0 2 0 53.0 4.4
112 4 7 0 3 6 14 0 0 0 0 0 0 0 34.0 4.3
113 0 0 4 15 6 14 0 3 10 2 0 0 0 54.0 5.5
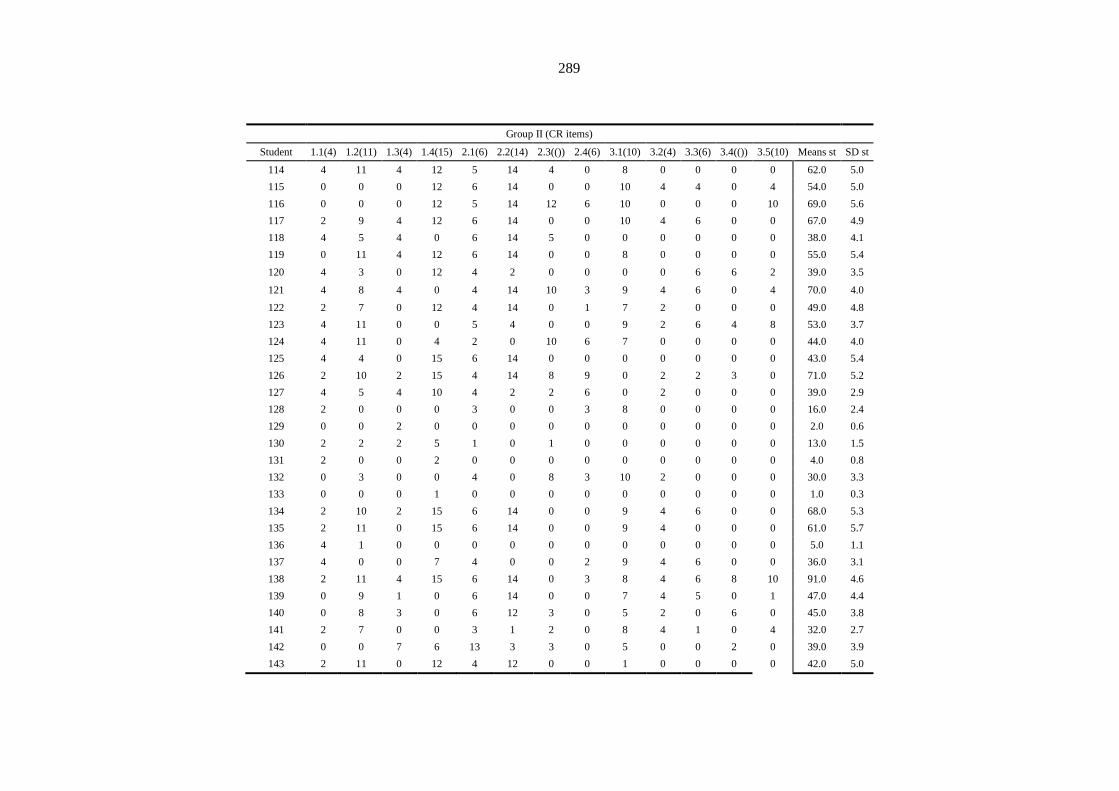
289
Group II (CR items)
Student 1.1(4) 1.2(11) 1.3(4) 1.4(15) 2.1(6) 2.2(14) 2.3(()) 2.4(6) 3.1(10) 3.2(4) 3.3(6) 3.4(()) 3.5(10) Means st SD st
114 4 11 4 12 5 14 4 0 8 0 0 0 0 62.0 5.0
115 0 0 0 12 6 14 0 0 10 4 4 0 4 54.0 5.0
116 0 0 0 12 5 14 12 6 10 0 0 0 10 69.0 5.6
117 2 9 4 12 6 14 0 0 10 4 6 0 0 67.0 4.9
118 4 5 4 0 6 14 5 0 0 0 0 0 0 38.0 4.1
119 0 11 4 12 6 14 0 0 8 0 0 0 0 55.0 5.4
120 4 3 0 12 4 2 0 0 0 0 6 6 2 39.0 3.5
121 4 8 4 0 4 14 10 3 9 4 6 0 4 70.0 4.0
122 2 7 0 12 4 14 0 1 7 2 0 0 0 49.0 4.8
123 4 11 0 0 5 4 0 0 9 2 6 4 8 53.0 3.7
124 4 11 0 4 2 0 10 6 7 0 0 0 0 44.0 4.0
125 4 4 0 15 6 14 0 0 0 0 0 0 0 43.0 5.4
126 2 10 2 15 4 14 8 9 0 2 2 3 0 71.0 5.2
127 4 5 4 10 4 2 2 6 0 2 0 0 0 39.0 2.9
128 2 0 0 0 3 0 0 3 8 0 0 0 0 16.0 2.4
129 0 0 2 0 0 0 0 0 0 0 0 0 0 2.0 0.6
130 2 2 2 5 1 0 1 0 0 0 0 0 0 13.0 1.5
131 2 0 0 2 0 0 0 0 0 0 0 0 0 4.0 0.8
132 0 3 0 0 4 0 8 3 10 2 0 0 0 30.0 3.3
133 0 0 0 1 0 0 0 0 0 0 0 0 0 1.0 0.3
134 2 10 2 15 6 14 0 0 9 4 6 0 0 68.0 5.3
135 2 11 0 15 6 14 0 0 9 4 0 0 0 61.0 5.7
136 4 1 0 0 0 0 0 0 0 0 0 0 0 5.0 1.1
137 4 0 0 7 4 0 0 2 9 4 6 0 0 36.0 3.1
138 2 11 4 15 6 14 0 3 8 4 6 8 10 91.0 4.6
139 0 9 1 0 6 14 0 0 7 4 5 0 1 47.0 4.4
140 0 8 3 0 6 12 3 0 5 2 0 6 0 45.0 3.8
141 2 7 0 0 3 1 2 0 8 4 1 0 4 32.0 2.7
142 0 0 7 6 13 3 3 0 5 0 0 2 0 39.0 3.9
143 2 11 0 12 4 12 0 0 1 0 0 0 0 42.0 5.0
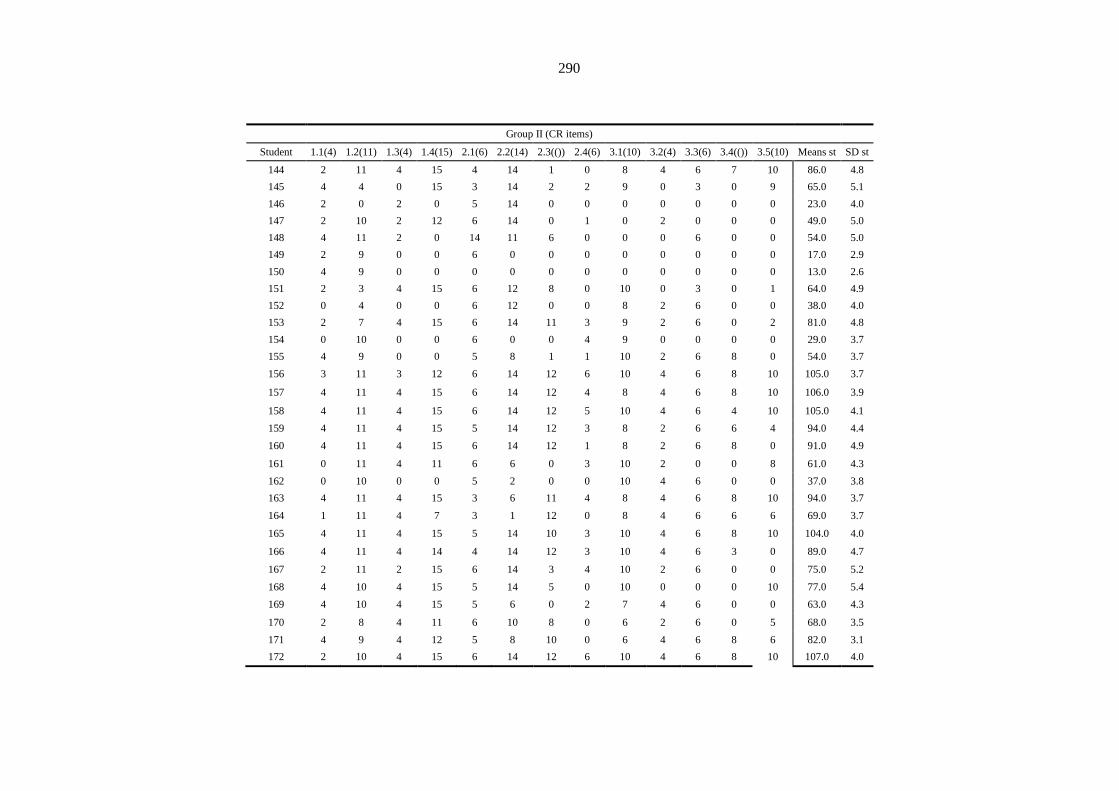
290
Group II (CR items)
Student 1.1(4) 1.2(11) 1.3(4) 1.4(15) 2.1(6) 2.2(14) 2.3(()) 2.4(6) 3.1(10) 3.2(4) 3.3(6) 3.4(()) 3.5(10) Means st SD st
144 2 11 4 15 4 14 1 0 8 4 6 7 10 86.0 4.8
145 4 4 0 15 3 14 2 2 9 0 3 0 9 65.0 5.1
146 2 0 2 0 5 14 0 0 0 0 0 0 0 23.0 4.0
147 2 10 2 12 6 14 0 1 0 2 0 0 0 49.0 5.0
148 4 11 2 0 14 11 6 0 0 0 6 0 0 54.0 5.0
149 2 9 0 0 6 0 0 0 0 0 0 0 0 17.0 2.9
150 4 9 0 0 0 0 0 0 0 0 0 0 0 13.0 2.6
151 2 3 4 15 6 12 8 0 10 0 3 0 1 64.0 4.9
152 0 4 0 0 6 12 0 0 8 2 6 0 0 38.0 4.0
153 2 7 4 15 6 14 11 3 9 2 6 0 2 81.0 4.8
154 0 10 0 0 6 0 0 4 9 0 0 0 0 29.0 3.7
155 4 9 0 0 5 8 1 1 10 2 6 8 0 54.0 3.7
156 3 11 3 12 6 14 12 6 10 4 6 8 10 105.0 3.7
157 4 11 4 15 6 14 12 4 8 4 6 8 10 106.0 3.9
158 4 11 4 15 6 14 12 5 10 4 6 4 10 105.0 4.1
159 4 11 4 15 5 14 12 3 8 2 6 6 4 94.0 4.4
160 4 11 4 15 6 14 12 1 8 2 6 8 0 91.0 4.9
161 0 11 4 11 6 6 0 3 10 2 0 0 8 61.0 4.3
162 0 10 0 0 5 2 0 0 10 4 6 0 0 37.0 3.8
163 4 11 4 15 3 6 11 4 8 4 6 8 10 94.0 3.7
164 1 11 4 7 3 1 12 0 8 4 6 6 6 69.0 3.7
165 4 11 4 15 5 14 10 3 10 4 6 8 10 104.0 4.0
166 4 11 4 14 4 14 12 3 10 4 6 3 0 89.0 4.7
167 2 11 2 15 6 14 3 4 10 2 6 0 0 75.0 5.2
168 4 10 4 15 5 14 5 0 10 0 0 0 10 77.0 5.4
169 4 10 4 15 5 6 0 2 7 4 6 0 0 63.0 4.3
170 2 8 4 11 6 10 8 0 6 2 6 0 5 68.0 3.5
171 4 9 4 12 5 8 10 0 6 4 6 8 6 82.0 3.1
172 2 10 4 15 6 14 12 6 10 4 6 8 10 107.0 4.0

291
Group II (CR items)
Student 1.1(4) 1.2(11) 1.3(4) 1.4(15) 2.1(6) 2.2(14) 2.3(()) 2.4(6) 3.1(10) 3.2(4) 3.3(6) 3.4(()) 3.5(10) Means st SD st
173 2 11 4 12 6 14 3 6 9 4 6 0 10 87.0 4.2
174 2 11 4 15 6 6 11 6 10 4 6 0 4 85.0 4.2
175 2 11 4 15 6 14 12 0 10 4 6 2 10 96.0 4.9
176 4 11 4 15 3 14 11 3 9 4 6 8 10 102.0 4.2
177 4 11 0 4 6 14 11 6 10 4 6 8 0 84.0 4.2
178 4 5 4 9 5 14 12 0 10 4 0 0 0 67.0 4.8
179 2 11 4 14 5 14 8 0 8 4 6 0 8 84.0 4.6
180 4 11 2 12 4 14 12 2 6 4 6 0 8 85.0 4.5
181 4 9 4 15 5 14 6 0 10 4 6 8 10 95.0 4.3
182 4 11 4 12 6 14 4 2 10 4 6 8 8 93.0 3.7
183 4 7 2 15 5 14 3 3 10 2 6 2 0 73.0 4.7
184 4 8 4 14 6 14 0 0 8 0 6 2 8 74.0 4.8
185 4 2 4 14 5 14 8 0 10 0 6 0 9 76.0 4.9
186 4 11 4 15 6 14 0 1 9 4 6 8 10 92.0 4.6
187 2 8 4 12 6 14 9 3 10 4 6 4 10 92.0 3.7
188 2 10 4 15 6 14 12 6 10 4 6 2 1 92.0 4.7
189 4 11 4 15 6 14 3 6 9 4 0 6 8 90.0 4.4
190 0 0 0 15 4 12 3 0 7 4 6 0 0 51.0 5.0
191 4 7 4 15 6 14 12 3 10 0 3 0 8 86.0 5.0
192 4 7 4 15 6 14 2 3 10 4 6 8 10 93.0 4.1
193 4 11 4 15 6 14 10 6 10 2 5 0 8 95.0 4.5
194 4 11 4 15 6 14 10 6 10 4 6 8 10 108.0 3.7
195 0 8 4 15 6 14 8 0 10 2 0 0 0 67.0 5.5
196 4 11 4 15 6 14 12 0 10 4 6 8 10 104.0 4.5
197 4 11 4 15 6 14 12 6 10 2 6 0 0 90.0 5.1
198 4 11 4 15 6 14 0 0 10 4 3 0 8 79.0 5.2
199 4 11 4 15 6 10 10 6 10 2 6 0 8 92.0 4.1
200 2 11 4 15 6 14 8 6 8 3 0 0 0 77.0 5.1
201 4 10 4 15 4 14 6 2 8 2 0 0 0 69.0 5.1
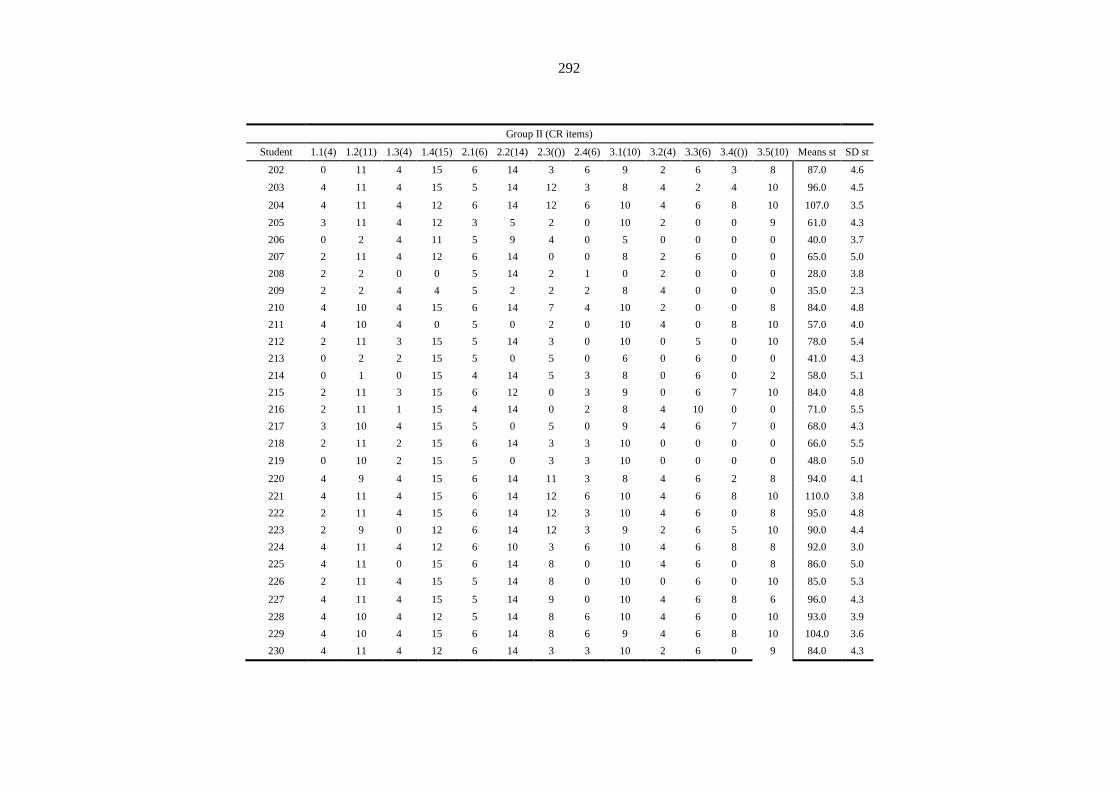
292
Group II (CR items)
Student 1.1(4) 1.2(11) 1.3(4) 1.4(15) 2.1(6) 2.2(14) 2.3(()) 2.4(6) 3.1(10) 3.2(4) 3.3(6) 3.4(()) 3.5(10) Means st SD st
202 0 11 4 15 6 14 3 6 9 2 6 3 8 87.0 4.6
203 4 11 4 15 5 14 12 3 8 4 2 4 10 96.0 4.5
204 4 11 4 12 6 14 12 6 10 4 6 8 10 107.0 3.5
205 3 11 4 12 3 5 2 0 10 2 0 0 9 61.0 4.3
206 0 2 4 11 5 9 4 0 5 0 0 0 0 40.0 3.7
207 2 11 4 12 6 14 0 0 8 2 6 0 0 65.0 5.0
208 2 2 0 0 5 14 2 1 0 2 0 0 0 28.0 3.8
209 2 2 4 4 5 2 2 2 8 4 0 0 0 35.0 2.3
210 4 10 4 15 6 14 7 4 10 2 0 0 8 84.0 4.8
211 4 10 4 0 5 0 2 0 10 4 0 8 10 57.0 4.0
212 2 11 3 15 5 14 3 0 10 0 5 0 10 78.0 5.4
213 0 2 2 15 5 0 5 0 6 0 6 0 0 41.0 4.3
214 0 1 0 15 4 14 5 3 8 0 6 0 2 58.0 5.1
215 2 11 3 15 6 12 0 3 9 0 6 7 10 84.0 4.8
216 2 11 1 15 4 14 0 2 8 4 10 0 0 71.0 5.5
217 3 10 4 15 5 0 5 0 9 4 6 7 0 68.0 4.3
218 2 11 2 15 6 14 3 3 10 0 0 0 0 66.0 5.5
219 0 10 2 15 5 0 3 3 10 0 0 0 0 48.0 5.0
220 4 9 4 15 6 14 11 3 8 4 6 2 8 94.0 4.1
221 4 11 4 15 6 14 12 6 10 4 6 8 10 110.0 3.8
222 2 11 4 15 6 14 12 3 10 4 6 0 8 95.0 4.8
223 2 9 0 12 6 14 12 3 9 2 6 5 10 90.0 4.4
224 4 11 4 12 6 10 3 6 10 4 6 8 8 92.0 3.0
225 4 11 0 15 6 14 8 0 10 4 6 0 8 86.0 5.0
226 2 11 4 15 5 14 8 0 10 0 6 0 10 85.0 5.3
227 4 11 4 15 5 14 9 0 10 4 6 8 6 96.0 4.3
228 4 10 4 12 5 14 8 6 10 4 6 0 10 93.0 3.9
229 4 10 4 15 6 14 8 6 9 4 6 8 10 104.0 3.6
230 4 11 4 12 6 14 3 3 10 2 6 0 9 84.0 4.3
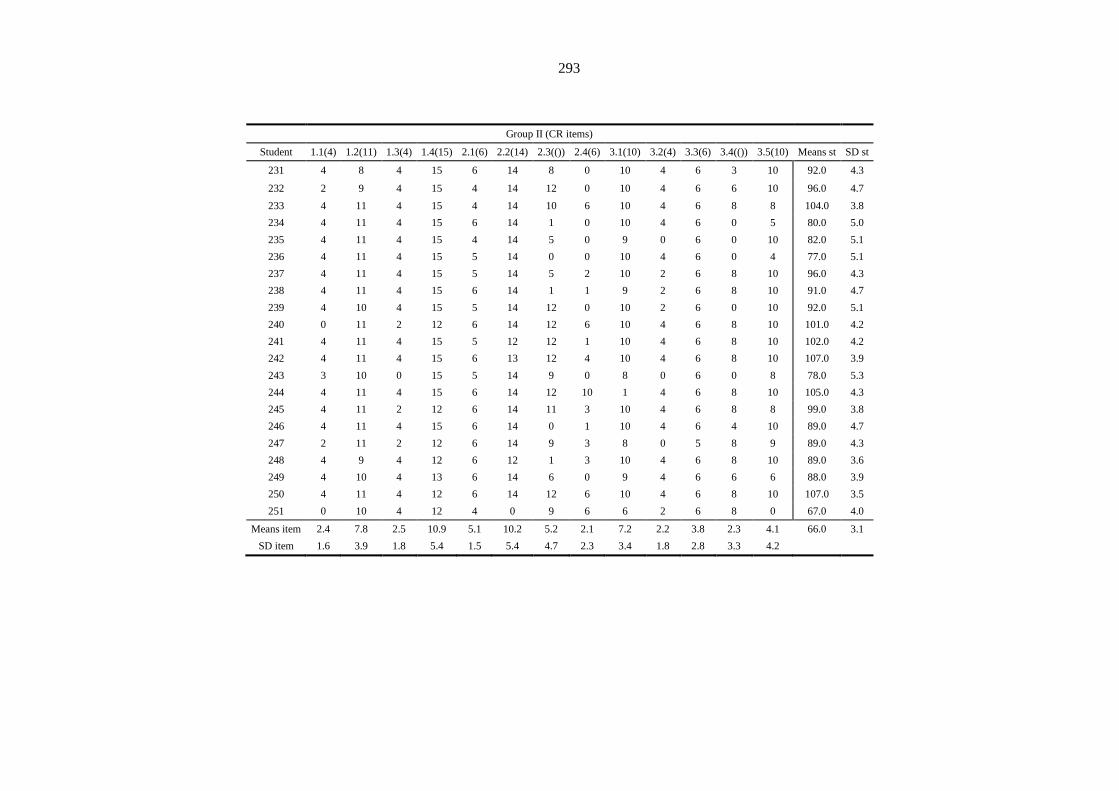
293
Group II (CR items)
Student 1.1(4) 1.2(11) 1.3(4) 1.4(15) 2.1(6) 2.2(14) 2.3(()) 2.4(6) 3.1(10) 3.2(4) 3.3(6) 3.4(()) 3.5(10) Means st SD st
231 4 8 4 15 6 14 8 0 10 4 6 3 10 92.0 4.3
232 2 9 4 15 4 14 12 0 10 4 6 6 10 96.0 4.7
233 4 11 4 15 4 14 10 6 10 4 6 8 8 104.0 3.8
234 4 11 4 15 6 14 1 0 10 4 6 0 5 80.0 5.0
235 4 11 4 15 4 14 5 0 9 0 6 0 10 82.0 5.1
236 4 11 4 15 5 14 0 0 10 4 6 0 4 77.0 5.1
237 4 11 4 15 5 14 5 2 10 2 6 8 10 96.0 4.3
238 4 11 4 15 6 14 1 1 9 2 6 8 10 91.0 4.7
239 4 10 4 15 5 14 12 0 10 2 6 0 10 92.0 5.1
240 0 11 2 12 6 14 12 6 10 4 6 8 10 101.0 4.2
241 4 11 4 15 5 12 12 1 10 4 6 8 10 102.0 4.2
242 4 11 4 15 6 13 12 4 10 4 6 8 10 107.0 3.9
243 3 10 0 15 5 14 9 0 8 0 6 0 8 78.0 5.3
244 4 11 4 15 6 14 12 10 1 4 6 8 10 105.0 4.3
245 4 11 2 12 6 14 11 3 10 4 6 8 8 99.0 3.8
246 4 11 4 15 6 14 0 1 10 4 6 4 10 89.0 4.7
247 2 11 2 12 6 14 9 3 8 0 5 8 9 89.0 4.3
248 4 9 4 12 6 12 1 3 10 4 6 8 10 89.0 3.6
249 4 10 4 13 6 14 6 0 9 4 6 6 6 88.0 3.9
250 4 11 4 12 6 14 12 6 10 4 6 8 10 107.0 3.5
251 0 10 4 12 4 0 9 6 6 2 6 8 0 67.0 4.0
Means item 2.4 7.8 2.5 10.9 5.1 10.2 5.2 2.1 7.2 2.2 3.8 2.3 4.1 66.0 3.1
SD item 1.6 3.9 1.8 5.4 1.5 5.4 4.7 2.3 3.4 1.8 2.8 3.3 4.2
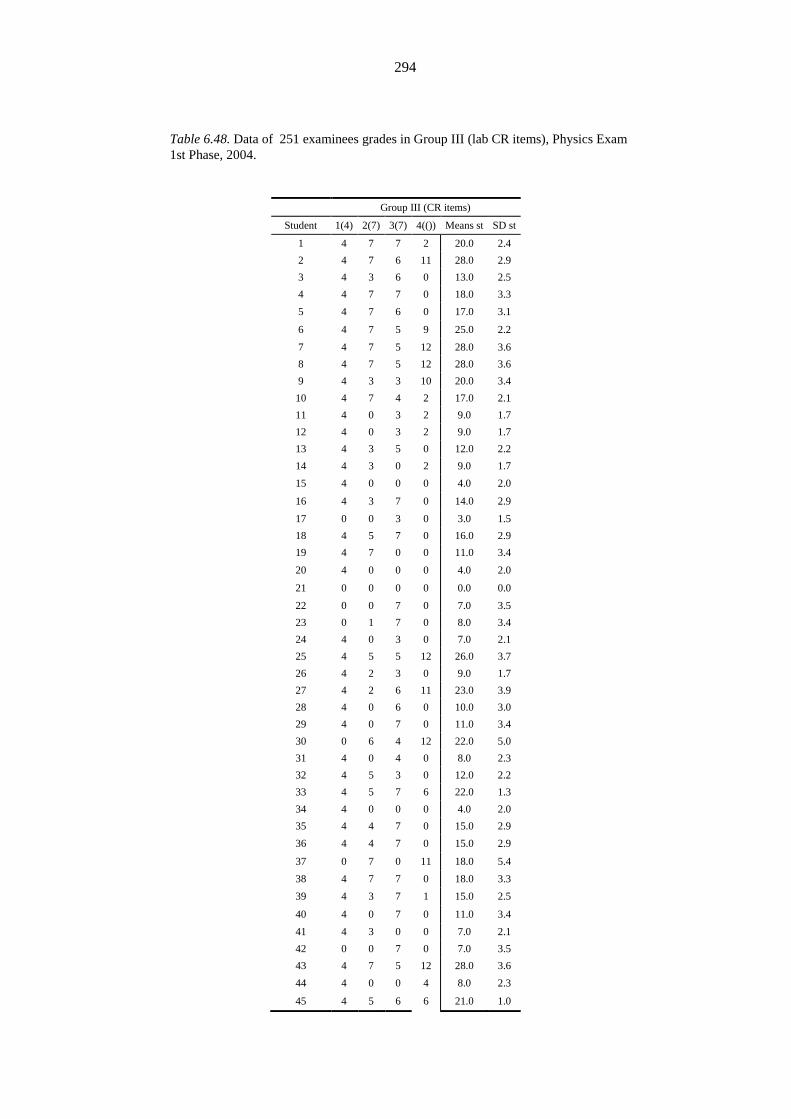
294
Table 6.48. Data of 251 examinees grades in Group III (lab CR items), Physics Exam
1st Phase, 2004.
Group III (CR items)
Student 1(4) 2(7) 3(7) 4(()) Means st SD st
1 4 7 7 2 20.0 2.4
2 4 7 6 11 28.0 2.9
3 4 3 6 0 13.0 2.5
4 4 7 7 0 18.0 3.3
5 4 7 6 0 17.0 3.1
6 4 7 5 9 25.0 2.2
7 4 7 5 12 28.0 3.6
8 4 7 5 12 28.0 3.6
9 4 3 3 10 20.0 3.4
10 4 7 4 2 17.0 2.1
11 4 0 3 2 9.0 1.7
12 4 0 3 2 9.0 1.7
13 4 3 5 0 12.0 2.2
14 4 3 0 2 9.0 1.7
15 4 0 0 0 4.0 2.0
16 4 3 7 0 14.0 2.9
17 0 0 3 0 3.0 1.5
18 4 5 7 0 16.0 2.9
19 4 7 0 0 11.0 3.4
20 4 0 0 0 4.0 2.0
21 0 0 0 0 0.0 0.0
22 0 0 7 0 7.0 3.5
23 0 1 7 0 8.0 3.4
24 4 0 3 0 7.0 2.1
25 4 5 5 12 26.0 3.7
26 4 2 3 0 9.0 1.7
27 4 2 6 11 23.0 3.9
28 4 0 6 0 10.0 3.0
29 4 0 7 0 11.0 3.4
30 0 6 4 12 22.0 5.0
31 4 0 4 0 8.0 2.3
32 4 5 3 0 12.0 2.2
33 4 5 7 6 22.0 1.3
34 4 0 0 0 4.0 2.0
35 4 4 7 0 15.0 2.9
36 4 4 7 0 15.0 2.9
37 0 7 0 11 18.0 5.4
38 4 7 7 0 18.0 3.3
39 4 3 7 1 15.0 2.5
40 4 0 7 0 11.0 3.4
41 4 3 0 0 7.0 2.1
42 0 0 7 0 7.0 3.5
43 4 7 5 12 28.0 3.6
44 4 0 0 4 8.0 2.3
45 4 5 6 6 21.0 1.0
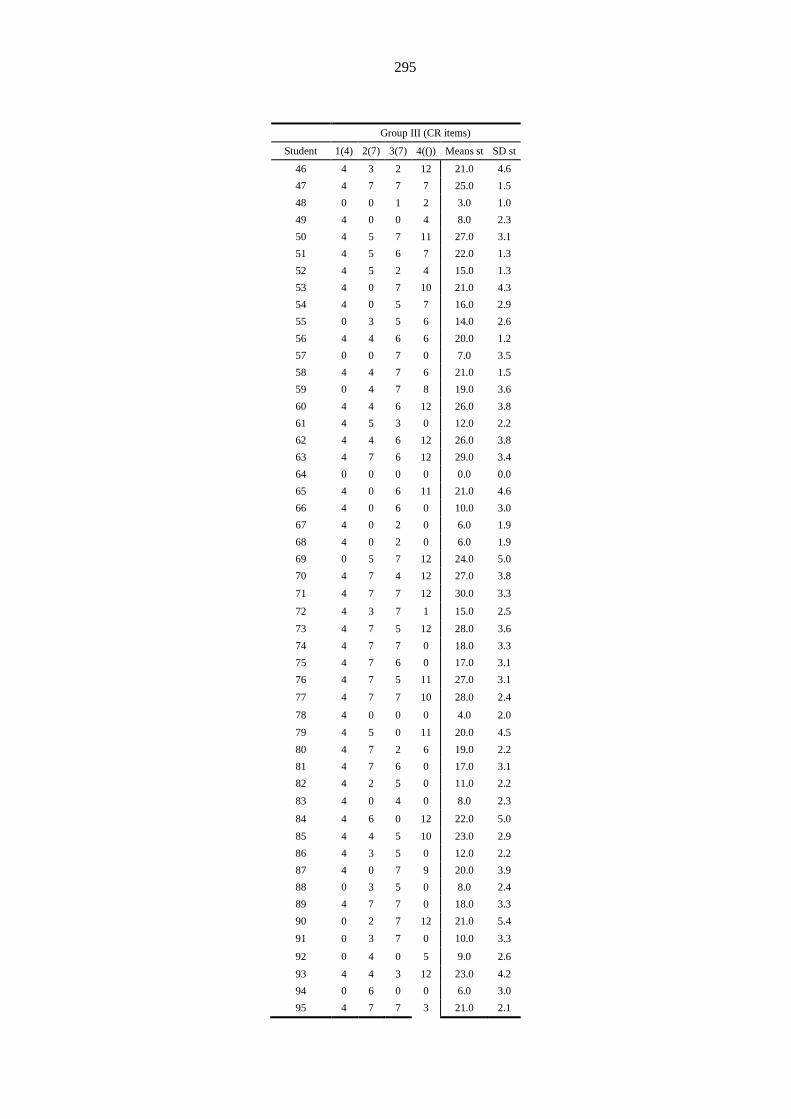
295
Group III (CR items)
Student 1(4) 2(7) 3(7) 4(()) Means st SD st
46 4 3 2 12 21.0 4.6
47 4 7 7 7 25.0 1.5
48 0 0 1 2 3.0 1.0
49 4 0 0 4 8.0 2.3
50 4 5 7 11 27.0 3.1
51 4 5 6 7 22.0 1.3
52 4 5 2 4 15.0 1.3
53 4 0 7 10 21.0 4.3
54 4 0 5 7 16.0 2.9
55 0 3 5 6 14.0 2.6
56 4 4 6 6 20.0 1.2
57 0 0 7 0 7.0 3.5
58 4 4 7 6 21.0 1.5
59 0 4 7 8 19.0 3.6
60 4 4 6 12 26.0 3.8
61 4 5 3 0 12.0 2.2
62 4 4 6 12 26.0 3.8
63 4 7 6 12 29.0 3.4
64 0 0 0 0 0.0 0.0
65 4 0 6 11 21.0 4.6
66 4 0 6 0 10.0 3.0
67 4 0 2 0 6.0 1.9
68 4 0 2 0 6.0 1.9
69 0 5 7 12 24.0 5.0
70 4 7 4 12 27.0 3.8
71 4 7 7 12 30.0 3.3
72 4 3 7 1 15.0 2.5
73 4 7 5 12 28.0 3.6
74 4 7 7 0 18.0 3.3
75 4 7 6 0 17.0 3.1
76 4 7 5 11 27.0 3.1
77 4 7 7 10 28.0 2.4
78 4 0 0 0 4.0 2.0
79 4 5 0 11 20.0 4.5
80 4 7 2 6 19.0 2.2
81 4 7 6 0 17.0 3.1
82 4 2 5 0 11.0 2.2
83 4 0 4 0 8.0 2.3
84 4 6 0 12 22.0 5.0
85 4 4 5 10 23.0 2.9
86 4 3 5 0 12.0 2.2
87 4 0 7 9 20.0 3.9
88 0 3 5 0 8.0 2.4
89 4 7 7 0 18.0 3.3
90 0 2 7 12 21.0 5.4
91 0 3 7 0 10.0 3.3
92 0 4 0 5 9.0 2.6
93 4 4 3 12 23.0 4.2
94 0 6 0 0 6.0 3.0
95 4 7 7 3 21.0 2.1
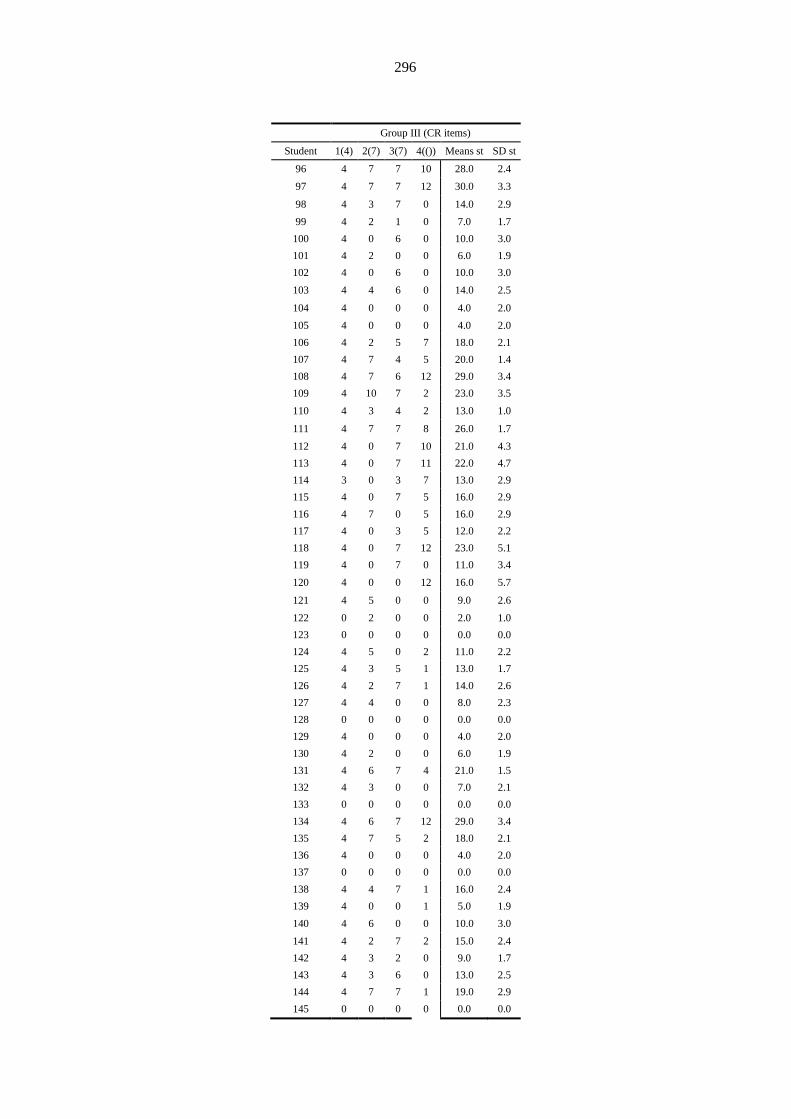
296
Group III (CR items)
Student 1(4) 2(7) 3(7) 4(()) Means st SD st
96 4 7 7 10 28.0 2.4
97 4 7 7 12 30.0 3.3
98 4 3 7 0 14.0 2.9
99 4 2 1 0 7.0 1.7
100 4 0 6 0 10.0 3.0
101 4 2 0 0 6.0 1.9
102 4 0 6 0 10.0 3.0
103 4 4 6 0 14.0 2.5
104 4 0 0 0 4.0 2.0
105 4 0 0 0 4.0 2.0
106 4 2 5 7 18.0 2.1
107 4 7 4 5 20.0 1.4
108 4 7 6 12 29.0 3.4
109 4 10 7 2 23.0 3.5
110 4 3 4 2 13.0 1.0
111 4 7 7 8 26.0 1.7
112 4 0 7 10 21.0 4.3
113 4 0 7 11 22.0 4.7
114 3 0 3 7 13.0 2.9
115 4 0 7 5 16.0 2.9
116 4 7 0 5 16.0 2.9
117 4 0 3 5 12.0 2.2
118 4 0 7 12 23.0 5.1
119 4 0 7 0 11.0 3.4
120 4 0 0 12 16.0 5.7
121 4 5 0 0 9.0 2.6
122 0 2 0 0 2.0 1.0
123 0 0 0 0 0.0 0.0
124 4 5 0 2 11.0 2.2
125 4 3 5 1 13.0 1.7
126 4 2 7 1 14.0 2.6
127 4 4 0 0 8.0 2.3
128 0 0 0 0 0.0 0.0
129 4 0 0 0 4.0 2.0
130 4 2 0 0 6.0 1.9
131 4 6 7 4 21.0 1.5
132 4 3 0 0 7.0 2.1
133 0 0 0 0 0.0 0.0
134 4 6 7 12 29.0 3.4
135 4 7 5 2 18.0 2.1
136 4 0 0 0 4.0 2.0
137 0 0 0 0 0.0 0.0
138 4 4 7 1 16.0 2.4
139 4 0 0 1 5.0 1.9
140 4 6 0 0 10.0 3.0
141 4 2 7 2 15.0 2.4
142 4 3 2 0 9.0 1.7
143 4 3 6 0 13.0 2.5
144 4 7 7 1 19.0 2.9
145 0 0 0 0 0.0 0.0
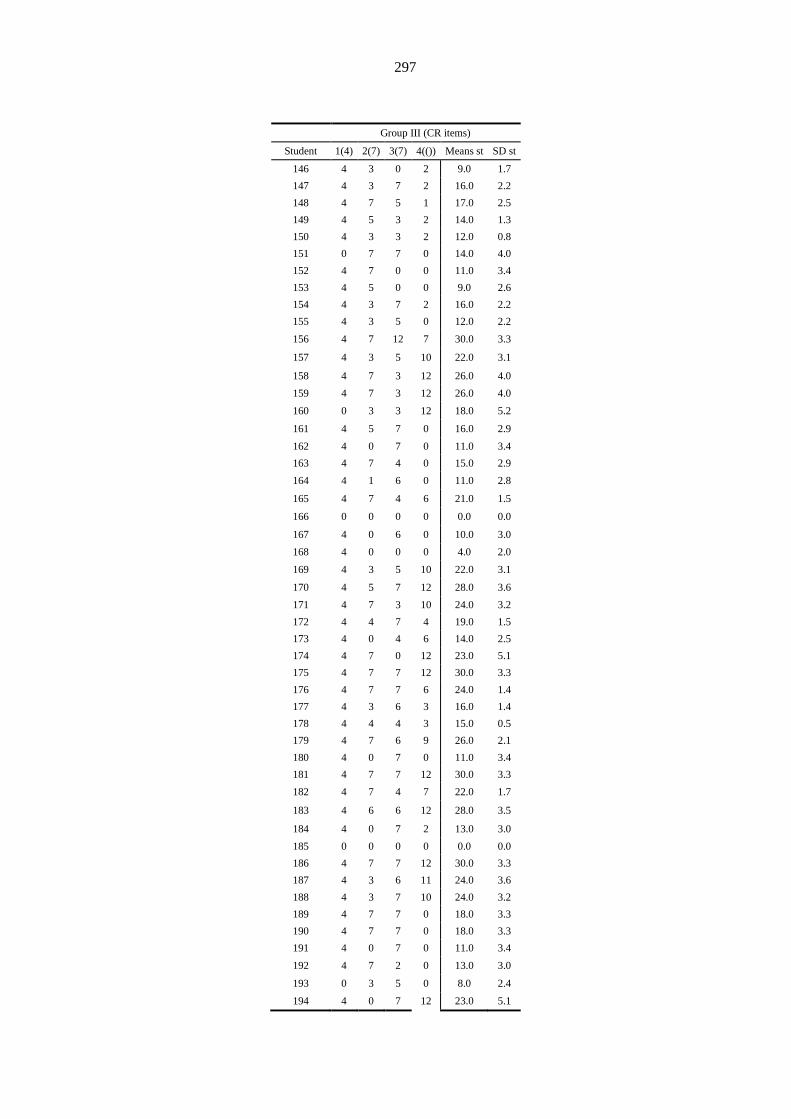
297
Group III (CR items)
Student 1(4) 2(7) 3(7) 4(()) Means st SD st
146 4 3 0 2 9.0 1.7
147 4 3 7 2 16.0 2.2
148 4 7 5 1 17.0 2.5
149 4 5 3 2 14.0 1.3
150 4 3 3 2 12.0 0.8
151 0 7 7 0 14.0 4.0
152 4 7 0 0 11.0 3.4
153 4 5 0 0 9.0 2.6
154 4 3 7 2 16.0 2.2
155 4 3 5 0 12.0 2.2
156 4 7 12 7 30.0 3.3
157 4 3 5 10 22.0 3.1
158 4 7 3 12 26.0 4.0
159 4 7 3 12 26.0 4.0
160 0 3 3 12 18.0 5.2
161 4 5 7 0 16.0 2.9
162 4 0 7 0 11.0 3.4
163 4 7 4 0 15.0 2.9
164 4 1 6 0 11.0 2.8
165 4 7 4 6 21.0 1.5
166 0 0 0 0 0.0 0.0
167 4 0 6 0 10.0 3.0
168 4 0 0 0 4.0 2.0
169 4 3 5 10 22.0 3.1
170 4 5 7 12 28.0 3.6
171 4 7 3 10 24.0 3.2
172 4 4 7 4 19.0 1.5
173 4 0 4 6 14.0 2.5
174 4 7 0 12 23.0 5.1
175 4 7 7 12 30.0 3.3
176 4 7 7 6 24.0 1.4
177 4 3 6 3 16.0 1.4
178 4 4 4 3 15.0 0.5
179 4 7 6 9 26.0 2.1
180 4 0 7 0 11.0 3.4
181 4 7 7 12 30.0 3.3
182 4 7 4 7 22.0 1.7
183 4 6 6 12 28.0 3.5
184 4 0 7 2 13.0 3.0
185 0 0 0 0 0.0 0.0
186 4 7 7 12 30.0 3.3
187 4 3 6 11 24.0 3.6
188 4 3 7 10 24.0 3.2
189 4 7 7 0 18.0 3.3
190 4 7 7 0 18.0 3.3
191 4 0 7 0 11.0 3.4
192 4 7 2 0 13.0 3.0
193 0 3 5 0 8.0 2.4
194 4 0 7 12 23.0 5.1
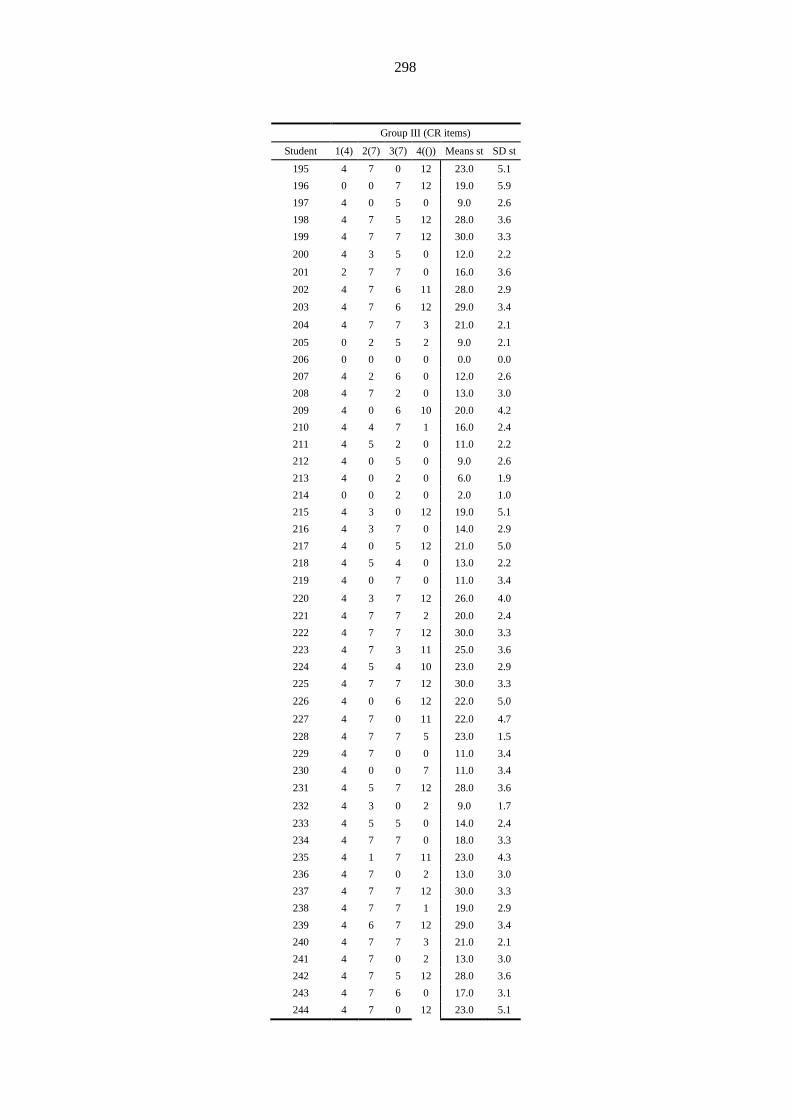
298
Group III (CR items)
Student 1(4) 2(7) 3(7) 4(()) Means st SD st
195 4 7 0 12 23.0 5.1
196 0 0 7 12 19.0 5.9
197 4 0 5 0 9.0 2.6
198 4 7 5 12 28.0 3.6
199 4 7 7 12 30.0 3.3
200 4 3 5 0 12.0 2.2
201 2 7 7 0 16.0 3.6
202 4 7 6 11 28.0 2.9
203 4 7 6 12 29.0 3.4
204 4 7 7 3 21.0 2.1
205 0 2 5 2 9.0 2.1
206 0 0 0 0 0.0 0.0
207 4 2 6 0 12.0 2.6
208 4 7 2 0 13.0 3.0
209 4 0 6 10 20.0 4.2
210 4 4 7 1 16.0 2.4
211 4 5 2 0 11.0 2.2
212 4 0 5 0 9.0 2.6
213 4 0 2 0 6.0 1.9
214 0 0 2 0 2.0 1.0
215 4 3 0 12 19.0 5.1
216 4 3 7 0 14.0 2.9
217 4 0 5 12 21.0 5.0
218 4 5 4 0 13.0 2.2
219 4 0 7 0 11.0 3.4
220 4 3 7 12 26.0 4.0
221 4 7 7 2 20.0 2.4
222 4 7 7 12 30.0 3.3
223 4 7 3 11 25.0 3.6
224 4 5 4 10 23.0 2.9
225 4 7 7 12 30.0 3.3
226 4 0 6 12 22.0 5.0
227 4 7 0 11 22.0 4.7
228 4 7 7 5 23.0 1.5
229 4 7 0 0 11.0 3.4
230 4 0 0 7 11.0 3.4
231 4 5 7 12 28.0 3.6
232 4 3 0 2 9.0 1.7
233 4 5 5 0 14.0 2.4
234 4 7 7 0 18.0 3.3
235 4 1 7 11 23.0 4.3
236 4 7 0 2 13.0 3.0
237 4 7 7 12 30.0 3.3
238 4 7 7 1 19.0 2.9
239 4 6 7 12 29.0 3.4
240 4 7 7 3 21.0 2.1
241 4 7 0 2 13.0 3.0
242 4 7 5 12 28.0 3.6
243 4 7 6 0 17.0 3.1
244 4 7 0 12 23.0 5.1
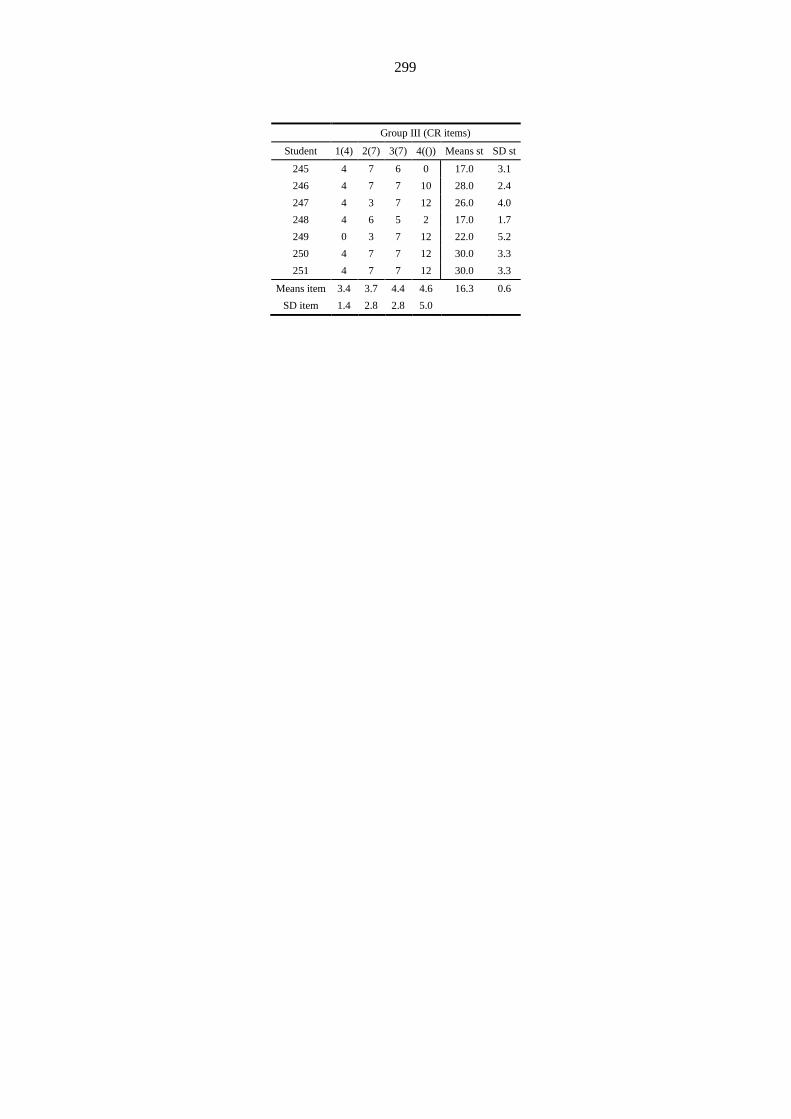
299
Group III (CR items)
Student 1(4) 2(7) 3(7) 4(()) Means st SD st
245 4 7 6 0 17.0 3.1
246 4 7 7 10 28.0 2.4
247 4 3 7 12 26.0 4.0
248 4 6 5 2 17.0 1.7
249 0 3 7 12 22.0 5.2
250 4 7 7 12 30.0 3.3
251 4 7 7 12 30.0 3.3
Means item 3.4 3.7 4.4 4.6 16.3 0.6
SD item 1.4 2.8 2.8 5.0
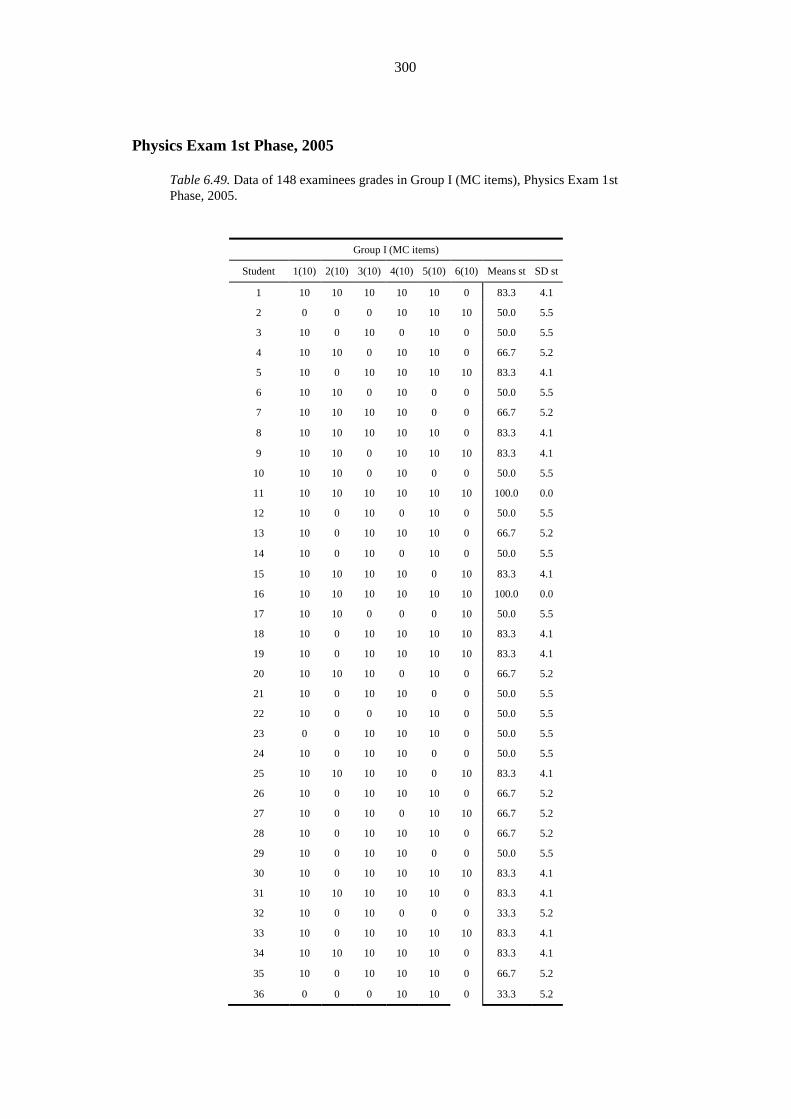
300
Physics Exam 1st Phase, 2005
Table 6.49. Data of 148 examinees grades in Group I (MC items), Physics Exam 1st
Phase, 2005.
Group I (MC items)
Student 1(10) 2(10) 3(10) 4(10) 5(10) 6(10) Means st SD st
1 10 10 10 10 10 0 83.3 4.1
2 0 0 0 10 10 10 50.0 5.5
3 10 0 10 0 10 0 50.0 5.5
4 10 10 0 10 10 0 66.7 5.2
5 10 0 10 10 10 10 83.3 4.1
6 10 10 0 10 0 0 50.0 5.5
7 10 10 10 10 0 0 66.7 5.2
8 10 10 10 10 10 0 83.3 4.1
9 10 10 0 10 10 10 83.3 4.1
10 10 10 0 10 0 0 50.0 5.5
11 10 10 10 10 10 10 100.0 0.0
12 10 0 10 0 10 0 50.0 5.5
13 10 0 10 10 10 0 66.7 5.2
14 10 0 10 0 10 0 50.0 5.5
15 10 10 10 10 0 10 83.3 4.1
16 10 10 10 10 10 10 100.0 0.0
17 10 10 0 0 0 10 50.0 5.5
18 10 0 10 10 10 10 83.3 4.1
19 10 0 10 10 10 10 83.3 4.1
20 10 10 10 0 10 0 66.7 5.2
21 10 0 10 10 0 0 50.0 5.5
22 10 0 0 10 10 0 50.0 5.5
23 0 0 10 10 10 0 50.0 5.5
24 10 0 10 10 0 0 50.0 5.5
25 10 10 10 10 0 10 83.3 4.1
26 10 0 10 10 10 0 66.7 5.2
27 10 0 10 0 10 10 66.7 5.2
28 10 0 10 10 10 0 66.7 5.2
29 10 0 10 10 0 0 50.0 5.5
30 10 0 10 10 10 10 83.3 4.1
31 10 10 10 10 10 0 83.3 4.1
32 10 0 10 0 0 0 33.3 5.2
33 10 0 10 10 10 10 83.3 4.1
34 10 10 10 10 10 0 83.3 4.1
35 10 0 10 10 10 0 66.7 5.2
36 0 0 0 10 10 0 33.3 5.2
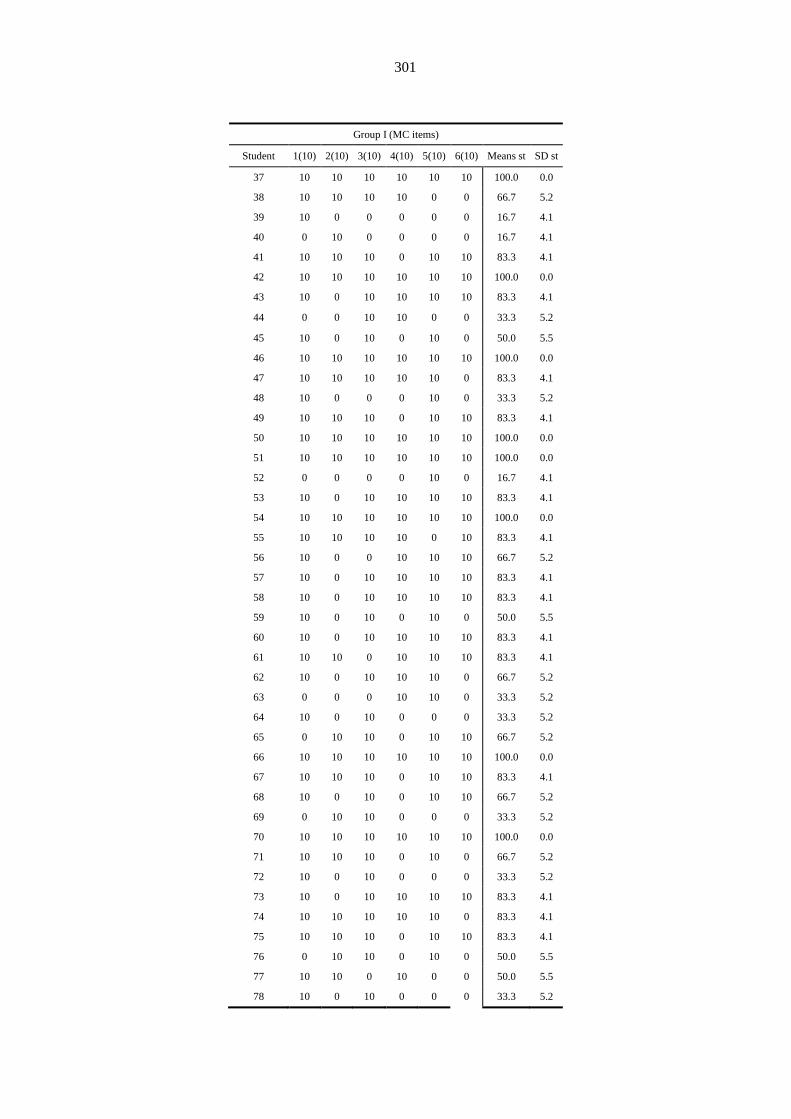
301
Group I (MC items)
Student 1(10) 2(10) 3(10) 4(10) 5(10) 6(10) Means st SD st
37 10 10 10 10 10 10 100.0 0.0
38 10 10 10 10 0 0 66.7 5.2
39 10 0 0 0 0 0 16.7 4.1
40 0 10 0 0 0 0 16.7 4.1
41 10 10 10 0 10 10 83.3 4.1
42 10 10 10 10 10 10 100.0 0.0
43 10 0 10 10 10 10 83.3 4.1
44 0 0 10 10 0 0 33.3 5.2
45 10 0 10 0 10 0 50.0 5.5
46 10 10 10 10 10 10 100.0 0.0
47 10 10 10 10 10 0 83.3 4.1
48 10 0 0 0 10 0 33.3 5.2
49 10 10 10 0 10 10 83.3 4.1
50 10 10 10 10 10 10 100.0 0.0
51 10 10 10 10 10 10 100.0 0.0
52 0 0 0 0 10 0 16.7 4.1
53 10 0 10 10 10 10 83.3 4.1
54 10 10 10 10 10 10 100.0 0.0
55 10 10 10 10 0 10 83.3 4.1
56 10 0 0 10 10 10 66.7 5.2
57 10 0 10 10 10 10 83.3 4.1
58 10 0 10 10 10 10 83.3 4.1
59 10 0 10 0 10 0 50.0 5.5
60 10 0 10 10 10 10 83.3 4.1
61 10 10 0 10 10 10 83.3 4.1
62 10 0 10 10 10 0 66.7 5.2
63 0 0 0 10 10 0 33.3 5.2
64 10 0 10 0 0 0 33.3 5.2
65 0 10 10 0 10 10 66.7 5.2
66 10 10 10 10 10 10 100.0 0.0
67 10 10 10 0 10 10 83.3 4.1
68 10 0 10 0 10 10 66.7 5.2
69 0 10 10 0 0 0 33.3 5.2
70 10 10 10 10 10 10 100.0 0.0
71 10 10 10 0 10 0 66.7 5.2
72 10 0 10 0 0 0 33.3 5.2
73 10 0 10 10 10 10 83.3 4.1
74 10 10 10 10 10 0 83.3 4.1
75 10 10 10 0 10 10 83.3 4.1
76 0 10 10 0 10 0 50.0 5.5
77 10 10 0 10 0 0 50.0 5.5
78 10 0 10 0 0 0 33.3 5.2
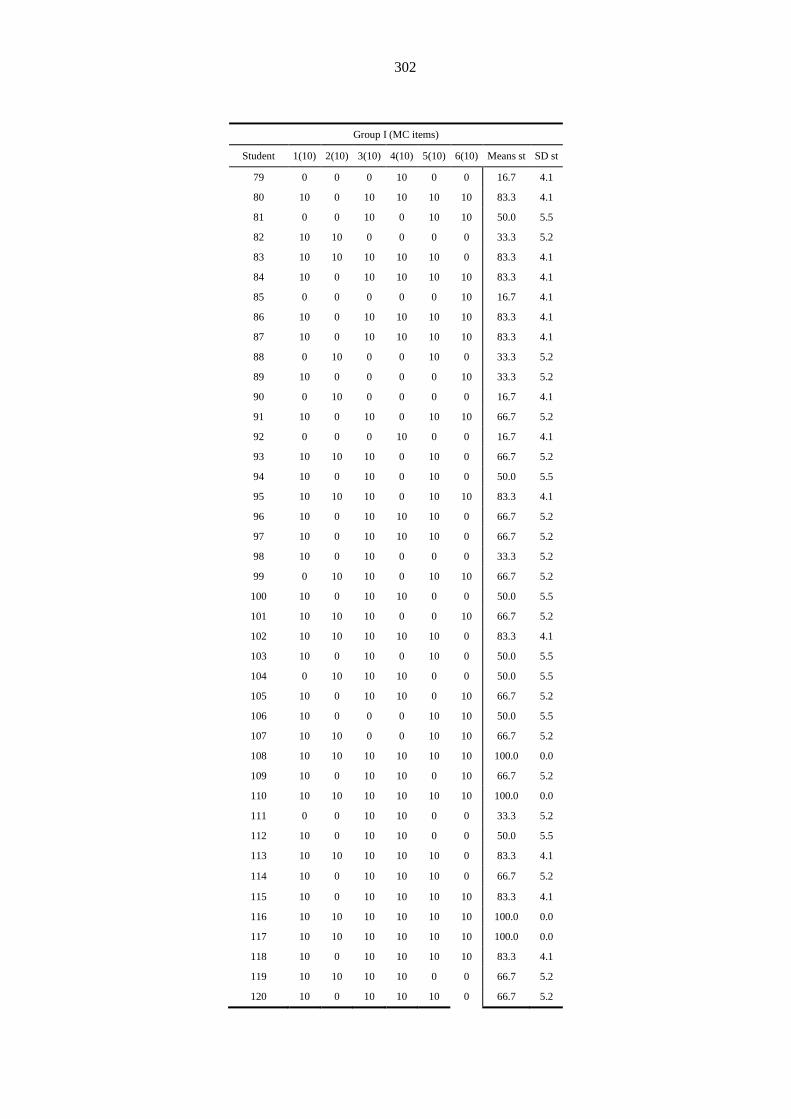
302
Group I (MC items)
Student 1(10) 2(10) 3(10) 4(10) 5(10) 6(10) Means st SD st
79 0 0 0 10 0 0 16.7 4.1
80 10 0 10 10 10 10 83.3 4.1
81 0 0 10 0 10 10 50.0 5.5
82 10 10 0 0 0 0 33.3 5.2
83 10 10 10 10 10 0 83.3 4.1
84 10 0 10 10 10 10 83.3 4.1
85 0 0 0 0 0 10 16.7 4.1
86 10 0 10 10 10 10 83.3 4.1
87 10 0 10 10 10 10 83.3 4.1
88 0 10 0 0 10 0 33.3 5.2
89 10 0 0 0 0 10 33.3 5.2
90 0 10 0 0 0 0 16.7 4.1
91 10 0 10 0 10 10 66.7 5.2
92 0 0 0 10 0 0 16.7 4.1
93 10 10 10 0 10 0 66.7 5.2
94 10 0 10 0 10 0 50.0 5.5
95 10 10 10 0 10 10 83.3 4.1
96 10 0 10 10 10 0 66.7 5.2
97 10 0 10 10 10 0 66.7 5.2
98 10 0 10 0 0 0 33.3 5.2
99 0 10 10 0 10 10 66.7 5.2
100 10 0 10 10 0 0 50.0 5.5
101 10 10 10 0 0 10 66.7 5.2
102 10 10 10 10 10 0 83.3 4.1
103 10 0 10 0 10 0 50.0 5.5
104 0 10 10 10 0 0 50.0 5.5
105 10 0 10 10 0 10 66.7 5.2
106 10 0 0 0 10 10 50.0 5.5
107 10 10 0 0 10 10 66.7 5.2
108 10 10 10 10 10 10 100.0 0.0
109 10 0 10 10 0 10 66.7 5.2
110 10 10 10 10 10 10 100.0 0.0
111 0 0 10 10 0 0 33.3 5.2
112 10 0 10 10 0 0 50.0 5.5
113 10 10 10 10 10 0 83.3 4.1
114 10 0 10 10 10 0 66.7 5.2
115 10 0 10 10 10 10 83.3 4.1
116 10 10 10 10 10 10 100.0 0.0
117 10 10 10 10 10 10 100.0 0.0
118 10 0 10 10 10 10 83.3 4.1
119 10 10 10 10 0 0 66.7 5.2
120 10 0 10 10 10 0 66.7 5.2
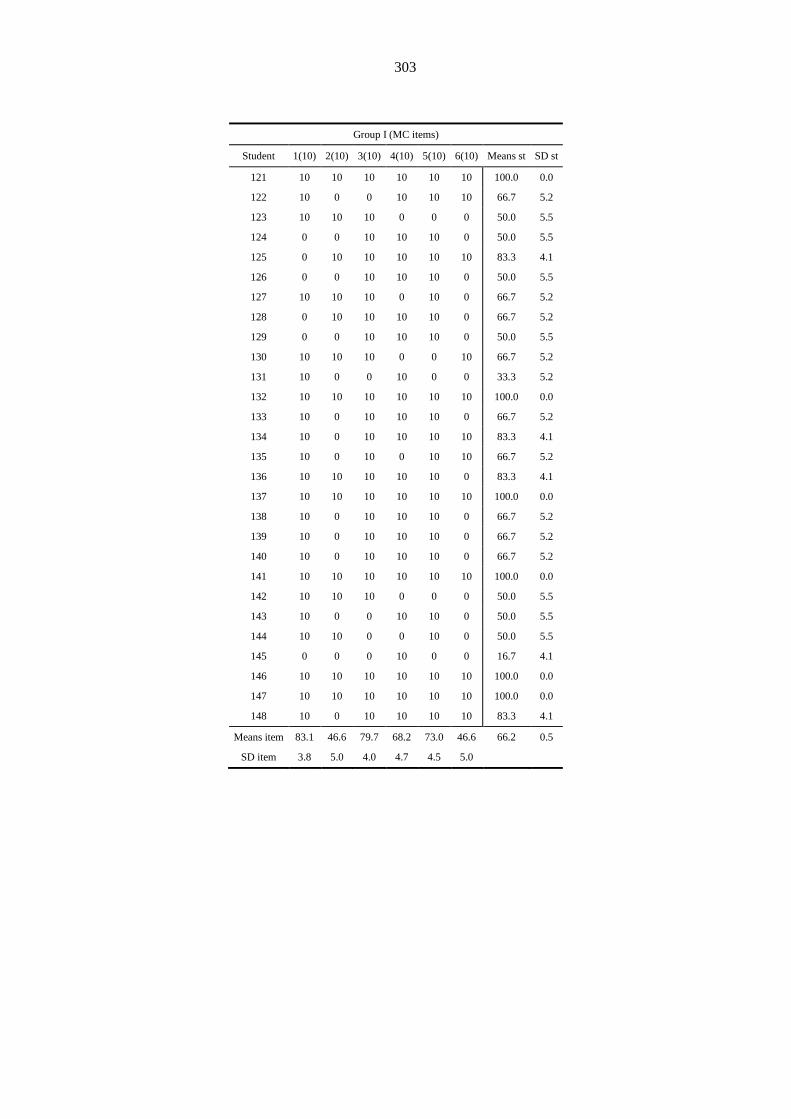
303
Group I (MC items)
Student 1(10) 2(10) 3(10) 4(10) 5(10) 6(10) Means st SD st
121 10 10 10 10 10 10 100.0 0.0
122 10 0 0 10 10 10 66.7 5.2
123 10 10 10 0 0 0 50.0 5.5
124 0 0 10 10 10 0 50.0 5.5
125 0 10 10 10 10 10 83.3 4.1
126 0 0 10 10 10 0 50.0 5.5
127 10 10 10 0 10 0 66.7 5.2
128 0 10 10 10 10 0 66.7 5.2
129 0 0 10 10 10 0 50.0 5.5
130 10 10 10 0 0 10 66.7 5.2
131 10 0 0 10 0 0 33.3 5.2
132 10 10 10 10 10 10 100.0 0.0
133 10 0 10 10 10 0 66.7 5.2
134 10 0 10 10 10 10 83.3 4.1
135 10 0 10 0 10 10 66.7 5.2
136 10 10 10 10 10 0 83.3 4.1
137 10 10 10 10 10 10 100.0 0.0
138 10 0 10 10 10 0 66.7 5.2
139 10 0 10 10 10 0 66.7 5.2
140 10 0 10 10 10 0 66.7 5.2
141 10 10 10 10 10 10 100.0 0.0
142 10 10 10 0 0 0 50.0 5.5
143 10 0 0 10 10 0 50.0 5.5
144 10 10 0 0 10 0 50.0 5.5
145 0 0 0 10 0 0 16.7 4.1
146 10 10 10 10 10 10 100.0 0.0
147 10 10 10 10 10 10 100.0 0.0
148 10 0 10 10 10 10 83.3 4.1
Means item 83.1 46.6 79.7 68.2 73.0 46.6 66.2 0.5
SD item 3.8 5.0 4.0 4.7 4.5 5.0
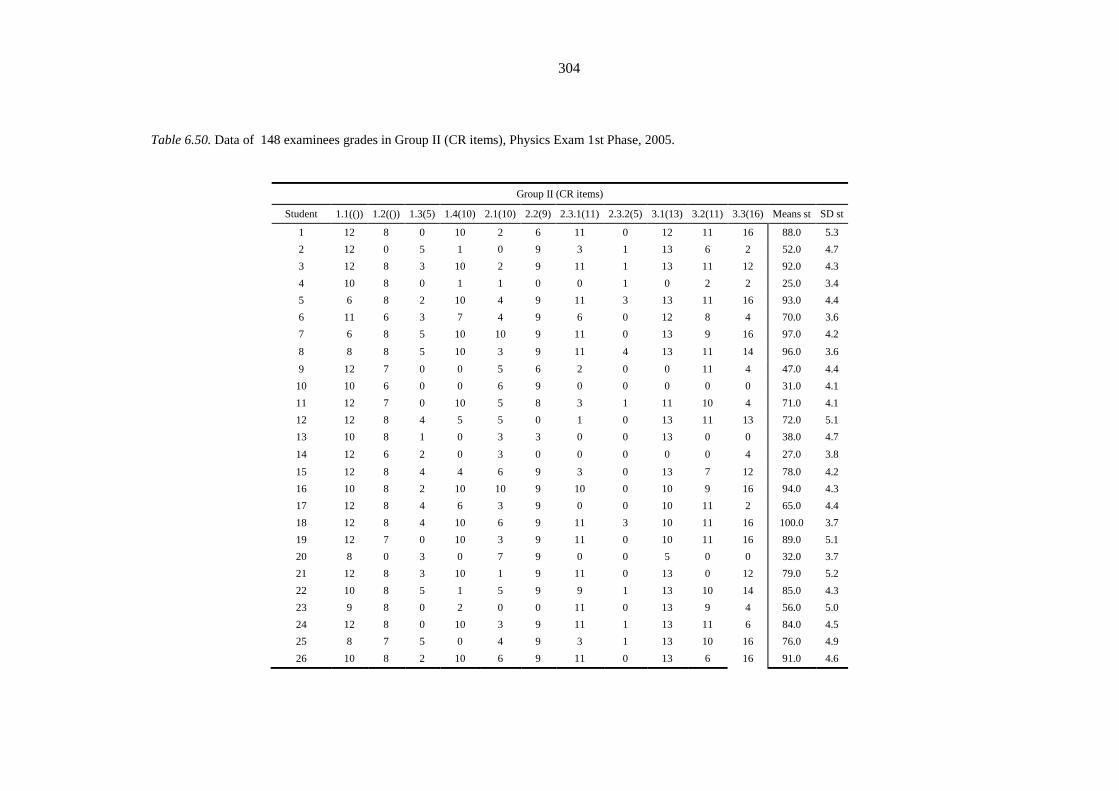
304
Table 6.50. Data of 148 examinees grades in Group II (CR items), Physics Exam 1st Phase, 2005.
Group II (CR items)
Student 1.1(()) 1.2(()) 1.3(5) 1.4(10) 2.1(10) 2.2(9) 2.3.1(11) 2.3.2(5) 3.1(13) 3.2(11) 3.3(16) Means st SD st
1 12 8 0 10 2 6 11 0 12 11 16 88.0 5.3
2 12 0 5 1 0 9 3 1 13 6 2 52.0 4.7
3 12 8 3 10 2 9 11 1 13 11 12 92.0 4.3
4 10 8 0 1 1 0 0 1 0 2 2 25.0 3.4
5 6 8 2 10 4 9 11 3 13 11 16 93.0 4.4
6 11 6 3 7 4 9 6 0 12 8 4 70.0 3.6
7 6 8 5 10 10 9 11 0 13 9 16 97.0 4.2
8 8 8 5 10 3 9 11 4 13 11 14 96.0 3.6
9 12 7 0 0 5 6 2 0 0 11 4 47.0 4.4
10 10 6 0 0 6 9 0 0 0 0 0 31.0 4.1
11 12 7 0 10 5 8 3 1 11 10 4 71.0 4.1
12 12 8 4 5 5 0 1 0 13 11 13 72.0 5.1
13 10 8 1 0 3 3 0 0 13 0 0 38.0 4.7
14 12 6 2 0 3 0 0 0 0 0 4 27.0 3.8
15 12 8 4 4 6 9 3 0 13 7 12 78.0 4.2
16 10 8 2 10 10 9 10 0 10 9 16 94.0 4.3
17 12 8 4 6 3 9 0 0 10 11 2 65.0 4.4
18 12 8 4 10 6 9 11 3 10 11 16 100.0 3.7
19 12 7 0 10 3 9 11 0 10 11 16 89.0 5.1
20 8 0 3 0 7 9 0 0 5 0 0 32.0 3.7
21 12 8 3 10 1 9 11 0 13 0 12 79.0 5.2
22 10 8 5 1 5 9 9 1 13 10 14 85.0 4.3
23 9 8 0 2 0 0 11 0 13 9 4 56.0 5.0
24 12 8 0 10 3 9 11 1 13 11 6 84.0 4.5
25 8 7 5 0 4 9 3 1 13 10 16 76.0 4.9
26 10 8 2 10 6 9 11 0 13 6 16 91.0 4.6
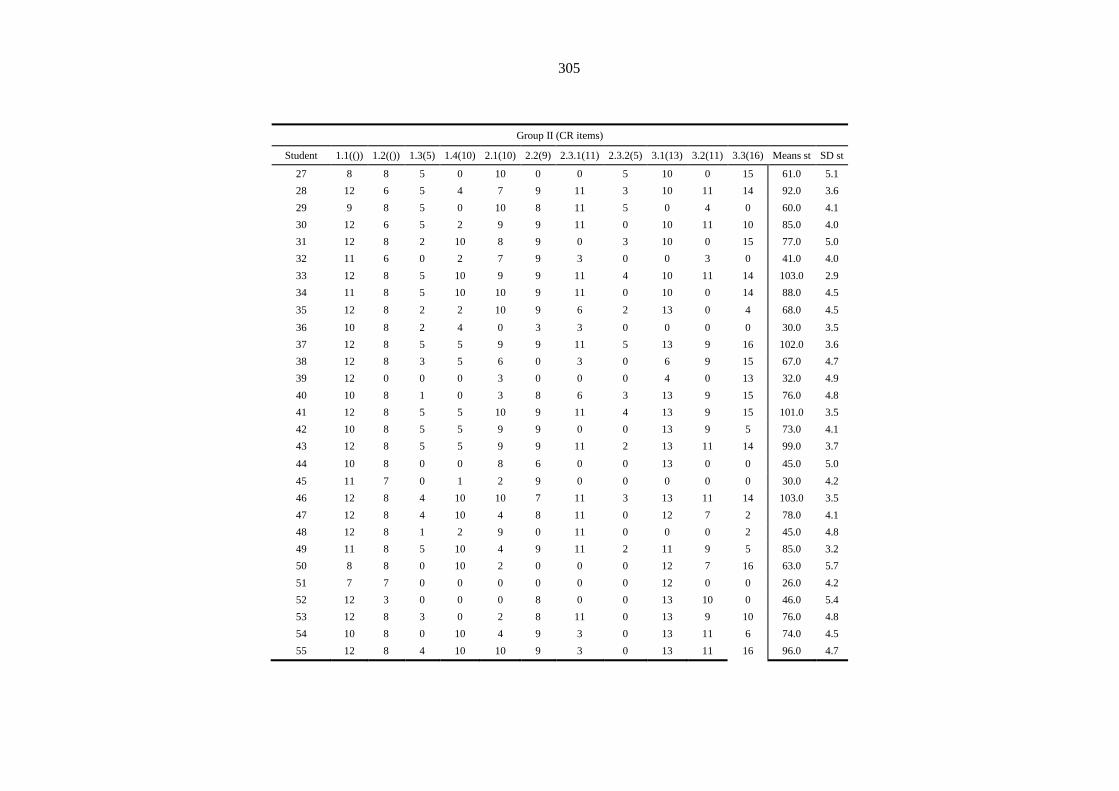
305
Group II (CR items)
Student 1.1(()) 1.2(()) 1.3(5) 1.4(10) 2.1(10) 2.2(9) 2.3.1(11) 2.3.2(5) 3.1(13) 3.2(11) 3.3(16) Means st SD st
27 8 8 5 0 10 0 0 5 10 0 15 61.0 5.1
28 12 6 5 4 7 9 11 3 10 11 14 92.0 3.6
29 9 8 5 0 10 8 11 5 0 4 0 60.0 4.1
30 12 6 5 2 9 9 11 0 10 11 10 85.0 4.0
31 12 8 2 10 8 9 0 3 10 0 15 77.0 5.0
32 11 6 0 2 7 9 3 0 0 3 0 41.0 4.0
33 12 8 5 10 9 9 11 4 10 11 14 103.0 2.9
34 11 8 5 10 10 9 11 0 10 0 14 88.0 4.5
35 12 8 2 2 10 9 6 2 13 0 4 68.0 4.5
36 10 8 2 4 0 3 3 0 0 0 0 30.0 3.5
37 12 8 5 5 9 9 11 5 13 9 16 102.0 3.6
38 12 8 3 5 6 0 3 0 6 9 15 67.0 4.7
39 12 0 0 0 3 0 0 0 4 0 13 32.0 4.9
40 10 8 1 0 3 8 6 3 13 9 15 76.0 4.8
41 12 8 5 5 10 9 11 4 13 9 15 101.0 3.5
42 10 8 5 5 9 9 0 0 13 9 5 73.0 4.1
43 12 8 5 5 9 9 11 2 13 11 14 99.0 3.7
44 10 8 0 0 8 6 0 0 13 0 0 45.0 5.0
45 11 7 0 1 2 9 0 0 0 0 0 30.0 4.2
46 12 8 4 10 10 7 11 3 13 11 14 103.0 3.5
47 12 8 4 10 4 8 11 0 12 7 2 78.0 4.1
48 12 8 1 2 9 0 11 0 0 0 2 45.0 4.8
49 11 8 5 10 4 9 11 2 11 9 5 85.0 3.2
50 8 8 0 10 2 0 0 0 12 7 16 63.0 5.7
51 7 7 0 0 0 0 0 0 12 0 0 26.0 4.2
52 12 3 0 0 0 8 0 0 13 10 0 46.0 5.4
53 12 8 3 0 2 8 11 0 13 9 10 76.0 4.8
54 10 8 0 10 4 9 3 0 13 11 6 74.0 4.5
55 12 8 4 10 10 9 3 0 13 11 16 96.0 4.7

306
Group II (CR items)
Student 1.1(()) 1.2(()) 1.3(5) 1.4(10) 2.1(10) 2.2(9) 2.3.1(11) 2.3.2(5) 3.1(13) 3.2(11) 3.3(16) Means st SD st
56 4 0 5 1 4 0 4 0 13 11 3 45.0 4.3
57 12 8 4 3 8 9 3 5 13 11 16 92.0 4.3
58 12 8 5 10 9 9 11 2 13 11 16 106.0 3.8
59 12 8 3 10 10 9 11 0 13 0 15 91.0 5.1
60 12 8 5 10 10 9 3 5 13 11 16 102.0 3.8
61 6 7 2 10 8 9 0 0 13 11 0 66.0 4.8
62 12 8 5 0 9 9 5 4 13 11 16 92.0 4.6
63 10 0 2 2 4 0 2 0 13 0 0 33.0 4.4
64 12 8 4 10 10 0 11 2 13 9 15 94.0 4.7
65 11 1 1 1 10 9 11 3 0 0 0 47.0 4.8
66 11 8 2 10 8 9 9 0 0 11 14 82.0 4.7
67 11 8 0 4 5 8 6 0 11 10 0 63.0 4.3
68 5 7 4 10 10 9 11 2 11 11 0 80.0 4.0
69 11 8 0 0 3 9 11 3 13 9 6 73.0 4.5
70 12 8 2 10 2 9 0 0 11 10 16 80.0 5.4
71 12 8 0 6 4 9 11 0 11 11 11 83.0 4.5
72 12 2 0 10 3 9 9 0 13 0 16 74.0 5.9
73 10 8 1 10 10 3 0 0 0 0 0 42.0 4.6
74 10 0 4 2 6 8 0 0 13 10 14 67.0 5.3
75 10 0 0 1 6 9 6 0 13 7 8 60.0 4.6
76 9 8 2 2 0 0 0 0 0 0 14 35.0 4.9
77 10 8 2 0 7 0 0 0 10 2 0 39.0 4.3
78 7 4 4 10 4 2 0 0 12 0 4 47.0 4.0
79 6 6 1 0 0 0 0 0 0 0 0 13.0 2.4
80 10 5 5 0 3 0 0 0 13 10 4 50.0 4.7
81 10 8 2 10 0 0 0 0 13 11 0 54.0 5.4
82 12 7 4 0 6 2 0 0 0 0 0 31.0 4.0
83 9 8 3 10 3 9 0 0 13 1 14 70.0 5.1
84 12 8 2 0 10 9 11 5 13 11 16 97.0 4.8
85 6 0 0 10 7 0 11 0 0 1 0 35.0 4.4
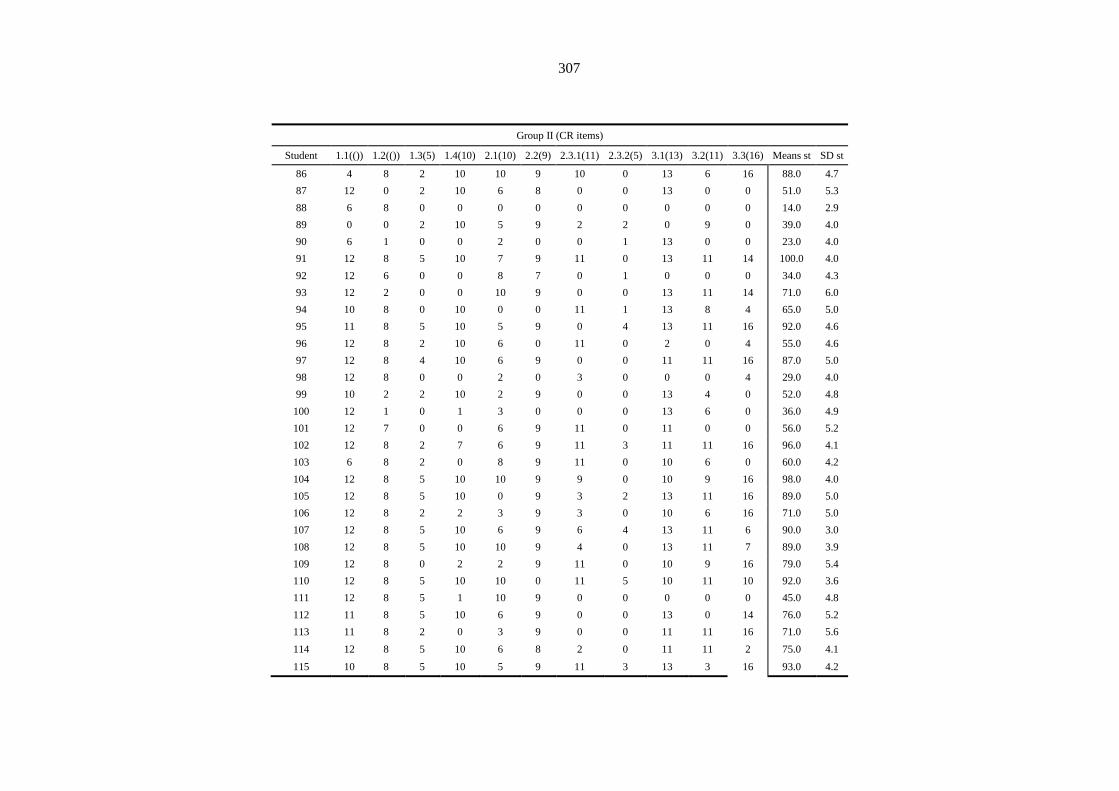
307
Group II (CR items)
Student 1.1(()) 1.2(()) 1.3(5) 1.4(10) 2.1(10) 2.2(9) 2.3.1(11) 2.3.2(5) 3.1(13) 3.2(11) 3.3(16) Means st SD st
86 4 8 2 10 10 9 10 0 13 6 16 88.0 4.7
87 12 0 2 10 6 8 0 0 13 0 0 51.0 5.3
88 6 8 0 0 0 0 0 0 0 0 0 14.0 2.9
89 0 0 2 10 5 9 2 2 0 9 0 39.0 4.0
90 6 1 0 0 2 0 0 1 13 0 0 23.0 4.0
91 12 8 5 10 7 9 11 0 13 11 14 100.0 4.0
92 12 6 0 0 8 7 0 1 0 0 0 34.0 4.3
93 12 2 0 0 10 9 0 0 13 11 14 71.0 6.0
94 10 8 0 10 0 0 11 1 13 8 4 65.0 5.0
95 11 8 5 10 5 9 0 4 13 11 16 92.0 4.6
96 12 8 2 10 6 0 11 0 2 0 4 55.0 4.6
97 12 8 4 10 6 9 0 0 11 11 16 87.0 5.0
98 12 8 0 0 2 0 3 0 0 0 4 29.0 4.0
99 10 2 2 10 2 9 0 0 13 4 0 52.0 4.8
100 12 1 0 1 3 0 0 0 13 6 0 36.0 4.9
101 12 7 0 0 6 9 11 0 11 0 0 56.0 5.2
102 12 8 2 7 6 9 11 3 11 11 16 96.0 4.1
103 6 8 2 0 8 9 11 0 10 6 0 60.0 4.2
104 12 8 5 10 10 9 9 0 10 9 16 98.0 4.0
105 12 8 5 10 0 9 3 2 13 11 16 89.0 5.0
106 12 8 2 2 3 9 3 0 10 6 16 71.0 5.0
107 12 8 5 10 6 9 6 4 13 11 6 90.0 3.0
108 12 8 5 10 10 9 4 0 13 11 7 89.0 3.9
109 12 8 0 2 2 9 11 0 10 9 16 79.0 5.4
110 12 8 5 10 10 0 11 5 10 11 10 92.0 3.6
111 12 8 5 1 10 9 0 0 0 0 0 45.0 4.8
112 11 8 5 10 6 9 0 0 13 0 14 76.0 5.2
113 11 8 2 0 3 9 0 0 11 11 16 71.0 5.6
114 12 8 5 10 6 8 2 0 11 11 2 75.0 4.1
115 10 8 5 10 5 9 11 3 13 3 16 93.0 4.2
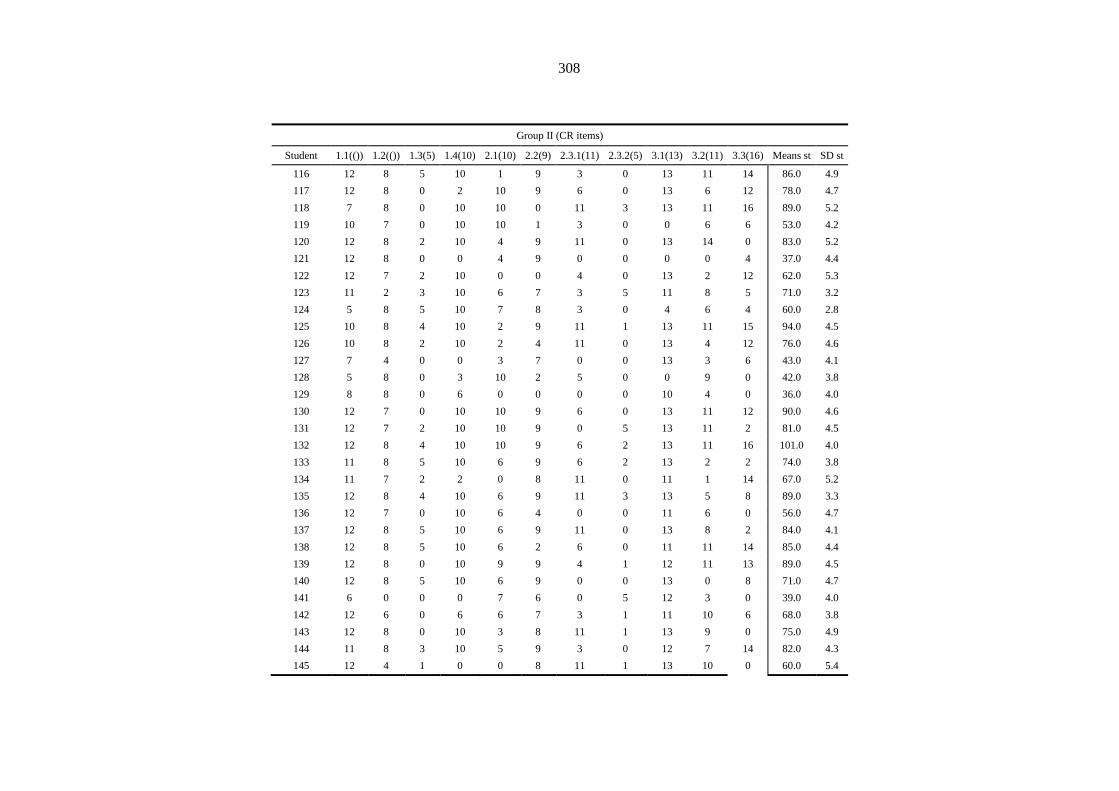
308
Group II (CR items)
Student 1.1(()) 1.2(()) 1.3(5) 1.4(10) 2.1(10) 2.2(9) 2.3.1(11) 2.3.2(5) 3.1(13) 3.2(11) 3.3(16) Means st SD st
116 12 8 5 10 1 9 3 0 13 11 14 86.0 4.9
117 12 8 0 2 10 9 6 0 13 6 12 78.0 4.7
118 7 8 0 10 10 0 11 3 13 11 16 89.0 5.2
119 10 7 0 10 10 1 3 0 0 6 6 53.0 4.2
120 12 8 2 10 4 9 11 0 13 14 0 83.0 5.2
121 12 8 0 0 4 9 0 0 0 0 4 37.0 4.4
122 12 7 2 10 0 0 4 0 13 2 12 62.0 5.3
123 11 2 3 10 6 7 3 5 11 8 5 71.0 3.2
124 5 8 5 10 7 8 3 0 4 6 4 60.0 2.8
125 10 8 4 10 2 9 11 1 13 11 15 94.0 4.5
126 10 8 2 10 2 4 11 0 13 4 12 76.0 4.6
127 7 4 0 0 3 7 0 0 13 3 6 43.0 4.1
128 5 8 0 3 10 2 5 0 0 9 0 42.0 3.8
129 8 8 0 6 0 0 0 0 10 4 0 36.0 4.0
130 12 7 0 10 10 9 6 0 13 11 12 90.0 4.6
131 12 7 2 10 10 9 0 5 13 11 2 81.0 4.5
132 12 8 4 10 10 9 6 2 13 11 16 101.0 4.0
133 11 8 5 10 6 9 6 2 13 2 2 74.0 3.8
134 11 7 2 2 0 8 11 0 11 1 14 67.0 5.2
135 12 8 4 10 6 9 11 3 13 5 8 89.0 3.3
136 12 7 0 10 6 4 0 0 11 6 0 56.0 4.7
137 12 8 5 10 6 9 11 0 13 8 2 84.0 4.1
138 12 8 5 10 6 2 6 0 11 11 14 85.0 4.4
139 12 8 0 10 9 9 4 1 12 11 13 89.0 4.5
140 12 8 5 10 6 9 0 0 13 0 8 71.0 4.7
141 6 0 0 0 7 6 0 5 12 3 0 39.0 4.0
142 12 6 0 6 6 7 3 1 11 10 6 68.0 3.8
143 12 8 0 10 3 8 11 1 13 9 0 75.0 4.9
144 11 8 3 10 5 9 3 0 12 7 14 82.0 4.3
145 12 4 1 0 0 8 11 1 13 10 0 60.0 5.4
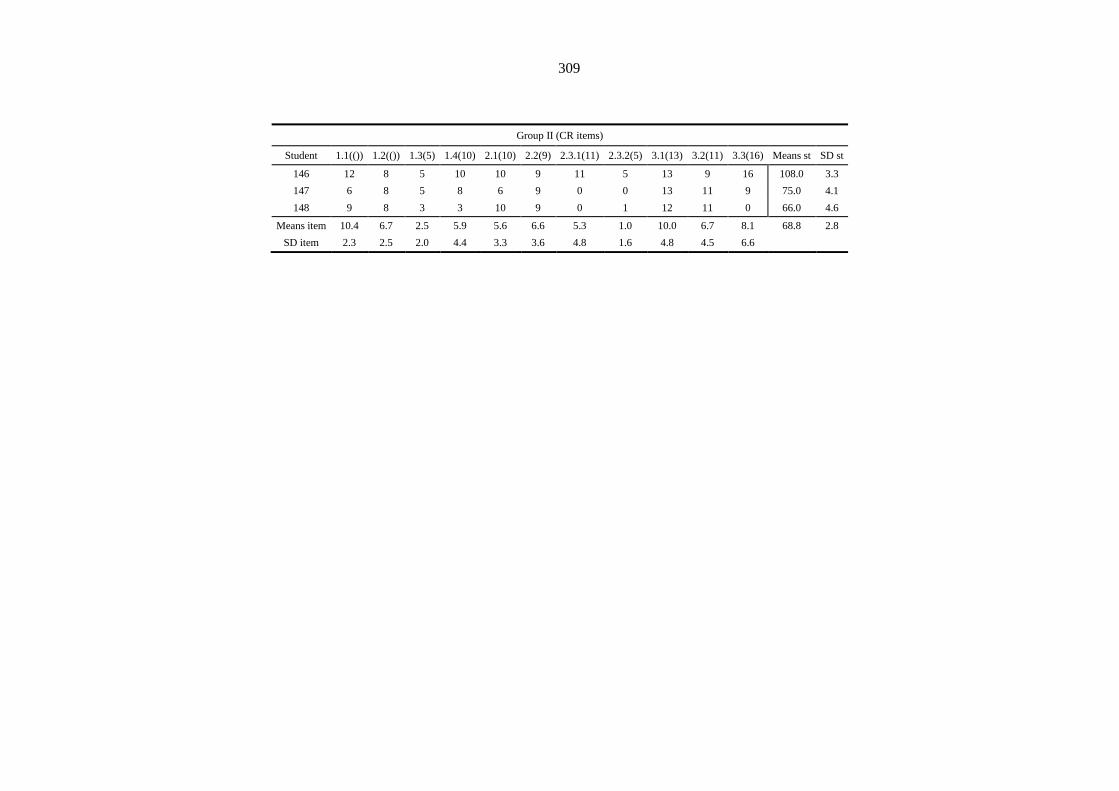
309
Group II (CR items)
Student 1.1(()) 1.2(()) 1.3(5) 1.4(10) 2.1(10) 2.2(9) 2.3.1(11) 2.3.2(5) 3.1(13) 3.2(11) 3.3(16) Means st SD st
146 12 8 5 10 10 9 11 5 13 9 16 108.0 3.3
147 6 8 5 8 6 9 0 0 13 11 9 75.0 4.1
148 9 8 3 3 10 9 0 1 12 11 0 66.0 4.6
Means item 10.4 6.7 2.5 5.9 5.6 6.6 5.3 1.0 10.0 6.7 8.1 68.8 2.8
SD item 2.3 2.5 2.0 4.4 3.3 3.6 4.8 1.6 4.8 4.5 6.6
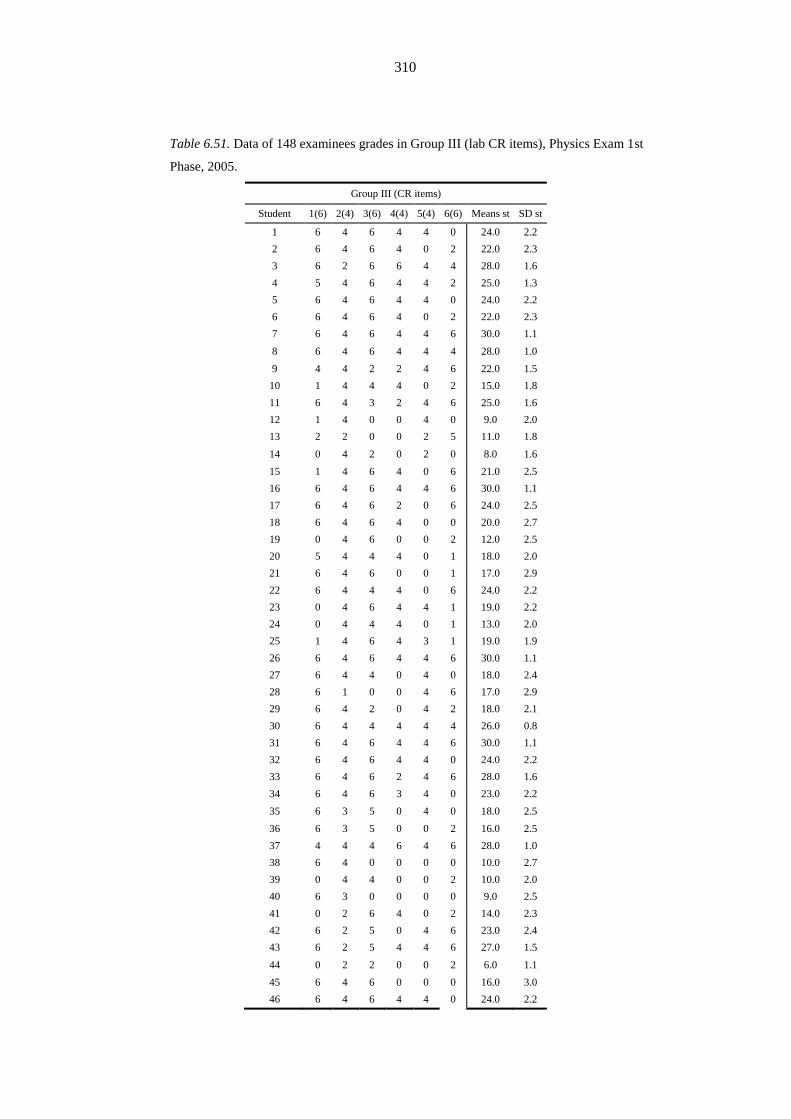
310
Table 6.51. Data of 148 examinees grades in Group III (lab CR items), Physics Exam 1st
Phase, 2005.
Group III (CR items)
Student 1(6) 2(4) 3(6) 4(4) 5(4) 6(6) Means st SD st
1 6 4 6 4 4 0 24.0 2.2
2 6 4 6 4 0 2 22.0 2.3
3 6 2 6 6 4 4 28.0 1.6
4 5 4 6 4 4 2 25.0 1.3
5 6 4 6 4 4 0 24.0 2.2
6 6 4 6 4 0 2 22.0 2.3
7 6 4 6 4 4 6 30.0 1.1
8 6 4 6 4 4 4 28.0 1.0
9 4 4 2 2 4 6 22.0 1.5
10 1 4 4 4 0 2 15.0 1.8
11 6 4 3 2 4 6 25.0 1.6
12 1 4 0 0 4 0 9.0 2.0
13 2 2 0 0 2 5 11.0 1.8
14 0 4 2 0 2 0 8.0 1.6
15 1 4 6 4 0 6 21.0 2.5
16 6 4 6 4 4 6 30.0 1.1
17 6 4 6 2 0 6 24.0 2.5
18 6 4 6 4 0 0 20.0 2.7
19 0 4 6 0 0 2 12.0 2.5
20 5 4 4 4 0 1 18.0 2.0
21 6 4 6 0 0 1 17.0 2.9
22 6 4 4 4 0 6 24.0 2.2
23 0 4 6 4 4 1 19.0 2.2
24 0 4 4 4 0 1 13.0 2.0
25 1 4 6 4 3 1 19.0 1.9
26 6 4 6 4 4 6 30.0 1.1
27 6 4 4 0 4 0 18.0 2.4
28 6 1 0 0 4 6 17.0 2.9
29 6 4 2 0 4 2 18.0 2.1
30 6 4 4 4 4 4 26.0 0.8
31 6 4 6 4 4 6 30.0 1.1
32 6 4 6 4 4 0 24.0 2.2
33 6 4 6 2 4 6 28.0 1.6
34 6 4 6 3 4 0 23.0 2.2
35 6 3 5 0 4 0 18.0 2.5
36 6 3 5 0 0 2 16.0 2.5
37 4 4 4 6 4 6 28.0 1.0
38 6 4 0 0 0 0 10.0 2.7
39 0 4 4 0 0 2 10.0 2.0
40 6 3 0 0 0 0 9.0 2.5
41 0 2 6 4 0 2 14.0 2.3
42 6 2 5 0 4 6 23.0 2.4
43 6 2 5 4 4 6 27.0 1.5
44 0 2 2 0 0 2 6.0 1.1
45 6 4 6 0 0 0 16.0 3.0
46 6 4 6 4 4 0 24.0 2.2
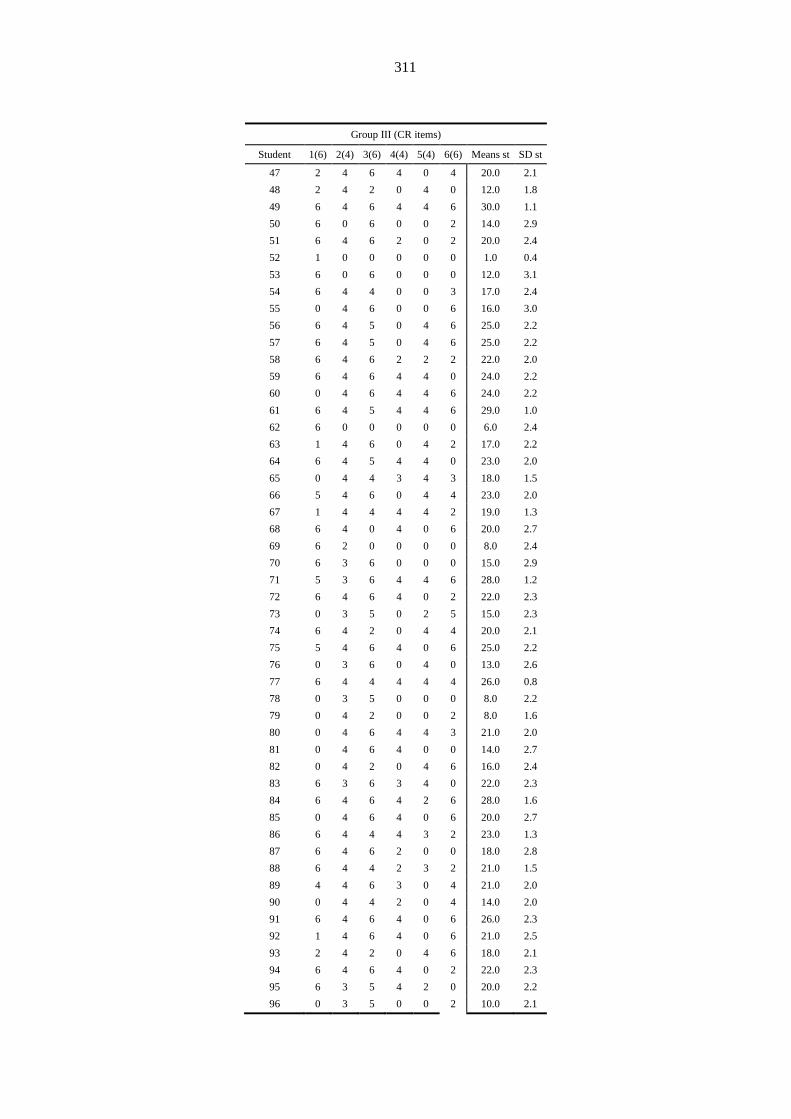
311
Group III (CR items)
Student 1(6) 2(4) 3(6) 4(4) 5(4) 6(6) Means st SD st
47 2 4 6 4 0 4 20.0 2.1
48 2 4 2 0 4 0 12.0 1.8
49 6 4 6 4 4 6 30.0 1.1
50 6 0 6 0 0 2 14.0 2.9
51 6 4 6 2 0 2 20.0 2.4
52 1 0 0 0 0 0 1.0 0.4
53 6 0 6 0 0 0 12.0 3.1
54 6 4 4 0 0 3 17.0 2.4
55 0 4 6 0 0 6 16.0 3.0
56 6 4 5 0 4 6 25.0 2.2
57 6 4 5 0 4 6 25.0 2.2
58 6 4 6 2 2 2 22.0 2.0
59 6 4 6 4 4 0 24.0 2.2
60 0 4 6 4 4 6 24.0 2.2
61 6 4 5 4 4 6 29.0 1.0
62 6 0 0 0 0 0 6.0 2.4
63 1 4 6 0 4 2 17.0 2.2
64 6 4 5 4 4 0 23.0 2.0
65 0 4 4 3 4 3 18.0 1.5
66 5 4 6 0 4 4 23.0 2.0
67 1 4 4 4 4 2 19.0 1.3
68 6 4 0 4 0 6 20.0 2.7
69 6 2 0 0 0 0 8.0 2.4
70 6 3 6 0 0 0 15.0 2.9
71 5 3 6 4 4 6 28.0 1.2
72 6 4 6 4 0 2 22.0 2.3
73 0 3 5 0 2 5 15.0 2.3
74 6 4 2 0 4 4 20.0 2.1
75 5 4 6 4 0 6 25.0 2.2
76 0 3 6 0 4 0 13.0 2.6
77 6 4 4 4 4 4 26.0 0.8
78 0 3 5 0 0 0 8.0 2.2
79 0 4 2 0 0 2 8.0 1.6
80 0 4 6 4 4 3 21.0 2.0
81 0 4 6 4 0 0 14.0 2.7
82 0 4 2 0 4 6 16.0 2.4
83 6 3 6 3 4 0 22.0 2.3
84 6 4 6 4 2 6 28.0 1.6
85 0 4 6 4 0 6 20.0 2.7
86 6 4 4 4 3 2 23.0 1.3
87 6 4 6 2 0 0 18.0 2.8
88 6 4 4 2 3 2 21.0 1.5
89 4 4 6 3 0 4 21.0 2.0
90 0 4 4 2 0 4 14.0 2.0
91 6 4 6 4 0 6 26.0 2.3
92 1 4 6 4 0 6 21.0 2.5
93 2 4 2 0 4 6 18.0 2.1
94 6 4 6 4 0 2 22.0 2.3
95 6 3 5 4 2 0 20.0 2.2
96 0 3 5 0 0 2 10.0 2.1
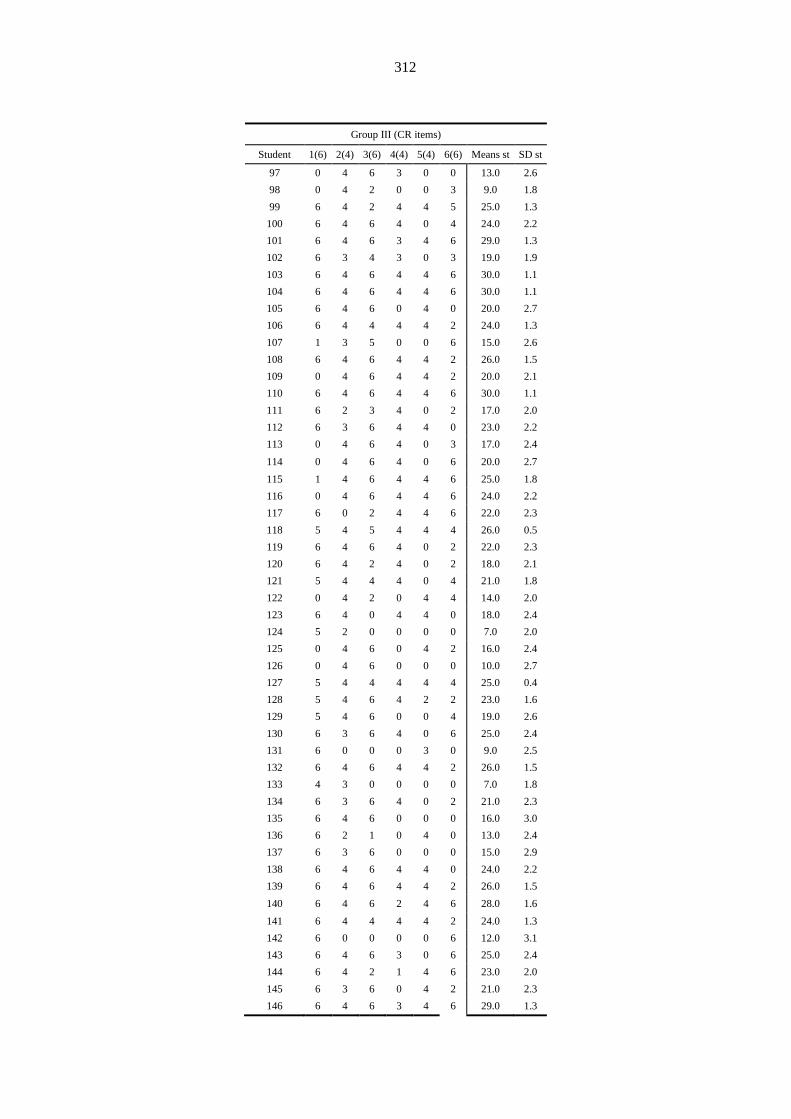
312
Group III (CR items)
Student 1(6) 2(4) 3(6) 4(4) 5(4) 6(6) Means st SD st
97 0 4 6 3 0 0 13.0 2.6
98 0 4 2 0 0 3 9.0 1.8
99 6 4 2 4 4 5 25.0 1.3
100 6 4 6 4 0 4 24.0 2.2
101 6 4 6 3 4 6 29.0 1.3
102 6 3 4 3 0 3 19.0 1.9
103 6 4 6 4 4 6 30.0 1.1
104 6 4 6 4 4 6 30.0 1.1
105 6 4 6 0 4 0 20.0 2.7
106 6 4 4 4 4 2 24.0 1.3
107 1 3 5 0 0 6 15.0 2.6
108 6 4 6 4 4 2 26.0 1.5
109 0 4 6 4 4 2 20.0 2.1
110 6 4 6 4 4 6 30.0 1.1
111 6 2 3 4 0 2 17.0 2.0
112 6 3 6 4 4 0 23.0 2.2
113 0 4 6 4 0 3 17.0 2.4
114 0 4 6 4 0 6 20.0 2.7
115 1 4 6 4 4 6 25.0 1.8
116 0 4 6 4 4 6 24.0 2.2
117 6 0 2 4 4 6 22.0 2.3
118 5 4 5 4 4 4 26.0 0.5
119 6 4 6 4 0 2 22.0 2.3
120 6 4 2 4 0 2 18.0 2.1
121 5 4 4 4 0 4 21.0 1.8
122 0 4 2 0 4 4 14.0 2.0
123 6 4 0 4 4 0 18.0 2.4
124 5 2 0 0 0 0 7.0 2.0
125 0 4 6 0 4 2 16.0 2.4
126 0 4 6 0 0 0 10.0 2.7
127 5 4 4 4 4 4 25.0 0.4
128 5 4 6 4 2 2 23.0 1.6
129 5 4 6 0 0 4 19.0 2.6
130 6 3 6 4 0 6 25.0 2.4
131 6 0 0 0 3 0 9.0 2.5
132 6 4 6 4 4 2 26.0 1.5
133 4 3 0 0 0 0 7.0 1.8
134 6 3 6 4 0 2 21.0 2.3
135 6 4 6 0 0 0 16.0 3.0
136 6 2 1 0 4 0 13.0 2.4
137 6 3 6 0 0 0 15.0 2.9
138 6 4 6 4 4 0 24.0 2.2
139 6 4 6 4 4 2 26.0 1.5
140 6 4 6 2 4 6 28.0 1.6
141 6 4 4 4 4 2 24.0 1.3
142 6 0 0 0 0 6 12.0 3.1
143 6 4 6 3 0 6 25.0 2.4
144 6 4 2 1 4 6 23.0 2.0
145 6 3 6 0 4 2 21.0 2.3
146 6 4 6 3 4 6 29.0 1.3

313
Group III (CR items)
Student 1(6) 2(4) 3(6) 4(4) 5(4) 6(6) Means st SD st
147 6 4 5 3 0 2 20.0 2.2
148 6 4 6 4 4 2 26.0 1.5
Means item 4.3 3.5 4.6 2.4 2.1 2.9 19.8 1.0
SD item 2.5 1.0 2.0 1.9 1.9 2.4
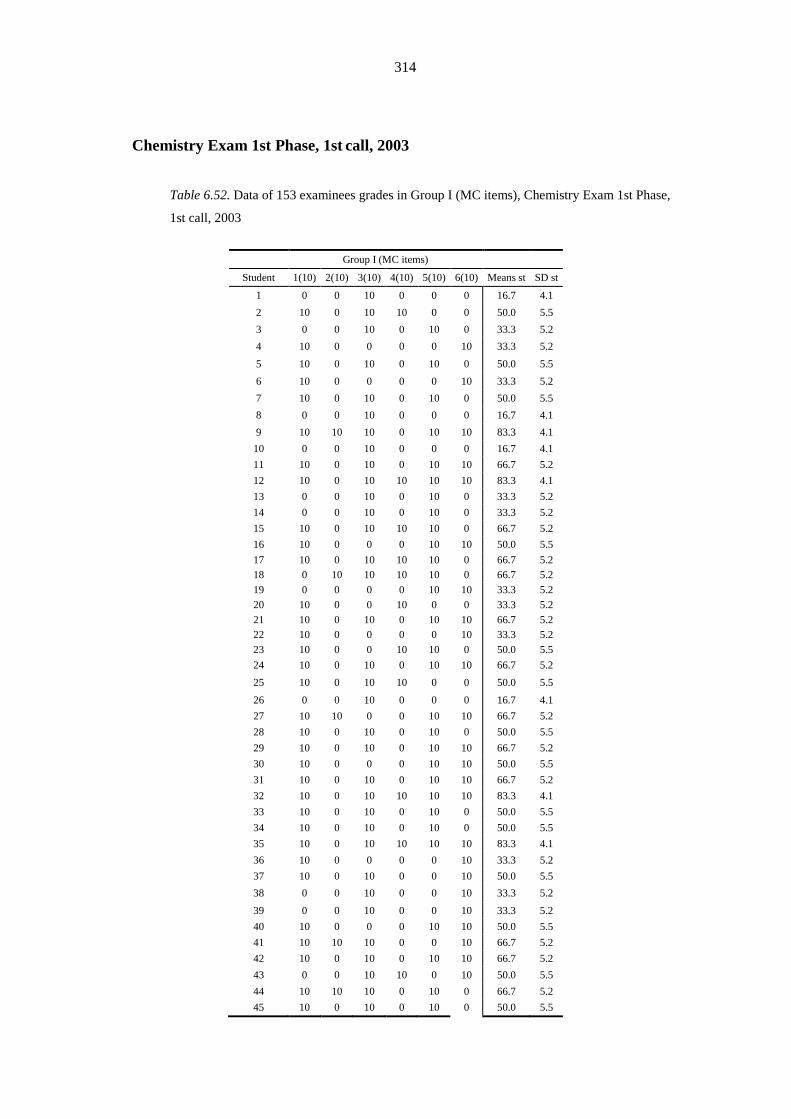
314
Chemistry Exam 1st Phase, 1st call, 2003
Table 6.52. Data of 153 examinees grades in Group I (MC items), Chemistry Exam 1st Phase,
1st call, 2003
Group I (MC items)
Student 1(10) 2(10) 3(10) 4(10) 5(10) 6(10) Means st SD st
1 0 0 10 0 0 0 16.7 4.1
2 10 0 10 10 0 0 50.0 5.5
3 0 0 10 0 10 0 33.3 5.2
4 10 0 0 0 0 10 33.3 5.2
5 10 0 10 0 10 0 50.0 5.5
6 10 0 0 0 0 10 33.3 5.2
7 10 0 10 0 10 0 50.0 5.5
8 0 0 10 0 0 0 16.7 4.1
9 10 10 10 0 10 10 83.3 4.1
10 0 0 10 0 0 0 16.7 4.1
11 10 0 10 0 10 10 66.7 5.2
12 10 0 10 10 10 10 83.3 4.1
13 0 0 10 0 10 0 33.3 5.2
14 0 0 10 0 10 0 33.3 5.2
15 10 0 10 10 10 0 66.7 5.2
16 10 0 0 0 10 10 50.0 5.5
17 10 0 10 10 10 0 66.7 5.2
18 0 10 10 10 10 0 66.7 5.2
19 0 0 0 0 10 10 33.3 5.2
20 10 0 0 10 0 0 33.3 5.2
21 10 0 10 0 10 10 66.7 5.2
22 10 0 0 0 0 10 33.3 5.2
23 10 0 0 10 10 0 50.0 5.5
24 10 0 10 0 10 10 66.7 5.2
25 10 0 10 10 0 0 50.0 5.5
26 0 0 10 0 0 0 16.7 4.1
27 10 10 0 0 10 10 66.7 5.2
28 10 0 10 0 10 0 50.0 5.5
29 10 0 10 0 10 10 66.7 5.2
30 10 0 0 0 10 10 50.0 5.5
31 10 0 10 0 10 10 66.7 5.2
32 10 0 10 10 10 10 83.3 4.1
33 10 0 10 0 10 0 50.0 5.5
34 10 0 10 0 10 0 50.0 5.5
35 10 0 10 10 10 10 83.3 4.1
36 10 0 0 0 0 10 33.3 5.2
37 10 0 10 0 0 10 50.0 5.5
38 0 0 10 0 0 10 33.3 5.2
39 0 0 10 0 0 10 33.3 5.2
40 10 0 0 0 10 10 50.0 5.5
41 10 10 10 0 0 10 66.7 5.2
42 10 0 10 0 10 10 66.7 5.2
43 0 0 10 10 0 10 50.0 5.5
44 10 10 10 0 10 0 66.7 5.2
45 10 0 10 0 10 0 50.0 5.5
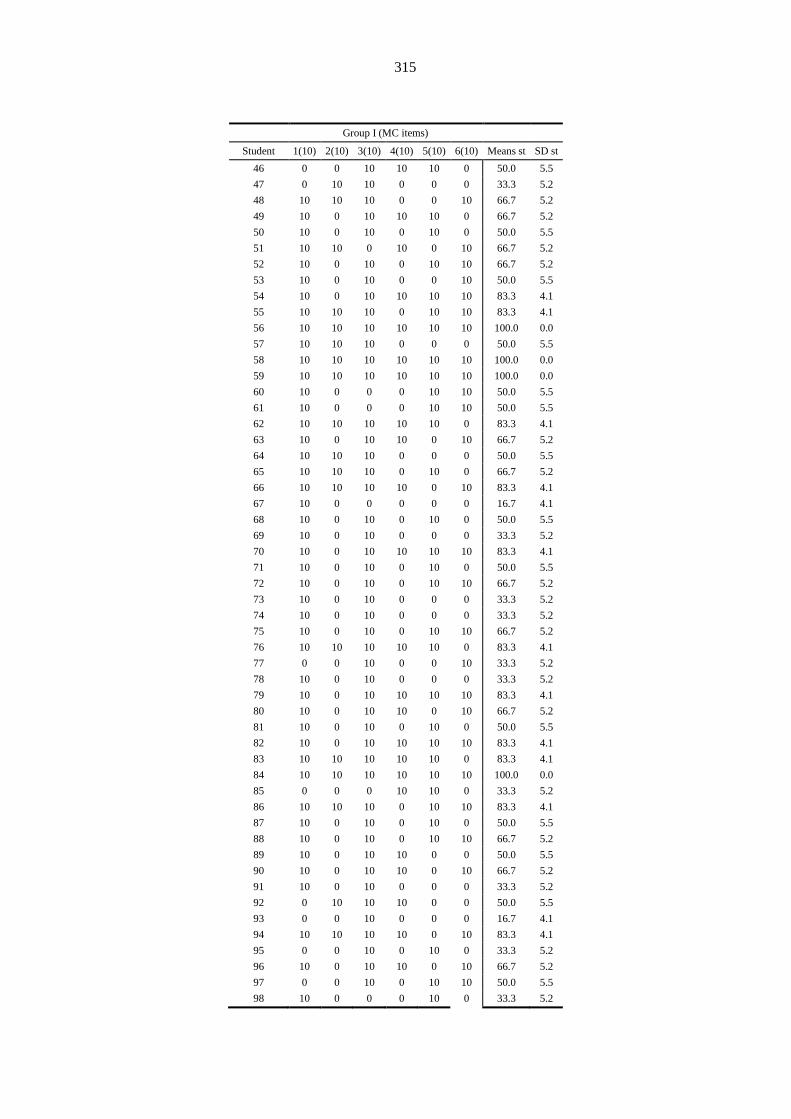
315
Group I (MC items)
Student 1(10) 2(10) 3(10) 4(10) 5(10) 6(10) Means st SD st
46 0 0 10 10 10 0 50.0 5.5
47 0 10 10 0 0 0 33.3 5.2
48 10 10 10 0 0 10 66.7 5.2
49 10 0 10 10 10 0 66.7 5.2
50 10 0 10 0 10 0 50.0 5.5
51 10 10 0 10 0 10 66.7 5.2
52 10 0 10 0 10 10 66.7 5.2
53 10 0 10 0 0 10 50.0 5.5
54 10 0 10 10 10 10 83.3 4.1
55 10 10 10 0 10 10 83.3 4.1
56 10 10 10 10 10 10 100.0 0.0
57 10 10 10 0 0 0 50.0 5.5
58 10 10 10 10 10 10 100.0 0.0
59 10 10 10 10 10 10 100.0 0.0
60 10 0 0 0 10 10 50.0 5.5
61 10 0 0 0 10 10 50.0 5.5
62 10 10 10 10 10 0 83.3 4.1
63 10 0 10 10 0 10 66.7 5.2
64 10 10 10 0 0 0 50.0 5.5
65 10 10 10 0 10 0 66.7 5.2
66 10 10 10 10 0 10 83.3 4.1
67 10 0 0 0 0 0 16.7 4.1
68 10 0 10 0 10 0 50.0 5.5
69 10 0 10 0 0 0 33.3 5.2
70 10 0 10 10 10 10 83.3 4.1
71 10 0 10 0 10 0 50.0 5.5
72 10 0 10 0 10 10 66.7 5.2
73 10 0 10 0 0 0 33.3 5.2
74 10 0 10 0 0 0 33.3 5.2
75 10 0 10 0 10 10 66.7 5.2
76 10 10 10 10 10 0 83.3 4.1
77 0 0 10 0 0 10 33.3 5.2
78 10 0 10 0 0 0 33.3 5.2
79 10 0 10 10 10 10 83.3 4.1
80 10 0 10 10 0 10 66.7 5.2
81 10 0 10 0 10 0 50.0 5.5
82 10 0 10 10 10 10 83.3 4.1
83 10 10 10 10 10 0 83.3 4.1
84 10 10 10 10 10 10 100.0 0.0
85 0 0 0 10 10 0 33.3 5.2
86 10 10 10 0 10 10 83.3 4.1
87 10 0 10 0 10 0 50.0 5.5
88 10 0 10 0 10 10 66.7 5.2
89 10 0 10 10 0 0 50.0 5.5
90 10 0 10 10 0 10 66.7 5.2
91 10 0 10 0 0 0 33.3 5.2
92 0 10 10 10 0 0 50.0 5.5
93 0 0 10 0 0 0 16.7 4.1
94 10 10 10 10 0 10 83.3 4.1
95 0 0 10 0 10 0 33.3 5.2
96 10 0 10 10 0 10 66.7 5.2
97 0 0 10 0 10 10 50.0 5.5
98 10 0 0 0 10 0 33.3 5.2
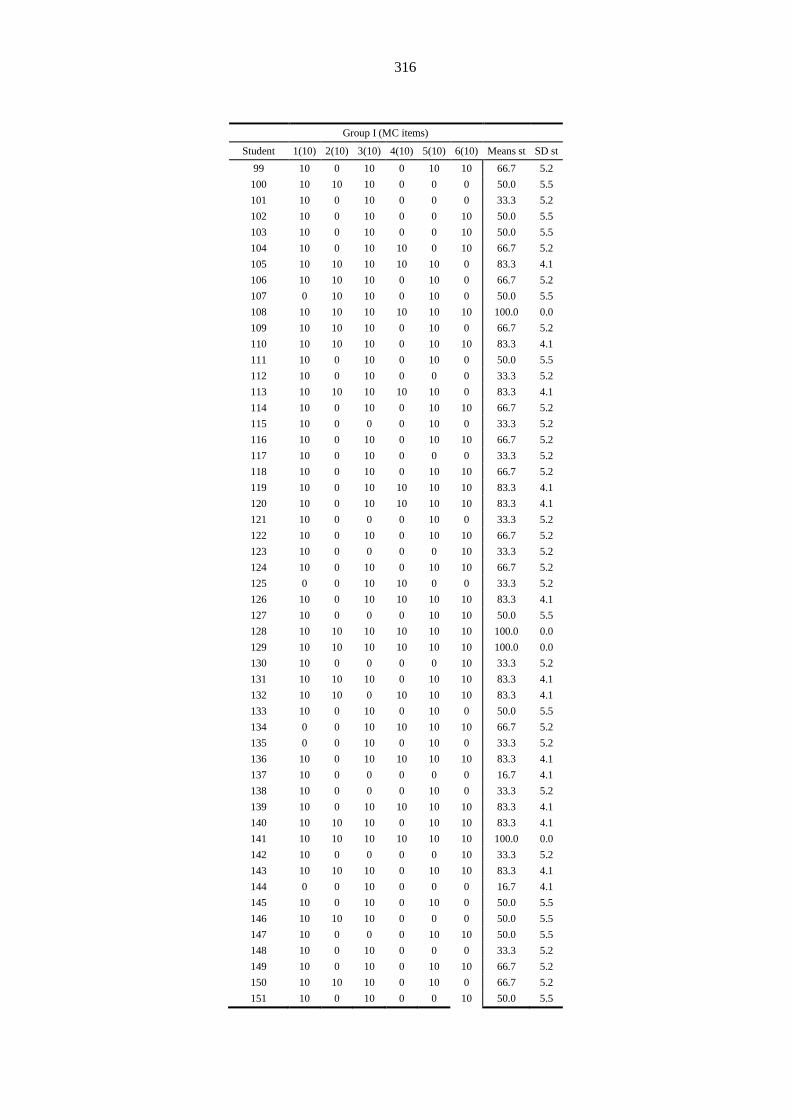
316
Group I (MC items)
Student 1(10) 2(10) 3(10) 4(10) 5(10) 6(10) Means st SD st
99 10 0 10 0 10 10 66.7 5.2
100 10 10 10 0 0 0 50.0 5.5
101 10 0 10 0 0 0 33.3 5.2
102 10 0 10 0 0 10 50.0 5.5
103 10 0 10 0 0 10 50.0 5.5
104 10 0 10 10 0 10 66.7 5.2
105 10 10 10 10 10 0 83.3 4.1
106 10 10 10 0 10 0 66.7 5.2
107 0 10 10 0 10 0 50.0 5.5
108 10 10 10 10 10 10 100.0 0.0
109 10 10 10 0 10 0 66.7 5.2
110 10 10 10 0 10 10 83.3 4.1
111 10 0 10 0 10 0 50.0 5.5
112 10 0 10 0 0 0 33.3 5.2
113 10 10 10 10 10 0 83.3 4.1
114 10 0 10 0 10 10 66.7 5.2
115 10 0 0 0 10 0 33.3 5.2
116 10 0 10 0 10 10 66.7 5.2
117 10 0 10 0 0 0 33.3 5.2
118 10 0 10 0 10 10 66.7 5.2
119 10 0 10 10 10 10 83.3 4.1
120 10 0 10 10 10 10 83.3 4.1
121 10 0 0 0 10 0 33.3 5.2
122 10 0 10 0 10 10 66.7 5.2
123 10 0 0 0 0 10 33.3 5.2
124 10 0 10 0 10 10 66.7 5.2
125 0 0 10 10 0 0 33.3 5.2
126 10 0 10 10 10 10 83.3 4.1
127 10 0 0 0 10 10 50.0 5.5
128 10 10 10 10 10 10 100.0 0.0
129 10 10 10 10 10 10 100.0 0.0
130 10 0 0 0 0 10 33.3 5.2
131 10 10 10 0 10 10 83.3 4.1
132 10 10 0 10 10 10 83.3 4.1
133 10 0 10 0 10 0 50.0 5.5
134 0 0 10 10 10 10 66.7 5.2
135 0 0 10 0 10 0 33.3 5.2
136 10 0 10 10 10 10 83.3 4.1
137 10 0 0 0 0 0 16.7 4.1
138 10 0 0 0 10 0 33.3 5.2
139 10 0 10 10 10 10 83.3 4.1
140 10 10 10 0 10 10 83.3 4.1
141 10 10 10 10 10 10 100.0 0.0
142 10 0 0 0 0 10 33.3 5.2
143 10 10 10 0 10 10 83.3 4.1
144 0 0 10 0 0 0 16.7 4.1
145 10 0 10 0 10 0 50.0 5.5
146 10 10 10 0 0 0 50.0 5.5
147 10 0 0 0 10 10 50.0 5.5
148 10 0 10 0 0 0 33.3 5.2
149 10 0 10 0 10 10 66.7 5.2
150 10 10 10 0 10 0 66.7 5.2
151 10 0 10 0 0 10 50.0 5.5
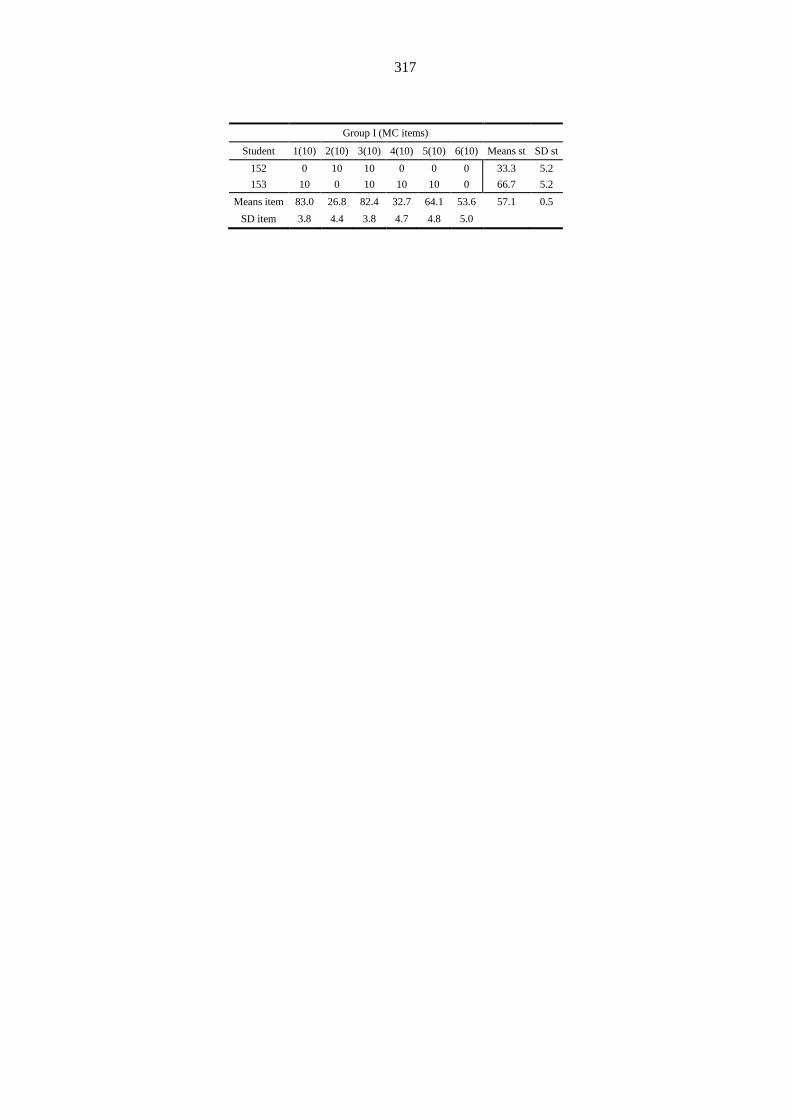
317
Group I (MC items)
Student 1(10) 2(10) 3(10) 4(10) 5(10) 6(10) Means st SD st
152 0 10 10 0 0 0 33.3 5.2
153 10 0 10 10 10 0 66.7 5.2
Means item 83.0 26.8 82.4 32.7 64.1 53.6 57.1 0.5
SD item 3.8 4.4 3.8 4.7 4.8 5.0

318
Table 6.53. Data of 153 examinees grades in Group II (CR items), Chemistry Exam 1st Phase, 1st call, 2003
Group II (CR items)
Student 1.1(7) 1.2(7) 1.3.1(4) 1.3.2(4) 1.3.3(4) 2.1(6) 2.2(3) 2.3(6) 2.4(()) 3.1(11) 3.2(5) 3.3.1(()) 3.3.2(()) 4.1(9) 4.2(10) 4.3(6) Means st SD st
1 7 7 4 4 4 0 0 1 12 11 4 0 0 8 2 2 66.0 3.9
2 0 0 0 0 0 6 3 0 0 11 5 0 0 8 10 6 49.0 4.0
3 0 0 4 4 4 6 0 1 1 0 5 4 3 0 6 0 38.0 2.3
4 0 3 0 4 0 5 0 0 0 3 4 0 0 9 6 3 37.0 2.8
5 0 0 4 0 0 0 0 0 2 11 5 0 0 7 9 0 38.0 3.7
6 5 0 0 4 0 6 0 0 9 0 5 0 0 9 0 3 41.0 3.3
7 5 5 4 4 4 0 0 6 5 11 5 7 0 9 10 0 75.0 3.5
8 7 2 4 4 4 0 3 1 0 11 5 0 0 8 0 3 52.0 3.3
9 7 7 4 4 4 0 3 6 1 11 5 8 4 9 10 3 86.0 3.1
10 0 0 0 0 4 5 0 0 0 7 0 0 0 9 0 0 25.0 3.0
11 3 7 4 4 4 0 3 1 0 11 5 8 0 9 8 6 73.0 3.4
12 7 7 4 4 4 5 0 0 2 11 5 8 0 9 10 0 76.0 3.7
13 3 0 4 4 4 0 0 1 0 11 4 0 0 7 8 0 46.0 3.4
14 7 7 4 4 4 6 3 1 3 11 4 0 0 4 0 6 64.0 3.0
15 7 7 4 4 4 5 0 3 1 11 3 8 4 9 10 6 86.0 3.1
16 7 7 4 4 4 0 3 3 12 11 5 8 0 9 10 3 90.0 3.7
17 7 6 4 4 0 6 0 3 11 11 5 8 8 9 8 0 90.0 3.6
18 3 0 4 0 0 5 0 0 8 7 5 0 0 9 0 0 41.0 3.3
19 3 0 0 0 0 0 0 0 0 11 5 0 0 9 6 3 37.0 3.6
20 3 0 4 4 4 6 3 0 0 11 5 0 1 7 4 4 56.0 3.0
21 3 0 4 4 4 6 0 0 0 11 2 3 4 0 0 6 47.0 3.1
22 3 2 0 0 4 5 0 0 2 11 5 3 2 7 4 4 52.0 2.9
23 7 6 0 0 4 6 3 6 0 9 0 8 0 9 8 4 70.0 3.5
24 0 0 4 0 4 6 3 0 12 11 5 8 5 9 10 0 77.0 4.2
25 7 0 4 4 4 5 3 5 0 11 5 8 0 9 4 6 75.0 3.1
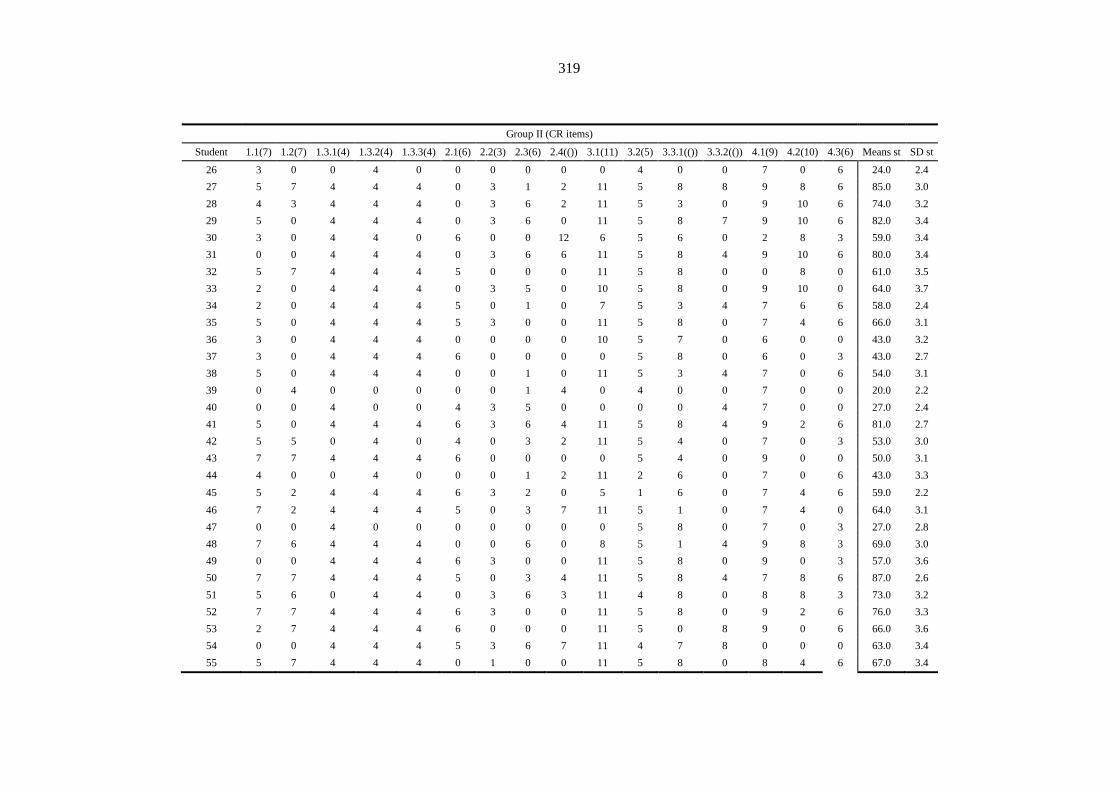
319
Group II (CR items)
Student 1.1(7) 1.2(7) 1.3.1(4) 1.3.2(4) 1.3.3(4) 2.1(6) 2.2(3) 2.3(6) 2.4(()) 3.1(11) 3.2(5) 3.3.1(()) 3.3.2(()) 4.1(9) 4.2(10) 4.3(6) Means st SD st
26 3 0 0 4 0 0 0 0 0 0 4 0 0 7 0 6 24.0 2.4
27 5 7 4 4 4 0 3 1 2 11 5 8 8 9 8 6 85.0 3.0
28 4 3 4 4 4 0 3 6 2 11 5 3 0 9 10 6 74.0 3.2
29 5 0 4 4 4 0 3 6 0 11 5 8 7 9 10 6 82.0 3.4
30 3 0 4 4 0 6 0 0 12 6 5 6 0 2 8 3 59.0 3.4
31 0 0 4 4 4 0 3 6 6 11 5 8 4 9 10 6 80.0 3.4
32 5 7 4 4 4 5 0 0 0 11 5 8 0 0 8 0 61.0 3.5
33 2 0 4 4 4 0 3 5 0 10 5 8 0 9 10 0 64.0 3.7
34 2 0 4 4 4 5 0 1 0 7 5 3 4 7 6 6 58.0 2.4
35 5 0 4 4 4 5 3 0 0 11 5 8 0 7 4 6 66.0 3.1
36 3 0 4 4 4 0 0 0 0 10 5 7 0 6 0 0 43.0 3.2
37 3 0 4 4 4 6 0 0 0 0 5 8 0 6 0 3 43.0 2.7
38 5 0 4 4 4 0 0 1 0 11 5 3 4 7 0 6 54.0 3.1
39 0 4 0 0 0 0 0 1 4 0 4 0 0 7 0 0 20.0 2.2
40 0 0 4 0 0 4 3 5 0 0 0 0 4 7 0 0 27.0 2.4
41 5 0 4 4 4 6 3 6 4 11 5 8 4 9 2 6 81.0 2.7
42 5 5 0 4 0 4 0 3 2 11 5 4 0 7 0 3 53.0 3.0
43 7 7 4 4 4 6 0 0 0 0 5 4 0 9 0 0 50.0 3.1
44 4 0 0 4 0 0 0 1 2 11 2 6 0 7 0 6 43.0 3.3
45 5 2 4 4 4 6 3 2 0 5 1 6 0 7 4 6 59.0 2.2
46 7 2 4 4 4 5 0 3 7 11 5 1 0 7 4 0 64.0 3.1
47 0 0 4 0 0 0 0 0 0 0 5 8 0 7 0 3 27.0 2.8
48 7 6 4 4 4 0 0 6 0 8 5 1 4 9 8 3 69.0 3.0
49 0 0 4 4 4 6 3 0 0 11 5 8 0 9 0 3 57.0 3.6
50 7 7 4 4 4 5 0 3 4 11 5 8 4 7 8 6 87.0 2.6
51 5 6 0 4 4 0 3 6 3 11 4 8 0 8 8 3 73.0 3.2
52 7 7 4 4 4 6 3 0 0 11 5 8 0 9 2 6 76.0 3.3
53 2 7 4 4 4 6 0 0 0 11 5 0 8 9 0 6 66.0 3.6
54 0 0 4 4 4 5 3 6 7 11 4 7 8 0 0 0 63.0 3.4
55 5 7 4 4 4 0 1 0 0 11 5 8 0 8 4 6 67.0 3.4
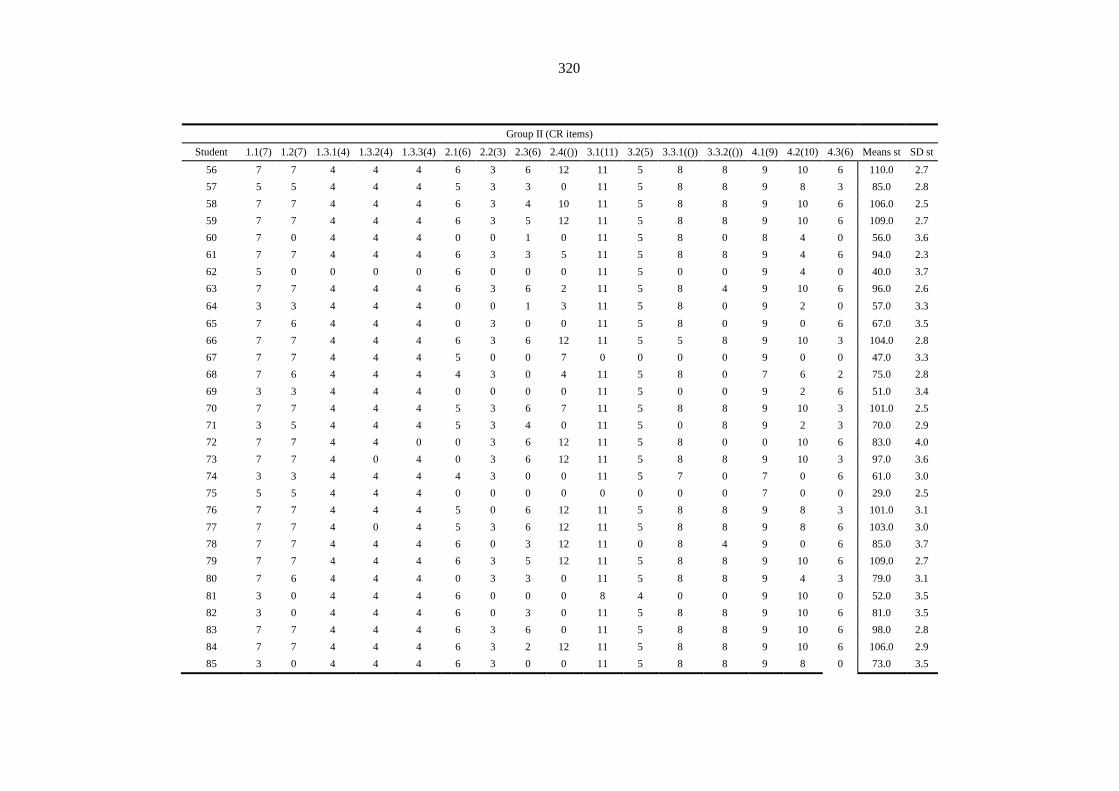
320
Group II (CR items)
Student 1.1(7) 1.2(7) 1.3.1(4) 1.3.2(4) 1.3.3(4) 2.1(6) 2.2(3) 2.3(6) 2.4(()) 3.1(11) 3.2(5) 3.3.1(()) 3.3.2(()) 4.1(9) 4.2(10) 4.3(6) Means st SD st
56 7 7 4 4 4 6 3 6 12 11 5 8 8 9 10 6 110.0 2.7
57 5 5 4 4 4 5 3 3 0 11 5 8 8 9 8 3 85.0 2.8
58 7 7 4 4 4 6 3 4 10 11 5 8 8 9 10 6 106.0 2.5
59 7 7 4 4 4 6 3 5 12 11 5 8 8 9 10 6 109.0 2.7
60 7 0 4 4 4 0 0 1 0 11 5 8 0 8 4 0 56.0 3.6
61 7 7 4 4 4 6 3 3 5 11 5 8 8 9 4 6 94.0 2.3
62 5 0 0 0 0 6 0 0 0 11 5 0 0 9 4 0 40.0 3.7
63 7 7 4 4 4 6 3 6 2 11 5 8 4 9 10 6 96.0 2.6
64 3 3 4 4 4 0 0 1 3 11 5 8 0 9 2 0 57.0 3.3
65 7 6 4 4 4 0 3 0 0 11 5 8 0 9 0 6 67.0 3.5
66 7 7 4 4 4 6 3 6 12 11 5 5 8 9 10 3 104.0 2.8
67 7 7 4 4 4 5 0 0 7 0 0 0 0 9 0 0 47.0 3.3
68 7 6 4 4 4 4 3 0 4 11 5 8 0 7 6 2 75.0 2.8
69 3 3 4 4 4 0 0 0 0 11 5 0 0 9 2 6 51.0 3.4
70 7 7 4 4 4 5 3 6 7 11 5 8 8 9 10 3 101.0 2.5
71 3 5 4 4 4 5 3 4 0 11 5 0 8 9 2 3 70.0 2.9
72 7 7 4 4 0 0 3 6 12 11 5 8 0 0 10 6 83.0 4.0
73 7 7 4 0 4 0 3 6 12 11 5 8 8 9 10 3 97.0 3.6
74 3 3 4 4 4 4 3 0 0 11 5 7 0 7 0 6 61.0 3.0
75 5 5 4 4 4 0 0 0 0 0 0 0 0 7 0 0 29.0 2.5
76 7 7 4 4 4 5 0 6 12 11 5 8 8 9 8 3 101.0 3.1
77 7 7 4 0 4 5 3 6 12 11 5 8 8 9 8 6 103.0 3.0
78 7 7 4 4 4 6 0 3 12 11 0 8 4 9 0 6 85.0 3.7
79 7 7 4 4 4 6 3 5 12 11 5 8 8 9 10 6 109.0 2.7
80 7 6 4 4 4 0 3 3 0 11 5 8 8 9 4 3 79.0 3.1
81 3 0 4 4 4 6 0 0 0 8 4 0 0 9 10 0 52.0 3.5
82 3 0 4 4 4 6 0 3 0 11 5 8 8 9 10 6 81.0 3.5
83 7 7 4 4 4 6 3 6 0 11 5 8 8 9 10 6 98.0 2.8
84 7 7 4 4 4 6 3 2 12 11 5 8 8 9 10 6 106.0 2.9
85 3 0 4 4 4 6 3 0 0 11 5 8 8 9 8 0 73.0 3.5

321
Group II (CR items)
Student 1.1(7) 1.2(7) 1.3.1(4) 1.3.2(4) 1.3.3(4) 2.1(6) 2.2(3) 2.3(6) 2.4(()) 3.1(11) 3.2(5) 3.3.1(()) 3.3.2(()) 4.1(9) 4.2(10) 4.3(6) Means st SD st
86 3 0 4 4 4 0 3 0 0 11 5 8 4 9 10 3 68.0 3.6
87 0 0 4 4 4 2 3 0 0 0 0 0 0 7 8 0 32.0 2.7
88 7 7 4 4 4 6 0 0 0 11 5 8 8 9 6 5 84.0 3.2
89 3 0 0 4 4 0 3 0 0 11 5 8 0 9 4 2 53.0 3.5
90 3 7 4 4 4 6 0 5 0 11 5 2 4 9 2 6 72.0 2.9
91 3 0 0 4 0 6 3 0 0 11 5 7 0 9 4 6 58.0 3.5
92 7 2 4 4 4 5 2 0 0 11 3 0 0 9 2 4 57.0 3.2
93 5 0 4 4 4 6 3 0 0 11 2 8 6 9 6 6 74.0 3.2
94 7 7 4 4 4 5 3 2 8 11 5 8 7 9 10 6 100.0 2.6
95 5 2 4 4 4 6 3 2 2 11 5 7 0 9 2 6 72.0 2.9
96 6 0 4 4 4 3 0 3 3 11 5 8 0 9 10 6 76.0 3.4
97 7 5 4 4 4 3 0 2 0 0 5 3 8 9 10 4 68.0 3.1
98 7 0 4 4 4 6 3 3 0 11 5 2 7 9 10 6 81.0 3.2
99 5 7 4 4 4 5 0 2 7 11 5 0 4 9 1 6 74.0 3.0
100 5 7 4 4 4 6 3 3 12 11 5 8 0 9 10 6 97.0 3.3
101 7 7 4 4 4 6 3 6 0 11 5 8 0 9 10 6 90.0 3.1
102 4 7 4 4 4 5 3 3 1 11 5 8 0 9 8 6 82.0 2.9
103 4 0 4 4 4 5 3 6 0 7 3 2 0 9 6 5 62.0 2.6
104 7 7 4 4 4 5 3 5 12 11 5 6 4 7 8 6 98.0 2.5
105 5 7 4 4 4 0 3 3 0 11 5 8 8 9 10 6 87.0 3.2
106 7 7 4 4 4 5 0 6 12 11 5 8 8 9 10 6 106.0 3.1
107 7 7 4 4 4 0 3 3 6 11 5 4 0 7 10 6 81.0 3.0
108 7 7 4 4 4 0 3 6 12 11 5 8 0 9 10 6 96.0 3.5
109 7 7 4 4 4 5 3 3 10 11 5 3 0 9 8 6 89.0 2.9
110 7 7 4 4 4 6 3 6 5 11 5 8 8 9 6 6 99.0 2.1
111 7 7 4 4 4 0 3 4 8 11 5 8 0 9 10 5 89.0 3.2
112 7 7 4 4 4 0 3 3 6 11 5 6 0 9 8 6 83.0 3.0
113 7 7 4 4 4 5 3 6 12 11 5 8 8 9 8 6 107.0 2.6
114 7 7 4 4 4 5 3 5 12 11 5 6 4 9 8 6 100.0 2.6
115 6 7 4 4 4 6 3 5 5 9 5 8 6 9 8 6 95.0 1.8

322
Group II (CR items)
Student 1.1(7) 1.2(7) 1.3.1(4) 1.3.2(4) 1.3.3(4) 2.1(6) 2.2(3) 2.3(6) 2.4(()) 3.1(11) 3.2(5) 3.3.1(()) 3.3.2(()) 4.1(9) 4.2(10) 4.3(6) Means st SD st
116 7 6 4 4 4 6 3 6 12 11 5 8 8 9 10 6 109.0 2.7
117 3 2 4 4 4 6 1 0 0 10 5 6 0 9 8 0 62.0 3.3
118 7 7 4 4 4 6 3 6 0 11 5 6 0 5 10 6 84.0 2.9
119 7 7 4 4 4 5 3 5 2 11 5 8 8 9 8 6 96.0 2.4
120 7 7 4 4 4 5 3 6 12 11 5 8 8 9 10 6 109.0 2.7
121 7 7 4 4 4 5 0 3 0 11 5 8 8 9 0 6 81.0 3.3
122 7 7 4 4 4 6 3 6 4 11 5 8 4 9 10 3 95.0 2.5
123 7 7 4 4 4 0 3 1 0 11 5 1 0 9 10 0 66.0 3.8
124 7 7 4 4 4 5 3 6 2 11 5 7 4 7 10 6 92.0 2.4
125 7 1 4 4 4 5 0 3 12 10 5 7 0 2 6 6 76.0 3.3
126 7 7 4 0 4 6 0 0 12 11 0 8 4 7 6 0 76.0 4.0
127 0 0 0 0 0 5 3 6 12 11 5 8 1 9 6 3 69.0 4.1
128 7 7 4 4 4 5 3 6 3 11 5 8 8 9 10 6 100.0 2.5
129 1 0 4 4 4 6 0 4 4 8 5 7 8 9 8 3 75.0 2.8
130 7 1 4 4 4 5 0 1 0 11 5 8 0 9 6 6 71.0 3.4
131 7 6 4 4 4 0 3 5 3 11 5 8 8 9 10 6 93.0 2.9
132 3 0 4 4 4 5 3 6 0 11 5 7 1 0 6 6 65.0 3.0
133 7 7 4 4 4 6 0 0 3 11 5 0 0 9 10 0 70.0 3.8
134 3 0 4 4 4 5 3 6 0 11 5 8 8 9 6 6 82.0 3.0
135 6 6 4 4 4 5 3 0 2 11 5 8 8 9 10 6 91.0 3.0
136 5 4 4 4 4 0 3 1 2 11 5 8 0 7 8 6 72.0 3.0
137 0 3 4 4 4 0 3 1 0 11 4 0 4 7 8 3 56.0 3.1
138 5 5 4 4 4 0 0 0 2 11 5 7 8 7 10 6 78.0 3.3
139 7 7 4 4 4 0 3 6 10 11 5 8 8 9 10 6 102.0 3.0
140 7 7 4 4 4 5 3 6 12 11 5 8 8 9 10 6 109.0 2.7
141 7 7 4 4 4 0 3 6 10 11 5 8 8 9 6 3 95.0 2.9
142 0 4 4 4 4 0 0 0 8 11 5 0 0 9 0 6 55.0 3.7
143 7 6 0 4 4 0 3 6 1 11 5 4 0 9 4 6 70.0 3.2
144 7 0 0 4 4 0 0 0 3 3 5 7 8 9 10 6 66.0 3.5
145 7 6 4 4 4 0 3 3 4 11 5 4 0 9 6 6 76.0 2.8
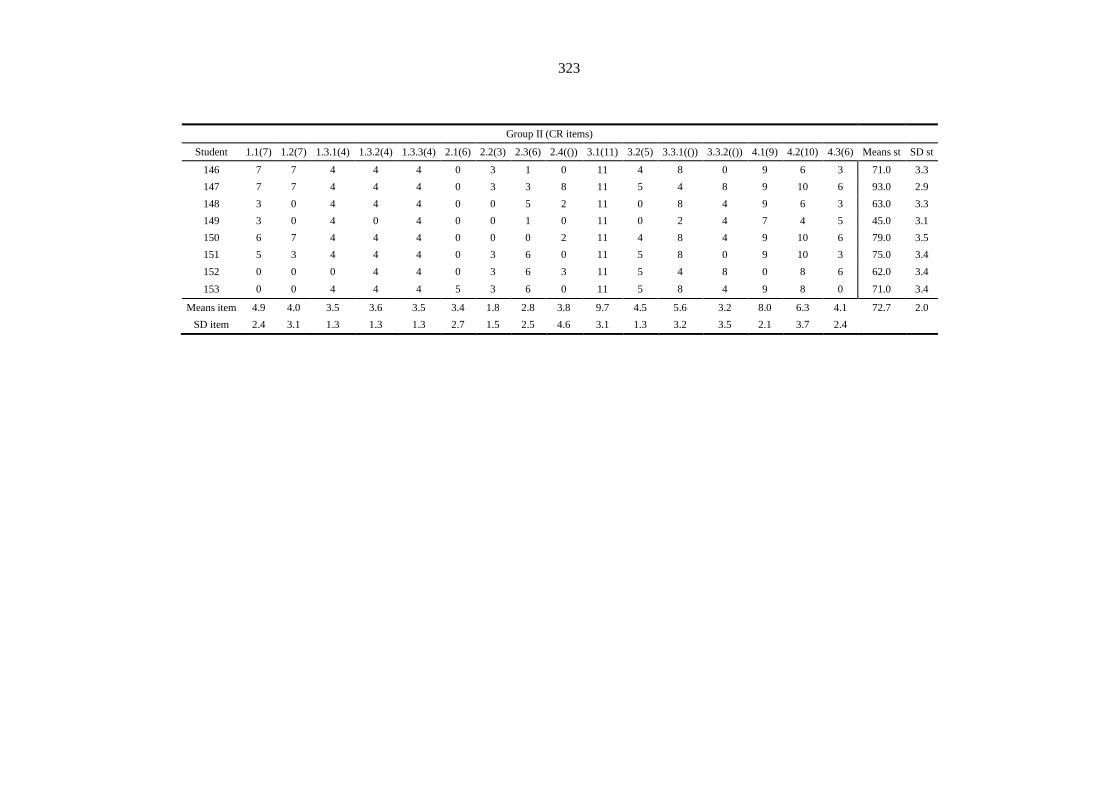
323
Group II (CR items)
Student 1.1(7) 1.2(7) 1.3.1(4) 1.3.2(4) 1.3.3(4) 2.1(6) 2.2(3) 2.3(6) 2.4(()) 3.1(11) 3.2(5) 3.3.1(()) 3.3.2(()) 4.1(9) 4.2(10) 4.3(6) Means st SD st
146 7 7 4 4 4 0 3 1 0 11 4 8 0 9 6 3 71.0 3.3
147 7 7 4 4 4 0 3 3 8 11 5 4 8 9 10 6 93.0 2.9
148 3 0 4 4 4 0 0 5 2 11 0 8 4 9 6 3 63.0 3.3
149 3 0 4 0 4 0 0 1 0 11 0 2 4 7 4 5 45.0 3.1
150 6 7 4 4 4 0 0 0 2 11 4 8 4 9 10 6 79.0 3.5
151 5 3 4 4 4 0 3 6 0 11 5 8 0 9 10 3 75.0 3.4
152 0 0 0 4 4 0 3 6 3 11 5 4 8 0 8 6 62.0 3.4
153 0 0 4 4 4 5 3 6 0 11 5 8 4 9 8 0 71.0 3.4
Means item 4.9 4.0 3.5 3.6 3.5 3.4 1.8 2.8 3.8 9.7 4.5 5.6 3.2 8.0 6.3 4.1 72.7 2.0
SD item 2.4 3.1 1.3 1.3 1.3 2.7 1.5 2.5 4.6 3.1 1.3 3.2 3.5 2.1 3.7 2.4
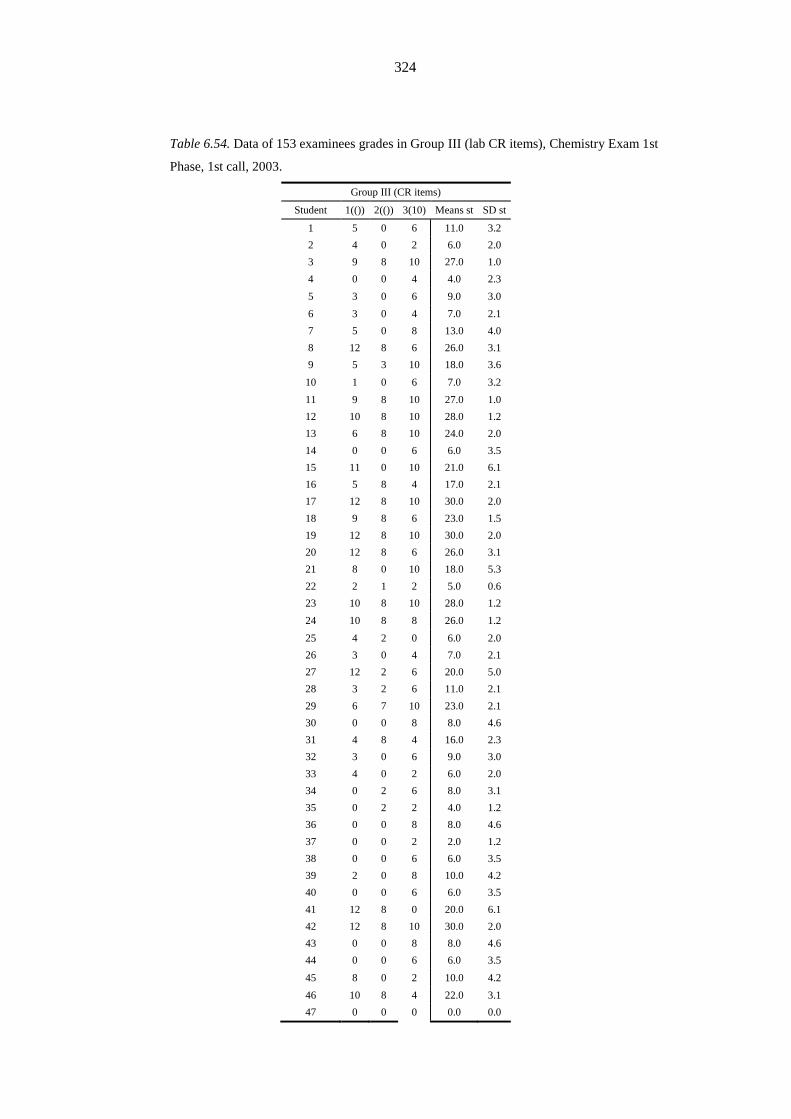
324
Table 6.54. Data of 153 examinees grades in Group III (lab CR items), Chemistry Exam 1st
Phase, 1st call, 2003.
Group III (CR items)
Student 1(()) 2(()) 3(10) Means st SD st
1 5 0 6 11.0 3.2
2 4 0 2 6.0 2.0
3 9 8 10 27.0 1.0
4 0 0 4 4.0 2.3
5 3 0 6 9.0 3.0
6 3 0 4 7.0 2.1
7 5 0 8 13.0 4.0
8 12 8 6 26.0 3.1
9 5 3 10 18.0 3.6
10 1 0 6 7.0 3.2
11 9 8 10 27.0 1.0
12 10 8 10 28.0 1.2
13 6 8 10 24.0 2.0
14 0 0 6 6.0 3.5
15 11 0 10 21.0 6.1
16 5 8 4 17.0 2.1
17 12 8 10 30.0 2.0
18 9 8 6 23.0 1.5
19 12 8 10 30.0 2.0
20 12 8 6 26.0 3.1
21 8 0 10 18.0 5.3
22 2 1 2 5.0 0.6
23 10 8 10 28.0 1.2
24 10 8 8 26.0 1.2
25 4 2 0 6.0 2.0
26 3 0 4 7.0 2.1
27 12 2 6 20.0 5.0
28 3 2 6 11.0 2.1
29 6 7 10 23.0 2.1
30 0 0 8 8.0 4.6
31 4 8 4 16.0 2.3
32 3 0 6 9.0 3.0
33 4 0 2 6.0 2.0
34 0 2 6 8.0 3.1
35 0 2 2 4.0 1.2
36 0 0 8 8.0 4.6
37 0 0 2 2.0 1.2
38 0 0 6 6.0 3.5
39 2 0 8 10.0 4.2
40 0 0 6 6.0 3.5
41 12 8 0 20.0 6.1
42 12 8 10 30.0 2.0
43 0 0 8 8.0 4.6
44 0 0 6 6.0 3.5
45 8 0 2 10.0 4.2
46 10 8 4 22.0 3.1
47 0 0 0 0.0 0.0

325
Group III (CR items)
Student 1(()) 2(()) 3(10) Means st SD st
48 0 0 2 2.0 1.2
49 0 0 6 6.0 3.5
50 9 0 10 19.0 5.5
51 3 0 6 9.0 3.0
52 10 0 2 12.0 5.3
53 10 5 4 19.0 3.2
54 9 0 4 13.0 4.5
55 12 8 6 26.0 3.1
56 12 8 10 30.0 2.0
57 5 0 8 13.0 4.0
58 11 8 10 29.0 1.5
59 12 8 6 26.0 3.1
60 6 0 6 12.0 3.5
61 12 8 6 26.0 3.1
62 5 0 4 9.0 2.6
63 3 0 10 13.0 5.1
64 0 0 8 8.0 4.6
65 3 0 6 9.0 3.0
66 12 6 10 28.0 3.1
67 0 0 10 10.0 5.8
68 11 8 10 29.0 1.5
69 3 0 6 9.0 3.0
70 11 8 10 29.0 1.5
71 11 0 10 21.0 6.1
72 11 3 10 24.0 4.4
73 12 8 10 30.0 2.0
74 9 0 10 19.0 5.5
75 9 8 6 23.0 1.5
76 12 8 10 30.0 2.0
77 11 8 10 29.0 1.5
78 12 0 10 22.0 6.4
79 12 6 10 28.0 3.1
80 10 6 4 20.0 3.1
81 0 0 6 6.0 3.5
82 8 0 8 16.0 4.6
83 12 8 10 30.0 2.0
84 11 8 10 29.0 1.5
85 11 8 10 29.0 1.5
86 3 0 8 11.0 4.0
87 3 0 10 13.0 5.1
88 11 0 10 21.0 6.1
89 11 8 10 29.0 1.5
90 10 8 10 28.0 1.2
91 0 0 8 8.0 4.6
92 0 2 6 8.0 3.1
93 10 0 2 12.0 5.3
94 12 8 8 28.0 2.3
95 5 0 8 13.0 4.0
96 12 8 4 24.0 4.0
97 6 6 10 22.0 2.3

326
Group III (CR items)
Student 1(()) 2(()) 3(10) Means st SD st
98 6 0 8 14.0 4.2
99 3 0 8 11.0 4.0
100 12 0 10 22.0 6.4
101 12 6 10 28.0 3.1
102 11 8 10 29.0 1.5
103 5 0 0 5.0 2.9
104 12 8 8 28.0 2.3
105 9 0 4 13.0 4.5
106 12 8 10 30.0 2.0
107 6 2 8 16.0 3.1
108 12 8 10 30.0 2.0
109 10 8 8 26.0 1.2
110 12 8 10 30.0 2.0
111 12 8 10 30.0 2.0
112 12 0 10 22.0 6.4
113 12 8 10 30.0 2.0
114 9 8 8 25.0 0.6
115 12 8 10 30.0 2.0
116 12 8 10 30.0 2.0
117 9 0 6 15.0 4.6
118 12 8 6 26.0 3.1
119 12 8 10 30.0 2.0
120 12 6 8 26.0 3.1
121 12 5 10 27.0 3.6
122 6 6 8 20.0 1.2
123 11 0 8 19.0 5.7
124 5 6 8 19.0 1.5
125 5 0 4 9.0 2.6
126 12 0 10 22.0 6.4
127 4 0 10 14.0 5.0
128 12 8 8 28.0 2.3
129 12 8 10 30.0 2.0
130 5 0 4 9.0 2.6
131 12 8 0 20.0 6.1
132 6 0 6 12.0 3.5
133 0 0 6 6.0 3.5
134 10 8 10 28.0 1.2
135 3 0 4 7.0 2.1
136 8 7 0 15.0 4.4
137 11 5 6 22.0 3.2
138 12 8 10 30.0 2.0
139 11 8 10 29.0 1.5
140 12 8 10 30.0 2.0
141 12 8 10 30.0 2.0
142 12 8 10 30.0 2.0
143 9 0 8 17.0 4.9
144 5 0 6 11.0 3.2
145 11 0 8 19.0 5.7
146 11 7 8 26.0 2.1
147 12 8 10 30.0 2.0
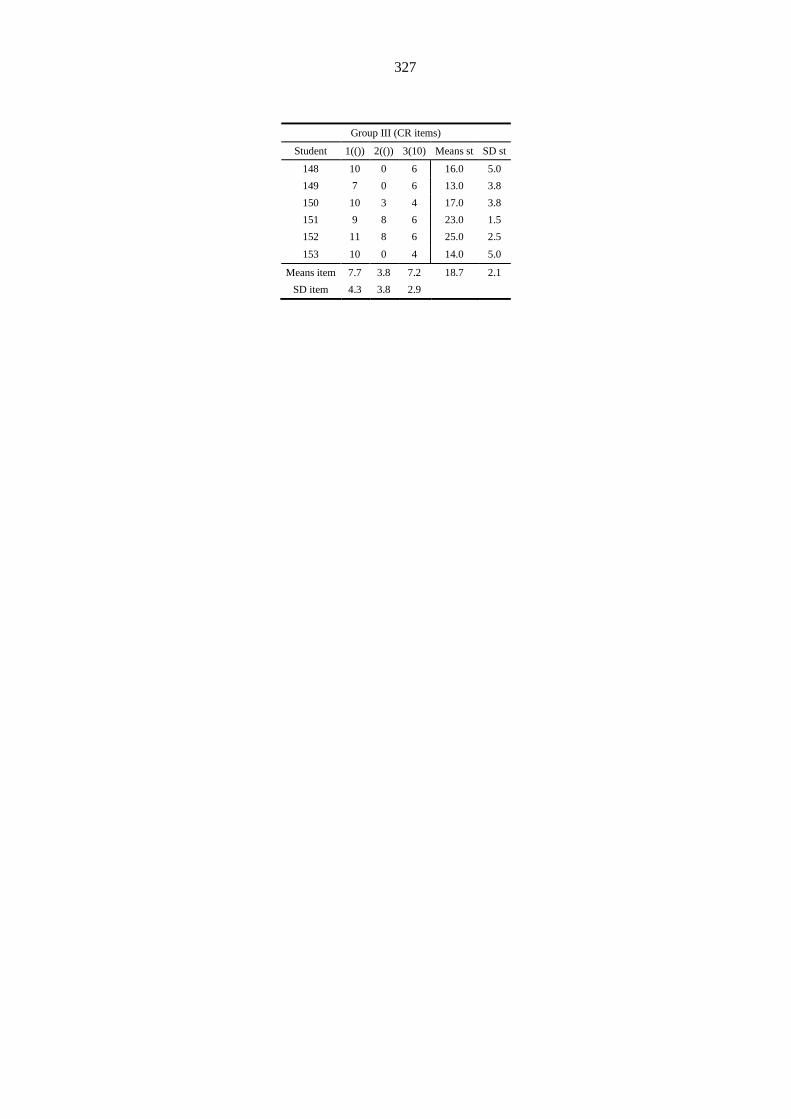
327
Group III (CR items)
Student 1(()) 2(()) 3(10) Means st SD st
148 10 0 6 16.0 5.0
149 7 0 6 13.0 3.8
150 10 3 4 17.0 3.8
151 9 8 6 23.0 1.5
152 11 8 6 25.0 2.5
153 10 0 4 14.0 5.0
Means item 7.7 3.8 7.2 18.7 2.1
SD item 4.3 3.8 2.9

328
Chemistry Exam 1st Phase, 2004
Table 6.55. Data of 317 examinees grades in Group I (MC items), Chemistry Exam 1st Phase,
2004.
Group I (MC items)
Student 1(10) 2(10) 3(10) 4(10) 5(10) 6(10) Means st SD st
1 10 0 10 0 0 10 50.0 5.5
2 10 0 10 0 0 0 33.3 5.2
3 0 0 10 10 0 10 50.0 5.5
4 10 0 10 10 0 10 66.7 5.2
5 10 0 10 0 0 10 50.0 5.5
6 0 0 10 0 0 10 33.3 5.2
7 0 0 10 10 0 0 33.3 5.2
8 0 0 0 0 10 10 33.3 5.2
9 10 10 10 0 0 0 50.0 5.5
10 0 0 10 0 0 0 16.7 4.1
11 10 0 10 10 0 10 66.7 5.2
12 10 10 10 0 10 10 83.3 4.1
13 10 0 10 0 0 10 50.0 5.5
14 10 10 0 0 10 0 50.0 5.5
15 0 0 10 0 0 0 16.7 4.1
16 10 0 10 10 10 0 66.7 5.2
17 0 0 10 10 0 10 50.0 5.5
18 10 10 0 0 0 0 33.3 5.2
19 0 10 10 10 0 10 66.7 5.2
20 0 0 0 0 0 0 0.0 0.0
21 10 0 10 0 10 10 66.7 5.2
22 0 10 0 0 0 0 16.7 4.1
23 0 0 0 0 10 0 16.7 4.1
24 0 0 0 0 0 0 0.0 0.0
25 10 10 10 10 0 0 66.7 5.2
26 10 10 10 0 0 0 50.0 5.5
27 10 0 0 0 0 0 16.7 4.1
28 10 0 10 0 10 10 66.7 5.2
29 0 0 0 0 0 10 16.7 4.1
30 10 10 10 10 0 10 83.3 4.1
31 0 0 10 0 10 10 50.0 5.5
32 10 0 0 10 0 0 33.3 5.2
33 10 0 0 10 0 10 50.0 5.5
34 10 0 0 0 0 10 33.3 5.2
35 10 10 0 0 0 10 50.0 5.5
36 0 0 10 10 0 0 33.3 5.2
37 0 0 0 0 0 0 0.0 0.0
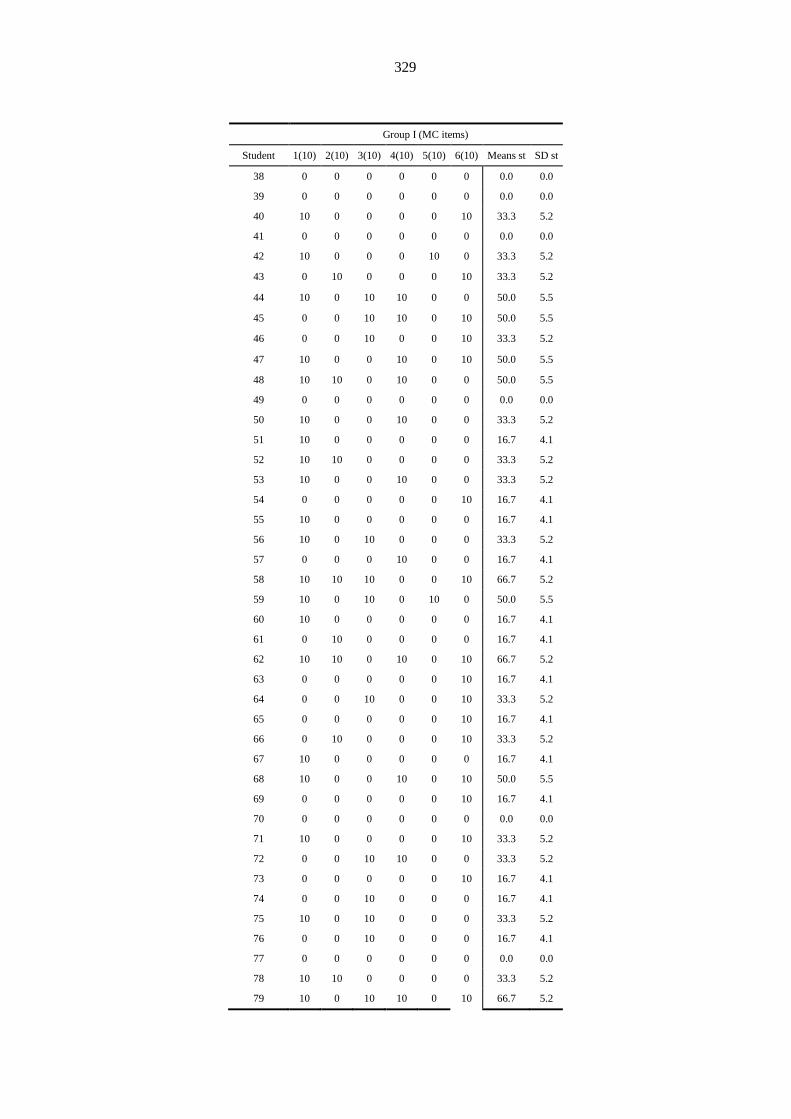
329
Group I (MC items)
Student 1(10) 2(10) 3(10) 4(10) 5(10) 6(10) Means st SD st
38 0 0 0 0 0 0 0.0 0.0
39 0 0 0 0 0 0 0.0 0.0
40 10 0 0 0 0 10 33.3 5.2
41 0 0 0 0 0 0 0.0 0.0
42 10 0 0 0 10 0 33.3 5.2
43 0 10 0 0 0 10 33.3 5.2
44 10 0 10 10 0 0 50.0 5.5
45 0 0 10 10 0 10 50.0 5.5
46 0 0 10 0 0 10 33.3 5.2
47 10 0 0 10 0 10 50.0 5.5
48 10 10 0 10 0 0 50.0 5.5
49 0 0 0 0 0 0 0.0 0.0
50 10 0 0 10 0 0 33.3 5.2
51 10 0 0 0 0 0 16.7 4.1
52 10 10 0 0 0 0 33.3 5.2
53 10 0 0 10 0 0 33.3 5.2
54 0 0 0 0 0 10 16.7 4.1
55 10 0 0 0 0 0 16.7 4.1
56 10 0 10 0 0 0 33.3 5.2
57 0 0 0 10 0 0 16.7 4.1
58 10 10 10 0 0 10 66.7 5.2
59 10 0 10 0 10 0 50.0 5.5
60 10 0 0 0 0 0 16.7 4.1
61 0 10 0 0 0 0 16.7 4.1
62 10 10 0 10 0 10 66.7 5.2
63 0 0 0 0 0 10 16.7 4.1
64 0 0 10 0 0 10 33.3 5.2
65 0 0 0 0 0 10 16.7 4.1
66 0 10 0 0 0 10 33.3 5.2
67 10 0 0 0 0 0 16.7 4.1
68 10 0 0 10 0 10 50.0 5.5
69 0 0 0 0 0 10 16.7 4.1
70 0 0 0 0 0 0 0.0 0.0
71 10 0 0 0 0 10 33.3 5.2
72 0 0 10 10 0 0 33.3 5.2
73 0 0 0 0 0 10 16.7 4.1
74 0 0 10 0 0 0 16.7 4.1
75 10 0 10 0 0 0 33.3 5.2
76 0 0 10 0 0 0 16.7 4.1
77 0 0 0 0 0 0 0.0 0.0
78 10 10 0 0 0 0 33.3 5.2
79 10 0 10 10 0 10 66.7 5.2
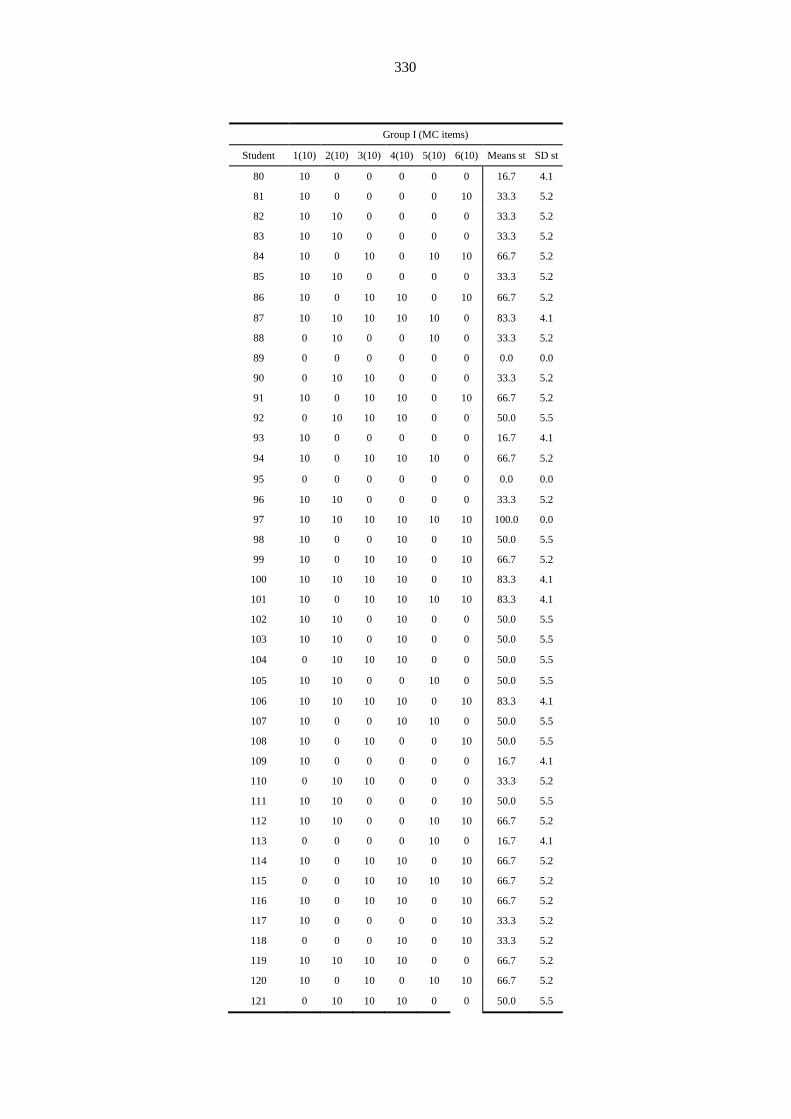
330
Group I (MC items)
Student 1(10) 2(10) 3(10) 4(10) 5(10) 6(10) Means st SD st
80 10 0 0 0 0 0 16.7 4.1
81 10 0 0 0 0 10 33.3 5.2
82 10 10 0 0 0 0 33.3 5.2
83 10 10 0 0 0 0 33.3 5.2
84 10 0 10 0 10 10 66.7 5.2
85 10 10 0 0 0 0 33.3 5.2
86 10 0 10 10 0 10 66.7 5.2
87 10 10 10 10 10 0 83.3 4.1
88 0 10 0 0 10 0 33.3 5.2
89 0 0 0 0 0 0 0.0 0.0
90 0 10 10 0 0 0 33.3 5.2
91 10 0 10 10 0 10 66.7 5.2
92 0 10 10 10 0 0 50.0 5.5
93 10 0 0 0 0 0 16.7 4.1
94 10 0 10 10 10 0 66.7 5.2
95 0 0 0 0 0 0 0.0 0.0
96 10 10 0 0 0 0 33.3 5.2
97 10 10 10 10 10 10 100.0 0.0
98 10 0 0 10 0 10 50.0 5.5
99 10 0 10 10 0 10 66.7 5.2
100 10 10 10 10 0 10 83.3 4.1
101 10 0 10 10 10 10 83.3 4.1
102 10 10 0 10 0 0 50.0 5.5
103 10 10 0 10 0 0 50.0 5.5
104 0 10 10 10 0 0 50.0 5.5
105 10 10 0 0 10 0 50.0 5.5
106 10 10 10 10 0 10 83.3 4.1
107 10 0 0 10 10 0 50.0 5.5
108 10 0 10 0 0 10 50.0 5.5
109 10 0 0 0 0 0 16.7 4.1
110 0 10 10 0 0 0 33.3 5.2
111 10 10 0 0 0 10 50.0 5.5
112 10 10 0 0 10 10 66.7 5.2
113 0 0 0 0 10 0 16.7 4.1
114 10 0 10 10 0 10 66.7 5.2
115 0 0 10 10 10 10 66.7 5.2
116 10 0 10 10 0 10 66.7 5.2
117 10 0 0 0 0 10 33.3 5.2
118 0 0 0 10 0 10 33.3 5.2
119 10 10 10 10 0 0 66.7 5.2
120 10 0 10 0 10 10 66.7 5.2
121 0 10 10 10 0 0 50.0 5.5
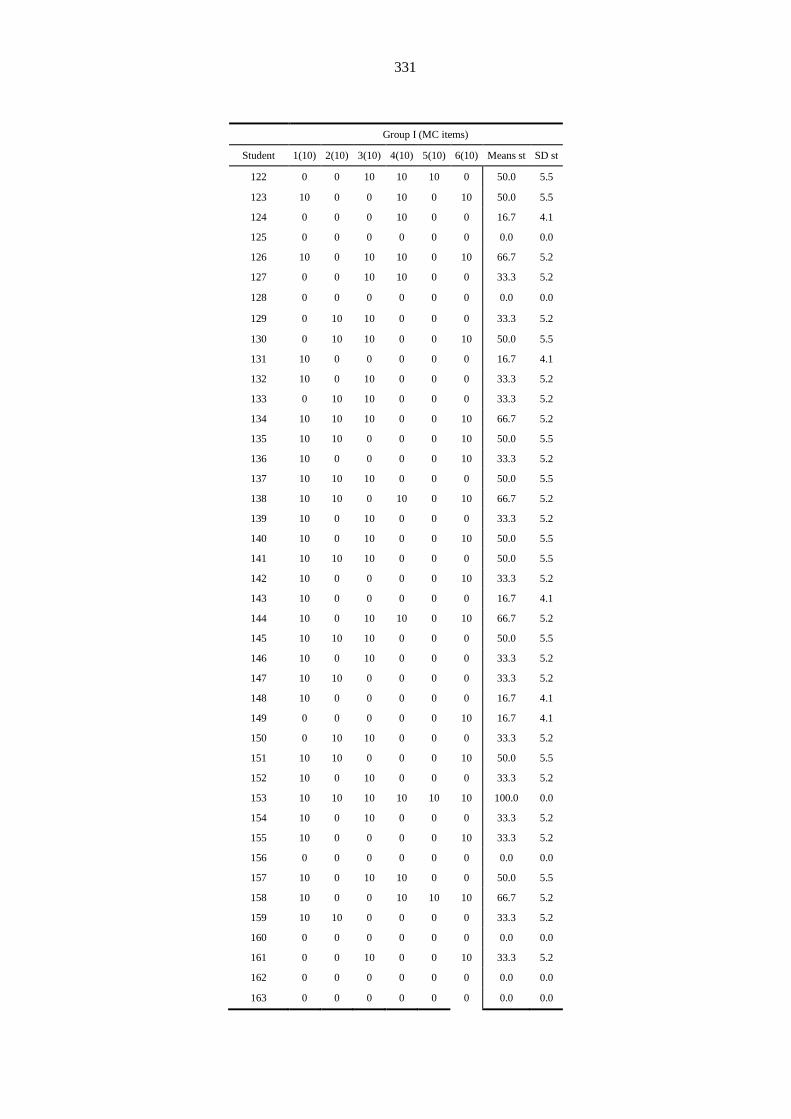
331
Group I (MC items)
Student 1(10) 2(10) 3(10) 4(10) 5(10) 6(10) Means st SD st
122 0 0 10 10 10 0 50.0 5.5
123 10 0 0 10 0 10 50.0 5.5
124 0 0 0 10 0 0 16.7 4.1
125 0 0 0 0 0 0 0.0 0.0
126 10 0 10 10 0 10 66.7 5.2
127 0 0 10 10 0 0 33.3 5.2
128 0 0 0 0 0 0 0.0 0.0
129 0 10 10 0 0 0 33.3 5.2
130 0 10 10 0 0 10 50.0 5.5
131 10 0 0 0 0 0 16.7 4.1
132 10 0 10 0 0 0 33.3 5.2
133 0 10 10 0 0 0 33.3 5.2
134 10 10 10 0 0 10 66.7 5.2
135 10 10 0 0 0 10 50.0 5.5
136 10 0 0 0 0 10 33.3 5.2
137 10 10 10 0 0 0 50.0 5.5
138 10 10 0 10 0 10 66.7 5.2
139 10 0 10 0 0 0 33.3 5.2
140 10 0 10 0 0 10 50.0 5.5
141 10 10 10 0 0 0 50.0 5.5
142 10 0 0 0 0 10 33.3 5.2
143 10 0 0 0 0 0 16.7 4.1
144 10 0 10 10 0 10 66.7 5.2
145 10 10 10 0 0 0 50.0 5.5
146 10 0 10 0 0 0 33.3 5.2
147 10 10 0 0 0 0 33.3 5.2
148 10 0 0 0 0 0 16.7 4.1
149 0 0 0 0 0 10 16.7 4.1
150 0 10 10 0 0 0 33.3 5.2
151 10 10 0 0 0 10 50.0 5.5
152 10 0 10 0 0 0 33.3 5.2
153 10 10 10 10 10 10 100.0 0.0
154 10 0 10 0 0 0 33.3 5.2
155 10 0 0 0 0 10 33.3 5.2
156 0 0 0 0 0 0 0.0 0.0
157 10 0 10 10 0 0 50.0 5.5
158 10 0 0 10 10 10 66.7 5.2
159 10 10 0 0 0 0 33.3 5.2
160 0 0 0 0 0 0 0.0 0.0
161 0 0 10 0 0 10 33.3 5.2
162 0 0 0 0 0 0 0.0 0.0
163 0 0 0 0 0 0 0.0 0.0

332
Group I (MC items)
Student 1(10) 2(10) 3(10) 4(10) 5(10) 6(10) Means st SD st
164 10 0 0 0 0 10 33.3 5.2
165 10 0 0 0 0 0 16.7 4.1
166 10 10 10 0 10 10 83.3 4.1
167 0 10 0 0 0 10 33.3 5.2
168 10 10 0 0 0 0 33.3 5.2
169 10 0 0 0 0 0 16.7 4.1
170 0 0 10 10 0 10 50.0 5.5
171 10 0 10 0 0 0 33.3 5.2
172 0 10 10 10 0 0 50.0 5.5
173 10 10 10 10 10 10 100.0 0.0
174 10 10 10 10 10 10 100.0 0.0
175 0 0 0 0 0 10 16.7 4.1
176 10 10 10 10 0 10 83.3 4.1
177 10 10 10 10 10 10 100.0 0.0
178 10 0 0 10 10 0 50.0 5.5
179 10 10 10 10 0 0 66.7 5.2
180 10 10 10 10 0 10 83.3 4.1
181 10 10 10 10 10 10 100.0 0.0
182 10 0 10 0 10 10 66.7 5.2
183 10 10 0 10 10 10 83.3 4.1
184 10 0 10 0 0 10 50.0 5.5
185 10 10 0 0 0 10 50.0 5.5
186 10 10 10 10 0 10 83.3 4.1
187 10 10 10 10 10 10 100.0 0.0
188 10 0 0 10 0 10 50.0 5.5
189 10 10 10 0 10 0 66.7 5.2
190 10 10 0 0 10 0 50.0 5.5
191 10 10 0 10 0 0 50.0 5.5
192 10 0 10 10 10 0 66.7 5.2
193 10 0 10 10 10 10 83.3 4.1
194 10 0 0 0 10 0 33.3 5.2
195 10 0 0 10 0 0 33.3 5.2
196 10 0 10 0 0 0 33.3 5.2
197 10 0 0 0 0 0 16.7 4.1
198 10 10 0 10 10 10 83.3 4.1
199 10 0 10 10 0 10 66.7 5.2
200 10 0 10 10 10 10 83.3 4.1
201 10 10 0 10 10 10 83.3 4.1
202 10 0 10 10 0 0 50.0 5.5
203 10 0 0 0 10 10 50.0 5.5
204 10 10 10 10 10 10 100.0 0.0
205 10 10 10 10 10 10 100.0 0.0
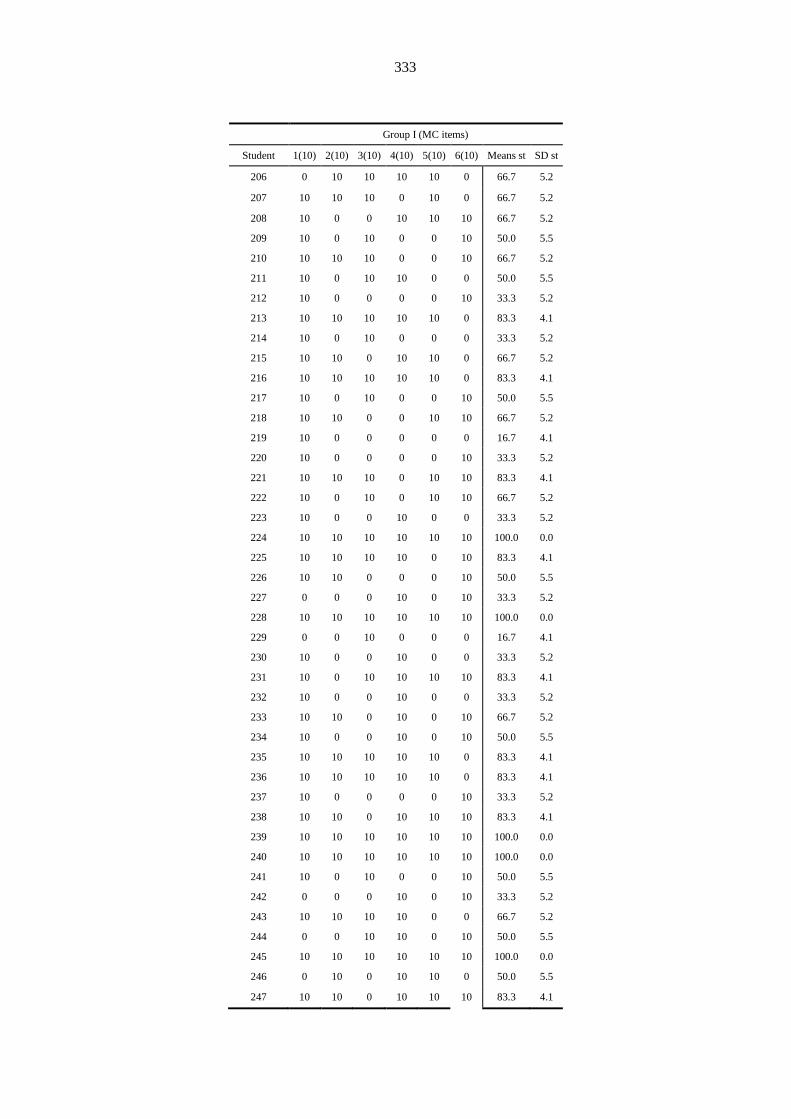
333
Group I (MC items)
Student 1(10) 2(10) 3(10) 4(10) 5(10) 6(10) Means st SD st
206 0 10 10 10 10 0 66.7 5.2
207 10 10 10 0 10 0 66.7 5.2
208 10 0 0 10 10 10 66.7 5.2
209 10 0 10 0 0 10 50.0 5.5
210 10 10 10 0 0 10 66.7 5.2
211 10 0 10 10 0 0 50.0 5.5
212 10 0 0 0 0 10 33.3 5.2
213 10 10 10 10 10 0 83.3 4.1
214 10 0 10 0 0 0 33.3 5.2
215 10 10 0 10 10 0 66.7 5.2
216 10 10 10 10 10 0 83.3 4.1
217 10 0 10 0 0 10 50.0 5.5
218 10 10 0 0 10 10 66.7 5.2
219 10 0 0 0 0 0 16.7 4.1
220 10 0 0 0 0 10 33.3 5.2
221 10 10 10 0 10 10 83.3 4.1
222 10 0 10 0 10 10 66.7 5.2
223 10 0 0 10 0 0 33.3 5.2
224 10 10 10 10 10 10 100.0 0.0
225 10 10 10 10 0 10 83.3 4.1
226 10 10 0 0 0 10 50.0 5.5
227 0 0 0 10 0 10 33.3 5.2
228 10 10 10 10 10 10 100.0 0.0
229 0 0 10 0 0 0 16.7 4.1
230 10 0 0 10 0 0 33.3 5.2
231 10 0 10 10 10 10 83.3 4.1
232 10 0 0 10 0 0 33.3 5.2
233 10 10 0 10 0 10 66.7 5.2
234 10 0 0 10 0 10 50.0 5.5
235 10 10 10 10 10 0 83.3 4.1
236 10 10 10 10 10 0 83.3 4.1
237 10 0 0 0 0 10 33.3 5.2
238 10 10 0 10 10 10 83.3 4.1
239 10 10 10 10 10 10 100.0 0.0
240 10 10 10 10 10 10 100.0 0.0
241 10 0 10 0 0 10 50.0 5.5
242 0 0 0 10 0 10 33.3 5.2
243 10 10 10 10 0 0 66.7 5.2
244 0 0 10 10 0 10 50.0 5.5
245 10 10 10 10 10 10 100.0 0.0
246 0 10 0 10 10 0 50.0 5.5
247 10 10 0 10 10 10 83.3 4.1
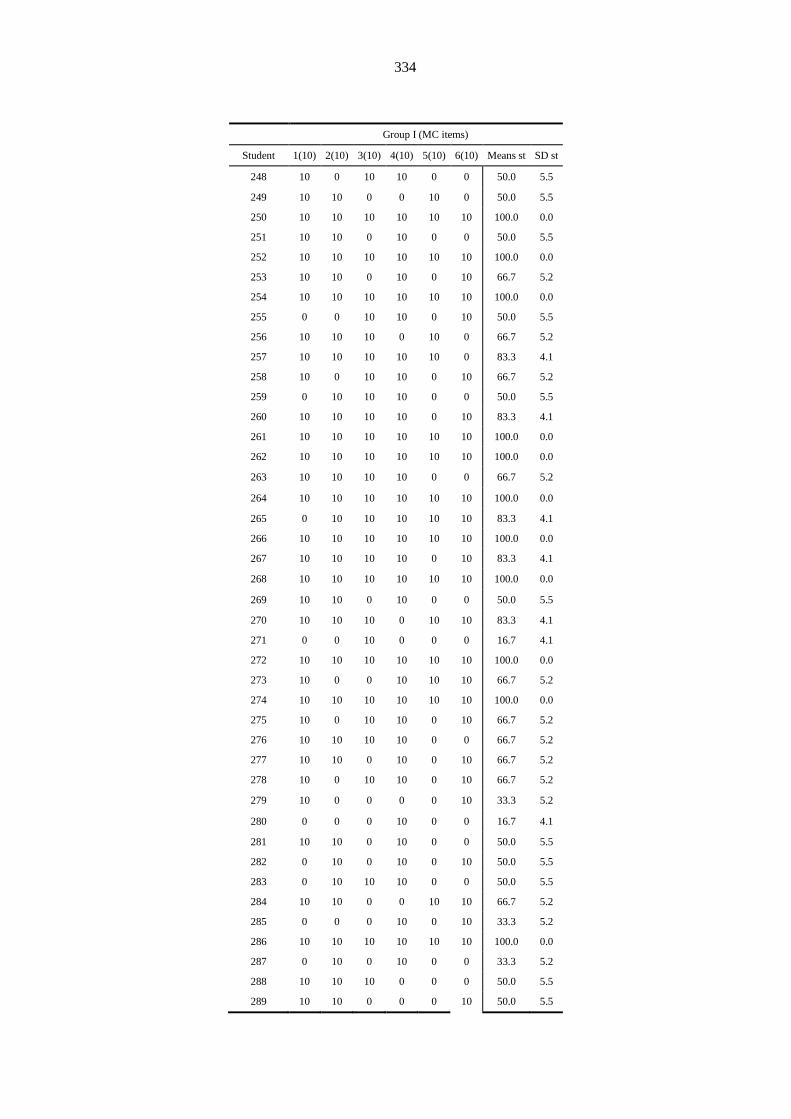
334
Group I (MC items)
Student 1(10) 2(10) 3(10) 4(10) 5(10) 6(10) Means st SD st
248 10 0 10 10 0 0 50.0 5.5
249 10 10 0 0 10 0 50.0 5.5
250 10 10 10 10 10 10 100.0 0.0
251 10 10 0 10 0 0 50.0 5.5
252 10 10 10 10 10 10 100.0 0.0
253 10 10 0 10 0 10 66.7 5.2
254 10 10 10 10 10 10 100.0 0.0
255 0 0 10 10 0 10 50.0 5.5
256 10 10 10 0 10 0 66.7 5.2
257 10 10 10 10 10 0 83.3 4.1
258 10 0 10 10 0 10 66.7 5.2
259 0 10 10 10 0 0 50.0 5.5
260 10 10 10 10 0 10 83.3 4.1
261 10 10 10 10 10 10 100.0 0.0
262 10 10 10 10 10 10 100.0 0.0
263 10 10 10 10 0 0 66.7 5.2
264 10 10 10 10 10 10 100.0 0.0
265 0 10 10 10 10 10 83.3 4.1
266 10 10 10 10 10 10 100.0 0.0
267 10 10 10 10 0 10 83.3 4.1
268 10 10 10 10 10 10 100.0 0.0
269 10 10 0 10 0 0 50.0 5.5
270 10 10 10 0 10 10 83.3 4.1
271 0 0 10 0 0 0 16.7 4.1
272 10 10 10 10 10 10 100.0 0.0
273 10 0 0 10 10 10 66.7 5.2
274 10 10 10 10 10 10 100.0 0.0
275 10 0 10 10 0 10 66.7 5.2
276 10 10 10 10 0 0 66.7 5.2
277 10 10 0 10 0 10 66.7 5.2
278 10 0 10 10 0 10 66.7 5.2
279 10 0 0 0 0 10 33.3 5.2
280 0 0 0 10 0 0 16.7 4.1
281 10 10 0 10 0 0 50.0 5.5
282 0 10 0 10 0 10 50.0 5.5
283 0 10 10 10 0 0 50.0 5.5
284 10 10 0 0 10 10 66.7 5.2
285 0 0 0 10 0 10 33.3 5.2
286 10 10 10 10 10 10 100.0 0.0
287 0 10 0 10 0 0 33.3 5.2
288 10 10 10 0 0 0 50.0 5.5
289 10 10 0 0 0 10 50.0 5.5
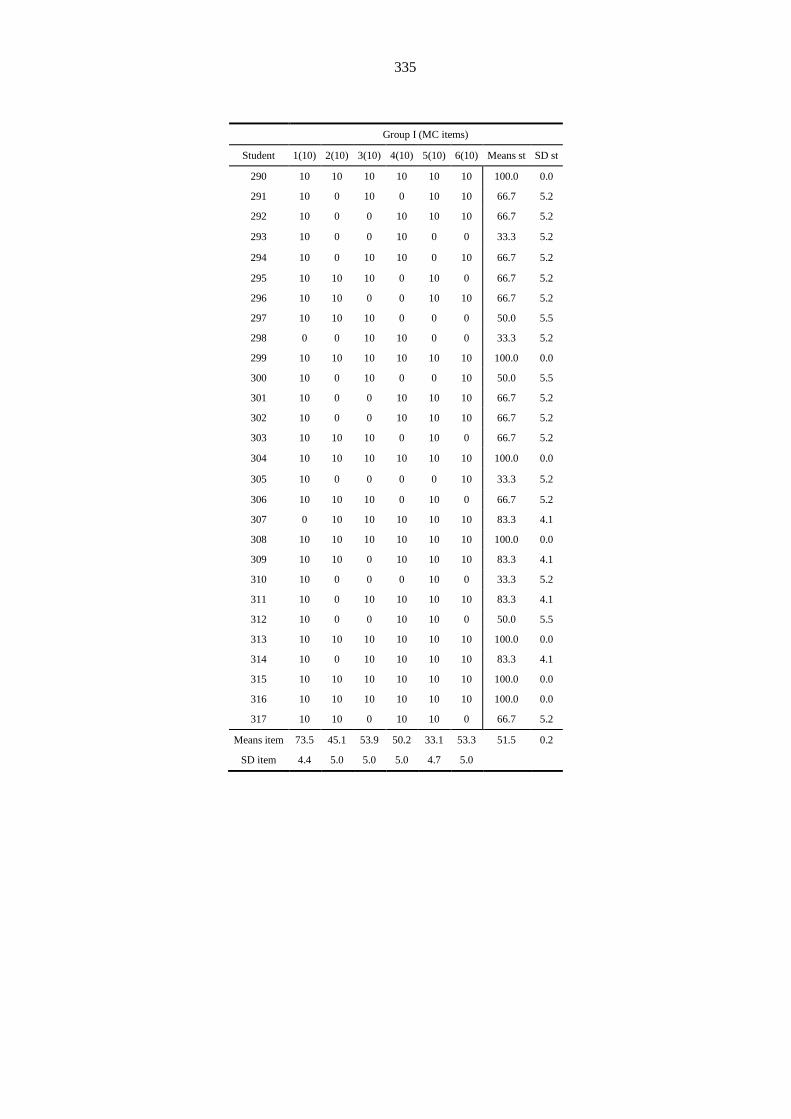
335
Group I (MC items)
Student 1(10) 2(10) 3(10) 4(10) 5(10) 6(10) Means st SD st
290 10 10 10 10 10 10 100.0 0.0
291 10 0 10 0 10 10 66.7 5.2
292 10 0 0 10 10 10 66.7 5.2
293 10 0 0 10 0 0 33.3 5.2
294 10 0 10 10 0 10 66.7 5.2
295 10 10 10 0 10 0 66.7 5.2
296 10 10 0 0 10 10 66.7 5.2
297 10 10 10 0 0 0 50.0 5.5
298 0 0 10 10 0 0 33.3 5.2
299 10 10 10 10 10 10 100.0 0.0
300 10 0 10 0 0 10 50.0 5.5
301 10 0 0 10 10 10 66.7 5.2
302 10 0 0 10 10 10 66.7 5.2
303 10 10 10 0 10 0 66.7 5.2
304 10 10 10 10 10 10 100.0 0.0
305 10 0 0 0 0 10 33.3 5.2
306 10 10 10 0 10 0 66.7 5.2
307 0 10 10 10 10 10 83.3 4.1
308 10 10 10 10 10 10 100.0 0.0
309 10 10 0 10 10 10 83.3 4.1
310 10 0 0 0 10 0 33.3 5.2
311 10 0 10 10 10 10 83.3 4.1
312 10 0 0 10 10 0 50.0 5.5
313 10 10 10 10 10 10 100.0 0.0
314 10 0 10 10 10 10 83.3 4.1
315 10 10 10 10 10 10 100.0 0.0
316 10 10 10 10 10 10 100.0 0.0
317 10 10 0 10 10 0 66.7 5.2
Means item 73.5 45.1 53.9 50.2 33.1 53.3 51.5 0.2
SD item 4.4 5.0 5.0 5.0 4.7 5.0
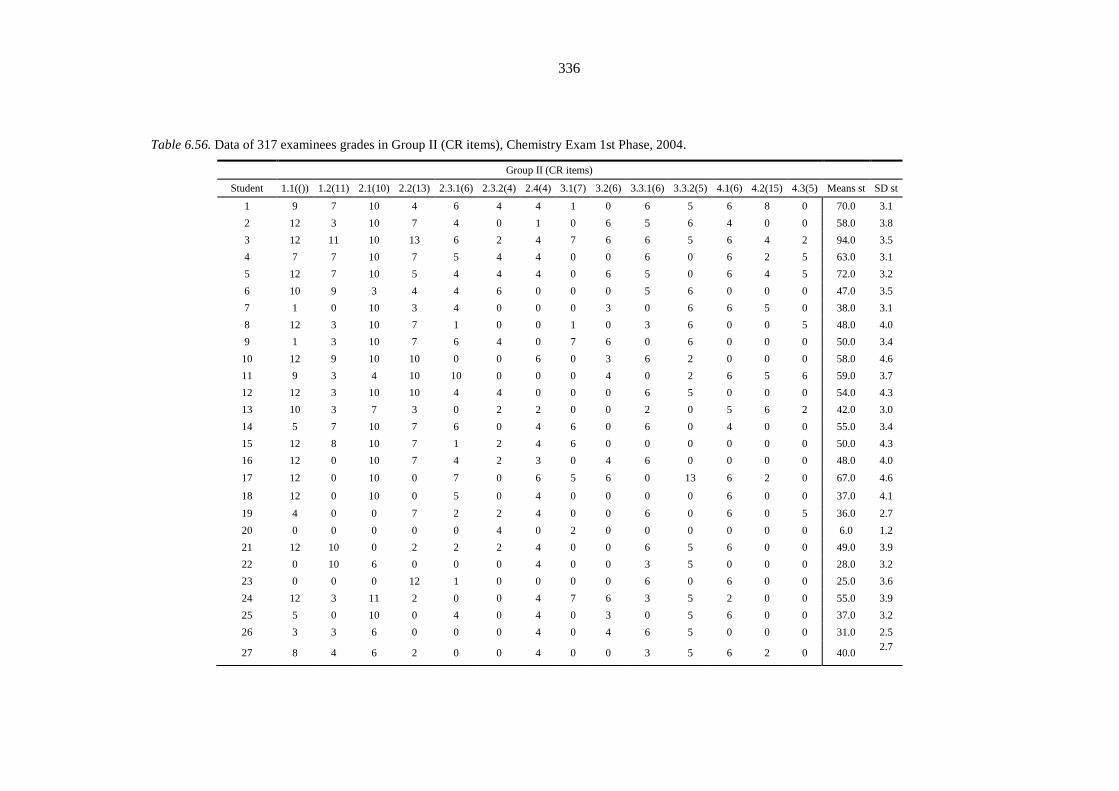
336
Table 6.56. Data of 317 examinees grades in Group II (CR items), Chemistry Exam 1st Phase, 2004.
Group II (CR items)
Student 1.1(()) 1.2(11) 2.1(10) 2.2(13) 2.3.1(6) 2.3.2(4) 2.4(4) 3.1(7) 3.2(6) 3.3.1(6) 3.3.2(5) 4.1(6) 4.2(15) 4.3(5) Means st SD st
1 9 7 10 4 6 4 4 1 0 6 5 6 8 0 70.0 3.1
2 12 3 10 7 4 0 1 0 6 5 6 4 0 0 58.0 3.8
3 12 11 10 13 6 2 4 7 6 6 5 6 4 2 94.0 3.5
4 7 7 10 7 5 4 4 0 0 6 0 6 2 5 63.0 3.1
5 12 7 10 5 4 4 4 0 6 5 0 6 4 5 72.0 3.2
6 10 9 3 4 4 6 0 0 0 5 6 0 0 0 47.0 3.5
7 1 0 10 3 4 0 0 0 3 0 6 6 5 0 38.0 3.1
8 12 3 10 7 1 0 0 1 0 3 6 0 0 5 48.0 4.0
9 1 3 10 7 6 4 0 7 6 0 6 0 0 0 50.0 3.4
10 12 9 10 10 0 0 6 0 3 6 2 0 0 0 58.0 4.6
11 9 3 4 10 10 0 0 0 4 0 2 6 5 6 59.0 3.7
12 12 3 10 10 4 4 0 0 0 6 5 0 0 0 54.0 4.3
13 10 3 7 3 0 2 2 0 0 2 0 5 6 2 42.0 3.0
14 5 7 10 7 6 0 4 6 0 6 0 4 0 0 55.0 3.4
15 12 8 10 7 1 2 4 6 0 0 0 0 0 0 50.0 4.3
16 12 0 10 7 4 2 3 0 4 6 0 0 0 0 48.0 4.0
17 12 0 10 0 7 0 6 5 6 0 13 6 2 0 67.0 4.6
18 12 0 10 0 5 0 4 0 0 0 0 6 0 0 37.0 4.1
19 4 0 0 7 2 2 4 0 0 6 0 6 0 5 36.0 2.7
20 0 0 0 0 0 4 0 2 0 0 0 0 0 0 6.0 1.2
21 12 10 0 2 2 2 4 0 0 6 5 6 0 0 49.0 3.9
22 0 10 6 0 0 0 4 0 0 3 5 0 0 0 28.0 3.2
23 0 0 0 12 1 0 0 0 0 6 0 6 0 0 25.0 3.6
24 12 3 11 2 0 0 4 7 6 3 5 2 0 0 55.0 3.9
25 5 0 10 0 4 0 4 0 3 0 5 6 0 0 37.0 3.2
26 3 3 6 0 0 0 4 0 4 6 5 0 0 0 31.0 2.5
27 8 4 6 2 0 0 4 0 0 3 5 6 2 0 40.0 2.7
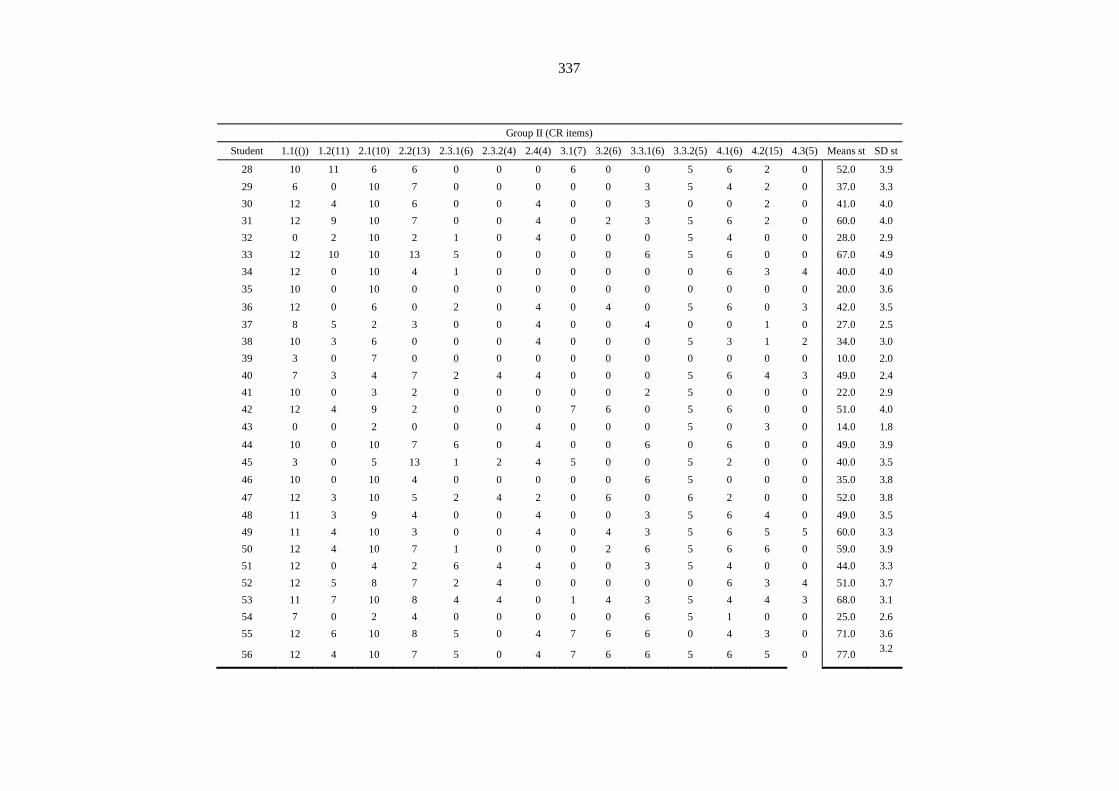
337
Group II (CR items)
Student 1.1(()) 1.2(11) 2.1(10) 2.2(13) 2.3.1(6) 2.3.2(4) 2.4(4) 3.1(7) 3.2(6) 3.3.1(6) 3.3.2(5) 4.1(6) 4.2(15) 4.3(5) Means st SD st
28 10 11 6 6 0 0 0 6 0 0 5 6 2 0 52.0 3.9
29 6 0 10 7 0 0 0 0 0 3 5 4 2 0 37.0 3.3
30 12 4 10 6 0 0 4 0 0 3 0 0 2 0 41.0 4.0
31 12 9 10 7 0 0 4 0 2 3 5 6 2 0 60.0 4.0
32 0 2 10 2 1 0 4 0 0 0 5 4 0 0 28.0 2.9
33 12 10 10 13 5 0 0 0 0 6 5 6 0 0 67.0 4.9
34 12 0 10 4 1 0 0 0 0 0 0 6 3 4 40.0 4.0
35 10 0 10 0 0 0 0 0 0 0 0 0 0 0 20.0 3.6
36 12 0 6 0 2 0 4 0 4 0 5 6 0 3 42.0 3.5
37 8 5 2 3 0 0 4 0 0 4 0 0 1 0 27.0 2.5
38 10 3 6 0 0 0 4 0 0 0 5 3 1 2 34.0 3.0
39 3 0 7 0 0 0 0 0 0 0 0 0 0 0 10.0 2.0
40 7 3 4 7 2 4 4 0 0 0 5 6 4 3 49.0 2.4
41 10 0 3 2 0 0 0 0 0 2 5 0 0 0 22.0 2.9
42 12 4 9 2 0 0 0 7 6 0 5 6 0 0 51.0 4.0
43 0 0 2 0 0 0 4 0 0 0 5 0 3 0 14.0 1.8
44 10 0 10 7 6 0 4 0 0 6 0 6 0 0 49.0 3.9
45 3 0 5 13 1 2 4 5 0 0 5 2 0 0 40.0 3.5
46 10 0 10 4 0 0 0 0 0 6 5 0 0 0 35.0 3.8
47 12 3 10 5 2 4 2 0 6 0 6 2 0 0 52.0 3.8
48 11 3 9 4 0 0 4 0 0 3 5 6 4 0 49.0 3.5
49 11 4 10 3 0 0 4 0 4 3 5 6 5 5 60.0 3.3
50 12 4 10 7 1 0 0 0 2 6 5 6 6 0 59.0 3.9
51 12 0 4 2 6 4 4 0 0 3 5 4 0 0 44.0 3.3
52 12 5 8 7 2 4 0 0 0 0 0 6 3 4 51.0 3.7
53 11 7 10 8 4 4 0 1 4 3 5 4 4 3 68.0 3.1
54 7 0 2 4 0 0 0 0 0 6 5 1 0 0 25.0 2.6
55 12 6 10 8 5 0 4 7 6 6 0 4 3 0 71.0 3.6
56 12 4 10 7 5 0 4 7 6 6 5 6 5 0 77.0 3.2

338
Group II (CR items)
Student 1.1(()) 1.2(11) 2.1(10) 2.2(13) 2.3.1(6) 2.3.2(4) 2.4(4) 3.1(7) 3.2(6) 3.3.1(6) 3.3.2(5) 4.1(6) 4.2(15) 4.3(5) Means st SD st
57 12 7 10 7 1 0 4 0 0 0 5 6 0 5 57.0 4.0
58 7 0 10 7 1 0 4 0 0 6 5 0 2 0 42.0 3.4
59 12 0 10 7 1 2 0 0 4 3 5 6 4 4 58.0 3.7
60 11 3 3 7 3 4 0 0 0 6 5 0 0 5 47.0 3.3
61 12 3 10 7 2 0 4 2 0 6 5 6 0 1 58.0 3.8
62 12 7 10 4 6 4 4 0 5 6 5 6 0 0 69.0 3.5
63 12 0 10 7 2 2 4 0 0 5 1 5 12 0 60.0 4.4
64 12 7 10 7 0 0 4 0 0 0 0 0 0 0 40.0 4.3
65 12 3 10 7 1 0 4 6 0 0 5 2 2 5 57.0 3.7
66 12 0 2 0 0 0 4 0 0 0 0 0 2 0 20.0 3.3
67 12 3 10 7 4 4 4 4 6 5 0 6 0 0 65.0 3.5
68 12 0 10 7 1 0 4 0 0 6 0 6 4 5 55.0 4.0
69 12 0 10 0 2 0 0 0 0 0 5 6 0 0 35.0 4.1
70 12 4 2 2 2 0 4 0 0 0 5 5 2 0 38.0 3.3
71 7 3 2 2 2 0 4 0 0 6 0 6 2 0 34.0 2.5
72 12 3 4 7 1 0 0 0 0 3 5 0 0 0 35.0 3.6
73 10 4 6 0 0 0 0 0 0 6 5 5 2 4 42.0 3.2
74 12 0 10 6 2 0 4 0 0 0 5 6 2 0 47.0 4.0
75 12 0 10 7 3 0 0 0 2 0 0 6 2 0 42.0 4.1
76 8 0 10 7 0 0 4 7 0 6 0 6 0 2 50.0 3.7
77 12 5 10 7 0 0 4 0 0 4 0 0 0 2 44.0 4.1
78 12 0 9 2 6 0 4 0 6 6 0 6 0 0 51.0 4.0
79 6 9 10 0 4 0 4 0 0 0 0 6 1 5 45.0 3.6
80 4 3 6 2 2 2 4 0 0 3 5 6 3 0 40.0 2.0
81 12 7 3 2 0 0 4 0 0 6 5 6 3 0 48.0 3.5
82 10 9 10 6 2 4 0 0 0 6 5 0 2 5 59.0 3.7
83 7 5 6 4 4 2 4 1 0 3 0 6 1 0 43.0 2.4
84 12 3 10 13 1 0 4 0 4 6 5 6 9 0 73.0 4.4
85 9 9 10 6 4 4 1 2 6 5 4 0 8 0 68.0 3.3

339
Group II (CR items)
Student 1.1(()) 1.2(11) 2.1(10) 2.2(13) 2.3.1(6) 2.3.2(4) 2.4(4) 3.1(7) 3.2(6) 3.3.1(6) 3.3.2(5) 4.1(6) 4.2(15) 4.3(5) Means st SD st
86 12 0 10 5 1 0 4 0 6 0 0 0 0 0 38.0 4.1
87 12 0 10 3 1 0 4 0 6 6 5 0 2 0 49.0 3.9
88 12 0 10 7 2 4 4 0 4 6 5 6 0 0 60.0 3.8
89 12 11 4 7 0 0 0 7 6 0 5 0 0 0 52.0 4.4
90 12 9 10 2 1 4 0 7 6 0 0 6 2 0 59.0 4.1
91 12 7 6 7 6 0 4 7 6 3 5 0 0 0 63.0 3.6
92 12 11 10 0 0 4 0 0 6 0 0 0 0 0 43.0 4.7
93 12 7 10 3 2 4 4 0 0 6 5 6 4 0 63.0 3.6
94 6 0 10 2 3 4 4 0 0 0 5 6 2 5 47.0 3.0
95 12 3 3 4 5 0 4 0 0 0 0 6 0 0 37.0 3.5
96 6 11 10 6 4 4 4 0 0 6 0 6 5 5 67.0 3.3
97 12 11 10 7 0 0 4 0 0 6 0 5 0 0 55.0 4.6
98 12 7 10 7 1 0 0 0 0 3 5 6 0 5 56.0 4.1
99 12 7 10 13 0 0 4 0 0 6 0 0 0 5 57.0 4.9
100 12 11 10 13 4 4 4 0 6 6 0 6 0 2 78.0 4.5
101 8 0 10 9 4 4 4 0 4 5 5 6 0 0 59.0 3.4
102 12 6 10 6 1 4 4 7 0 3 5 6 0 3 67.0 3.5
103 7 7 10 3 3 0 4 0 0 0 5 0 0 0 39.0 3.4
104 6 0 9 2 1 0 4 0 0 6 5 6 0 0 39.0 3.1
105 3 0 6 3 1 0 1 0 0 0 5 6 7 3 35.0 2.6
106 12 8 10 7 6 4 4 0 2 3 5 6 0 5 72.0 3.4
107 12 9 10 7 5 4 4 0 4 6 5 6 2 0 74.0 3.5
108 12 5 10 7 1 0 0 0 0 6 5 6 0 3 55.0 4.0
109 12 4 10 7 4 2 4 0 6 3 5 6 0 0 63.0 3.6
110 12 3 10 2 5 0 0 0 4 3 5 6 0 3 53.0 3.7
111 12 4 10 7 6 0 0 0 0 6 5 6 0 5 61.0 3.9
112 12 9 10 13 4 4 4 0 6 0 5 5 0 0 72.0 4.5
113 4 0 10 7 1 0 4 0 0 6 5 6 3 0 46.0 3.2
114 12 8 10 10 0 4 4 0 0 3 0 6 2 0 59.0 4.3
115 12 11 10 2 3 2 4 0 0 0 5 5 4 5 63.0 4.0
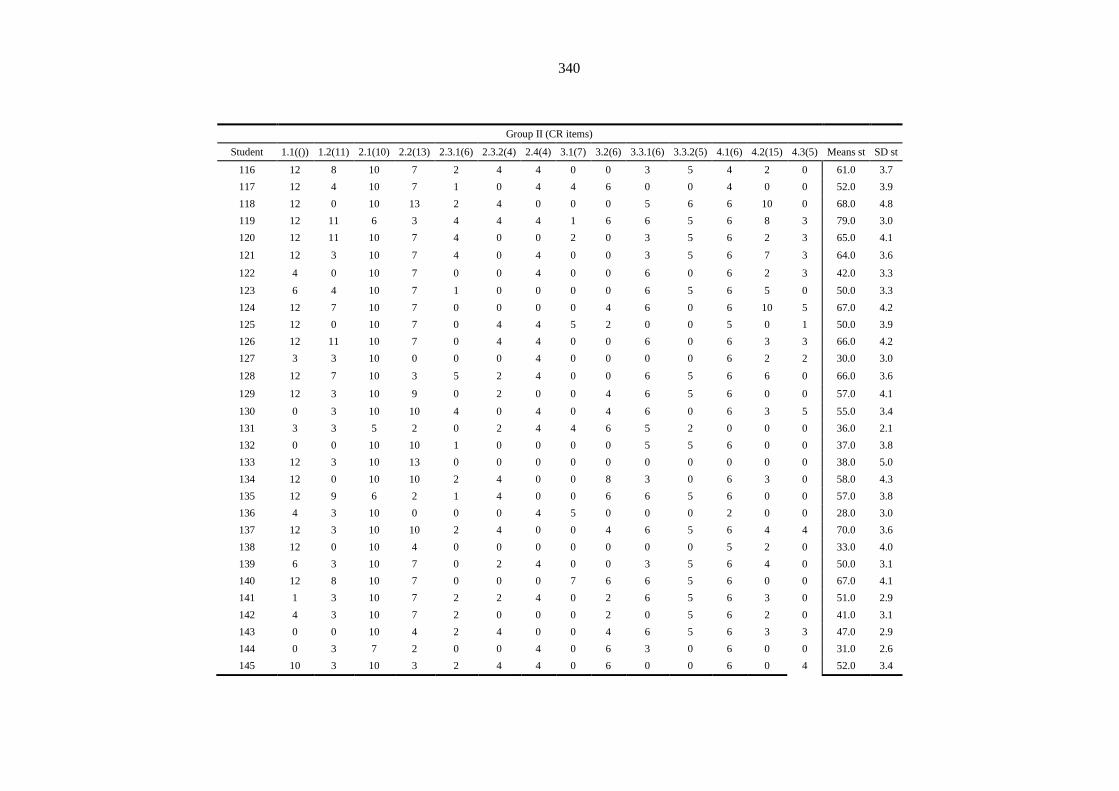
340
Group II (CR items)
Student 1.1(()) 1.2(11) 2.1(10) 2.2(13) 2.3.1(6) 2.3.2(4) 2.4(4) 3.1(7) 3.2(6) 3.3.1(6) 3.3.2(5) 4.1(6) 4.2(15) 4.3(5) Means st SD st
116 12 8 10 7 2 4 4 0 0 3 5 4 2 0 61.0 3.7
117 12 4 10 7 1 0 4 4 6 0 0 4 0 0 52.0 3.9
118 12 0 10 13 2 4 0 0 0 5 6 6 10 0 68.0 4.8
119 12 11 6 3 4 4 4 1 6 6 5 6 8 3 79.0 3.0
120 12 11 10 7 4 0 0 2 0 3 5 6 2 3 65.0 4.1
121 12 3 10 7 4 0 4 0 0 3 5 6 7 3 64.0 3.6
122 4 0 10 7 0 0 4 0 0 6 0 6 2 3 42.0 3.3
123 6 4 10 7 1 0 0 0 0 6 5 6 5 0 50.0 3.3
124 12 7 10 7 0 0 0 0 4 6 0 6 10 5 67.0 4.2
125 12 0 10 7 0 4 4 5 2 0 0 5 0 1 50.0 3.9
126 12 11 10 7 0 4 4 0 0 6 0 6 3 3 66.0 4.2
127 3 3 10 0 0 0 4 0 0 0 0 6 2 2 30.0 3.0
128 12 7 10 3 5 2 4 0 0 6 5 6 6 0 66.0 3.6
129 12 3 10 9 0 2 0 0 4 6 5 6 0 0 57.0 4.1
130 0 3 10 10 4 0 4 0 4 6 0 6 3 5 55.0 3.4
131 3 3 5 2 0 2 4 4 6 5 2 0 0 0 36.0 2.1
132 0 0 10 10 1 0 0 0 0 5 5 6 0 0 37.0 3.8
133 12 3 10 13 0 0 0 0 0 0 0 0 0 0 38.0 5.0
134 12 0 10 10 2 4 0 0 8 3 0 6 3 0 58.0 4.3
135 12 9 6 2 1 4 0 0 6 6 5 6 0 0 57.0 3.8
136 4 3 10 0 0 0 4 5 0 0 0 2 0 0 28.0 3.0
137 12 3 10 10 2 4 0 0 4 6 5 6 4 4 70.0 3.6
138 12 0 10 4 0 0 0 0 0 0 0 5 2 0 33.0 4.0
139 6 3 10 7 0 2 4 0 0 3 5 6 4 0 50.0 3.1
140 12 8 10 7 0 0 0 7 6 6 5 6 0 0 67.0 4.1
141 1 3 10 7 2 2 4 0 2 6 5 6 3 0 51.0 2.9
142 4 3 10 7 2 0 0 0 2 0 5 6 2 0 41.0 3.1
143 0 0 10 4 2 4 0 0 4 6 5 6 3 3 47.0 2.9
144 0 3 7 2 0 0 4 0 6 3 0 6 0 0 31.0 2.6
145 10 3 10 3 2 4 4 0 6 0 0 6 0 4 52.0 3.4
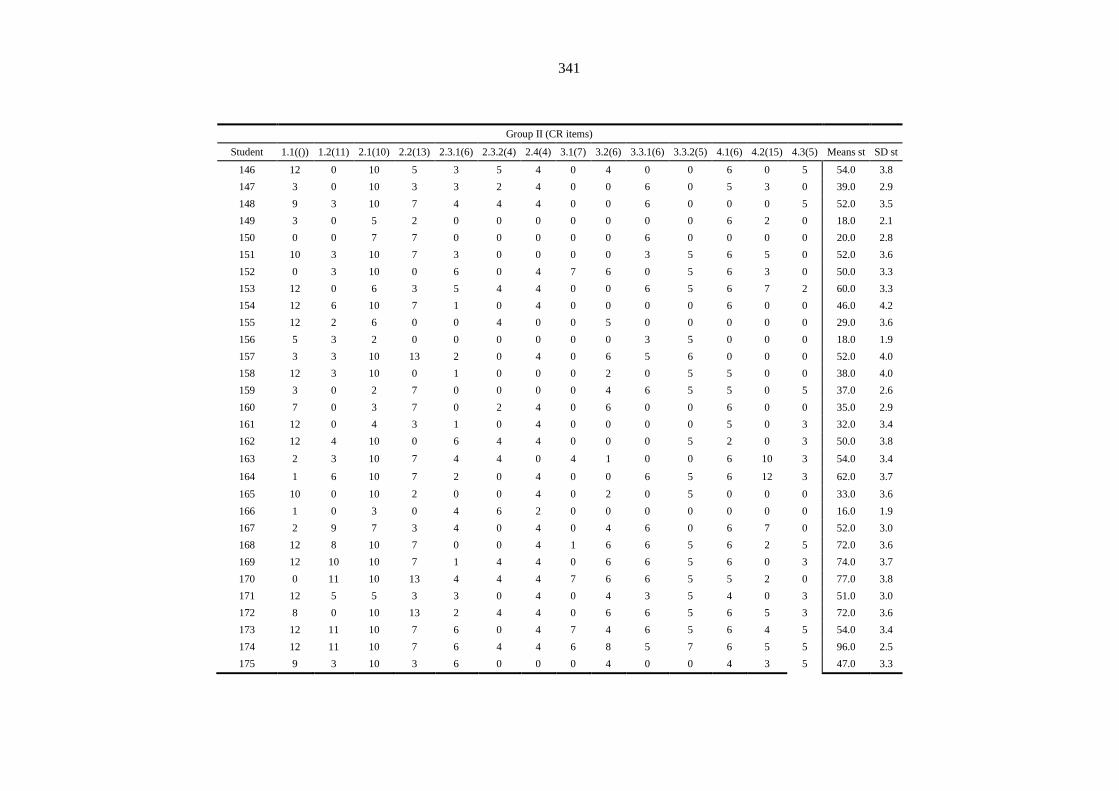
341
Group II (CR items)
Student 1.1(()) 1.2(11) 2.1(10) 2.2(13) 2.3.1(6) 2.3.2(4) 2.4(4) 3.1(7) 3.2(6) 3.3.1(6) 3.3.2(5) 4.1(6) 4.2(15) 4.3(5) Means st SD st
146 12 0 10 5 3 5 4 0 4 0 0 6 0 5 54.0 3.8
147 3 0 10 3 3 2 4 0 0 6 0 5 3 0 39.0 2.9
148 9 3 10 7 4 4 4 0 0 6 0 0 0 5 52.0 3.5
149 3 0 5 2 0 0 0 0 0 0 0 6 2 0 18.0 2.1
150 0 0 7 7 0 0 0 0 0 6 0 0 0 0 20.0 2.8
151 10 3 10 7 3 0 0 0 0 3 5 6 5 0 52.0 3.6
152 0 3 10 0 6 0 4 7 6 0 5 6 3 0 50.0 3.3
153 12 0 6 3 5 4 4 0 0 6 5 6 7 2 60.0 3.3
154 12 6 10 7 1 0 4 0 0 0 0 6 0 0 46.0 4.2
155 12 2 6 0 0 4 0 0 5 0 0 0 0 0 29.0 3.6
156 5 3 2 0 0 0 0 0 0 3 5 0 0 0 18.0 1.9
157 3 3 10 13 2 0 4 0 6 5 6 0 0 0 52.0 4.0
158 12 3 10 0 1 0 0 0 2 0 5 5 0 0 38.0 4.0
159 3 0 2 7 0 0 0 0 4 6 5 5 0 5 37.0 2.6
160 7 0 3 7 0 2 4 0 6 0 0 6 0 0 35.0 2.9
161 12 0 4 3 1 0 4 0 0 0 0 5 0 3 32.0 3.4
162 12 4 10 0 6 4 4 0 0 0 5 2 0 3 50.0 3.8
163 2 3 10 7 4 4 0 4 1 0 0 6 10 3 54.0 3.4
164 1 6 10 7 2 0 4 0 0 6 5 6 12 3 62.0 3.7
165 10 0 10 2 0 0 4 0 2 0 5 0 0 0 33.0 3.6
166 1 0 3 0 4 6 2 0 0 0 0 0 0 0 16.0 1.9
167 2 9 7 3 4 0 4 0 4 6 0 6 7 0 52.0 3.0
168 12 8 10 7 0 0 4 1 6 6 5 6 2 5 72.0 3.6
169 12 10 10 7 1 4 4 0 6 6 5 6 0 3 74.0 3.7
170 0 11 10 13 4 4 4 7 6 6 5 5 2 0 77.0 3.8
171 12 5 5 3 3 0 4 0 4 3 5 4 0 3 51.0 3.0
172 8 0 10 13 2 4 4 0 6 6 5 6 5 3 72.0 3.6
173 12 11 10 7 6 0 4 7 4 6 5 6 4 5 54.0 3.4
174 12 11 10 7 6 4 4 6 8 5 7 6 5 5 96.0 2.5
175 9 3 10 3 6 0 0 0 4 0 0 4 3 5 47.0 3.3
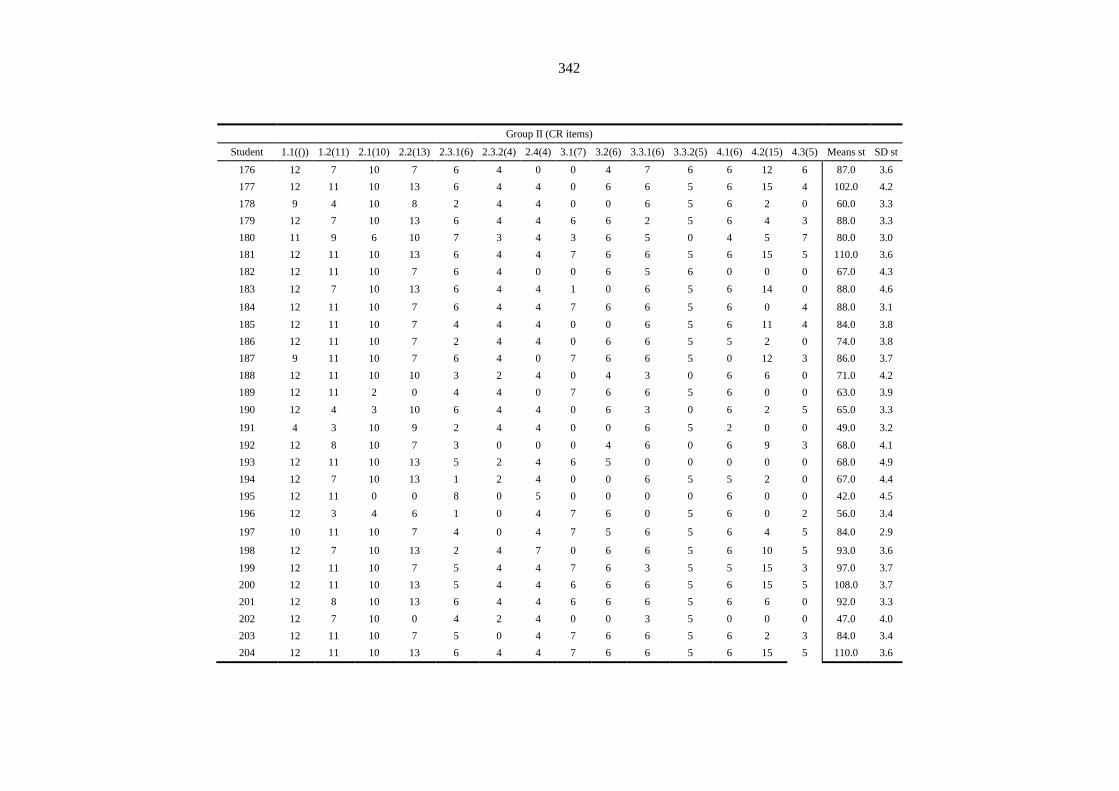
342
Group II (CR items)
Student 1.1(()) 1.2(11) 2.1(10) 2.2(13) 2.3.1(6) 2.3.2(4) 2.4(4) 3.1(7) 3.2(6) 3.3.1(6) 3.3.2(5) 4.1(6) 4.2(15) 4.3(5) Means st SD st
176 12 7 10 7 6 4 0 0 4 7 6 6 12 6 87.0 3.6
177 12 11 10 13 6 4 4 0 6 6 5 6 15 4 102.0 4.2
178 9 4 10 8 2 4 4 0 0 6 5 6 2 0 60.0 3.3
179 12 7 10 13 6 4 4 6 6 2 5 6 4 3 88.0 3.3
180 11 9 6 10 7 3 4 3 6 5 0 4 5 7 80.0 3.0
181 12 11 10 13 6 4 4 7 6 6 5 6 15 5 110.0 3.6
182 12 11 10 7 6 4 0 0 6 5 6 0 0 0 67.0 4.3
183 12 7 10 13 6 4 4 1 0 6 5 6 14 0 88.0 4.6
184 12 11 10 7 6 4 4 7 6 6 5 6 0 4 88.0 3.1
185 12 11 10 7 4 4 4 0 0 6 5 6 11 4 84.0 3.8
186 12 11 10 7 2 4 4 0 6 6 5 5 2 0 74.0 3.8
187 9 11 10 7 6 4 0 7 6 6 5 0 12 3 86.0 3.7
188 12 11 10 10 3 2 4 0 4 3 0 6 6 0 71.0 4.2
189 12 11 2 0 4 4 0 7 6 6 5 6 0 0 63.0 3.9
190 12 4 3 10 6 4 4 0 6 3 0 6 2 5 65.0 3.3
191 4 3 10 9 2 4 4 0 0 6 5 2 0 0 49.0 3.2
192 12 8 10 7 3 0 0 0 4 6 0 6 9 3 68.0 4.1
193 12 11 10 13 5 2 4 6 5 0 0 0 0 0 68.0 4.9
194 12 7 10 13 1 2 4 0 0 6 5 5 2 0 67.0 4.4
195 12 11 0 0 8 0 5 0 0 0 0 6 0 0 42.0 4.5
196 12 3 4 6 1 0 4 7 6 0 5 6 0 2 56.0 3.4
197 10 11 10 7 4 0 4 7 5 6 5 6 4 5 84.0 2.9
198 12 7 10 13 2 4 7 0 6 6 5 6 10 5 93.0 3.6
199 12 11 10 7 5 4 4 7 6 3 5 5 15 3 97.0 3.7
200 12 11 10 13 5 4 4 6 6 6 5 6 15 5 108.0 3.7
201 12 8 10 13 6 4 4 6 6 6 5 6 6 0 92.0 3.3
202 12 7 10 0 4 2 4 0 0 3 5 0 0 0 47.0 4.0
203 12 11 10 7 5 0 4 7 6 6 5 6 2 3 84.0 3.4
204 12 11 10 13 6 4 4 7 6 6 5 6 15 5 110.0 3.6
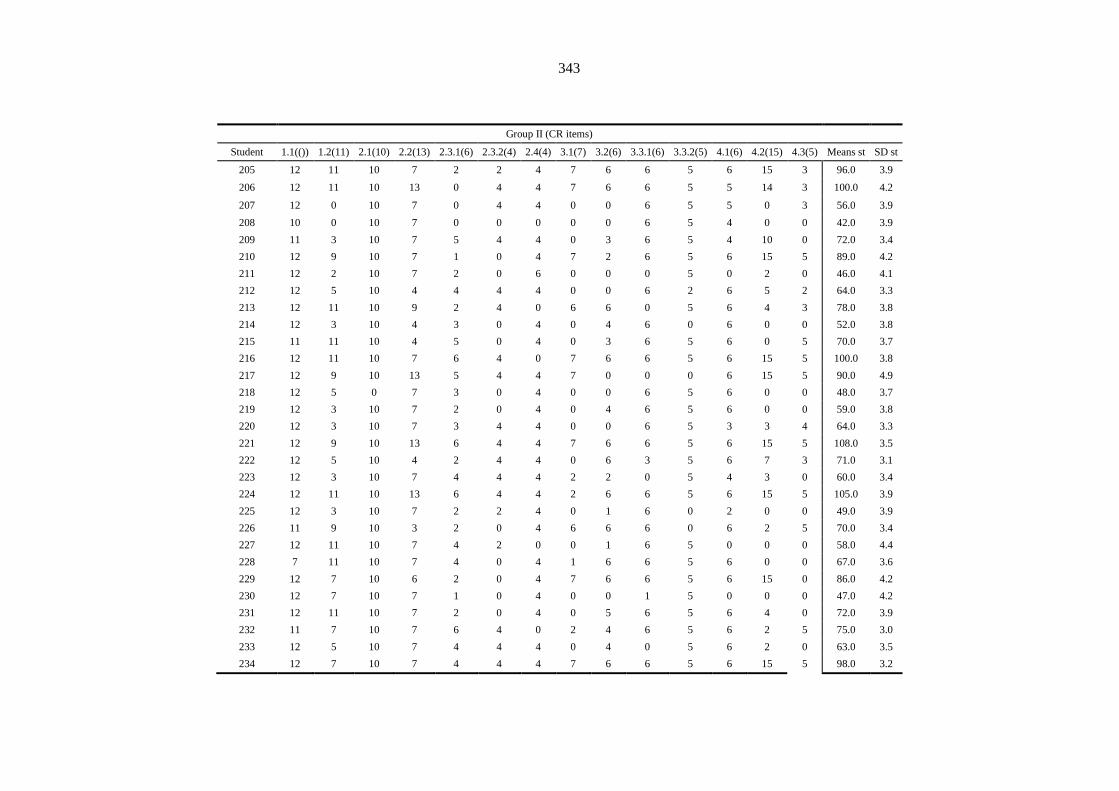
343
Group II (CR items)
Student 1.1(()) 1.2(11) 2.1(10) 2.2(13) 2.3.1(6) 2.3.2(4) 2.4(4) 3.1(7) 3.2(6) 3.3.1(6) 3.3.2(5) 4.1(6) 4.2(15) 4.3(5) Means st SD st
205 12 11 10 7 2 2 4 7 6 6 5 6 15 3 96.0 3.9
206 12 11 10 13 0 4 4 7 6 6 5 5 14 3 100.0 4.2
207 12 0 10 7 0 4 4 0 0 6 5 5 0 3 56.0 3.9
208 10 0 10 7 0 0 0 0 0 6 5 4 0 0 42.0 3.9
209 11 3 10 7 5 4 4 0 3 6 5 4 10 0 72.0 3.4
210 12 9 10 7 1 0 4 7 2 6 5 6 15 5 89.0 4.2
211 12 2 10 7 2 0 6 0 0 0 5 0 2 0 46.0 4.1
212 12 5 10 4 4 4 4 0 0 6 2 6 5 2 64.0 3.3
213 12 11 10 9 2 4 0 6 6 0 5 6 4 3 78.0 3.8
214 12 3 10 4 3 0 4 0 4 6 0 6 0 0 52.0 3.8
215 11 11 10 4 5 0 4 0 3 6 5 6 0 5 70.0 3.7
216 12 11 10 7 6 4 0 7 6 6 5 6 15 5 100.0 3.8
217 12 9 10 13 5 4 4 7 0 0 0 6 15 5 90.0 4.9
218 12 5 0 7 3 0 4 0 0 6 5 6 0 0 48.0 3.7
219 12 3 10 7 2 0 4 0 4 6 5 6 0 0 59.0 3.8
220 12 3 10 7 3 4 4 0 0 6 5 3 3 4 64.0 3.3
221 12 9 10 13 6 4 4 7 6 6 5 6 15 5 108.0 3.5
222 12 5 10 4 2 4 4 0 6 3 5 6 7 3 71.0 3.1
223 12 3 10 7 4 4 4 2 2 0 5 4 3 0 60.0 3.4
224 12 11 10 13 6 4 4 2 6 6 5 6 15 5 105.0 3.9
225 12 3 10 7 2 2 4 0 1 6 0 2 0 0 49.0 3.9
226 11 9 10 3 2 0 4 6 6 6 0 6 2 5 70.0 3.4
227 12 11 10 7 4 2 0 0 1 6 5 0 0 0 58.0 4.4
228 7 11 10 7 4 0 4 1 6 6 5 6 0 0 67.0 3.6
229 12 7 10 6 2 0 4 7 6 6 5 6 15 0 86.0 4.2
230 12 7 10 7 1 0 4 0 0 1 5 0 0 0 47.0 4.2
231 12 11 10 7 2 0 4 0 5 6 5 6 4 0 72.0 3.9
232 11 7 10 7 6 4 0 2 4 6 5 6 2 5 75.0 3.0
233 12 5 10 7 4 4 4 0 4 0 5 6 2 0 63.0 3.5
234 12 7 10 7 4 4 4 7 6 6 5 6 15 5 98.0 3.2

344
Group II (CR items)
Student 1.1(()) 1.2(11) 2.1(10) 2.2(13) 2.3.1(6) 2.3.2(4) 2.4(4) 3.1(7) 3.2(6) 3.3.1(6) 3.3.2(5) 4.1(6) 4.2(15) 4.3(5) Means st SD st
235 12 11 10 7 4 0 4 7 6 6 5 6 2 0 80.0 3.7
236 12 11 10 13 6 4 4 7 0 6 0 6 4 5 88.0 4.0
237 10 7 10 6 6 4 4 0 2 4 0 6 4 4 67.0 3.0
238 12 11 10 6 4 4 4 7 6 6 5 6 2 3 86.0 3.0
239 12 11 10 13 4 4 4 7 6 6 5 6 15 5 108.0 3.7
240 12 7 10 7 4 0 4 7 6 6 5 6 2 4 80.0 3.0
241 12 7 10 7 4 4 4
0 6 5 6 10 4 79.0 3.2
242 12 9 10 7 1 4 0 6 0 0 0 6 6 4 65.0 4.0
243 12 11 10 7 6 4 4 7 6 6 5 6 2 3 89.0 2.9
244 12 7 10 7 6 4 4 5 0 6 5 6 15 2 89.0 3.9
245 12 11 10 12 4 4 4 6 7 6 5 6 15 5 107.0 3.6
246 12 4 10 6 4 4 4 0 6 6 5 6 4 5 76.0 2.8
247 12 9 10 6 6 4 4 7 6 6 5 6 13 5 99.0 2.8
248 12 10 10 2 6 4 4 7 6 3 5 6 15 3 93.0 3.8
249 12 8 10 7 4 0 4 7 6 6 5 6 15 5 95.0 3.7
250 12 11 10 13 6 4 4 7 6 6 5 6 7 5 102.0 3.0
251 12 11 10 7 2 0 4 0 0 6 0 6 0 0 58.0 4.5
252 12 11 10 13 6 4 4 7 4 6 5 6 15 2 105.0 4.0
253 12 11 10 7 3 4 4 7 6 6 5 6 4 5 90.0 2.8
254 12 11 10 13 6 4 4 7 6 6 5 6 15 5 110.0 3.6
255 12 5 10 7 4 4 4 0 0 6 5 6 12 0 75.0 4.0
256 12 9 10 7 6 4 4 0 0 0 0 6 0 0 58.0 4.3
257 12 8 10 7 5 0 4 7 6 6 5 6 0 5 81.0 3.2
258 12 11 6 5 4 4 0 6 6 6 0 6 0 3 69.0 3.6
259 12 11 10 10 2 0 4 7 6 6 5 6 7 5 91.0 3.4
260 12 9 10 13 3 0 4 7 6 6 5 6 4 5 90.0 3.5
261 12 7 10 13 4 2 0 7 6 6 0 6 15 5 93.0 4.6
262 12 11 10 7 6 4 4 7 6 6 5 6 15 5 104.0 3.3
263 12 4 10 13 2 4 4 1 6 6 5 5 0 0 72.0 4.1
264 12 7 10 12 6 4 4 0 6 6 5 6 15 5 98.0 3.9
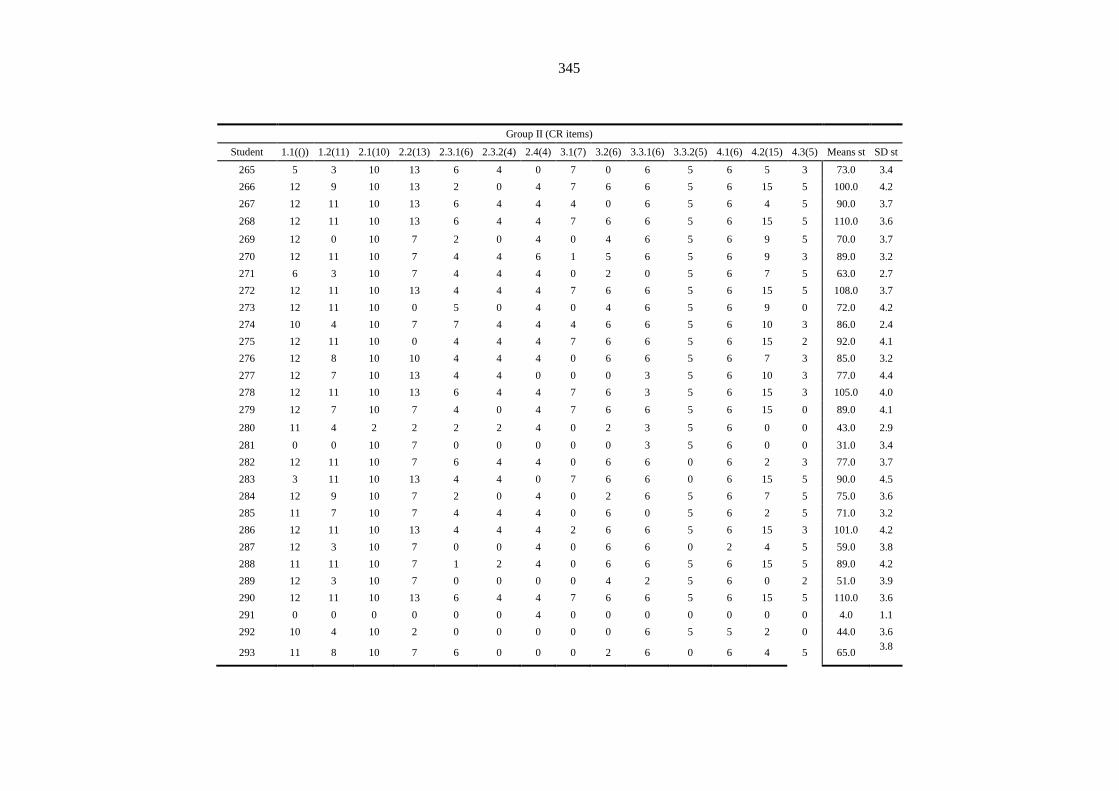
345
Group II (CR items)
Student 1.1(()) 1.2(11) 2.1(10) 2.2(13) 2.3.1(6) 2.3.2(4) 2.4(4) 3.1(7) 3.2(6) 3.3.1(6) 3.3.2(5) 4.1(6) 4.2(15) 4.3(5) Means st SD st
265 5 3 10 13 6 4 0 7 0 6 5 6 5 3 73.0 3.4
266 12 9 10 13 2 0 4 7 6 6 5 6 15 5 100.0 4.2
267 12 11 10 13 6 4 4 4 0 6 5 6 4 5 90.0 3.7
268 12 11 10 13 6 4 4 7 6 6 5 6 15 5 110.0 3.6
269 12 0 10 7 2 0 4 0 4 6 5 6 9 5 70.0 3.7
270 12 11 10 7 4 4 6 1 5 6 5 6 9 3 89.0 3.2
271 6 3 10 7 4 4 4 0 2 0 5 6 7 5 63.0 2.7
272 12 11 10 13 4 4 4 7 6 6 5 6 15 5 108.0 3.7
273 12 11 10 0 5 0 4 0 4 6 5 6 9 0 72.0 4.2
274 10 4 10 7 7 4 4 4 6 6 5 6 10 3 86.0 2.4
275 12 11 10 0 4 4 4 7 6 6 5 6 15 2 92.0 4.1
276 12 8 10 10 4 4 4 0 6 6 5 6 7 3 85.0 3.2
277 12 7 10 13 4 4 0 0 0 3 5 6 10 3 77.0 4.4
278 12 11 10 13 6 4 4 7 6 3 5 6 15 3 105.0 4.0
279 12 7 10 7 4 0 4 7 6 6 5 6 15 0 89.0 4.1
280 11 4 2 2 2 2 4 0 2 3 5 6 0 0 43.0 2.9
281 0 0 10 7 0 0 0 0 0 3 5 6 0 0 31.0 3.4
282 12 11 10 7 6 4 4 0 6 6 0 6 2 3 77.0 3.7
283 3 11 10 13 4 4 0 7 6 6 0 6 15 5 90.0 4.5
284 12 9 10 7 2 0 4 0 2 6 5 6 7 5 75.0 3.6
285 11 7 10 7 4 4 4 0 6 0 5 6 2 5 71.0 3.2
286 12 11 10 13 4 4 4 2 6 6 5 6 15 3 101.0 4.2
287 12 3 10 7 0 0 4 0 6 6 0 2 4 5 59.0 3.8
288 11 11 10 7 1 2 4 0 6 6 5 6 15 5 89.0 4.2
289 12 3 10 7 0 0 0 0 4 2 5 6 0 2 51.0 3.9
290 12 11 10 13 6 4 4 7 6 6 5 6 15 5 110.0 3.6
291 0 0 0 0 0 0 4 0 0 0 0 0 0 0 4.0 1.1
292 10 4 10 2 0 0 0 0 0 6 5 5 2 0 44.0 3.6
293 11 8 10 7 6 0 0 0 2 6 0 6 4 5 65.0 3.8
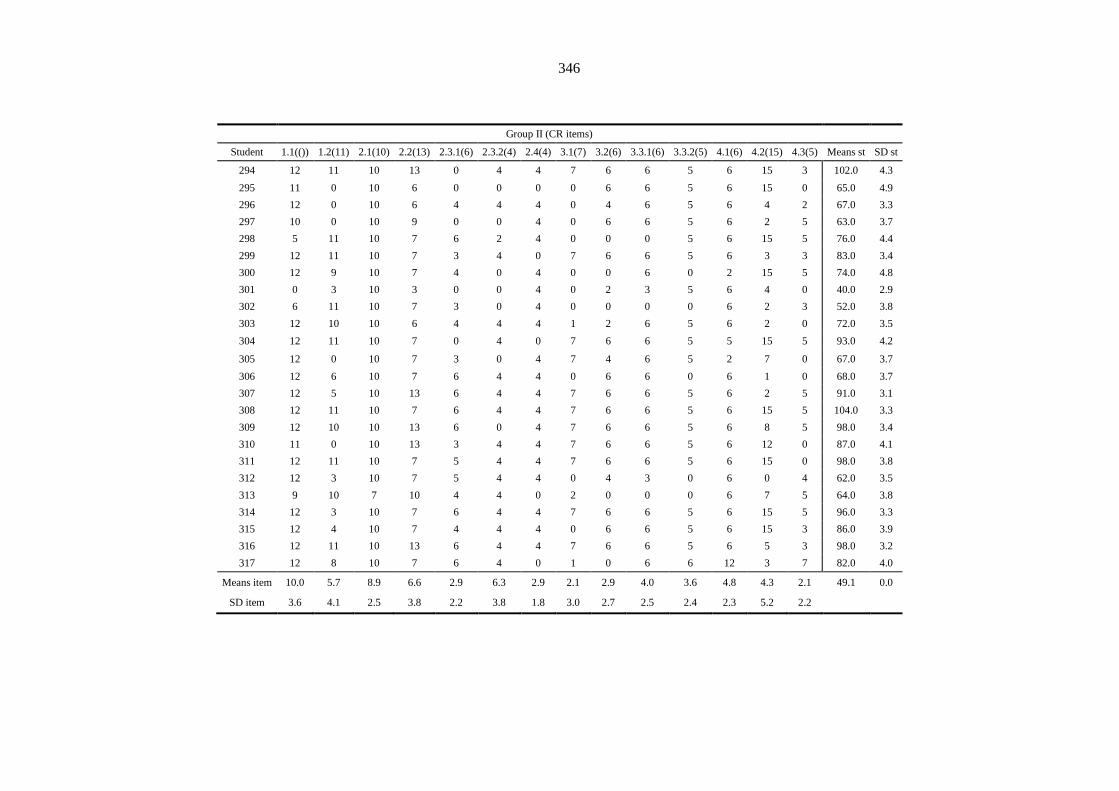
346
Group II (CR items)
Student 1.1(()) 1.2(11) 2.1(10) 2.2(13) 2.3.1(6) 2.3.2(4) 2.4(4) 3.1(7) 3.2(6) 3.3.1(6) 3.3.2(5) 4.1(6) 4.2(15) 4.3(5) Means st SD st
294 12 11 10 13 0 4 4 7 6 6 5 6 15 3 102.0 4.3
295 11 0 10 6 0 0 0 0 6 6 5 6 15 0 65.0 4.9
296 12 0 10 6 4 4 4 0 4 6 5 6 4 2 67.0 3.3
297 10 0 10 9 0 0 4 0 6 6 5 6 2 5 63.0 3.7
298 5 11 10 7 6 2 4 0 0 0 5 6 15 5 76.0 4.4
299 12 11 10 7 3 4 0 7 6 6 5 6 3 3 83.0 3.4
300 12 9 10 7 4 0 4 0 0 6 0 2 15 5 74.0 4.8
301 0 3 10 3 0 0 4 0 2 3 5 6 4 0 40.0 2.9
302 6 11 10 7 3 0 4 0 0 0 0 6 2 3 52.0 3.8
303 12 10 10 6 4 4 4 1 2 6 5 6 2 0 72.0 3.5
304 12 11 10 7 0 4 0 7 6 6 5 5 15 5 93.0 4.2
305 12 0 10 7 3 0 4 7 4 6 5 2 7 0 67.0 3.7
306 12 6 10 7 6 4 4 0 6 6 0 6 1 0 68.0 3.7
307 12 5 10 13 6 4 4 7 6 6 5 6 2 5 91.0 3.1
308 12 11 10 7 6 4 4 7 6 6 5 6 15 5 104.0 3.3
309 12 10 10 13 6 0 4 7 6 6 5 6 8 5 98.0 3.4
310 11 0 10 13 3 4 4 7 6 6 5 6 12 0 87.0 4.1
311 12 11 10 7 5 4 4 7 6 6 5 6 15 0 98.0 3.8
312 12 3 10 7 5 4 4 0 4 3 0 6 0 4 62.0 3.5
313 9 10 7 10 4 4 0 2 0 0 0 6 7 5 64.0 3.8
314 12 3 10 7 6 4 4 7 6 6 5 6 15 5 96.0 3.3
315 12 4 10 7 4 4 4 0 6 6 5 6 15 3 86.0 3.9
316 12 11 10 13 6 4 4 7 6 6 5 6 5 3 98.0 3.2
317 12 8 10 7 6 4 0 1 0 6 6 12 3 7 82.0 4.0
Means item 10.0 5.7 8.9 6.6 2.9 6.3 2.9 2.1 2.9 4.0 3.6 4.8 4.3 2.1 49.1 0.0
SD item 3.6 4.1 2.5 3.8 2.2 3.8 1.8 3.0 2.7 2.5 2.4 2.3 5.2 2.2
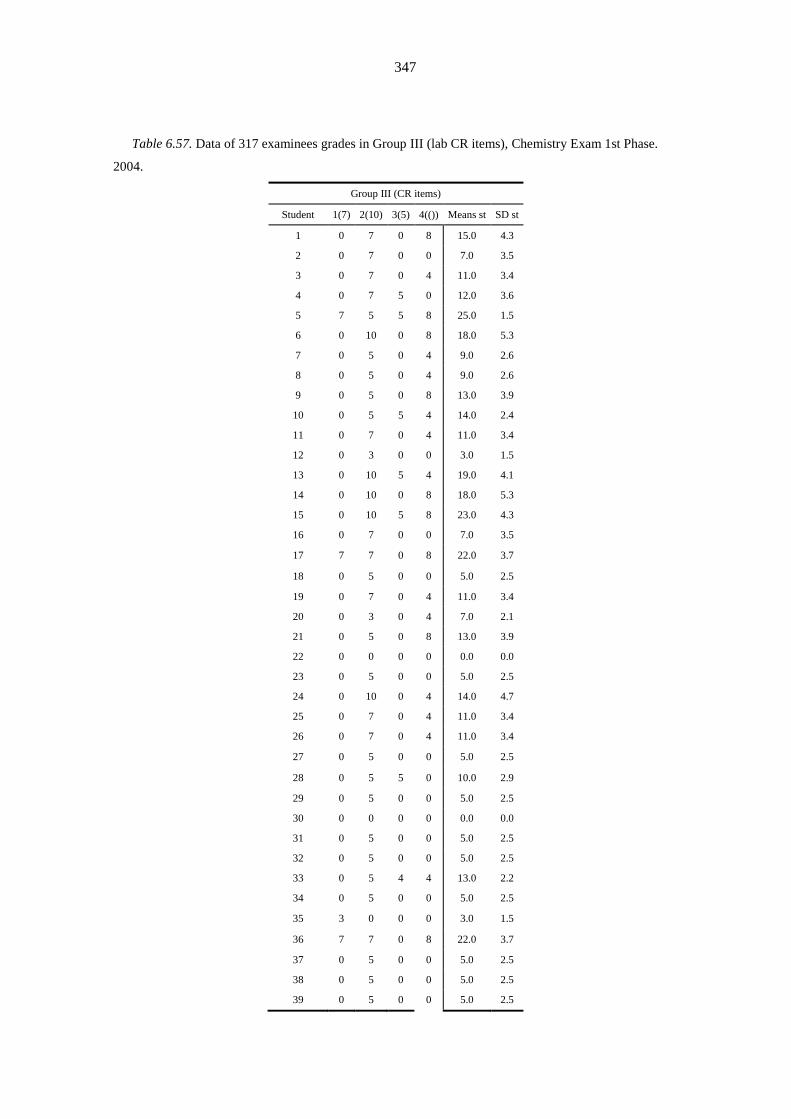
347
Table 6.57. Data of 317 examinees grades in Group III (lab CR items), Chemistry Exam 1st Phase.
2004.
Group III (CR items)
Student 1(7) 2(10) 3(5) 4(()) Means st SD st
1 0 7 0 8 15.0 4.3
2 0 7 0 0 7.0 3.5
3 0 7 0 4 11.0 3.4
4 0 7 5 0 12.0 3.6
5 7 5 5 8 25.0 1.5
6 0 10 0 8 18.0 5.3
7 0 5 0 4 9.0 2.6
8 0 5 0 4 9.0 2.6
9 0 5 0 8 13.0 3.9
10 0 5 5 4 14.0 2.4
11 0 7 0 4 11.0 3.4
12 0 3 0 0 3.0 1.5
13 0 10 5 4 19.0 4.1
14 0 10 0 8 18.0 5.3
15 0 10 5 8 23.0 4.3
16 0 7 0 0 7.0 3.5
17 7 7 0 8 22.0 3.7
18 0 5 0 0 5.0 2.5
19 0 7 0 4 11.0 3.4
20 0 3 0 4 7.0 2.1
21 0 5 0 8 13.0 3.9
22 0 0 0 0 0.0 0.0
23 0 5 0 0 5.0 2.5
24 0 10 0 4 14.0 4.7
25 0 7 0 4 11.0 3.4
26 0 7 0 4 11.0 3.4
27 0 5 0 0 5.0 2.5
28 0 5 5 0 10.0 2.9
29 0 5 0 0 5.0 2.5
30 0 0 0 0 0.0 0.0
31 0 5 0 0 5.0 2.5
32 0 5 0 0 5.0 2.5
33 0 5 4 4 13.0 2.2
34 0 5 0 0 5.0 2.5
35 3 0 0 0 3.0 1.5
36 7 7 0 8 22.0 3.7
37 0 5 0 0 5.0 2.5
38 0 5 0 0 5.0 2.5
39 0 5 0 0 5.0 2.5
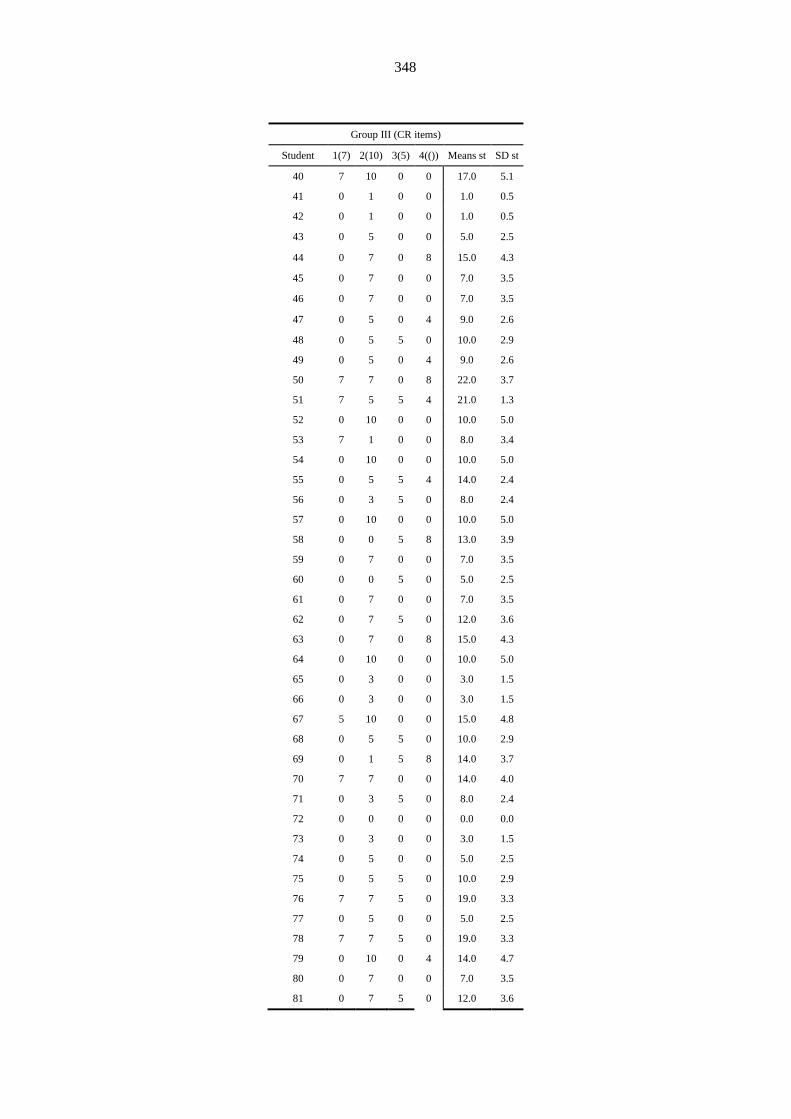
348
Group III (CR items)
Student 1(7) 2(10) 3(5) 4(()) Means st SD st
40 7 10 0 0 17.0 5.1
41 0 1 0 0 1.0 0.5
42 0 1 0 0 1.0 0.5
43 0 5 0 0 5.0 2.5
44 0 7 0 8 15.0 4.3
45 0 7 0 0 7.0 3.5
46 0 7 0 0 7.0 3.5
47 0 5 0 4 9.0 2.6
48 0 5 5 0 10.0 2.9
49 0 5 0 4 9.0 2.6
50 7 7 0 8 22.0 3.7
51 7 5 5 4 21.0 1.3
52 0 10 0 0 10.0 5.0
53 7 1 0 0 8.0 3.4
54 0 10 0 0 10.0 5.0
55 0 5 5 4 14.0 2.4
56 0 3 5 0 8.0 2.4
57 0 10 0 0 10.0 5.0
58 0 0 5 8 13.0 3.9
59 0 7 0 0 7.0 3.5
60 0 0 5 0 5.0 2.5
61 0 7 0 0 7.0 3.5
62 0 7 5 0 12.0 3.6
63 0 7 0 8 15.0 4.3
64 0 10 0 0 10.0 5.0
65 0 3 0 0 3.0 1.5
66 0 3 0 0 3.0 1.5
67 5 10 0 0 15.0 4.8
68 0 5 5 0 10.0 2.9
69 0 1 5 8 14.0 3.7
70 7 7 0 0 14.0 4.0
71 0 3 5 0 8.0 2.4
72 0 0 0 0 0.0 0.0
73 0 3 0 0 3.0 1.5
74 0 5 0 0 5.0 2.5
75 0 5 5 0 10.0 2.9
76 7 7 5 0 19.0 3.3
77 0 5 0 0 5.0 2.5
78 7 7 5 0 19.0 3.3
79 0 10 0 4 14.0 4.7
80 0 7 0 0 7.0 3.5
81 0 7 5 0 12.0 3.6
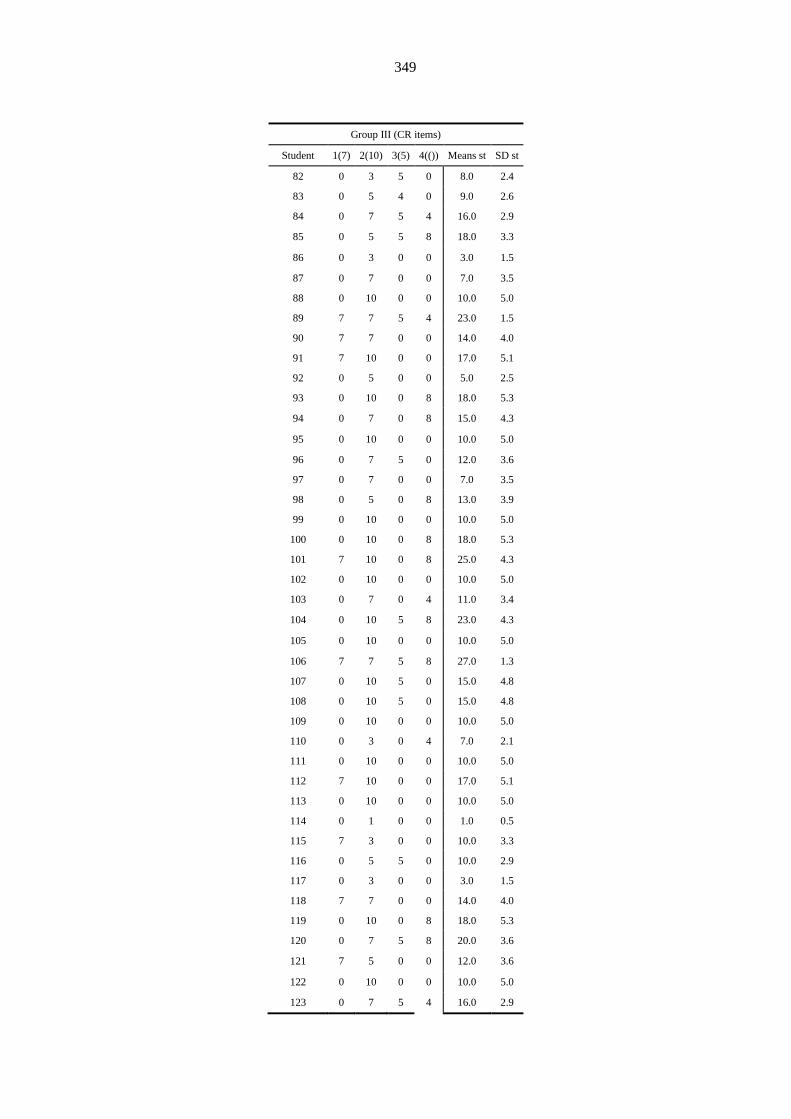
349
Group III (CR items)
Student 1(7) 2(10) 3(5) 4(()) Means st SD st
82 0 3 5 0 8.0 2.4
83 0 5 4 0 9.0 2.6
84 0 7 5 4 16.0 2.9
85 0 5 5 8 18.0 3.3
86 0 3 0 0 3.0 1.5
87 0 7 0 0 7.0 3.5
88 0 10 0 0 10.0 5.0
89 7 7 5 4 23.0 1.5
90 7 7 0 0 14.0 4.0
91 7 10 0 0 17.0 5.1
92 0 5 0 0 5.0 2.5
93 0 10 0 8 18.0 5.3
94 0 7 0 8 15.0 4.3
95 0 10 0 0 10.0 5.0
96 0 7 5 0 12.0 3.6
97 0 7 0 0 7.0 3.5
98 0 5 0 8 13.0 3.9
99 0 10 0 0 10.0 5.0
100 0 10 0 8 18.0 5.3
101 7 10 0 8 25.0 4.3
102 0 10 0 0 10.0 5.0
103 0 7 0 4 11.0 3.4
104 0 10 5 8 23.0 4.3
105 0 10 0 0 10.0 5.0
106 7 7 5 8 27.0 1.3
107 0 10 5 0 15.0 4.8
108 0 10 5 0 15.0 4.8
109 0 10 0 0 10.0 5.0
110 0 3 0 4 7.0 2.1
111 0 10 0 0 10.0 5.0
112 7 10 0 0 17.0 5.1
113 0 10 0 0 10.0 5.0
114 0 1 0 0 1.0 0.5
115 7 3 0 0 10.0 3.3
116 0 5 5 0 10.0 2.9
117 0 3 0 0 3.0 1.5
118 7 7 0 0 14.0 4.0
119 0 10 0 8 18.0 5.3
120 0 7 5 8 20.0 3.6
121 7 5 0 0 12.0 3.6
122 0 10 0 0 10.0 5.0
123 0 7 5 4 16.0 2.9
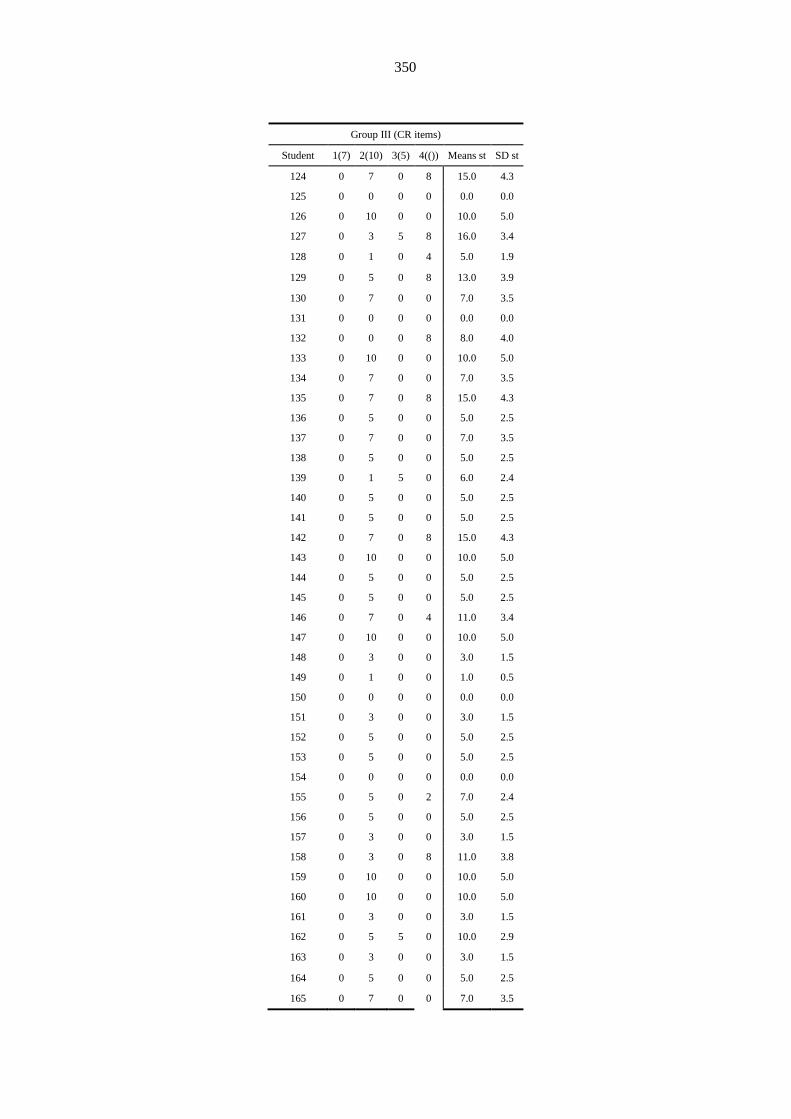
350
Group III (CR items)
Student 1(7) 2(10) 3(5) 4(()) Means st SD st
124 0 7 0 8 15.0 4.3
125 0 0 0 0 0.0 0.0
126 0 10 0 0 10.0 5.0
127 0 3 5 8 16.0 3.4
128 0 1 0 4 5.0 1.9
129 0 5 0 8 13.0 3.9
130 0 7 0 0 7.0 3.5
131 0 0 0 0 0.0 0.0
132 0 0 0 8 8.0 4.0
133 0 10 0 0 10.0 5.0
134 0 7 0 0 7.0 3.5
135 0 7 0 8 15.0 4.3
136 0 5 0 0 5.0 2.5
137 0 7 0 0 7.0 3.5
138 0 5 0 0 5.0 2.5
139 0 1 5 0 6.0 2.4
140 0 5 0 0 5.0 2.5
141 0 5 0 0 5.0 2.5
142 0 7 0 8 15.0 4.3
143 0 10 0 0 10.0 5.0
144 0 5 0 0 5.0 2.5
145 0 5 0 0 5.0 2.5
146 0 7 0 4 11.0 3.4
147 0 10 0 0 10.0 5.0
148 0 3 0 0 3.0 1.5
149 0 1 0 0 1.0 0.5
150 0 0 0 0 0.0 0.0
151 0 3 0 0 3.0 1.5
152 0 5 0 0 5.0 2.5
153 0 5 0 0 5.0 2.5
154 0 0 0 0 0.0 0.0
155 0 5 0 2 7.0 2.4
156 0 5 0 0 5.0 2.5
157 0 3 0 0 3.0 1.5
158 0 3 0 8 11.0 3.8
159 0 10 0 0 10.0 5.0
160 0 10 0 0 10.0 5.0
161 0 3 0 0 3.0 1.5
162 0 5 5 0 10.0 2.9
163 0 3 0 0 3.0 1.5
164 0 5 0 0 5.0 2.5
165 0 7 0 0 7.0 3.5
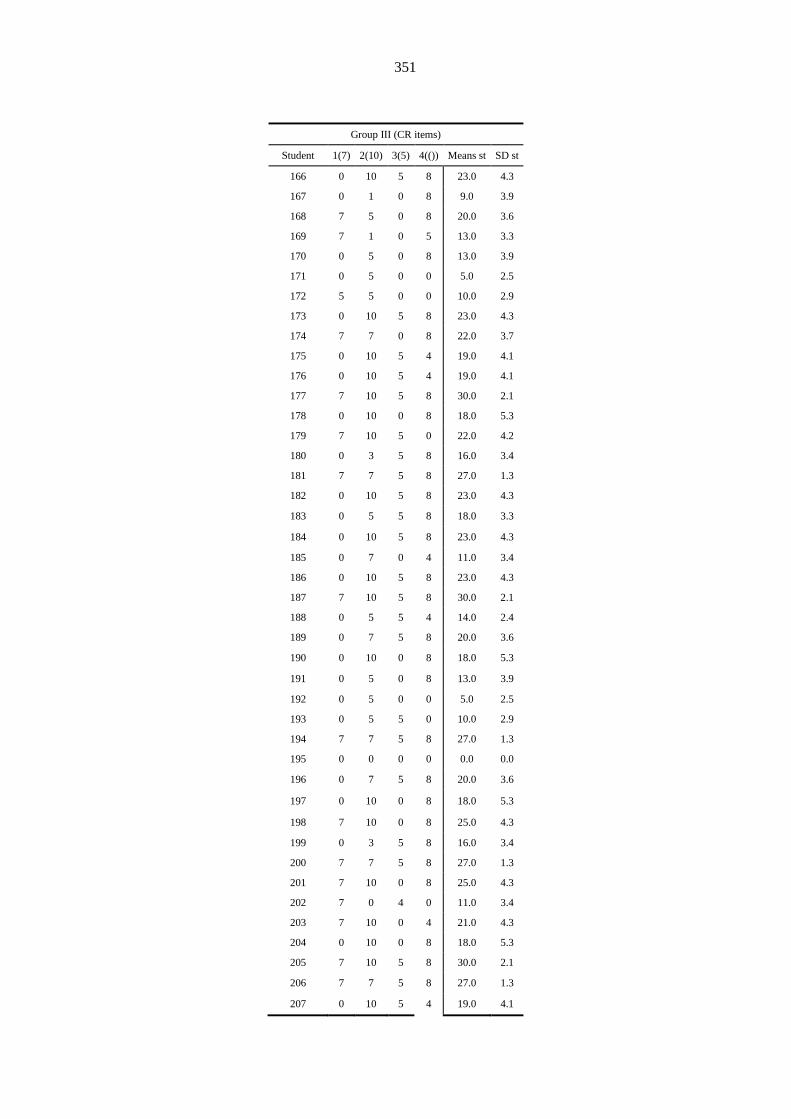
351
Group III (CR items)
Student 1(7) 2(10) 3(5) 4(()) Means st SD st
166 0 10 5 8 23.0 4.3
167 0 1 0 8 9.0 3.9
168 7 5 0 8 20.0 3.6
169 7 1 0 5 13.0 3.3
170 0 5 0 8 13.0 3.9
171 0 5 0 0 5.0 2.5
172 5 5 0 0 10.0 2.9
173 0 10 5 8 23.0 4.3
174 7 7 0 8 22.0 3.7
175 0 10 5 4 19.0 4.1
176 0 10 5 4 19.0 4.1
177 7 10 5 8 30.0 2.1
178 0 10 0 8 18.0 5.3
179 7 10 5 0 22.0 4.2
180 0 3 5 8 16.0 3.4
181 7 7 5 8 27.0 1.3
182 0 10 5 8 23.0 4.3
183 0 5 5 8 18.0 3.3
184 0 10 5 8 23.0 4.3
185 0 7 0 4 11.0 3.4
186 0 10 5 8 23.0 4.3
187 7 10 5 8 30.0 2.1
188 0 5 5 4 14.0 2.4
189 0 7 5 8 20.0 3.6
190 0 10 0 8 18.0 5.3
191 0 5 0 8 13.0 3.9
192 0 5 0 0 5.0 2.5
193 0 5 5 0 10.0 2.9
194 7 7 5 8 27.0 1.3
195 0 0 0 0 0.0 0.0
196 0 7 5 8 20.0 3.6
197 0 10 0 8 18.0 5.3
198 7 10 0 8 25.0 4.3
199 0 3 5 8 16.0 3.4
200 7 7 5 8 27.0 1.3
201 7 10 0 8 25.0 4.3
202 7 0 4 0 11.0 3.4
203 7 10 0 4 21.0 4.3
204 0 10 0 8 18.0 5.3
205 7 10 5 8 30.0 2.1
206 7 7 5 8 27.0 1.3
207 0 10 5 4 19.0 4.1

352
Group III (CR items)
Student 1(7) 2(10) 3(5) 4(()) Means st SD st
208 0 5 0 4 9.0 2.6
209 7 10 5 8 30.0 2.1
210 7 10 5 8 30.0 2.1
211 0 5 0 4 9.0 2.6
212 0 10 5 8 23.0 4.3
213 7 7 5 8 27.0 1.3
214 0 7 5 4 16.0 2.9
215 0 7 5 8 20.0 3.6
216 7 10 5 4 26.0 2.6
217 7 7 5 0 19.0 3.3
218 0 5 5 4 14.0 2.4
219 0 5 0 8 13.0 3.9
220 0 3 5 8 16.0 3.4
221 7 7 5 8 27.0 1.3
222 0 7 5 8 20.0 3.6
223 7 7 5 8 27.0 1.3
224 7 10 5 8 30.0 2.1
225 0 5 5 0 10.0 2.9
226 7 5 5 8 25.0 1.5
227 0 10 0 8 18.0 5.3
228 0 0 5 8 13.0 3.9
229 7 10 5 8 30.0 2.1
230 0 5 0 8 13.0 3.9
231 0 10 5 8 23.0 4.3
232 0 5 0 0 5.0 2.5
233 0 7 0 8 15.0 4.3
234 7 5 5 8 25.0 1.5
235 0 10 5 8 23.0 4.3
236 7 7 5 8 27.0 1.3
237 0 3 5 0 8.0 2.4
238 0 7 0 8 15.0 4.3
239 7 7 5 8 27.0 1.3
240 0 7 0 8 15.0 4.3
241 0 5 5 8 18.0 3.3
242 0 7 5 4 16.0 2.9
243 0 7 5 8 20.0 3.6
244 0 5 5 8 18.0 3.3
245 0 10 5 4 19.0 4.1
246 0 10 5 8 23.0 4.3
247 0 7 5 4 16.0 2.9
248 7 10 0 8 25.0 4.3
249 7 10 0 8 25.0 4.3

353
Group III (CR items)
Student 1(7) 2(10) 3(5) 4(()) Means st SD st
250 7 10 0 8 25.0 4.3
251 0 10 0 8 18.0 5.3
252 7 10 5 8 30.0 2.1
253 7 7 5 4 23.0 1.5
254 7 10 5 8 30.0 2.1
255 7 10 0 8 25.0 4.3
256 7 10 0 0 17.0 5.1
257 7 10 0 0 17.0 5.1
258 7 7 0 8 22.0 3.7
259 0 7 0 8 15.0 4.3
260 7 7 0 8 22.0 3.7
261 7 10 5 8 30.0 2.1
262 7 7 0 8 22.0 3.7
263 0 10 0 8 18.0 5.3
264 7 7 5 8 27.0 1.3
265 0 7 5 0 12.0 3.6
266 7 7 5 0 19.0 3.3
267 7 10 5 0 22.0 4.2
268 7 10 5 8 30.0 2.1
269 0 10 5 0 15.0 4.8
270 0 7 0 4 11.0 3.4
271 0 7 0 0 7.0 3.5
272 0 7 5 8 20.0 3.6
273 0 7 0 8 15.0 4.3
274 7 10 5 8 30.0 2.1
275 7 7 5 8 27.0 1.3
276 7 3 0 4 14.0 2.9
277 0 0 5 8 13.0 3.9
278 7 10 5 8 30.0 2.1
279 7 10 0 4 21.0 4.3
280 0 5 0 4 9.0 2.6
281 0 10 0 4 14.0 4.7
282 0 10 5 4 19.0 4.1
283 0 10 0 0 10.0 5.0
284 0 3 0 8 11.0 3.8
285 0 7 0 8 15.0 4.3
286 7 10 5 8 30.0 2.1
287 0 10 5 4 19.0 4.1
288 0 7 5 8 20.0 3.6
289 0 7 0 8 15.0 4.3
290 0 10 5 4 19.0 4.1
291 0 10 0 0 10.0 5.0
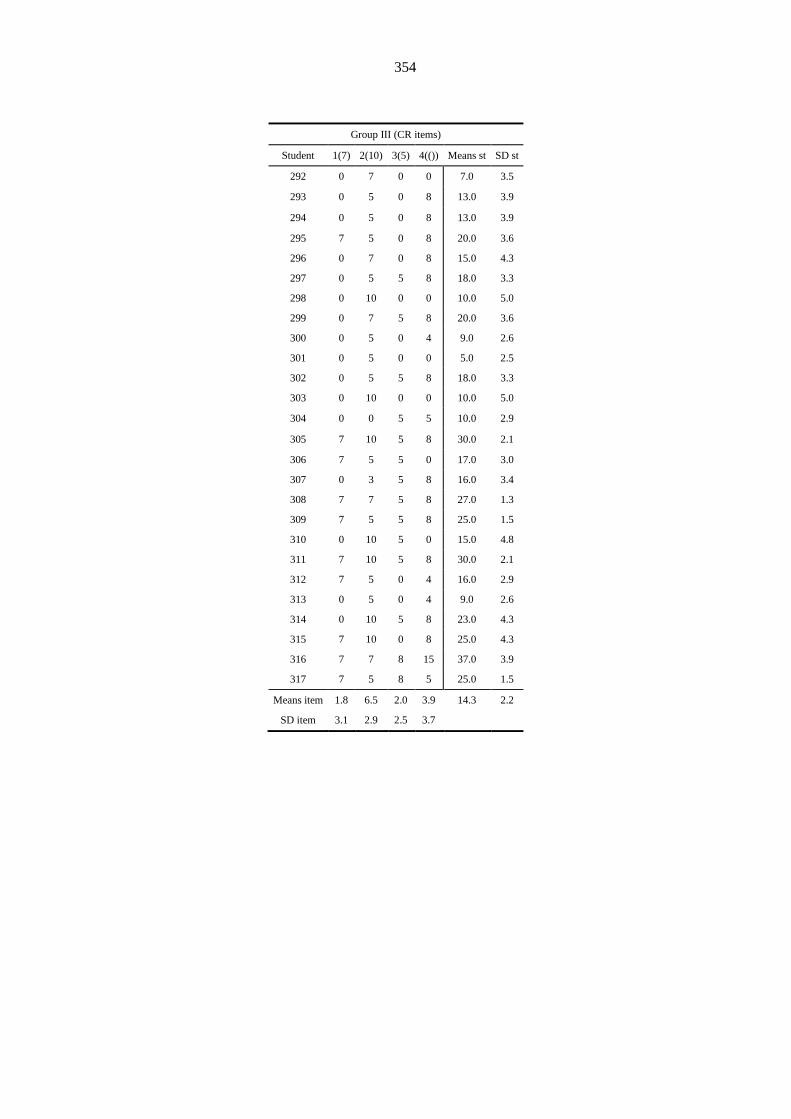
354
Group III (CR items)
Student 1(7) 2(10) 3(5) 4(()) Means st SD st
292 0 7 0 0 7.0 3.5
293 0 5 0 8 13.0 3.9
294 0 5 0 8 13.0 3.9
295 7 5 0 8 20.0 3.6
296 0 7 0 8 15.0 4.3
297 0 5 5 8 18.0 3.3
298 0 10 0 0 10.0 5.0
299 0 7 5 8 20.0 3.6
300 0 5 0 4 9.0 2.6
301 0 5 0 0 5.0 2.5
302 0 5 5 8 18.0 3.3
303 0 10 0 0 10.0 5.0
304 0 0 5 5 10.0 2.9
305 7 10 5 8 30.0 2.1
306 7 5 5 0 17.0 3.0
307 0 3 5 8 16.0 3.4
308 7 7 5 8 27.0 1.3
309 7 5 5 8 25.0 1.5
310 0 10 5 0 15.0 4.8
311 7 10 5 8 30.0 2.1
312 7 5 0 4 16.0 2.9
313 0 5 0 4 9.0 2.6
314 0 10 5 8 23.0 4.3
315 7 10 0 8 25.0 4.3
316 7 7 8 15 37.0 3.9
317 7 5 8 5 25.0 1.5
Means item 1.8 6.5 2.0 3.9 14.3 2.2
SD item 3.1 2.9 2.5 3.7
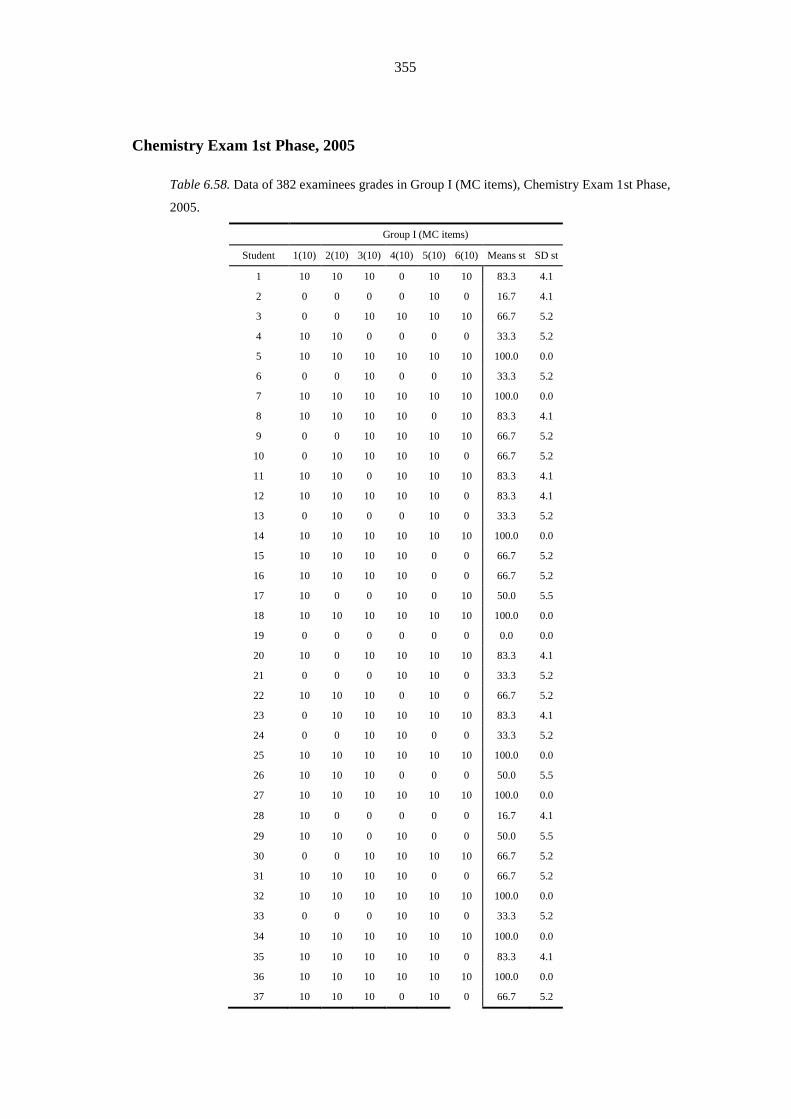
355
Chemistry Exam 1st Phase, 2005
Table 6.58. Data of 382 examinees grades in Group I (MC items), Chemistry Exam 1st Phase,
2005.
Group I (MC items)
Student 1(10) 2(10) 3(10) 4(10) 5(10) 6(10) Means st SD st
1 10 10 10 0 10 10 83.3 4.1
2 0 0 0 0 10 0 16.7 4.1
3 0 0 10 10 10 10 66.7 5.2
4 10 10 0 0 0 0 33.3 5.2
5 10 10 10 10 10 10 100.0 0.0
6 0 0 10 0 0 10 33.3 5.2
7 10 10 10 10 10 10 100.0 0.0
8 10 10 10 10 0 10 83.3 4.1
9 0 0 10 10 10 10 66.7 5.2
10 0 10 10 10 10 0 66.7 5.2
11 10 10 0 10 10 10 83.3 4.1
12 10 10 10 10 10 0 83.3 4.1
13 0 10 0 0 10 0 33.3 5.2
14 10 10 10 10 10 10 100.0 0.0
15 10 10 10 10 0 0 66.7 5.2
16 10 10 10 10 0 0 66.7 5.2
17 10 0 0 10 0 10 50.0 5.5
18 10 10 10 10 10 10 100.0 0.0
19 0 0 0 0 0 0 0.0 0.0
20 10 0 10 10 10 10 83.3 4.1
21 0 0 0 10 10 0 33.3 5.2
22 10 10 10 0 10 0 66.7 5.2
23 0 10 10 10 10 10 83.3 4.1
24 0 0 10 10 0 0 33.3 5.2
25 10 10 10 10 10 10 100.0 0.0
26 10 10 10 0 0 0 50.0 5.5
27 10 10 10 10 10 10 100.0 0.0
28 10 0 0 0 0 0 16.7 4.1
29 10 10 0 10 0 0 50.0 5.5
30 0 0 10 10 10 10 66.7 5.2
31 10 10 10 10 0 0 66.7 5.2
32 10 10 10 10 10 10 100.0 0.0
33 0 0 0 10 10 0 33.3 5.2
34 10 10 10 10 10 10 100.0 0.0
35 10 10 10 10 10 0 83.3 4.1
36 10 10 10 10 10 10 100.0 0.0
37 10 10 10 0 10 0 66.7 5.2
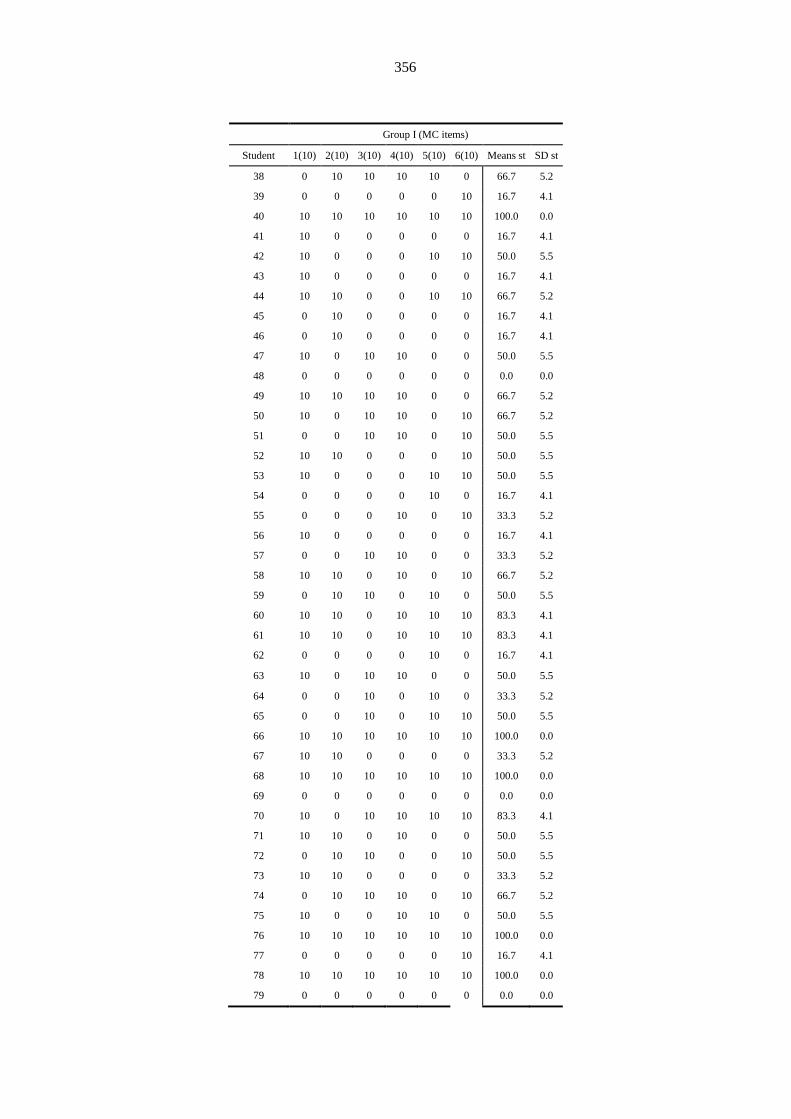
356
Group I (MC items)
Student 1(10) 2(10) 3(10) 4(10) 5(10) 6(10) Means st SD st
38 0 10 10 10 10 0 66.7 5.2
39 0 0 0 0 0 10 16.7 4.1
40 10 10 10 10 10 10 100.0 0.0
41 10 0 0 0 0 0 16.7 4.1
42 10 0 0 0 10 10 50.0 5.5
43 10 0 0 0 0 0 16.7 4.1
44 10 10 0 0 10 10 66.7 5.2
45 0 10 0 0 0 0 16.7 4.1
46 0 10 0 0 0 0 16.7 4.1
47 10 0 10 10 0 0 50.0 5.5
48 0 0 0 0 0 0 0.0 0.0
49 10 10 10 10 0 0 66.7 5.2
50 10 0 10 10 0 10 66.7 5.2
51 0 0 10 10 0 10 50.0 5.5
52 10 10 0 0 0 10 50.0 5.5
53 10 0 0 0 10 10 50.0 5.5
54 0 0 0 0 10 0 16.7 4.1
55 0 0 0 10 0 10 33.3 5.2
56 10 0 0 0 0 0 16.7 4.1
57 0 0 10 10 0 0 33.3 5.2
58 10 10 0 10 0 10 66.7 5.2
59 0 10 10 0 10 0 50.0 5.5
60 10 10 0 10 10 10 83.3 4.1
61 10 10 0 10 10 10 83.3 4.1
62 0 0 0 0 10 0 16.7 4.1
63 10 0 10 10 0 0 50.0 5.5
64 0 0 10 0 10 0 33.3 5.2
65 0 0 10 0 10 10 50.0 5.5
66 10 10 10 10 10 10 100.0 0.0
67 10 10 0 0 0 0 33.3 5.2
68 10 10 10 10 10 10 100.0 0.0
69 0 0 0 0 0 0 0.0 0.0
70 10 0 10 10 10 10 83.3 4.1
71 10 10 0 10 0 0 50.0 5.5
72 0 10 10 0 0 10 50.0 5.5
73 10 10 0 0 0 0 33.3 5.2
74 0 10 10 10 0 10 66.7 5.2
75 10 0 0 10 10 0 50.0 5.5
76 10 10 10 10 10 10 100.0 0.0
77 0 0 0 0 0 10 16.7 4.1
78 10 10 10 10 10 10 100.0 0.0
79 0 0 0 0 0 0 0.0 0.0
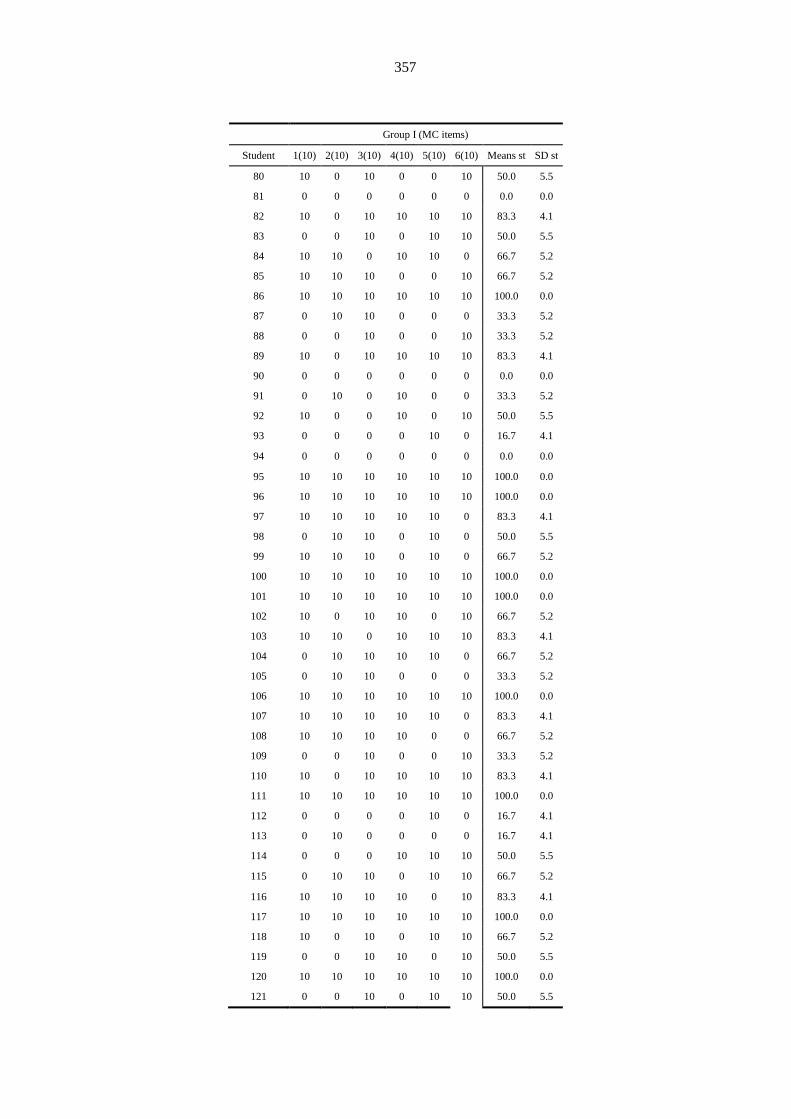
357
Group I (MC items)
Student 1(10) 2(10) 3(10) 4(10) 5(10) 6(10) Means st SD st
80 10 0 10 0 0 10 50.0 5.5
81 0 0 0 0 0 0 0.0 0.0
82 10 0 10 10 10 10 83.3 4.1
83 0 0 10 0 10 10 50.0 5.5
84 10 10 0 10 10 0 66.7 5.2
85 10 10 10 0 0 10 66.7 5.2
86 10 10 10 10 10 10 100.0 0.0
87 0 10 10 0 0 0 33.3 5.2
88 0 0 10 0 0 10 33.3 5.2
89 10 0 10 10 10 10 83.3 4.1
90 0 0 0 0 0 0 0.0 0.0
91 0 10 0 10 0 0 33.3 5.2
92 10 0 0 10 0 10 50.0 5.5
93 0 0 0 0 10 0 16.7 4.1
94 0 0 0 0 0 0 0.0 0.0
95 10 10 10 10 10 10 100.0 0.0
96 10 10 10 10 10 10 100.0 0.0
97 10 10 10 10 10 0 83.3 4.1
98 0 10 10 0 10 0 50.0 5.5
99 10 10 10 0 10 0 66.7 5.2
100 10 10 10 10 10 10 100.0 0.0
101 10 10 10 10 10 10 100.0 0.0
102 10 0 10 10 0 10 66.7 5.2
103 10 10 0 10 10 10 83.3 4.1
104 0 10 10 10 10 0 66.7 5.2
105 0 10 10 0 0 0 33.3 5.2
106 10 10 10 10 10 10 100.0 0.0
107 10 10 10 10 10 0 83.3 4.1
108 10 10 10 10 0 0 66.7 5.2
109 0 0 10 0 0 10 33.3 5.2
110 10 0 10 10 10 10 83.3 4.1
111 10 10 10 10 10 10 100.0 0.0
112 0 0 0 0 10 0 16.7 4.1
113 0 10 0 0 0 0 16.7 4.1
114 0 0 0 10 10 10 50.0 5.5
115 0 10 10 0 10 10 66.7 5.2
116 10 10 10 10 0 10 83.3 4.1
117 10 10 10 10 10 10 100.0 0.0
118 10 0 10 0 10 10 66.7 5.2
119 0 0 10 10 0 10 50.0 5.5
120 10 10 10 10 10 10 100.0 0.0
121 0 0 10 0 10 10 50.0 5.5

358
Group I (MC items)
Student 1(10) 2(10) 3(10) 4(10) 5(10) 6(10) Means st SD st
122 10 10 10 10 10 10 100.0 0.0
123 0 10 10 10 10 10 83.3 4.1
124 10 10 0 10 10 0 66.7 5.2
125 0 10 10 10 10 10 83.3 4.1
126 0 10 10 10 10 10 83.3 4.1
127 10 10 0 0 0 0 33.3 5.2
128 0 10 0 0 0 0 16.7 4.1
129 10 10 10 10 10 10 100.0 0.0
130 0 10 10 0 10 10 66.7 5.2
131 10 10 10 10 10 10 100.0 0.0
132 10 10 10 10 10 10 100.0 0.0
133 10 10 10 10 10 0 83.3 4.1
134 0 10 10 10 10 0 66.7 5.2
135 10 10 10 10 10 10 100.0 0.0
136 10 10 10 0 10 0 66.7 5.2
137 10 10 10 0 10 10 83.3 4.1
138 0 10 10 0 0 0 33.3 5.2
139 10 10 10 10 10 10 100.0 0.0
140 10 0 0 0 0 0 16.7 4.1
141 10 0 0 10 10 0 50.0 5.5
142 10 10 10 10 10 10 100.0 0.0
143 0 0 0 0 10 0 16.7 4.1
144 0 10 0 0 10 0 33.3 5.2
145 10 10 10 0 10 10 83.3 4.1
146 10 10 10 10 10 10 100.0 0.0
147 10 0 10 10 0 10 66.7 5.2
148 10 0 10 0 0 0 33.3 5.2
149 0 0 10 10 0 0 33.3 5.2
150 10 10 10 10 10 10 100.0 0.0
151 10 10 10 0 0 0 50.0 5.5
152 10 0 0 0 10 0 33.3 5.2
153 10 10 10 10 10 10 100.0 0.0
154 10 0 0 0 0 0 16.7 4.1
155 0 10 10 10 10 0 66.7 5.2
156 10 10 10 10 10 10 100.0 0.0
157 10 10 10 10 10 10 100.0 0.0
158 0 0 10 0 0 10 33.3 5.2
159 0 0 0 0 0 0 0.0 0.0
160 10 10 10 0 10 0 66.7 5.2
161 0 10 0 10 10 0 50.0 5.5
162 10 0 0 10 10 10 66.7 5.2
163 10 10 10 10 10 0 83.3 4.1
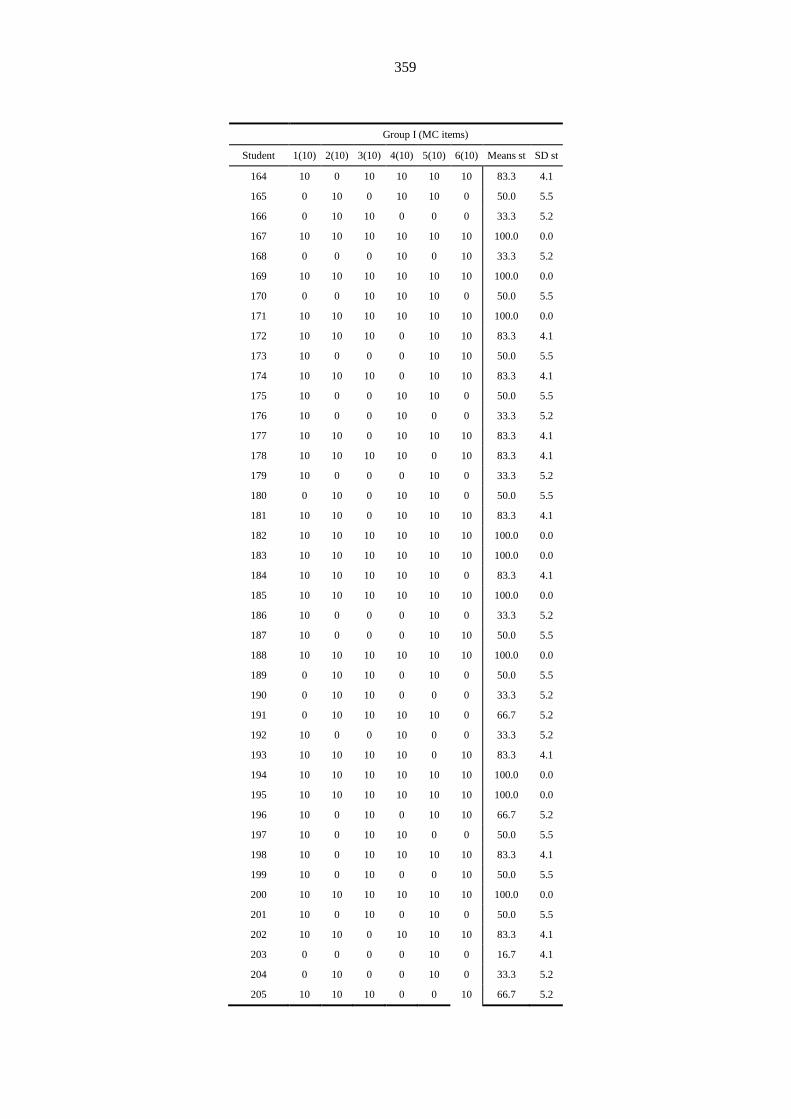
359
Group I (MC items)
Student 1(10) 2(10) 3(10) 4(10) 5(10) 6(10) Means st SD st
164 10 0 10 10 10 10 83.3 4.1
165 0 10 0 10 10 0 50.0 5.5
166 0 10 10 0 0 0 33.3 5.2
167 10 10 10 10 10 10 100.0 0.0
168 0 0 0 10 0 10 33.3 5.2
169 10 10 10 10 10 10 100.0 0.0
170 0 0 10 10 10 0 50.0 5.5
171 10 10 10 10 10 10 100.0 0.0
172 10 10 10 0 10 10 83.3 4.1
173 10 0 0 0 10 10 50.0 5.5
174 10 10 10 0 10 10 83.3 4.1
175 10 0 0 10 10 0 50.0 5.5
176 10 0 0 10 0 0 33.3 5.2
177 10 10 0 10 10 10 83.3 4.1
178 10 10 10 10 0 10 83.3 4.1
179 10 0 0 0 10 0 33.3 5.2
180 0 10 0 10 10 0 50.0 5.5
181 10 10 0 10 10 10 83.3 4.1
182 10 10 10 10 10 10 100.0 0.0
183 10 10 10 10 10 10 100.0 0.0
184 10 10 10 10 10 0 83.3 4.1
185 10 10 10 10 10 10 100.0 0.0
186 10 0 0 0 10 0 33.3 5.2
187 10 0 0 0 10 10 50.0 5.5
188 10 10 10 10 10 10 100.0 0.0
189 0 10 10 0 10 0 50.0 5.5
190 0 10 10 0 0 0 33.3 5.2
191 0 10 10 10 10 0 66.7 5.2
192 10 0 0 10 0 0 33.3 5.2
193 10 10 10 10 0 10 83.3 4.1
194 10 10 10 10 10 10 100.0 0.0
195 10 10 10 10 10 10 100.0 0.0
196 10 0 10 0 10 10 66.7 5.2
197 10 0 10 10 0 0 50.0 5.5
198 10 0 10 10 10 10 83.3 4.1
199 10 0 10 0 0 10 50.0 5.5
200 10 10 10 10 10 10 100.0 0.0
201 10 0 10 0 10 0 50.0 5.5
202 10 10 0 10 10 10 83.3 4.1
203 0 0 0 0 10 0 16.7 4.1
204 0 10 0 0 10 0 33.3 5.2
205 10 10 10 0 0 10 66.7 5.2
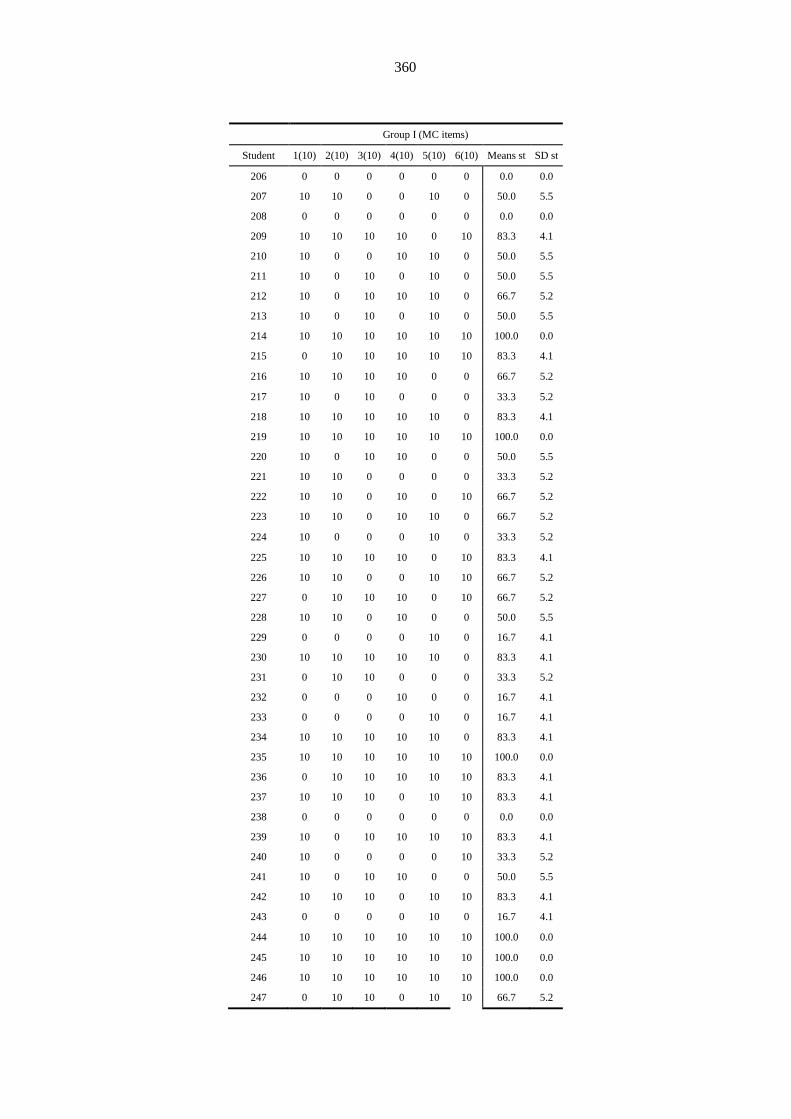
360
Group I (MC items)
Student 1(10) 2(10) 3(10) 4(10) 5(10) 6(10) Means st SD st
206 0 0 0 0 0 0 0.0 0.0
207 10 10 0 0 10 0 50.0 5.5
208 0 0 0 0 0 0 0.0 0.0
209 10 10 10 10 0 10 83.3 4.1
210 10 0 0 10 10 0 50.0 5.5
211 10 0 10 0 10 0 50.0 5.5
212 10 0 10 10 10 0 66.7 5.2
213 10 0 10 0 10 0 50.0 5.5
214 10 10 10 10 10 10 100.0 0.0
215 0 10 10 10 10 10 83.3 4.1
216 10 10 10 10 0 0 66.7 5.2
217 10 0 10 0 0 0 33.3 5.2
218 10 10 10 10 10 0 83.3 4.1
219 10 10 10 10 10 10 100.0 0.0
220 10 0 10 10 0 0 50.0 5.5
221 10 10 0 0 0 0 33.3 5.2
222 10 10 0 10 0 10 66.7 5.2
223 10 10 0 10 10 0 66.7 5.2
224 10 0 0 0 10 0 33.3 5.2
225 10 10 10 10 0 10 83.3 4.1
226 10 10 0 0 10 10 66.7 5.2
227 0 10 10 10 0 10 66.7 5.2
228 10 10 0 10 0 0 50.0 5.5
229 0 0 0 0 10 0 16.7 4.1
230 10 10 10 10 10 0 83.3 4.1
231 0 10 10 0 0 0 33.3 5.2
232 0 0 0 10 0 0 16.7 4.1
233 0 0 0 0 10 0 16.7 4.1
234 10 10 10 10 10 0 83.3 4.1
235 10 10 10 10 10 10 100.0 0.0
236 0 10 10 10 10 10 83.3 4.1
237 10 10 10 0 10 10 83.3 4.1
238 0 0 0 0 0 0 0.0 0.0
239 10 0 10 10 10 10 83.3 4.1
240 10 0 0 0 0 10 33.3 5.2
241 10 0 10 10 0 0 50.0 5.5
242 10 10 10 0 10 10 83.3 4.1
243 0 0 0 0 10 0 16.7 4.1
244 10 10 10 10 10 10 100.0 0.0
245 10 10 10 10 10 10 100.0 0.0
246 10 10 10 10 10 10 100.0 0.0
247 0 10 10 0 10 10 66.7 5.2

361
Group I (MC items)
Student 1(10) 2(10) 3(10) 4(10) 5(10) 6(10) Means st SD st
248 10 10 10 0 10 0 66.7 5.2
249 10 10 10 0 10 0 66.7 5.2
250 10 10 10 10 0 0 66.7 5.2
251 10 10 10 10 10 10 100.0 0.0
252 10 10 0 10 0 0 50.0 5.5
253 10 10 10 10 10 10 100.0 0.0
254 10 10 10 10 10 10 100.0 0.0
255 10 10 10 10 10 10 100.0 0.0
256 10 10 10 10 0 10 83.3 4.1
257 0 10 10 0 0 0 33.3 5.2
258 0 10 10 10 10 0 66.7 5.2
259 10 10 10 10 10 10 100.0 0.0
260 10 10 10 10 10 10 100.0 0.0
261 0 10 10 0 10 0 50.0 5.5
262 10 10 10 10 0 10 83.3 4.1
263 10 10 10 10 0 10 83.3 4.1
264 10 10 10 10 10 0 83.3 4.1
265 0 10 10 10 0 0 50.0 5.5
266 10 0 10 10 10 10 83.3 4.1
267 10 0 10 0 10 10 66.7 5.2
268 10 10 0 0 10 10 66.7 5.2
269 10 10 0 0 0 0 33.3 5.2
270 0 10 10 10 10 10 83.3 4.1
271 0 10 10 10 10 10 83.3 4.1
272 0 10 10 0 10 10 66.7 5.2
273 10 10 10 10 10 10 100.0 0.0
274 10 10 10 0 10 10 83.3 4.1
275 10 10 10 10 10 10 100.0 0.0
276 10 10 10 10 10 10 100.0 0.0
277 10 10 10 10 10 10 100.0 0.0
278 10 10 10 10 10 0 83.3 4.1
279 0 0 10 0 0 0 16.7 4.1
280 10 10 10 10 10 10 100.0 0.0
281 10 10 10 10 10 10 100.0 0.0
282 10 10 10 10 10 0 83.3 4.1
283 10 10 10 10 10 10 100.0 0.0
284 10 10 10 10 10 10 100.0 0.0
285 0 0 10 10 10 10 66.7 5.2
286 10 10 10 10 10 10 100.0 0.0
287 10 10 10 10 10 10 100.0 0.0
288 10 10 10 10 10 10 100.0 0.0
289 0 0 0 10 0 0 16.7 4.1
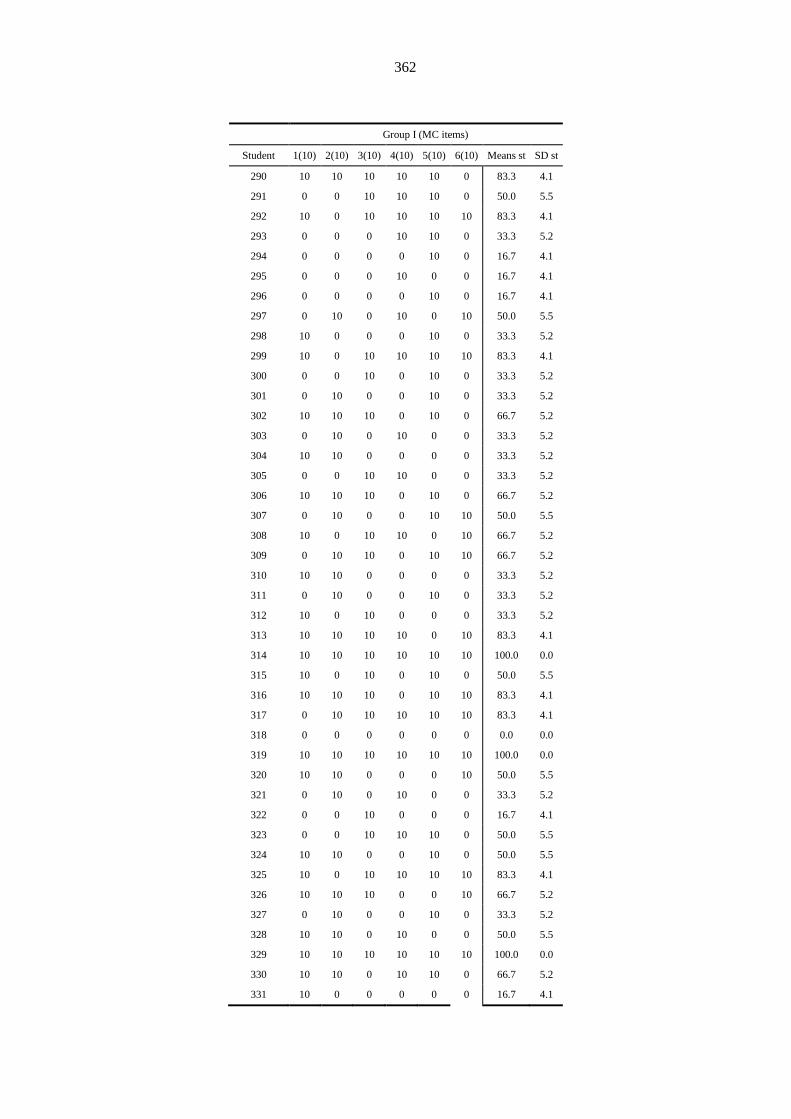
362
Group I (MC items)
Student 1(10) 2(10) 3(10) 4(10) 5(10) 6(10) Means st SD st
290 10 10 10 10 10 0 83.3 4.1
291 0 0 10 10 10 0 50.0 5.5
292 10 0 10 10 10 10 83.3 4.1
293 0 0 0 10 10 0 33.3 5.2
294 0 0 0 0 10 0 16.7 4.1
295 0 0 0 10 0 0 16.7 4.1
296 0 0 0 0 10 0 16.7 4.1
297 0 10 0 10 0 10 50.0 5.5
298 10 0 0 0 10 0 33.3 5.2
299 10 0 10 10 10 10 83.3 4.1
300 0 0 10 0 10 0 33.3 5.2
301 0 10 0 0 10 0 33.3 5.2
302 10 10 10 0 10 0 66.7 5.2
303 0 10 0 10 0 0 33.3 5.2
304 10 10 0 0 0 0 33.3 5.2
305 0 0 10 10 0 0 33.3 5.2
306 10 10 10 0 10 0 66.7 5.2
307 0 10 0 0 10 10 50.0 5.5
308 10 0 10 10 0 10 66.7 5.2
309 0 10 10 0 10 10 66.7 5.2
310 10 10 0 0 0 0 33.3 5.2
311 0 10 0 0 10 0 33.3 5.2
312 10 0 10 0 0 0 33.3 5.2
313 10 10 10 10 0 10 83.3 4.1
314 10 10 10 10 10 10 100.0 0.0
315 10 0 10 0 10 0 50.0 5.5
316 10 10 10 0 10 10 83.3 4.1
317 0 10 10 10 10 10 83.3 4.1
318 0 0 0 0 0 0 0.0 0.0
319 10 10 10 10 10 10 100.0 0.0
320 10 10 0 0 0 10 50.0 5.5
321 0 10 0 10 0 0 33.3 5.2
322 0 0 10 0 0 0 16.7 4.1
323 0 0 10 10 10 0 50.0 5.5
324 10 10 0 0 10 0 50.0 5.5
325 10 0 10 10 10 10 83.3 4.1
326 10 10 10 0 0 10 66.7 5.2
327 0 10 0 0 10 0 33.3 5.2
328 10 10 0 10 0 0 50.0 5.5
329 10 10 10 10 10 10 100.0 0.0
330 10 10 0 10 10 0 66.7 5.2
331 10 0 0 0 0 0 16.7 4.1
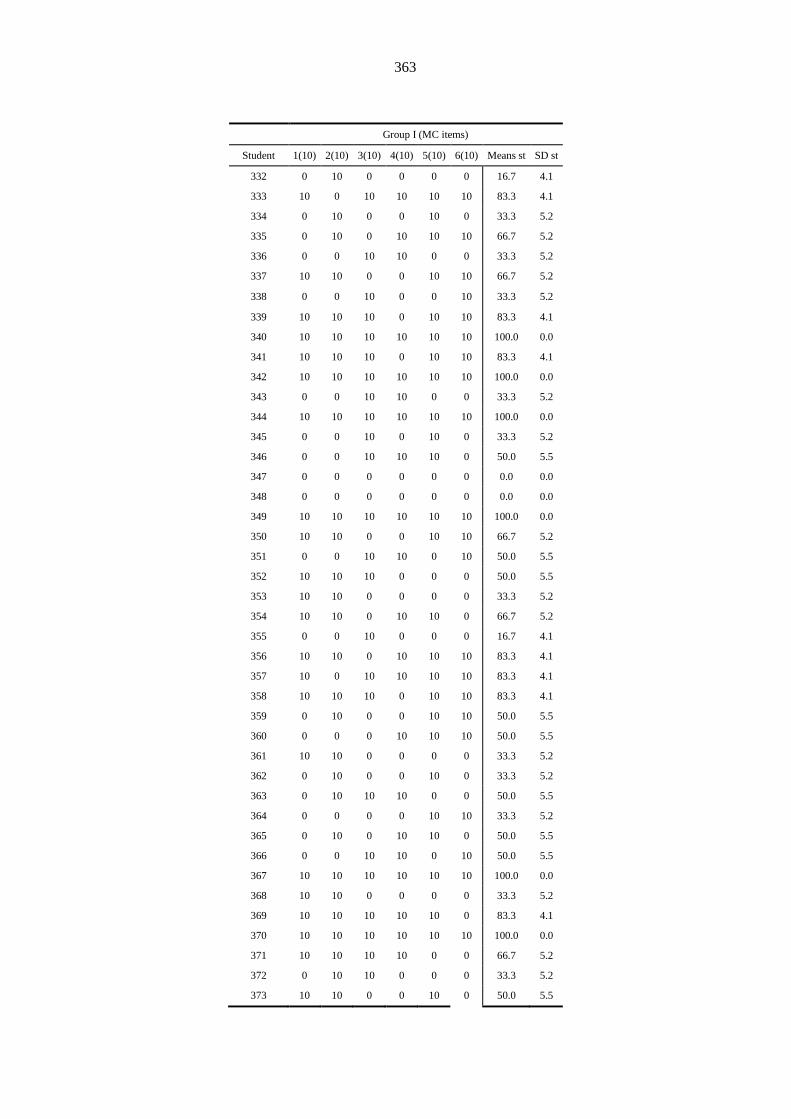
363
Group I (MC items)
Student 1(10) 2(10) 3(10) 4(10) 5(10) 6(10) Means st SD st
332 0 10 0 0 0 0 16.7 4.1
333 10 0 10 10 10 10 83.3 4.1
334 0 10 0 0 10 0 33.3 5.2
335 0 10 0 10 10 10 66.7 5.2
336 0 0 10 10 0 0 33.3 5.2
337 10 10 0 0 10 10 66.7 5.2
338 0 0 10 0 0 10 33.3 5.2
339 10 10 10 0 10 10 83.3 4.1
340 10 10 10 10 10 10 100.0 0.0
341 10 10 10 0 10 10 83.3 4.1
342 10 10 10 10 10 10 100.0 0.0
343 0 0 10 10 0 0 33.3 5.2
344 10 10 10 10 10 10 100.0 0.0
345 0 0 10 0 10 0 33.3 5.2
346 0 0 10 10 10 0 50.0 5.5
347 0 0 0 0 0 0 0.0 0.0
348 0 0 0 0 0 0 0.0 0.0
349 10 10 10 10 10 10 100.0 0.0
350 10 10 0 0 10 10 66.7 5.2
351 0 0 10 10 0 10 50.0 5.5
352 10 10 10 0 0 0 50.0 5.5
353 10 10 0 0 0 0 33.3 5.2
354 10 10 0 10 10 0 66.7 5.2
355 0 0 10 0 0 0 16.7 4.1
356 10 10 0 10 10 10 83.3 4.1
357 10 0 10 10 10 10 83.3 4.1
358 10 10 10 0 10 10 83.3 4.1
359 0 10 0 0 10 10 50.0 5.5
360 0 0 0 10 10 10 50.0 5.5
361 10 10 0 0 0 0 33.3 5.2
362 0 10 0 0 10 0 33.3 5.2
363 0 10 10 10 0 0 50.0 5.5
364 0 0 0 0 10 10 33.3 5.2
365 0 10 0 10 10 0 50.0 5.5
366 0 0 10 10 0 10 50.0 5.5
367 10 10 10 10 10 10 100.0 0.0
368 10 10 0 0 0 0 33.3 5.2
369 10 10 10 10 10 0 83.3 4.1
370 10 10 10 10 10 10 100.0 0.0
371 10 10 10 10 0 0 66.7 5.2
372 0 10 10 0 0 0 33.3 5.2
373 10 10 0 0 10 0 50.0 5.5

364
Group I (MC items)
Student 1(10) 2(10) 3(10) 4(10) 5(10) 6(10) Means st SD st
374 10 10 10 0 10 10 83.3 4.1
375 10 10 10 0 0 10 66.7 5.2
376 0 0 10 10 10 0 50.0 5.5
377 10 10 10 10 10 10 100.0 0.0
378 0 10 10 10 10 0 66.7 5.2
379 10 0 0 0 0 0 16.7 4.1
380 0 10 0 0 0 0 16.7 4.1
381 10 10 10 10 10 0 83.3 4.1
382 10 10 10 10 10 0 83.3 4.1
Means item 64.4 64.7 65.4 58.9 64.9 51.6 61.6 0.1
SD item 4.8 4.8 4.8 4.9 4.8 5.0
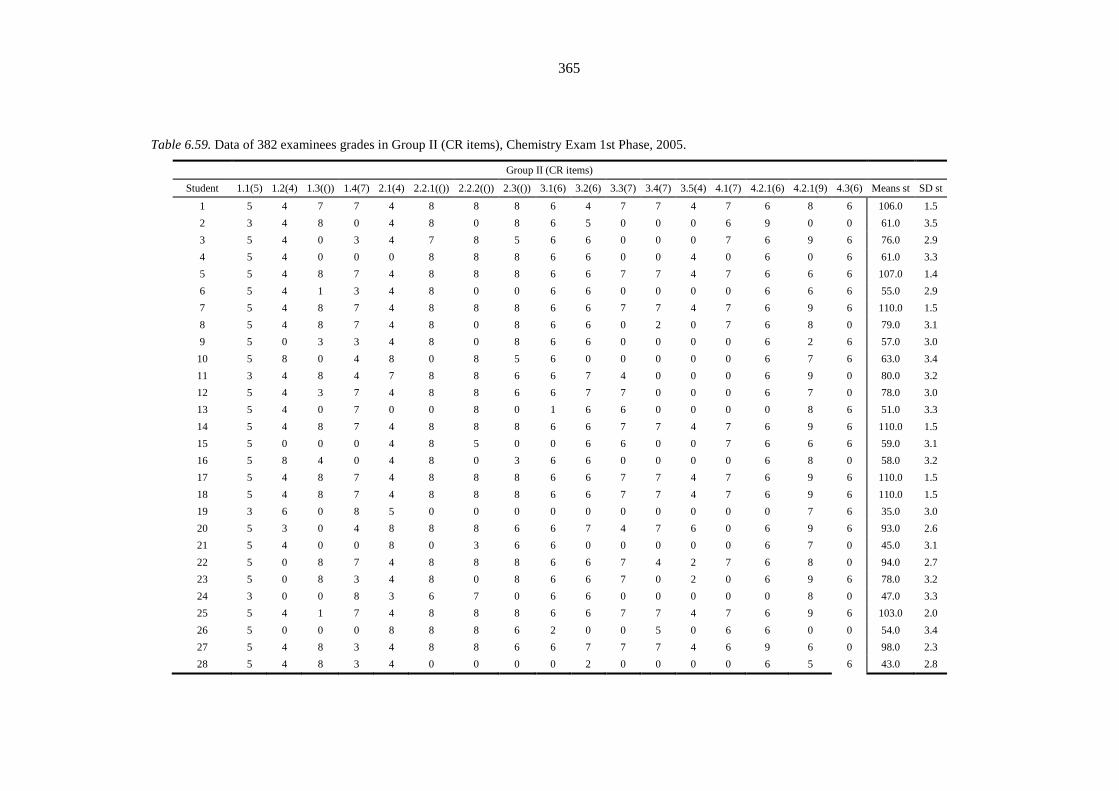
365
Table 6.59. Data of 382 examinees grades in Group II (CR items), Chemistry Exam 1st Phase, 2005.
Group II (CR items)
Student 1.1(5) 1.2(4) 1.3(()) 1.4(7) 2.1(4) 2.2.1(()) 2.2.2(()) 2.3(()) 3.1(6) 3.2(6) 3.3(7) 3.4(7) 3.5(4) 4.1(7) 4.2.1(6) 4.2.1(9) 4.3(6) Means st SD st
1 5 4 7 7 4 8 8 8 6 4 7 7 4 7 6 8 6 106.0 1.5
2 3 4 8 0 4 8 0 8 6 5 0 0 0 6 9 0 0 61.0 3.5
3 5 4 0 3 4 7 8 5 6 6 0 0 0 7 6 9 6 76.0 2.9
4 5 4 0 0 0 8 8 8 6 6 0 0 4 0 6 0 6 61.0 3.3
5 5 4 8 7 4 8 8 8 6 6 7 7 4 7 6 6 6 107.0 1.4
6 5 4 1 3 4 8 0 0 6 6 0 0 0 0 6 6 6 55.0 2.9
7 5 4 8 7 4 8 8 8 6 6 7 7 4 7 6 9 6 110.0 1.5
8 5 4 8 7 4 8 0 8 6 6 0 2 0 7 6 8 0 79.0 3.1
9 5 0 3 3 4 8 0 8 6 6 0 0 0 0 6 2 6 57.0 3.0
10 5 8 0 4 8 0 8 5 6 0 0 0 0 0 6 7 6 63.0 3.4
11 3 4 8 4 7 8 8 6 6 7 4 0 0 0 6 9 0 80.0 3.2
12 5 4 3 7 4 8 8 6 6 7 7 0 0 0 6 7 0 78.0 3.0
13 5 4 0 7 0 0 8 0 1 6 6 0 0 0 0 8 6 51.0 3.3
14 5 4 8 7 4 8 8 8 6 6 7 7 4 7 6 9 6 110.0 1.5
15 5 0 0 0 4 8 5 0 0 6 6 0 0 7 6 6 6 59.0 3.1
16 5 8 4 0 4 8 0 3 6 6 0 0 0 0 6 8 0 58.0 3.2
17 5 4 8 7 4 8 8 8 6 6 7 7 4 7 6 9 6 110.0 1.5
18 5 4 8 7 4 8 8 8 6 6 7 7 4 7 6 9 6 110.0 1.5
19 3 6 0 8 5 0 0 0 0 0 0 0 0 0 0 7 6 35.0 3.0
20 5 3 0 4 8 8 8 6 6 7 4 7 6 0 6 9 6 93.0 2.6
21 5 4 0 0 8 0 3 6 6 0 0 0 0 0 6 7 0 45.0 3.1
22 5 0 8 7 4 8 8 8 6 6 7 4 2 7 6 8 0 94.0 2.7
23 5 0 8 3 4 8 0 8 6 6 7 0 2 0 6 9 6 78.0 3.2
24 3 0 0 8 3 6 7 0 6 6 0 0 0 0 0 8 0 47.0 3.3
25 5 4 1 7 4 8 8 8 6 6 7 7 4 7 6 9 6 103.0 2.0
26 5 0 0 0 8 8 8 6 2 0 0 5 0 6 6 0 0 54.0 3.4
27 5 4 8 3 4 8 8 6 6 7 7 7 4 6 9 6 0 98.0 2.3
28 5 4 8 3 4 0 0 0 0 2 0 0 0 0 6 5 6 43.0 2.8

366
Group II (CR items)
Student 1.1(5) 1.2(4) 1.3(()) 1.4(7) 2.1(4) 2.2.1(()) 2.2.2(()) 2.3(()) 3.1(6) 3.2(6) 3.3(7) 3.4(7) 3.5(4) 4.1(7) 4.2.1(6) 4.2.1(9) 4.3(6) Means st SD st
29 5 4 8 0 4 8 8 3 6 6 7 4 0 0 6 9 6 84.0 2.9
30 5 0 0 3 4 8 8 8 5 6 0 0 0 0 0 7 6 60.0 3.3
31 3 0 8 0 4 8 0 5 6 6 7 0 0 0 6 7 6 66.0 3.2
32 5 4 8 7 4 8 8 5 6 6 7 5 4 0 6 9 0 92.0 2.6
33 5 0 0 0 8 0 8 6 4 0 0 7 0 0 6 9 0 53.0 3.6
34 5 8 7 4 8 8 8 6 6 7 5 3 4 6 6 9 6 106.0 1.7
35 5 4 8 7 4 8 8 8 6 7 0 0 2 7 6 7 6 93.0 2.6
36 5 4 8 3 4 8 8 5 6 6 7 0 2 7 5 4 6 88.0 2.2
37 5 4 3 3 4 8 0 8 6 0 7 3 2 7 6 2 6 74.0 2.5
38 0 0 0 0 4 8 0 8 0 0 0 0 0 7 6 4 6 43.0 3.3
39 5 0 0 0 4 8 5 5 0 0 0 0 0 7 6 0 6 46.0 3.1
40 5 4 8 0 4 8 8 8 6 6 7 7 0 7 6 9 6 99.0 2.6
41 5 0 8 0 4 8 3 6 7 0 4 0 0 6 4 6 3 64.0 2.9
42 0 0 3 0 4 0 0 5 5 0 0 0 0 7 6 4 6 40.0 2.7
43 5 0 0 0 0 8 0 5 4 5 0 0 0 7 6 7 6 53.0 3.2
44 5 4 8 0 4 2 8 5 6 2 0 7 0 0 0 0 0 51.0 3.1
45 0 0 8 0 4 8 0 3 6 0 0 0 0 7 6 7 0 49.0 3.4
46 0 4 2 0 4 8 0 3 0 0 0 0 0 0 6 5 0 32.0 2.6
47 5 0 8 7 4 8 7 3 6 6 7 7 0 0 5 4 6 83.0 2.7
48 5 4 1 0 0 2 0 8 0 0 0 3 0 0 6 0 0 29.0 2.6
49 5 4 8 3 4 8 0 0 6 6 0 0 0 0 0 5 0 49.0 3.1
50 5 4 3 7 4 8 8 3 0 6 0 3 2 6 6 0 0 65.0 2.8
51 5 4 8 0 4 6 8 3 6 6 7 5 2 0 6 9 0 79.0 2.8
52 5 4 2 0 4 8 8 0 4 0 0 2 0 5 4 0 6 52.0 2.8
53 5 4 8 7 4 7 0 8 0 0 0 0 0 0 5 4 0 52.0 3.2
54 5 4 0 3 0 2 0 5 5 3 0 0 0 0 5 0 0 32.0 2.2
55 3 4 5 0 0 0 0 3 4 0 0 0 0 7 0 4 0 30.0 2.3
56 5 0 8 0 4 8 8 8 0 6 0 0 0 0 6 2 6 61.0 3.4
57 3 0 0 0 4 7 0 5 0 2 0 0 0 0 6 8 6 41.0 3.0
58 0 4 3 0 4 0 0 3 6 6 0 0 0 0 5 9 6 46.0 3.0
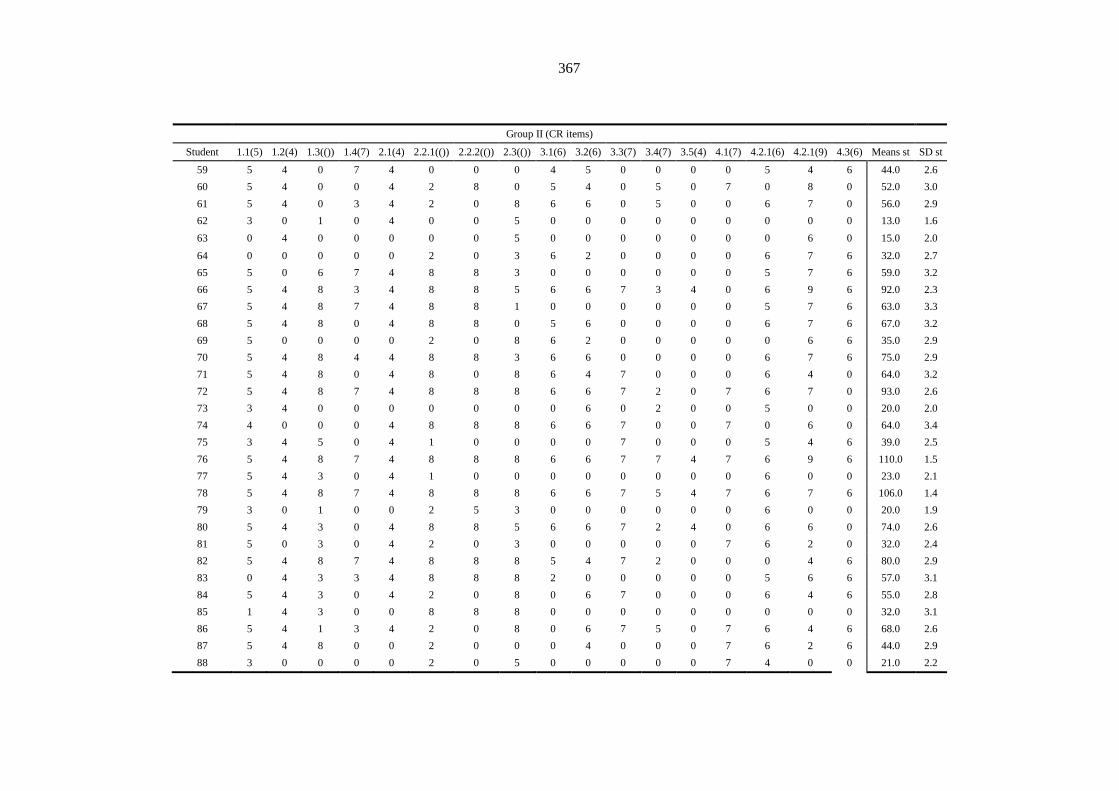
367
Group II (CR items)
Student 1.1(5) 1.2(4) 1.3(()) 1.4(7) 2.1(4) 2.2.1(()) 2.2.2(()) 2.3(()) 3.1(6) 3.2(6) 3.3(7) 3.4(7) 3.5(4) 4.1(7) 4.2.1(6) 4.2.1(9) 4.3(6) Means st SD st
59 5 4 0 7 4 0 0 0 4 5 0 0 0 0 5 4 6 44.0 2.6
60 5 4 0 0 4 2 8 0 5 4 0 5 0 7 0 8 0 52.0 3.0
61 5 4 0 3 4 2 0 8 6 6 0 5 0 0 6 7 0 56.0 2.9
62 3 0 1 0 4 0 0 5 0 0 0 0 0 0 0 0 0 13.0 1.6
63 0 4 0 0 0 0 0 5 0 0 0 0 0 0 0 6 0 15.0 2.0
64 0 0 0 0 0 2 0 3 6 2 0 0 0 0 6 7 6 32.0 2.7
65 5 0 6 7 4 8 8 3 0 0 0 0 0 0 5 7 6 59.0 3.2
66 5 4 8 3 4 8 8 5 6 6 7 3 4 0 6 9 6 92.0 2.3
67 5 4 8 7 4 8 8 1 0 0 0 0 0 0 5 7 6 63.0 3.3
68 5 4 8 0 4 8 8 0 5 6 0 0 0 0 6 7 6 67.0 3.2
69 5 0 0 0 0 2 0 8 6 2 0 0 0 0 0 6 6 35.0 2.9
70 5 4 8 4 4 8 8 3 6 6 0 0 0 0 6 7 6 75.0 2.9
71 5 4 8 0 4 8 0 8 6 4 7 0 0 0 6 4 0 64.0 3.2
72 5 4 8 7 4 8 8 8 6 6 7 2 0 7 6 7 0 93.0 2.6
73 3 4 0 0 0 0 0 0 0 6 0 2 0 0 5 0 0 20.0 2.0
74 4 0 0 0 4 8 8 8 6 6 7 0 0 7 0 6 0 64.0 3.4
75 3 4 5 0 4 1 0 0 0 0 7 0 0 0 5 4 6 39.0 2.5
76 5 4 8 7 4 8 8 8 6 6 7 7 4 7 6 9 6 110.0 1.5
77 5 4 3 0 4 1 0 0 0 0 0 0 0 0 6 0 0 23.0 2.1
78 5 4 8 7 4 8 8 8 6 6 7 5 4 7 6 7 6 106.0 1.4
79 3 0 1 0 0 2 5 3 0 0 0 0 0 0 6 0 0 20.0 1.9
80 5 4 3 0 4 8 8 5 6 6 7 2 4 0 6 6 0 74.0 2.6
81 5 0 3 0 4 2 0 3 0 0 0 0 0 7 6 2 0 32.0 2.4
82 5 4 8 7 4 8 8 8 5 4 7 2 0 0 0 4 6 80.0 2.9
83 0 4 3 3 4 8 8 8 2 0 0 0 0 0 5 6 6 57.0 3.1
84 5 4 3 0 4 2 0 8 0 6 7 0 0 0 6 4 6 55.0 2.8
85 1 4 3 0 0 8 8 8 0 0 0 0 0 0 0 0 0 32.0 3.1
86 5 4 1 3 4 2 0 8 0 6 7 5 0 7 6 4 6 68.0 2.6
87 5 4 8 0 0 2 0 0 0 4 0 0 0 7 6 2 6 44.0 2.9
88 3 0 0 0 0 2 0 5 0 0 0 0 0 7 4 0 0 21.0 2.2
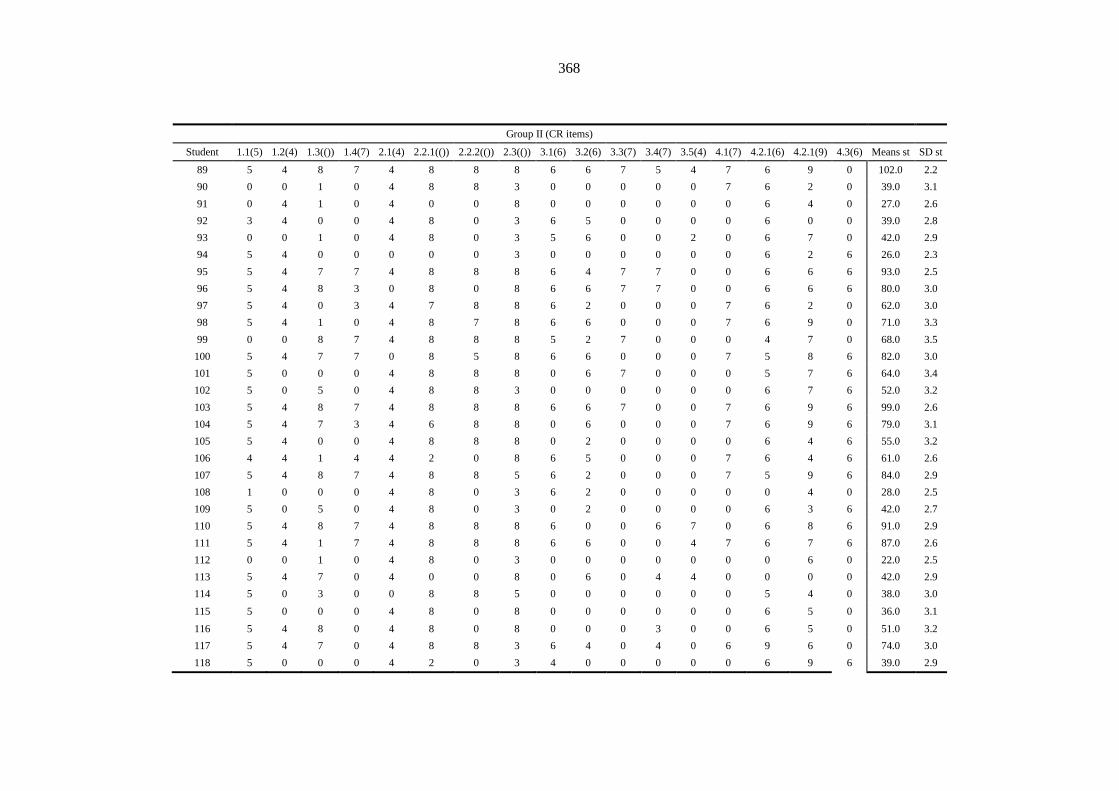
368
Group II (CR items)
Student 1.1(5) 1.2(4) 1.3(()) 1.4(7) 2.1(4) 2.2.1(()) 2.2.2(()) 2.3(()) 3.1(6) 3.2(6) 3.3(7) 3.4(7) 3.5(4) 4.1(7) 4.2.1(6) 4.2.1(9) 4.3(6) Means st SD st
89 5 4 8 7 4 8 8 8 6 6 7 5 4 7 6 9 0 102.0 2.2
90 0 0 1 0 4 8 8 3 0 0 0 0 0 7 6 2 0 39.0 3.1
91 0 4 1 0 4 0 0 8 0 0 0 0 0 0 6 4 0 27.0 2.6
92 3 4 0 0 4 8 0 3 6 5 0 0 0 0 6 0 0 39.0 2.8
93 0 0 1 0 4 8 0 3 5 6 0 0 2 0 6 7 0 42.0 2.9
94 5 4 0 0 0 0 0 3 0 0 0 0 0 0 6 2 6 26.0 2.3
95 5 4 7 7 4 8 8 8 6 4 7 7 0 0 6 6 6 93.0 2.5
96 5 4 8 3 0 8 0 8 6 6 7 7 0 0 6 6 6 80.0 3.0
97 5 4 0 3 4 7 8 8 6 2 0 0 0 7 6 2 0 62.0 3.0
98 5 4 1 0 4 8 7 8 6 6 0 0 0 7 6 9 0 71.0 3.3
99 0 0 8 7 4 8 8 8 5 2 7 0 0 0 4 7 0 68.0 3.5
100 5 4 7 7 0 8 5 8 6 6 0 0 0 7 5 8 6 82.0 3.0
101 5 0 0 0 4 8 8 8 0 6 7 0 0 0 5 7 6 64.0 3.4
102 5 0 5 0 4 8 8 3 0 0 0 0 0 0 6 7 6 52.0 3.2
103 5 4 8 7 4 8 8 8 6 6 7 0 0 7 6 9 6 99.0 2.6
104 5 4 7 3 4 6 8 8 0 6 0 0 0 7 6 9 6 79.0 3.1
105 5 4 0 0 4 8 8 8 0 2 0 0 0 0 6 4 6 55.0 3.2
106 4 4 1 4 4 2 0 8 6 5 0 0 0 7 6 4 6 61.0 2.6
107 5 4 8 7 4 8 8 5 6 2 0 0 0 7 5 9 6 84.0 2.9
108 1 0 0 0 4 8 0 3 6 2 0 0 0 0 0 4 0 28.0 2.5
109 5 0 5 0 4 8 0 3 0 2 0 0 0 0 6 3 6 42.0 2.7
110 5 4 8 7 4 8 8 8 6 0 0 6 7 0 6 8 6 91.0 2.9
111 5 4 1 7 4 8 8 8 6 6 0 0 4 7 6 7 6 87.0 2.6
112 0 0 1 0 4 8 0 3 0 0 0 0 0 0 0 6 0 22.0 2.5
113 5 4 7 0 4 0 0 8 0 6 0 4 4 0 0 0 0 42.0 2.9
114 5 0 3 0 0 8 8 5 0 0 0 0 0 0 5 4 0 38.0 3.0
115 5 0 0 0 4 8 0 8 0 0 0 0 0 0 6 5 0 36.0 3.1
116 5 4 8 0 4 8 0 8 0 0 0 3 0 0 6 5 0 51.0 3.2
117 5 4 7 0 4 8 8 3 6 4 0 4 0 6 9 6 0 74.0 3.0
118 5 0 0 0 4 2 0 3 4 0 0 0 0 0 6 9 6 39.0 2.9
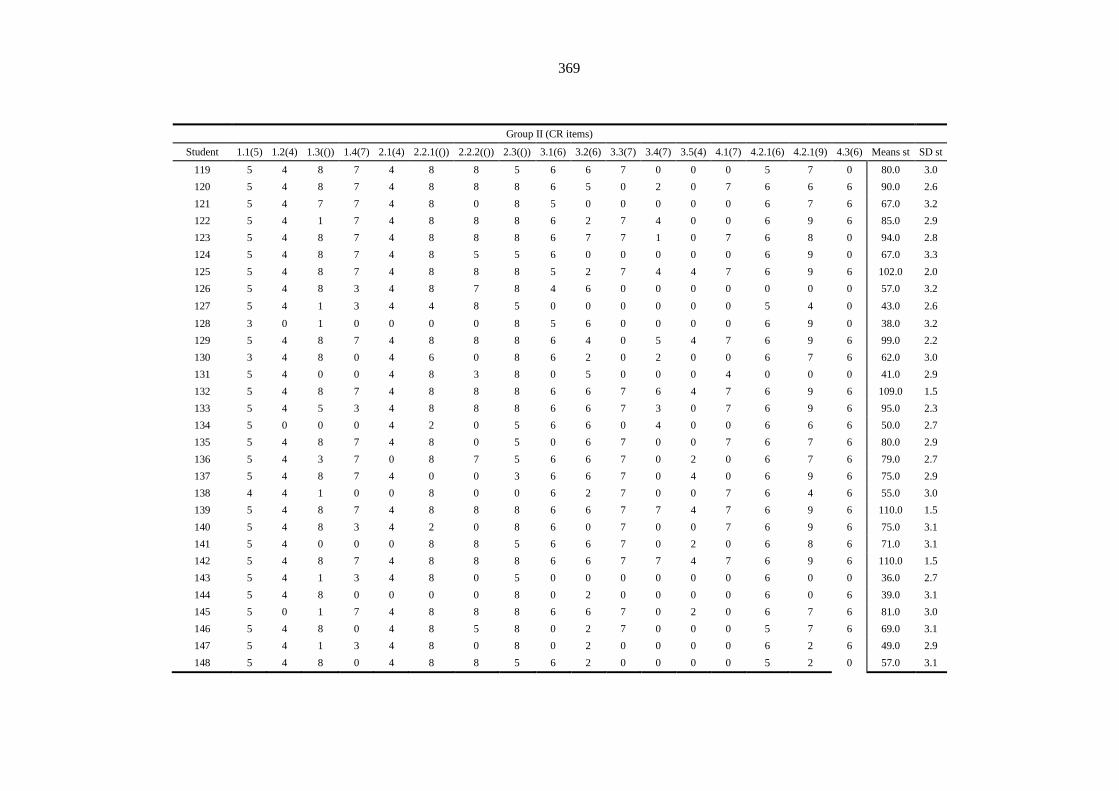
369
Group II (CR items)
Student 1.1(5) 1.2(4) 1.3(()) 1.4(7) 2.1(4) 2.2.1(()) 2.2.2(()) 2.3(()) 3.1(6) 3.2(6) 3.3(7) 3.4(7) 3.5(4) 4.1(7) 4.2.1(6) 4.2.1(9) 4.3(6) Means st SD st
119 5 4 8 7 4 8 8 5 6 6 7 0 0 0 5 7 0 80.0 3.0
120 5 4 8 7 4 8 8 8 6 5 0 2 0 7 6 6 6 90.0 2.6
121 5 4 7 7 4 8 0 8 5 0 0 0 0 0 6 7 6 67.0 3.2
122 5 4 1 7 4 8 8 8 6 2 7 4 0 0 6 9 6 85.0 2.9
123 5 4 8 7 4 8 8 8 6 7 7 1 0 7 6 8 0 94.0 2.8
124 5 4 8 7 4 8 5 5 6 0 0 0 0 0 6 9 0 67.0 3.3
125 5 4 8 7 4 8 8 8 5 2 7 4 4 7 6 9 6 102.0 2.0
126 5 4 8 3 4 8 7 8 4 6 0 0 0 0 0 0 0 57.0 3.2
127 5 4 1 3 4 4 8 5 0 0 0 0 0 0 5 4 0 43.0 2.6
128 3 0 1 0 0 0 0 8 5 6 0 0 0 0 6 9 0 38.0 3.2
129 5 4 8 7 4 8 8 8 6 4 0 5 4 7 6 9 6 99.0 2.2
130 3 4 8 0 4 6 0 8 6 2 0 2 0 0 6 7 6 62.0 3.0
131 5 4 0 0 4 8 3 8 0 5 0 0 0 4 0 0 0 41.0 2.9
132 5 4 8 7 4 8 8 8 6 6 7 6 4 7 6 9 6 109.0 1.5
133 5 4 5 3 4 8 8 8 6 6 7 3 0 7 6 9 6 95.0 2.3
134 5 0 0 0 4 2 0 5 6 6 0 4 0 0 6 6 6 50.0 2.7
135 5 4 8 7 4 8 0 5 0 6 7 0 0 7 6 7 6 80.0 2.9
136 5 4 3 7 0 8 7 5 6 6 7 0 2 0 6 7 6 79.0 2.7
137 5 4 8 7 4 0 0 3 6 6 7 0 4 0 6 9 6 75.0 2.9
138 4 4 1 0 0 8 0 0 6 2 7 0 0 7 6 4 6 55.0 3.0
139 5 4 8 7 4 8 8 8 6 6 7 7 4 7 6 9 6 110.0 1.5
140 5 4 8 3 4 2 0 8 6 0 7 0 0 7 6 9 6 75.0 3.1
141 5 4 0 0 0 8 8 5 6 6 7 0 2 0 6 8 6 71.0 3.1
142 5 4 8 7 4 8 8 8 6 6 7 7 4 7 6 9 6 110.0 1.5
143 5 4 1 3 4 8 0 5 0 0 0 0 0 0 6 0 0 36.0 2.7
144 5 4 8 0 0 0 0 8 0 2 0 0 0 0 6 0 6 39.0 3.1
145 5 0 1 7 4 8 8 8 6 6 7 0 2 0 6 7 6 81.0 3.0
146 5 4 8 0 4 8 5 8 0 2 7 0 0 0 5 7 6 69.0 3.1
147 5 4 1 3 4 8 0 8 0 2 0 0 0 0 6 2 6 49.0 2.9
148 5 4 8 0 4 8 8 5 6 2 0 0 0 0 5 2 0 57.0 3.1
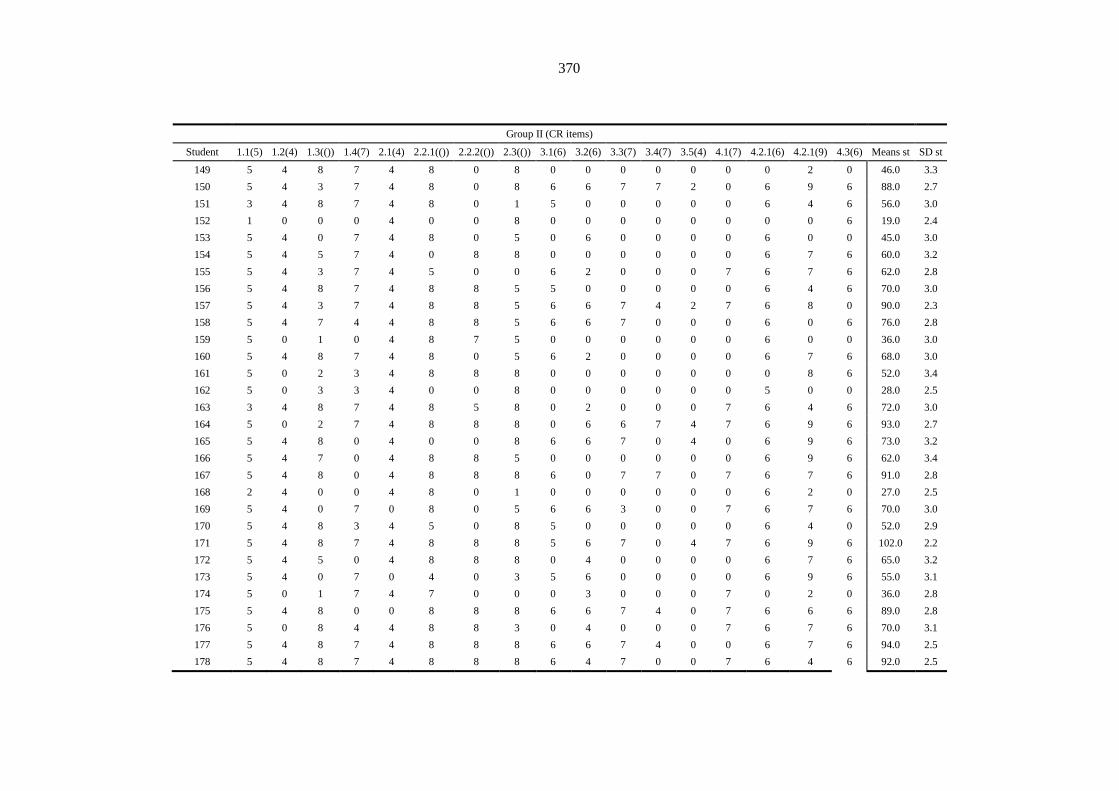
370
Group II (CR items)
Student 1.1(5) 1.2(4) 1.3(()) 1.4(7) 2.1(4) 2.2.1(()) 2.2.2(()) 2.3(()) 3.1(6) 3.2(6) 3.3(7) 3.4(7) 3.5(4) 4.1(7) 4.2.1(6) 4.2.1(9) 4.3(6) Means st SD st
149 5 4 8 7 4 8 0 8 0 0 0 0 0 0 0 2 0 46.0 3.3
150 5 4 3 7 4 8 0 8 6 6 7 7 2 0 6 9 6 88.0 2.7
151 3 4 8 7 4 8 0 1 5 0 0 0 0 0 6 4 6 56.0 3.0
152 1 0 0 0 4 0 0 8 0 0 0 0 0 0 0 0 6 19.0 2.4
153 5 4 0 7 4 8 0 5 0 6 0 0 0 0 6 0 0 45.0 3.0
154 5 4 5 7 4 0 8 8 0 0 0 0 0 0 6 7 6 60.0 3.2
155 5 4 3 7 4 5 0 0 6 2 0 0 0 7 6 7 6 62.0 2.8
156 5 4 8 7 4 8 8 5 5 0 0 0 0 0 6 4 6 70.0 3.0
157 5 4 3 7 4 8 8 5 6 6 7 4 2 7 6 8 0 90.0 2.3
158 5 4 7 4 4 8 8 5 6 6 7 0 0 0 6 0 6 76.0 2.8
159 5 0 1 0 4 8 7 5 0 0 0 0 0 0 6 0 0 36.0 3.0
160 5 4 8 7 4 8 0 5 6 2 0 0 0 0 6 7 6 68.0 3.0
161 5 0 2 3 4 8 8 8 0 0 0 0 0 0 0 8 6 52.0 3.4
162 5 0 3 3 4 0 0 8 0 0 0 0 0 0 5 0 0 28.0 2.5
163 3 4 8 7 4 8 5 8 0 2 0 0 0 7 6 4 6 72.0 3.0
164 5 0 2 7 4 8 8 8 0 6 6 7 4 7 6 9 6 93.0 2.7
165 5 4 8 0 4 0 0 8 6 6 7 0 4 0 6 9 6 73.0 3.2
166 5 4 7 0 4 8 8 5 0 0 0 0 0 0 6 9 6 62.0 3.4
167 5 4 8 0 4 8 8 8 6 0 7 7 0 7 6 7 6 91.0 2.8
168 2 4 0 0 4 8 0 1 0 0 0 0 0 0 6 2 0 27.0 2.5
169 5 4 0 7 0 8 0 5 6 6 3 0 0 7 6 7 6 70.0 3.0
170 5 4 8 3 4 5 0 8 5 0 0 0 0 0 6 4 0 52.0 2.9
171 5 4 8 7 4 8 8 8 5 6 7 0 4 7 6 9 6 102.0 2.2
172 5 4 5 0 4 8 8 8 0 4 0 0 0 0 6 7 6 65.0 3.2
173 5 4 0 7 0 4 0 3 5 6 0 0 0 0 6 9 6 55.0 3.1
174 5 0 1 7 4 7 0 0 0 3 0 0 0 7 0 2 0 36.0 2.8
175 5 4 8 0 0 8 8 8 6 6 7 4 0 7 6 6 6 89.0 2.8
176 5 0 8 4 4 8 8 3 0 4 0 0 0 7 6 7 6 70.0 3.1
177 5 4 8 7 4 8 8 8 6 6 7 4 0 0 6 7 6 94.0 2.5
178 5 4 8 7 4 8 8 8 6 4 7 0 0 7 6 4 6 92.0 2.5

371
Group II (CR items)
Student 1.1(5) 1.2(4) 1.3(()) 1.4(7) 2.1(4) 2.2.1(()) 2.2.2(()) 2.3(()) 3.1(6) 3.2(6) 3.3(7) 3.4(7) 3.5(4) 4.1(7) 4.2.1(6) 4.2.1(9) 4.3(6) Means st SD st
179 5 0 0 0 0 8 0 1 5 4 0 2 0 7 6 7 0 45.0 3.1
180 5 4 8 0 4 2 0 8 6 4 7 4 0 7 6 7 0 72.0 2.9
181 5 4 8 7 4 8 8 8 5 6 7 0 0 7 6 4 6 93.0 2.5
182 5 4 0 7 4 8 0 8 6 4 7 0 0 0 6 4 6 69.0 3.0
183 5 4 8 7 4 8 8 8 6 6 0 7 2 7 6 9 0 95.0 2.8
184 5 4 8 7 4 8 8 8 6 6 7 0 2 0 6 9 6 94.0 2.7
185 5 4 7 7 4 8 8 8 5 6 7 3 2 7 6 6 6 99.0 1.8
186 5 4 8 0 0 8 5 8 5 6 0 0 2 0 6 4 6 67.0 3.0
187 5 4 8 3 4 8 3 5 2 0 0 0 0 0 6 4 6 58.0 2.8
188 5 4 8 7 4 8 5 8 6 6 7 7 4 0 6 7 0 92.0 2.5
189 5 4 8 3 0 0 5 3 6 6 0 0 2 0 0 9 0 51.0 3.1
190 5 4 8 3 4 0 0 0 0 0 0 0 0 0 6 7 0 37.0 2.9
191 5 4 8 7 4 8 8 8 5 6 7 0 0 0 6 7 6 89.0 2.8
192 5 4 3 7 4 8 0 8 0 6 7 0 0 0 6 8 6 72.0 3.2
193 5 4 8 3 4 8 8 3 6 6 0 7 4 7 6 4 6 89.0 2.2
194 5 4 8 3 4 8 8 8 6 6 7 7 2 0 6 4 6 92.0 2.3
195 5 4 8 7 4 8 8 8 6 6 0 0 2 0 6 8 6 86.0 2.9
196 5 0 8 7 4 8 8 0 0 6 0 2 0 0 6 4 6 64.0 3.3
197 5 4 7 7 0 7 7 8 6 6 3 0 0 0 6 7 6 79.0 2.9
198 5 0 2 7 4 8 0 1 6 0 0 0 0 7 6 6 0 52.0 3.1
199 5 4 1 7 4 8 8 8 6 0 0 0 0 7 6 9 6 79.0 3.3
200 5 4 8 7 4 8 8 8 6 6 7 7 4 7 6 9 6 110.0 1.5
201 5 0 0 0 0 8 8 8 0 6 0 0 0 0 6 4 6 51.0 3.4
202 5 4 8 7 4 8 8 8 6 6 7 7 4 7 6 8 6 109.0 1.5
203 5 4 5 0 4 8 2 3 6 4 0 4 0 7 6 3 6 67.0 2.4
204 3 4 1 0 4 0 0 3 6 4 7 0 0 7 6 4 6 55.0 2.6
205 5 4 0 7 0 8 7 3 6 4 7 0 0 0 6 7 6 70.0 3.0
206 5 0 2 0 0 2 0 8 0 6 0 0 0 7 6 4 0 40.0 3.0
207 5 4 8 3 4 8 8 0 6 6 7 0 0 0 6 6 0 71.0 3.1
208 5 4 8 0 4 8 8 1 6 6 0 0 0 0 5 7 6 68.0 3.2
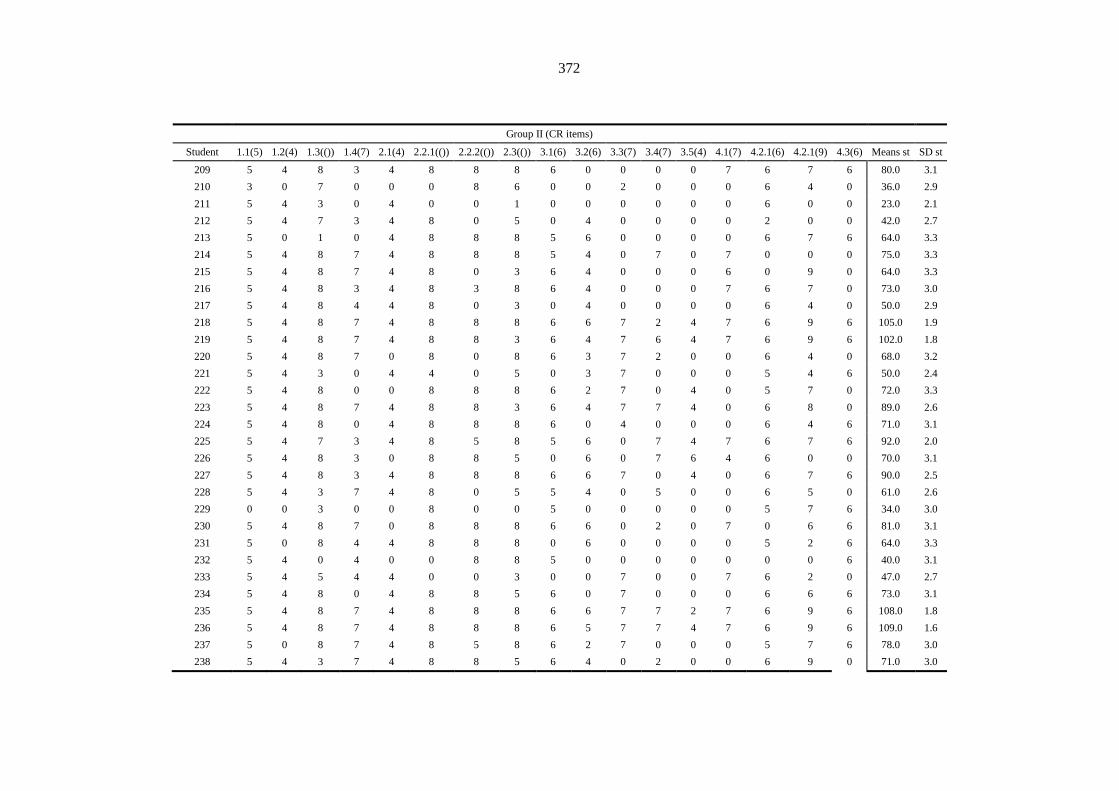
372
Group II (CR items)
Student 1.1(5) 1.2(4) 1.3(()) 1.4(7) 2.1(4) 2.2.1(()) 2.2.2(()) 2.3(()) 3.1(6) 3.2(6) 3.3(7) 3.4(7) 3.5(4) 4.1(7) 4.2.1(6) 4.2.1(9) 4.3(6) Means st SD st
209 5 4 8 3 4 8 8 8 6 0 0 0 0 7 6 7 6 80.0 3.1
210 3 0 7 0 0 0 8 6 0 0 2 0 0 0 6 4 0 36.0 2.9
211 5 4 3 0 4 0 0 1 0 0 0 0 0 0 6 0 0 23.0 2.1
212 5 4 7 3 4 8 0 5 0 4 0 0 0 0 2 0 0 42.0 2.7
213 5 0 1 0 4 8 8 8 5 6 0 0 0 0 6 7 6 64.0 3.3
214 5 4 8 7 4 8 8 8 5 4 0 7 0 7 0 0 0 75.0 3.3
215 5 4 8 7 4 8 0 3 6 4 0 0 0 6 0 9 0 64.0 3.3
216 5 4 8 3 4 8 3 8 6 4 0 0 0 7 6 7 0 73.0 3.0
217 5 4 8 4 4 8 0 3 0 4 0 0 0 0 6 4 0 50.0 2.9
218 5 4 8 7 4 8 8 8 6 6 7 2 4 7 6 9 6 105.0 1.9
219 5 4 8 7 4 8 8 3 6 4 7 6 4 7 6 9 6 102.0 1.8
220 5 4 8 7 0 8 0 8 6 3 7 2 0 0 6 4 0 68.0 3.2
221 5 4 3 0 4 4 0 5 0 3 7 0 0 0 5 4 6 50.0 2.4
222 5 4 8 0 0 8 8 8 6 2 7 0 4 0 5 7 0 72.0 3.3
223 5 4 8 7 4 8 8 3 6 4 7 7 4 0 6 8 0 89.0 2.6
224 5 4 8 0 4 8 8 8 6 0 4 0 0 0 6 4 6 71.0 3.1
225 5 4 7 3 4 8 5 8 5 6 0 7 4 7 6 7 6 92.0 2.0
226 5 4 8 3 0 8 8 5 0 6 0 7 6 4 6 0 0 70.0 3.1
227 5 4 8 3 4 8 8 8 6 6 7 0 4 0 6 7 6 90.0 2.5
228 5 4 3 7 4 8 0 5 5 4 0 5 0 0 6 5 0 61.0 2.6
229 0 0 3 0 0 8 0 0 5 0 0 0 0 0 5 7 6 34.0 3.0
230 5 4 8 7 0 8 8 8 6 6 0 2 0 7 0 6 6 81.0 3.1
231 5 0 8 4 4 8 8 8 0 6 0 0 0 0 5 2 6 64.0 3.3
232 5 4 0 4 0 0 8 8 5 0 0 0 0 0 0 0 6 40.0 3.1
233 5 4 5 4 4 0 0 3 0 0 7 0 0 7 6 2 0 47.0 2.7
234 5 4 8 0 4 8 8 5 6 0 7 0 0 0 6 6 6 73.0 3.1
235 5 4 8 7 4 8 8 8 6 6 7 7 2 7 6 9 6 108.0 1.8
236 5 4 8 7 4 8 8 8 6 5 7 7 4 7 6 9 6 109.0 1.6
237 5 0 8 7 4 8 5 8 6 2 7 0 0 0 5 7 6 78.0 3.0
238 5 4 3 7 4 8 8 5 6 4 0 2 0 0 6 9 0 71.0 3.0
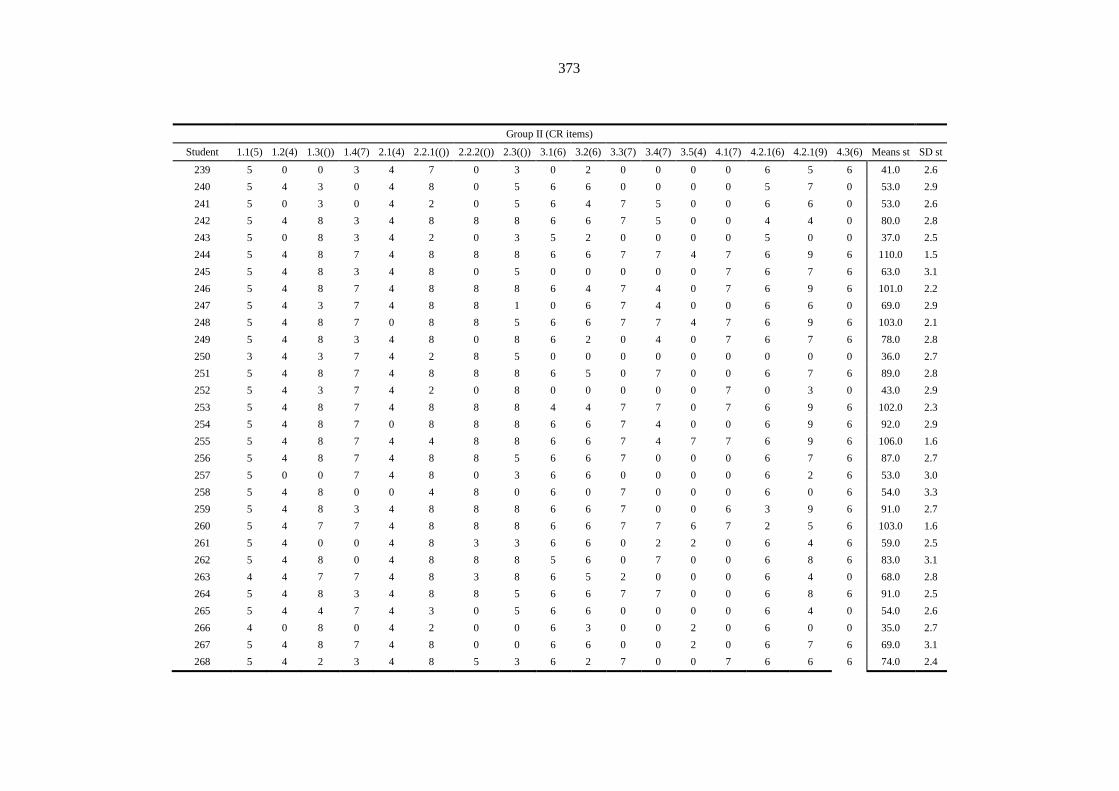
373
Group II (CR items)
Student 1.1(5) 1.2(4) 1.3(()) 1.4(7) 2.1(4) 2.2.1(()) 2.2.2(()) 2.3(()) 3.1(6) 3.2(6) 3.3(7) 3.4(7) 3.5(4) 4.1(7) 4.2.1(6) 4.2.1(9) 4.3(6) Means st SD st
239 5 0 0 3 4 7 0 3 0 2 0 0 0 0 6 5 6 41.0 2.6
240 5 4 3 0 4 8 0 5 6 6 0 0 0 0 5 7 0 53.0 2.9
241 5 0 3 0 4 2 0 5 6 4 7 5 0 0 6 6 0 53.0 2.6
242 5 4 8 3 4 8 8 8 6 6 7 5 0 0 4 4 0 80.0 2.8
243 5 0 8 3 4 2 0 3 5 2 0 0 0 0 5 0 0 37.0 2.5
244 5 4 8 7 4 8 8 8 6 6 7 7 4 7 6 9 6 110.0 1.5
245 5 4 8 3 4 8 0 5 0 0 0 0 0 7 6 7 6 63.0 3.1
246 5 4 8 7 4 8 8 8 6 4 7 4 0 7 6 9 6 101.0 2.2
247 5 4 3 7 4 8 8 1 0 6 7 4 0 0 6 6 0 69.0 2.9
248 5 4 8 7 0 8 8 5 6 6 7 7 4 7 6 9 6 103.0 2.1
249 5 4 8 3 4 8 0 8 6 2 0 4 0 7 6 7 6 78.0 2.8
250 3 4 3 7 4 2 8 5 0 0 0 0 0 0 0 0 0 36.0 2.7
251 5 4 8 7 4 8 8 8 6 5 0 7 0 0 6 7 6 89.0 2.8
252 5 4 3 7 4 2 0 8 0 0 0 0 0 7 0 3 0 43.0 2.9
253 5 4 8 7 4 8 8 8 4 4 7 7 0 7 6 9 6 102.0 2.3
254 5 4 8 7 0 8 8 8 6 6 7 4 0 0 6 9 6 92.0 2.9
255 5 4 8 7 4 4 8 8 6 6 7 4 7 7 6 9 6 106.0 1.6
256 5 4 8 7 4 8 8 5 6 6 7 0 0 0 6 7 6 87.0 2.7
257 5 0 0 7 4 8 0 3 6 6 0 0 0 0 6 2 6 53.0 3.0
258 5 4 8 0 0 4 8 0 6 0 7 0 0 0 6 0 6 54.0 3.3
259 5 4 8 3 4 8 8 8 6 6 7 0 0 6 3 9 6 91.0 2.7
260 5 4 7 7 4 8 8 8 6 6 7 7 6 7 2 5 6 103.0 1.6
261 5 4 0 0 4 8 3 3 6 6 0 2 2 0 6 4 6 59.0 2.5
262 5 4 8 0 4 8 8 8 5 6 0 7 0 0 6 8 6 83.0 3.1
263 4 4 7 7 4 8 3 8 6 5 2 0 0 0 6 4 0 68.0 2.8
264 5 4 8 3 4 8 8 5 6 6 7 7 0 0 6 8 6 91.0 2.5
265 5 4 4 7 4 3 0 5 6 6 0 0 0 0 6 4 0 54.0 2.6
266 4 0 8 0 4 2 0 0 6 3 0 0 2 0 6 0 0 35.0 2.7
267 5 4 8 7 4 8 0 0 6 6 0 0 2 0 6 7 6 69.0 3.1
268 5 4 2 3 4 8 5 3 6 2 7 0 0 7 6 6 6 74.0 2.4
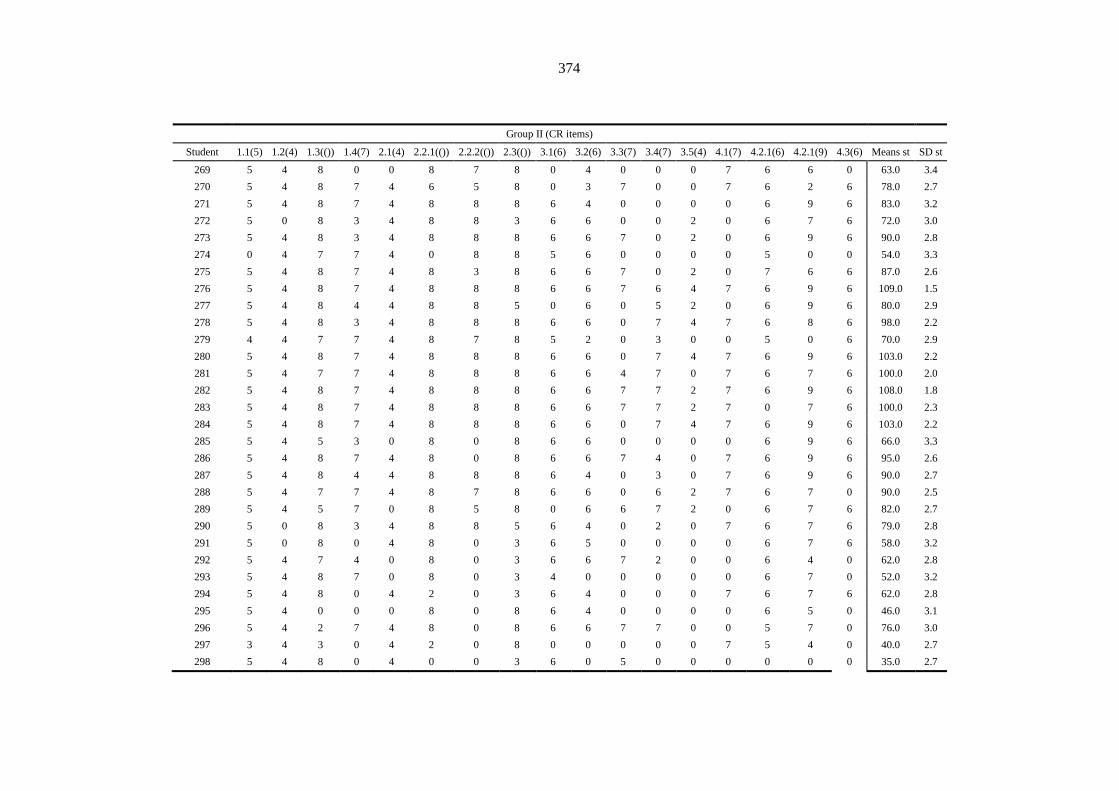
374
Group II (CR items)
Student 1.1(5) 1.2(4) 1.3(()) 1.4(7) 2.1(4) 2.2.1(()) 2.2.2(()) 2.3(()) 3.1(6) 3.2(6) 3.3(7) 3.4(7) 3.5(4) 4.1(7) 4.2.1(6) 4.2.1(9) 4.3(6) Means st SD st
269 5 4 8 0 0 8 7 8 0 4 0 0 0 7 6 6 0 63.0 3.4
270 5 4 8 7 4 6 5 8 0 3 7 0 0 7 6 2 6 78.0 2.7
271 5 4 8 7 4 8 8 8 6 4 0 0 0 0 6 9 6 83.0 3.2
272 5 0 8 3 4 8 8 3 6 6 0 0 2 0 6 7 6 72.0 3.0
273 5 4 8 3 4 8 8 8 6 6 7 0 2 0 6 9 6 90.0 2.8
274 0 4 7 7 4 0 8 8 5 6 0 0 0 0 5 0 0 54.0 3.3
275 5 4 8 7 4 8 3 8 6 6 7 0 2 0 7 6 6 87.0 2.6
276 5 4 8 7 4 8 8 8 6 6 7 6 4 7 6 9 6 109.0 1.5
277 5 4 8 4 4 8 8 5 0 6 0 5 2 0 6 9 6 80.0 2.9
278 5 4 8 3 4 8 8 8 6 6 0 7 4 7 6 8 6 98.0 2.2
279 4 4 7 7 4 8 7 8 5 2 0 3 0 0 5 0 6 70.0 2.9
280 5 4 8 7 4 8 8 8 6 6 0 7 4 7 6 9 6 103.0 2.2
281 5 4 7 7 4 8 8 8 6 6 4 7 0 7 6 7 6 100.0 2.0
282 5 4 8 7 4 8 8 8 6 6 7 7 2 7 6 9 6 108.0 1.8
283 5 4 8 7 4 8 8 8 6 6 7 7 2 7 0 7 6 100.0 2.3
284 5 4 8 7 4 8 8 8 6 6 0 7 4 7 6 9 6 103.0 2.2
285 5 4 5 3 0 8 0 8 6 6 0 0 0 0 6 9 6 66.0 3.3
286 5 4 8 7 4 8 0 8 6 6 7 4 0 7 6 9 6 95.0 2.6
287 5 4 8 4 4 8 8 8 6 4 0 3 0 7 6 9 6 90.0 2.7
288 5 4 7 7 4 8 7 8 6 6 0 6 2 7 6 7 0 90.0 2.5
289 5 4 5 7 0 8 5 8 0 6 6 7 2 0 6 7 6 82.0 2.7
290 5 0 8 3 4 8 8 5 6 4 0 2 0 7 6 7 6 79.0 2.8
291 5 0 8 0 4 8 0 3 6 5 0 0 0 0 6 7 6 58.0 3.2
292 5 4 7 4 0 8 0 3 6 6 7 2 0 0 6 4 0 62.0 2.8
293 5 4 8 7 0 8 0 3 4 0 0 0 0 0 6 7 0 52.0 3.2
294 5 4 8 0 4 2 0 3 6 4 0 0 0 7 6 7 6 62.0 2.8
295 5 4 0 0 0 8 0 8 6 4 0 0 0 0 6 5 0 46.0 3.1
296 5 4 2 7 4 8 0 8 6 6 7 7 0 0 5 7 0 76.0 3.0
297 3 4 3 0 4 2 0 8 0 0 0 0 0 7 5 4 0 40.0 2.7
298 5 4 8 0 4 0 0 3 6 0 5 0 0 0 0 0 0 35.0 2.7
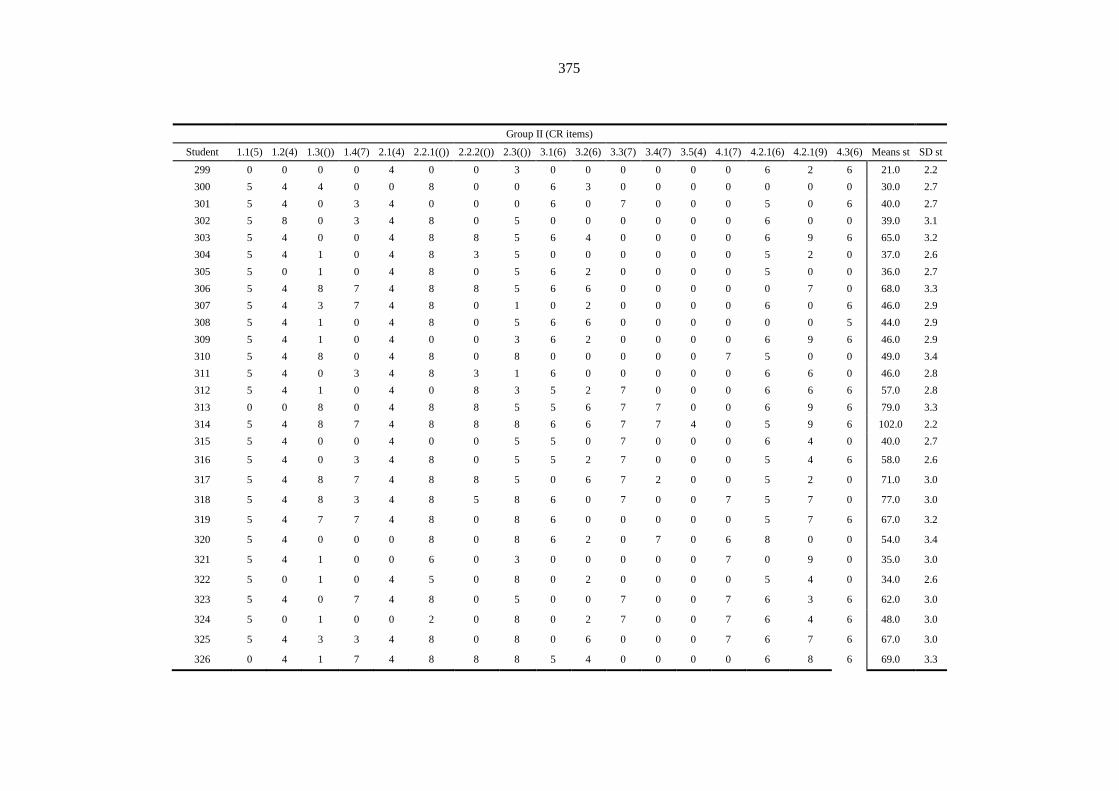
375
Group II (CR items)
Student 1.1(5) 1.2(4) 1.3(()) 1.4(7) 2.1(4) 2.2.1(()) 2.2.2(()) 2.3(()) 3.1(6) 3.2(6) 3.3(7) 3.4(7) 3.5(4) 4.1(7) 4.2.1(6) 4.2.1(9) 4.3(6) Means st SD st
299 0 0 0 0 4 0 0 3 0 0 0 0 0 0 6 2 6 21.0 2.2
300 5 4 4 0 0 8 0 0 6 3 0 0 0 0 0 0 0 30.0 2.7
301 5 4 0 3 4 0 0 0 6 0 7 0 0 0 5 0 6 40.0 2.7
302 5 8 0 3 4 8 0 5 0 0 0 0 0 0 6 0 0 39.0 3.1
303 5 4 0 0 4 8 8 5 6 4 0 0 0 0 6 9 6 65.0 3.2
304 5 4 1 0 4 8 3 5 0 0 0 0 0 0 5 2 0 37.0 2.6
305 5 0 1 0 4 8 0 5 6 2 0 0 0 0 5 0 0 36.0 2.7
306 5 4 8 7 4 8 8 5 6 6 0 0 0 0 0 7 0 68.0 3.3
307 5 4 3 7 4 8 0 1 0 2 0 0 0 0 6 0 6 46.0 2.9
308 5 4 1 0 4 8 0 5 6 6 0 0 0 0 0 0 5 44.0 2.9
309 5 4 1 0 4 0 0 3 6 2 0 0 0 0 6 9 6 46.0 2.9
310 5 4 8 0 4 8 0 8 0 0 0 0 0 7 5 0 0 49.0 3.4
311 5 4 0 3 4 8 3 1 6 0 0 0 0 0 6 6 0 46.0 2.8
312 5 4 1 0 4 0 8 3 5 2 7 0 0 0 6 6 6 57.0 2.8
313 0 0 8 0 4 8 8 5 5 6 7 7 0 0 6 9 6 79.0 3.3
314 5 4 8 7 4 8 8 8 6 6 7 7 4 0 5 9 6 102.0 2.2
315 5 4 0 0 4 0 0 5 5 0 7 0 0 0 6 4 0 40.0 2.7
316 5 4 0 3 4 8 0 5 5 2 7 0 0 0 5 4 6 58.0 2.6
317 5 4 8 7 4 8 8 5 0 6 7 2 0 0 5 2 0 71.0 3.0
318 5 4 8 3 4 8 5 8 6 0 7 0 0 7 5 7 0 77.0 3.0
319 5 4 7 7 4 8 0 8 6 0 0 0 0 0 5 7 6 67.0 3.2
320 5 4 0 0 0 8 0 8 6 2 0 7 0 6 8 0 0 54.0 3.4
321 5 4 1 0 0 6 0 3 0 0 0 0 0 7 0 9 0 35.0 3.0
322 5 0 1 0 4 5 0 8 0 2 0 0 0 0 5 4 0 34.0 2.6
323 5 4 0 7 4 8 0 5 0 0 7 0 0 7 6 3 6 62.0 3.0
324 5 0 1 0 0 2 0 8 0 2 7 0 0 7 6 4 6 48.0 3.0
325 5 4 3 3 4 8 0 8 0 6 0 0 0 7 6 7 6 67.0 3.0
326 0 4 1 7 4 8 8 8 5 4 0 0 0 0 6 8 6 69.0 3.3

376
Group II (CR items)
Student 1.1(5) 1.2(4) 1.3(()) 1.4(7) 2.1(4) 2.2.1(()) 2.2.2(()) 2.3(()) 3.1(6) 3.2(6) 3.3(7) 3.4(7) 3.5(4) 4.1(7) 4.2.1(6) 4.2.1(9) 4.3(6) Means st SD st
327 5 4 8 7 4 8 8 1 6 2 0 0 0 7 6 4 6 76.0 2.9
328 3 0 8 3 0 8 0 5 5 2 0 0 0 7 6 9 6 62.0 3.3
329 5 4 8 7 4 8 8 8 6 6 7 7 4 7 6 7 6 108.0 1.4
330 5 4 8 3 4 8 8 8 5 0 0 0 0 0 0 4 0 57.0 3.3
331 5 4 1 0 0 8 0 8 6 6 7 0 0 0 6 4 6 61.0 3.2
332 5 0 0 3 0 0 0 3 0 0 0 0 0 0 0 0 6 17.0 2.0
333 5 4 8 7 4 8 8 8 6 6 7 0 0 0 6 2 6 85.0 2.9
334 5 0 0 0 4 0 0 3 0 0 0 0 0 0 6 7 0 25.0 2.5
335 5 4 0 7 4 8 0 3 6 6 7 0 0 0 5 9 6 70.0 3.1
336 5 4 8 0 4 8 8 3 4 2 0 0 0 7 6 7 0 66.0 3.1
337 5 4 8 7 4 8 8 5 6 6 7 0 0 0 6 3 6 83.0 2.7
338 5 4 1 7 4 8 0 8 0 2 0 0 0 0 6 2 0 47.0 3.1
339 5 4 8 7 4 8 8 8 6 0 7 0 0 0 6 9 0 80.0 3.4
340 5 4 8 3 4 8 8 8 6 6 0 7 4 0 6 7 6 90.0 2.5
341 5 4 1 3 4 8 8 8 6 5 7 4 4 0 6 4 0 77.0 2.6
342 5 4 8 7 4 8 8 8 6 6 0 0 0 7 6 9 6 92.0 2.9
343 5 4 8 7 4 8 8 0 6 5 7 0 0 0 5 8 6 81.0 3.0
344 5 4 1 3 4 8 0 8 6 6 0 0 0 7 0 2 0 54.0 3.0
345 5 0 1 0 4 2 8 0 0 0 0 0 0 7 6 0 0 33.0 2.9
346 5 4 8 0 0 0 0 0 0 4 0 0 0 0 5 5 0 31.0 2.7
347 3 4 1 3 0 0 0 0 0 0 0 0 0 7 5 0 6 29.0 2.4
348 3 0 1 0 4 0 0 8 6 0 0 0 0 0 6 0 0 28.0 2.7
349 5 4 8 7 4 8 8 8 6 6 7 7 4 7 6 9 0 104.0 2.2
350 5 0 8 0 4 0 0 5 0 0 0 0 0 0 6 0 0 28.0 2.7
351 5 3 3 4 4 8 8 8 6 6 0 5 0 0 5 7 6 78.0 2.7
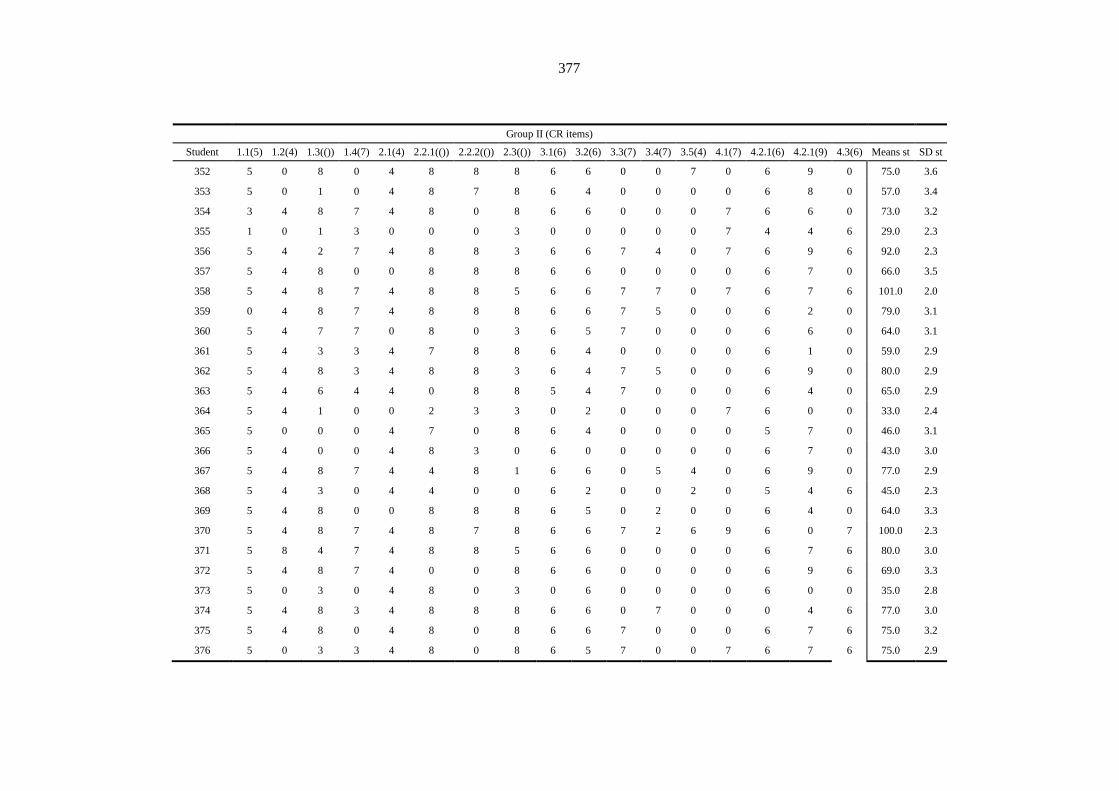
377
Group II (CR items)
Student 1.1(5) 1.2(4) 1.3(()) 1.4(7) 2.1(4) 2.2.1(()) 2.2.2(()) 2.3(()) 3.1(6) 3.2(6) 3.3(7) 3.4(7) 3.5(4) 4.1(7) 4.2.1(6) 4.2.1(9) 4.3(6) Means st SD st
352 5 0 8 0 4 8 8 8 6 6 0 0 7 0 6 9 0 75.0 3.6
353 5 0 1 0 4 8 7 8 6 4 0 0 0 0 6 8 0 57.0 3.4
354 3 4 8 7 4 8 0 8 6 6 0 0 0 7 6 6 0 73.0 3.2
355 1 0 1 3 0 0 0 3 0 0 0 0 0 7 4 4 6 29.0 2.3
356 5 4 2 7 4 8 8 3 6 6 7 4 0 7 6 9 6 92.0 2.3
357 5 4 8 0 0 8 8 8 6 6 0 0 0 0 6 7 0 66.0 3.5
358 5 4 8 7 4 8 8 5 6 6 7 7 0 7 6 7 6 101.0 2.0
359 0 4 8 7 4 8 8 8 6 6 7 5 0 0 6 2 0 79.0 3.1
360 5 4 7 7 0 8 0 3 6 5 7 0 0 0 6 6 0 64.0 3.1
361 5 4 3 3 4 7 8 8 6 4 0 0 0 0 6 1 0 59.0 2.9
362 5 4 8 3 4 8 8 3 6 4 7 5 0 0 6 9 0 80.0 2.9
363 5 4 6 4 4 0 8 8 5 4 7 0 0 0 6 4 0 65.0 2.9
364 5 4 1 0 0 2 3 3 0 2 0 0 0 7 6 0 0 33.0 2.4
365 5 0 0 0 4 7 0 8 6 4 0 0 0 0 5 7 0 46.0 3.1
366 5 4 0 0 4 8 3 0 6 0 0 0 0 0 6 7 0 43.0 3.0
367 5 4 8 7 4 4 8 1 6 6 0 5 4 0 6 9 0 77.0 2.9
368 5 4 3 0 4 4 0 0 6 2 0 0 2 0 5 4 6 45.0 2.3
369 5 4 8 0 0 8 8 8 6 5 0 2 0 0 6 4 0 64.0 3.3
370 5 4 8 7 4 8 7 8 6 6 7 2 6 9 6 0 7 100.0 2.3
371 5 8 4 7 4 8 8 5 6 6 0 0 0 0 6 7 6 80.0 3.0
372 5 4 8 7 4 0 0 8 6 6 0 0 0 0 6 9 6 69.0 3.3
373 5 0 3 0 4 8 0 3 0 6 0 0 0 0 6 0 0 35.0 2.8
374 5 4 8 3 4 8 8 8 6 6 0 7 0 0 0 4 6 77.0 3.0
375 5 4 8 0 4 8 0 8 6 6 7 0 0 0 6 7 6 75.0 3.2
376 5 0 3 3 4 8 0 8 6 5 7 0 0 7 6 7 6 75.0 2.9
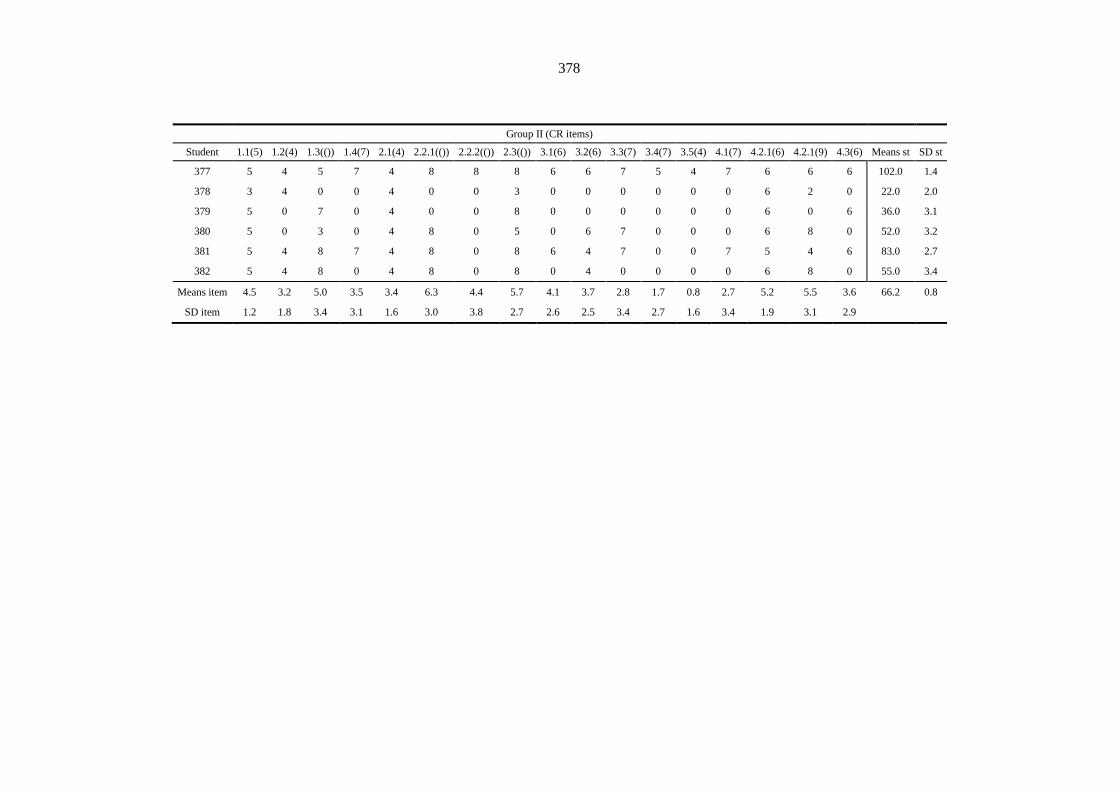
378
Group II (CR items)
Student 1.1(5) 1.2(4) 1.3(()) 1.4(7) 2.1(4) 2.2.1(()) 2.2.2(()) 2.3(()) 3.1(6) 3.2(6) 3.3(7) 3.4(7) 3.5(4) 4.1(7) 4.2.1(6) 4.2.1(9) 4.3(6) Means st SD st
377 5 4 5 7 4 8 8 8 6 6 7 5 4 7 6 6 6 102.0 1.4
378 3 4 0 0 4 0 0 3 0 0 0 0 0 0 6 2 0 22.0 2.0
379 5 0 7 0 4 0 0 8 0 0 0 0 0 0 6 0 6 36.0 3.1
380 5 0 3 0 4 8 0 5 0 6 7 0 0 0 6 8 0 52.0 3.2
381 5 4 8 7 4 8 0 8 6 4 7 0 0 7 5 4 6 83.0 2.7
382 5 4 8 0 4 8 0 8 0 4 0 0 0 0 6 8 0 55.0 3.4
Means item 4.5 3.2 5.0 3.5 3.4 6.3 4.4 5.7 4.1 3.7 2.8 1.7 0.8 2.7 5.2 5.5 3.6 66.2 0.8
SD item 1.2 1.8 3.4 3.1 1.6 3.0 3.8 2.7 2.6 2.5 3.4 2.7 1.6 3.4 1.9 3.1 2.9
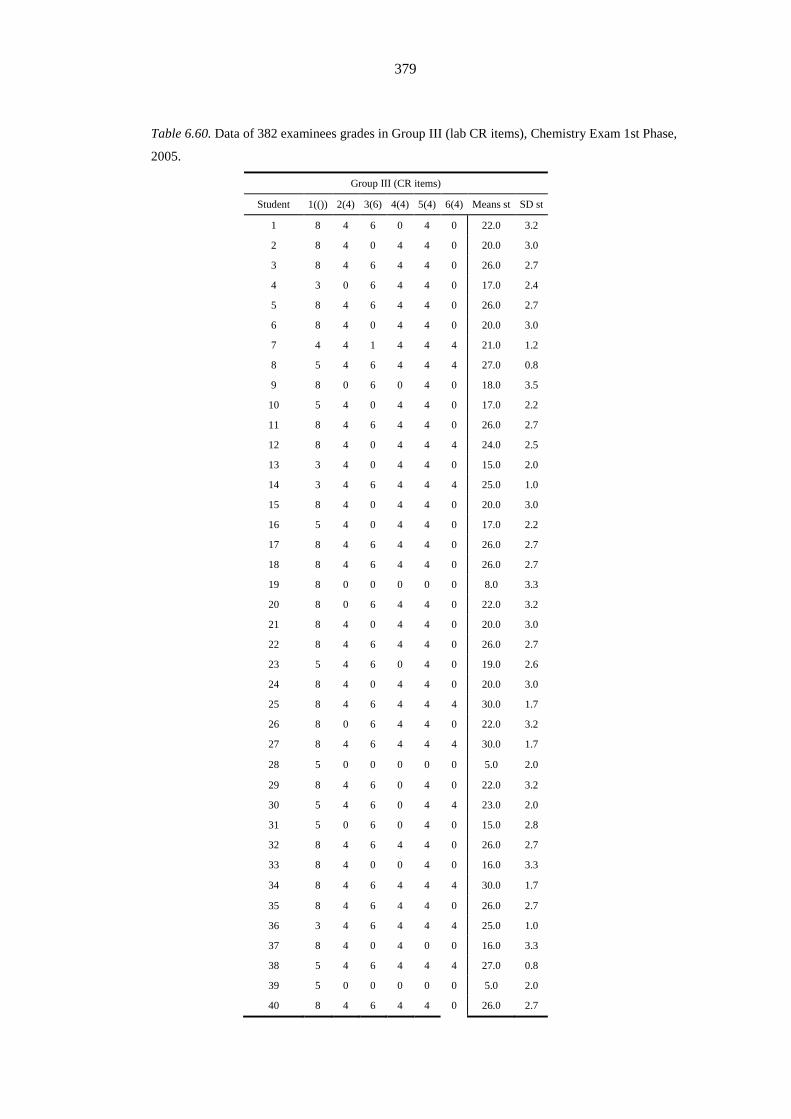
379
Table 6.60. Data of 382 examinees grades in Group III (lab CR items), Chemistry Exam 1st Phase,
2005.
Group III (CR items)
Student 1(()) 2(4) 3(6) 4(4) 5(4) 6(4) Means st SD st
1 8 4 6 0 4 0 22.0 3.2
2 8 4 0 4 4 0 20.0 3.0
3 8 4 6 4 4 0 26.0 2.7
4 3 0 6 4 4 0 17.0 2.4
5 8 4 6 4 4 0 26.0 2.7
6 8 4 0 4 4 0 20.0 3.0
7 4 4 1 4 4 4 21.0 1.2
8 5 4 6 4 4 4 27.0 0.8
9 8 0 6 0 4 0 18.0 3.5
10 5 4 0 4 4 0 17.0 2.2
11 8 4 6 4 4 0 26.0 2.7
12 8 4 0 4 4 4 24.0 2.5
13 3 4 0 4 4 0 15.0 2.0
14 3 4 6 4 4 4 25.0 1.0
15 8 4 0 4 4 0 20.0 3.0
16 5 4 0 4 4 0 17.0 2.2
17 8 4 6 4 4 0 26.0 2.7
18 8 4 6 4 4 0 26.0 2.7
19 8 0 0 0 0 0 8.0 3.3
20 8 0 6 4 4 0 22.0 3.2
21 8 4 0 4 4 0 20.0 3.0
22 8 4 6 4 4 0 26.0 2.7
23 5 4 6 0 4 0 19.0 2.6
24 8 4 0 4 4 0 20.0 3.0
25 8 4 6 4 4 4 30.0 1.7
26 8 0 6 4 4 0 22.0 3.2
27 8 4 6 4 4 4 30.0 1.7
28 5 0 0 0 0 0 5.0 2.0
29 8 4 6 0 4 0 22.0 3.2
30 5 4 6 0 4 4 23.0 2.0
31 5 0 6 0 4 0 15.0 2.8
32 8 4 6 4 4 0 26.0 2.7
33 8 4 0 0 4 0 16.0 3.3
34 8 4 6 4 4 4 30.0 1.7
35 8 4 6 4 4 0 26.0 2.7
36 3 4 6 4 4 4 25.0 1.0
37 8 4 0 4 0 0 16.0 3.3
38 5 4 6 4 4 4 27.0 0.8
39 5 0 0 0 0 0 5.0 2.0
40 8 4 6 4 4 0 26.0 2.7
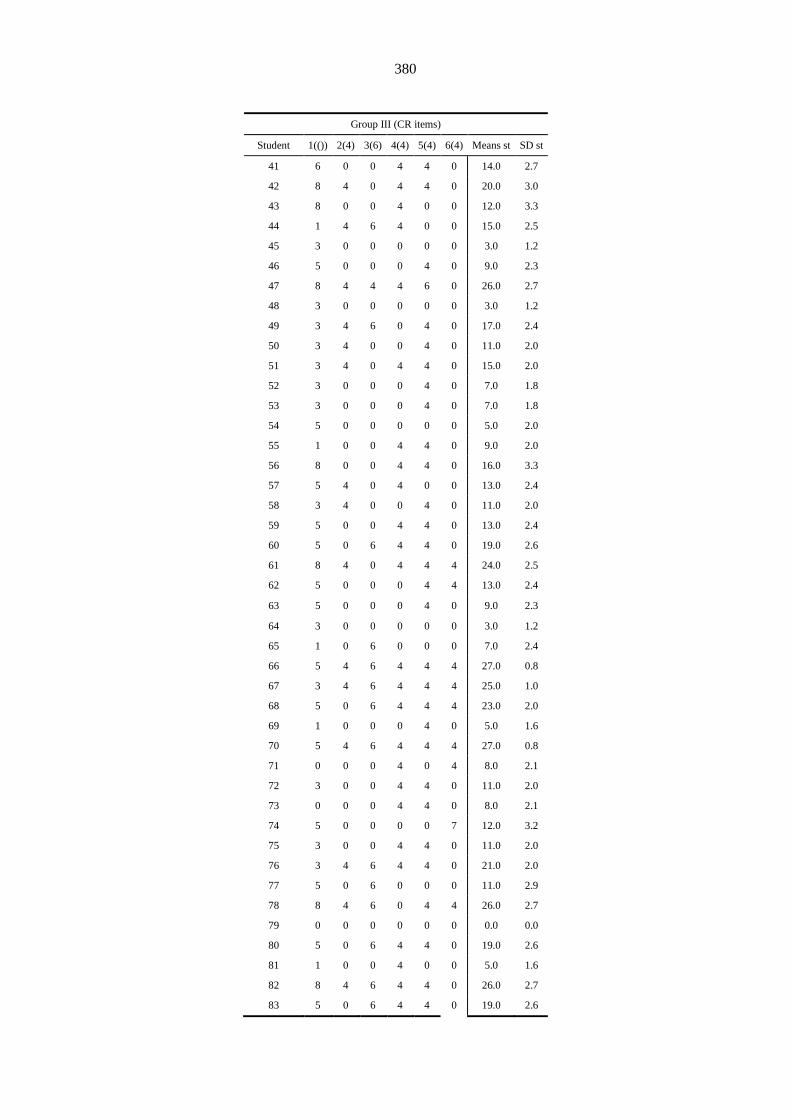
380
Group III (CR items)
Student 1(()) 2(4) 3(6) 4(4) 5(4) 6(4) Means st SD st
41 6 0 0 4 4 0 14.0 2.7
42 8 4 0 4 4 0 20.0 3.0
43 8 0 0 4 0 0 12.0 3.3
44 1 4 6 4 0 0 15.0 2.5
45 3 0 0 0 0 0 3.0 1.2
46 5 0 0 0 4 0 9.0 2.3
47 8 4 4 4 6 0 26.0 2.7
48 3 0 0 0 0 0 3.0 1.2
49 3 4 6 0 4 0 17.0 2.4
50 3 4 0 0 4 0 11.0 2.0
51 3 4 0 4 4 0 15.0 2.0
52 3 0 0 0 4 0 7.0 1.8
53 3 0 0 0 4 0 7.0 1.8
54 5 0 0 0 0 0 5.0 2.0
55 1 0 0 4 4 0 9.0 2.0
56 8 0 0 4 4 0 16.0 3.3
57 5 4 0 4 0 0 13.0 2.4
58 3 4 0 0 4 0 11.0 2.0
59 5 0 0 4 4 0 13.0 2.4
60 5 0 6 4 4 0 19.0 2.6
61 8 4 0 4 4 4 24.0 2.5
62 5 0 0 0 4 4 13.0 2.4
63 5 0 0 0 4 0 9.0 2.3
64 3 0 0 0 0 0 3.0 1.2
65 1 0 6 0 0 0 7.0 2.4
66 5 4 6 4 4 4 27.0 0.8
67 3 4 6 4 4 4 25.0 1.0
68 5 0 6 4 4 4 23.0 2.0
69 1 0 0 0 4 0 5.0 1.6
70 5 4 6 4 4 4 27.0 0.8
71 0 0 0 4 0 4 8.0 2.1
72 3 0 0 4 4 0 11.0 2.0
73 0 0 0 4 4 0 8.0 2.1
74 5 0 0 0 0 7 12.0 3.2
75 3 0 0 4 4 0 11.0 2.0
76 3 4 6 4 4 0 21.0 2.0
77 5 0 6 0 0 0 11.0 2.9
78 8 4 6 0 4 4 26.0 2.7
79 0 0 0 0 0 0 0.0 0.0
80 5 0 6 4 4 0 19.0 2.6
81 1 0 0 4 0 0 5.0 1.6
82 8 4 6 4 4 0 26.0 2.7
83 5 0 6 4 4 0 19.0 2.6
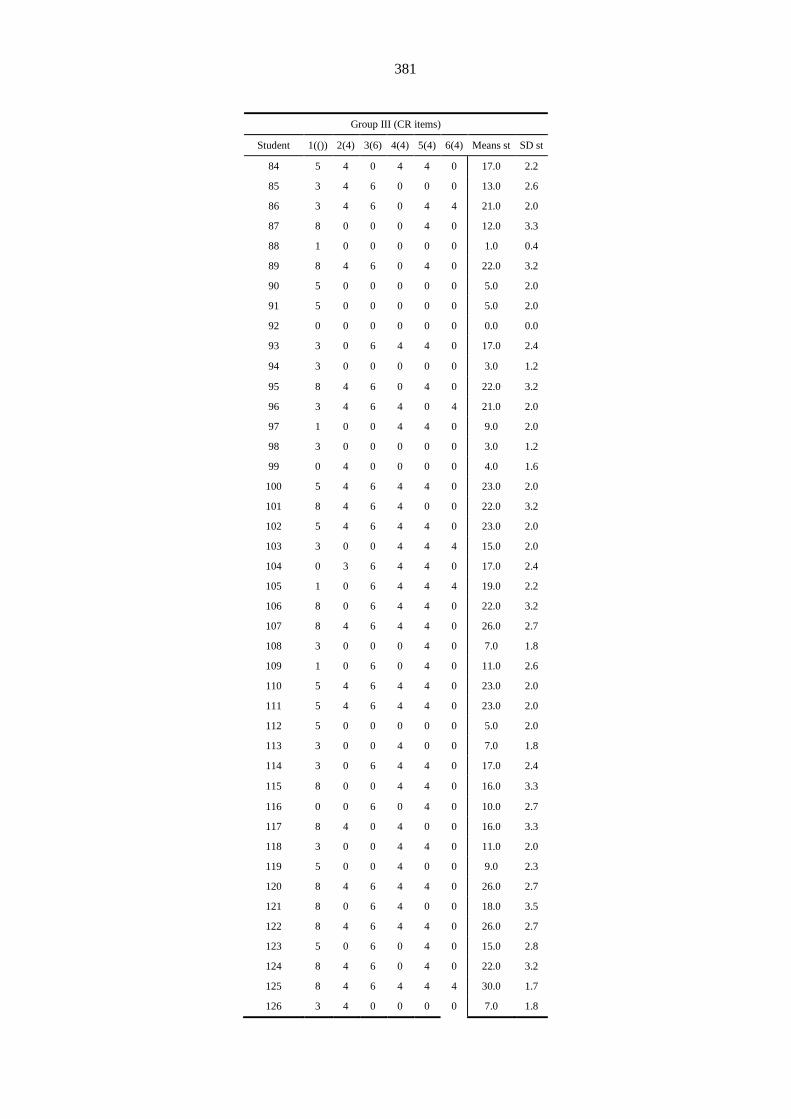
381
Group III (CR items)
Student 1(()) 2(4) 3(6) 4(4) 5(4) 6(4) Means st SD st
84 5 4 0 4 4 0 17.0 2.2
85 3 4 6 0 0 0 13.0 2.6
86 3 4 6 0 4 4 21.0 2.0
87 8 0 0 0 4 0 12.0 3.3
88 1 0 0 0 0 0 1.0 0.4
89 8 4 6 0 4 0 22.0 3.2
90 5 0 0 0 0 0 5.0 2.0
91 5 0 0 0 0 0 5.0 2.0
92 0 0 0 0 0 0 0.0 0.0
93 3 0 6 4 4 0 17.0 2.4
94 3 0 0 0 0 0 3.0 1.2
95 8 4 6 0 4 0 22.0 3.2
96 3 4 6 4 0 4 21.0 2.0
97 1 0 0 4 4 0 9.0 2.0
98 3 0 0 0 0 0 3.0 1.2
99 0 4 0 0 0 0 4.0 1.6
100 5 4 6 4 4 0 23.0 2.0
101 8 4 6 4 0 0 22.0 3.2
102 5 4 6 4 4 0 23.0 2.0
103 3 0 0 4 4 4 15.0 2.0
104 0 3 6 4 4 0 17.0 2.4
105 1 0 6 4 4 4 19.0 2.2
106 8 0 6 4 4 0 22.0 3.2
107 8 4 6 4 4 0 26.0 2.7
108 3 0 0 0 4 0 7.0 1.8
109 1 0 6 0 4 0 11.0 2.6
110 5 4 6 4 4 0 23.0 2.0
111 5 4 6 4 4 0 23.0 2.0
112 5 0 0 0 0 0 5.0 2.0
113 3 0 0 4 0 0 7.0 1.8
114 3 0 6 4 4 0 17.0 2.4
115 8 0 0 4 4 0 16.0 3.3
116 0 0 6 0 4 0 10.0 2.7
117 8 4 0 4 0 0 16.0 3.3
118 3 0 0 4 4 0 11.0 2.0
119 5 0 0 4 0 0 9.0 2.3
120 8 4 6 4 4 0 26.0 2.7
121 8 0 6 4 0 0 18.0 3.5
122 8 4 6 4 4 0 26.0 2.7
123 5 0 6 0 4 0 15.0 2.8
124 8 4 6 0 4 0 22.0 3.2
125 8 4 6 4 4 4 30.0 1.7
126 3 4 0 0 0 0 7.0 1.8
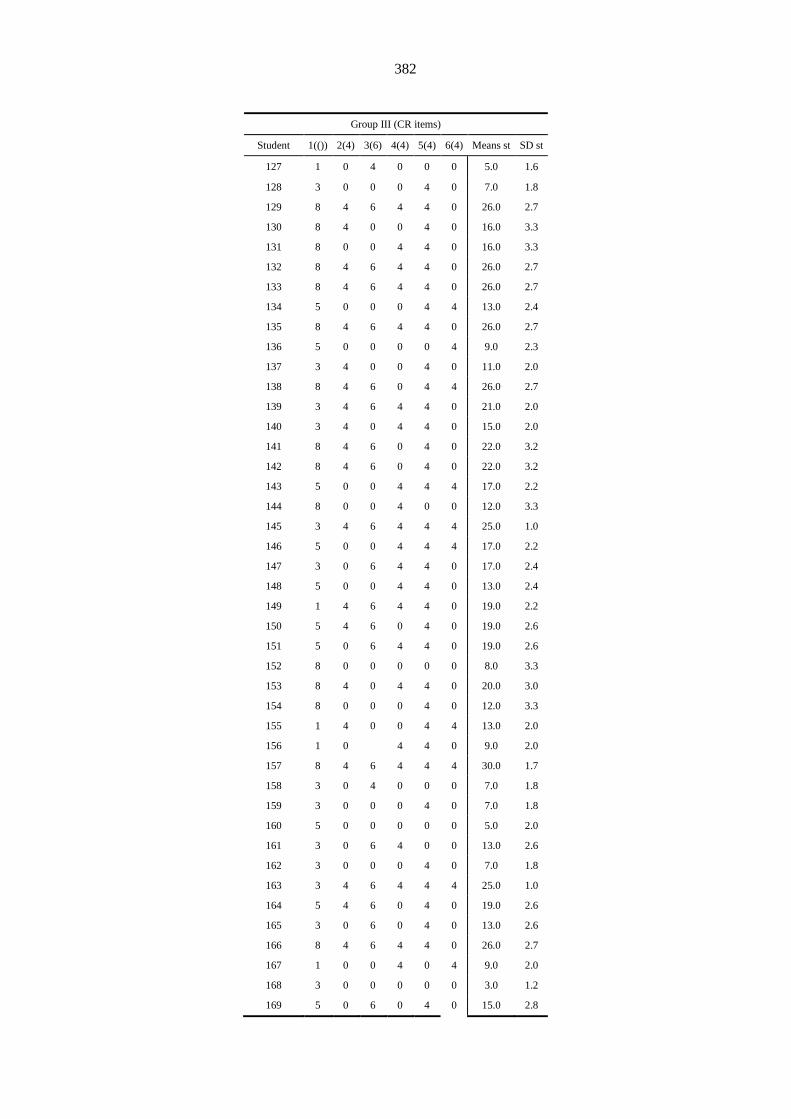
382
Group III (CR items)
Student 1(()) 2(4) 3(6) 4(4) 5(4) 6(4) Means st SD st
127 1 0 4 0 0 0 5.0 1.6
128 3 0 0 0 4 0 7.0 1.8
129 8 4 6 4 4 0 26.0 2.7
130 8 4 0 0 4 0 16.0 3.3
131 8 0 0 4 4 0 16.0 3.3
132 8 4 6 4 4 0 26.0 2.7
133 8 4 6 4 4 0 26.0 2.7
134 5 0 0 0 4 4 13.0 2.4
135 8 4 6 4 4 0 26.0 2.7
136 5 0 0 0 0 4 9.0 2.3
137 3 4 0 0 4 0 11.0 2.0
138 8 4 6 0 4 4 26.0 2.7
139 3 4 6 4 4 0 21.0 2.0
140 3 4 0 4 4 0 15.0 2.0
141 8 4 6 0 4 0 22.0 3.2
142 8 4 6 0 4 0 22.0 3.2
143 5 0 0 4 4 4 17.0 2.2
144 8 0 0 4 0 0 12.0 3.3
145 3 4 6 4 4 4 25.0 1.0
146 5 0 0 4 4 4 17.0 2.2
147 3 0 6 4 4 0 17.0 2.4
148 5 0 0 4 4 0 13.0 2.4
149 1 4 6 4 4 0 19.0 2.2
150 5 4 6 0 4 0 19.0 2.6
151 5 0 6 4 4 0 19.0 2.6
152 8 0 0 0 0 0 8.0 3.3
153 8 4 0 4 4 0 20.0 3.0
154 8 0 0 0 4 0 12.0 3.3
155 1 4 0 0 4 4 13.0 2.0
156 1 0
4 4 0 9.0 2.0
157 8 4 6 4 4 4 30.0 1.7
158 3 0 4 0 0 0 7.0 1.8
159 3 0 0 0 4 0 7.0 1.8
160 5 0 0 0 0 0 5.0 2.0
161 3 0 6 4 0 0 13.0 2.6
162 3 0 0 0 4 0 7.0 1.8
163 3 4 6 4 4 4 25.0 1.0
164 5 4 6 0 4 0 19.0 2.6
165 3 0 6 0 4 0 13.0 2.6
166 8 4 6 4 4 0 26.0 2.7
167 1 0 0 4 0 4 9.0 2.0
168 3 0 0 0 0 0 3.0 1.2
169 5 0 6 0 4 0 15.0 2.8
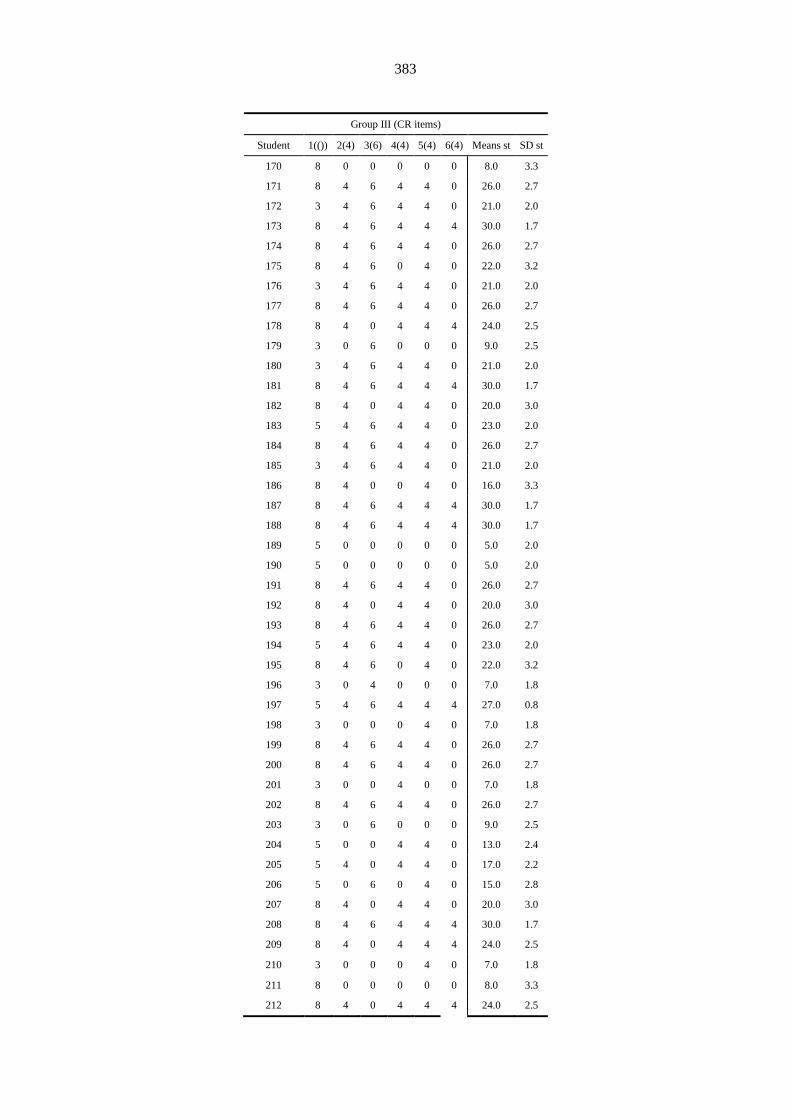
383
Group III (CR items)
Student 1(()) 2(4) 3(6) 4(4) 5(4) 6(4) Means st SD st
170 8 0 0 0 0 0 8.0 3.3
171 8 4 6 4 4 0 26.0 2.7
172 3 4 6 4 4 0 21.0 2.0
173 8 4 6 4 4 4 30.0 1.7
174 8 4 6 4 4 0 26.0 2.7
175 8 4 6 0 4 0 22.0 3.2
176 3 4 6 4 4 0 21.0 2.0
177 8 4 6 4 4 0 26.0 2.7
178 8 4 0 4 4 4 24.0 2.5
179 3 0 6 0 0 0 9.0 2.5
180 3 4 6 4 4 0 21.0 2.0
181 8 4 6 4 4 4 30.0 1.7
182 8 4 0 4 4 0 20.0 3.0
183 5 4 6 4 4 0 23.0 2.0
184 8 4 6 4 4 0 26.0 2.7
185 3 4 6 4 4 0 21.0 2.0
186 8 4 0 0 4 0 16.0 3.3
187 8 4 6 4 4 4 30.0 1.7
188 8 4 6 4 4 4 30.0 1.7
189 5 0 0 0 0 0 5.0 2.0
190 5 0 0 0 0 0 5.0 2.0
191 8 4 6 4 4 0 26.0 2.7
192 8 4 0 4 4 0 20.0 3.0
193 8 4 6 4 4 0 26.0 2.7
194 5 4 6 4 4 0 23.0 2.0
195 8 4 6 0 4 0 22.0 3.2
196 3 0 4 0 0 0 7.0 1.8
197 5 4 6 4 4 4 27.0 0.8
198 3 0 0 0 4 0 7.0 1.8
199 8 4 6 4 4 0 26.0 2.7
200 8 4 6 4 4 0 26.0 2.7
201 3 0 0 4 0 0 7.0 1.8
202 8 4 6 4 4 0 26.0 2.7
203 3 0 6 0 0 0 9.0 2.5
204 5 0 0 4 4 0 13.0 2.4
205 5 4 0 4 4 0 17.0 2.2
206 5 0 6 0 4 0 15.0 2.8
207 8 4 0 4 4 0 20.0 3.0
208 8 4 6 4 4 4 30.0 1.7
209 8 4 0 4 4 4 24.0 2.5
210 3 0 0 0 4 0 7.0 1.8
211 8 0 0 0 0 0 8.0 3.3
212 8 4 0 4 4 4 24.0 2.5
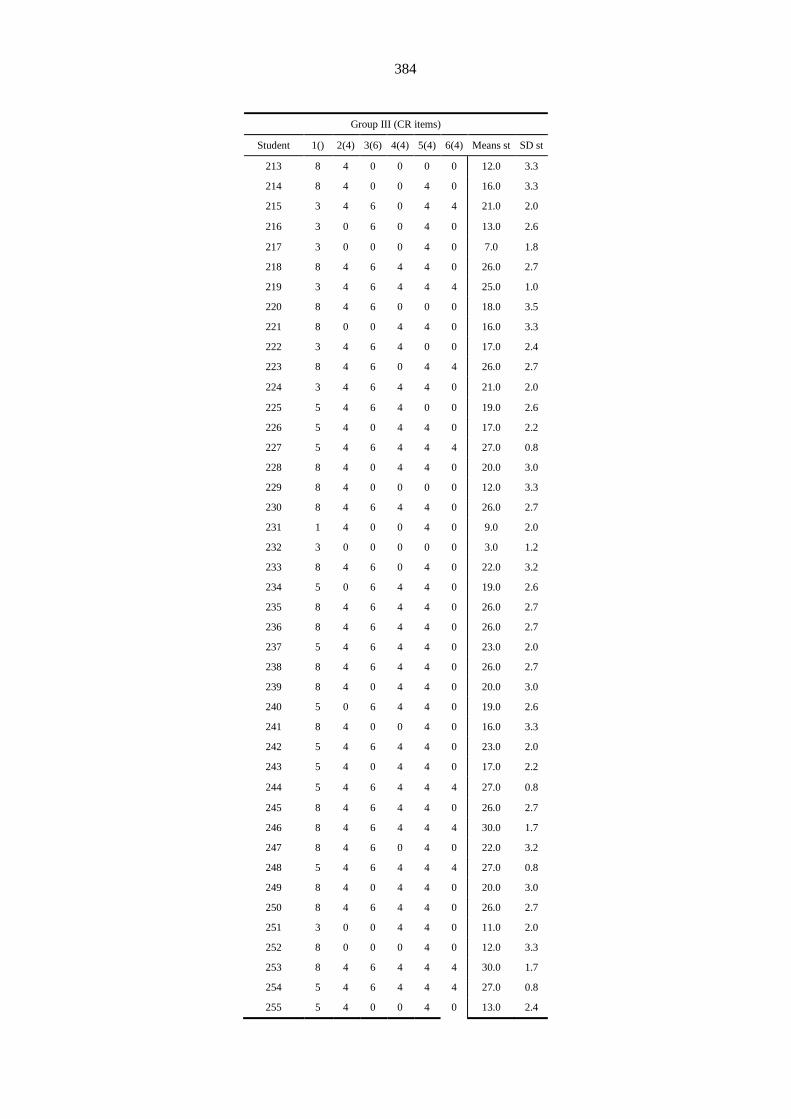
384
Group III (CR items)
Student 1() 2(4) 3(6) 4(4) 5(4) 6(4) Means st SD st
213 8 4 0 0 0 0 12.0 3.3
214 8 4 0 0 4 0 16.0 3.3
215 3 4 6 0 4 4 21.0 2.0
216 3 0 6 0 4 0 13.0 2.6
217 3 0 0 0 4 0 7.0 1.8
218 8 4 6 4 4 0 26.0 2.7
219 3 4 6 4 4 4 25.0 1.0
220 8 4 6 0 0 0 18.0 3.5
221 8 0 0 4 4 0 16.0 3.3
222 3 4 6 4 0 0 17.0 2.4
223 8 4 6 0 4 4 26.0 2.7
224 3 4 6 4 4 0 21.0 2.0
225 5 4 6 4 0 0 19.0 2.6
226 5 4 0 4 4 0 17.0 2.2
227 5 4 6 4 4 4 27.0 0.8
228 8 4 0 4 4 0 20.0 3.0
229 8 4 0 0 0 0 12.0 3.3
230 8 4 6 4 4 0 26.0 2.7
231 1 4 0 0 4 0 9.0 2.0
232 3 0 0 0 0 0 3.0 1.2
233 8 4 6 0 4 0 22.0 3.2
234 5 0 6 4 4 0 19.0 2.6
235 8 4 6 4 4 0 26.0 2.7
236 8 4 6 4 4 0 26.0 2.7
237 5 4 6 4 4 0 23.0 2.0
238 8 4 6 4 4 0 26.0 2.7
239 8 4 0 4 4 0 20.0 3.0
240 5 0 6 4 4 0 19.0 2.6
241 8 4 0 0 4 0 16.0 3.3
242 5 4 6 4 4 0 23.0 2.0
243 5 4 0 4 4 0 17.0 2.2
244 5 4 6 4 4 4 27.0 0.8
245 8 4 6 4 4 0 26.0 2.7
246 8 4 6 4 4 4 30.0 1.7
247 8 4 6 0 4 0 22.0 3.2
248 5 4 6 4 4 4 27.0 0.8
249 8 4 0 4 4 0 20.0 3.0
250 8 4 6 4 4 0 26.0 2.7
251 3 0 0 4 4 0 11.0 2.0
252 8 0 0 0 4 0 12.0 3.3
253 8 4 6 4 4 4 30.0 1.7
254 5 4 6 4 4 4 27.0 0.8
255 5 4 0 0 4 0 13.0 2.4
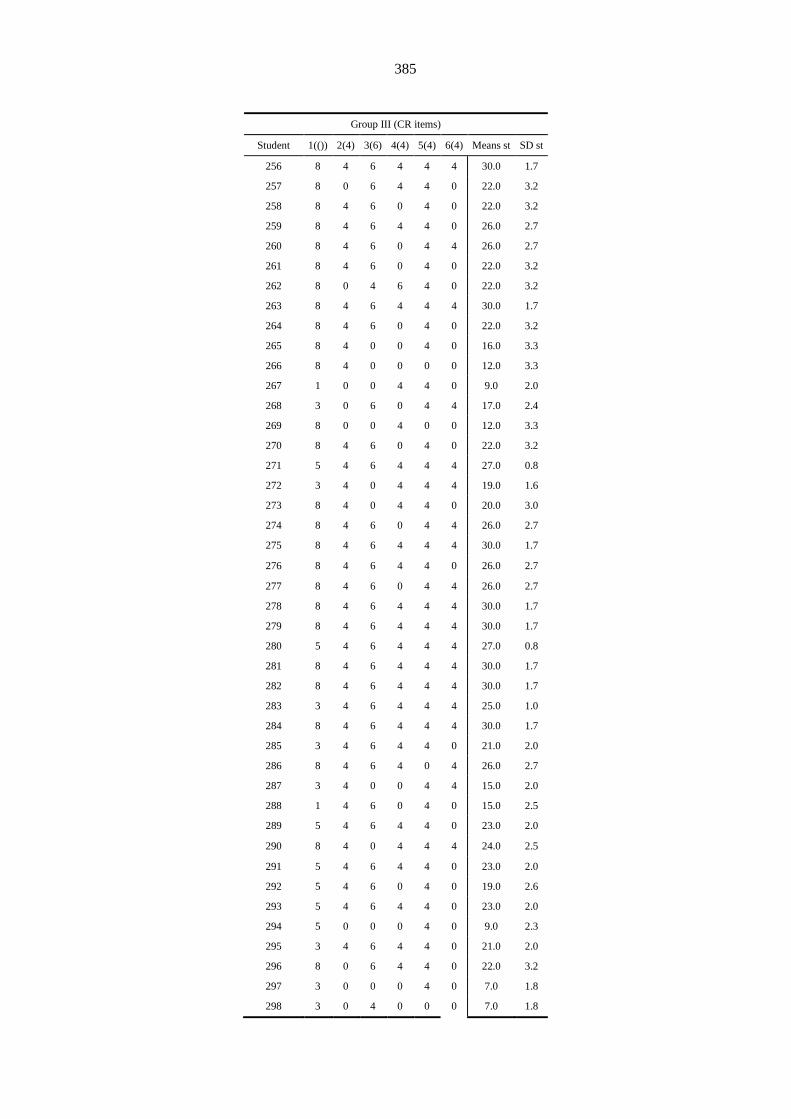
385
Group III (CR items)
Student 1(()) 2(4) 3(6) 4(4) 5(4) 6(4) Means st SD st
256 8 4 6 4 4 4 30.0 1.7
257 8 0 6 4 4 0 22.0 3.2
258 8 4 6 0 4 0 22.0 3.2
259 8 4 6 4 4 0 26.0 2.7
260 8 4 6 0 4 4 26.0 2.7
261 8 4 6 0 4 0 22.0 3.2
262 8 0 4 6 4 0 22.0 3.2
263 8 4 6 4 4 4 30.0 1.7
264 8 4 6 0 4 0 22.0 3.2
265 8 4 0 0 4 0 16.0 3.3
266 8 4 0 0 0 0 12.0 3.3
267 1 0 0 4 4 0 9.0 2.0
268 3 0 6 0 4 4 17.0 2.4
269 8 0 0 4 0 0 12.0 3.3
270 8 4 6 0 4 0 22.0 3.2
271 5 4 6 4 4 4 27.0 0.8
272 3 4 0 4 4 4 19.0 1.6
273 8 4 0 4 4 0 20.0 3.0
274 8 4 6 0 4 4 26.0 2.7
275 8 4 6 4 4 4 30.0 1.7
276 8 4 6 4 4 0 26.0 2.7
277 8 4 6 0 4 4 26.0 2.7
278 8 4 6 4 4 4 30.0 1.7
279 8 4 6 4 4 4 30.0 1.7
280 5 4 6 4 4 4 27.0 0.8
281 8 4 6 4 4 4 30.0 1.7
282 8 4 6 4 4 4 30.0 1.7
283 3 4 6 4 4 4 25.0 1.0
284 8 4 6 4 4 4 30.0 1.7
285 3 4 6 4 4 0 21.0 2.0
286 8 4 6 4 0 4 26.0 2.7
287 3 4 0 0 4 4 15.0 2.0
288 1 4 6 0 4 0 15.0 2.5
289 5 4 6 4 4 0 23.0 2.0
290 8 4 0 4 4 4 24.0 2.5
291 5 4 6 4 4 0 23.0 2.0
292 5 4 6 0 4 0 19.0 2.6
293 5 4 6 4 4 0 23.0 2.0
294 5 0 0 0 4 0 9.0 2.3
295 3 4 6 4 4 0 21.0 2.0
296 8 0 6 4 4 0 22.0 3.2
297 3 0 0 0 4 0 7.0 1.8
298 3 0 4 0 0 0 7.0 1.8
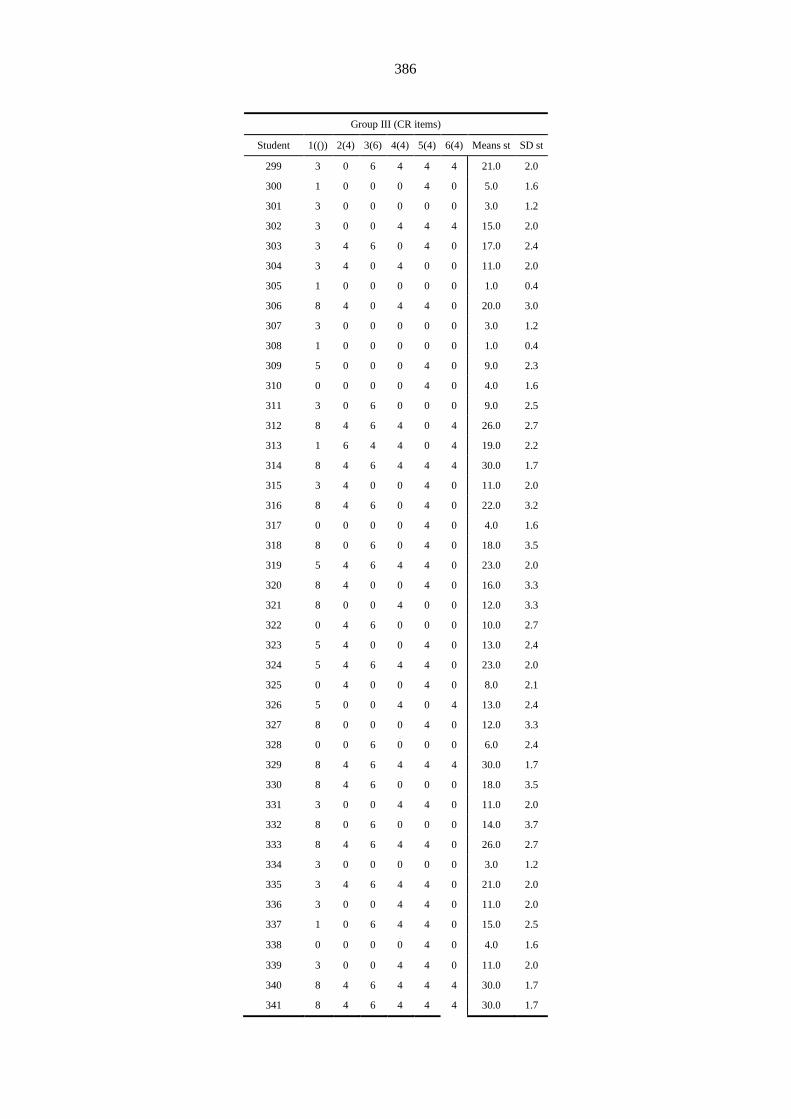
386
Group III (CR items)
Student 1(()) 2(4) 3(6) 4(4) 5(4) 6(4) Means st SD st
299 3 0 6 4 4 4 21.0 2.0
300 1 0 0 0 4 0 5.0 1.6
301 3 0 0 0 0 0 3.0 1.2
302 3 0 0 4 4 4 15.0 2.0
303 3 4 6 0 4 0 17.0 2.4
304 3 4 0 4 0 0 11.0 2.0
305 1 0 0 0 0 0 1.0 0.4
306 8 4 0 4 4 0 20.0 3.0
307 3 0 0 0 0 0 3.0 1.2
308 1 0 0 0 0 0 1.0 0.4
309 5 0 0 0 4 0 9.0 2.3
310 0 0 0 0 4 0 4.0 1.6
311 3 0 6 0 0 0 9.0 2.5
312 8 4 6 4 0 4 26.0 2.7
313 1 6 4 4 0 4 19.0 2.2
314 8 4 6 4 4 4 30.0 1.7
315 3 4 0 0 4 0 11.0 2.0
316 8 4 6 0 4 0 22.0 3.2
317 0 0 0 0 4 0 4.0 1.6
318 8 0 6 0 4 0 18.0 3.5
319 5 4 6 4 4 0 23.0 2.0
320 8 4 0 0 4 0 16.0 3.3
321 8 0 0 4 0 0 12.0 3.3
322 0 4 6 0 0 0 10.0 2.7
323 5 4 0 0 4 0 13.0 2.4
324 5 4 6 4 4 0 23.0 2.0
325 0 4 0 0 4 0 8.0 2.1
326 5 0 0 4 0 4 13.0 2.4
327 8 0 0 0 4 0 12.0 3.3
328 0 0 6 0 0 0 6.0 2.4
329 8 4 6 4 4 4 30.0 1.7
330 8 4 6 0 0 0 18.0 3.5
331 3 0 0 4 4 0 11.0 2.0
332 8 0 6 0 0 0 14.0 3.7
333 8 4 6 4 4 0 26.0 2.7
334 3 0 0 0 0 0 3.0 1.2
335 3 4 6 4 4 0 21.0 2.0
336 3 0 0 4 4 0 11.0 2.0
337 1 0 6 4 4 0 15.0 2.5
338 0 0 0 0 4 0 4.0 1.6
339 3 0 0 4 4 0 11.0 2.0
340 8 4 6 4 4 4 30.0 1.7
341 8 4 6 4 4 4 30.0 1.7

387
Group III (CR items)
Student 1(()) 2(4) 3(6) 4(4) 5(4) 6(4) Means st SD st
342 5 4 6 4 4 4 27.0 0.8
343 3 4 6 4 4 0 21.0 2.0
344 5 4 0 0 4 0 13.0 2.4
345 8 0 0 4 0 4 16.0 3.3
346 3 0 0 0 0 4 7.0 1.8
347 3 0 6 0 0 0 9.0 2.5
348 1 0 0 0 0 0 1.0 0.4
349 5 4 6 4 4 4 27.0 0.8
350 3 4 6 0 4 0 17.0 2.4
351 5 4 6 4 4 4 27.0 0.8
352 1 4 6 0 4 4 19.0 2.2
353 8 0 6 4 4 4 26.0 2.7
354 5 4 0 4 4 0 17.0 2.2
355 5 0 6 0 0 0 11.0 2.9
356 4 6 4 0 0 0 14.0 2.7
357 3 0 0 4 4 4 15.0 2.0
358 8 0 6 4 4 4 26.0 2.7
359 8 4 6 0 4 0 22.0 3.2
360 3 0 6 0 4 0 13.0 2.6
361 8 4 6 4 0 4 26.0 2.7
362 5 4 0 0 4 0 13.0 2.4
363 0 0 0 0 0 0 0.0 0.0
364 8 0 0 0 4 0 12.0 3.3
365 5 4 6 4 4 0 23.0 2.0
366 5 4 6 4 4 0 23.0 2.0
367 8 4 6 4 4 0 26.0 2.7
368 0 0 0 0 0 0 0.0 0.0
369 0 0 0 4 4 0 8.0 2.1
370 8 4 6 4 4 4 30.0 1.7
371 5 0 4 0 4 4 17.0 2.2
372 1 4 6 0 4 4 19.0 2.2
373 3 0 6 4 0 0 13.0 2.6
374 3 4 6 4 4 0 21.0 2.0
375 3 0 0 0 4 0 7.0 1.8
376 0 0 0 4 0 0 4.0 1.6
377 1 4 0 4 0 4 13.0 2.0
378 1 0 0 0 0 0 1.0 0.4
379 5 0 0 0 0 0 5.0 2.0
380 3 0 0 0 4 4 11.0 2.0
381 8 4 6 0 4 0 22.0 3.2
382 3 0 6 4 4 0 17.0 2.4
Means item 5.2 2.4 3.4 2.4 3.1 1.0 17.4 1.4
SD item 2.6 2.0 2.9 2.0 1.7 1.8

388