Embed Size (px)
Citation preview
1 | P a g e
Maricopa County 2017 CCHNA
Key Informant Interviews Report
October 2016
Report prepared by:
Jillian Papa, MPH Nejra Sumic, MPA
Funding provided by:
Maricopa County Department of Public Health
2 | P a g e
Table of Contents
Overview ............................................................................................................................................... 3
Methods & Samples ........................................................................................................................... 3
Analysis Methodology ...................................................................................................................... 6
Results and Findings ......................................................................................................................... 7
Overarching Themes and Frequencies ...................................................................................... 8
Characteristics of a Healthy Community: What does it mean to be a healthy
community? ........................................................................................................................................ 10
The Health of Residents within the Community: How healthy are they? ................... 13
Accountability of the Community’s Health: Who is responsible? ................................. 16
Changes in the Community: What changes occurred over the past five years? ....... 18
Influencers in the Community: Which community partners are influential? ............ 20
Strengths and Resources in the Community: What can be built upon? ...................... 22
Community Concerns: What are they and which is most important? .......................... 24
Barriers within the Community: What obstacles do communities face? .................... 26
Are there any health-related projects that are being successfully implemented in
the community? ................................................................................................................................ 28
Next Steps ........................................................................................................................................... 30
Appendix A: Informed Consent Form ....................................................................................... 31
Appendix B: Key Informant Interview Questions ................................................................ 34
Appendix C: Working Together to Improve Health in Maricopa County .................... 38
3 | P a g e
Maricopa County CCHNA Key Informant Interviews Report Overview The Key Informant Study is part of the Coordinated Maricopa County Community Health Needs Assessment (CCHNA) designed to identify health indicators, barriers and resources to consider within Maricopa County through a community-driven process known as Mobilizing for Action through Planning and Partnerships (MAPP)1. Of the four primary components of the MAPP framework, the key informant interviews were specifically targeted towards the Community Themes and Strengths and Forces of Change Assessments. Maricopa County Department of Public Health (MCDPH) has partnered with community health partners to conduct a series of sixteen key informant interviews from representatives from various community sectors. Input from key informants provided insight to the essential needs of the community and how certain issues can be best addressed for the inclusion in change to which will inform the Community Health Needs Assessment and the Community Health Improvement Plan (CHIP) for the next three-year cycle.
Methods & Samples
In order to maintain diversity among participants, twelve different community sectors were selected to be the focus of recruitment. It includes the following: Built Environment, Business, Education, Faith based, Healthcare, Justice/Law Enforcement, Media, Other (Special Populations), Philanthropy, Public Health, State/Local/Government (including Military), and Volunteer/Civic sectors. Each interview lasted approximately sixty to ninety minutes and was recorded by using an audio-recording device. During each interview, a note-taker was present with the interviewer to take additional notes. The notes were utilized to capture non-verbal communication, in which audio was not able to do so; such as facial expressions and other non-verbal cues. In addition, the audio and notes were separately transcribed to verify accuracy of interview content. During each session, participants were asked about their expertise and opinions on public health in Maricopa County. They were asked about important characteristics of a healthy community, the health of Maricopa County residents, along with areas which need improvement. If they agreed to participate, MCDPH staff took strict measures to protect their privacy by not disclosing any identifiable information at any point in time. The Key Informant Questions are included for reference purposes in Appendix B.
1 See http://www.naccho.org/topics/infrastructure/mapp/ for additional information on the MAPP process.
4 | P a g e
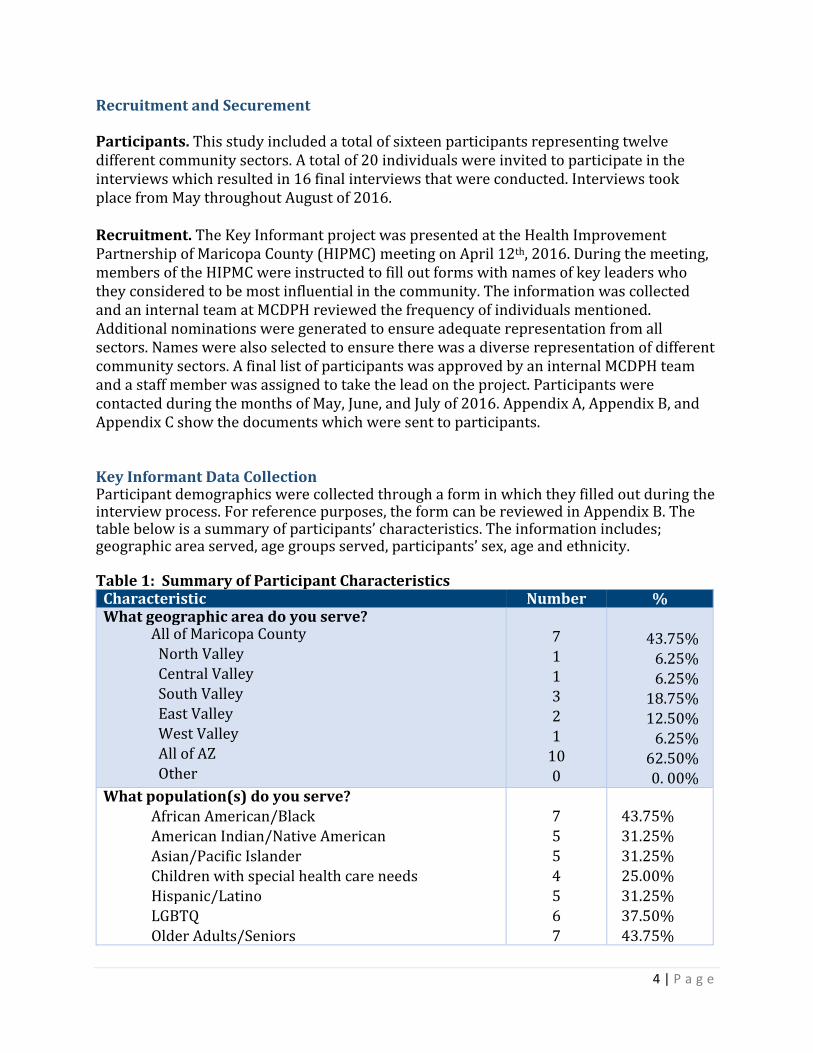
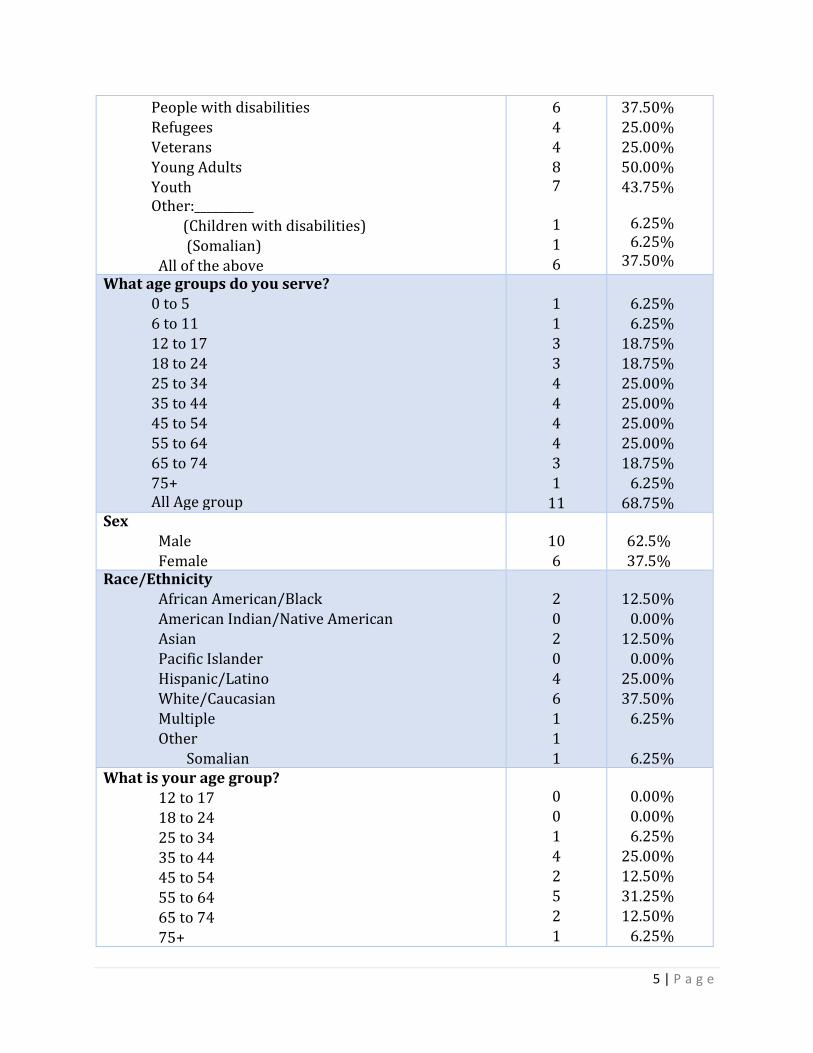
Recruitment and Securement Participants. This study included a total of sixteen participants representing twelve different community sectors. A total of 20 individuals were invited to participate in the interviews which resulted in 16 final interviews that were conducted. Interviews took place from May throughout August of 2016. Recruitment. The Key Informant project was presented at the Health Improvement Partnership of Maricopa County (HIPMC) meeting on April 12th, 2016. During the meeting, members of the HIPMC were instructed to fill out forms with names of key leaders who they considered to be most influential in the community. The information was collected and an internal team at MCDPH reviewed the frequency of individuals mentioned. Additional nominations were generated to ensure adequate representation from all sectors. Names were also selected to ensure there was a diverse representation of different community sectors. A final list of participants was approved by an internal MCDPH team and a staff member was assigned to take the lead on the project. Participants were contacted during the months of May, June, and July of 2016. Appendix A, Appendix B, and Appendix C show the documents which were sent to participants. Key Informant Data Collection Participant demographics were collected through a form in which they filled out during the interview process. For reference purposes, the form can be reviewed in Appendix B. The table below is a summary of participants’ characteristics. The information includes; geographic area served, age groups served, participants’ sex, age and ethnicity. Table 1: Summary of Participant Characteristics
Characteristic Number % What geographic area do you serve?
All of Maricopa County North Valley Central Valley South Valley East Valley West Valley All of AZ Other
7 1 1 3 2 1
10 0
43.75% 6.25% 6.25% 18.75%
12.50% 6.25%
62.50% 0. 00%
What population(s) do you serve? African American/Black American Indian/Native American Asian/Pacific Islander Children with special health care needs Hispanic/Latino LGBTQ
Older Adults/Seniors
7 5 5 4 5 6
7
43.75% 31.25% 31.25% 25.00% 31.25% 37.50%
43.75%
5 | P a g e
People with disabilities Refugees Veterans Young Adults
Youth Other:__________
(Children with disabilities) (Somalian) All of the above
6 4 4 8 7
1 1 6
37.50% 25.00% 25.00% 50.00%
43.75%
6.25% 6.25%
37.50%
What age groups do you serve? 0 to 5 6 to 11 12 to 17 18 to 24 25 to 34 35 to 44 45 to 54 55 to 64 65 to 74 75+ All Age group
1 1 3 3 4 4 4 4 3 1
11
6.25% 6.25%
18.75% 18.75% 25.00% 25.00% 25.00% 25.00% 18.75%
6.25% 68.75%
Sex Male
Female
10
6
62.5%
37.5%
Race/Ethnicity African American/Black American Indian/Native American Asian Pacific Islander
Hispanic/Latino White/Caucasian Multiple Other Somalian
2 0 2 0
4 6 1 1 1
12.50%
0.00% 12.50%
0.00%
25.00% 37.50%
6.25%
6.25%
What is your age group? 12 to 17 18 to 24 25 to 34 35 to 44 45 to 54 55 to 64 65 to 74
75+
0 0 1 4 2 5 2
1
0.00% 0.00% 6.25%
25.00% 12.50% 31.25% 12.50%
6.25%
6 | P a g e
Consent. Participants were provided with copies of a consent form in advance. On the day of the interview, participants were given an additional copy and the interviewer recited the consent form verbatim. In order to proceed with the interview, they were required to sign the consent form at that time. Participants were fully informed of any benefits, risks, and expectations associated with their participation. In addition, they were given the option to skip any questions or stop the interview process at any point in time. Upon completion of the interview, a signed copy of the consent form was provided to participants. All original signed documents were kept separate in a locked filing cabinet at the MCDPH office. Staff members assigned to the project were the only ones with access to the interview documents. For reference purposes, the consent form can be viewed in Appendix A. Venues. Venues were selected in order to accommodate the needs of the participants and to protect their identity. Fourteen out of the sixteen participants chose to do in-person interviews, while two opted to conduct a phone interview. Facilitation. Training was provided to staff members who were assigned to conduct interviews and/or take-notes. During the training, the following topics were discussed; different interviewing styles, ways in probing for answers, the importance of maintaining confidentiality, methods in note-taking, and the use of technology equipment (for example; laptops, I-Pads, and audio recording devices). Record-Keeping. Interviews were recorded using a mini I-Pad, which had a multi-microphone audio recording device. Note-takers also typed notes during the session in case a device failed. The note-taking allowed our staff to capture information in which audio recording could not capture, such as, facial expressions. Transcription. Audio recordings were transcribed by a specially trained staff of MCDPH. During the transcription process, each recording was listened and transcribed verbatim. Files were stored in a secure Maricopa County computer network. The transcribing process took approximately four weeks to complete. Once all transcribing was completed, the data was sent to a highly experienced third-party contractor for analysis of thematic coding. Having a third-party contractor complete the analysis also helped reduce bias in interpretation.
Analysis Methodology
The Key Informant Questionnaire included a total of twenty-one questions. The survey began by asking participants what role they have in their organizations and the populations they serve. The following questions (questions 3 and 4) asked their opinions on what a healthy community means to them and any important characteristics of a healthy community. Questions 5 and 6, asked participants on how healthy residents are in their communities and Maricopa County as a whole, and who is responsible for community health in the county. Questions 7, 8, and 9 focused on any changes they have seen in the community in the last five years, any entities/organizations that are influential in the community, and what strengths or resources present in the community. Questions 10, 11, and 12 asked about any concerns or factors keeping people from being healthy, along with
7 | P a g e
any health-related projects that are currently being implemented successfully. The final question gave participants an opportunity to share any additional comments that were important to them. A separate demographic form was given to participants to fill out upon completion of their interview. Please refer to Table 1 for a full breakdown of participants’ demographic information. Taking an iterative approach, a content-based, thematic analysis was conducted on 16 semi-structured interviews with key informants using QDA Miner Lite. Themes were identified and codes were developed for ten of the thirteen open-ended questions. The responses to question 12 were divided into two lists, which are described further in the question-specific Results and Findings section. The responses to question 13, which acted as a catch-all by asking respondents if they had anything else to add, were either reassigned to one of the 12 other questions or were excluded due to irrelevancy. The analysis was approached two ways. The first approach was to determine overarching and recurrent themes by assigning codes throughout the interview. The study generated a thematic framework that allowed for the integration and organization of responses across questions. The second approach was question specific. A more in-depth analysis by question was also done for recurrent themes and their codes. Themes from both approaches were quantified to understand the frequency of mention and potential collective magnitude of importance. There are two types of tables that can be found in sections of Results and Findings. The first table in each section displays identified codes or themes, their descriptions, the number, and percentage of cases. These tables contain codes, which are distinguished in bold font, and sub-codes. The second type of table can only be found in the question-specific sections within Results and Findings. This table provides a selection of noteworthy verbatim quotes from respondents to supplement the quantitative and thematic piece. Additionally, there is a brief narrative paragraph(s) at the beginning of each section describing the methods and high level results specific to that question(s).
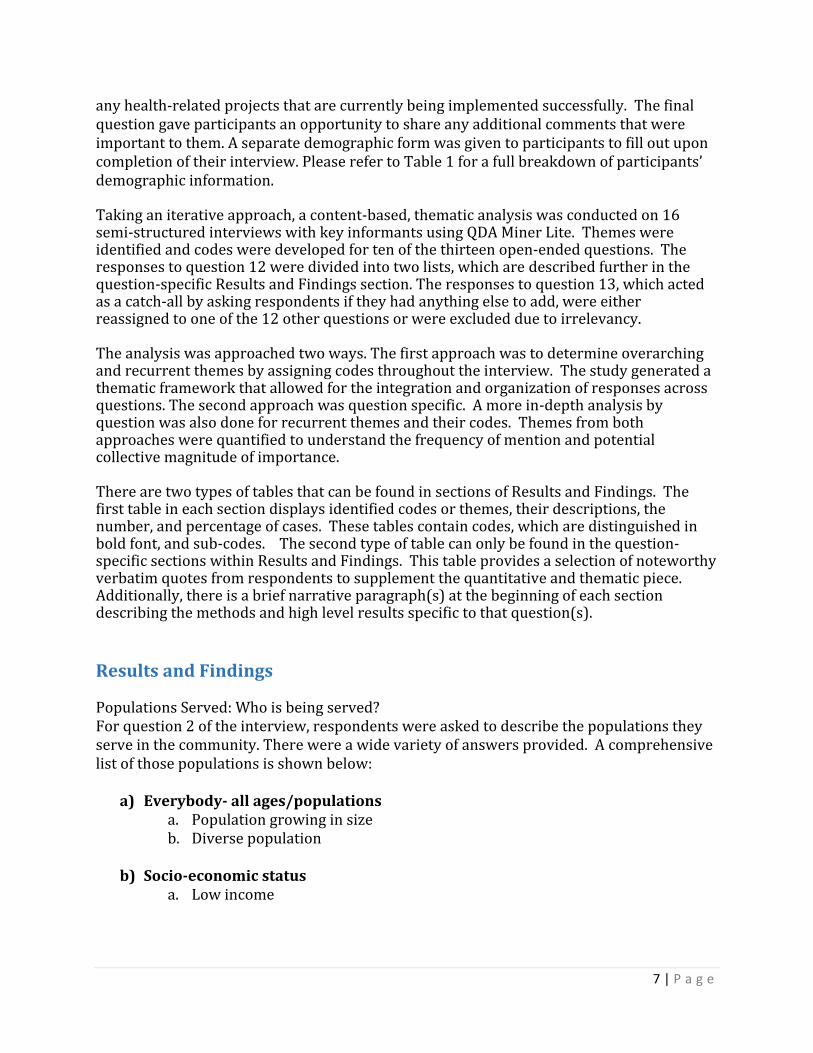
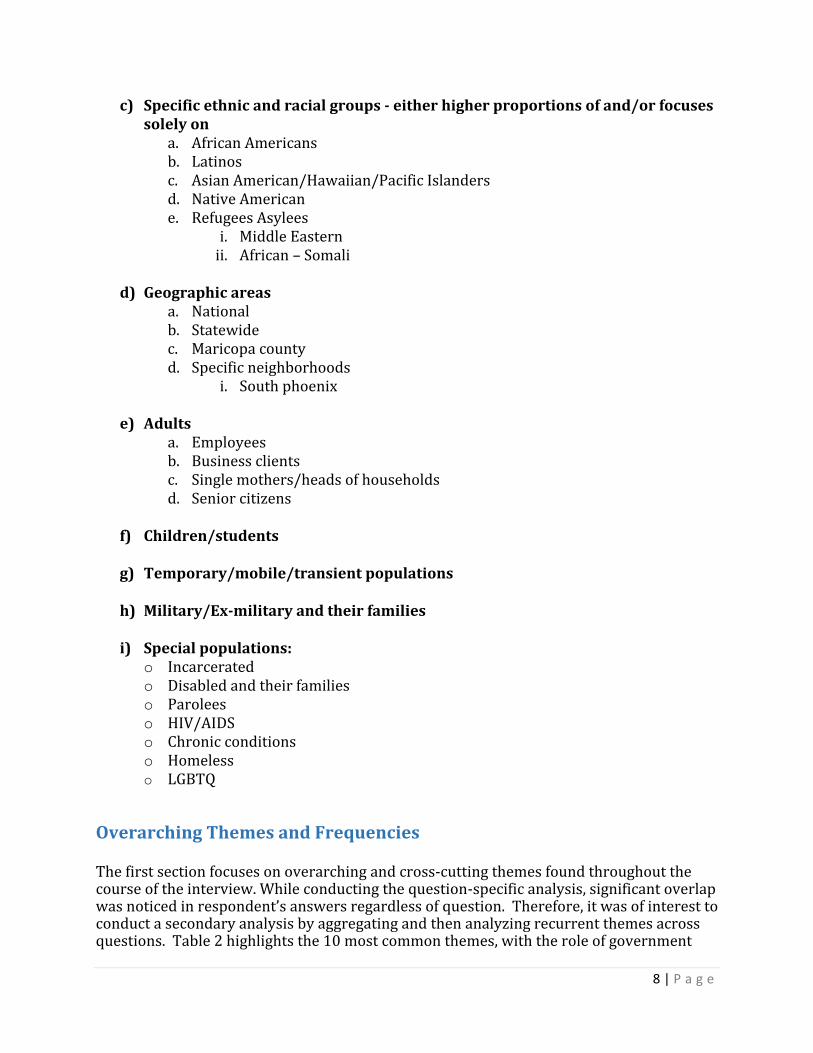
Results and Findings Populations Served: Who is being served? For question 2 of the interview, respondents were asked to describe the populations they serve in the community. There were a wide variety of answers provided. A comprehensive list of those populations is shown below:
a) Everybody- all ages/populations a. Population growing in size b. Diverse population
b) Socio-economic status
a. Low income
8 | P a g e
c) Specific ethnic and racial groups - either higher proportions of and/or focuses solely on
a. African Americans b. Latinos c. Asian American/Hawaiian/Pacific Islanders d. Native American e. Refugees Asylees
i. Middle Eastern ii. African – Somali
d) Geographic areas
a. National b. Statewide c. Maricopa county d. Specific neighborhoods
i. South phoenix
e) Adults a. Employees b. Business clients c. Single mothers/heads of households d. Senior citizens
f) Children/students
g) Temporary/mobile/transient populations
h) Military/Ex-military and their families
i) Special populations:
o Incarcerated o Disabled and their families o Parolees o HIV/AIDS o Chronic conditions o Homeless o LGBTQ
Overarching Themes and Frequencies
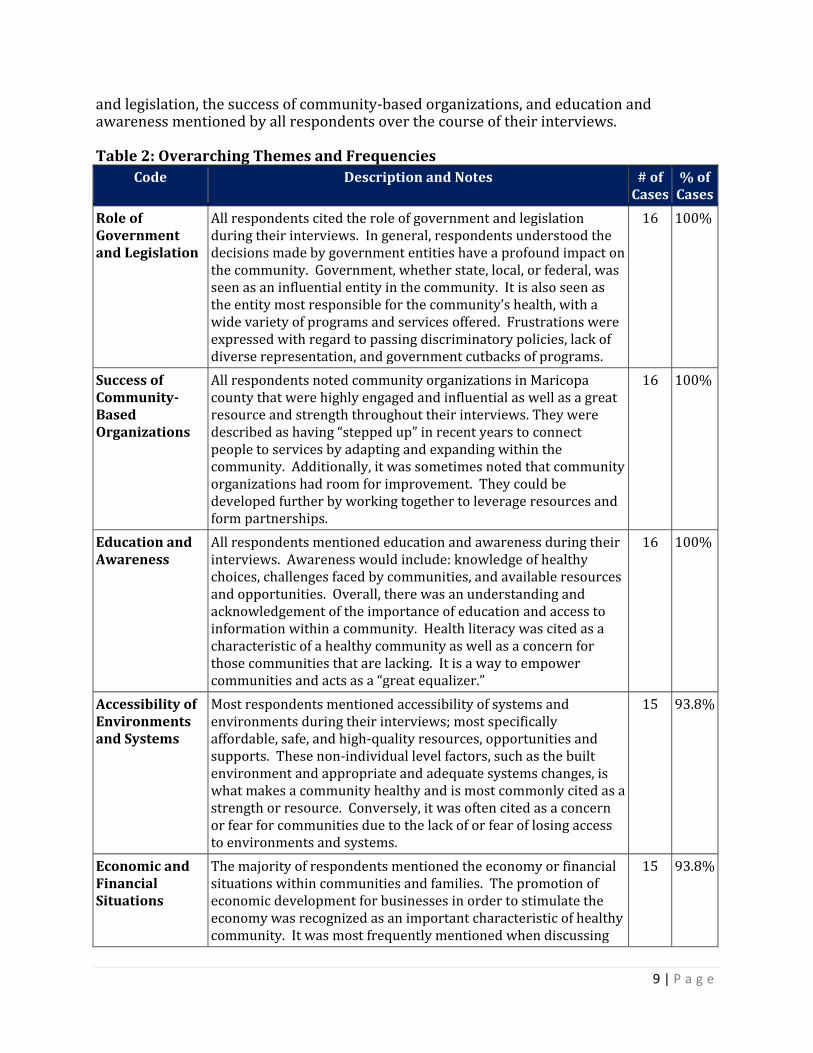
The first section focuses on overarching and cross-cutting themes found throughout the course of the interview. While conducting the question-specific analysis, significant overlap was noticed in respondent’s answers regardless of question. Therefore, it was of interest to conduct a secondary analysis by aggregating and then analyzing recurrent themes across questions. Table 2 highlights the 10 most common themes, with the role of government
9 | P a g e
and legislation, the success of community-based organizations, and education and awareness mentioned by all respondents over the course of their interviews. Table 2: Overarching Themes and Frequencies
Code Description and Notes # of Cases
% of Cases
Role of Government and Legislation
All respondents cited the role of government and legislation during their interviews. In general, respondents understood the decisions made by government entities have a profound impact on the community. Government, whether state, local, or federal, was seen as an influential entity in the community. It is also seen as the entity most responsible for the community’s health, with a wide variety of programs and services offered. Frustrations were expressed with regard to passing discriminatory policies, lack of diverse representation, and government cutbacks of programs.
16 100%
Success of Community- Based Organizations
All respondents noted community organizations in Maricopa county that were highly engaged and influential as well as a great resource and strength throughout their interviews. They were described as having “stepped up” in recent years to connect people to services by adapting and expanding within the community. Additionally, it was sometimes noted that community organizations had room for improvement. They could be developed further by working together to leverage resources and form partnerships.
16 100%
Education and Awareness
All respondents mentioned education and awareness during their interviews. Awareness would include: knowledge of healthy choices, challenges faced by communities, and available resources and opportunities. Overall, there was an understanding and acknowledgement of the importance of education and access to information within a community. Health literacy was cited as a characteristic of a healthy community as well as a concern for those communities that are lacking. It is a way to empower communities and acts as a “great equalizer.”
16 100%
Accessibility of Environments and Systems
Most respondents mentioned accessibility of systems and environments during their interviews; most specifically affordable, safe, and high-quality resources, opportunities and supports. These non-individual level factors, such as the built environment and appropriate and adequate systems changes, is what makes a community healthy and is most commonly cited as a strength or resource. Conversely, it was often cited as a concern or fear for communities due to the lack of or fear of losing access to environments and systems.
15 93.8%
Economic and Financial Situations
The majority of respondents mentioned the economy or financial situations within communities and families. The promotion of economic development for businesses in order to stimulate the economy was recognized as an important characteristic of healthy community. It was most frequently mentioned when discussing
15 93.8%
10 | P a g e
poverty or “living pay check to paycheck” in order to “make ends meet.” Additionally, the economy’s recovery since the recession was also noted, in particular increased jobs although not high-paying.
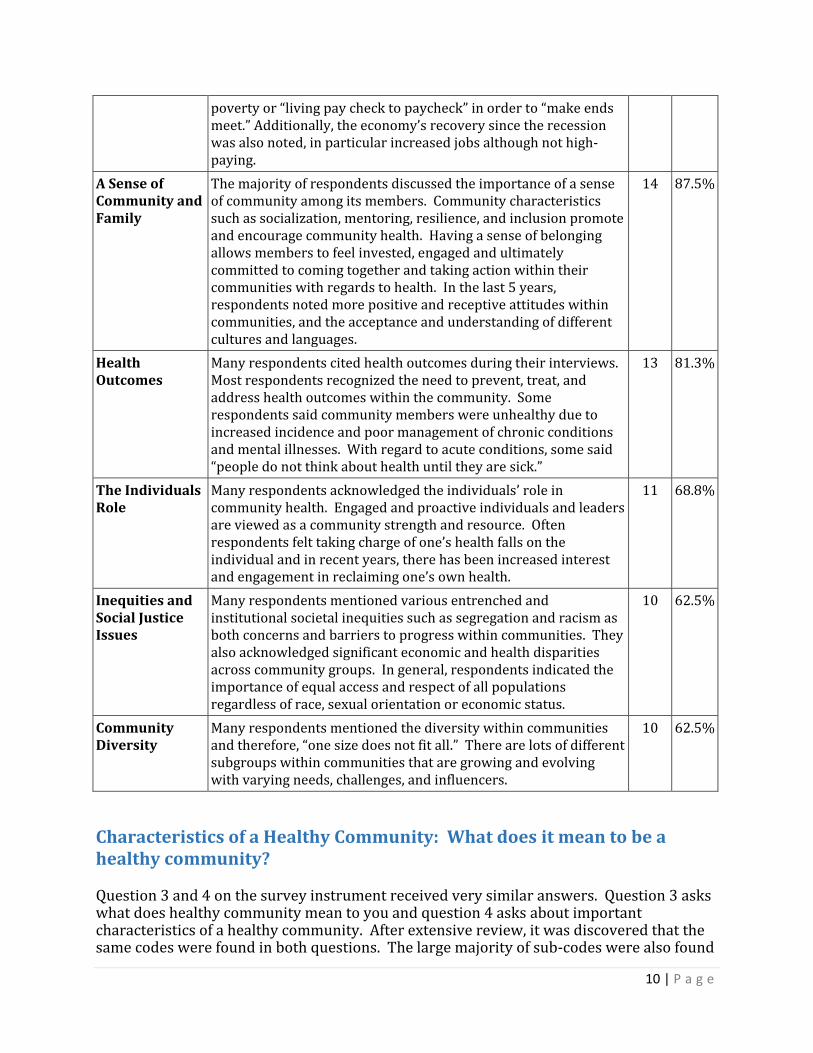
A Sense of Community and Family
The majority of respondents discussed the importance of a sense of community among its members. Community characteristics such as socialization, mentoring, resilience, and inclusion promote and encourage community health. Having a sense of belonging allows members to feel invested, engaged and ultimately committed to coming together and taking action within their communities with regards to health. In the last 5 years, respondents noted more positive and receptive attitudes within communities, and the acceptance and understanding of different cultures and languages.
14 87.5%
Health Outcomes
Many respondents cited health outcomes during their interviews. Most respondents recognized the need to prevent, treat, and address health outcomes within the community. Some respondents said community members were unhealthy due to increased incidence and poor management of chronic conditions and mental illnesses. With regard to acute conditions, some said “people do not think about health until they are sick.”
13 81.3%
The Individuals Role
Many respondents acknowledged the individuals’ role in community health. Engaged and proactive individuals and leaders are viewed as a community strength and resource. Often respondents felt taking charge of one’s health falls on the individual and in recent years, there has been increased interest and engagement in reclaiming one’s own health.
11 68.8%
Inequities and Social Justice Issues
Many respondents mentioned various entrenched and institutional societal inequities such as segregation and racism as both concerns and barriers to progress within communities. They also acknowledged significant economic and health disparities across community groups. In general, respondents indicated the importance of equal access and respect of all populations regardless of race, sexual orientation or economic status.
10 62.5%
Community Diversity
Many respondents mentioned the diversity within communities and therefore, “one size does not fit all.” There are lots of different subgroups within communities that are growing and evolving with varying needs, challenges, and influencers.
10 62.5%
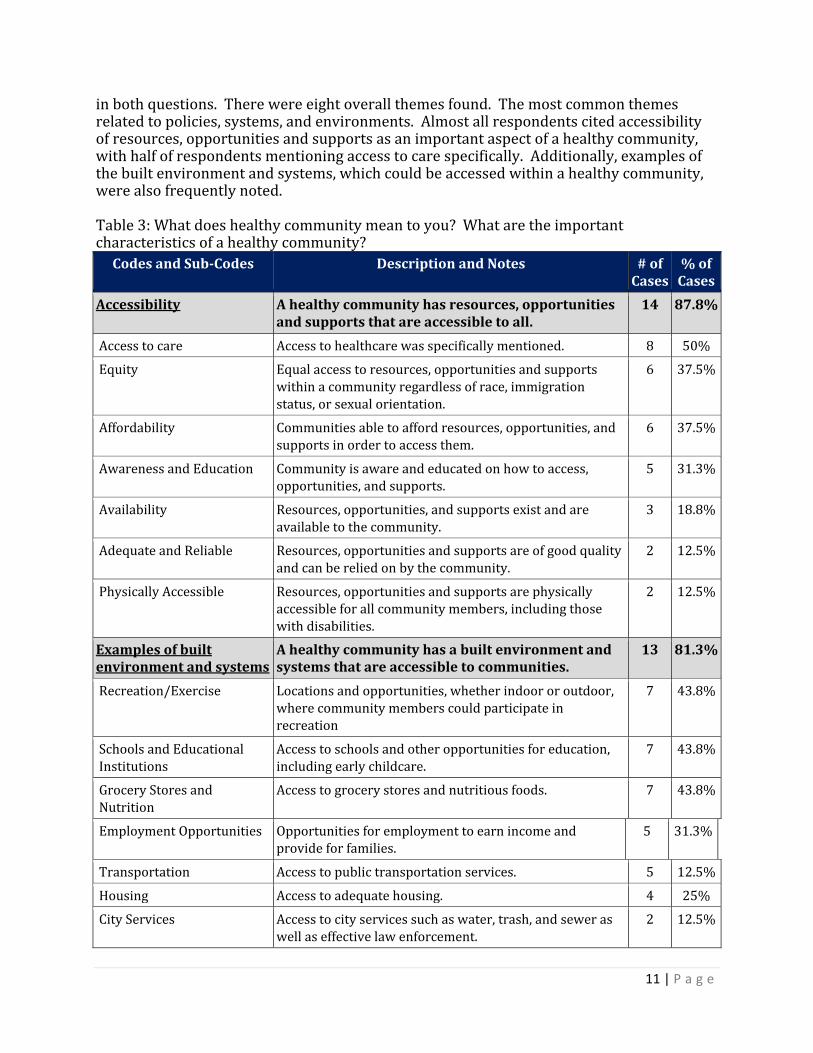
Characteristics of a Healthy Community: What does it mean to be a healthy community? Question 3 and 4 on the survey instrument received very similar answers. Question 3 asks what does healthy community mean to you and question 4 asks about important characteristics of a healthy community. After extensive review, it was discovered that the same codes were found in both questions. The large majority of sub-codes were also found
11 | P a g e
in both questions. There were eight overall themes found. The most common themes related to policies, systems, and environments. Almost all respondents cited accessibility of resources, opportunities and supports as an important aspect of a healthy community, with half of respondents mentioning access to care specifically. Additionally, examples of the built environment and systems, which could be accessed within a healthy community, were also frequently noted. Table 3: What does healthy community mean to you? What are the important characteristics of a healthy community?
Codes and Sub-Codes Description and Notes # of Cases
% of Cases
Accessibility A healthy community has resources, opportunities and supports that are accessible to all.
14
87.8%
Access to care Access to healthcare was specifically mentioned. 8 50%
Equity Equal access to resources, opportunities and supports within a community regardless of race, immigration status, or sexual orientation.
6 37.5%
Affordability Communities able to afford resources, opportunities, and supports in order to access them.
6 37.5%
Awareness and Education Community is aware and educated on how to access, opportunities, and supports.
5 31.3%
Availability Resources, opportunities, and supports exist and are available to the community.
3 18.8%
Adequate and Reliable Resources, opportunities and supports are of good quality and can be relied on by the community.
2 12.5%
Physically Accessible Resources, opportunities and supports are physically accessible for all community members, including those with disabilities.
2 12.5%
Examples of built environment and systems
A healthy community has a built environment and systems that are accessible to communities.
13 81.3%
Recreation/Exercise Locations and opportunities, whether indoor or outdoor, where community members could participate in recreation
7 43.8%
Schools and Educational Institutions
Access to schools and other opportunities for education, including early childcare.
7 43.8%
Grocery Stores and Nutrition
Access to grocery stores and nutritious foods. 7 43.8%
Employment Opportunities Opportunities for employment to earn income and provide for families.
5 31.3%
Transportation Access to public transportation services. 5 12.5%
Housing Access to adequate housing. 4 25%
City Services Access to city services such as water, trash, and sewer as well as effective law enforcement.
2 12.5%
12 | P a g e
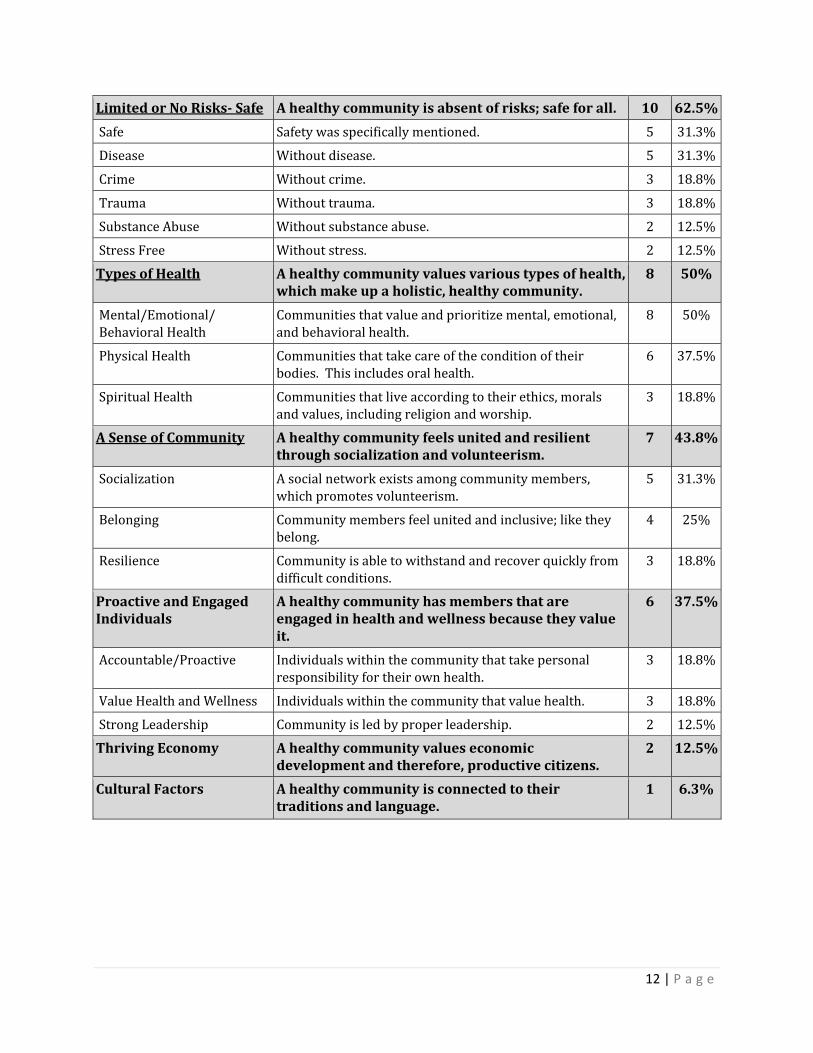
Limited or No Risks- Safe A healthy community is absent of risks; safe for all. 10 62.5%
Safe Safety was specifically mentioned. 5 31.3%
Disease Without disease. 5 31.3%
Crime Without crime. 3 18.8%
Trauma Without trauma. 3 18.8%
Substance Abuse Without substance abuse. 2 12.5%
Stress Free Without stress. 2 12.5%
Types of Health A healthy community values various types of health, which make up a holistic, healthy community.
8 50%
Mental/Emotional/ Behavioral Health
Communities that value and prioritize mental, emotional, and behavioral health.
8 50%
Physical Health Communities that take care of the condition of their bodies. This includes oral health.
6 37.5%
Spiritual Health Communities that live according to their ethics, morals and values, including religion and worship.
3 18.8%
A Sense of Community A healthy community feels united and resilient through socialization and volunteerism.
7 43.8%
Socialization A social network exists among community members, which promotes volunteerism.
5 31.3%
Belonging Community members feel united and inclusive; like they belong.
4 25%
Resilience Community is able to withstand and recover quickly from difficult conditions.
3 18.8%
Proactive and Engaged Individuals
A healthy community has members that are engaged in health and wellness because they value it.
6 37.5%
Accountable/Proactive Individuals within the community that take personal responsibility for their own health.
3 18.8%
Value Health and Wellness Individuals within the community that value health. 3 18.8%
Strong Leadership Community is led by proper leadership. 2 12.5%
Thriving Economy A healthy community values economic development and therefore, productive citizens.
2 12.5%
Cultural Factors A healthy community is connected to their traditions and language.
1 6.3%
13 | P a g e
Sampling of verbatim responses referring to the meaning and characteristics of a healthy community: “We have nice sidewalks, light rails, etc., but that doesn’t equate to community engagement. Do you feel good when you walk those streets? Do you belong there or does it feel foreign/ alienating to you?” “A place where people are able to achieve the state of health they want to achieve where they are free from extrinsic limitations on that.” “Very early on we started looking at the living environment in which they were trying to be well. They come to us, be with us, makes significant changes and then return back to the community and relapse. And so we began looking at really what makes up a well community? So it’s every aspect of that. Do they have a good job? Can they take care of their family? Do they have good health all around?” “I would say one that has easy access to healthcare, meaning not only can they physically get to a hospital, but they have a way to see a doctor, see a nurse, or other healthcare provider. So, access in a broader sense. Also, community that has a built environment that accommodates for easy walking, and community gardening, and a day-to-day activities that have been proven to improve health of the community, and reduce risk of heart disease or obesity.” “Healthy community is one where people are connected. Where they have access to the information, services, support, resources that they need that they have the ability to make informed decisions about their own situations and that they are connected to those around them and to the opportunities in our community.”
The Health of Residents within the Community: How healthy are they?
For question 5 on the survey instrument, respondents were asked how healthy residents are in their community and Maricopa County as a whole. Overall, respondents were confused about how to interpret this question. Often, they stated that they weren’t sure what was meant by “your community.” A handful of respondents mentioned the size, variability, and diversity of the county or community being difficult to generalize. A couple of respondents stated they didn’t know how to answer the question at all due to this fact. Additionally, because the question is double barreled—two questions within one—it was difficult to distinguish when a respondent was talking about their community, Maricopa County, or both. Sometimes interviewers clarified by asking the question two different ways, however, not always. Occasionally respondents were specific in their answers by distinguishing between their community and Maricopa. However, most respondents did not distinguish between the two. This made the analysis of this question challenging. Responses for this question varied greatly. Two respondents indicated on a scale of 1 to 10 how healthy their communities were. Both said they would rate their community at a 6 or
14 | P a g e
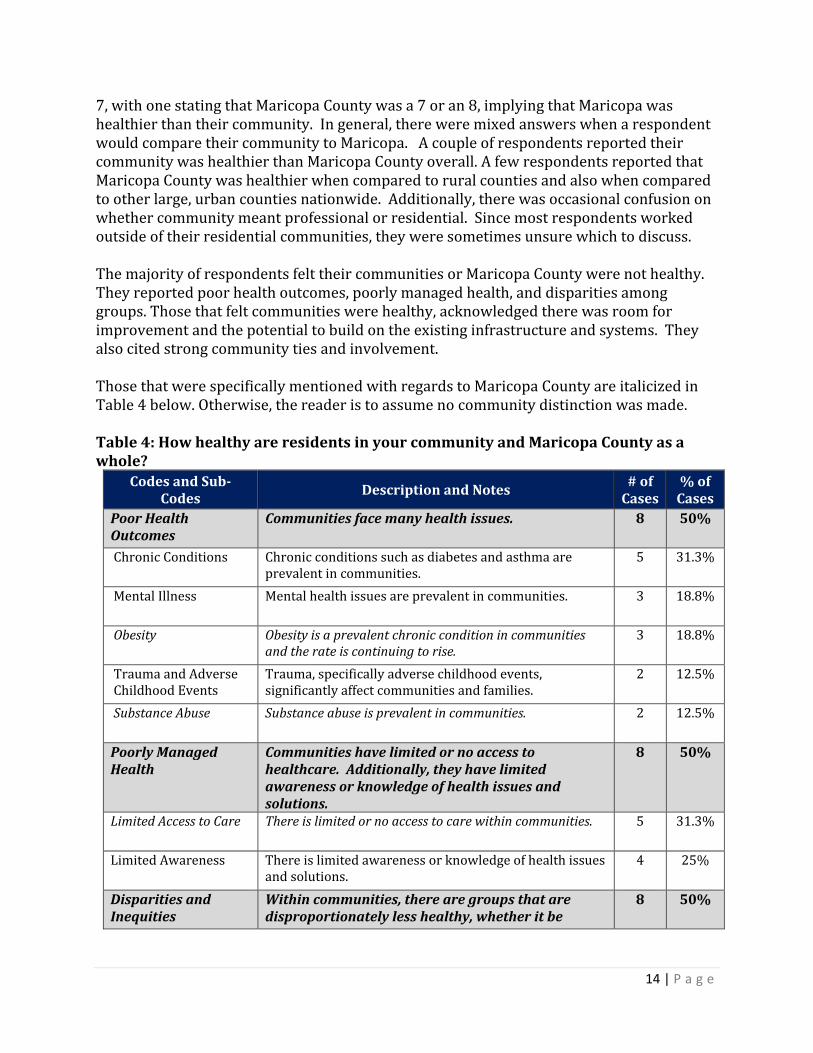
7, with one stating that Maricopa County was a 7 or an 8, implying that Maricopa was healthier than their community. In general, there were mixed answers when a respondent would compare their community to Maricopa. A couple of respondents reported their community was healthier than Maricopa County overall. A few respondents reported that Maricopa County was healthier when compared to rural counties and also when compared to other large, urban counties nationwide. Additionally, there was occasional confusion on whether community meant professional or residential. Since most respondents worked outside of their residential communities, they were sometimes unsure which to discuss. The majority of respondents felt their communities or Maricopa County were not healthy. They reported poor health outcomes, poorly managed health, and disparities among groups. Those that felt communities were healthy, acknowledged there was room for improvement and the potential to build on the existing infrastructure and systems. They also cited strong community ties and involvement. Those that were specifically mentioned with regards to Maricopa County are italicized in Table 4 below. Otherwise, the reader is to assume no community distinction was made. Table 4: How healthy are residents in your community and Maricopa County as a whole?
Codes and Sub-Codes
Description and Notes # of
Cases % of
Cases
Poor Health Outcomes
Communities face many health issues. 8 50%
Chronic Conditions Chronic conditions such as diabetes and asthma are prevalent in communities.
5 31.3%
Mental Illness Mental health issues are prevalent in communities. 3 18.8%
Obesity Obesity is a prevalent chronic condition in communities and the rate is continuing to rise.
3 18.8%
Trauma and Adverse Childhood Events
Trauma, specifically adverse childhood events, significantly affect communities and families.
2 12.5%
Substance Abuse Substance abuse is prevalent in communities. 2 12.5%
Poorly Managed Health
Communities have limited or no access to healthcare. Additionally, they have limited awareness or knowledge of health issues and solutions.
8 50%
Limited Access to Care There is limited or no access to care within communities. 5 31.3%
Limited Awareness There is limited awareness or knowledge of health issues and solutions.
4 25%
Disparities and Inequities
Within communities, there are groups that are disproportionately less healthy, whether it be
8 50%
15 | P a g e
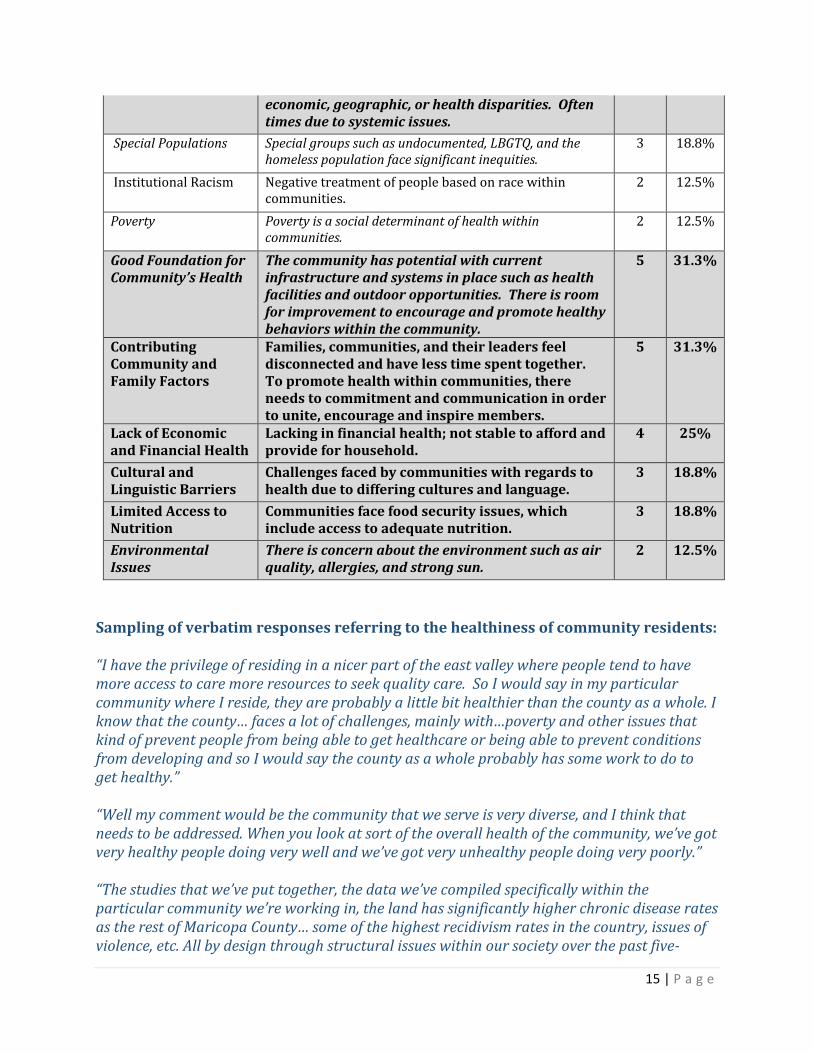
economic, geographic, or health disparities. Often times due to systemic issues.
Special Populations Special groups such as undocumented, LBGTQ, and the homeless population face significant inequities.
3 18.8%
Institutional Racism Negative treatment of people based on race within communities.
2 12.5%
Poverty Poverty is a social determinant of health within communities.
2 12.5%
Good Foundation for Community’s Health
The community has potential with current infrastructure and systems in place such as health facilities and outdoor opportunities. There is room for improvement to encourage and promote healthy behaviors within the community.
5 31.3%
Contributing Community and Family Factors
Families, communities, and their leaders feel disconnected and have less time spent together. To promote health within communities, there needs to commitment and communication in order to unite, encourage and inspire members.
5 31.3%
Lack of Economic and Financial Health
Lacking in financial health; not stable to afford and provide for household.
4 25%
Cultural and Linguistic Barriers
Challenges faced by communities with regards to health due to differing cultures and language.
3 18.8%
Limited Access to Nutrition
Communities face food security issues, which include access to adequate nutrition.
3 18.8%
Environmental Issues
There is concern about the environment such as air quality, allergies, and strong sun.
2 12.5%
Sampling of verbatim responses referring to the healthiness of community residents: “I have the privilege of residing in a nicer part of the east valley where people tend to have more access to care more resources to seek quality care. So I would say in my particular community where I reside, they are probably a little bit healthier than the county as a whole. I know that the county… faces a lot of challenges, mainly with…poverty and other issues that kind of prevent people from being able to get healthcare or being able to prevent conditions from developing and so I would say the county as a whole probably has some work to do to get healthy.” “Well my comment would be the community that we serve is very diverse, and I think that needs to be addressed. When you look at sort of the overall health of the community, we’ve got very healthy people doing very well and we’ve got very unhealthy people doing very poorly.” “The studies that we’ve put together, the data we’ve compiled specifically within the particular community we’re working in, the land has significantly higher chronic disease rates as the rest of Maricopa County… some of the highest recidivism rates in the country, issues of violence, etc. All by design through structural issues within our society over the past five-
16 | P a g e
hundred years, so issues of structural racism, issues of institutional oppression, issues of community and design to separate the people.” “I’d like to see our county… be more concerned about the most vulnerable in our community and what kind of supports they need to, not to become dependent on the support but to become independent with the right amount of support. So I don’t know a lot about the health of Maricopa County, but I know that the people that we see – poverty, and the high drug addition, the exposure, that they experience as children has a high impact on their life.” “I think that the potential for a healthy community is certainly here, at the same time we have challenges and those challenges come because we have some folks that may not have ready access to all of the resources that they should have, maybe they don’t have the information, maybe the culture and traditions that they come from keep them from being able to know and understand what some of the good choices are that are available to them.”
Accountability of the Community’s Health: Who is responsible?
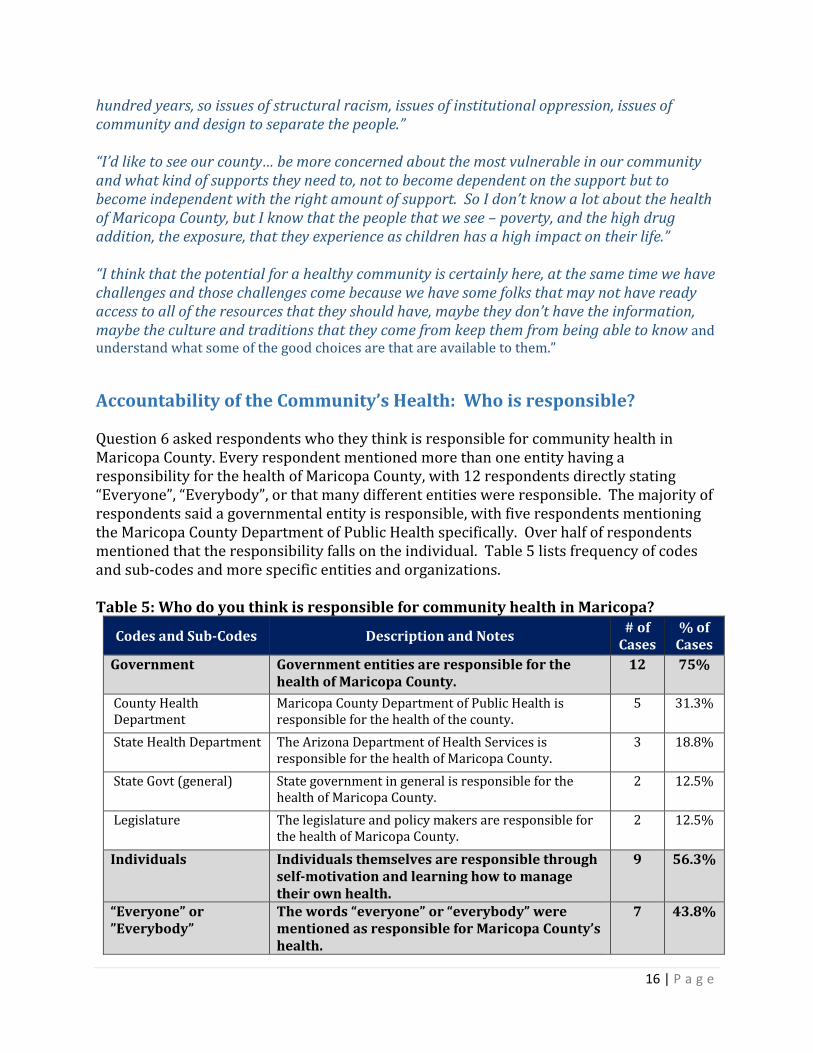
Question 6 asked respondents who they think is responsible for community health in Maricopa County. Every respondent mentioned more than one entity having a responsibility for the health of Maricopa County, with 12 respondents directly stating “Everyone”, “Everybody”, or that many different entities were responsible. The majority of respondents said a governmental entity is responsible, with five respondents mentioning the Maricopa County Department of Public Health specifically. Over half of respondents mentioned that the responsibility falls on the individual. Table 5 lists frequency of codes and sub-codes and more specific entities and organizations. Table 5: Who do you think is responsible for community health in Maricopa?
Codes and Sub-Codes Description and Notes # of
Cases % of
Cases
Government Government entities are responsible for the health of Maricopa County.
12 75%
County Health Department
Maricopa County Department of Public Health is responsible for the health of the county.
5 31.3%
State Health Department The Arizona Department of Health Services is responsible for the health of Maricopa County.
3 18.8%
State Govt (general) State government in general is responsible for the health of Maricopa County.
2 12.5%
Legislature The legislature and policy makers are responsible for the health of Maricopa County.
2 12.5%
Individuals Individuals themselves are responsible through self-motivation and learning how to manage their own health.
9 56.3%
“Everyone” or ”Everybody”
The words “everyone” or “everybody” were mentioned as responsible for Maricopa County’s health.
7 43.8%
17 | P a g e
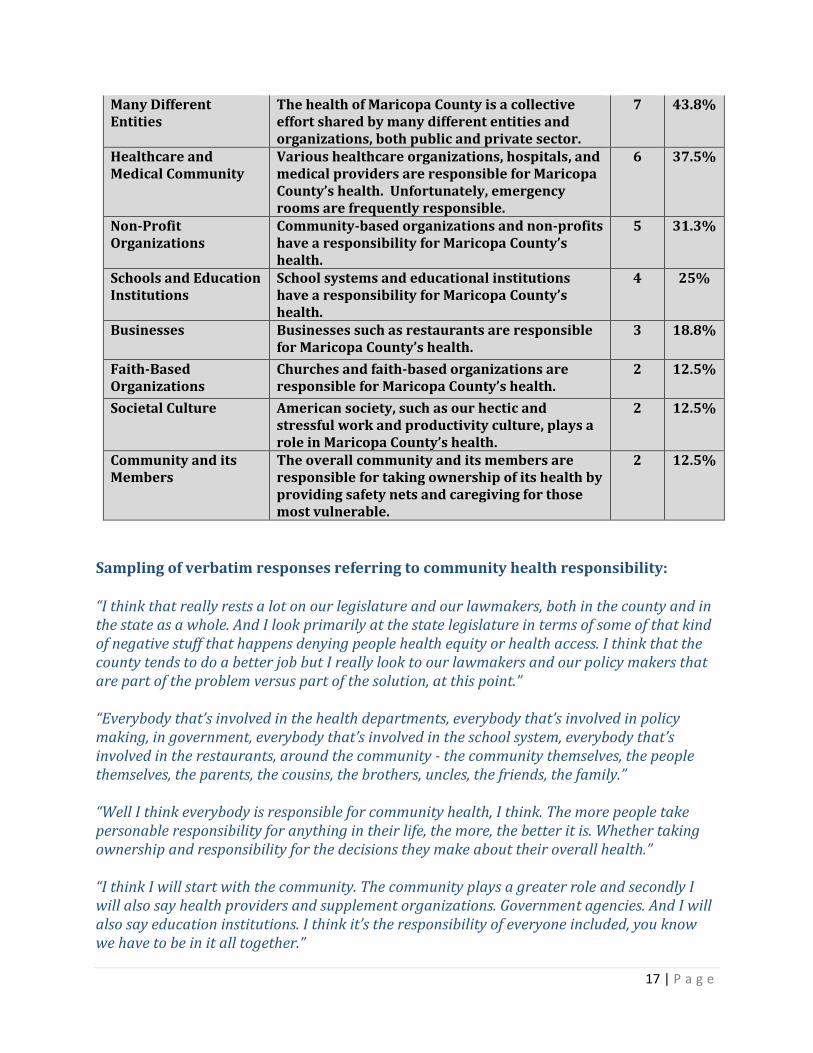
Many Different Entities
The health of Maricopa County is a collective effort shared by many different entities and organizations, both public and private sector.
7 43.8%
Healthcare and Medical Community
Various healthcare organizations, hospitals, and medical providers are responsible for Maricopa County’s health. Unfortunately, emergency rooms are frequently responsible.
6 37.5%
Non-Profit Organizations
Community-based organizations and non-profits have a responsibility for Maricopa County’s health.
5 31.3%
Schools and Education Institutions
School systems and educational institutions have a responsibility for Maricopa County’s health.
4 25%
Businesses Businesses such as restaurants are responsible for Maricopa County’s health.
3 18.8%
Faith-Based Organizations
Churches and faith-based organizations are responsible for Maricopa County’s health.
2 12.5%
Societal Culture American society, such as our hectic and stressful work and productivity culture, plays a role in Maricopa County’s health.
2 12.5%
Community and its Members
The overall community and its members are responsible for taking ownership of its health by providing safety nets and caregiving for those most vulnerable.
2 12.5%
Sampling of verbatim responses referring to community health responsibility: “I think that really rests a lot on our legislature and our lawmakers, both in the county and in the state as a whole. And I look primarily at the state legislature in terms of some of that kind of negative stuff that happens denying people health equity or health access. I think that the county tends to do a better job but I really look to our lawmakers and our policy makers that are part of the problem versus part of the solution, at this point.” “Everybody that’s involved in the health departments, everybody that’s involved in policy making, in government, everybody that’s involved in the school system, everybody that’s involved in the restaurants, around the community - the community themselves, the people themselves, the parents, the cousins, the brothers, uncles, the friends, the family.” “Well I think everybody is responsible for community health, I think. The more people take personable responsibility for anything in their life, the more, the better it is. Whether taking ownership and responsibility for the decisions they make about their overall health.”
“I think I will start with the community. The community plays a greater role and secondly I will also say health providers and supplement organizations. Government agencies. And I will also say education institutions. I think it’s the responsibility of everyone included, you know we have to be in it all together.”
18 | P a g e
“I think obviously the local health department is a key factor in that, but I think the state health department is also a key player because it does a lot of funding… So I think there’s a role for both, the state and local health department. But also in Maricopa County, there’s a huge nonprofit world, that I think plays also a role. So I think all of them together, it’s not just one organization.”
Changes in the Community: What changes occurred over the past five years?
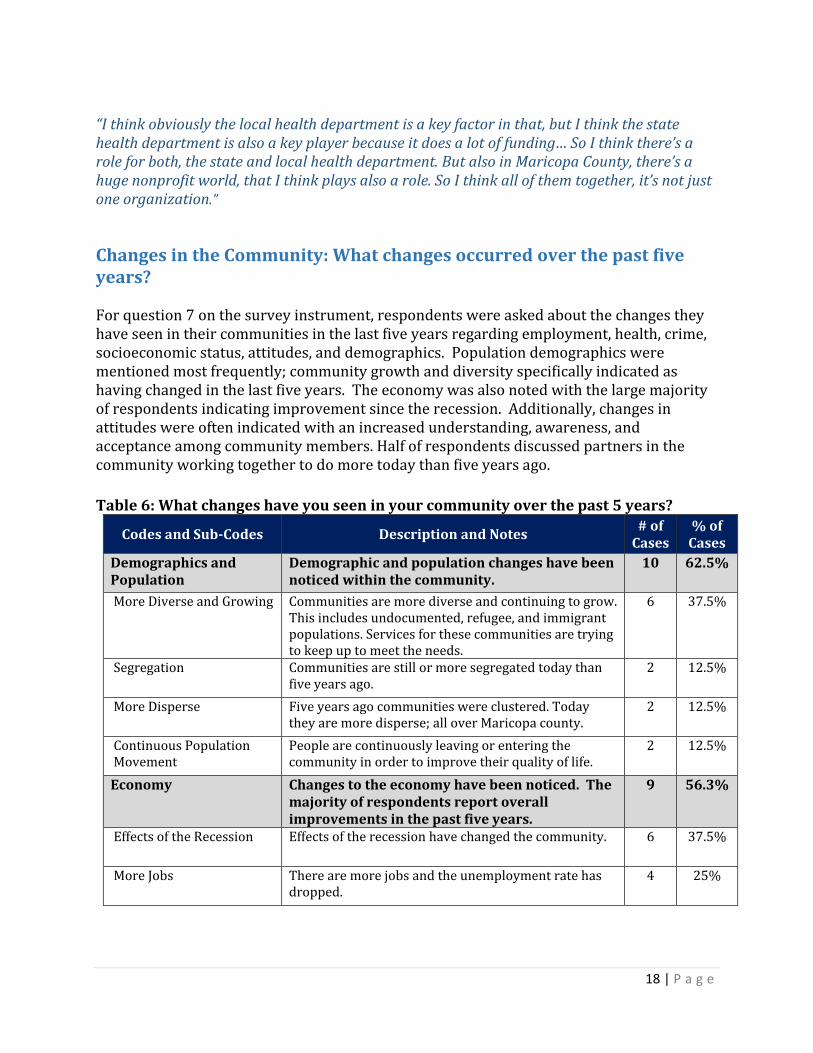
For question 7 on the survey instrument, respondents were asked about the changes they have seen in their communities in the last five years regarding employment, health, crime, socioeconomic status, attitudes, and demographics. Population demographics were mentioned most frequently; community growth and diversity specifically indicated as having changed in the last five years. The economy was also noted with the large majority of respondents indicating improvement since the recession. Additionally, changes in attitudes were often indicated with an increased understanding, awareness, and acceptance among community members. Half of respondents discussed partners in the community working together to do more today than five years ago.
Table 6: What changes have you seen in your community over the past 5 years?
Codes and Sub-Codes Description and Notes # of
Cases % of
Cases
Demographics and Population
Demographic and population changes have been noticed within the community.
10 62.5%
More Diverse and Growing Communities are more diverse and continuing to grow. This includes undocumented, refugee, and immigrant populations. Services for these communities are trying to keep up to meet the needs.
6 37.5%
Segregation Communities are still or more segregated today than five years ago.
2 12.5%
More Disperse Five years ago communities were clustered. Today they are more disperse; all over Maricopa county.
2 12.5%
Continuous Population Movement
People are continuously leaving or entering the community in order to improve their quality of life.
2 12.5%
Economy Changes to the economy have been noticed. The majority of respondents report overall improvements in the past five years.
9 56.3%
Effects of the Recession Effects of the recession have changed the community. 6 37.5%
More Jobs There are more jobs and the unemployment rate has dropped.
4 25%
19 | P a g e
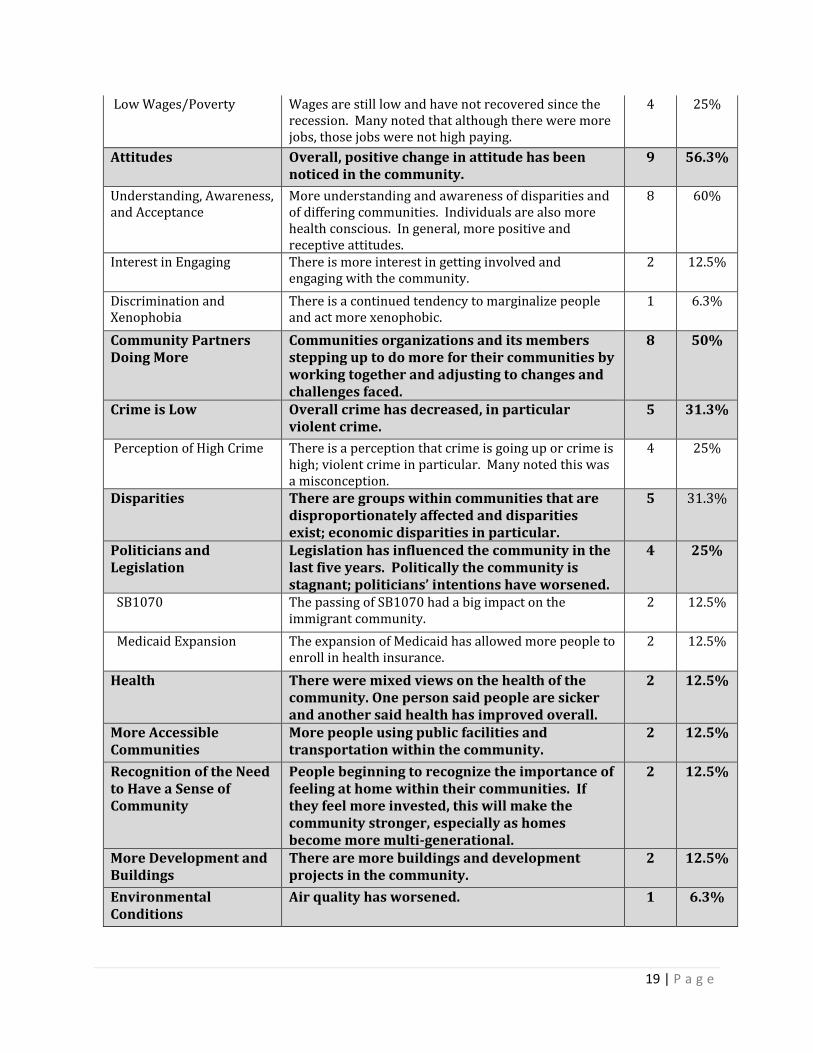
Low Wages/Poverty Wages are still low and have not recovered since the recession. Many noted that although there were more jobs, those jobs were not high paying.
4 25%
Attitudes Overall, positive change in attitude has been noticed in the community.
9 56.3%
Understanding, Awareness, and Acceptance
More understanding and awareness of disparities and of differing communities. Individuals are also more health conscious. In general, more positive and receptive attitudes.
8 60%
Interest in Engaging There is more interest in getting involved and engaging with the community.
2 12.5%
Discrimination and Xenophobia
There is a continued tendency to marginalize people and act more xenophobic.
1 6.3%
Community Partners Doing More
Communities organizations and its members stepping up to do more for their communities by working together and adjusting to changes and challenges faced.
8 50%
Crime is Low Overall crime has decreased, in particular violent crime.
5 31.3%
Perception of High Crime There is a perception that crime is going up or crime is high; violent crime in particular. Many noted this was a misconception.
4 25%
Disparities There are groups within communities that are disproportionately affected and disparities exist; economic disparities in particular.
5 31.3%
Politicians and Legislation
Legislation has influenced the community in the last five years. Politically the community is stagnant; politicians’ intentions have worsened.
4 25%
SB1070 The passing of SB1070 had a big impact on the immigrant community.
2 12.5%
Medicaid Expansion The expansion of Medicaid has allowed more people to enroll in health insurance.
2 12.5%
Health There were mixed views on the health of the community. One person said people are sicker and another said health has improved overall.
2 12.5%
More Accessible Communities
More people using public facilities and transportation within the community.
2 12.5%
Recognition of the Need to Have a Sense of Community
People beginning to recognize the importance of feeling at home within their communities. If they feel more invested, this will make the community stronger, especially as homes become more multi-generational.
2 12.5%
More Development and Buildings
There are more buildings and development projects in the community.
2 12.5%
Environmental Conditions
Air quality has worsened. 1 6.3%
20 | P a g e
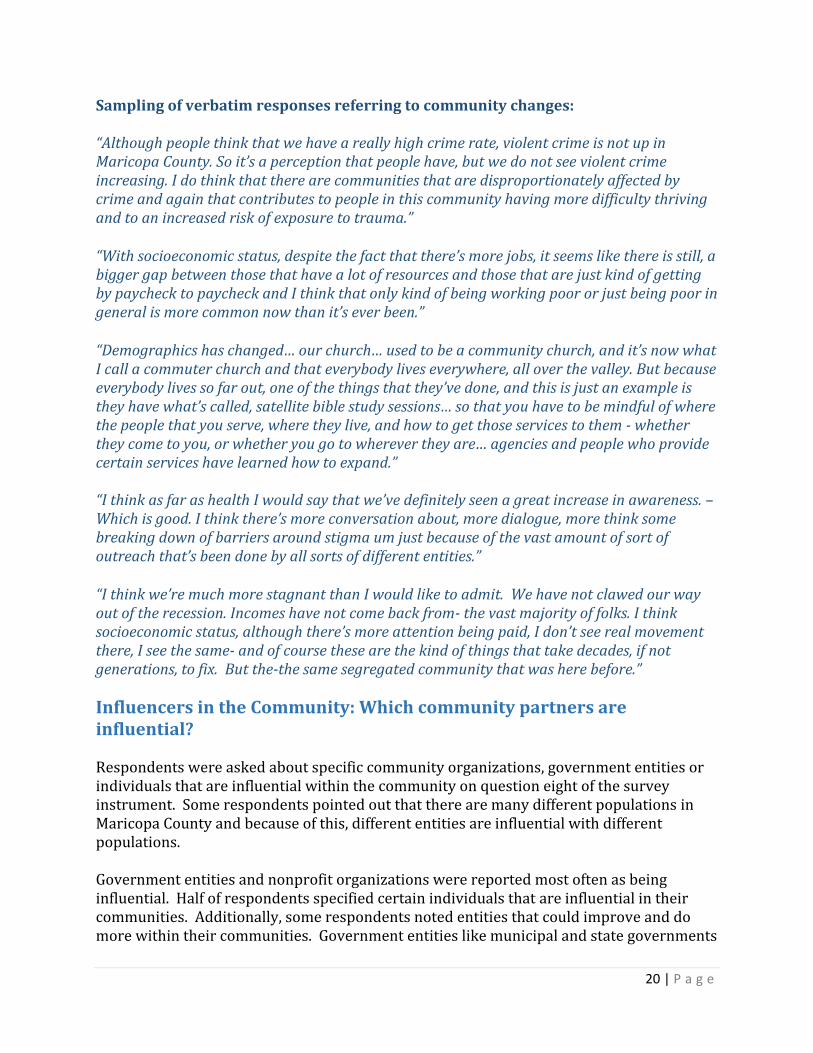
Sampling of verbatim responses referring to community changes: “Although people think that we have a really high crime rate, violent crime is not up in Maricopa County. So it’s a perception that people have, but we do not see violent crime increasing. I do think that there are communities that are disproportionately affected by crime and again that contributes to people in this community having more difficulty thriving and to an increased risk of exposure to trauma.” “With socioeconomic status, despite the fact that there’s more jobs, it seems like there is still, a bigger gap between those that have a lot of resources and those that are just kind of getting by paycheck to paycheck and I think that only kind of being working poor or just being poor in general is more common now than it’s ever been.” “Demographics has changed… our church… used to be a community church, and it’s now what I call a commuter church and that everybody lives everywhere, all over the valley. But because everybody lives so far out, one of the things that they’ve done, and this is just an example is they have what’s called, satellite bible study sessions… so that you have to be mindful of where the people that you serve, where they live, and how to get those services to them - whether they come to you, or whether you go to wherever they are… agencies and people who provide certain services have learned how to expand.” “I think as far as health I would say that we’ve definitely seen a great increase in awareness. – Which is good. I think there’s more conversation about, more dialogue, more think some breaking down of barriers around stigma um just because of the vast amount of sort of outreach that’s been done by all sorts of different entities.” “I think we’re much more stagnant than I would like to admit. We have not clawed our way out of the recession. Incomes have not come back from- the vast majority of folks. I think socioeconomic status, although there’s more attention being paid, I don’t see real movement there, I see the same- and of course these are the kind of things that take decades, if not generations, to fix. But the-the same segregated community that was here before.”
Influencers in the Community: Which community partners are influential?
Respondents were asked about specific community organizations, government entities or individuals that are influential within the community on question eight of the survey instrument. Some respondents pointed out that there are many different populations in Maricopa County and because of this, different entities are influential with different populations. Government entities and nonprofit organizations were reported most often as being influential. Half of respondents specified certain individuals that are influential in their communities. Additionally, some respondents noted entities that could improve and do more within their communities. Government entities like municipal and state governments
21 | P a g e
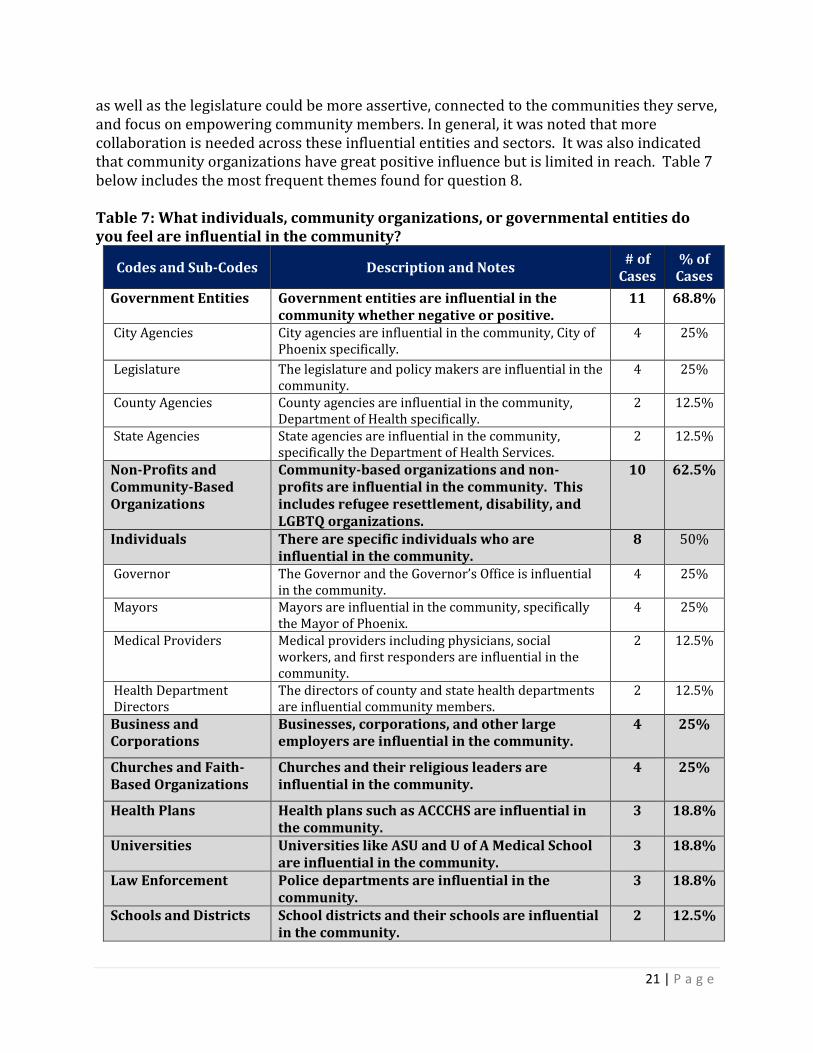
as well as the legislature could be more assertive, connected to the communities they serve, and focus on empowering community members. In general, it was noted that more collaboration is needed across these influential entities and sectors. It was also indicated that community organizations have great positive influence but is limited in reach. Table 7 below includes the most frequent themes found for question 8. Table 7: What individuals, community organizations, or governmental entities do you feel are influential in the community?
Codes and Sub-Codes Description and Notes # of
Cases % of
Cases
Government Entities Government entities are influential in the community whether negative or positive.
11 68.8%
City Agencies City agencies are influential in the community, City of Phoenix specifically.
4 25%
Legislature The legislature and policy makers are influential in the community.
4 25%
County Agencies County agencies are influential in the community, Department of Health specifically.
2 12.5%
State Agencies State agencies are influential in the community, specifically the Department of Health Services.
2 12.5%
Non-Profits and Community-Based Organizations
Community-based organizations and non-profits are influential in the community. This includes refugee resettlement, disability, and LGBTQ organizations.
10 62.5%
Individuals There are specific individuals who are influential in the community.
8 50%
Governor The Governor and the Governor’s Office is influential in the community.
4 25%
Mayors Mayors are influential in the community, specifically the Mayor of Phoenix.
4 25%
Medical Providers Medical providers including physicians, social workers, and first responders are influential in the community.
2 12.5%
Health Department Directors
The directors of county and state health departments are influential community members.
2 12.5%
Business and Corporations
Businesses, corporations, and other large employers are influential in the community.
4 25%
Churches and Faith-Based Organizations
Churches and their religious leaders are influential in the community.
4 25%
Health Plans Health plans such as ACCCHS are influential in the community.
3 18.8%
Universities Universities like ASU and U of A Medical School are influential in the community.
3 18.8%
Law Enforcement Police departments are influential in the community.
3 18.8%
Schools and Districts School districts and their schools are influential in the community.
2 12.5%
22 | P a g e
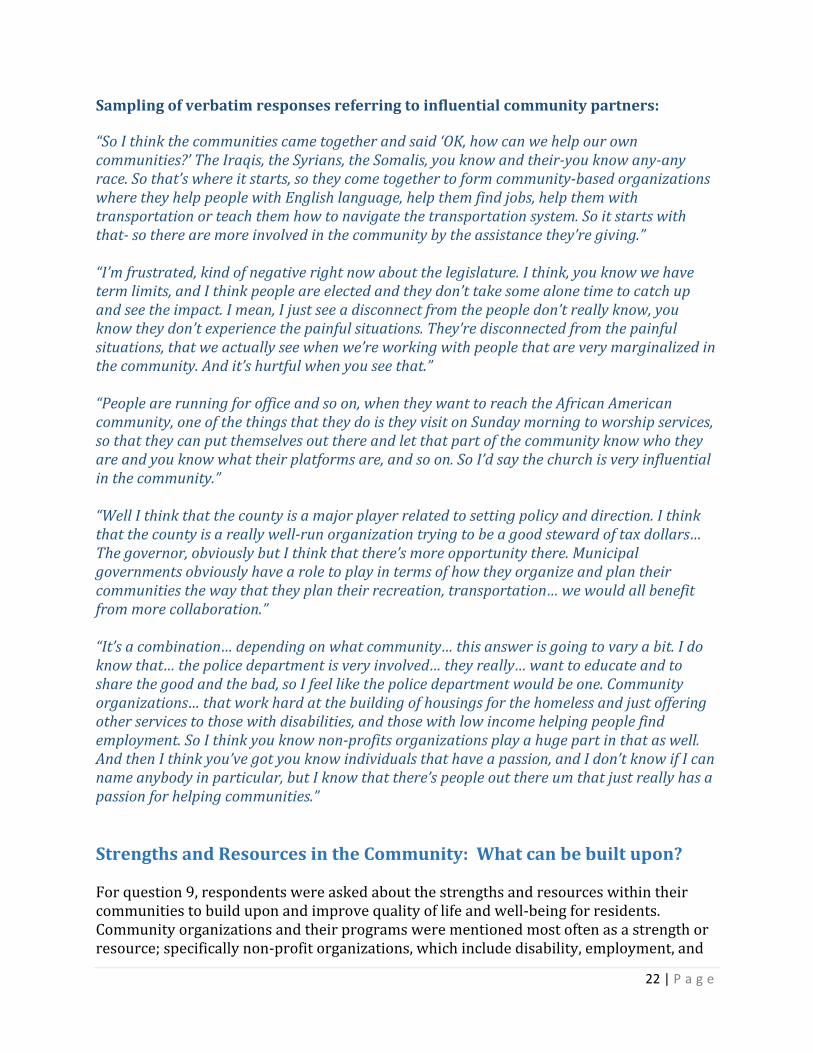
Sampling of verbatim responses referring to influential community partners:
“So I think the communities came together and said ‘OK, how can we help our own communities?’ The Iraqis, the Syrians, the Somalis, you know and their-you know any-any race. So that’s where it starts, so they come together to form community-based organizations where they help people with English language, help them find jobs, help them with transportation or teach them how to navigate the transportation system. So it starts with that- so there are more involved in the community by the assistance they’re giving.” “I’m frustrated, kind of negative right now about the legislature. I think, you know we have term limits, and I think people are elected and they don’t take some alone time to catch up and see the impact. I mean, I just see a disconnect from the people don’t really know, you know they don’t experience the painful situations. They’re disconnected from the painful situations, that we actually see when we’re working with people that are very marginalized in the community. And it’s hurtful when you see that.” “People are running for office and so on, when they want to reach the African American community, one of the things that they do is they visit on Sunday morning to worship services, so that they can put themselves out there and let that part of the community know who they are and you know what their platforms are, and so on. So I’d say the church is very influential in the community.” “Well I think that the county is a major player related to setting policy and direction. I think that the county is a really well-run organization trying to be a good steward of tax dollars… The governor, obviously but I think that there’s more opportunity there. Municipal governments obviously have a role to play in terms of how they organize and plan their communities the way that they plan their recreation, transportation… we would all benefit from more collaboration.” “It’s a combination… depending on what community… this answer is going to vary a bit. I do know that… the police department is very involved… they really… want to educate and to share the good and the bad, so I feel like the police department would be one. Community organizations… that work hard at the building of housings for the homeless and just offering other services to those with disabilities, and those with low income helping people find employment. So I think you know non-profits organizations play a huge part in that as well. And then I think you’ve got you know individuals that have a passion, and I don’t know if I can name anybody in particular, but I know that there’s people out there um that just really has a passion for helping communities.”
Strengths and Resources in the Community: What can be built upon?
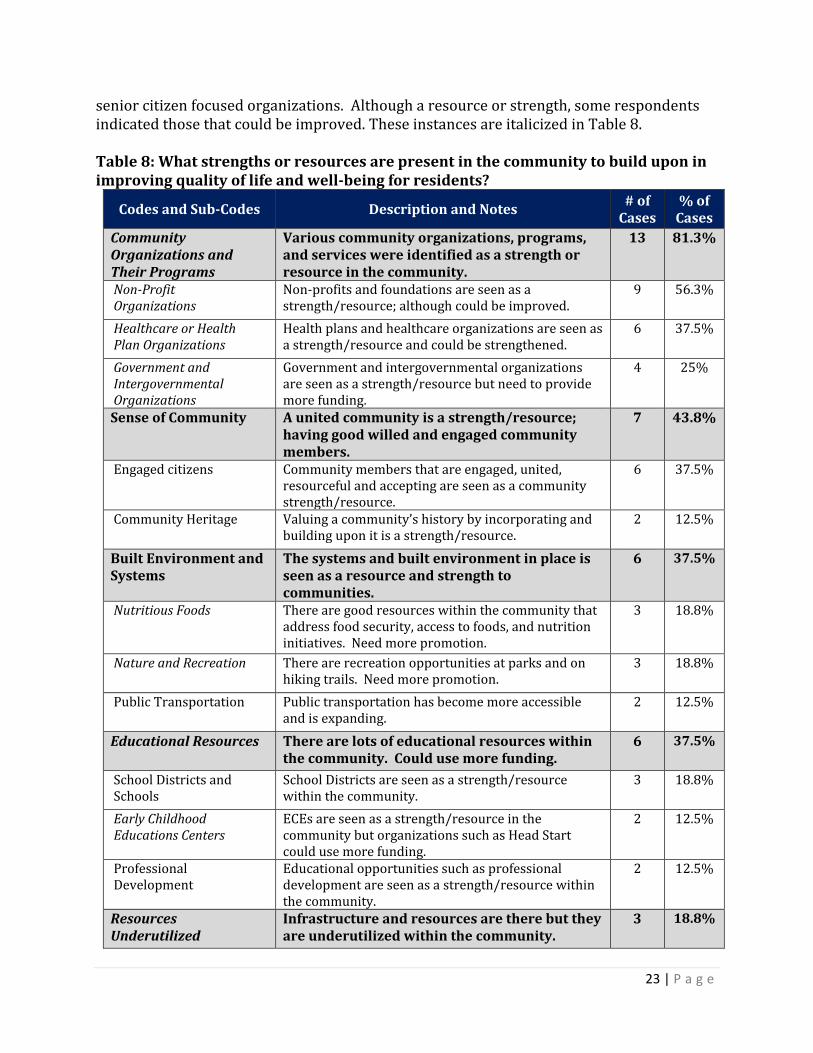
For question 9, respondents were asked about the strengths and resources within their communities to build upon and improve quality of life and well-being for residents. Community organizations and their programs were mentioned most often as a strength or resource; specifically non-profit organizations, which include disability, employment, and
23 | P a g e
senior citizen focused organizations. Although a resource or strength, some respondents indicated those that could be improved. These instances are italicized in Table 8. Table 8: What strengths or resources are present in the community to build upon in improving quality of life and well-being for residents?
Codes and Sub-Codes Description and Notes # of
Cases % of
Cases
Community Organizations and Their Programs
Various community organizations, programs, and services were identified as a strength or resource in the community.
13 81.3%
Non-Profit Organizations
Non-profits and foundations are seen as a strength/resource; although could be improved.
9 56.3%
Healthcare or Health Plan Organizations
Health plans and healthcare organizations are seen as a strength/resource and could be strengthened.
6 37.5%
Government and Intergovernmental Organizations
Government and intergovernmental organizations are seen as a strength/resource but need to provide more funding.
4 25%
Sense of Community A united community is a strength/resource; having good willed and engaged community members.
7 43.8%
Engaged citizens Community members that are engaged, united, resourceful and accepting are seen as a community strength/resource.
6 37.5%
Community Heritage Valuing a community’s history by incorporating and building upon it is a strength/resource.
2 12.5%
Built Environment and Systems
The systems and built environment in place is seen as a resource and strength to communities.
6 37.5%
Nutritious Foods There are good resources within the community that address food security, access to foods, and nutrition initiatives. Need more promotion.
3 18.8%
Nature and Recreation There are recreation opportunities at parks and on hiking trails. Need more promotion.
3 18.8%
Public Transportation Public transportation has become more accessible and is expanding.
2 12.5%
Educational Resources There are lots of educational resources within the community. Could use more funding.
6 37.5%
School Districts and Schools
School Districts are seen as a strength/resource within the community.
3 18.8%
Early Childhood Educations Centers
ECEs are seen as a strength/resource in the community but organizations such as Head Start could use more funding.
2 12.5%
Professional Development
Educational opportunities such as professional development are seen as a strength/resource within the community.
2 12.5%
Resources Underutilized
Infrastructure and resources are there but they are underutilized within the community.
3 18.8%
24 | P a g e
Collaboration Communities collaborating and leveraging their resources is seen as a strength/resource.
2 12.5%
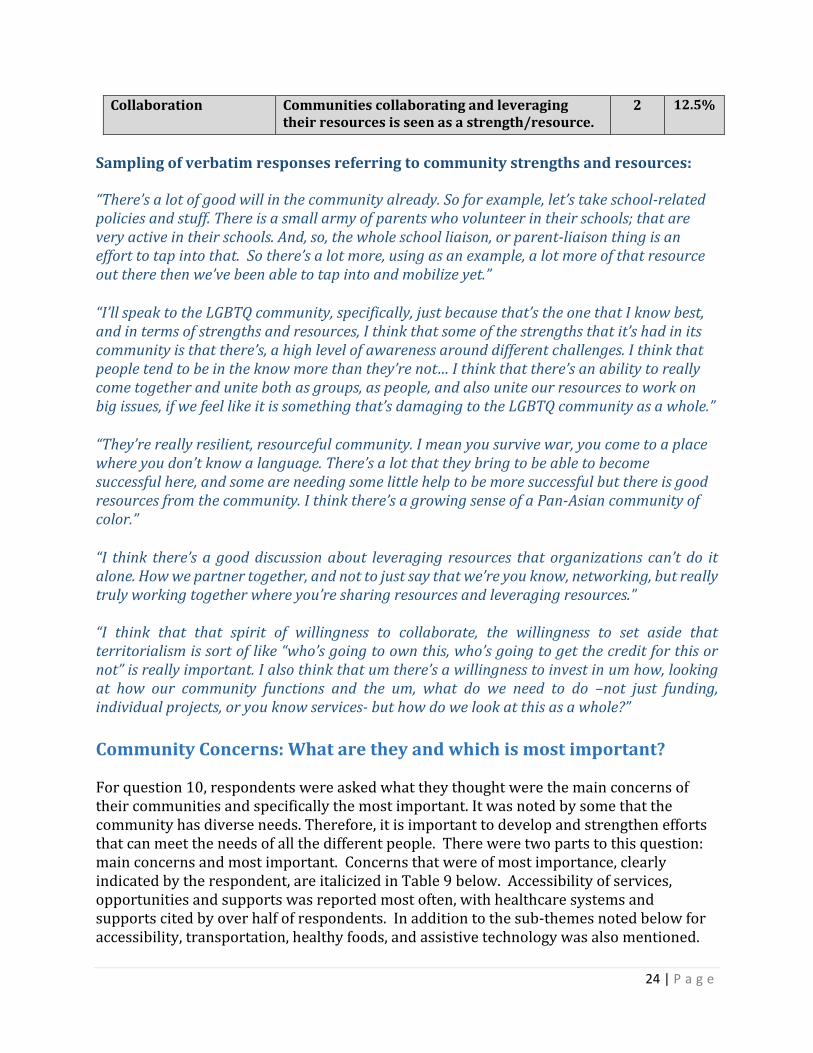
Sampling of verbatim responses referring to community strengths and resources:
“There’s a lot of good will in the community already. So for example, let’s take school-related policies and stuff. There is a small army of parents who volunteer in their schools; that are very active in their schools. And, so, the whole school liaison, or parent-liaison thing is an effort to tap into that. So there’s a lot more, using as an example, a lot more of that resource out there then we’ve been able to tap into and mobilize yet.” “I’ll speak to the LGBTQ community, specifically, just because that’s the one that I know best, and in terms of strengths and resources, I think that some of the strengths that it’s had in its community is that there’s, a high level of awareness around different challenges. I think that people tend to be in the know more than they’re not… I think that there’s an ability to really come together and unite both as groups, as people, and also unite our resources to work on big issues, if we feel like it is something that’s damaging to the LGBTQ community as a whole.” “They’re really resilient, resourceful community. I mean you survive war, you come to a place where you don’t know a language. There’s a lot that they bring to be able to become successful here, and some are needing some little help to be more successful but there is good resources from the community. I think there’s a growing sense of a Pan-Asian community of color.” “I think there’s a good discussion about leveraging resources that organizations can’t do it alone. How we partner together, and not to just say that we’re you know, networking, but really truly working together where you’re sharing resources and leveraging resources.” “I think that that spirit of willingness to collaborate, the willingness to set aside that territorialism is sort of like “who’s going to own this, who’s going to get the credit for this or not” is really important. I also think that um there’s a willingness to invest in um how, looking at how our community functions and the um, what do we need to do –not just funding, individual projects, or you know services- but how do we look at this as a whole?”
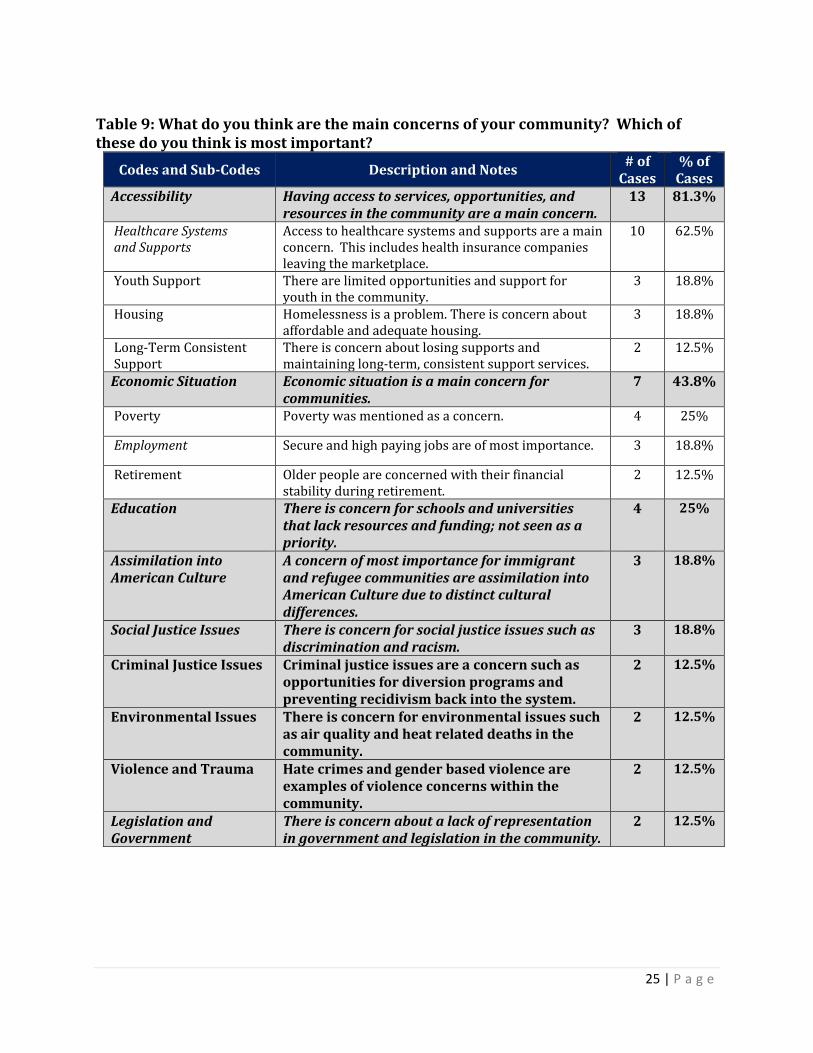
Community Concerns: What are they and which is most important?
For question 10, respondents were asked what they thought were the main concerns of their communities and specifically the most important. It was noted by some that the community has diverse needs. Therefore, it is important to develop and strengthen efforts that can meet the needs of all the different people. There were two parts to this question: main concerns and most important. Concerns that were of most importance, clearly indicated by the respondent, are italicized in Table 9 below. Accessibility of services, opportunities and supports was reported most often, with healthcare systems and supports cited by over half of respondents. In addition to the sub-themes noted below for accessibility, transportation, healthy foods, and assistive technology was also mentioned.
25 | P a g e
Table 9: What do you think are the main concerns of your community? Which of these do you think is most important?
Codes and Sub-Codes Description and Notes # of
Cases % of
Cases Accessibility Having access to services, opportunities, and
resources in the community are a main concern. 13 81.3%
Healthcare Systems and Supports
Access to healthcare systems and supports are a main concern. This includes health insurance companies leaving the marketplace.
10 62.5%
Youth Support There are limited opportunities and support for youth in the community.
3 18.8%
Housing Homelessness is a problem. There is concern about affordable and adequate housing.
3 18.8%
Long-Term Consistent Support
There is concern about losing supports and maintaining long-term, consistent support services.
2 12.5%
Economic Situation Economic situation is a main concern for communities.
7 43.8%
Poverty Poverty was mentioned as a concern. 4 25%
Employment Secure and high paying jobs are of most importance. 3 18.8%
Retirement Older people are concerned with their financial stability during retirement.
2 12.5%
Education There is concern for schools and universities that lack resources and funding; not seen as a priority.
4 25%
Assimilation into American Culture
A concern of most importance for immigrant and refugee communities are assimilation into American Culture due to distinct cultural differences.
3 18.8%
Social Justice Issues There is concern for social justice issues such as discrimination and racism.
3 18.8%
Criminal Justice Issues Criminal justice issues are a concern such as opportunities for diversion programs and preventing recidivism back into the system.
2 12.5%
Environmental Issues There is concern for environmental issues such as air quality and heat related deaths in the community.
2 12.5%
Violence and Trauma Hate crimes and gender based violence are examples of violence concerns within the community.
2 12.5%
Legislation and Government
There is concern about a lack of representation in government and legislation in the community.
2 12.5%
26 | P a g e
Sampling of verbatim responses referring to community concerns:
“Losing their (healthcare) access. And then being able to access healthcare is the biggest fear. I mean, most of the people I’ve seen are not worried about what they eat, but they are mostly worried about, having some sort of safety net for their health… I mean having that insurance… It’s what they always worry about… because, you know, people I work with are poor.” “Cultural differences. Affect people’s relationships and communications. A refugee face unique emotional and social and cultural adjustment… during the period of their resettlement process.” “Education. The amount of dollars that are put to education, particularly here in the state of Arizona, we are you know, keep learning we are forty-eight or forty-ninth in the nation in the financial resources that are allocated to our children’s school… and just hearing what some of the teachers have to go through in order to make it through their school year with their students. Their class sizes are getting… bigger. I know a lot of them use their own resources to provide the supplies that they need throughout the year with the tax structure that’s here in the state, and the amount of tax they collect, it just makes you wonder compared to what other states are doing, “What are they doing with the money?”” “I think another concern is helping people with mental health disabilities, that’s a big concern and diverting them away from the criminal justice system, I know there’s some work being done in that area but more needs to be coordination of resources so that they get the things they need.” “Because the community is not homogenous, I think that there’s lots of different concerns, but for me, what I would think the main concerns are is really violence that’s happening, towards the community, particularly towards trans individuals, and especially trans women of color and also attempts to roll back some of the successes that we’ve had over the past few years with different legislation to try and again, make it an uncomfortable at the very least and criminal at the most to be LGBTQ and kind of live your life.”
Barriers within the Community: What obstacles do communities face?
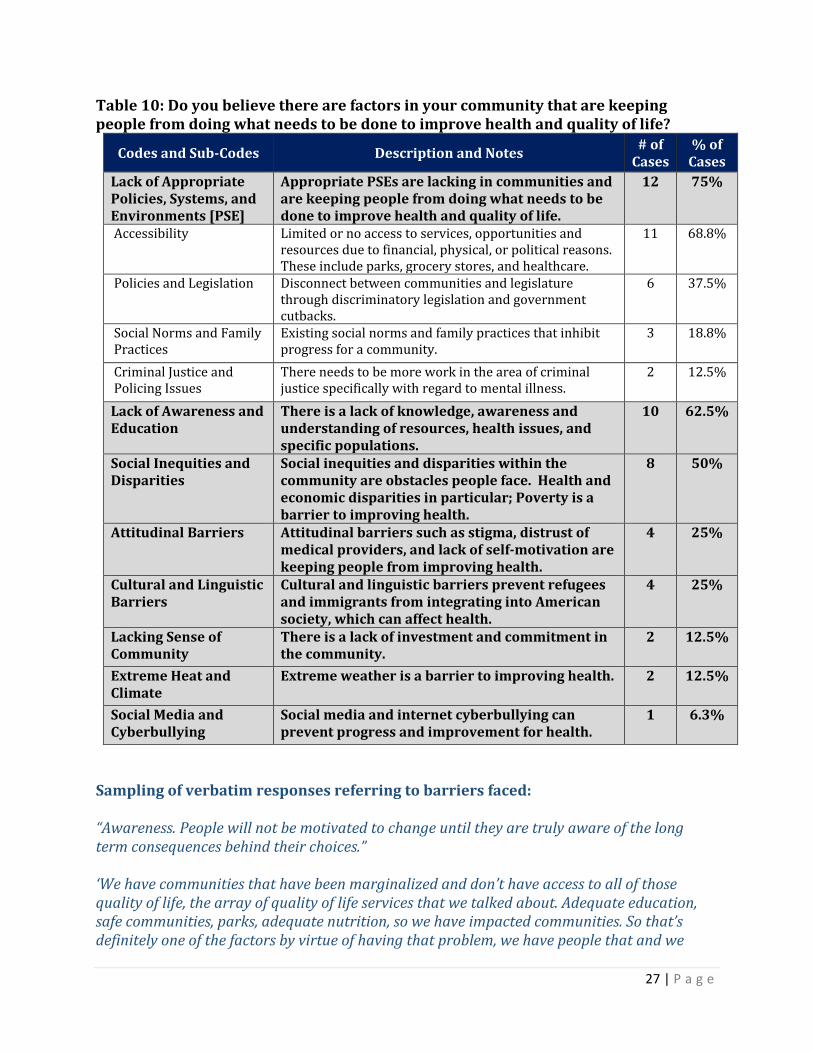
For question 11, respondents are asked about factors in the community that prevent people from doing what needs to be done to improve their health and quality of life. The lack of appropriate policies, systems, and environments within communities are a significant barrier. Accessibility of resources, opportunities, and supports in particular are crucial to the improvement of health and quality of life for communities. Lack of awareness, education and understanding of health issues, resources in the community, and unique or different populations also hinder the improvement of health. Half of respondents mentioned inequities and/or disparities as a significant obstacle in improving health.
27 | P a g e
Table 10: Do you believe there are factors in your community that are keeping people from doing what needs to be done to improve health and quality of life?
Codes and Sub-Codes Description and Notes # of
Cases % of
Cases
Lack of Appropriate Policies, Systems, and Environments [PSE]
Appropriate PSEs are lacking in communities and are keeping people from doing what needs to be done to improve health and quality of life.
12 75%
Accessibility Limited or no access to services, opportunities and resources due to financial, physical, or political reasons. These include parks, grocery stores, and healthcare.
11 68.8%
Policies and Legislation Disconnect between communities and legislature through discriminatory legislation and government cutbacks.
6 37.5%
Social Norms and Family Practices
Existing social norms and family practices that inhibit progress for a community.
3 18.8%
Criminal Justice and Policing Issues
There needs to be more work in the area of criminal justice specifically with regard to mental illness.
2 12.5%
Lack of Awareness and Education
There is a lack of knowledge, awareness and understanding of resources, health issues, and specific populations.
10 62.5%
Social Inequities and Disparities
Social inequities and disparities within the community are obstacles people face. Health and economic disparities in particular; Poverty is a barrier to improving health.
8 50%
Attitudinal Barriers Attitudinal barriers such as stigma, distrust of medical providers, and lack of self-motivation are keeping people from improving health.
4 25%
Cultural and Linguistic Barriers
Cultural and linguistic barriers prevent refugees and immigrants from integrating into American society, which can affect health.
4 25%
Lacking Sense of Community
There is a lack of investment and commitment in the community.
2 12.5%
Extreme Heat and Climate
Extreme weather is a barrier to improving health. 2 12.5%
Social Media and Cyberbullying
Social media and internet cyberbullying can prevent progress and improvement for health.
1 6.3%
Sampling of verbatim responses referring to barriers faced: “Awareness. People will not be motivated to change until they are truly aware of the long term consequences behind their choices.” ‘We have communities that have been marginalized and don’t have access to all of those quality of life, the array of quality of life services that we talked about. Adequate education, safe communities, parks, adequate nutrition, so we have impacted communities. So that’s definitely one of the factors by virtue of having that problem, we have people that and we
28 | P a g e
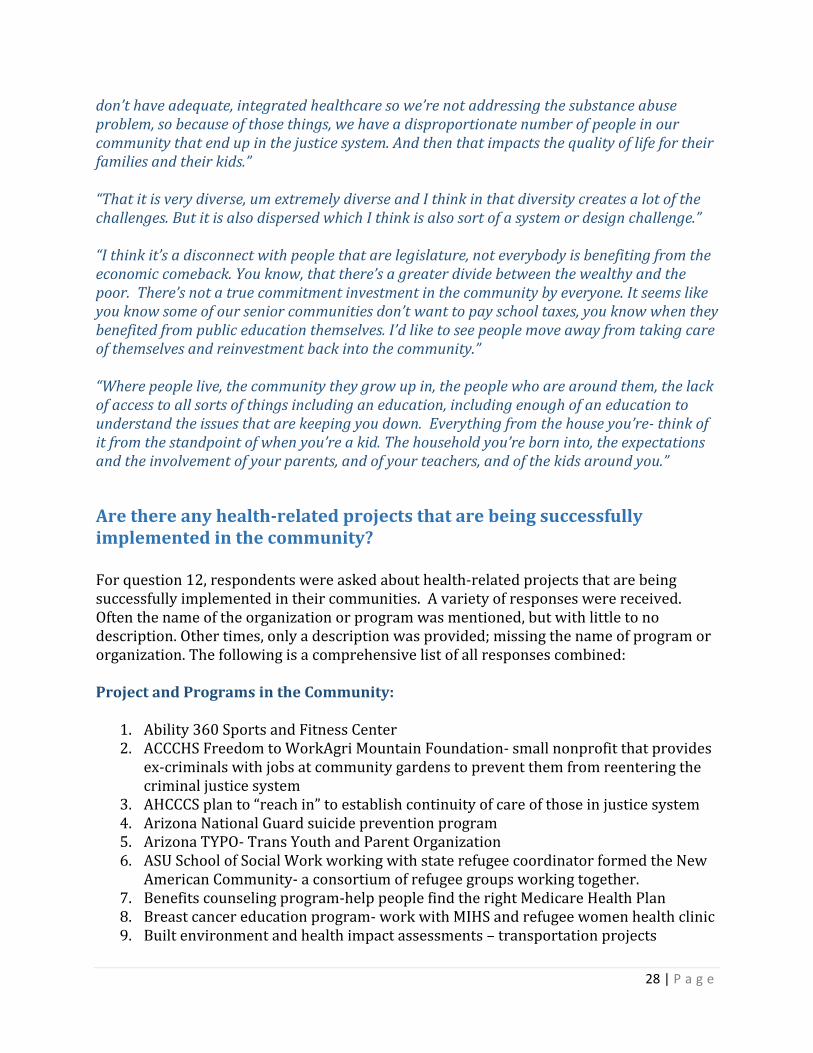
don’t have adequate, integrated healthcare so we’re not addressing the substance abuse problem, so because of those things, we have a disproportionate number of people in our community that end up in the justice system. And then that impacts the quality of life for their families and their kids.” “That it is very diverse, um extremely diverse and I think in that diversity creates a lot of the challenges. But it is also dispersed which I think is also sort of a system or design challenge.” “I think it’s a disconnect with people that are legislature, not everybody is benefiting from the economic comeback. You know, that there’s a greater divide between the wealthy and the poor. There’s not a true commitment investment in the community by everyone. It seems like you know some of our senior communities don’t want to pay school taxes, you know when they benefited from public education themselves. I’d like to see people move away from taking care of themselves and reinvestment back into the community.”
“Where people live, the community they grow up in, the people who are around them, the lack of access to all sorts of things including an education, including enough of an education to understand the issues that are keeping you down. Everything from the house you’re- think of it from the standpoint of when you’re a kid. The household you’re born into, the expectations and the involvement of your parents, and of your teachers, and of the kids around you.”
Are there any health-related projects that are being successfully implemented in the community?
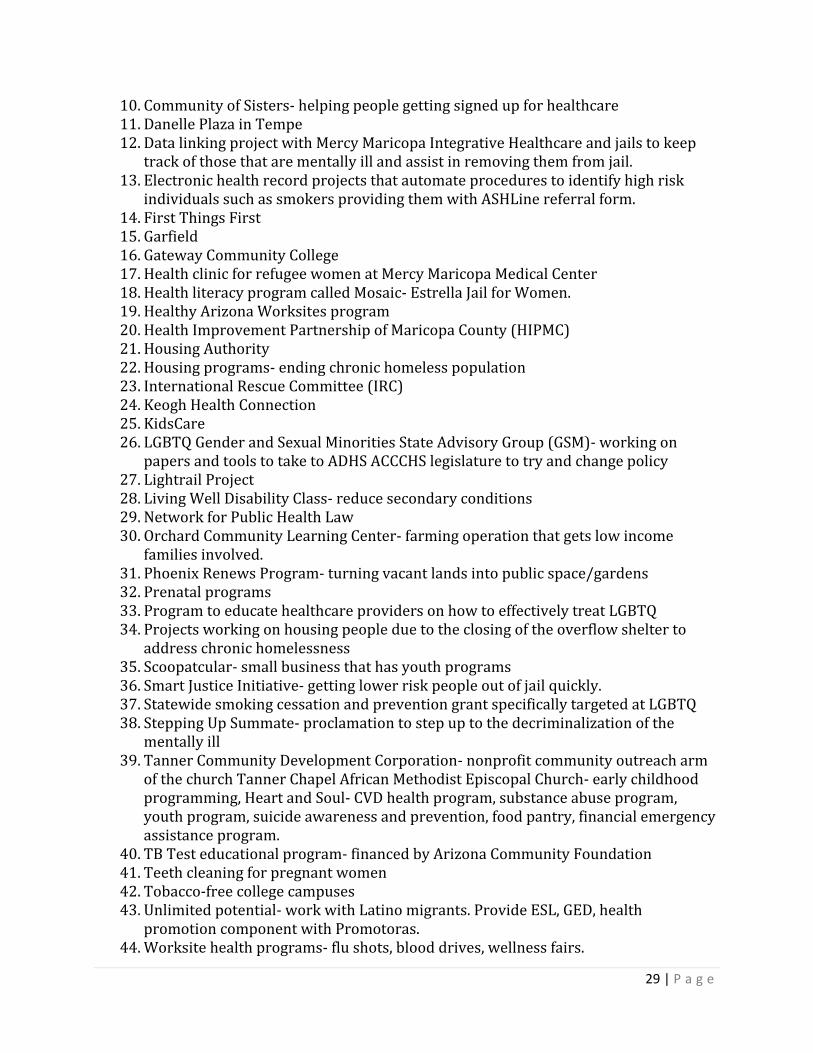
For question 12, respondents were asked about health-related projects that are being successfully implemented in their communities. A variety of responses were received. Often the name of the organization or program was mentioned, but with little to no description. Other times, only a description was provided; missing the name of program or organization. The following is a comprehensive list of all responses combined: Project and Programs in the Community:
1. Ability 360 Sports and Fitness Center 2. ACCCHS Freedom to WorkAgri Mountain Foundation- small nonprofit that provides
ex-criminals with jobs at community gardens to prevent them from reentering the criminal justice system
3. AHCCCS plan to “reach in” to establish continuity of care of those in justice system 4. Arizona National Guard suicide prevention program 5. Arizona TYPO- Trans Youth and Parent Organization 6. ASU School of Social Work working with state refugee coordinator formed the New
American Community- a consortium of refugee groups working together. 7. Benefits counseling program-help people find the right Medicare Health Plan 8. Breast cancer education program- work with MIHS and refugee women health clinic 9. Built environment and health impact assessments – transportation projects
29 | P a g e
10. Community of Sisters- helping people getting signed up for healthcare 11. Danelle Plaza in Tempe 12. Data linking project with Mercy Maricopa Integrative Healthcare and jails to keep
track of those that are mentally ill and assist in removing them from jail. 13. Electronic health record projects that automate procedures to identify high risk
individuals such as smokers providing them with ASHLine referral form. 14. First Things First 15. Garfield 16. Gateway Community College 17. Health clinic for refugee women at Mercy Maricopa Medical Center 18. Health literacy program called Mosaic- Estrella Jail for Women. 19. Healthy Arizona Worksites program 20. Health Improvement Partnership of Maricopa County (HIPMC) 21. Housing Authority 22. Housing programs- ending chronic homeless population 23. International Rescue Committee (IRC) 24. Keogh Health Connection 25. KidsCare 26. LGBTQ Gender and Sexual Minorities State Advisory Group (GSM)- working on
papers and tools to take to ADHS ACCCHS legislature to try and change policy 27. Lightrail Project 28. Living Well Disability Class- reduce secondary conditions 29. Network for Public Health Law 30. Orchard Community Learning Center- farming operation that gets low income
families involved. 31. Phoenix Renews Program- turning vacant lands into public space/gardens 32. Prenatal programs 33. Program to educate healthcare providers on how to effectively treat LGBTQ 34. Projects working on housing people due to the closing of the overflow shelter to
address chronic homelessness 35. Scoopatcular- small business that has youth programs 36. Smart Justice Initiative- getting lower risk people out of jail quickly. 37. Statewide smoking cessation and prevention grant specifically targeted at LGBTQ 38. Stepping Up Summate- proclamation to step up to the decriminalization of the
mentally ill 39. Tanner Community Development Corporation- nonprofit community outreach arm
of the church Tanner Chapel African Methodist Episcopal Church- early childhood programming, Heart and Soul- CVD health program, substance abuse program, youth program, suicide awareness and prevention, food pantry, financial emergency assistance program.
40. TB Test educational program- financed by Arizona Community Foundation 41. Teeth cleaning for pregnant women 42. Tobacco-free college campuses 43. Unlimited potential- work with Latino migrants. Provide ESL, GED, health
promotion component with Promotoras. 44. Worksite health programs- flu shots, blood drives, wellness fairs.

30 | P a g e
Next Steps
The findings from this report, along with the remaining community health assessments, will be utilized to pick community healthy priorities for 2018-2021. All data findings and results will be shared through the Maricopa Health Matters website, scheduled HIPMC meetings, traditional and social media outlets, public forums and community hearing sessions.

31 | P a g e
Appendix A: Informed Consent Form
32 | P a g e
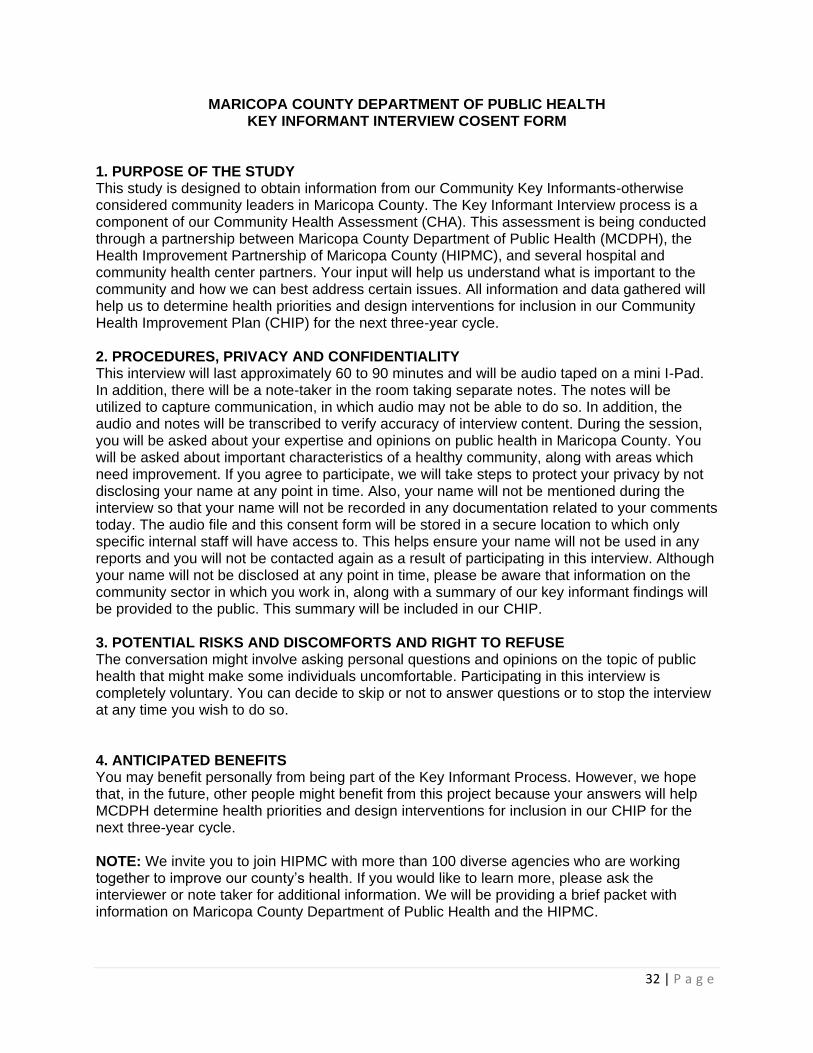
MARICOPA COUNTY DEPARTMENT OF PUBLIC HEALTH KEY INFORMANT INTERVIEW COSENT FORM
1. PURPOSE OF THE STUDY This study is designed to obtain information from our Community Key Informants-otherwise considered community leaders in Maricopa County. The Key Informant Interview process is a component of our Community Health Assessment (CHA). This assessment is being conducted through a partnership between Maricopa County Department of Public Health (MCDPH), the Health Improvement Partnership of Maricopa County (HIPMC), and several hospital and community health center partners. Your input will help us understand what is important to the community and how we can best address certain issues. All information and data gathered will help us to determine health priorities and design interventions for inclusion in our Community Health Improvement Plan (CHIP) for the next three-year cycle. 2. PROCEDURES, PRIVACY AND CONFIDENTIALITY This interview will last approximately 60 to 90 minutes and will be audio taped on a mini I-Pad. In addition, there will be a note-taker in the room taking separate notes. The notes will be utilized to capture communication, in which audio may not be able to do so. In addition, the audio and notes will be transcribed to verify accuracy of interview content. During the session, you will be asked about your expertise and opinions on public health in Maricopa County. You will be asked about important characteristics of a healthy community, along with areas which need improvement. If you agree to participate, we will take steps to protect your privacy by not disclosing your name at any point in time. Also, your name will not be mentioned during the interview so that your name will not be recorded in any documentation related to your comments today. The audio file and this consent form will be stored in a secure location to which only specific internal staff will have access to. This helps ensure your name will not be used in any reports and you will not be contacted again as a result of participating in this interview. Although your name will not be disclosed at any point in time, please be aware that information on the community sector in which you work in, along with a summary of our key informant findings will be provided to the public. This summary will be included in our CHIP. 3. POTENTIAL RISKS AND DISCOMFORTS AND RIGHT TO REFUSE The conversation might involve asking personal questions and opinions on the topic of public health that might make some individuals uncomfortable. Participating in this interview is completely voluntary. You can decide to skip or not to answer questions or to stop the interview at any time you wish to do so. 4. ANTICIPATED BENEFITS You may benefit personally from being part of the Key Informant Process. However, we hope that, in the future, other people might benefit from this project because your answers will help MCDPH determine health priorities and design interventions for inclusion in our CHIP for the next three-year cycle. NOTE: We invite you to join HIPMC with more than 100 diverse agencies who are working together to improve our county’s health. If you would like to learn more, please ask the interviewer or note taker for additional information. We will be providing a brief packet with information on Maricopa County Department of Public Health and the HIPMC.
33 | P a g e
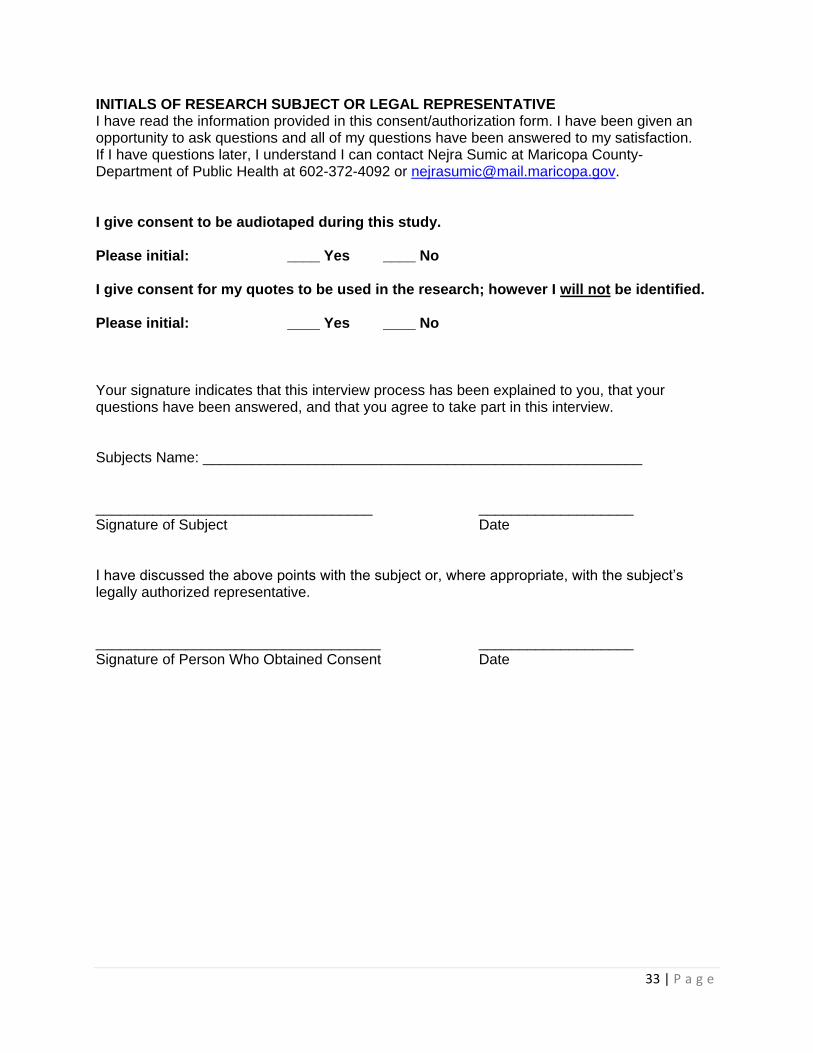
INITIALS OF RESEARCH SUBJECT OR LEGAL REPRESENTATIVE I have read the information provided in this consent/authorization form. I have been given an opportunity to ask questions and all of my questions have been answered to my satisfaction. If I have questions later, I understand I can contact Nejra Sumic at Maricopa County- Department of Public Health at 602-372-4092 or [email protected]. I give consent to be audiotaped during this study. Please initial: ____ Yes ____ No I give consent for my quotes to be used in the research; however I will not be identified. Please initial: ____ Yes ____ No Your signature indicates that this interview process has been explained to you, that your questions have been answered, and that you agree to take part in this interview. Subjects Name: ______________________________________________________ __________________________________ ___________________ Signature of Subject Date I have discussed the above points with the subject or, where appropriate, with the subject’s legally authorized representative. ___________________________________ ___________________ Signature of Person Who Obtained Consent Date
34 | P a g e
Appendix B: Key Informant Interview Questions
35 | P a g e
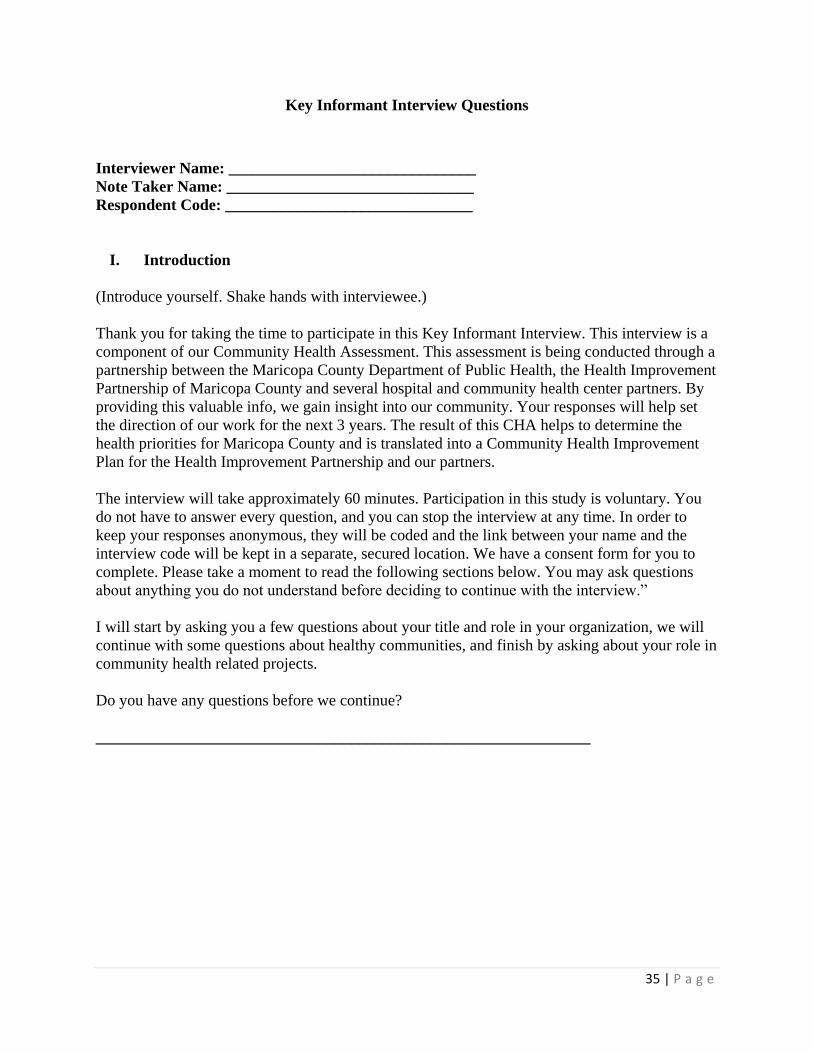
Key Informant Interview Questions
Interviewer Name: _______________________________
Note Taker Name: _______________________________
Respondent Code: _______________________________
I. Introduction
(Introduce yourself. Shake hands with interviewee.)
Thank you for taking the time to participate in this Key Informant Interview. This interview is a
component of our Community Health Assessment. This assessment is being conducted through a
partnership between the Maricopa County Department of Public Health, the Health Improvement
Partnership of Maricopa County and several hospital and community health center partners. By
providing this valuable info, we gain insight into our community. Your responses will help set
the direction of our work for the next 3 years. The result of this CHA helps to determine the
health priorities for Maricopa County and is translated into a Community Health Improvement
Plan for the Health Improvement Partnership and our partners.
The interview will take approximately 60 minutes. Participation in this study is voluntary. You
do not have to answer every question, and you can stop the interview at any time. In order to
keep your responses anonymous, they will be coded and the link between your name and the
interview code will be kept in a separate, secured location. We have a consent form for you to
complete. Please take a moment to read the following sections below. You may ask questions
about anything you do not understand before deciding to continue with the interview.”
I will start by asking you a few questions about your title and role in your organization, we will
continue with some questions about healthy communities, and finish by asking about your role in
community health related projects.
Do you have any questions before we continue?
______________________________________________________________
36 | P a g e
II. Interview Questions
1. What is your title or role in your organization?
2. Please describe the populations you serve in the community.
Before we move on to our next set of questions we would like to provide you with the World
Health Organization’s definition of health in order to provide context for questions 3-6.
WHO defines Health as a state of complete physical, mental and social well-being and not
merely the absence of disease or infirmity. Now with that definition in mind……
3. What does a healthy community mean to you?
4. What are the important characteristics of a healthy community?
5. How healthy are residents in your community and Maricopa County as a whole?
6. Who do you think is responsible for community health in Maricopa County?
7. What changes have you seen in your community over the past 5 years regarding
employment, health, crime, socioeconomic status, attitudes, and demographics?
8. What individuals, community organizations, or governmental entities do you feel are
influential in the community?
9. What strengths or resources are present in the community to build upon in improving quality
of life and well-being for residents?
10. What do you think are the main concerns of your community? Which of these do you think is
the most important?
11. Do you believe there are factors in your community that are keeping people from doing what
needs to be done to improve the health and quality of life?
12. Are there any health-related projects that are being successfully implemented in the
community? Are you involved in any of these projects, whether it is on a personal or
professional level?
Yes….. (Ask b)
No…… (Skip to c)
b. Can you elaborate on those projects?
c. Would you be interested in getting involved?
13. Is there anything else that you would like to add about the topics we discussed?
37 | P a g e
III. Demographic Information
14. What geographic area do you serve? (select all that apply)
☐All of Maricopa County ☐Central Valley ☐East Valley ☐All of Arizona
☐North Valley ☐South Valley ☐West Valley ☐Other:__________
15. What population(s) do you serve?
☐African American/Black ☐LGBTQ ☐Young Adults
☐American Indian/Native American ☐Older Adults/Seniors ☐Youth
☐Asian/Pacific Islander ☐People with disabilities ☐Other:__________
☐Children with special health care needs ☐Refugees ☐All of the above
☐Hispanic/Latino ☐Veterans
16. What age groups do you serve?
☐0-5 ☐6-11 ☐12-17 ☐18-24 ☐25-34 ☐All age groups
☐35-44 ☐45-54 ☐55-64 ☐65-74 ☐75+
17. What is your zip code? __________
18. Sex: ☐Male ☐Female ☐Other
19. Race/Ethnicity:
☐African American/Black ☐American Indian/Native American
☐Asian (please specify): ____________ ☐Pacific Islander (please specify):_________
☐Hispanic/Latino ☐White/Caucasian
☐Other:____________
20. What is your age group?
☐12-17 ☐18-24 ☐25-34 ☐35-44 ☐45-54
☐55-64 ☐65-74 ☐75+
21. Would you be interested in learning more about the Health Improvement Partnership of
Maricopa County (HIPMC)?
☐Yes ☐No ☐Already a Member

38 | P a g e
Appendix C: Working Together to Improve Health in Maricopa County
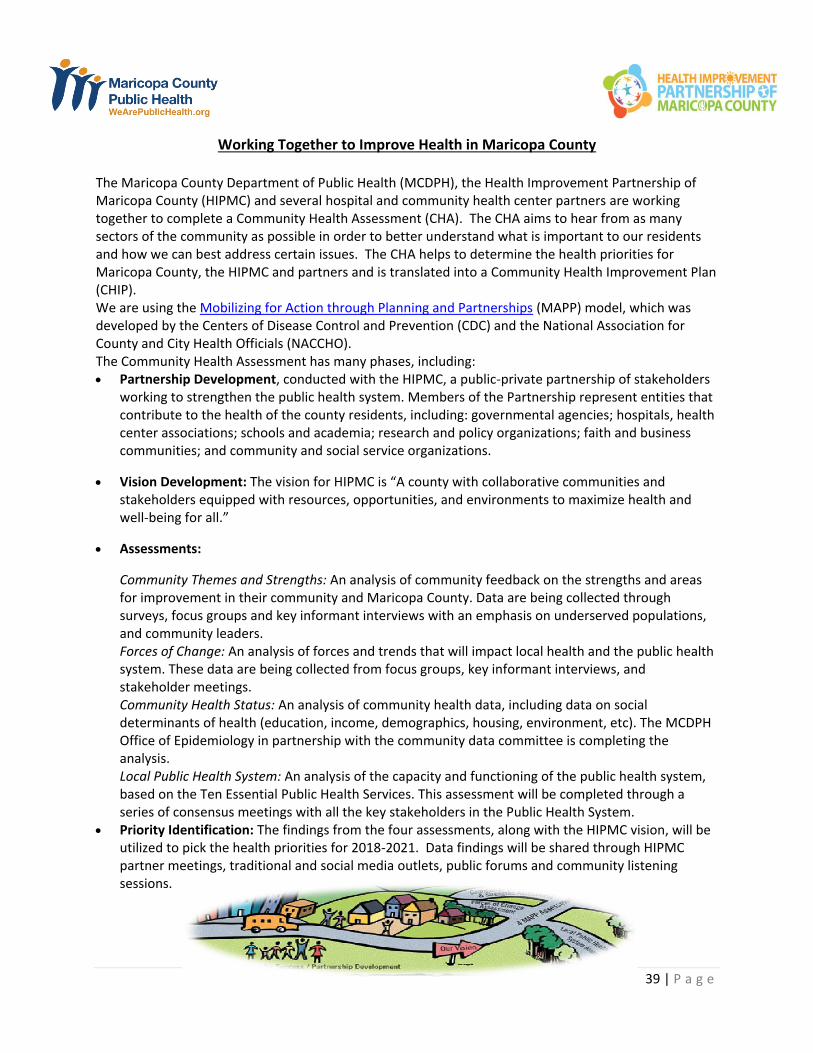
39 | P a g e
Working Together to Improve Health in Maricopa County
The Maricopa County Department of Public Health (MCDPH), the Health Improvement Partnership of Maricopa County (HIPMC) and several hospital and community health center partners are working together to complete a Community Health Assessment (CHA). The CHA aims to hear from as many sectors of the community as possible in order to better understand what is important to our residents and how we can best address certain issues. The CHA helps to determine the health priorities for Maricopa County, the HIPMC and partners and is translated into a Community Health Improvement Plan (CHIP). We are using the Mobilizing for Action through Planning and Partnerships (MAPP) model, which was developed by the Centers of Disease Control and Prevention (CDC) and the National Association for County and City Health Officials (NACCHO). The Community Health Assessment has many phases, including: Partnership Development, conducted with the HIPMC, a public-private partnership of stakeholders
working to strengthen the public health system. Members of the Partnership represent entities that contribute to the health of the county residents, including: governmental agencies; hospitals, health center associations; schools and academia; research and policy organizations; faith and business communities; and community and social service organizations.
Vision Development: The vision for HIPMC is “A county with collaborative communities and stakeholders equipped with resources, opportunities, and environments to maximize health and well-being for all.”
Assessments:
Community Themes and Strengths: An analysis of community feedback on the strengths and areas for improvement in their community and Maricopa County. Data are being collected through surveys, focus groups and key informant interviews with an emphasis on underserved populations, and community leaders. Forces of Change: An analysis of forces and trends that will impact local health and the public health system. These data are being collected from focus groups, key informant interviews, and stakeholder meetings. Community Health Status: An analysis of community health data, including data on social determinants of health (education, income, demographics, housing, environment, etc). The MCDPH Office of Epidemiology in partnership with the community data committee is completing the analysis. Local Public Health System: An analysis of the capacity and functioning of the public health system, based on the Ten Essential Public Health Services. This assessment will be completed through a series of consensus meetings with all the key stakeholders in the Public Health System.
Priority Identification: The findings from the four assessments, along with the HIPMC vision, will be utilized to pick the health priorities for 2018-2021. Data findings will be shared through HIPMC partner meetings, traditional and social media outlets, public forums and community listening sessions.

40 | P a g e

 • 8 focus groups (mothers, fathers, pregnant women, grandparents) • Key informant interviews of health care professionals (July](https://img.pdfslide.net/doc/110x75/611568f67a04143b8a755e8f/welcome-cdphe-march-2012-june-2012-a-8-focus-groups-mothers-fathers.jpg)


![[Final online] Governing Labour Standards · 2020-07-05 · core conventions] happen.” (Korean informant) “ Interviews with state, business and civil society stakeholders in the](https://img.pdfslide.net/doc/110x75/5f3723ea64ef426cdb7867e6/final-online-governing-labour-standards-2020-07-05-core-conventions-happena.jpg)