Embed Size (px)
Citation preview
Marine biology
AESOPS (Antarctic Environment Southern Ocean Process Study) Process I Study: Winter-spring transition
WALKER O. SMITH, JR., ANN-MAREE WHITE, SCOTT POLK, and SYLVIE MATHOT, Department of Ecology and Evolutionary Biology, University of Tennessee, Knoxville, Tennessee 37996
ESOPS (Antarctic Environment Southern Ocean ProcessStudy) is a multidisciplinary program designed to address
three broad objectives: to quantify the net flux of carbon dioxidebetween the ocean and atmosphere and its seasonal variability,to evaluate the factors that lead to phytoplankton blooms inboth the Ross Sea and the antarctic polar front, and to under-stand the controls on production and fate of biogenic materialin these regions. To complete these objectives, a series of four
process studies on the R/V Nathaniel B. Palmer were conductedon the Ross Sea continental shelf (as well as a benthic cruise).The cruises were completed during the winter-spring transi-tion, the spring bloom, summer conditions, and the autumn-winter transition. This article describes preliminary results fromthe first process study.
The Ross Sea polynya has been identified as the regionsupporting the southern oceans’ most spatially extensive and
A
ANTARCTIC JOURNAL – REVIEW 1997
79
Figure 1. Study site showing the location of the stations occupied throughout all AESOPS process studies.
ANTARCTIC JOURNAL – REVIEW 1997
80
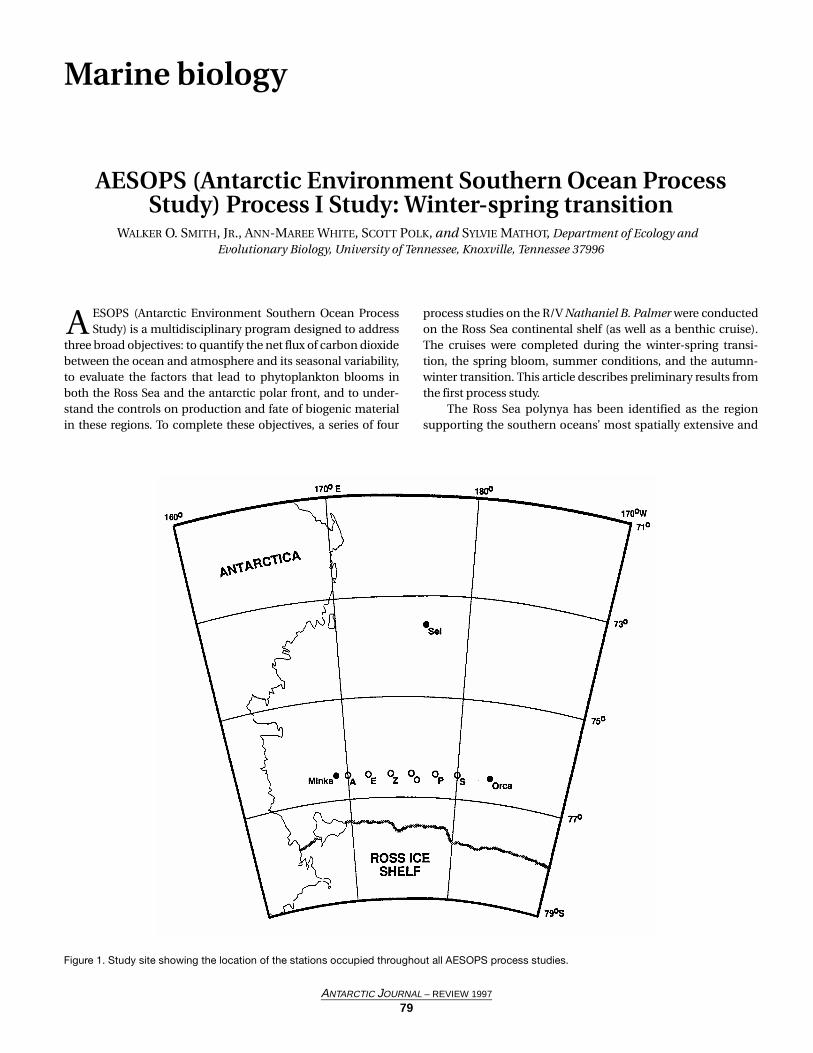
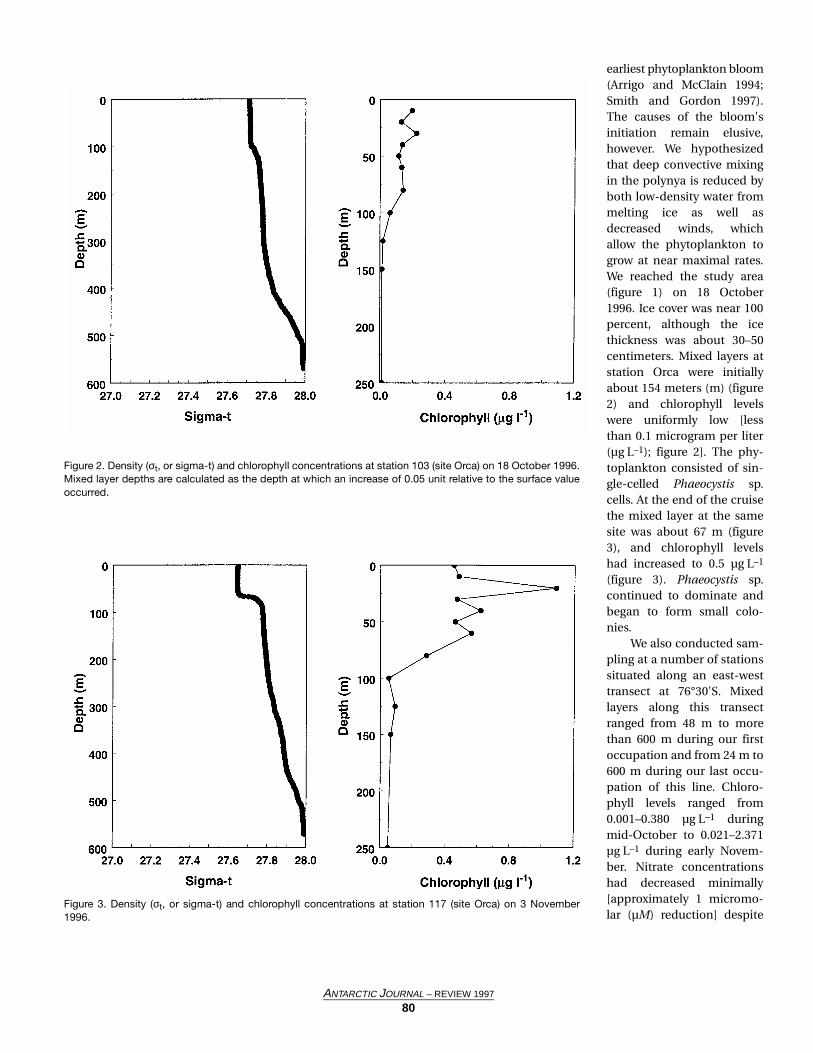
Figure 2. Density (σt, or sigma-t) and chlorophyll concentrations at station 103 (site Orca) on 18 October 1996.Mixed layer depths are calculated as the depth at which an increase of 0.05 unit relative to the surface valueoccurred.
Figure 3. Density (σt, or sigma-t) and chlorophyll concentrations at station 117 (site Orca) on 3 November1996.
earliest phytoplankton bloom(Arrigo and McClain 1994;Smith and Gordon 1997).The causes of the bloom'sinitiation remain elusive,however. We hypothesizedthat deep convective mixingin the polynya is reduced byboth low-density water frommelting ice as well asdecreased winds, whichallow the phytoplankton togrow at near maximal rates.We reached the study area(figure 1) on 18 October1996. Ice cover was near 100percent, although the icethickness was about 30–50centimeters. Mixed layers atstation Orca were initiallyabout 154 meters (m) (figure2) and chlorophyll levelswere uniformly low [lessthan 0.1 microgram per liter(µg L–1); figure 2]. The phy-toplankton consisted of sin-gle-celled Phaeocystis sp.cells. At the end of the cruisethe mixed layer at the samesite was about 67 m (figure3), and chlorophyll levelshad increased to 0.5 µg L–1
(figure 3). Phaeocystis sp.continued to dominate andbegan to form small colo-nies.
We also conducted sam-pling at a number of stationssituated along an east-westtransect at 76°30'S. Mixedlayers along this transectranged from 48 m to morethan 600 m during our firstoccupation and from 24 m to600 m during our last occu-pation of this line. Chloro-phyll levels ranged from0.001–0.380 µg L–1 duringmid-October to 0.021–2.371µg L–1 during early Novem-ber. Nitrate concentrationshad decreased minimally[approximately 1 micromo-lar (µM) reduction] despite
the fact that the photoperiod extended to 24 hours by 28 Octo-ber and maximal irradiances approached 2,000 micromolequanta per square meter per second on clear days. Winds weremodest for much of the time in the Ross Sea.
We believe that we observed the initiation of the seasonalphytoplankton bloom in the Ross Sea (chlorophyll concentra-tions exceeded more than 10 µg L–1 in December). Phy-toplankton growth appeared to be restricted by deep verticalmixing, which was driven by surface cooling and convectiveoverturn. As the mixed layer shoaled, the mean irradianceencountered by the phytoplankton assemblage increased(Nelson and Smith 1991). Given that the phytoplankton werenutrient saturated (with both macronutrients such as nitrateand micronutrients such as iron) during this period, and thatthe assemblages were adapted to extremely low photon fluxdensities (5 micromole quanta per square meter per second orless), phytoplankton growth began early in the year, under ice,and under extremely low irradiance conditions. Furthermore,
we believe that as maximum growth was attained, biomassincreased rapidly until growth became limited by trace metalsin late spring and early summer. A complete assessment of thetemporal changes of the controls of phytoplankton growthawaits the synthesis of all data from all process cruises.
This research was supported by National Science Founda-tion grant OPP 95-31990.
References
Arrigo, K.R., and C.R. McClain. 1994. Spring phytoplankton produc-tion in the western Ross Sea. Science, 266, 261–263.
Nelson, D.M., and W.O. Smith, Jr. 1991. Sverdrup revisited: Criticaldepths, maximum chlorophyll levels, and the control of southernocean productivity by the irradiance-mixing regime. Limnologyand Oceanography, 36(8), 1650–1661.
Smith, W.O., and L.I. Gordon. 1997. Hyperproductivity of the Ross Sea(Antarctica) polynya during austral spring. Geophysical ResearchLetters, 24, 233–236.
Bacterivory and herbivory play key roles in fate of Ross Sea production
DAVID A. CARON, Biology Department, Woods Hole Oceanographic Institution, Woods Hole, Massachusetts 02543DARCY J. LONSDALE, Marine Sciences Research Center, State University of New York at Stony Brook, Stony Brook, New York 11794-5000
MARK R. DENNETT, Biology Department, Woods Hole Oceanographic Institution, Woods Hole, Massachusetts 02543
he Ross Sea polynya is a site of an extensive, albeit sea-sonally restricted, phytoplankton bloom (Smith and Gor-
don 1997). It is also presently an active study site for theAntarctic Environment Southern Ocean Process Study(AESOPS), a research program within the U.S. Joint GlobalOcean Flux Study (JGOFS). A major goal of this initiative is tocharacterize the production and fate of primary productivityin this coastal ecosystem and the factors affecting these pro-cesses. Within the context of this multi-investigator JGOFSprogram, we have been examining the trophic activities ofherbivorous and bacterivorous microbial assemblages duringa series of four cruises spanning October 1996 to December1997.
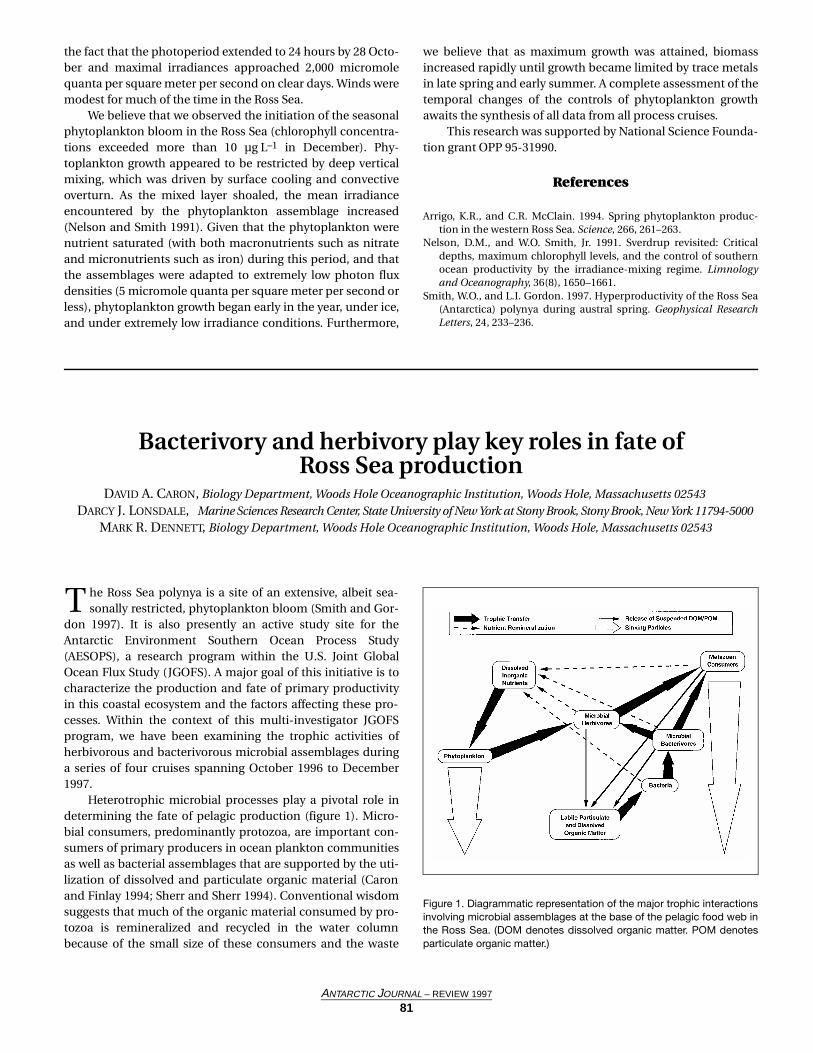
Heterotrophic microbial processes play a pivotal role indetermining the fate of pelagic production (figure 1). Micro-bial consumers, predominantly protozoa, are important con-sumers of primary producers in ocean plankton communitiesas well as bacterial assemblages that are supported by the uti-lization of dissolved and particulate organic material (Caronand Finlay 1994; Sherr and Sherr 1994). Conventional wisdomsuggests that much of the organic material consumed by pro-tozoa is remineralized and recycled in the water columnbecause of the small size of these consumers and the waste
T
Figure 1. Diagrammatic representation of the major trophic interactionsinvolving microbial assemblages at the base of the pelagic food web inthe Ross Sea. (DOM denotes dissolved organic matter. POM denotesparticulate organic matter.)
ANTARCTIC JOURNAL – REVIEW 1997
81
material that they release. In contrast, consumption by meta-zoa can result in the production of relatively large, rapidlysinking particles. Therefore, metazoan grazing may contributesignificantly to the removal of compounds of considerablebiogeochemical significance (e.g., carbon dioxide) from thewater column, whereas microbial grazing in surface watersmay promote the retention of these materials in the upperocean and atmosphere (Michaels and Silver 1988).
Relatively few investigators report the grazing activities ofprotozoa in antarctic ecosystems (Burkill, Edwards, and Sleigh1995; Archer et al. 1996; Froneman and Perissinotto 1996).Nevertheless, heterotrophic protists have been reported toconstitute a significant, and sometimes dominant, compo-nent of the total protistan abundance and biomass in thesouthern oceans, their coastal seas, and the sea-ice microbialcommunities associated with these water masses (Gowing andGarrison 1992; Stoecker, Buck, and Putt 1993). Quantificationof the rates of growth and trophic activity of these microbialconsumers is, therefore, imperative to understanding howthese food webs function.
Our component of the JGOFS process study is designed toobtain information on the abundances and trophic activity ofmicrobial assemblages within the water column of the RossSea proper, mostly along a transect line at 76°30'S 168°E to178°W (Anderson 1993). We have completed three cruises atthis time (October and November 1996; January and February1997; April and May 1997) with one remaining (November andDecember 1997) to provide seasonal coverage from australspring through fall. Our ongoing research program entails• characterization of the standing stocks of nanoplankton
and microplankton (photosynthetic and heterotrophicmicroorganisms 2–200 micrometers in size) by directmicroscopy (Kemp et al. 1993) and
• experimental investigations of the rates of herbivory andbacterivory by the microbial consumers within these sizeclasses using the dilution technique for estimating her-bivory (Landry, Kirshtein, and Constantinou 1995) and thedisappearance of fluorescently labeled bacteria (FLB) as anindicator of the activity of bacterivorous protozoa (Mar-rasé, Lim, and Caron 1992).
We observed standing
.
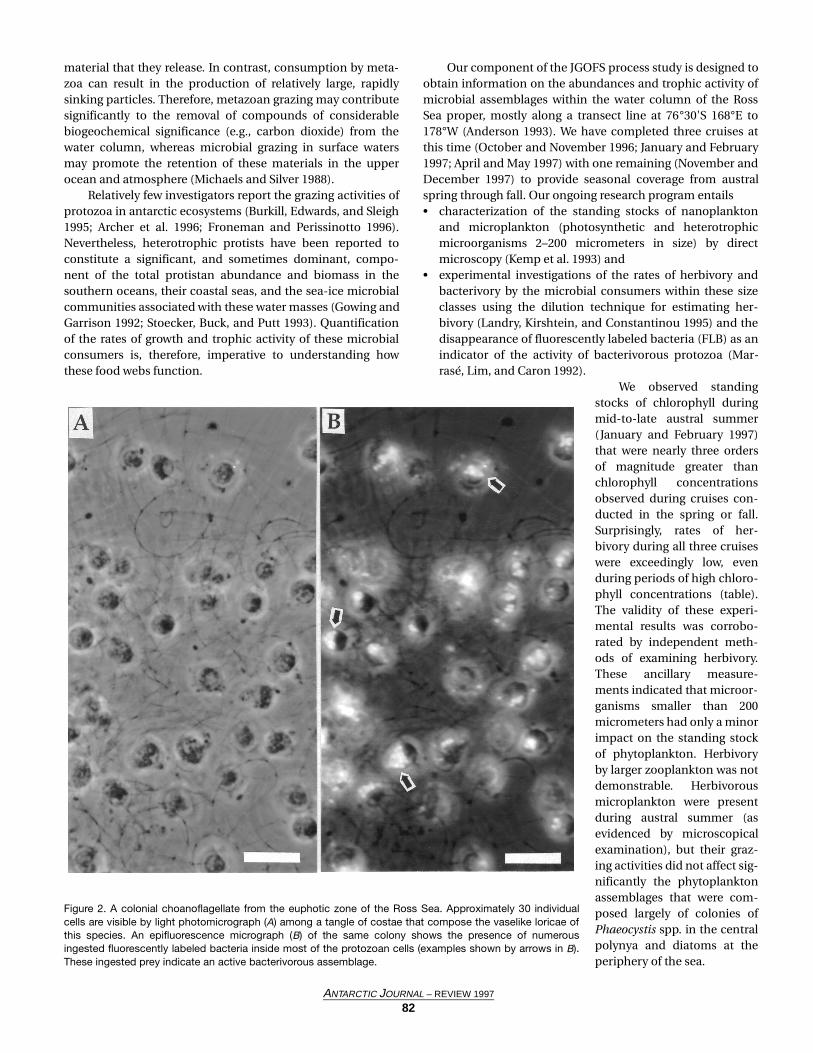
Figure 2. A colonial choanoflagellate from the euphotic zone of the Ross Sea. Approximately 30 individualcells are visible by light photomicrograph (A) among a tangle of costae that compose the vaselike loricae ofthis species. An epifluorescence micrograph (B) of the same colony shows the presence of numerousingested fluorescently labeled bacteria inside most of the protozoan cells (examples shown by arrows in B).These ingested prey indicate an active bacterivorous assemblage.
ANTARCTIC JOURNAL – REVIEW 1997
82
stocks of chlorophyll duringmid-to-late austral summer(January and February 1997)that were nearly three ordersof magnitude greater thanchlorophyll concentrationsobserved during cruises con-ducted in the spring or fall.Surprisingly, rates of her-bivory during all three cruiseswere exceedingly low, evenduring periods of high chloro-phyll concentrations (table).The validity of these experi-mental results was corrobo-rated by independent meth-ods of examining herbivory.These ancillary measure-ments indicated that microor-ganisms smaller than 200micrometers had only a minorimpact on the standing stockof phytoplankton. Herbivoryby larger zooplankton was notdemonstrable. Herbivorousmicroplankton were presentduring austral summer (asevidenced by microscopicalexamination), but their graz-ing activities did not affect sig-nificantly the phytoplanktonassemblages that were com-posed largely of colonies ofPhaeocystis spp. in the centralpolynya and diatoms at theperiphery of the sea.
Samples from bacterivory experiments are being analyzedat this time, but preliminary conclusions based on availabledata indicate that bacterivores were abundant and active dur-ing the period of the phytoplankton bloom and subsequentdecrease during the austral summer cruise. Up to 30 percentof the bacterial assemblages were removed daily by bacteri-vores at specific depths and locales during that cruise. Highabundances of colonial choanoflagellates in surface waters atthat time accounted for much of the grazing pressure on bac-teria (figure 2). Our preliminary analyses of microbial grazingduring the AESOPS cruises revealed the surprising finding thatmicrobial trophic activities did not result in high rates of mor-tality of phytoplankton even during periods of peak phy-toplankton biomass. We speculate that other processes (e.g.,sinking) must be responsible for the removal of much of thisprimary production. On the other hand, a bacterivorous pro-tozoan fauna was abundant and active during austral summer1997, and bacteria were consumed at significant rates in someof our experiments. We speculate that much of the energyentering the “microbial loop” in this coastal sea at that timemay be a consequence of release of dissolved organic materialby the abundant phytoplankton assemblage with subsequentuptake and growth by the heterotrophic bacterial assemblage.
This research is supported by National Science Founda-tion grant OPP 96-33703.
References
Anderson, R.F. 1993. U.S. Joint Global Ocean Flux Study. Southernocean process study science plan. Woods Hole, Massachusetts: U.S.JGOFS Planning and Coordination Office.
Archer, S.D., R.J.G. Leakey, P.H. Burkill, and M.A. Sleigh. 1996. Micro-bial dynamics in coastal waters of East Antarctica: Herbivory byheterotrophic dinoflagellates. Marine Ecology Progress Series, 139,239–255.
Burkill, P.H., E.S. Edwards, and M.A. Sleigh. 1995. Microzooplanktonand their role in controlling phytoplankton growth in the marginalice zone of the Bellingshausen Sea. Deep-Sea Research, 42, 1277–1290.
Caron, D.A., and B.J. Finlay. 1994. Protozoan links in food webs. In K.Hausmann and N. Hülsmann (Eds.), Progress in Protozoology, Pro-ceedings of the IX International Congress of Protozoology, Berlin1993. Stuttgart: Gustav Fischer Verlag.
Froneman, P., and R. Perissinotto. 1996. Microzooplankton grazing inthe southern ocean: Implications for the carbon cycle. Pubblicazi-oni della Stazione Zoologica di Napoli: Marine Ecology, 17, 99–115.
Gowing, M.M., and D.L. Garrison. 1992. Abundance and feeding ecol-ogy of larger protozooplankton in the ice edge zone of the Weddelland Scotia Seas during the austral winter. Deep-Sea Research, 39,893–919.
Kemp, P.F., B.F. Sherr, E.B. Sherr, and J.J. Cole. 1993. Handbook of meth-ods in aquatic microbial ecology. Boca Raton: Lewis.
Landry, M.R., J. Kirshtein, and J. Constantinou. 1995. A refined dilu-tion technique for measuring the community grazing impact ofmicrozooplankton, with experimental test in the central equatorialPacific. Marine Ecology Progress Series, 120, 53–63.
Marrasé, C., E.L. Lim, and D.A. Caron. 1992. Seasonal and dailychanges in bacterivory in a coastal plankton community. MarineEcology Progress Series, 82, 281–289.
Michaels, A.F., and M.W. Silver. 1988. Primary production, sinkingfluxes and the microbial food web. Deep-Sea Research, 35, 473–490.
Sherr, E.B., and B.F. Sherr. 1994. Bacterivory and herbivory: Key roles ofphagotrophic protists in pelagic food webs. Microbial Ecology, 28,223–235.
Smith, W.O., Jr., and L.I. Gordon. 1997. Hyperproductivity of the RossSea (Antarctica) polynya during austral spring. GeophysicalResearch Letters, 24, 233–236.
Stoecker, D.K., K.R. Buck, and M. Putt. 1993. Changes in the sea-icebrine community during the spring-summer transition, McMurdoSound, Antarctica. 2. Phagotrophic protists. Marine EcologyProgress Series, 95, 103–113.
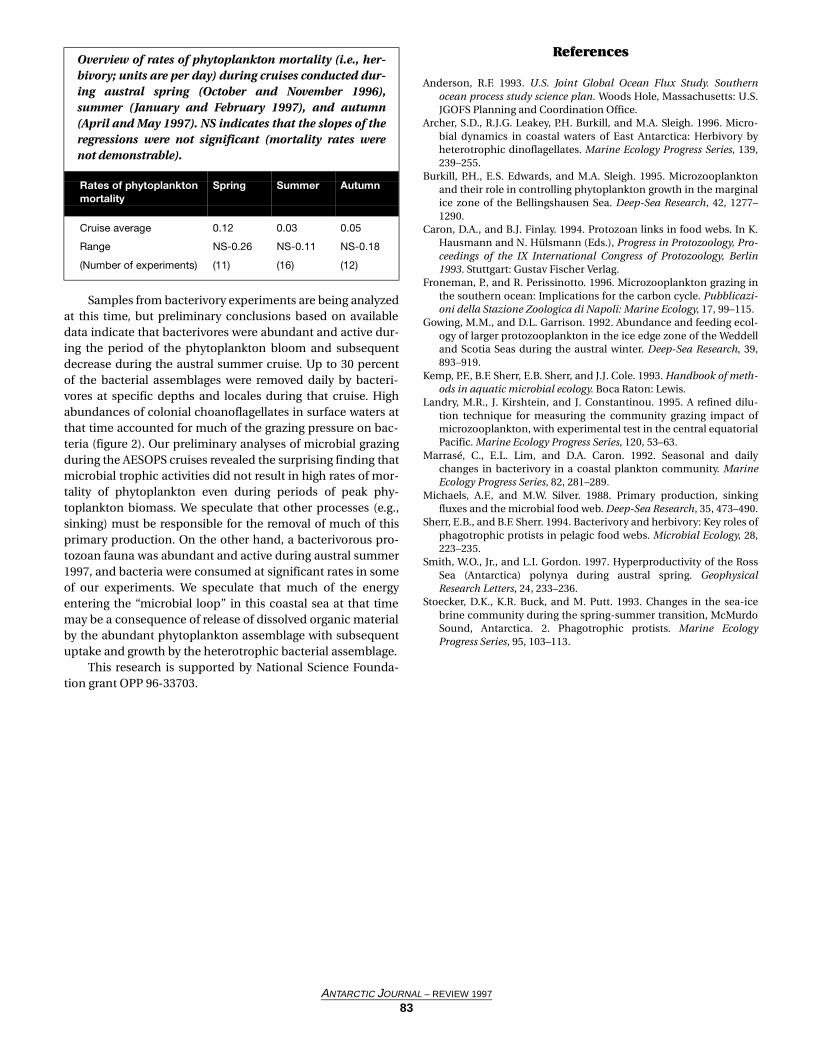
Overview of rates of phytoplankton mortality (i.e., her-bivory; units are per day) during cruises conducted dur-ing austral spring (October and November 1996),summer (January and February 1997), and autumn(April and May 1997). NS indicates that the slopes of theregressions were not significant (mortality rates werenot demonstrable).
Rates of phytoplanktonmortality
Spring Summer Autumn
Cruise average 0.12 0.03 0.05
Range NS-0.26 NS-0.11 NS-0.18
(Number of experiments) (11) (16) (12)
ANTARCTIC JOURNAL – REVIEW 1997
83
Quantitative estimation of the phlorotannin content of three antarctic brown macroalgae
CHARLES D. AMSLER, JAMES B. MCCLINTOCK, and DOMINIC TEDESCHI, Department of Biology, University of Alabama at Birmingham, Birmingham, Alabama 35294-1170
KENNETH H. DUNTON, Marine Science Institute, University of Texas at Austin, Port Aransas, Texas 78373BILL J. BAKER, Department of Chemistry, Florida Institute of Technology, Melbourne, Florida 32901
he diverse assemblage of macroalgae that occurs alongthe Antarctic Peninsula frequently dominates shallow
marine communities on hard substrates (e.g., Neushul 1965;Richardson 1979; Klöser et al. 1994). These plants form under-sea forests and often cover over 80 percent of the bottom withstanding biomass levels exceeding 8 kilograms per squaremeter. These levels of coverage are comparable to algal bio-mass levels in temperate kelp forests (cf. Amsler et al. 1995;Brouwer et al. 1995).
The majority of this standing biomass appears to enterthe detrital food chains (references in Amsler et al. 1995;Amsler, McClintock, and Baker in press). Iken (1994, 1995)tested the ability of several potential herbivores to consume anumber of antarctic macroalgae in aquarium studies anddemonstrated that macroalgae can constitute a significantproportion of the gut contents of such animals. However, thereis little evidence of herbivory in the field (references in Amsleret al. in press), and we are aware of no reports of substantialgrazing on antarctic macroalgae. Macroalgae have beenreported only rarely and, primarily, in small amounts in theguts of potential herbivores in the field (references in Amsleret al. in press). Therefore, even though macroalgae represent alarge potential food source that some animals are capable ofeating, few appear to do so. This raises the question, why is solittle of this potential resource consumed?
One way in which macroalgae defend themselves againstherbivory is by chemical means such as production andsequestration of metabolites that deter feeding (reviewed byHay and Fenical 1992; Paul 1992; Hay 1996). Recent researchhas revealed that chemical defenses are not uncommon inantarctic invertebrates (reviewed by McClintock and Baker1997). We have recently shown that thallus disks of the antarc-tic red macroalgae Iridaea cordata and Phyllophora antarcticawere rejected by the sea urchin Sterechinus neumayeri in aphagostimulation assay (Amsler et al. in press). This finding isconsistent with previous observations that although theurchins use these macroalgae for cover, they do not consumethem in significant quantities. Nonpolar and polar extracts ofboth macroalgal species were also strongly rejected by the ani-mals (Amsler et al. in press), indicating that the unpalatabilityof the intact plants is due, at least in part, to defensive chemis-try. This definitive evidence of chemical defenses against her-bivores in antarctic macroalgae is, to our knowledge, the first,but we believe that chemical defenses against herbivory arelikely to be much more common in antarctic macroalgae thanhave been recognized to date.
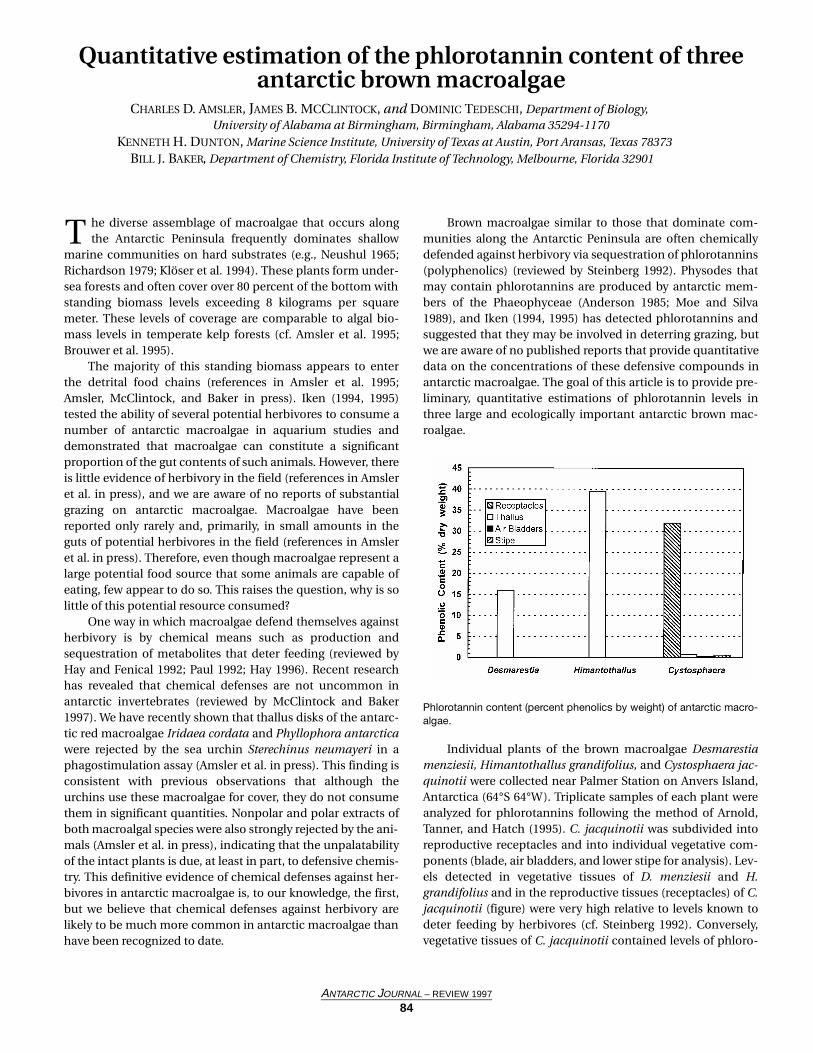
Brown macroalgae similar to those that dominate com-munities along the Antarctic Peninsula are often chemicallydefended against herbivory via sequestration of phlorotannins(polyphenolics) (reviewed by Steinberg 1992). Physodes thatmay contain phlorotannins are produced by antarctic mem-bers of the Phaeophyceae (Anderson 1985; Moe and Silva1989), and Iken (1994, 1995) has detected phlorotannins andsuggested that they may be involved in deterring grazing, butwe are aware of no published reports that provide quantitativedata on the concentrations of these defensive compounds inantarctic macroalgae. The goal of this article is to provide pre-liminary, quantitative estimations of phlorotannin levels inthree large and ecologically important antarctic brown mac-roalgae.
Individual plants of the brown macroalgae Desmarestiamenziesii, Himantothallus grandifolius, and Cystosphaera jac-quinotii were collected near Palmer Station on Anvers Island,Antarctica (64°S 64°W). Triplicate samples of each plant wereanalyzed for phlorotannins following the method of Arnold,Tanner, and Hatch (1995). C. jacquinotii was subdivided intoreproductive receptacles and into individual vegetative com-ponents (blade, air bladders, and lower stipe for analysis). Lev-els detected in vegetative tissues of D. menziesii and H.grandifolius and in the reproductive tissues (receptacles) of C.jacquinotii (figure) were very high relative to levels known todeter feeding by herbivores (cf. Steinberg 1992). Conversely,vegetative tissues of C. jacquinotii contained levels of phloro-
T
Phlorotannin content (percent phenolics by weight) of antarctic macro-algae.
ANTARCTIC JOURNAL – REVIEW 1997
84
tannins that were very low and that would be unlikely to pre-vent herbivory.
These results indicate that antarctic brown macroalgaeproduce phlorotannins at concentrations that would providedefense against a wide variety of herbivores in lower latitudecommunities (cf. Steinberg 1992). We postulate that the phlo-rotannins are likely to play this same role in antarctic brownmacroalgae. Our observation that C. jacquinotii differentiallyallocates phlorotannins to its stalked (and, therefore, veryexposed) reproductive structures (figure) is consistent withthe “optimal defense theory” of plant chemical defense(Rhoades 1979). This species appears to invest in defenses ofits vulnerable and, presumably, high energy content reproduc-tive structures even though it does not seem to defend its veg-etative tissues.
We are grateful to J. Heine for collections and to A. Boett-ger for assistance with German translations. This work wassupported by National Science Foundation grants OPP 95-30735 to James B. McClintock, OPP 95-26610 to Bill J. Baker,and OPP 94-21765 to Kenneth H. Dunton. Dominic Tedeschiwas a participant in the National Science Foundation’s “Teach-ers Experiencing the Antarctic/Arctic” program.
References
Amsler, C.D., J.B. McClintock, and B.J. Baker. In press. Chemicaldefense against herbivory in the antarctic marine macroalgae Iri-daea cordata and Phyllophora antarctica (Rhodophyceae). Journalof Phycology, 34(1).
Amsler, C.D., R.J. Rowley, D.R. Laur, L.B. Quetin, and R.M. Ross. 1995.Vertical distribution of antarctic peninsular macroalgae: Cover,biomass, and species composition. Phycologia, 34, 424–430.
Anderson, R.J. 1985. Morphological and taxonomic relationshipsamong branched, ligulate members of the genus Desmarestia(Phaeophyceae, Desmarestiales), with special reference to SouthAfrican D. frima. Canadian Journal of Botany, 63, 437–447.
Arnold, T.M., C.E. Tanner, and W.I. Hatch. 1995. Phenotypic variationin polyphenolic content of the tropical brown alga Lobophora var-
iegata as a function of nitrogen availability. Marine EcologyProgress Series, 123, 177–183.
Brouwer, P.E.M., E.F.M. Geilen, N.J.M. Gremmen, and F. van Lent.1995. Biomass, cover and zonation pattern of sublittoral macroal-gae at Signy Island, South Orkney Islands, Antarctica. BotanicaMarina, 38, 259–270.
Hay, M.E. 1996. Marine chemical ecology: What's known and what'snext? Journal of Experimental Marine Biology and Ecology, 200,103–134.
Hay, M.E., and W. Fenical. 1992. Chemical mediation of seaweed-her-bivore interactions. In V.M. John, S.J. Hawkins, and J.H. Price (Eds.),Plant-animal interactions in the marine benthos (Systematic Asso-ciation Special Vol. 46). Oxford, England: Clarendon Press.
Iken, K. 1994. Herbivore-algal trophic relationships in shallow watersof Potter Cove. Instituto Antartico Argentino, Contribución, 1994.No. 419. Structure and dynamics of coastal ecosystems at JubanyStation. Buenos Aires: Instituto Antartico Argentino. [In Spanish]
Iken, K. 1995. Food relations between antarctic macroalgae and herbi-vores. Berichte zur Polarforschung, 155, 21–23. [In German]
Klöser H., G. Mercuri, F. Laturnus, M.L. Quartino, and C. Wiencke.1994. On the competitive balance of macroalgae at Potter Cove(King George Island, South Shetlands). Polar Biology, 14, 11–16.
McClintock, J.B., and B.J. Baker. 1997. A review of the chemical ecologyof antarctic marine invertebrates. American Zoologist, 37, 329–342.
Moe, R.L., and P.C. Silva. 1989. Desmarestia antarctica (Desmares-tiales, Phaeophyceae), a new ligulate antarctic species with anendophytic gametophyte. Plant Systematics and Evolution, 164,273–283.
Neushul, M. 1965. Diving observation of sub-tidal antarctic marinevegetation. Botanica Marina, 8, 234–243.
Paul, V.J. 1992. Ecological roles of marine natural products. Ithaca, NewYork: Comstock Publishing Associates.
Rhoades, D. 1979. Evolution of plant chemical defenses against herbi-vores. In G.A. Rosenthal and D.H. Janzen (Eds.), Herbivores. NewYork: Academic Press.
Richardson, M.G. 1979. The distribution of antarctic marinemacro-algae related to depth and substrate. British Antarctic Sur-vey Bulletin, 49, 1–13.
Steinberg, P.D. 1992. Geographic variation in the interaction betweenmarine herbivores and brown algal secondary metabolites. In V.J.Paul (Ed.), Ecological roles of marine natural products. Ithaca, NewYork: Comstock Publishing Associates.
Detection of ultraviolet radiation induced DNA damage in microbial communities of the Gerlache Strait
W.H. JEFFREY, Center for Environmental Diagnostics and Bioremediation, University of West Florida, Pensacola, Florida 32514R.V. MILLER, Department of Microbiology, Oklahoma State University, Stillwater, Oklahoma 74078
D.L. MITCHELL, M.D. Anderson Cancer Center, Smithville, Texas 78957
here is now strong evidence that ultraviolet radiation(UVR) is increasing over certain locations on the Earth's
surface. Of primary concern has been the annual pattern ofozone depletion over Antarctica and the southern oceanswhere ozone levels have declined as much as 74 percent com-pared to pre–ozone-hole events. Reduction of ozone concen-
tration selectively limits stratospheric adsorption ofultraviolet-B (UV-B) radiation [280–320 nanometers (nm)],resulting in higher irradiance on the Earth's surface. As aresult, studies of the impact of natural UVR on marine micro-organisms have received much attention. The impact ofincreased UV-B due to ozone depletion on phytoplankton and
T
ANTARCTIC JOURNAL – REVIEW 1997
85
primary production has attracted extensive interest. Theeffects of UV-B on bacteria, in contrast, have been largely over-looked. It is apparent from previous studies in the southernocean and elsewhere that bacteria play a vital role in mineral-ization of nutrients and provide a trophic link to higher organ-isms. The objectives of our study have been to identify theeffects of UVR and ozone depletion on bacterioplankton in thesouthern ocean. Our approach has been to combine state-of-the-art molecular approaches with more traditional microbialecology methodologies. We have examined the extent of DNAdamage in bacterioplankton resulting from UVR and as afunction of ozone depletion with the ultimate goal of estimat-ing the effect of the stress on carbon fluxes through bacterialassemblages.
Cyclobutane pyrimidine dimers (CPDs) are one of theunique photoproducts created by UV-B and these DNA lesionsmay be identified using radioimmunoassays (Mitchell 1996). Ifthese photolesions are not repaired, they may affect bacterialDNA and mRNA synthesis resulting in gene mutations, alteredphysiological activities, or lethality. Because they are inducedby UV-B, quantification of these photoproducts is a directmeans by which UVR effects may be monitored.
Samples were collected during two research cruisesaboard the R/V Polar Duke in the Gerlache Strait (approxi-mately 64°20'S 62°00'W) between 12 October and 5 November1995 and 1 and 25 October 1996. By limiting the ship's travel,we also minimized variability in results due to changing watermasses while experiencing significant fluctuations in columnozone concentrations. Conditions were very different betweenthe two cruises. The 1995 cruise was characterized by veryheavy ice, whereas in 1996, ice was minimal at the beginningof the cruise but formed as the cruise progressed. Air tempera-tures were significantly colder in 1996, and the much heaviercloud cover and snow in 1996 reduced the quality of light com-pared to the 1995 cruise. Water temperatures were approxi-mately –1.5°C in 1996. In 1995, they averaged approximately–0.6°C. In contrast, production was much greater in 1966:microbial biomass was approximately an order of magnitudegreater than in 1995.
Our primary objectives were to determine the distributionof UV-B–induced DNA damage as a function of depth in thewater column, time of day (diel studies), and how these maychange as a function of ozone conditions and sea state (i.e.,surface-water mixing). Results from representative depth pro-files are presented herein. Depth profiles of damage weredetermined by collecting water at discrete depths at sunriseand again near sunset. The bacterioplankton fraction was sep-arated from the larger organisms and concentrated by filtra-tion onto 0.2-micrometer (µm) pore filters. DNA damage wasdetermined upon return to our laboratories (Jeffrey et al.1996). Potential damage with depth was estimated by deploy-ing DNA dosimeters (solutions of calf thymus DNA in quartztubes; Jeffrey et al. 1996) at discrete depths during sunlighthours. By comparing DNA damage collected from in situdosimeters with water column bacterioplankton depth sam-ples, we have been able to identify the role of mixing in distri-bution of UV-B effects.
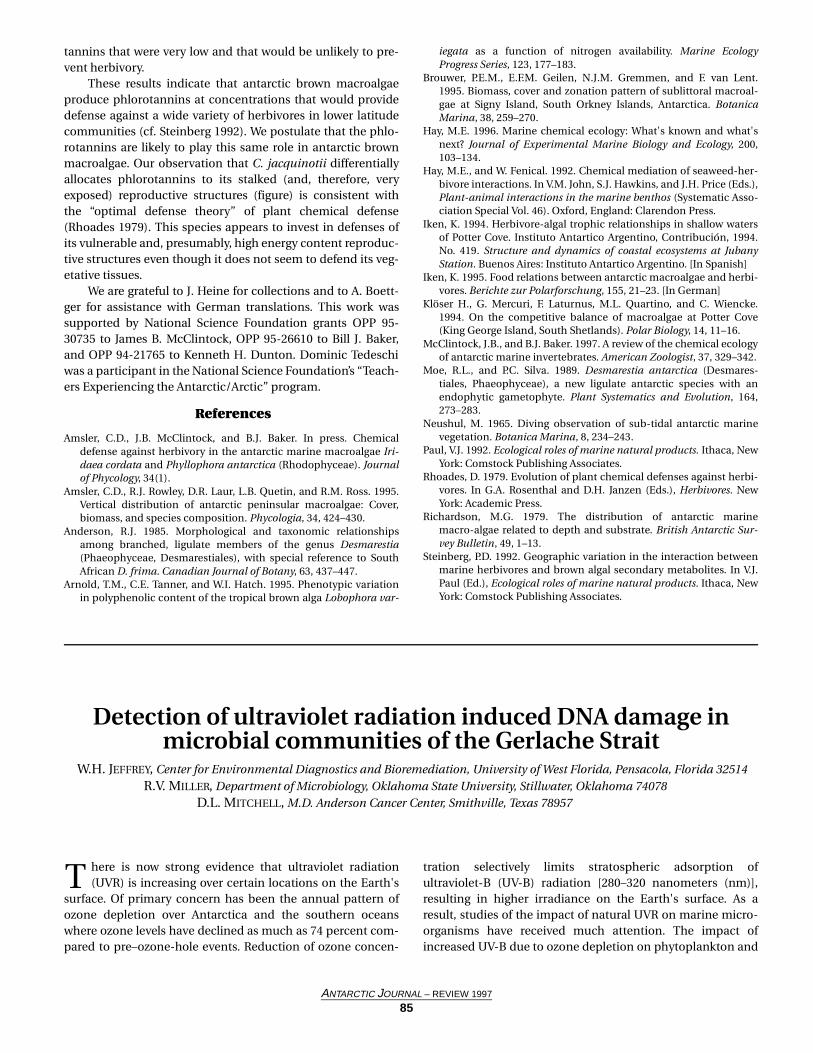
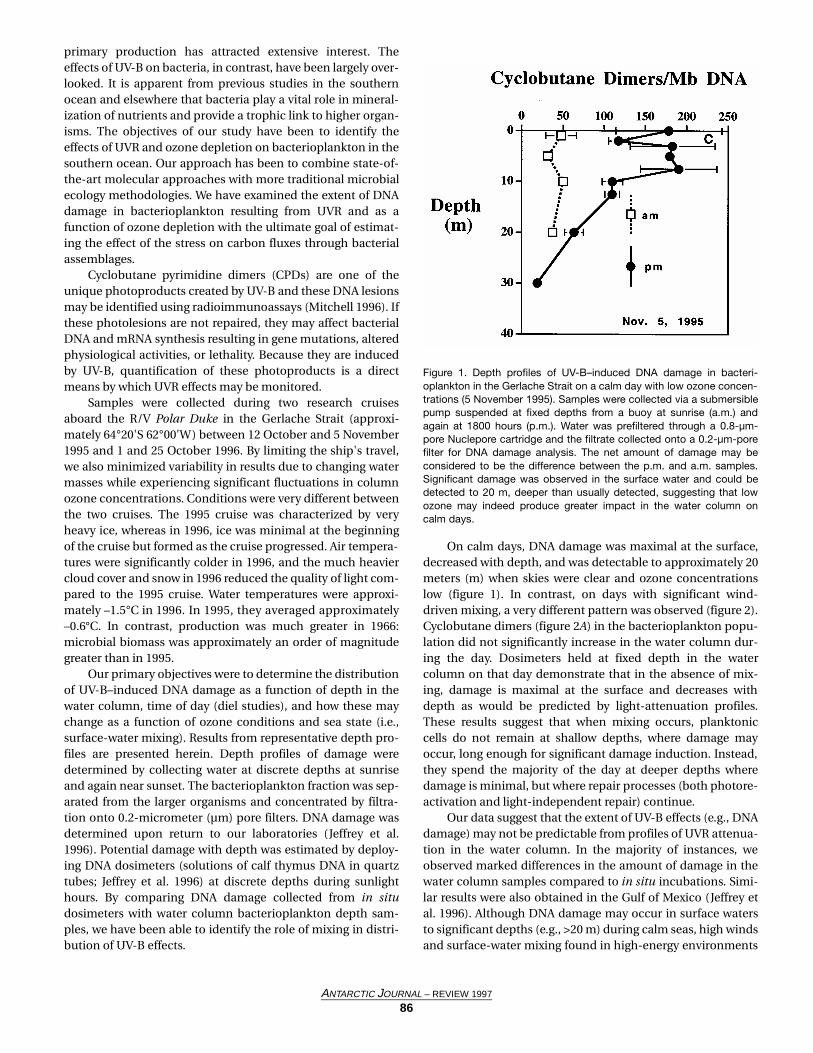
On calm days, DNA damage was maximal at the surface,decreased with depth, and was detectable to approximately 20meters (m) when skies were clear and ozone concentrationslow (figure 1). In contrast, on days with significant wind-driven mixing, a very different pattern was observed (figure 2).Cyclobutane dimers (figure 2A) in the bacterioplankton popu-lation did not significantly increase in the water column dur-ing the day. Dosimeters held at fixed depth in the watercolumn on that day demonstrate that in the absence of mix-ing, damage is maximal at the surface and decreases withdepth as would be predicted by light-attenuation profiles.These results suggest that when mixing occurs, planktoniccells do not remain at shallow depths, where damage mayoccur, long enough for significant damage induction. Instead,they spend the majority of the day at deeper depths wheredamage is minimal, but where repair processes (both photore-activation and light-independent repair) continue.
Our data suggest that the extent of UV-B effects (e.g., DNAdamage) may not be predictable from profiles of UVR attenua-tion in the water column. In the majority of instances, weobserved marked differences in the amount of damage in thewater column samples compared to in situ incubations. Simi-lar results were also obtained in the Gulf of Mexico (Jeffrey etal. 1996). Although DNA damage may occur in surface watersto significant depths (e.g., >20 m) during calm seas, high windsand surface-water mixing found in high-energy environments
Figure 1. Depth profiles of UV-B–induced DNA damage in bacteri-oplankton in the Gerlache Strait on a calm day with low ozone concen-trations (5 November 1995). Samples were collected via a submersiblepump suspended at fixed depths from a buoy at sunrise (a.m.) andagain at 1800 hours (p.m.). Water was prefiltered through a 0.8-µm-pore Nuclepore cartridge and the filtrate collected onto a 0.2-µm-porefilter for DNA damage analysis. The net amount of damage may beconsidered to be the difference between the p.m. and a.m. samples.Significant damage was observed in the surface water and could bedetected to 20 m, deeper than usually detected, suggesting that lowozone may indeed produce greater impact in the water column oncalm days.
ANTARCTIC JOURNAL – REVIEW 1997
86
Figure 2. Depth profiles of DNA damage on a day with moderate wind-driven mixing. Seas were approximately 0.5 m and wind speeds averaged3.6 meters per second during the day. (A) Depth profile of cyclobutane dimers in water column samples collected at sunrise (a.m.) and again at1800 (p.m.). On calm days, DNA damage will increase during the day with maximal damage at the surface and decrease with depth as seen in fig-ure 1. In contrast here, CPD damage actually decreases during the day. (B) Damage patterns in dosimeters held at fixed depths confirm thatpotential damage in the absence of mixing would occur as might be predicted from UV-B attenuation.
such as the southern oceans may result in reduced impact ofUVR. These results demonstrate the difficulty in predicting insitu UVR effects based on physical measurements. Further,although these effects have been observed for DNA damage inbacterioplankton, other reports have suggested that surface-water mixing may intensify the distribution of phytoplanktonproduction inhibition (Cullen et al. 1994). These results sug-gest that different trophic levels and processes may be affecteddifferently by changes in the physical environment, furthercomplicating predictive modeling of UVR effects.
This work was supported by National Science Foundationgrant number OPP 94-19037. We thank Peter Aas, MelissaBooth, Richard Coffin, Ross Downer, Sonya Holder, LeAnnaHutchinson, Cheryl Kelley, Maille Lyons, Erin McKee, Dean
Pakulski, and Steven Ripp for sample collection aboard the R/VPolar Duke cruises.
References
Cullen, J.J., P.J. Neale, R.F. Davis, and D.R.S. Lean. 1994. Ultravioletradiation, vertical mixing, and primary productivity in the Antarc-tic. EOS, Transactions of the American Geophysical Union, 75, 200.
Jeffrey, W.H., R.J. Pledger, P. Aas, S. Hager, R.B. Coffin, R. Von Haven,and D.L. Mitchell. 1996. Diel and depth profiles of DNA photodam-age in bacterioplankton exposed to ambient solar ultraviolet radia-tion. Marine Ecology Progress Series, 137, 293–304.
Mitchell, D.L. 1996. Radioimmunoassay of DNA damaged by ultravio-let light. In G. Pfeifer (Ed.), Technologies for detection of DNA dam-age and mutations. New York: Plenum Publishing.
ANTARCTIC JOURNAL – REVIEW 1997
87
Epipelagic communities in the northwestern Weddell Sea: Results from high-resolution trawl surveys
R.S. KAUFMANN* and K.L. SMITH, JR., Marine Biology Research Division, Scripps Institution of Oceanography,La Jolla, California 92093-0202
*Present address: Marine and Environmental Studies Program, University of San Diego, San Diego, California 92110
he southern ocean is one of the most productive areas ofthe marine environment, supporting an abundant and
diverse pelagic community (e.g., Lancraft, Torres, and Hopkins1991; Hopkins et al. 1993; Voronina, Kosobokova, and Pakho-mov 1994). One of the most important features structuringcommunities in this part of the ocean is the antarctic ice sheet,which covers up to 20 million square kilometers during theaustral winter but contracts during the summer to less than 4million square kilometers (Zwally et al. 1983; Laws 1985). Themagnitude of this seasonal variation, arguably the most dra-matic seasonal process in the ocean, may have substantialeffects on the biota inhabiting the underlying water column(Eicken 1992; Loeb et al. 1997; Nicol and Allison 1997). In par-ticular, the presence/absence of pack ice may substantiallyaffect the trophic coupling between surface predators (e.g.,seabirds, marine mammals) and their pelagic prey (Ainley etal. 1986). Until recently, little was known about the communityliving beneath seasonal sea ice in the southern ocean, due inpart to the logistic difficulty of sampling in areas covered bypack ice (cf. Kaufmann et al. 1995). As a result of these logisti-cal constraints, previous studies have been confined to briefperiods of time that had broad spatial coverage but poor tem-poral coverage and low temporal resolution.
As part of a study to sample the pelagic communitybeneath seasonal pack ice with high temporal resolution overa complete annual cycle, we conducted a series of trawls dur-ing September and October 1995 in an ice-covered area of thenorthwestern Weddell Sea near 63°S 46°W. The primary goal ofthis effort was to sample the epipelagic community with hightemporal resolution during a period when our study area wascovered by seasonal pack ice, for later comparison with sam-ples taken during seasons characterized by different degrees ofice coverage. Samples were collected using a multiple open-ing-closing trawl with six nets [MOCNESS, with a 10-square-meter mouth opening (Wiebe et al., 1985), 4-millimeter circu-lar mesh in the main body, and 505-micrometer (µm) meshcod ends]. Sampling periods lasted 1 hour and covered a 50-meter (m) deep portion of the epipelagic zone, defined here asthe region of the ocean between the surface and 100 m depth.Volumes of water sampled during the 1-hour sampling peri-ods ranged from 24,274 to 46,832 cubic meters.
The most abundant species collected with the MOCNESStrawl were the euphausiids Euphausia superba and Thysa-noessa macrura and the salp Salpa thompsoni. Also abundantwas the siphonophore Diphyes antarctica, and lesser numbersof hyperiid amphipods (Cyllopus lucasii, Hyperiella dilatata,
and Primno macropa), polychaetes (Vanadis antarctica andTomopteris carpenteri), pteropods (Clio sp.), and chaetognathswere collected as well. A noteworthy component of our collec-tions was a number of individuals of the pelagic medusa Per-iphylla periphylla. Although this species typically occurs atgreater depths (e.g., Lancraft et al. 1991), we collected fivemedusae in the epipelagic zone. The largest of these had afresh wet weight in excess of 4 kilograms, and all but one of theothers were larger than 2 kilograms, by far the most massiveorganisms collected in our nets.
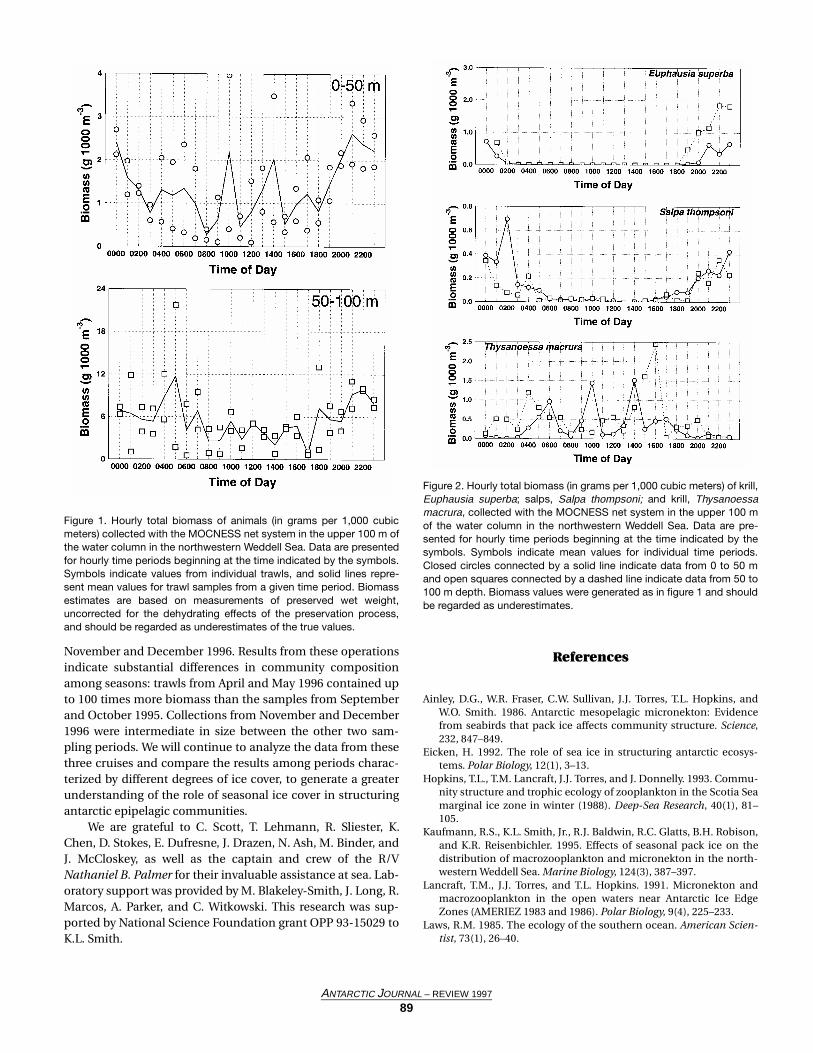
A temporal pattern in biomass was observed at this site;reduced values were recorded in the upper 50 m of the watercolumn between 0800 and 1800 hours and maximum valuesbetween 2100 and 0100 hours (figure 1). During the periodcovered by this study, sunrise occurred between 0430 and 0530hours (ship time) and sunset between 1700 and 1800 hours.The temporal pattern observed between the surface and 50 mdepth was less evident between 50 and 100 m depth; however,a slight elevation in biomass was observed 3–4 hours aftersunset (figure 1). It should be noted that trawl-based biomassfrom 0 to 50 m was consistently lower than between 50 and100 m (figure 1), possibly as a result of surface perturbationsdue to the passage of the ship ahead of the trawl.
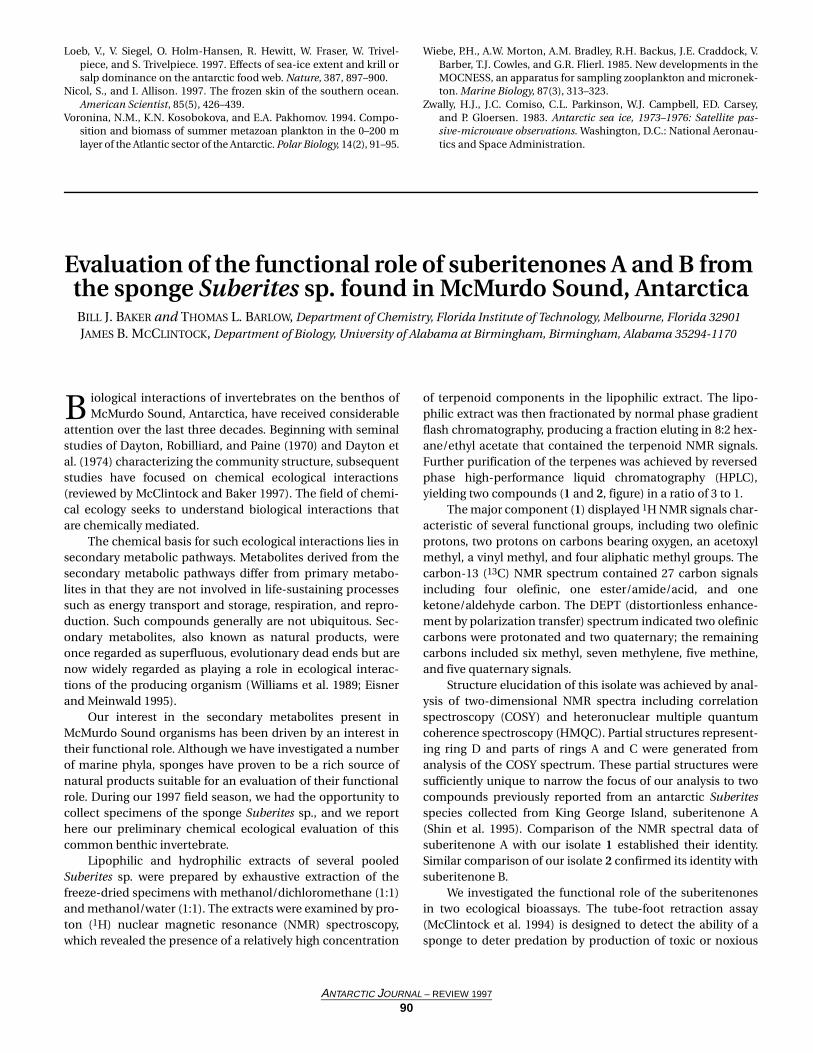
A portion of this temporal pattern may be explained bydiel variation in the depth distribution of the abundanteuphausiid Euphausia superba. Although virtually absentfrom surface waters during the day, substantial numbers of E.superba were collected in the epipelagic zone between 1800and 0200 hours (figure 2). A similar pattern was observed forSalpa thompsoni, although estimated salp biomass was sub-stantially lower than estimated krill biomass. Thysanoessamacrura exhibited an opposite pattern: elevated biomass insurface waters during the day and a reduced presence at night.Total biomass fluctuations were strongly influenced by T.macrura, as exemplified by the correspondence between totalbiomass (figure 1) and T. macrura biomass (figure 2) peaks at1000 and 1400 hours between the surface and 50 m depth.
Our data indicate that biomass distribution within theepipelagic zone in the presence of seasonal pack ice was influ-enced primarily by krill species, specifically Euphausiasuperba and Thysanoessa macrura. The results thus far agreewell with data collected to the northwest of our sampling site,near Elephant Island, that show a predominance of krill, com-pared to salps, during the austral spring and summer of 1995–1996 (Loeb et al. 1997). Our sampling program included trawlcollections in the same area during April and May 1996 and
T
ANTARCTIC JOURNAL – REVIEW 1997
88
November and December 1996. Results from these operationsindicate substantial differences in community compositionamong seasons: trawls from April and May 1996 contained upto 100 times more biomass than the samples from Septemberand October 1995. Collections from November and December1996 were intermediate in size between the other two sam-pling periods. We will continue to analyze the data from thesethree cruises and compare the results among periods charac-terized by different degrees of ice cover, to generate a greaterunderstanding of the role of seasonal ice cover in structuringantarctic epipelagic communities.
We are grateful to C. Scott, T. Lehmann, R. Sliester, K.Chen, D. Stokes, E. Dufresne, J. Drazen, N. Ash, M. Binder, andJ. McCloskey, as well as the captain and crew of the R/VNathaniel B. Palmer for their invaluable assistance at sea. Lab-oratory support was provided by M. Blakeley-Smith, J. Long, R.Marcos, A. Parker, and C. Witkowski. This research was sup-ported by National Science Foundation grant OPP 93-15029 toK.L. Smith.
References
Ainley, D.G., W.R. Fraser, C.W. Sullivan, J.J. Torres, T.L. Hopkins, andW.O. Smith. 1986. Antarctic mesopelagic micronekton: Evidencefrom seabirds that pack ice affects community structure. Science,232, 847–849.
Eicken, H. 1992. The role of sea ice in structuring antarctic ecosys-tems. Polar Biology, 12(1), 3–13.
Hopkins, T.L., T.M. Lancraft, J.J. Torres, and J. Donnelly. 1993. Commu-nity structure and trophic ecology of zooplankton in the Scotia Seamarginal ice zone in winter (1988). Deep-Sea Research, 40(1), 81–105.
Kaufmann, R.S., K.L. Smith, Jr., R.J. Baldwin, R.C. Glatts, B.H. Robison,and K.R. Reisenbichler. 1995. Effects of seasonal pack ice on thedistribution of macrozooplankton and micronekton in the north-western Weddell Sea. Marine Biology, 124(3), 387–397.
Lancraft, T.M., J.J. Torres, and T.L. Hopkins. 1991. Micronekton andmacrozooplankton in the open waters near Antarctic Ice EdgeZones (AMERIEZ 1983 and 1986). Polar Biology, 9(4), 225–233.
Laws, R.M. 1985. The ecology of the southern ocean. American Scien-tist, 73(1), 26–40.
Figure 1. Hourly total biomass of animals (in grams per 1,000 cubicmeters) collected with the MOCNESS net system in the upper 100 m ofthe water column in the northwestern Weddell Sea. Data are presentedfor hourly time periods beginning at the time indicated by the symbols.Symbols indicate values from individual trawls, and solid lines repre-sent mean values for trawl samples from a given time period. Biomassestimates are based on measurements of preserved wet weight,uncorrected for the dehydrating effects of the preservation process,and should be regarded as underestimates of the true values.
Figure 2. Hourly total biomass (in grams per 1,000 cubic meters) of krill,Euphausia superba; salps, Salpa thompsoni; and krill, Thysanoessamacrura, collected with the MOCNESS net system in the upper 100 mof the water column in the northwestern Weddell Sea. Data are pre-sented for hourly time periods beginning at the time indicated by thesymbols. Symbols indicate mean values for individual time periods.Closed circles connected by a solid line indicate data from 0 to 50 mand open squares connected by a dashed line indicate data from 50 to100 m depth. Biomass values were generated as in figure 1 and shouldbe regarded as underestimates.
ANTARCTIC JOURNAL – REVIEW 1997
89
Loeb, V., V. Siegel, O. Holm-Hansen, R. Hewitt, W. Fraser, W. Trivel-piece, and S. Trivelpiece. 1997. Effects of sea-ice extent and krill orsalp dominance on the antarctic food web. Nature, 387, 897–900.
Nicol, S., and I. Allison. 1997. The frozen skin of the southern ocean.American Scientist, 85(5), 426–439.
Voronina, N.M., K.N. Kosobokova, and E.A. Pakhomov. 1994. Compo-sition and biomass of summer metazoan plankton in the 0–200 mlayer of the Atlantic sector of the Antarctic. Polar Biology, 14(2), 91–95.
Wiebe, P.H., A.W. Morton, A.M. Bradley, R.H. Backus, J.E. Craddock, V.Barber, T.J. Cowles, and G.R. Flierl. 1985. New developments in theMOCNESS, an apparatus for sampling zooplankton and micronek-ton. Marine Biology, 87(3), 313–323.
Zwally, H.J., J.C. Comiso, C.L. Parkinson, W.J. Campbell, F.D. Carsey,and P. Gloersen. 1983. Antarctic sea ice, 1973–1976: Satellite pas-sive-microwave observations. Washington, D.C.: National Aeronau-tics and Space Administration.
Evaluation of the functional role of suberitenones A and B from the sponge Suberites sp. found in McMurdo Sound, AntarcticaBILL J. BAKER and THOMAS L. BARLOW, Department of Chemistry, Florida Institute of Technology, Melbourne, Florida 32901
JAMES B. MCCLINTOCK, Department of Biology, University of Alabama at Birmingham, Birmingham, Alabama 35294-1170
iological interactions of invertebrates on the benthos ofMcMurdo Sound, Antarctica, have received considerable
attention over the last three decades. Beginning with seminalstudies of Dayton, Robilliard, and Paine (1970) and Dayton etal. (1974) characterizing the community structure, subsequentstudies have focused on chemical ecological interactions(reviewed by McClintock and Baker 1997). The field of chemi-cal ecology seeks to understand biological interactions thatare chemically mediated.
The chemical basis for such ecological interactions lies insecondary metabolic pathways. Metabolites derived from thesecondary metabolic pathways differ from primary metabo-lites in that they are not involved in life-sustaining processessuch as energy transport and storage, respiration, and repro-duction. Such compounds generally are not ubiquitous. Sec-ondary metabolites, also known as natural products, wereonce regarded as superfluous, evolutionary dead ends but arenow widely regarded as playing a role in ecological interac-tions of the producing organism (Williams et al. 1989; Eisnerand Meinwald 1995).
Our interest in the secondary metabolites present inMcMurdo Sound organisms has been driven by an interest intheir functional role. Although we have investigated a numberof marine phyla, sponges have proven to be a rich source ofnatural products suitable for an evaluation of their functionalrole. During our 1997 field season, we had the opportunity tocollect specimens of the sponge Suberites sp., and we reporthere our preliminary chemical ecological evaluation of thiscommon benthic invertebrate.
Lipophilic and hydrophilic extracts of several pooledSuberites sp. were prepared by exhaustive extraction of thefreeze-dried specimens with methanol/dichloromethane (1:1)and methanol/water (1:1). The extracts were examined by pro-ton (1H) nuclear magnetic resonance (NMR) spectroscopy,which revealed the presence of a relatively high concentration
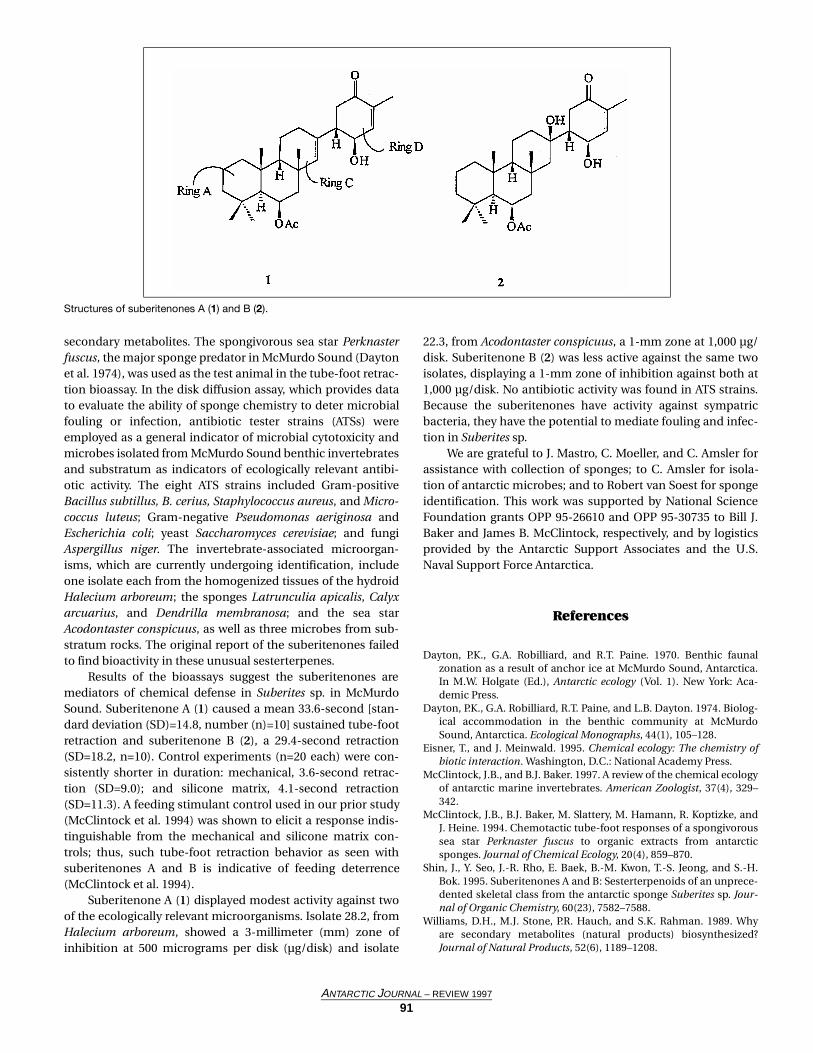
of terpenoid components in the lipophilic extract. The lipo-philic extract was then fractionated by normal phase gradientflash chromatography, producing a fraction eluting in 8:2 hex-ane/ethyl acetate that contained the terpenoid NMR signals.Further purification of the terpenes was achieved by reversedphase high-performance liquid chromatography (HPLC),yielding two compounds (1 and 2, figure) in a ratio of 3 to 1.
The major component (1) displayed 1H NMR signals char-acteristic of several functional groups, including two olefinicprotons, two protons on carbons bearing oxygen, an acetoxylmethyl, a vinyl methyl, and four aliphatic methyl groups. Thecarbon-13 (13C) NMR spectrum contained 27 carbon signalsincluding four olefinic, one ester/amide/acid, and oneketone/aldehyde carbon. The DEPT (distortionless enhance-ment by polarization transfer) spectrum indicated two olefiniccarbons were protonated and two quaternary; the remainingcarbons included six methyl, seven methylene, five methine,and five quaternary signals.
Structure elucidation of this isolate was achieved by anal-ysis of two-dimensional NMR spectra including correlationspectroscopy (COSY) and heteronuclear multiple quantumcoherence spectroscopy (HMQC). Partial structures represent-ing ring D and parts of rings A and C were generated fromanalysis of the COSY spectrum. These partial structures weresufficiently unique to narrow the focus of our analysis to twocompounds previously reported from an antarctic Suberitesspecies collected from King George Island, suberitenone A(Shin et al. 1995). Comparison of the NMR spectral data ofsuberitenone A with our isolate 1 established their identity.Similar comparison of our isolate 2 confirmed its identity withsuberitenone B..
We investigated the functional role of the suberitenonesin two ecological bioassays. The tube-foot retraction assay(McClintock et al. 1994) is designed to detect the ability of asponge to deter predation by production of toxic or noxious
B
ANTARCTIC JOURNAL – REVIEW 1997
90
secondary metabolites. The spongivorous sea star Perknasterfuscus, the major sponge predator in McMurdo Sound (Daytonet al. 1974), was used as the test animal in the tube-foot retrac-tion bioassay. In the disk diffusion assay, which provides datato evaluate the ability of sponge chemistry to deter microbialfouling or infection, antibiotic tester strains (ATSs) wereemployed as a general indicator of microbial cytotoxicity andmicrobes isolated from McMurdo Sound benthic invertebratesand substratum as indicators of ecologically relevant antibi-otic activity. The eight ATS strains included Gram-positiveBacillus subtillus, B. cerius, Staphylococcus aureus, and Micro-coccus luteus; Gram-negative Pseudomonas aeriginosa andEscherichia coli; yeast Saccharomyces cerevisiae; and fungiAspergillus niger. The invertebrate-associated microorgan-isms, which are currently undergoing identification, includeone isolate each from the homogenized tissues of the hydroidHalecium arboreum; the sponges Latrunculia apicalis, Calyxarcuarius, and Dendrilla membranosa; and the sea starAcodontaster conspicuus, as well as three microbes from sub-stratum rocks. The original report of the suberitenones failedto find bioactivity in these unusual sesterterpenes.
Results of the bioassays suggest the suberitenones aremediators of chemical defense in Suberites sp. in McMurdoSound. Suberitenone A (1) caused a mean 33.6-second [stan-dard deviation (SD)=14.8, number (n)=10] sustained tube-footretraction and suberitenone B (2), a 29.4-second retraction(SD=18.2, n=10). Control experiments (n=20 each) were con-sistently shorter in duration: mechanical, 3.6-second retrac-tion (SD=9.0); and silicone matrix, 4.1-second retraction(SD=11.3). A feeding stimulant control used in our prior study(McClintock et al. 1994) was shown to elicit a response indis-tinguishable from the mechanical and silicone matrix con-trols; thus, such tube-foot retraction behavior as seen withsuberitenones A and B is indicative of feeding deterrence(McClintock et al. 1994).
Suberitenone A (1) displayed modest activity against twoof the ecologically relevant microorganisms. Isolate 28.2, fromHalecium arboreum, showed a 3-millimeter (mm) zone ofinhibition at 500 micrograms per disk (µg/disk) and isolate
22.3, from Acodontaster conspicuus, a 1-mm zone at 1,000 µg/disk. Suberitenone B (2) was less active against the same twoisolates, displaying a 1-mm zone of inhibition against both at1,000 µg/disk. No antibiotic activity was found in ATS strains.Because the suberitenones have activity against sympatricbacteria, they have the potential to mediate fouling and infec-tion in Suberites sp.
We are grateful to J. Mastro, C. Moeller, and C. Amsler forassistance with collection of sponges; to C. Amsler for isola-tion of antarctic microbes; and to Robert van Soest for spongeidentification. This work was supported by National ScienceFoundation grants OPP 95-26610 and OPP 95-30735 to Bill J.Baker and James B. McClintock, respectively, and by logisticsprovided by the Antarctic Support Associates and the U.S.Naval Support Force Antarctica.
References
Dayton, P.K., G.A. Robilliard, and R.T. Paine. 1970. Benthic faunalzonation as a result of anchor ice at McMurdo Sound, Antarctica.In M.W. Holgate (Ed.), Antarctic ecology (Vol. 1). New York: Aca-demic Press.
Dayton, P.K., G.A. Robilliard, R.T. Paine, and L.B. Dayton. 1974. Biolog-ical accommodation in the benthic community at McMurdoSound, Antarctica. Ecological Monographs, 44(1), 105–128.
Eisner, T., and J. Meinwald. 1995. Chemical ecology: The chemistry ofbiotic interaction. Washington, D.C.: National Academy Press.
McClintock, J.B., and B.J. Baker. 1997. A review of the chemical ecologyof antarctic marine invertebrates. American Zoologist, 37(4), 329–342.
McClintock, J.B., B.J. Baker, M. Slattery, M. Hamann, R. Koptizke, andJ. Heine. 1994. Chemotactic tube-foot responses of a spongivoroussea star Perknaster fuscus to organic extracts from antarcticsponges. Journal of Chemical Ecology, 20(4), 859–870.
Shin, J., Y. Seo, J.-R. Rho, E. Baek, B.-M. Kwon, T.-S. Jeong, and S.-H.Bok. 1995. Suberitenones A and B: Sesterterpenoids of an unprece-dented skeletal class from the antarctic sponge Suberites sp. Jour-nal of Organic Chemistry, 60(23), 7582–7588.
Williams, D.H., M.J. Stone, P.R. Hauch, and S.K. Rahman. 1989. Whyare secondary metabolites (natural products) biosynthesized?Journal of Natural Products, 52(6), 1189–1208.
Structures of suberitenones A (1) and B (2).
ANTARCTIC JOURNAL – REVIEW 1997
91
Effects of feeding conditions on sodium pump (Na+,K+-ATPase) activity during larval development of the antarctic sea urchin
Sterechinus neumayeri PATRICK K.K. LEONG and DONAL T. MANAHAN, Department of Biological Sciences, University of Southern California,
Los Angeles,California 90089-0371
he seawater of McMurdo Sound is characterized by lowand constant temperatures and by high seasonal fluctua-
tions in the availability of phytoplankton food sources. The seaurchin Sterechinus neumayeri, which is widely distributed andabundant in McMurdo Sound, has feeding larval forms thathave to survive for long periods (weeks to months) in thewater column in the near absence of algal foods. The lifespanof these larval forms without food is set by their maternallyendowed energy reserves and their rate of utilization of thesereserves (i.e., their metabolic rate) (Shilling and Manahan1994). The aim of this study is to understand the major bio-chemical processes that establish the metabolic rates for theselarval forms. In particular, we have focused on the role of thesodium pump (Na+,K+-ATPase). This enzyme is an importanttransmembrane protein responsible for maintaining ion gra-dients in animal cells. Previously, we have shown that thephysiological activity of this single enzyme could account forover 40 percent of the metabolic rate of larvae of temperatespecies of sea urchin (Leong and Manahan 1997). In this study,we quantify the changes in activity of the sodium pump dur-ing development of the antarctic sea urchin S. neumayeri. Inaddition, we present the developmental changes in the activ-ity of Na+,K+-ATPase for fed and starved larvae.
Adult sea urchins were collected from McMurdo Sound(off Cape Evans) by scuba divers in October 1996. Males andfemales were induced to spawn by standard methods (injec-tion of 0.5 molar potassium chloride) and fertilized eggs wereplaced in 200-liter culture vessels at a concentration of 7 permilliliter. All subsequent culturing over a 2-month period wasdone using ambient seawater from McMurdo Sound (–1.5°C)that had been passed through a 0.2-micrometer pore-size fil-ter prior to use. The culture water was changed every 3 to 4days by gently sieving the animals onto mesh screens. Underthese rearing conditions, the embryos developed to the firstlarval feeding stage (early pluteus) after 22 days. Once thefeeding larval stage was reached, two experimental treatmentswere set up for which larvae were either• fed ad libitum on a mixture of algal cells (Rhodomonas sp.
and Dunaliella tertiolecta, each at a concentration of 7,500cells per milliliter of culture water) or
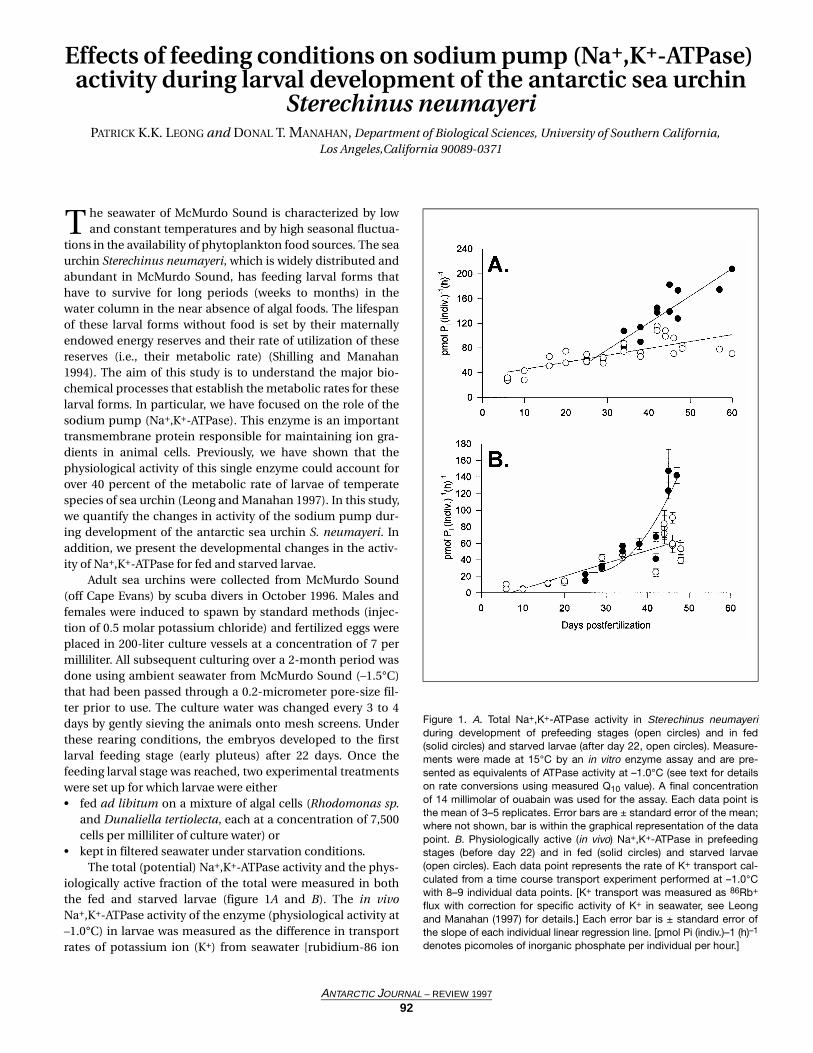
• kept in filtered seawater under starvation conditions.The total (potential) Na+,K+-ATPase activity and the phys-
iologically active fraction of the total were measured in boththe fed and starved larvae (figure 1A and B). The in vivoNa+,K+-ATPase activity of the enzyme (physiological activity at–1.0°C) in larvae was measured as the difference in transportrates of potassium ion (K+) from seawater [rubidium-86 ion
T
Figure 1. A. Total Na+,K+-ATPase activity in Sterechinus neumayeriduring development of prefeeding stages (open circles) and in fed(solid circles) and starved larvae (after day 22, open circles). Measure-ments were made at 15°C by an in vitro enzyme assay and are pre-sented as equivalents of ATPase activity at –1.0°C (see text for detailson rate conversions using measured Q10 value). A final concentrationof 14 millimolar of ouabain was used for the assay. Each data point isthe mean of 3–5 replicates. Error bars are ± standard error of the mean;where not shown, bar is within the graphical representation of the datapoint. B. Physiologically active (in vivo) Na+,K+-ATPase in prefeedingstages (before day 22) and in fed (solid circles) and starved larvae(open circles). Each data point represents the rate of K+ transport cal-culated from a time course transport experiment performed at –1.0°Cwith 8–9 individual data points. [K+ transport was measured as 86Rb+
flux with correction for specific activity of K+ in seawater, see Leongand Manahan (1997) for details.] Each error bar is ± standard error ofthe slope of each individual linear regression line. [pmol Pi (indiv.)–1 (h)–1
denotes picomoles of inorganic phosphate per individual per hour.]
ANTARCTIC JOURNAL – REVIEW 1997
92
.
(86Rb+) used as a radiotracer] in the presence and absence ofouabain, a specific inhibitor of Na+,K+-ATPase. The totalNa+,K+-ATPase activity was measured in vitro using tissuehomogenates of larvae (with and without ouabain). Themethod of Esmann (1988) was used for the in vitro measure-ments, where the rate of release by Na+,K+-ATPase of inorganicphosphate (Pi) from ATP was measured. All in vitro assayswere conducted at 15°C. The activities so obtained were con-verted to their corresponding values at physiological tempera-ture (–1.0°C) using a Q10 of 2.9. This value was previouslydetermined for the effect of temperature on the activity ofNa+,K+-ATPase in S. neumayeri (data not shown). The proteincontents of prefeeding stages and of fed and starved larvaewere determined using a modified Bradford method (Leongand Manahan 1997) to allow for calculations of developmentalchanges in the protein-specific activity of the enzyme.
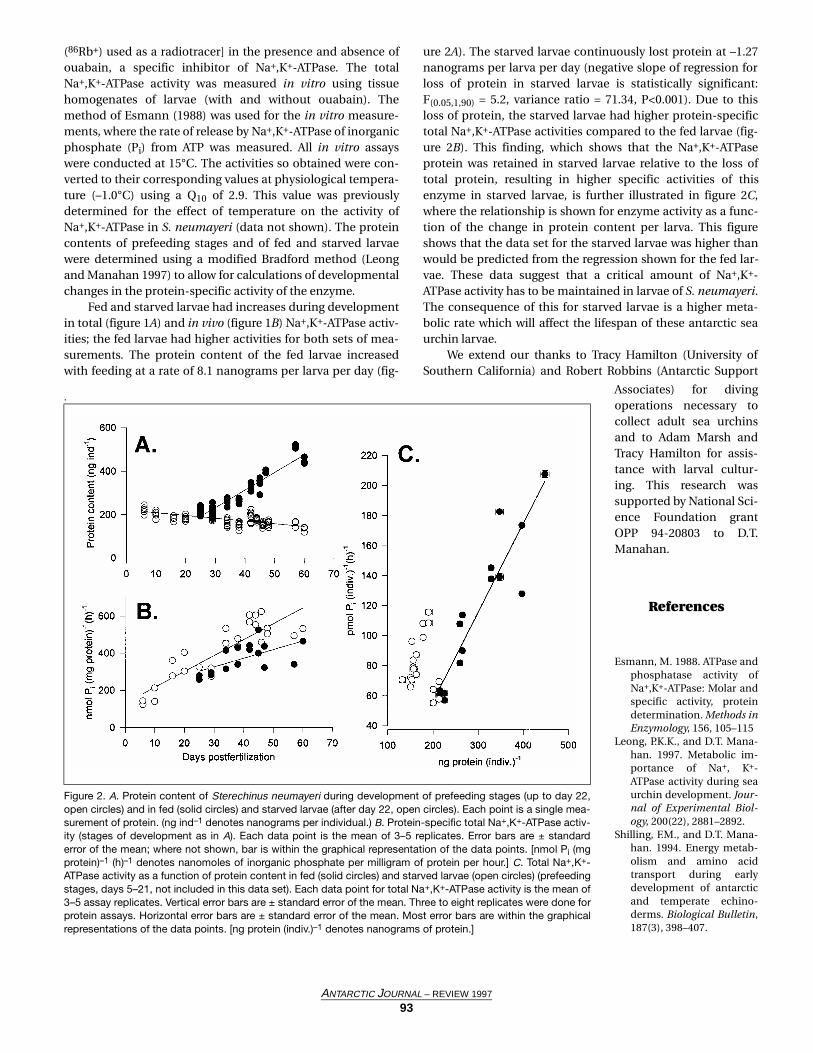
Fed and starved larvae had increases during developmentin total (figure 1A) and in vivo (figure 1B) Na+,K+-ATPase activ-ities; the fed larvae had higher activities for both sets of mea-surements. The protein content of the fed larvae increasedwith feeding at a rate of 8.1 nanograms per larva per day (fig-
ure 2A). The starved larvae continuously lost protein at –1.27nanograms per larva per day (negative slope of regression forloss of protein in starved larvae is statistically significant:F(0.05,1,90) = 5.2, variance ratio = 71.34, P<0.001). Due to thisloss of protein, the starved larvae had higher protein-specifictotal Na+,K+-ATPase activities compared to the fed larvae (fig-ure 2B). This finding, which shows that the Na+,K+-ATPaseprotein was retained in starved larvae relative to the loss oftotal protein, resulting in higher specific activities of thisenzyme in starved larvae, is further illustrated in figure 2C,where the relationship is shown for enzyme activity as a func-tion of the change in protein content per larva. This figureshows that the data set for the starved larvae was higher thanwould be predicted from the regression shown for the fed lar-vae. These data suggest that a critical amount of Na+,K+-ATPase activity has to be maintained in larvae of S. neumayeri.The consequence of this for starved larvae is a higher meta-bolic rate which will affect the lifespan of these antarctic seaurchin larvae.
We extend our thanks to Tracy Hamilton (University ofSouthern California) and Robert Robbins (Antarctic Support
Associates) for diving
ANTARCTIC JOURNAL – REVIEW 1997
93
Figure 2. A. Protein content of Sterechinus neumayeri during development of prefeeding stages (up to day 22,open circles) and in fed (solid circles) and starved larvae (after day 22, open circles). Each point is a single mea-surement of protein. (ng ind–1 denotes nanograms per individual.) B. Protein-specific total Na+,K+-ATPase activ-ity (stages of development as in A). Each data point is the mean of 3–5 replicates. Error bars are ± standarderror of the mean; where not shown, bar is within the graphical representation of the data points. [nmol Pi (mgprotein)–1 (h)–1 denotes nanomoles of inorganic phosphate per milligram of protein per hour.] C. Total Na+,K+-ATPase activity as a function of protein content in fed (solid circles) and starved larvae (open circles) (prefeedingstages, days 5–21, not included in this data set). Each data point for total Na+,K+-ATPase activity is the mean of3–5 assay replicates. Vertical error bars are ± standard error of the mean. Three to eight replicates were done forprotein assays. Horizontal error bars are ± standard error of the mean. Most error bars are within the graphicalrepresentations of the data points. [ng protein (indiv.)–1 denotes nanograms of protein.]
operations necessary tocollect adult sea urchinsand to Adam Marsh andTracy Hamilton for assis-tance with larval cultur-ing. This research wassupported by National Sci-ence Foundation grantOPP 94-20803 to D.T.Manahan.
References
Esmann, M. 1988. ATPase andphosphatase activity ofNa+,K+-ATPase: Molar andspecific activity, proteindetermination. Methods inEnzymology, 156, 105–115
Leong, P.K.K., and D.T. Mana-han. 1997. Metabolic im-portance of Na+, K+-ATPase activity during seaurchin development. Jour-nal of Experimental Biol-ogy, 200(22), 2881–2892.
Shilling, F.M., and D.T. Mana-han. 1994. Energy metab-olism and amino acidtransport during earlydevelopment of antarcticand temperate echino-derms. Biological Bulletin,187(3), 398–407.
Feeding and energetic costs of larval development in the antarctic sea urchin Sterechinus neumayeri
ADAM G. MARSH and DONAL T. MANAHAN, Department of Biological Sciences, University of Southern California, Los Angeles,California 90089-0371
urrently, a debate is underway concerning why antarcticinvertebrate embryos and larvae have such protracted
developmental times in comparison to their temperate coun-terparts. Thorson (1950) suggests that cold polar temperaturesslow metabolism and, hence, developmental rates in antarcticinvertebrates whereas Clark (1983) argues that the limitednutritional resources in polar environments restrict metabolicrates of developing embryos and larvae. Despite almost a halfcentury of debate, we still know very little about how larvaesurvive and metamorphose in extreme polar environments. Asa first step toward empirically determining the relative impor-tance of temperature or nutritional controls, our researchmeasures the specific costs of early development and the rela-tive impact of feeding on those energetic costs in the larvae ofa polar invertebrate, the antarctic sea urchin Sterechinus neu-mayeri.
The energetic cost of early development in S. neumayeriwas measured by culturing embryos to the four-arm pluteuslarval stage (day 22 of development at –1.5°C) and then raisingthe larvae to the beginning of the six-arm pluteus stage (day60). For this study, larvae were then raised in two treatments:one group was fed ad libidum (a mixture of the red algaRhodomonas sp. and the green alga Dunaliella tertiolecta) andthe other group was starved (all culturing details described inLeong and Manahan, Antarctic Journal, in this issue).
Over the course of development, the biochemical compo-sition of different embryonic and larval stages was measuredin terms of• organic mass by the analysis of total elemental carbon and
nitrogen, • protein content as determined by a standard Bradford
assay, and • DNA content as determined using a quantitative fluores-
cent dye technique (Hoeschst's stain) in a fluorometerequipped to hold small (10-microliter) capillary tubes.
Oxygen (O2) consumption rates were quantified usingsmall (<1-milliliter volume) biological oxygen demand vials(µBOD), a new method developed in our laboratory. Between50 and 500 individual embryos or larvae are incubated in aµBOD vial for 8–10 hours (at –1.5°C). A gas-tight syringe isused to inject an aliquot of the µBOD seawater into a polaro-graphic oxygen sensor (POS), providing a direct measure of theO2 concentration in the µBOD vial.
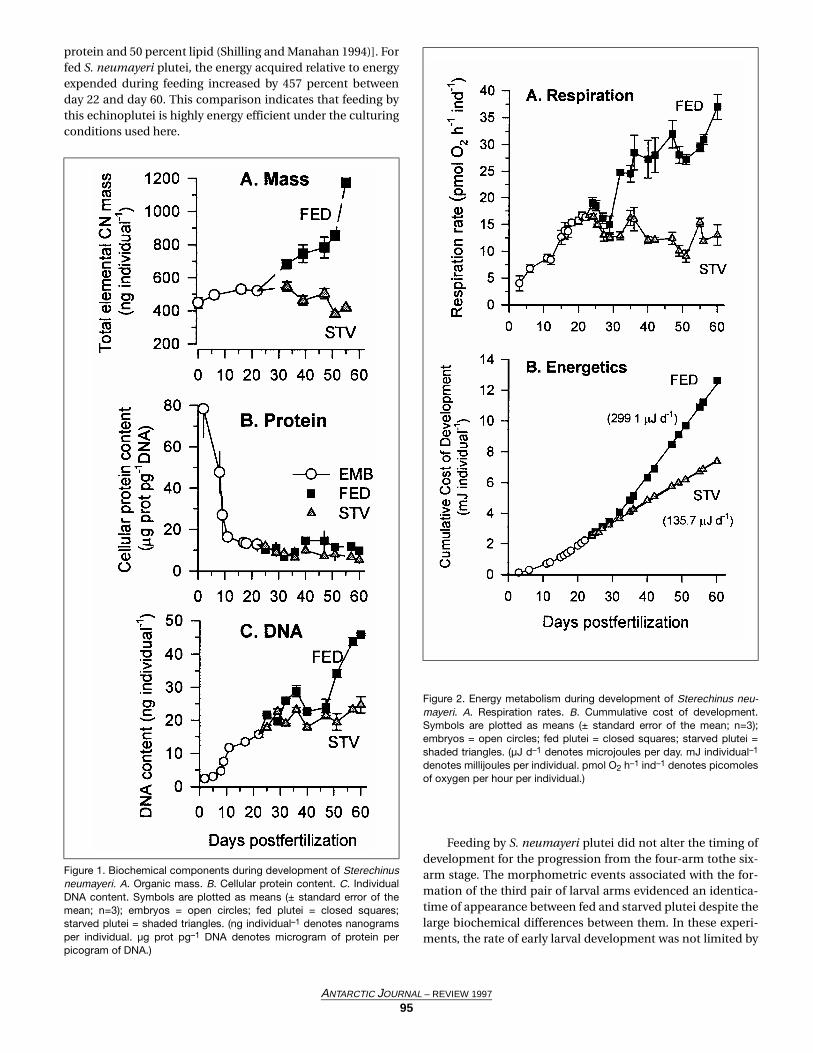
During early development, the biomass of embryos doesnot decline as expected due to the oxidation of energy reserves(figure 1A). The lack of a significant decline in mass duringearly development has been previously documented for S.neumayeri (Marsh and Manahan 1996) and for another ant-
arctic echinoderm, the asteroid Odontaster validus (Shillingand Manahan 1994). From figure 1A, embryos of S. neumayerireach the four-arm pluteus stage (day 22) with approximatelythe same total mass as the initial eggs. Early development,however, does have a total metabolic cost of 2.2 millijoules perindividual (mJ individual–1) for the first 22 days of develop-ment (figure 2B). With no detectable change in mass, theenergy source fueling development must be derived from anexternal origin. These findings suggest that embryos of S. neu-mayeri may exhibit a far greater ability for nutrient uptakethan has been found in temperate sea urchin embryos.
Once larvae begin feeding at day 22, individual biomassincreases steadily relative to starved larvae. At day 50, the thirdpair of larval arms begins to form, and larval biomass in thefed treatment increases rapidly between days 50 and 60. Fig-ure 1B shows that the cellular protein content does not changeduring development between the fed and starved treatments,indicating the change in biomass does not occur as a changein cell volume or size. This finding is substantiated in figure 1Cwhere the individual DNA content is higher in fed than starvedlarvae indicating that fed larvae have a higher cell numbercount. Thus, changes in larval biomass occur at the level ofchanges in cell number and not in terms of changes in cellsize.
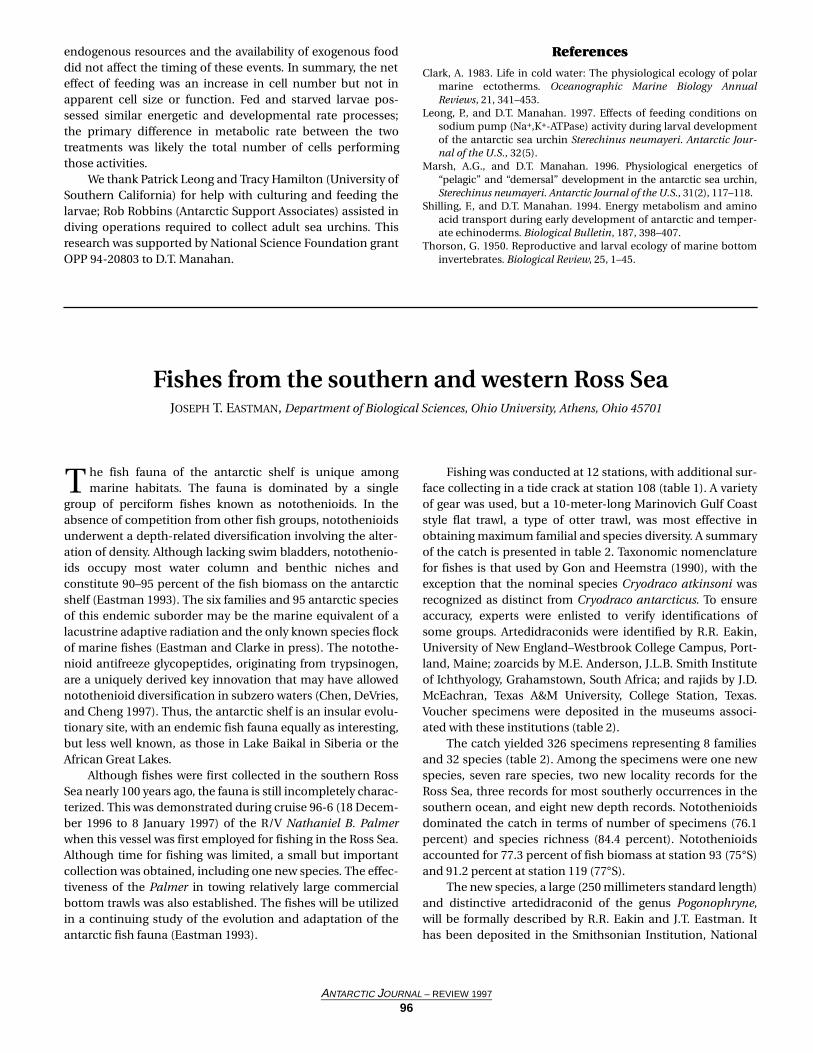
During embryonic development, respiration rates steadilyrise to a maximum value of 16 picomoles of oxygen perembryo per hour (pmol O2 embryo–1 h–1) at day 22 (figure 2A).From day 22 to day 32, respiration rates are equivalentbetween fed and starved treatments. After day 32, fed pluteievidence a large increase in respiration rates, which continueto increase until day 60. By day 60, respiration in the fed pluteihas more than doubled to 37 pmol O2 larva–1 h–1 from the ini-tial pre-feeding level.
When the four-arm plutei begin to feed ad libidum at day22, the total metabolic costs from fertilization to day 60increase from 7.42 mJ individual–1 in the starved group to12.67 mJ individual–1 in the fed group (figure 2B). Feedingresults in a 71 percent increase in metabolic energy expendi-ture. A regression of the cumulative cost of developmentagainst time (between day 30 and day 60) results in a dailyenergy expenditure for fed larvae of 299.1 microjoules perindividual per day (µJ individual–1 d–1) (r2=0.9980) whilestarved larvae expended only 135.7 µJ individual–1 d–1
(r2=0.9986) (figure 2B). The absolute difference in cumulativeenergy expended between fed and starved larvae at day 60 was5.3 mJ individual–1 (assuming 484 kilojoules per mole of O2),whereas the mass difference was 24.0 mJ individual–1 [inenergy equivalents, 31.75 kilojoules per gram for 50 percent
C
ANTARCTIC JOURNAL – REVIEW 1997
94
protein and 50 percent lipid (Shilling and Manahan 1994)]. Forfed S. neumayeri plutei, the energy acquired relative to energyexpended during feeding increased by 457 percent betweenday 22 and day 60. This comparison indicates that feeding bythis echinoplutei is highly energy efficient under the culturingconditions used here.
Feeding by S. neumayeri plutei did not alter the timing ofdevelopment for the progression from the four-arm tothe six-arm stage. The morphometric events associated with the for-mation of the third pair of larval arms evidenced an identica-time of appearance between fed and starved plutei despite thelarge biochemical differences between them. In these experi-ments, the rate of early larval development was not limited by
Figure 1. Biochemical components during development of Sterechinusneumayeri. A. Organic mass. B. Cellular protein content. C. IndividualDNA content. Symbols are plotted as means (± standard error of themean; n=3); embryos = open circles; fed plutei = closed squares;starved plutei = shaded triangles. (ng individual–1 denotes nanogramsper individual. µg prot pg–1 DNA denotes microgram of protein perpicogram of DNA.)
Figure 2. Energy metabolism during development of Sterechinus neu-mayeri. A. Respiration rates. B. Cummulative cost of development.Symbols are plotted as means (± standard error of the mean; n=3);embryos = open circles; fed plutei = closed squares; starved plutei =shaded triangles. (µJ d–1 denotes microjoules per day. mJ individual–1
denotes millijoules per individual. pmol O2 h–1 ind–1 denotes picomolesof oxygen per hour per individual.)
ANTARCTIC JOURNAL – REVIEW 1997
95
endogenous resources and the availability of exogenous fooddid not affect the timing of these events. In summary, the neteffect of feeding was an increase in cell number but not inapparent cell size or function. Fed and starved larvae pos-sessed similar energetic and developmental rate processes;the primary difference in metabolic rate between the twotreatments was likely the total number of cells performingthose activities.
We thank Patrick Leong and Tracy Hamilton (University ofSouthern California) for help with culturing and feeding thelarvae; Rob Robbins (Antarctic Support Associates) assisted indiving operations required to collect adult sea urchins. Thisresearch was supported by National Science Foundation grantOPP 94-20803 to D.T. Manahan.
References
Clark, A. 1983. Life in cold water: The physiological ecology of polarmarine ectotherms. Oceanographic Marine Biology AnnualReviews, 21, 341–453.
Leong, P., and D.T. Manahan. 1997. Effects of feeding conditions onsodium pump (Na+,K+-ATPase) activity during larval developmentof the antarctic sea urchin Sterechinus neumayeri. Antarctic Jour-nal of the U.S., 32(5).
Marsh, A.G., and D.T. Manahan. 1996. Physiological energetics of“pelagic” and “demersal” development in the antarctic sea urchin,Sterechinus neumayeri. Antarctic Journal of the U.S., 31(2), 117–118.
Shilling, F., and D.T. Manahan. 1994. Energy metabolism and aminoacid transport during early development of antarctic and temper-ate echinoderms. Biological Bulletin, 187, 398–407.
Thorson, G. 1950. Reproductive and larval ecology of marine bottominvertebrates. Biological Review, 25, 1–45.
Fishes from the southern and western Ross SeaJOSEPH T. EASTMAN, Department of Biological Sciences, Ohio University, Athens, Ohio 45701
he fish fauna of the antarctic shelf is unique amongmarine habitats. The fauna is dominated by a single
group of perciform fishes known as notothenioids. In theabsence of competition from other fish groups, notothenioidsunderwent a depth-related diversification involving the alter-ation of density. Although lacking swim bladders, notothenio-ids occupy most water column and benthic niches andconstitute 90–95 percent of the fish biomass on the antarcticshelf (Eastman 1993). The six families and 95 antarctic speciesof this endemic suborder may be the marine equivalent of alacustrine adaptive radiation and the only known species flockof marine fishes (Eastman and Clarke in press). The notothe-nioid antifreeze glycopeptides, originating from trypsinogen,are a uniquely derived key innovation that may have allowednotothenioid diversification in subzero waters (Chen, DeVries,and Cheng 1997). Thus, the antarctic shelf is an insular evolu-tionary site, with an endemic fish fauna equally as interesting,but less well known, as those in Lake Baikal in Siberia or theAfrican Great Lakes.
Although fishes were first collected in the southern RossSea nearly 100 years ago, the fauna is still incompletely charac-terized. This was demonstrated during cruise 96-6 (18 Decem-ber 1996 to 8 January 1997) of the R/V Nathaniel B. Palmerwhen this vessel was first employed for fishing in the Ross Sea.Although time for fishing was limited, a small but importantcollection was obtained, including one new species. The effec-tiveness of the Palmer in towing relatively large commercialbottom trawls was also established. The fishes will be utilizedin a continuing study of the evolution and adaptation of theantarctic fish fauna (Eastman 1993).
Fishing was conducted at 12 stations, with additional sur-face collecting in a tide crack at station 108 (table 1). A varietyof gear was used, but a 10-meter-long Marinovich Gulf Coaststyle flat trawl, a type of otter trawl, was most effective inobtaining maximum familial and species diversity. A summaryof the catch is presented in table 2. Taxonomic nomenclaturefor fishes is that used by Gon and Heemstra (1990), with theexception that the nominal species Cryodraco atkinsoni wasrecognized as distinct from Cryodraco antarcticus. To ensureaccuracy, experts were enlisted to verify identifications ofsome groups. Artedidraconids were identified by R.R. Eakin,University of New England–Westbrook College Campus, Port-land, Maine; zoarcids by M.E. Anderson, J.L.B. Smith Instituteof Ichthyology, Grahamstown, South Africa; and rajids by J.D.McEachran, Texas A&M University, College Station, Texas.Voucher specimens were deposited in the museums associ-ated with these institutions (table 2).
The catch yielded 326 specimens representing 8 familiesand 32 species (table 2). Among the specimens were one newspecies, seven rare species, two new locality records for theRoss Sea, three records for most southerly occurrences in thesouthern ocean, and eight new depth records. Notothenioidsdominated the catch in terms of number of specimens (76.1percent) and species richness (84.4 percent). Notothenioidsaccounted for 77.3 percent of fish biomass at station 93 (75°S)and 91.2 percent at station 119 (77°S).
The new species, a large (250 millimeters standard length)and distinctive artedidraconid of the genus Pogonophryne,will be formally described by R.R. Eakin and J.T. Eastman. Ithas been deposited in the Smithsonian Institution, National
T
ANTARCTIC JOURNAL – REVIEW 1997
96
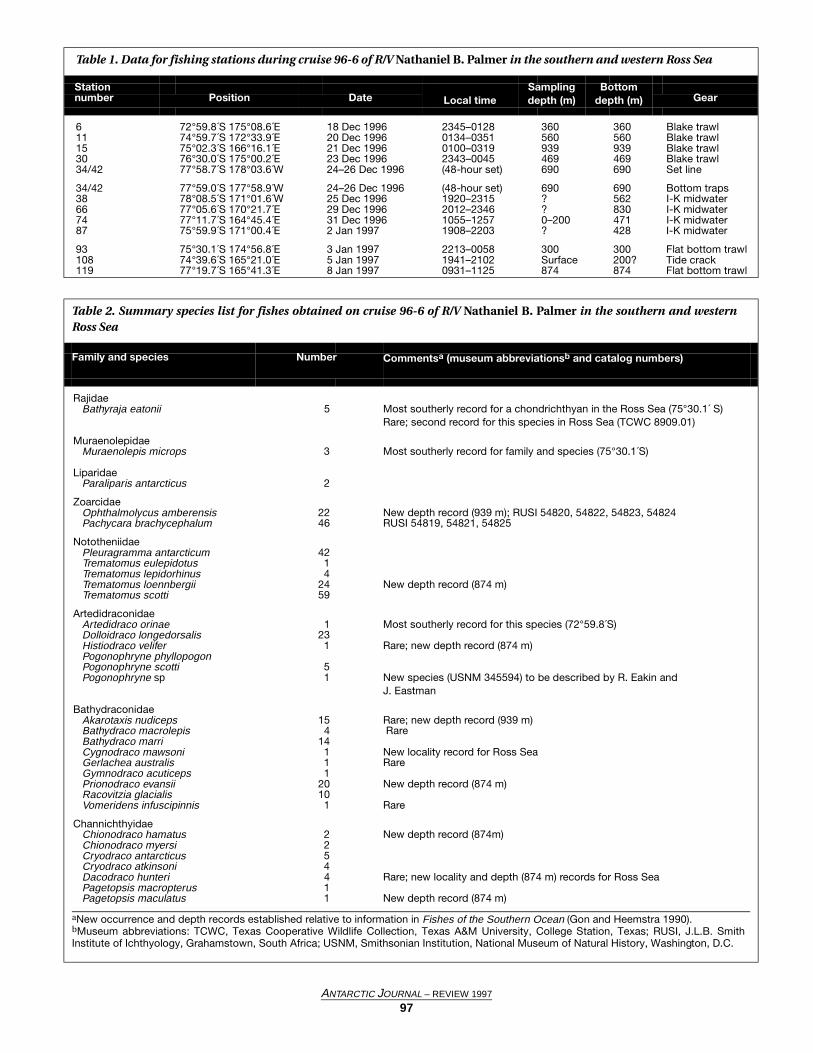
Table 1. Data for fishing stations during cruise 96-6 of R/V Nathaniel B. Palmer in the southern and western Ross Sea
StationLocal time
Samplingdepth (m)
Bottomdepth (m)number Position Date Gear
6 72°59.8´S 175°08.6´E 18 Dec 1996 2345–0128 360 360 Blake trawl11 74°59.7´S 172°33.9´E 20 Dec 1996 0134–0351 560 560 Blake trawl15 75°02.3´S 166°16.1´E 21 Dec 1996 0100–0319 939 939 Blake trawl30 76°30.0´S 175°00.2´E 23 Dec 1996 2343–0045 469 469 Blake trawl34/42 77°58.7´S 178°03.6´W 24–26 Dec 1996 (48-hour set) 690 690 Set line
34/42 77°59.0´S 177°58.9´W 24–26 Dec 1996 (48-hour set) 690 690 Bottom traps38 78°08.5´S 171°01.6´W 25 Dec 1996 1920–2315 ? 562 I-K midwater66 77°05.6´S 170°21.7´E 29 Dec 1996 2012–2346 ? 830 I-K midwater74 77°11.7´S 164°45.4´E 31 Dec 1996 1055–1257 0–200 471 I-K midwater87 75°59.9´S 171°00.4´E 2 Jan 1997 1908–2203 ? 428 I-K midwater
93 75°30.1´S 174°56.8´E 3 Jan 1997 2213–0058 300 300 Flat bottom trawl108 74°39.6´S 165°21.0´E 5 Jan 1997 1941–2102 Surface 200? Tide crack119 77°19.7´S 165°41.3´E 8 Jan 1997 0931–1125 874 874 Flat bottom trawl
Table 2. Summary species list for fishes obtained on cruise 96-6 of R/V Nathaniel B. Palmer in the southern and westernRoss Sea
Family and species Number Commentsa (museum abbreviationsb and catalog numbers)
Rajidae Bathyraja eatonii 5 Most southerly record for a chondrichthyan in the Ross Sea (75°30.1´ S)
Rare; second record for this species in Ross Sea (TCWC 8909.01)
Muraenolepidae Muraenolepis microps 3 Most southerly record for family and species (75°30.1´S)
Liparidae Paraliparis antarcticus 2
Zoarcidae Ophthalmolycus amberensis 22 New depth record (939 m); RUSI 54820, 54822, 54823, 54824 Pachycara brachycephalum 46 RUSI 54819, 54821, 54825
Nototheniidae Pleuragramma antarcticum 42 Trematomus eulepidotus 1 Trematomus lepidorhinus 4 Trematomus loennbergii 24 New depth record (874 m) Trematomus scotti 59
Artedidraconidae Artedidraco orinae 1 Most southerly record for this species (72°59.8´S) Dolloidraco longedorsalis 23 Histiodraco velifer 1 Rare; new depth record (874 m) Pogonophryne phyllopogon Pogonophryne scotti 5 Pogonophryne sp 1 New species (USNM 345594) to be described by R. Eakin and
J. Eastman
Bathydraconidae Akarotaxis nudiceps 15 Rare; new depth record (939 m) Bathydraco macrolepis 4 Rare Bathydraco marri 14 Cygnodraco mawsoni 1 New locality record for Ross Sea Gerlachea australis 1 Rare Gymnodraco acuticeps 1 Prionodraco evansii 20 New depth record (874 m) Racovitzia glacialis 10 Vomeridens infuscipinnis 1 Rare
Channichthyidae Chionodraco hamatus 2 New depth record (874m) Chionodraco myersi 2 Cryodraco antarcticus 5 Cryodraco atkinsoni 4 Dacodraco hunteri 4 Rare; new locality and depth (874 m) records for Ross Sea Pagetopsis macropterus 1 Pagetopsis maculatus 1 New depth record (874 m)
aNew occurrence and depth records established relative to information in Fishes of the Southern Ocean (Gon and Heemstra 1990).bMuseum abbreviations: TCWC, Texas Cooperative Wildlife Collection, Texas A&M University, College Station, Texas; RUSI, J.L.B. SmithInstitute of Ichthyology, Grahamstown, South Africa; USNM, Smithsonian Institution, National Museum of Natural History, Washington, D.C.
ANTARCTIC JOURNAL – REVIEW 1997
97
Museum of Natural History, Washington, D.C., under the cata-log number USNM 345594.
The notothenioid families Bathydraconidae and Chan-nichthyidae were especially well represented in terms of taxo-nomic coverage. Ten of 16 bathydraconid species occur in EastAntarctica, and nine of these were captured during cruise 96-6. Similarly 10 of 16 channichthyids are found in East Antarc-tica, and seven of these were obtained.
The catches made with the flat bottom trawl at stations 93and 119 were noteworthy in that 148 of 326 specimens, 45 per-cent of the total catch during cruise 96-6, were obtained atthese two stations. The 30-minute trawl at station 93 may havebeen one of the most productive in the history of antarctic ich-thyology. Twenty species were collected—44 percent of the 45fish species known from the entire Ross Sea (Anonymous1967). In addition to the new species of Pogonophryne, the 19other species from this station included one rajid, onemuraenolepid, two zoarcids, three nototheniids, five bathy-draconids, five channichthyids, and two other artedidra-conids, Pogonophryne scotti and P. phyllopogon.
After nearly a century of exploration, it is surprising thatthe southern Ross Sea continues to yield distinctive new spe-cies and infrequently collected species. Previous bottom trawl-ing in this area, however, usually employed small Blake trawlsthat occasionally captured a maximum of 12–14 species pertrawl but usually considerably fewer (DeWitt and Tyler 1960;Reseck 1961; Iwami and Abe 1981). Use of a relatively largecommercial trawl to scour the bottom on a shallow 300-meterbank may account for the especially great species diversity atstation 93. These trawls will be used on future cruises.
I thank A.L. DeVries and J. Turnbull for their efforts in col-lecting fishes during this cruise. B. Kluckhohn of AntarcticSupport Associates and the captain and crew of the R/VNathaniel B. Palmer contributed greatly to the success of thetrawling. J. Barry, J. Grebmeier, and M. Van Woert provideduseful information on the bottom and oceanographic condi-tions at the fishing stations. This research was supported byNational Science Foundation grant OPP 94-16870.
References
Anonymous. 1967. Eltanin cruise 27. Antarctic Journal of the U.S., 2(4),150–152.
Chen, L., A.L. DeVries, and C.-H.C. Cheng. 1997. Evolution of anti-freeze glycoprotein gene from a trypsinogen gene in antarcticnotothenioid fish. Proceedings of the National Academy of Sciencesof the U.S.A., 94, 3811–3816.
DeWitt, H.H., and J.C. Tyler. 1960. Fishes of the Stanford Antarctic Bio-logical Research Program, 1958–1959. Stanford Ichthyological Bul-letin, 7(4), 162–199.
Eastman, J.T. 1993. Antarctic fish biology: Evolution in a unique envi-ronment. San Diego, California: Academic Press.
Eastman, J.T., and A. Clarke. 1998. Radiations of antarctic and non-antarctic fish. In G. di Prisco, A. Clarke, and E. Pisano (Eds.), Fishesof Antarctica: A biological overview. Berlin, Germany: Springer-Verlag.
Gon, O., and P.C. Heemstra (Eds.). 1990. Fishes of the southern ocean.Grahamstown, South Africa: J.L.B. Smith Institute of Ichthyology.
Iwami, T., and T. Abe. 1981. The collection of fishes trawled in the RossSea. Antarctic Record, National Institute of Polar Research, Tokyo,No. 71, 130–141.
Reseck, J., Jr. 1961. A note on fishes from the Ross Sea, Antarctica. NewZealand Journal of Science, 4(1), 107–115.
The loss of hemoglobin and/or myoglobin affects cardiac ultrastructure in antarctic fishes
KRISTIN M. O'BRIEN and BRUCE D. SIDELL, School of Marine Sciences, University of Maine, Orono, Maine 04469
hannicthyidae, a family of antarctic fishes, are uniqueamong all vertebrates because they lack the oxygen-car-
rying protein, hemoglobin. Much is known about the cardio-vascular adapations of these fish that allow them to survivedespite the loss of hemoglobin: • their heart-to-body mass ratio is three times greater than
red-blooded notothenioids and allows for a cardiac outputfour to five times greater than red-blooded teleosts,
• capillary diameters are two to three times larger, and• blood volume is two to four times greater than red-blooded
teleosts (Hemmingsen 1991).These adjustments in the cardiovascular system allow a
large volume of blood to be pumped through the circulatory
system at high flow against only a small peripheral resistance;this configuration maintains oxygen delivery to working mus-cles.
Not only do Channicthyids (icefishes) lack hemoglobin,but some species within this family also lack myoglobin intheir oxidative muscle tissue (Sidell 1997). Myoglobin is theintracellular oxygen-binding protein that is important for thestorage and transport of oxygen within muscle cells (Witten-berg and Wittenberg 1989). Johnston and Harrison (1987)studied hearts from icefish and determined that modificationsin the architecture of cardiac myocytes may enhance oxygendelivery to the mitochondria in those species that lack myo-globin. They compared the ultrastructure of ventricles
C
ANTARCTIC JOURNAL – REVIEW 1997
98
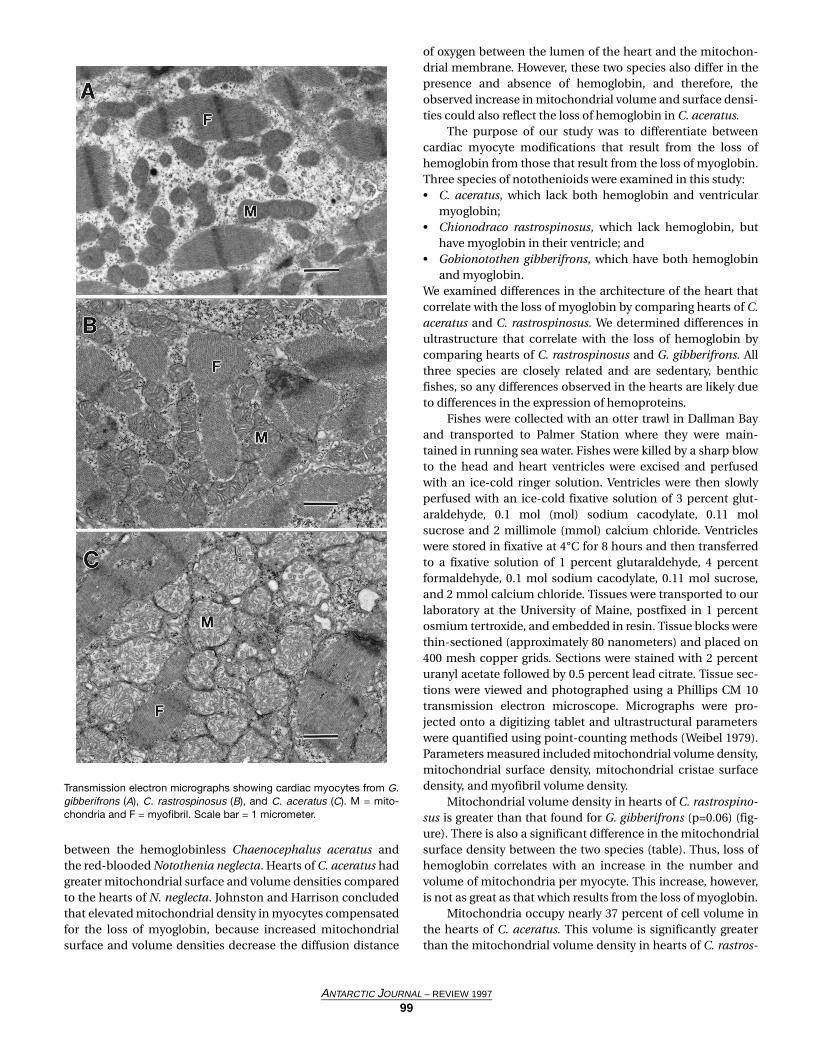
between the hemoglobinless Chaenocephalus aceratus andthe red-blooded Notothenia neglecta. Hearts of C. aceratus hadgreater mitochondrial surface and volume densities comparedto the hearts of N. neglecta. Johnston and Harrison concludedthat elevated mitochondrial density in myocytes compensatedfor the loss of myoglobin, because increased mitochondrialsurface and volume densities decrease the diffusion distance
of oxygen between the lumen of the heart and the mitochon-drial membrane. However, these two species also differ in thepresence and absence of hemoglobin, and therefore, theobserved increase in mitochondrial volume and surface densi-ties could also reflect the loss of hemoglobin in C. aceratus.
The purpose of our study was to differentiate betweencardiac myocyte modifications that result from the loss ofhemoglobin from those that result from the loss of myoglobin.Three species of notothenioids were examined in this study:• C. aceratus, which lack both hemoglobin and ventricular
myoglobin;• Chionodraco rastrospinosus, which lack hemoglobin, but
have myoglobin in their ventricle; and• Gobionotothen gibberifrons, which have both hemoglobin
and myoglobin.We examined differences in the architecture of the heart thatcorrelate with the loss of myoglobin by comparing hearts of C.aceratus and C. rastrospinosus. We determined differences inultrastructure that correlate with the loss of hemoglobin bycomparing hearts of C. rastrospinosus and G. gibberifrons. Allthree species are closely related and are sedentary, benthicfishes, so any differences observed in the hearts are likely dueto differences in the expression of hemoproteins.
Fishes were collected with an otter trawl in Dallman Bayand transported to Palmer Station where they were main-tained in running sea water. Fishes were killed by a sharp blowto the head and heart ventricles were excised and perfusedwith an ice-cold ringer solution. Ventricles were then slowlyperfused with an ice-cold fixative solution of 3 percent glut-araldehyde, 0.1 mol (mol) sodium cacodylate, 0.11 molsucrose and 2 millimole (mmol) calcium chloride. Ventricleswere stored in fixative at 4°C for 8 hours and then transferredto a fixative solution of 1 percent glutaraldehyde, 4 percentformaldehyde, 0.1 mol sodium cacodylate, 0.11 mol sucrose,and 2 mmol calcium chloride. Tissues were transported to ourlaboratory at the University of Maine, postfixed in 1 percentosmium tertroxide, and embedded in resin. Tissue blocks werethin-sectioned (approximately 80 nanometers) and placed on400 mesh copper grids. Sections were stained with 2 percenturanyl acetate followed by 0.5 percent lead citrate. Tissue sec-tions were viewed and photographed using a Phillips CM 10transmission electron microscope. Micrographs were pro-jected onto a digitizing tablet and ultrastructural parameterswere quantified using point-counting methods (Weibel 1979).Parameters measured included mitochondrial volume density,mitochondrial surface density, mitochondrial cristae surfacedensity, and myofibril volume density.
Mitochondrial volume density in hearts of C. rastrospino-sus is greater than that found for G. gibberifrons (p=0.06) (fig-ure). There is also a significant difference in the mitochondrialsurface density between the two species (table). Thus, loss ofhemoglobin correlates with an increase in the number andvolume of mitochondria per myocyte. This increase, however,is not as great as that which results from the loss of myoglobin.
Mitochondria occupy nearly 37 percent of cell volume inthe hearts of C. aceratus. This volume is significantly greaterthan the mitochondrial volume density in hearts of C. rastros-
Transmission electron micrographs showing cardiac myocytes from G.gibberifrons (A), C. rastrospinosus (B), and C. aceratus (C). M = mito-chondria and F = myofibril. Scale bar = 1 micrometer.
ANTARCTIC JOURNAL – REVIEW 1997
99
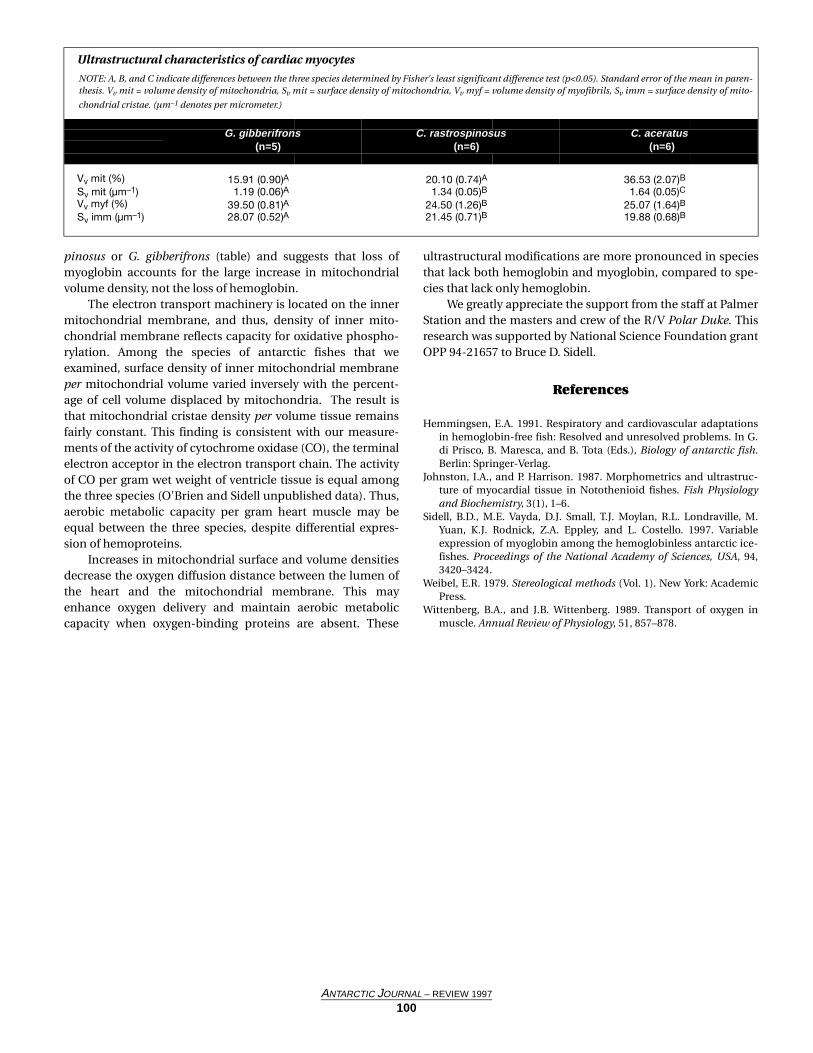
pinosus or G. gibberifrons (table) and suggests that loss ofmyoglobin accounts for the large increase in mitochondrialvolume density, not the loss of hemoglobin.
The electron transport machinery is located on the innermitochondrial membrane, and thus, density of inner mito-chondrial membrane reflects capacity for oxidative phospho-rylation. Among the species of antarctic fishes that weexamined, surface density of inner mitochondrial membraneper mitochondrial volume varied inversely with the percent-age of cell volume displaced by mitochondria. The result isthat mitochondrial cristae density per volume tissue remainsfairly constant. This finding is consistent with our measure-ments of the activity of cytochrome oxidase (CO), the terminalelectron acceptor in the electron transport chain. The activityof CO per gram wet weight of ventricle tissue is equal amongthe three species (O'Brien and Sidell unpublished data). Thus,aerobic metabolic capacity per gram heart muscle may beequal between the three species, despite differential expres-sion of hemoproteins.
Increases in mitochondrial surface and volume densitiesdecrease the oxygen diffusion distance between the lumen ofthe heart and the mitochondrial membrane. This mayenhance oxygen delivery and maintain aerobic metaboliccapacity when oxygen-binding proteins are absent. These
ultrastructural modifications are more pronounced in speciesthat lack both hemoglobin and myoglobin, compared to spe-cies that lack only hemoglobin.
We greatly appreciate the support from the staff at PalmerStation and the masters and crew of the R/V Polar Duke. Thisresearch was supported by National Science Foundation grantOPP 94-21657 to Bruce D. Sidell.
References
Hemmingsen, E.A. 1991. Respiratory and cardiovascular adaptationsin hemoglobin-free fish: Resolved and unresolved problems. In G.di Prisco, B. Maresca, and B. Tota (Eds.), Biology of antarctic fish.Berlin: Springer-Verlag.
Johnston, I.A., and P. Harrison. 1987. Morphometrics and ultrastruc-ture of myocardial tissue in Notothenioid fishes. Fish Physiologyand Biochemistry, 3(1), 1–6.
Sidell, B.D., M.E. Vayda, D.J. Small, T.J. Moylan, R.L. Londraville, M.Yuan, K.J. Rodnick, Z.A. Eppley, and L. Costello. 1997. Variableexpression of myoglobin among the hemoglobinless antarctic ice-fishes. Proceedings of the National Academy of Sciences, USA, 94,3420–3424.
Weibel, E.R. 1979. Stereological methods (Vol. 1). New York: AcademicPress.
Wittenberg, B.A., and J.B. Wittenberg. 1989. Transport of oxygen inmuscle. Annual Review of Physiology, 51, 857–878.
Ultrastructural characteristics of cardiac myocytes
NOTE: A, B, and C indicate differences between the three species determined by Fisher's least significant difference test (p<0.05). Standard error of the mean in paren-thesis. Vv mit = volume density of mitochondria, Sv mit = surface density of mitochondria, Vv myf = volume density of myofibrils, Sv imm = surface density of mito-
chondrial cristae. (µm–1 denotes per micrometer.)
G. gibberifrons (n=5)
C. rastrospinosus (n=6)
C. aceratus (n=6)
Vv mit (%) 15.91 (0.90)A 20.10 (0.74)A 36.53 (2.07)BSv mit (µm–1) 1.19 (0.06)A 1.34 (0.05)B 1.64 (0.05)CVv myf (%) 39.50 (0.81)A 24.50 (1.26)B 25.07 (1.64)BSv imm (µm–1) 28.07 (0.52)A 21.45 (0.71)B 19.88 (0.68)B
ANTARCTIC JOURNAL – REVIEW 1997
100
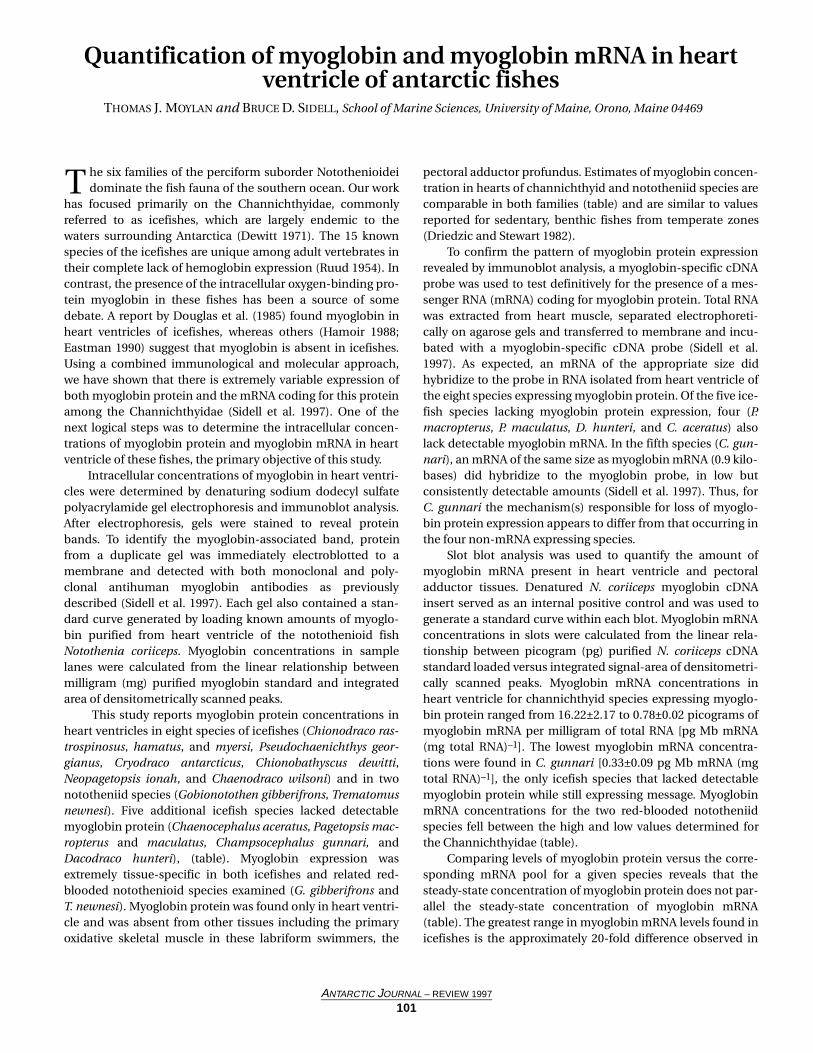
Quantification of myoglobin and myoglobin mRNA in heart ventricle of antarctic fishes
THOMAS J. MOYLAN and BRUCE D. SIDELL, School of Marine Sciences, University of Maine, Orono, Maine 04469
he six families of the perciform suborder Notothenioideidominate the fish fauna of the southern ocean. Our work
has focused primarily on the Channichthyidae, commonlyreferred to as icefishes, which are largely endemic to thewaters surrounding Antarctica (Dewitt 1971). The 15 knownspecies of the icefishes are unique among adult vertebrates intheir complete lack of hemoglobin expression (Ruud 1954). Incontrast, the presence of the intracellular oxygen-binding pro-tein myoglobin in these fishes has been a source of somedebate. A report by Douglas et al. (1985) found myoglobin inheart ventricles of icefishes, whereas others (Hamoir 1988;Eastman 1990) suggest that myoglobin is absent in icefishes.Using a combined immunological and molecular approach,we have shown that there is extremely variable expression ofboth myoglobin protein and the mRNA coding for this proteinamong the Channichthyidae (Sidell et al. 1997). One of thenext logical steps was to determine the intracellular concen-trations of myoglobin protein and myoglobin mRNA in heartventricle of these fishes, the primary objective of this study.
Intracellular concentrations of myoglobin in heart ventri-cles were determined by denaturing sodium dodecyl sulfatepolyacrylamide gel electrophoresis and immunoblot analysis.After electrophoresis, gels were stained to reveal proteinbands. To identify the myoglobin-associated band, proteinfrom a duplicate gel was immediately electroblotted to amembrane and detected with both monoclonal and poly-clonal antihuman myoglobin antibodies as previouslydescribed (Sidell et al. 1997). Each gel also contained a stan-dard curve generated by loading known amounts of myoglo-bin purified from heart ventricle of the notothenioid fishNotothenia coriiceps. Myoglobin concentrations in samplelanes were calculated from the linear relationship betweenmilligram (mg) purified myoglobin standard and integratedarea of densitometrically scanned peaks.
This study reports myoglobin protein concentrations inheart ventricles in eight species of icefishes (Chionodraco ras-trospinosus, hamatus, and myersi, Pseudochaenichthys geor-gianus, Cryodraco antarcticus, Chionobathyscus dewitti,Neopagetopsis ionah, and Chaenodraco wilsoni) and in twonototheniid species (Gobionotothen gibberifrons, Trematomusnewnesi). Five additional icefish species lacked detectablemyoglobin protein (Chaenocephalus aceratus, Pagetopsis mac-ropterus and maculatus, Champsocephalus gunnari, andDacodraco hunteri), (table). Myoglobin expression wasextremely tissue-specific in both icefishes and related red-blooded notothenioid species examined (G. gibberifrons andT. newnesi). Myoglobin protein was found only in heart ventri-cle and was absent from other tissues including the primaryoxidative skeletal muscle in these labriform swimmers, the
pectoral adductor profundus. Estimates of myoglobin concen-tration in hearts of channichthyid and nototheniid species arecomparable in both families (table) and are similar to valuesreported for sedentary, benthic fishes from temperate zones(Driedzic and Stewart 1982).
To confirm the pattern of myoglobin protein expressionrevealed by immunoblot analysis, a myoglobin-specific cDNAprobe was used to test definitively for the presence of a mes-senger RNA (mRNA) coding for myoglobin protein. Total RNAwas extracted from heart muscle, separated electrophoreti-cally on agarose gels and transferred to membrane and incu-bated with a myoglobin-specific cDNA probe (Sidell et al.1997). As expected, an mRNA of the appropriate size didhybridize to the probe in RNA isolated from heart ventricle ofthe eight species expressing myoglobin protein. Of the five ice-fish species lacking myoglobin protein expression, four (P.macropterus, P. maculatus, D. hunteri, and C. aceratus) alsolack detectable myoglobin mRNA. In the fifth species (C. gun-nari), an mRNA of the same size as myoglobin mRNA (0.9 kilo-bases) did hybridize to the myoglobin probe, in low butconsistently detectable amounts (Sidell et al. 1997). Thus, forC. gunnari the mechanism(s) responsible for loss of myoglo-bin protein expression appears to differ from that occurring inthe four non-mRNA expressing species.
Slot blot analysis was used to quantify the amount ofmyoglobin mRNA present in heart ventricle and pectoraladductor tissues. Denatured N. coriiceps myoglobin cDNAinsert served as an internal positive control and was used togenerate a standard curve within each blot. Myoglobin mRNAconcentrations in slots were calculated from the linear rela-tionship between picogram (pg) purified N. coriiceps cDNAstandard loaded versus integrated signal-area of densitometri-cally scanned peaks. Myoglobin mRNA concentrations inheart ventricle for channichthyid species expressing myoglo-bin protein ranged from 16.22±2.17 to 0.78±0.02 picograms ofmyoglobin mRNA per milligram of total RNA [pg Mb mRNA(mg total RNA)–1]. The lowest myoglobin mRNA concentra-tions were found in C. gunnari [0.33±0.09 pg Mb mRNA (mgtotal RNA)–1], the only icefish species that lacked detectablemyoglobin protein while still expressing message. MyoglobinmRNA concentrations for the two red-blooded nototheniidspecies fell between the high and low values determined forthe Channichthyidae (table).
Comparing levels of myoglobin protein versus the corre-sponding mRNA pool for a given species reveals that thesteady-state concentration of myoglobin protein does not par-allel the steady-state concentration of myoglobin mRNA(table). The greatest range in myoglobin mRNA levels found inicefishes is the approximately 20-fold difference observed in
T
ANTARCTIC JOURNAL – REVIEW 1997
101
the congeneric species C. rastrospinosus and C. hamatus. Thisobserved difference in myoglobin mRNA pool is not reflectedin the standing stock of myoglobin protein, which is equiva-lent in hearts of these two species. This result suggests thatsynthesis and/or turnover of the protein is not coordinatelyregulated with the mRNA pool. The lack of correlationbetween myoglobin protein and myoglobin mRNA concentra-tions in notothenioid fishes suggests protein concentrationsare not regulated at the mRNA level.
Phylogenetic analysis possible at this time does not sug-gest the Channichthyidae are undergoing selective pressuretoward a myoglobinless state (Sidell et al. 1997). Indeed, given
the seemingly random loss of myoglobin expression in thisfamily, we cannot determine if myoglobin (+) or myoglobin (–)is the most derived state within the Channichthyidae.
We gratefully acknowledge the generous contribution ofsamples by A.L. DeVries (University of Illinois), G. diPrisco andR. Acierno (Italian National Antarctic Program), T. Iwami(Tokyo Kasei Gakuin University), and H.W. Detrich (Northeast-ern University). Personnel at the U.S. Antarctic Program'sPalmer Station and the masters and crew of R/V Polar Dukeprovided invaluable support during the course of our work.This work was supported by National Science Foundationgrants OPP 92-20775 and OPP 94-21657 to Bruce D. Sidell..
References
Dewitt, H.H. 1971. Coastal and deep-water benthic fishes of the Ant-arctic. In V.C. Bushnell (Ed.), Antarctic map folio series, folio 15.New York: American Geographical Society.
Douglas, E.L., K.S. Peterson, J.R. Gyso, and D.J. Chapman. 1985. Myo-globin in the heart tissue of fishes lacking hemoglobin. Compara-tive Biochemistry and Physiology, 81(A), 855–888.
Driedzic, W.R., and J. Stewart. 1982. Myoglobin content and the activi-ties of enzymes of energy metabolism in red and white fish hearts.Journal of Comparative Physiology, 149(B), 67–73.
Eastman, J.T. 1990. The biology and physiological ecology of notothe-nioid fishes. In O. Gon and P.C. Heemstra (Eds.), Fishes of the south-ern ocean. Grahamstown, South Africa: J.L.B. Smith Institute ofIchthyology.
Hamoir, G. 1988. Biochemical adaptation of the muscles of the Chan-nichthyidae to their lack in hemoglobin and myoglobin. Compara-tive Biochemistry and Physiology, 90(B), 557–559.
Ruud, J.T. 1954. Vertebrates without erythrocytes and blood pigment.Nature, 173, 848–850.
Sidell, B.D., M.E. Vayda, D.J. Small, T.J. Moylan, R.L. Londraville, M.-L.Yuan, K.J. Rodnick, Z.A. Eppley, and L. Costello. 1997. Variableexpression of myoglobin among species of hemoglobinless antarc-tic icefishes. Proceedings of the National Academy of Sciences, USA,3420–3424.
Concentrationsa of myoglobin (mb) protein and myoglobin mRNA in heart ventricles of antarctic notothenioid fishes
Mb concentration [mg Mb·(g wet weight)–1]
Mb mRNA concentration [pg Mb mRNA·(µg total RNA)–1]Taxon
ChannichthyidaeChionodraco rastrospinosus (n=6) 0.64±0.07 (n=6) 16.22±2.17C. hamatus (n=6) 0.62±0.04 (n=4) 0.78±0.02C. myersi (n=4) 0.71±0.08Pseudochaenichthys georgianus (n=6) 0.46±0.04 (n=4) 1.97±0.77Cryodraco antarcticus (n=6) 0.44±0.02 (n=1) 2.05Chaenodraco wilsoni (n=6) 0.65±0.08 (n=1) 5.31Chionobathyscus dewitti (n=2) 0.69±0.03Neopagetopsis ionah (n=1) 0.70Champsocephalus gunnari (n=6) N.D.b (n=6) 0.33±0.09Chaenocephalus aceratus (n=6) N.D. (n=6) N.D.Dacodraco hunteri (n=4) N.D. (n=4) N.D.Pagetopsis macropterus (n=2) N.D. (n=2) N.D.P. maculatus (n=1) N.D. (n=1) N.D.
NototheniidaeGobionotothen gibberifrons (n=6) 0.85±0.11 (n=6) 7.27±1.94Trematomus newnesi (n=6) 1.12±0.07 (n=5) 7.11±1.04
aConcentration data are presented as mean ± standard error.bN.D. = not detected.
ANTARCTIC JOURNAL – REVIEW 1997
102
Patterns of nest attendance and relief in Adélie penguins, Pygoscelis adeliae
THERESA L. BUCHER* and CAROL M. VLECK, Department of Zoology and Genetics, Iowa State University, Ames, Iowa 50011
*Present address: University of California–Los Angeles, Department of Biology, Tarzana, California 91356
he Adélie penguin breeds at rookeries distributed alongthe coast of Antarctica and on islands south of 60°S lati-
tude. Numerous investigators have documented reproductivesuccess and causes of breeding failure of banded birds at vari-ous latitudes, most often in colonies on Ross Island, Antarc-tica, all located south of 77°S latitude (see Ainley, LeResche,and Sladen 1983) but also at King George Island (62°10'S58°30'W) (Trivelpiece et al. 1990) and Signy Island in the SouthOrkney Islands (60°43'S 45°36'W) (Croxall et al. 1988). Westudied the breeding biology of a colony of Adélie penguins onTorgersen Island, west of the Antarctic Peninsula (64°46'S64°05'W). We documented the pattern of nest attendance andreliefs of banded birds and here compare the pattern we foundwith that described for colonies at higher and lower latitudes.
A fairly consistent pattern of nest attendance and reliefshas been described and strongly linked to breeding success orfailure in the most southerly populations studied on RossIsland (Davis 1982, 1988; Davis and Miller 1990). After femaleslay their second eggs, they go to sea to forage. Males take thefirst and longest incubation bout; females take the secondbout while the males forage at sea; males take the third bout;and the females return from sea at approximately the time ofhatching of the first egg. Therefore, there are usually threeattendance switches before hatching, and the total time of thefirst three incubation bouts approximately equals the incuba-tion period (table). After hatching, the parents shorten thelength of their alternate foraging bouts to feed the chicks regu-larly. Incubation from the laying of the second (last) egg untilthe first egg hatches usually is between 32 and 34 days.
In contrast to the Ross Island birds, Trivelpiece et al.(1990) reported a different pattern for birds nesting at Admi-ralty Bay on King George Island (table). Both male first boutsand female second bouts were shorter than the bouts reportedfor Ross Island, and the average number of attendanceswitches until hatching ranged from 3.4 to 6.7 over five differ-ent seasons. The year with the lowest average number ofswitches also had the lowest number of chicks hatched perpair and the lowest number of chicks fledged per pair.
At the most northerly latitude on Signy Island, SouthOrkney Islands, Croxall et al. (1988) reported first and secondbout lengths of 13.7 and 12.8 days, respectively, for an “aver-age” year between 1976 and 1987. This first bout length is sim-ilar to those reported at Admiralty Bay, but the second boutlength is similar to those reported for the more southerly RossIsland colonies. The total number of days for the first two
bouts suggests that there are probably more than three atten-dance switches during incubation until hatching.
At the midlatitude site on Torgersen Island, we found thatthe mean number of attendance switches varied significantlybetween years [ANOVA, F=94.2(3,533)]. It averaged from five tonine in different years and ranged from as few as one to asmany as 19 among nests within different years (table). Firstincubation bouts of males and second bouts of females wereshorter on Torgersen than at any of the other sites.
There is not a single pattern of coordination of incubationbouts and nest reliefs that leads to successful hatching eitherwithin colonies or across colonies in widely separated loca-tions. However, there are consistent differences between loca-tions. For example, Ross Island colonies consistently havelonger bouts and fewer switches than do Torgersen Island col-onies.
Davis and Miller (1990) suggest that food per se does notdetermine the length of foraging trips, at least during the incu-bation period. Ice conditions, including heavy ice and latebreakup and lack of easy access to open water, affect thelength of the first foraging trip and this change in turn affectsthe length of the second and third foraging trips because of thechange in the length of time available until hatching (Davis1988). Desertions are more prevalent (Ainley and LeResche1973), and reproductive success is lowest in the years when icepersists the longest (Croxall et al. 1988).
Although social behavior within a species has tradition-ally been viewed as rather static, recently this view haschanged. Social interactions, as well as life history, mating sys-tems, and morphology, vary intraspecifically and correlatewith environmental heterogeneity. Such a situation has beenreported by Waas (1990) in cave- and burrow-dwelling littleblue penguins (Eudyptula minor). Incubation behavior mayvary with environmental heterogeneity as well. In Adélie pen-guins, the length of foraging trips during incubation may berelated to the distance to open water and/or to the extent andtype of ice near the colony, both of which will vary temporallyand spatially and may affect the presence and accessibility offood.
We thank our field assistants, Asrun Kristmundsdottir,Wendy Reed, David Vleck, Lori Ross, and David Lott for theirable assistance with all aspects of this research, and the sup-port staff at Palmer Station. This research was supported byNational Science Foundation grant OPP 93-17356 to C.M.Vleck..
T
ANTARCTIC JOURNAL – REVIEW 1997
103
References
Ainley, D.G., and R.E. LeResche. 1973. The effects of weather and iceconditions on breeding in Adélie penguins. Condor, 75, 235–239.
Ainley, D.G., R.E. LeResche, and W.J. Sladen. 1983. Breeding biology ofthe Adélie penguin. Berkeley: University of California Press.
Croxall, J.P., T.S. McCann, P.A. Prince, and P. Rothery. 1988. Reproduc-tive performance of seabirds and seals at South Georgia and SignyIsland, South Orkney Islands, 1976–1987: Implications for south-ern ocean monitoring studies. In D. Sahrhage (Ed.), Antarctic oceanand resources variability. Berlin: Springer-Verlag.
Davis, S.L. 1982. Timing of nest relief and its effect on breeding suc-cess in Adélie penguins (Pygoscelis adeliae). Condor, 84, 178–183.
Davis, S.L. 1988. Coordination of incubation routines and mate choicein Adélie penguins (Pygoscelis adeliae). Auk, 105, 428–432.
Davis, S.L., and G.D. Miller. 1990. Foraging patterns of Adélie penguinsduring the incubation period. In K.R. Kerry and G. Hempel (Eds.),Antarctic ecosystems, ecological change and conservation. Berlin:Springer-Verlag.
Trivelpiece, W.Z., S.G. Trivelpiece, G.R. Geupel, J. Kjelmyr, and N.J.Volkman. 1990. Adélie and chinstrap penguins: Their potential asmonitors of the southern ocean marine ecosystem. In K.R. Kerryand G. Hempel (Eds.), Antarctic ecosystems, ecological change andconservation. Berlin: Springer-Verlag.
Waas, J.R. 1990. Intraspecific variation in social repertoires: Evidencefrom cave- and burrow-dwelling little blue penguins. Behaviour,115(1–2), 63–99.
Incubation bout lengths and number of attendance switches of Adélie penguins
YearFirst incubation
boutmales, days
(range)
Second incubation bout
females, days(range)
Third incubation bout
males, days(range)
Number ofswitches
Reference
1977–1978 16.5 12.4 3.6 3 Cape Bird, Ross Island(9–25) (7–20) (1–9) Davis and Miller (1990)
1984–1985 19.8 12.6 3.1 3 Cape Bird, Ross Island(10.7–24.7) (6.5–16.1) (1.4–7.1) Davis and Miller (1990)
1986–1987 14.2 12.0 4.3 3/4 Cape Bird, Ross Island(10.5–18.5) (9.5–15) (1.5–7) Davis and Miller (1990)
1987–1988 15.8 9.7 4.3 3/4 Cape Bird, Ross Island(11.5–20.5) (7.5–13.5) (2–7) Davis and Miller (1990)
1981–1982 12.8 9.4 7 4.3 Admiralty Bay, King George IslandTrivelpiece et al. (1990)
1982–1983 13.5 12.1 6.1 3.4 Admiralty Bay, King George IslandTrivelpiece et al. (1990)
1984–1985 11.5 9.7 5.5 Admiralty Bay, King George IslandTrivelpiece et al. (1990)
1985–1986 11.1 8.6 6.7 Admiralty Bay, King George IslandTrivelpiece et al. (1990)
1986–1987 12.2 10.4 6.9 4.1 Admiralty Bay, King George IslandTrivelpiece et al. (1990)
1990–1991 19.1 6.3 Torgersen Island
(2–12) Bucher and Chappell (unpublished data)
1991–1992 21.5 4.7 Torgersen Island(2–11) Bucher and Chappell (unpublished data)
1995–1996 10.7 7.3 5.3 Torgersen Island(3–33) (1–25) (1–10) Bucher and Vleck
1996–1997 8.2 5.3 8.8 Torgersen Island(1–23) (1–20) (3–19) Bucher and Vleck
ANTARCTIC JOURNAL – REVIEW 1997
104
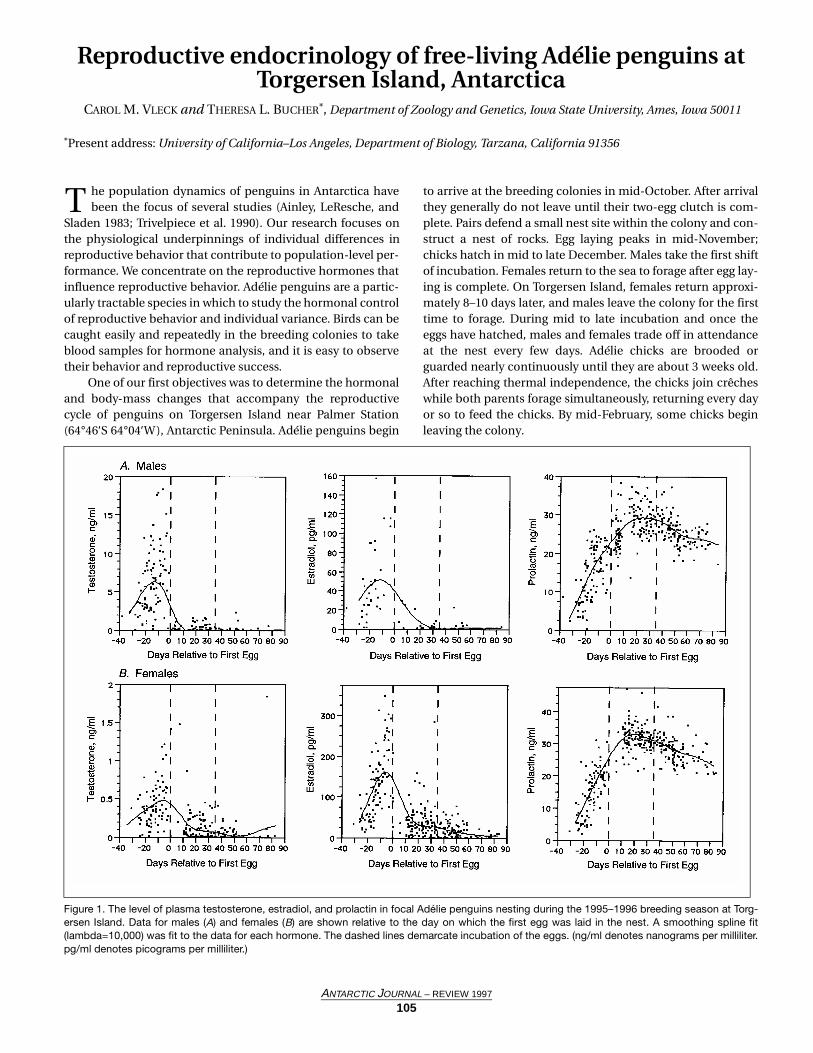
Reproductive endocrinology of free-living Adélie penguins at Torgersen Island, Antarctica
CAROL M. VLECK and THERESA L. BUCHER*, Department of Zoology and Genetics, Iowa State University, Ames, Iowa 50011
*Present address: University of California–Los Angeles, Department of Biology, Tarzana, California 91356
he population dynamics of penguins in Antarctica havebeen the focus of several studies (Ainley, LeResche, and
Sladen 1983; Trivelpiece et al. 1990). Our research focuses onthe physiological underpinnings of individual differences inreproductive behavior that contribute to population-level per-formance. We concentrate on the reproductive hormones thatinfluence reproductive behavior. Adélie penguins are a partic-ularly tractable species in which to study the hormonal controlof reproductive behavior and individual variance. Birds can becaught easily and repeatedly in the breeding colonies to takeblood samples for hormone analysis, and it is easy to observetheir behavior and reproductive success.
One of our first objectives was to determine the hormonaland body-mass changes that accompany the reproductivecycle of penguins on Torgersen Island near Palmer Station(64°46′S 64°04′W), Antarctic Peninsula. Adélie penguins begin
to arrive at the breeding colonies in mid-October. After arrivalthey generally do not leave until their two-egg clutch is com-plete. Pairs defend a small nest site within the colony and con-struct a nest of rocks. Egg laying peaks in mid-November;chicks hatch in mid to late December. Males take the first shiftof incubation. Females return to the sea to forage after egg lay-ing is complete. On Torgersen Island, females return approxi-mately 8–10 days later, and males leave the colony for the firsttime to forage. During mid to late incubation and once theeggs have hatched, males and females trade off in attendanceat the nest every few days. Adélie chicks are brooded orguarded nearly continuously until they are about 3 weeks old.After reaching thermal independence, the chicks join crêcheswhile both parents forage simultaneously, returning every dayor so to feed the chicks. By mid-February, some chicks beginleaving the colony.
T
Figure 1. The level of plasma testosterone, estradiol, and prolactin in focal Adélie penguins nesting during the 1995–1996 breeding season at Torg-ersen Island. Data for males (A) and females (B) are shown relative to the day on which the first egg was laid in the nest. A smoothing spline fit(lambda=10,000) was fit to the data for each hormone. The dashed lines demarcate incubation of the eggs. (ng/ml denotes nanograms per milliliter.pg/ml denotes picograms per milliliter.)
ANTARCTIC JOURNAL – REVIEW 1997
105
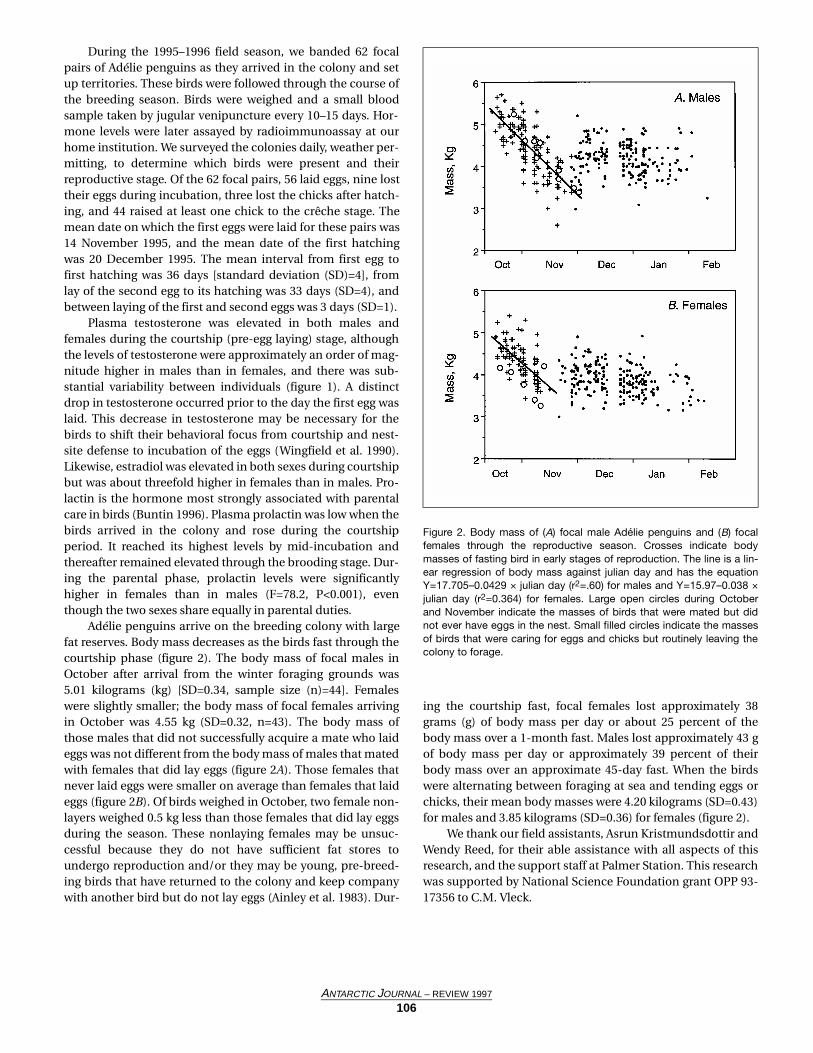
During the 1995–1996 field season, we banded 62 focalpairs of Adélie penguins as they arrived in the colony and setup territories. These birds were followed through the course ofthe breeding season. Birds were weighed and a small bloodsample taken by jugular venipuncture every 10–15 days. Hor-mone levels were later assayed by radioimmunoassay at ourhome institution. We surveyed the colonies daily, weather per-mitting, to determine which birds were present and theirreproductive stage. Of the 62 focal pairs, 56 laid eggs, nine losttheir eggs during incubation, three lost the chicks after hatch-ing, and 44 raised at least one chick to the crêche stage. Themean date on which the first eggs were laid for these pairs was14 November 1995, and the mean date of the first hatchingwas 20 December 1995. The mean interval from first egg tofirst hatching was 36 days [standard deviation (SD)=4], fromlay of the second egg to its hatching was 33 days (SD=4), andbetween laying of the first and second eggs was 3 days (SD=1).
Plasma testosterone was elevated in both males andfemales during the courtship (pre-egg laying) stage, althoughthe levels of testosterone were approximately an order of mag-nitude higher in males than in females, and there was sub-stantial variability between individuals (figure 1). A distinctdrop in testosterone occurred prior to the day the first egg waslaid. This decrease in testosterone may be necessary for thebirds to shift their behavioral focus from courtship and nest-site defense to incubation of the eggs (Wingfield et al. 1990).Likewise, estradiol was elevated in both sexes during courtshipbut was about threefold higher in females than in males. Pro-lactin is the hormone most strongly associated with parentalcare in birds (Buntin 1996). Plasma prolactin was low when thebirds arrived in the colony and rose during the courtshipperiod. It reached its highest levels by mid-incubation andthereafter remained elevated through the brooding stage. Dur-ing the parental phase, prolactin levels were significantlyhigher in females than in males (F=78.2, P<0.001), eventhough the two sexes share equally in parental duties.
Adélie penguins arrive on the breeding colony with largefat reserves. Body mass decreases as the birds fast through thecourtship phase (figure 2). The body mass of focal males inOctober after arrival from the winter foraging grounds was5.01 kilograms (kg) [SD=0.34, sample size (n)=44]. Femaleswere slightly smaller; the body mass of focal females arrivingin October was 4.55 kg (SD=0.32, n=43). The body mass ofthose males that did not successfully acquire a mate who laideggs was not different from the body mass of males that matedwith females that did lay eggs (figure 2A). Those females thatnever laid eggs were smaller on average than females that laideggs (figure 2B). Of birds weighed in October, two female non-layers weighed 0.5 kg less than those females that did lay eggsduring the season. These nonlaying females may be unsuc-cessful because they do not have sufficient fat stores toundergo reproduction and/or they may be young, pre-breed-ing birds that have returned to the colony and keep companywith another bird but do not lay eggs (Ainley et al. 1983). Dur-
ing the courtship fast, focal females lost approximately 38grams (g) of body mass per day or about 25 percent of thebody mass over a 1-month fast. Males lost approximately 43 gof body mass per day or approximately 39 percent of theirbody mass over an approximate 45-day fast. When the birdswere alternating between foraging at sea and tending eggs orchicks, their mean body masses were 4.20 kilograms (SD=0.43)for males and 3.85 kilograms (SD=0.36) for females (figure 2).
We thank our field assistants, Asrun Kristmundsdottir andWendy Reed, for their able assistance with all aspects of thisresearch, and the support staff at Palmer Station. This researchwas supported by National Science Foundation grant OPP 93-17356 to C.M. Vleck.
Figure 2. Body mass of (A) focal male Adélie penguins and (B) focalfemales through the reproductive season. Crosses indicate bodymasses of fasting bird in early stages of reproduction. The line is a lin-ear regression of body mass against julian day and has the equationY=17.705–0.0429 × julian day (r2=.60) for males and Y=15.97–0.038 ×julian day (r2=0.364) for females. Large open circles during Octoberand November indicate the masses of birds that were mated but didnot ever have eggs in the nest. Small filled circles indicate the massesof birds that were caring for eggs and chicks but routinely leaving thecolony to forage.
ANTARCTIC JOURNAL – REVIEW 1997
106
References
Ainley, D.G., R.E. LeResche, and W.J.L. Sladen. 1983. Breeding biologyof the Adélie penguin. Berkeley: University of California Press.
Buntin, J. 1996. Neural and hormonal control of parental behavior inbirds. Advances in the Study of Behavior, 25, 161–213.
Trivelpiece, W.Z., S.G. Trivelpiece, G.R. Geupel, J. Kjelmyr, and N.J.Volkman. 1990. Adélie and chinstrap penguins: Their potential as
monitors of the southern ocean marine ecosystem. In K.R. Kerryand G. Hempel (Eds.), Antarctic ecosystems, ecological change, andconservation. Berlin: Springer-Verlag.
Wingfield, J.C., R.E. Hegner, A.M. Dufty, Jr., and G.F. Ball. 1990. The“challenge hypothesis”: Theoretical implications for patterns oftestosterone secretion, mating systems, and breeding strategies.The American Naturalist, 136, 829–846.
Factors regulating population size and colony formation of Adélie penguins in the Ross Sea
DAVID G. AINLEY, H.T. Harvey and Associates, Alviso, California 95002
ollaborating with biologists from LandCare ResearchNew Zealand, Ltd. (LCRNZ), we conducted the third year
of an investigation into the factors responsible for dramaticgrowth of Adélie penguin (Pygoscelis adeliae) colonies in theRoss Sea during the past two decades (Taylor and Wilson 1990;Blackburn, Taylor, and Wilson 1991). The LCRNZ biologistshad collected certain key data during the past two seasons,anticipating our joining the effort in 1996–1997. With ourarrival into the project, we increased the effort to work simul-taneously at three penguin breeding colonies collecting thesame suite of data at each. We hope to continue this project forat least 5 more years.
We are testing the hypothesis that population growth,which has been greater at the smallest colonies (Taylor andWilson 1990), has resulted from a lessening of pack-ice cover.The smaller pack-ice cover has made food resources moreavailable in a region characterized by concentrated pack icewell through the spring and into the summer; concentratedice cover increases the effort that penguins must expend dur-ing foraging (because they have to walk rather than swim),which, in effect, is a reduction of food availability. In turn, thelessened effort required to find food has led to increasedreproductive success and juvenile and adult survival (or so wehypothesize). We ask: Why has growth disproportionatelyfavored the smaller colonies, given that ample space forexpansion exists at all colonies? Using the Adélie penguin as amodel, this question is of increasing relevance as managersmore and more attempt to restore seabird colonies decimatedby disasters such as oil spills. Which colonies should berestored: The small ones, which may owe their existence toover-flow of breeders (emigrants) from the larger ones, whichhave suffered the greatest impact, or the large colonies, wheregrowth is slow and size presents logistical problems and, likely,little in the way of dramatic results to keep the purse managersinterested?
In our research, we are comparing the colonies in theRoss/Beaufort Island cluster, in ascending order of size: CapeRoyds (about 4,000 pairs), Beaufort Island (45,000), Cape Bird(45,000), and Cape Crozier (180,000). On Beaufort Island andat the three colonies on Ross Island, we are examining rates ofcolony growth determined from annual counts of breedingpairs in aerial photos. These photos have been taken byLCRNZ biologists beginning in 1981. Soon, we will inspectarchived satellite imagery of pack-ice cover during the pen-guin breeding season to look for correspondence in colonygrowth and ice cover. In addition to the colony counts, we also • estimated reproductive success by comparing counts of
chicks in mid-January to number of breeding adults on 1December;
• used radio telemetry to determine overlap in the foragingareas of breeding adults from each colony;
• collected food samples using stomach lavage; • estimated parental foraging effort by determining feeding
frequency and food load size brought to chicks; and• calculated a chick growth index. We also banded a sample of chicks and adults to estimatepostbreeding survival and emigration when we find thesebirds in subsequent years. To complement the diet samples,we also collected tissues from chicks killed by south polarskuas (Catharacta maccormicki); these will be analyzed for thestable isotopes of nitrogen and carbon to determine thetrophic level at which their parents were feeding (low = krill,high = fish). A diet composed of fish is much more energeti-cally rich than one of krill.
The telemetry was conducted by taping small radios tothe backs of 15 adults at the three Ross Island colonies in mid-December. Three times daily until mid-January, we then trian-gulated positions of radios by using directional antennas andreceivers to search simultaneously the waters in sight from thecolonies from vantage points 15–200 meters (m) above sea
C
ANTARCTIC JOURNAL – REVIEW 1997
107
level. For 4 days, we tracked also from Hanson Ridge (600 m)on the west side of McMurdo Sound opposite Capes Royds andBird, for 2 days from the top of Beaufort Island (650 m); andonce from Mount Bird (900 m), we assessed overlap in forag-ing area of birds from Capes Bird and Crozier; and on a 2-dayexcursion of USCGC Polar Sea, we assessed overlap among allcolonies. Owing to the high altitudes and relatively interfer-ence-free air waves, our receiving range was on the order of 35kilometers (km) (as also experienced by Sadleir and Lay 1990);from sea level (ship), range was 5–10 km.
Parental foraging effort was assessed by implanting radiofrequency identification (RFID) tags under the skin of 60–70breeding birds in a breeding group at each colony, encirclingthe colony with a plastic fence and, thus, channeling the birdsto come and go over a computerized scale/RFID tag reader.The weights of birds and tag readings were downloaded dailyinto a laptop computer for analysis.
Highest chick growth rates and greatest breeding successwere experienced by penguins at the smallest colony. Thesebirds also put least effort into procuring food (shortest feedingtrips) and ate food of highest caloric content (highest percent-age of fish in the diet). Data collected during breeding seasonsprevious to 1996–1997 indicated similar trends more oftenthan not. The big question, then, is: If breeding conditions areso wonderful at the smallest colony, why does it remain small?
We will attempt to answer this question with additional yearsof research.
Collaborators in the project were my coworkers, GrantBallard, Sophie Webb, Stephani Zador, and Ian Gaffney; PeterWilson, Kerry Barton, and Brian Karl, LCRNZ; Mike Beigel andNathaniel Polish, Beigel Technology Corp.; Christine Ribic,U.S. Geological Survey–Biological Research, University of Wis-consin; Greg Rau, University of California–Santa Cruz; andNadav Nur, Point Reyes Bird Observatory. We are grateful forthe expert logistical support provided by personnel of theNational Science Foundation, Antarctic Support Associatesand their subcontractors, the New Zealand Antarctic Program,and the USCGC Polar Sea. Our portion of the project wasfunded by National Science Foundation grant OPP 95-26865.
References
Blackburn, N., R.H. Taylor, and P.R. Wilson. 1991. An interpretation ofthe growth of the Adélie penguin rookery at Cape Royds, 1955–1990. New Zealand Journal of Ecology, 15(1), 23–28.
Sadleir, M.F., and K.M. Lay. 1990. Foraging movements of Adélie pen-guins (Pygoscelis adeliae) in McMurdo Sound. In L.S. Davis and J.T.Darby (Eds.), Penguin biology. San Diego: Academic Press.
Taylor, R.H., and P.R. Wilson. 1990. Recent increase and southernexpansion of Adélie penguin populations in the Ross Sea, Antarc-tica, related to climatic warming. New Zealand Journal of Ecology,14(1), 25–29.
Population ecology of Weddell seals (Leptonychotes weddellii) in McMurdo Sound, Antarctica, 1995–1997
THOMAS S. GELATT, Department of Fisheries and Wildlife, University of Minnesota, St. Paul, Minnesota 55108DONALD B. SINIFF, Department of Ecology, Evolution and Behavior, St. Paul, Minnesota 55108
ong-term examinations of the demographic processesacting on the dynamics of a large mammalian vertebrate
are rare throughout the world. It is often necessary to docu-ment these factors over a period of time at least as long as asingle generation in order to recognize any real differences inthe most important members of the population: the breedingadults. An extensive program of tagging and re-sighting Wed-dell seals in Erebus Bay, near McMurdo Sound, Antarctica, car-ried out by the Universities of Minnesota and Alaska–Fairbanks since the early 1970s, has permitted in-depth analy-ses of these processes. This work continued in the 1995–1996and 1996–1997 field seasons with the primary objectives ofupdating the extensive database by marking all of the new-born pups and performing weekly censuses within the studyarea extending from Scott Base to Cape Evans, McMurdoSound. In addition, the continued monitoring of the survival
of individual seals sampled in the early 1990s was requested topermit follow-up investigations by researchers at the Univer-sity of Alaska.
We used Jolly–Seber mark-recapture functions to estimatethe Weddell population in the area by comparing the ratios ofmarked seals seen in consecutive censuses. These censuseshave revealed that the population has remained essentiallystable since the last thorough analyses in the mid-1980s (Testaand Siniff 1987). Likewise, the number of pups born annuallyappears to have leveled out over the previous 14 years.
Our seasons extended from 14 October to 3 Decemberand 10 October to 10 January in 1995–1996 and 1996–1997,respectively. The first pup was tagged on 18 October in bothseasons, and in total, 386 pups were tagged in 1995 and 380 in1996. Two helicopter flights were used in each season to visitthe isolated population of seals at White Island approximately
L
ANTARCTIC JOURNAL – REVIEW 1997
108
15 kilometers southeast of McMurdo Station. This populationis surrounded by the Ross Ice Shelf and recent moleculargenetic work suggests that some inbreeding may be occurring(Fleischer, Perry, and Testa 1995, unpublished data). Eighttagged adult females were seen in each season; four pups weretagged in 1995 and eight in 1996. One pup in 1995 and three in1996 appeared to have died soon after birth. Tissue sampleswere collected for further genetic analyses and an entire car-cass was collected in 1995 for examination at the University ofAlaska. Blood samples were collected from pups of variousages, within the study area, in both seasons, for baseline inves-tigations of trace metal and vitamin concentrations.
Blood and tissue samples were also collected in 1996 fromall seals at the Big Razorback colony for preliminary workexamining the mating system of Weddell seals. We are utilizingrecent advances in molecular genetics, which now permitindividual identification. Information obtained from the long-term database has shown that Weddell seals have a relativelyhigh fidelity for returning to the study area in subsequentyears to breed and give birth. All breeding occurs under the iceand has been observed only once via remote cameras (Clineand Siniff 1971). By sampling mother-pup pairs soon after thepups’ birth, however, and comparing these to the males in thesame area the previous year, we hope to shed some light onthe breeding system and obtain good estimates of male repro-ductive success as estimated by number of pups produced.The database provides information on maternal lines from thetagging histories of known-age breeding females. Using acombination of molecular genetics, behavioral observations,radio telemetry, and paternity analyses, we have initiated aproject to• develop techniques to extract DNA from blood and tissue
samples, • confirm mother-pup relationships using microsatellite
primers, and
• measure male reproductive success from paternity analy-ses and correlate success with territorial activity.
Preliminary analyses have confirmed the first two objectives.Research is continuing on the third.
In January 1997, we collaborated with scientists fromHubbs Sea World Research Institute to collect blood samplesfor blood parasite and chemistry analyses. Additionally, weattached four satellite-linked radio transmitters to weanedpups to gather information on the movements of these indi-viduals after the pupping season. Annual census records onindividual seals tagged as pups in the study area have shownthat nonreproductive animals tend to leave the study area,only to return again when they are reproductively active. Ourobjective was to track some seals in their first year to comparetheir movements to the annual ice break-up and to the knownrange of adult seals. Two of the four transmitters were still col-lecting locations in September of 1997, and one continued totransmit until early November.
This research was supported by National Science Founda-tion grant OPP 94-20818 to D.B. Siniff. M. Cameron, R. Jenson,D. Monson, B. Stewart, and P. Yochem provided field assis-tance.
References
Cline, D.R., and D.B. Siniff. 1971. Underwater copulation of the Wed-dell seal. Journal of Mammalogy, 52(1), 216–218.
Fleischer, R.C., E.A. Perry, and J.W. Testa. 1995. Do low genetic varia-tion and inbreeding relate to low fecundity in a small, isolated pop-ulation of antarctic Weddell seals? [Abstract presented at 11thbiennial conference on the biology of marine mammals, Orlando,Florida, December 1995.]
Testa, J.W., and D.B. Siniff. 1987. Long-term population dynamics ofWeddell seal (Leptonychotes weddellii) in McMurdo Sound, Antarc-tica. Ecological Monographs, 57, 149–165.
ANTARCTIC JOURNAL – REVIEW 1997
109