Embed Size (px)
Citation preview

| MA
RIN
E F
RO
NT
IER
@ U
niKL
MIMET Technical Bulletin Volume 1 (2) 2010
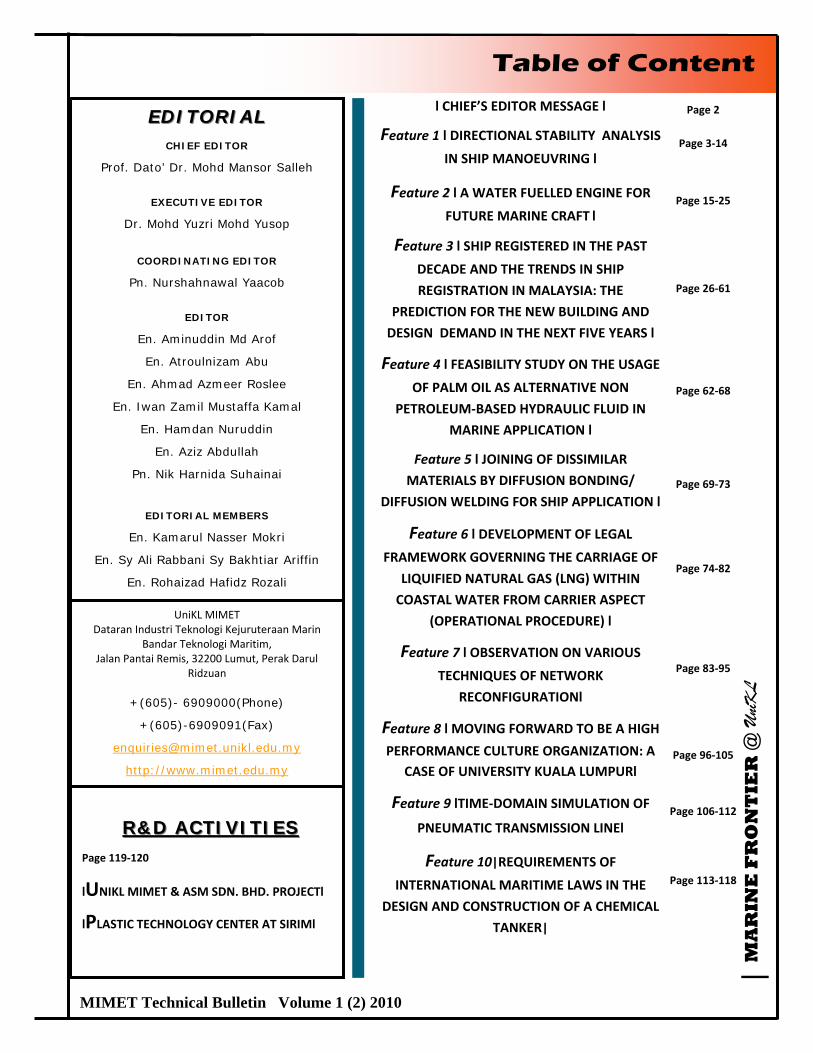
l CHIEF’S EDITOR MESSAGE l Page 2
Feature 1 l DIRECTIONAL STABILITY ANALYSIS IN SHIP MANOEUVRING l
Page 3‐14
Feature 2 l A WATER FUELLED ENGINE FOR
FUTURE MARINE CRAFT l Page 15‐25
Feature 3 l SHIP REGISTERED IN THE PAST DECADE AND THE TRENDS IN SHIP
REGISTRATION IN MALAYSIA: THE
PREDICTION FOR THE NEW BUILDING AND
DESIGN DEMAND IN THE NEXT FIVE YEARS l
Page 26‐61
Feature 4 l FEASIBILITY STUDY ON THE USAGE OF PALM OIL AS ALTERNATIVE NON
PETROLEUM‐BASED HYDRAULIC FLUID IN
MARINE APPLICATION l
Page 62‐68
Feature 5 l JOINING OF DISSIMILAR
MATERIALS BY DIFFUSION BONDING/
DIFFUSION WELDING FOR SHIP APPLICATION l
Page 69‐73
Feature 6 l DEVELOPMENT OF LEGAL
FRAMEWORK GOVERNING THE CARRIAGE OF
LIQUIFIED NATURAL GAS (LNG) WITHIN
COASTAL WATER FROM CARRIER ASPECT
(OPERATIONAL PROCEDURE) l
Page 74‐82
Feature 7 l OBSERVATION ON VARIOUS TECHNIQUES OF NETWORK
RECONFIGURATIONl
Page 83‐95
Feature 8 l MOVING FORWARD TO BE A HIGH
PERFORMANCE CULTURE ORGANIZATION: A
CASE OF UNIVERSITY KUALA LUMPURl Page 96‐105
Feature 9 lTIME‐DOMAIN SIMULATION OF
PNEUMATIC TRANSMISSION LINEl Page 106‐112
Feature 10|REQUIREMENTS OF
INTERNATIONAL MARITIME LAWS IN THE
DESIGN AND CONSTRUCTION OF A CHEMICAL
TANKER|
Page 113‐118
EDITORIALEDITORIAL CHIEF EDITOR
Prof. Dato’ Dr. Mohd Mansor Salleh
EXECUTIVE EDITOR
Dr. Mohd Yuzri Mohd Yusop
COORDINATING EDITOR
Pn. Nurshahnawal Yaacob
EDITOR
En. Aminuddin Md Arof
En. Atroulnizam Abu
En. Ahmad Azmeer Roslee
En. Iwan Zamil Mustaffa Kamal
En. Hamdan Nuruddin
En. Aziz Abdullah
Pn. Nik Harnida Suhainai
EDITORIAL MEMBERS
En. Kamarul Nasser Mokri
En. Sy Ali Rabbani Sy Bakhtiar Ariffin
En. Rohaizad Hafidz Rozali
UniKL MIMET Dataran Industri Teknologi Kejuruteraan Marin
Bandar Teknologi Maritim, Jalan Pantai Remis, 32200 Lumut, Perak Darul
Ridzuan
+(605)- 6909000(Phone)
+(605)-6909091(Fax)
http://www.mimet.edu.my
R&D ACTIVITIESR&D ACTIVITIES Page 119‐120
lUNIKL MIMET & ASM SDN. BHD. PROJECTl
lPLASTIC TECHNOLOGY CENTER AT SIRIMl
PLASTIC TECHNOLOGY

| MA
RIN
E F
RO
NT
IER
@ U
niKL
2 MIMET Technical Bulletin Volume 1 (2) 2010
Dear Readers,
Welcome to the second issue of Marine Frontier@UniKL!
We are happy that we are keeping to our targeted publication plan i.e the second issue is to be published in
October 2010 after the first issue in July 2010. It shows the strong commitment of the academic staff of MI‐
MET towards research and consultancy activities. I would like to congratulate the Editorial group under the
able leadership of coordinating editor, Pn. Nurshahnawal Yaacob for the excellent work of getting the second
issue out on time.
As the journey progresses, we are now going
to embark on improving quality, after getting
the quantity! We will improve as we go along
our journey so that “Marine Frontier@UniKL”
will be a quality journal after a full year of pub‐
lication. We will be looking at clustering the
articles under different research areas grouped
within the Departments or sections of MIMET.
We are going to cast our net wider for research
articles from within Malaysian Universities and
research bodies or even international. Anything
related to maritime studies including education
is within our ambit and are welcome.
I am glad to inform that we have already ob‐
tained our ISSN Number recently: ISSN 2180‐
4907. This means that our Marine Fron‐
tier@UniKL can and will be distributed widely.
We would like to receive feedback from our
dear readers so that we can keep improving
our technical bulletin. Intending authors are
welcome to send in contributions. A guide for
authors is also given at the end of this issue.
Once again, congratulations to the Editorial
group for a job well done.
Happy Reading!
Mohd Mansor Salleh Chief Editor

| MA
RIN
E F
RO
NT
IER
@ U
niKL
3 MIMET Technical Bulletin Volume 1 (2) 2010
Feature Article 1
DIRECTIONAL STABILITY ANALYSIS IN SHIP MANOEUVRING
ASSOC. PROF. IR MD SALIM KAMIL*
Department of Marine Design Technology
Malaysian Institute of Marine Engineering Technology, Universiti Kuala Lumpur
Received: 20 May 2010; Revised: 8 July 2010 ; Accepted: 7 October 2010
ABSTRACT
The directional stability analysis method presented is useful for solving directional instability problems of a vessel during
the feasibility studies and design stage of a new construction or for operational ships. The governing equations and the
influences of trim, rudder and skeg on the stability criteria are briefly derived. The computation of the analysis is per‐
formed using a simple program written in FORTRAN. Extracts from the computation output based on a known ship’s data
are shown. One could provide recommendations for the solution of the directional instability problem of the vessel from
the typical output. Apart from the stability criteria, a measure of manoeuvrability could also be investigated based on
the turning radii evaluated.
Keyword: Directional stability, manoeuvring
*Corresponding Author:
Assoc. Prof. Ir Md Salim Kamil CEng, CMarEng, PEng, FIMarEST, MIEM, was once the Dean and Head of Campus of Universiti Kuala Lumpur Malaysian Insti‐
tute of Marine Engineering Technology and a retired Commander of the Royal Malaysian Navy. He graduated with an MSc in Naval Architecture (London
University ), a BSc (Hons) in Naval Architecture and Ocean Engineering (Glasgow University), a Diploma in Naval Architecture (University College London)
and a Diploma in Mechanical Engineering (Universiti Teknologi Malaysia). He is currently pursuing a PhD course at St Petersburg State Marine Marine Tech‐
nical University, Russia.
Email: [email protected] Tel:+605‐6909000
INTRODUCTION
Manoeuvring performance is one of the
many technicalities normally checked by the
ship designers during the initial stage of the
design of a new construction. Corrections of
directional instability can be made during or
after the model tests phase. The standard
tests on the particular free model are neces‐
sary to be carried out to determine the ap‐
propriate manoeuvring derivatives. The stan‐
dard tests to determine the manoeuvring
derivatives carried out utilizing models in
special manoeuvring tanks are oblique, ro‐
tating arm and planar motion mechanism
tests. The planar motion mechanism tests
which are necessary to be conducted for this
purpose include the pure sway and pure yaw
tests. The options available to solve the in‐
stability problem without changing the ship
hull form include altering the design trim,
addition of a skeg, changing the rudder size
or the rudder effectiveness and any combi‐
nation of the above options.
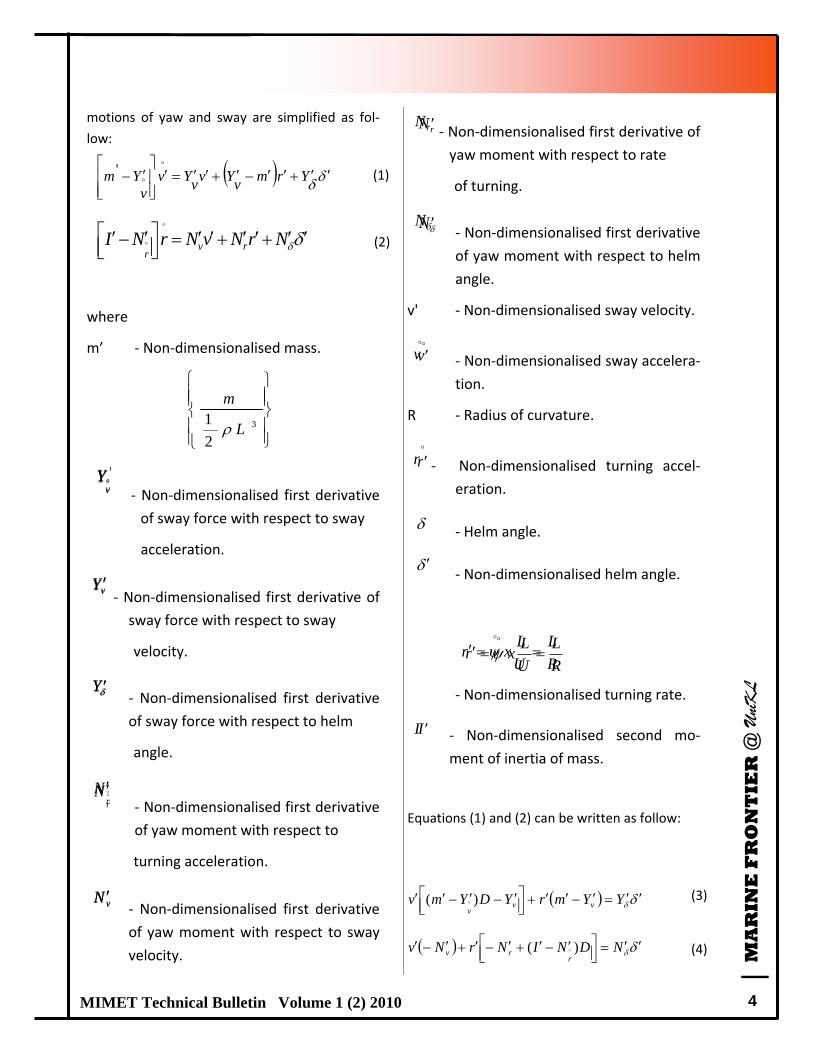
The Directional Stability Criteria
The derivatives of the linearised non‐
dimensionalised equations of yaw and sway
motions are derived based on the Taylor’s
Theorem. Taking into consideration of small
deviation or variation, the roll, surge and
heave motions and the second derivatives
are neglected. The linearised equations of
| MA
RIN
E F
RO
NT
IER
@ U
niKL
4 MIMET Technical Bulletin Volume 1 (2) 2010
motions of yaw and sway are simplified as fol‐
low:
where
m’ ‐ Non‐dimensionalised mass.
‐ Non‐dimensionalised first derivative
of sway force with respect to sway
acceleration.
‐ Non‐dimensionalised first derivative of
sway force with respect to sway
velocity.
‐ Non‐dimensionalised first derivative
of sway force with respect to helm
angle.
‐ Non‐dimensionalised first derivative
of yaw moment with respect to
turning acceleration.
‐ Non‐dimensionalised first derivative
of yaw moment with respect to sway
velocity.
‐ Non‐dimensionalised first derivative of
yaw moment with respect to rate
of turning.
‐ Non‐dimensionalised first derivative
of yaw moment with respect to helm
angle.
v' ‐ Non‐dimensionalised sway velocity.
‐ Non‐dimensionalised sway accelera‐
tion.
R ‐ Radius of curvature.
‐ Non‐dimensionalised turning accel‐
eration.
‐ Helm angle.
‐ Non‐dimensionalised helm angle.
‐ Non‐dimensionalised turning rate.
‐ Non‐dimensionalised second mo‐
ment of inertia of mass.
Equations (1) and (2) can be written as follow:
Yv'
vY
Y
r
N
vN
Nr
N
v
r
R
L
U
Lxr
I I
R
L
U
Lxr
r
v
N
Nr
vN
r
N
Y
vY
Yv'
Yrmv
Yvv
Yvv
Ym ' (1)
NrNvNrNI rvr
(2)
3
2
1L
m
YYmrYDYmv vv
v)( (3)
NDNINrNv
rrv )( (4)

| MA
RIN
E F
RO
NT
IER
@ U
niKL
5 MIMET Technical Bulletin Volume 1 (2) 2010
Equation (5) is a second order equation in the
form of;
(AD2 + BD + C) x = 0, x = v or r
For a ship, A and B are always positive, there‐
fore the directional stability criteria requires C
> 0. Hence,
Equation (6) can be written as follow to show
the relationship between the levers of sway
and yaw forces in the directional stability cri‐
teria:
Where
‐ Non‐dimensionalised first deriva‐
tive of sway force with respect to
turning rate.
Effect of Trim, Rudder and Skeg Effectiveness
The effects on the hull derivatives due to
trim, rudder and skeg effectiveness are as fol‐
low;
Due to Trim; Due to Trim;
YrYr
(5)
(6)
02 vvrvOvOrOO YmNNYDIYmNDIm
The determinant from equations (3) and (4) above equals to zero for zero control input, that is:
v
o Ymm '
r
'o NII
0 mYNNY vvrv
0
v
v
r
r
Y
N
mY
N(7)

| MA
RIN
E F
RO
NT
IER
@ U
niKL
6 MIMET Technical Bulletin Volume 1 (2) 2010

| MA
RIN
E F
RO
NT
IER
@ U
niKL
7 MIMET Technical Bulletin Volume 1 (2) 2010
Table 1 ‐ Results of Stability Criteria and Manoeuvrability with Effects of Trims, Rudder and
Skeg Effectiveness
Trim Rudder
Effectivenes
Skeg
Effectivenes
Y’R N’R Y’V N’V Directional
Stability Criteria Turning
Radius(m)
‐0.50 1.00 0.00 0.001 ‐0.001 ‐0.005 ‐0.002 ‐0.107 304.938 ‐0.50 1.00 0.5 0.001 ‐0.001 ‐0.005 ‐0.002 ‐0.084 241.076 ‐0.50 1.00 1.00 0.001 ‐0.001 ‐0.005 ‐0.002 ‐0.061 177.378 ‐0.50 1.00 1.50 0.001 ‐0.001 ‐0.005 ‐0.001 ‐0.039 113.844 ‐0.50 1.00 2.00 0.001 ‐0.001 ‐0.005 ‐0.001 ‐0.017 50.473 ‐0.50 1.00 2.50 0.001 ‐0.001 ‐0.006 ‐0.001 0.004 ‐12.735 ‐0.50 1.00 3.00 0.001 ‐0.001 ‐0.006 ‐0.001 0.025 ‐75.781 ‐0.50 1.25 0.00 0.001 ‐0.001 ‐0.005 ‐0.002 ‐0.082 187.404 ‐0.50 1.25 0.50 0.001 ‐0.001 ‐0.005 ‐0.002 ‐0.059 136.384 ‐0.50 1.25 1.00 0.001 ‐0.001 ‐0.005 ‐0.001 ‐0.037 85.495 ‐0.50 1.25 1.50 0.001 ‐0.001 ‐0.005 ‐0.001 ‐0.015 34.738 ‐0.50 1.25 2.00 0.001 ‐0.001 ‐0.006 ‐0.001 0.007 ‐15.889 ‐0.50 1.25 2.50 0.001 ‐0.001 ‐0.006 ‐0.001 0.028 ‐66.387 ‐0.50 1.25 3.00 0.001 ‐0.001 ‐0.006 ‐0.001 0.049 ‐116.755 ‐0.50 1.50 0.00 0.001 ‐0.001 ‐0.005 ‐0.002 ‐0.057 109.047 ‐0.50 1.50 0.50 0.001 ‐0.001 ‐0.005 ‐0.001 ‐0.034 66.589 ‐0.50 1.50 1.00 0.001 ‐0.001 ‐0.005 ‐0.001 ‐0.012 24.240 ‐0.50 1.50 1.50 0.001 ‐0.001 ‐0.006 ‐0.001 0.009 ‐18.000 ‐0.50 1.50 2.00 0.001 ‐0.001 ‐0.006 ‐0.001 0.030 ‐60.131 ‐0.50 1.50 2.50 0.001 ‐0.001 ‐0.006 ‐0.001 0.051 ‐102.155 ‐0.50 1.50 3.00 0.001 ‐0.001 ‐0.006 ‐0.001 0.072 ‐144.071 ‐0.50 1.75 0.00 0.001 ‐0.001 ‐0.005 ‐0.001 ‐0.032 53.079 ‐0.50 1.75 0.50 0.001 ‐0.001 ‐0.005 ‐0.001 ‐0.010 16.736 ‐0.50 1.75 1.00 0.001 ‐0.001 ‐0.006 ‐0.001 0.012 ‐19.513 ‐0.50 1.75 1.50 0.001 ‐0.001 ‐0.006 ‐0.001 0.033 ‐55.669 ‐0.50 1.75 2.00 0.001 ‐0.001 ‐0.006 ‐0.001 0.054 091.733 ‐0.50 1.75 2.50 0.001 ‐0.001 ‐0.006 ‐0.001 0.074 ‐127.703 ‐0.50 1.75 3.00 0.001 ‐0.001 ‐0.006 ‐0.001 0.095 ‐163.582 ‐0.50 2.00 0.00 0.001 ‐0.001 ‐0.005 ‐0.001 ‐0.008 11.102 ‐0.50 2.00 0.50 0.001 ‐0.001 ‐0.006 ‐0.001 0.014 ‐20.654 ‐0.50 2.00 1.00 0.001 ‐0.001 ‐0.006 ‐0.001 0.035 ‐52.329 ‐0.50 2.00 1.50 0.001 ‐0.001 ‐0.006 ‐0.001 0.056 ‐83.922 ‐0.50 2.00 2.00 0.001 ‐0.001 ‐0.006 ‐0.001 0.077 ‐115.434 ‐0.50 2.00 2.50 0.001 ‐0.001 ‐0.006 ‐0.001 0.097 ‐146.865 ‐0.50 2.00 3.00 0.002 ‐0.001 ‐0.006 ‐0.001 0.118 ‐178.215 ‐0.50 2.25 0.00 0.001 ‐0.001 ‐0.006 ‐0.001 0.016 ‐21.546 ‐0.50 2.25 0.50 0.001 ‐0.001 ‐0.006 ‐0.001 0.038 ‐49.735 ‐0.50 2.25 1.00 0.001 ‐0.001 ‐0.006 ‐0.001 0.059 ‐77.852 ‐0.50 2.25 1.50 0.001 ‐0.001 ‐0.006 ‐0.001 0.079 ‐105.896 ‐0.50 2.25 2.00 0.001 ‐0.001 ‐0.006 ‐0.001 0.100 ‐133.868 ‐0.50 2.25 2.50 0.002 ‐0.001 ‐0.006 ‐0.001 0.120 ‐161.768 ‐0.50 2.25 3.00 0.002 ‐0.001 ‐0.006 ‐0.001 0.140 ‐189.597 ‐0.50 2.50 0.00 0.001 ‐0.001 ‐0.006 ‐0.001 0.040 ‐47.665 ‐0.50 2.50 0.50 0.001 ‐0.001 ‐0.006 ‐0.001 0.061 ‐73.000 ‐0.50 2.50 1.00 0.001 ‐0.001 ‐0.006 ‐0.001 0.082 ‐98.270 ‐0.50 2.50 1.50 0.001 ‐0.001 ‐0.006 ‐0.001 0.102 ‐123.475 ‐0.50 2.50 2.00 0.002 ‐0.001 ‐0.006 ‐0.001 0.123 ‐148.615 ‐0.50 2.50 2.50 0.002 ‐0.001 ‐0.006 ‐0.001 0.143 ‐173.691 ‐0.50 2.50 3.00 0.002 ‐0.001 ‐0.006 ‐0.001 0.163 ‐198.702

| MA
RIN
E F
RO
NT
IER
@ U
niKL
8 MIMET Technical Bulletin Volume 1 (2) 2010
The Program
The computation was performed using a simple program written in FORTRAN or it can also be cal‐culated using COTS spread sheet software;
C THIS PROGRAM CALCULATES DIRECTIONAL
C STABILITY CRITERIA AND NON‐DIMENSIONAL
C TURNING RADII
REAL NVB
REAL NRB
REAL M
REAL NV(7,7,7)
REAL NR(7,7,7)
REAL NVR(7)
REAL NRR(7)
REAL NRS(7)
REAL NVS(7)
REAL NVT(7)
REAL NRT(7)
REAL NDEL(7)
DIMENSION TR(7)
DIMENSION REFF(7)
DIMENSION SEFF(7)
DIMENSION YVR(7)
DIMENSION YVS(7)
DIMENSION YRS(7)
DIMENSION YVT(7)
DIMENSION YRT(7)
DIMENSION YDEL(7)
DIMENSION YRR(7)
DIMENSION YV(7,7,7)
DIMENSION YR(7,7,7)
DIMENSION S(7,7,7)
DIMENSION RAD(7,7,7)
L=115
T=3.92
DISP=3708
XR=50
XS=45
RO=1.023
DEL=25*3.1416/180
YVB=‐.00495
YRB=.000973
NRB=‐.000754
NVB=‐.00165
CLR=.00045
CLS=CLR/2
M=2*DISP/(RO*L**3)
XRR=XR/L
XSS=XS/L
WRITE(1,*)’RESULTS OF STABILITY CRITERIA
AND MANOEUVRABILITY
$ WITH EFFECTS OF TRIM, RUDDER AND SKEG
EFFECTIVENESS’
WRITE(1,*)
WRITE(1,*)’ TRIM REFF SEFF YR
NR YV NV
$ STAB T/RAD(m)’
WRITE(1,*)
DO 10 I=1,7
TR(I)=(I‐3)/4.0
YVT(I)=YVB*(1+(2*TR(I)/(3*T)))
YRT(I)=YRB*(1+(.8*TR(I)/T))
NVT(I)=NVB*(1‐(.27*TR(I)/(T*NVB/YVB)))
NRT(I)=NRB*(1+(.3*TR(I)/T))

| MA
RIN
E F
RO
NT
IER
@ U
niKL
9 MIMET Technical Bulletin Volume 1 (2) 2010
DO 20 J=1,7
REFF(J)=1+((J‐1)*1.5/6.0)
YDEL(J)=CLR*REFF(J)
YVR(J)=‐YDEL(J)
YRR(J)=XRR*YDEL(J)
NDEL(J)=‐XRR*YDEL(J)
NVR(J)=XRR*YDEL(J)
NRR(J)=‐XRR**2*YDEL(J)
DO 30 K=1,7
SEFF(K)=(K‐1)/2.0
YVS(K)=‐CLS*SEFF(K)
YRS(K)=‐XSS*YVS(K)
NVS(K)=‐XSS*YVS(K)
NRS(K)=XSS**2*YVS(K)
NV(I,J,K)=NVT(I)+NVR(J)+NVS(K)
NR(I,J,K)=NRT(I)+NRR(J)+NRS(K)
YV(I,J,K)=YVT(I)+YVR(J)+YVS(K)
YR(I,J,K)=YRT(I)+YRR(J)+YRS(K)
S(I,J,K)=(NR(I,J,K)/(YR(I,J,K)‐M))‐(NV(I,J,K)/YV
(I,J,K))
RAD(I,J,K)=(L*((YV(I,J,K)*NR(I,J,K))‐(NV(I,J,K)*
(YR(I,J,K)
$ ‐M))))/(DEL*((NV(I,J,K)*YDEL(J))‐(YV(I,J,K)
*NDEL(J))))
WRITE(1,5)TR(I),REFF(J),SEFF(K),YR(I,J,K),NR
(I,J,K)
$ ,YV(I,J,K),NV(I,J,K),S(I,J,K),RAD(I,J,K)
5 FORMAT(1X,F5.2,2X,F5.2,2X,F5.2,X,
F6.3,2X,F6.3,2X,F6.3,2X
$ ,F6.3,2X,F6.3,2X,F8.3
30 CONTINUE
20 CONTINUE
10 CONTINUE
STOP
END
Ship’s Data
The above program was run based on the
following ship’s input data as shown in Table 2;
Table 2: Ship’s input data
Distance of rudder center from
Longitudinal Centre Gravity
(LCG), a
50m aft of LCG
Distance of skeg center from
LCG, b 45m aft of LCG
Length between Perpendiculars
(LBP), L 115m
Draught, T 3.92m
Longitudinal position of the
centre of buoayancy, LCB ‐5.0m
Density, ρ 1.023 tonnes/m3
Trim, t ‐0.5m < t < 1.0m
Rudder Effectiveness, Reff 1.0 < (δCL/δα)r < 2.5
Skeg Effectiveness, Seff 0.0 < (δCL/δα)s < 3.0
Non‐dimensionalised first
derivative of sway force of the
bare hull with respect to sway
velocity, 0vY
‐0.00495
Non‐dimensionalised first
derivative of sway force of the
bare hull with respect to turning
rate, 0rY
0.000973
Non‐dimensionalised first
derivative of yaw moment of
the bare hull with respect to
sway velocity, 0vN
‐0.00165
Non‐dimensionalised first
derivative of yaw moment of
the bare hull with respect to
rate of turning, 0rN
‐0.000754
Rudder effectiveness factor,
(δCL/δα)r 0.00045
Skeg effectiveness factor, (δCL/
δα)s (δCL/δα)r/2
Displacement 3708 tonnes

| MA
RIN
E F
RO
NT
IER
@ U
niKL
10 MIMET Technical Bulletin Volume 1 (2) 2010
Computation Output
Extracts from the computation output based on the ship’s data input for t = ‐0.5, 1.0 < Reff < 2.5 and 0.0 <
Seff < 3.0 are given below;
Directional Stability
00.5
11.5
22.5
33.5
-0.057 -0.034 -0.012 0.009 0.03 0.051 0.072
Directional Stability Criteria
Ske
g E
ffec
tive
nes
st=-0.5, Reff=1.5
Directional Stability
0
0.5
1
1.5
2
2.5
3
3.5
-0.032 -0.01 0.012 0.033 0.054 0.074 0.095
Directional Stability Criteria
Ske
g E
ffec
tive
nes
s
t=-0.5, Reff=1.75
(a)
(b)
Directional Stability
0
0.51
1.5
2
2.53
3.5
-0.008 0.014 0.035 0.056 0.077 0.097 0.118
Directional Stability Criteria
Ske
g E
ffec
tive
nes
s
t=-0.5, Reff=2
(c)

| MA
RIN
E F
RO
NT
IER
@ U
niKL
11 MIMET Technical Bulletin Volume 1 (2) 2010
(d)
(e)
Figure 1: Directional Stability (a) at t = ‐0.5, Reff = 1.5 (b) at t = ‐0.5, Reff = 1.75 (c)
at t = ‐0.5, Reff = 2 (d) at t = ‐0.5, Reff = 2.25 (e) at t = ‐0.5, Reff = 2.5
Directional Stability
0
0.51
1.52
2.53
3.5
0.016 0.038 0.059 0.079 0.1 0.12 0.14
Directional Stability Criteria
Ske
g E
ffec
tive
nes
s
t=-0.5, Reff=2.25
Directional Stability
0
0.51
1.5
2
2.53
3.5
0.04 0.061 0.082 0.102 0.123 0.143 0.163
Directional Stablity Criteria
Ske
g E
ffec
tive
nes
s
t=-0.5, Reff=2.5

| MA
RIN
E F
RO
NT
IER
@ U
niKL
12 MIMET Technical Bulletin Volume 1 (2) 2010
Turning Circle Radius
0
0.51
1.5
2
2.53
3.5
304.94 241.08 177.38 113.84 50.47 -12.74 -75.78
Turning Circle Radius (m)
Ske
g E
ffec
tive
nes
s
t=-0.5, Reff=1
Turning Circle Radius
0
0.51
1.5
2
2.53
3.5
187.40 136.38 85.50 34.74 -15.89 -66.39 -116.76
Turning Circle Radius (m)
Ske
g E
ffec
tive
nes
s
t=-0.5, Reff=1.25
Turning Circle Radius
0
0.5
1
1.52
2.5
3
3.5
109.05 66.59 24.24 -18.00 -60.13 -102.16 -144.07
Turning Circle Radius (m)
Ske
g E
ffec
tive
nes
s
t=-0.5, Reff=1.5
(a)
(c)
(b)

| MA
RIN
E F
RO
NT
IER
@ U
niKL
13 MIMET Technical Bulletin Volume 1 (2) 2010
(d)
(f)
(e)
Turning Circle Radius
0
0.51
1.5
2
2.53
3.5
53.08 16.74 -19.51 -55.67 91.73 -127.70 -163.58
Turning Circle Radius (m)
Ske
g E
ffec
tive
nes
s
t=-0.5, Reff=1.75
Turning Circle Radius
0
0.5
1
1.52
2.5
3
3.5
11.10 -20.65 -52.33 -83.92 -115.43 -146.87 -178.22
Turning Circle Radius (m)
Ske
g E
ffec
tive
nes
s
t=-0.5, Reff=2
Turning Circle Radius
0
0.51
1.52
2.53
3.5
-21.55 -49.74 -77.85 -105.90 -133.87 -161.77 -189.60
Turning Circle Radius (m)
Ske
g E
ffec
tive
nes
s
t=-0.5, Reff=2.25

| MA
RIN
E F
RO
NT
IER
@ U
niKL
14 MIMET Technical Bulletin Volume 1 (2) 2010
Figure 2: Turning Circle Radius (a) at t = ‐0.5, Reff = 1 (b) at t = ‐0.5, Reff = 1.25 (c)
at t = ‐0.5, Reff = 1.5 (d) at t = ‐0.5, Reff = 1.75 (e) at t = ‐0.5, Reff = 2 (f) at t = ‐0.5,
Reff = 2.25 (g) at t = ‐0.5, Reff = 2.5
(g)
Turning Circle Radius
0
0.51
1.52
2.53
3.5
-47.67 -73.00 -98.27 -123.48 -148.62 -173.69 -198.70
Turning Circle Radius (m)
Ske
g E
ffec
tive
nes
s
t=-0.5, Reff=2.5
Conclusion
It can be concluded that the ship’s directional
stability improves as the trim moves towards
positive values and so do with increasing rudder
and skeg effectiveness. As the ship trimmed
more by the stern (positive trims) and with
increasing rudder and skeg effectiveness, the
wetted surface area of the ship becomes larger.
Therefore by virtue of its position, the centroid
of the wetted surface shifts towards aft, the
directional stability increases. The magnitude of
the stability criteria is an indicative of the degree
of the directional stability. The ship is more
directionally stable with numerically higher
values of stability criteria. The negative values of
the stability criteria indicate that the ship is
directionally unstable. The lower the negative
values of the stability criteria, the more unstable
directionally the ship is. It can be deduced that
the ship manoeuvrability increases with
increasing directional stability, turning radius,
positive trim, rudder effectiveness and skeg
effectiveness.
References:
1. R.K Burcher (1971) Development in Ship Manoeuvrability,
Royal Institutions of Naval Architects (RINA).
2. Inou, Hirano and Kajima (1981) Hydrodynamic Derivatives
on Ship Manoeuvring, International Shipbuilding
Progress,
Vol. 20.
3. E. C Tupper (2004) Introduction to Naval Architecture, 4th
Edition, 253‐261.
4. K.J Rawson and E.C Tupper (2001) Basic Ship Theory, Vol.
2, 5th Edition, 539‐578
5. Toshio ISEKI (2005) Ship Manoeuvrability, Theory and
Assessment, Advanced Topics for Marine Technology by,
Tokyo University of Science and Technology, Japan.
6. Eda H. (1972‐1979) Directional Stability and Control of
Ships in Waves, Journal of Ship Research, Vol. 16, Issue
No. 3, Society of Naval Architects and Marine
Engineers, 205‐218
7. N. Minorsky (2009) Directional Stability of Automatically
Steered Bodies, Journal of the American Society of the
Naval Engineers, Vol. 34, Issue 2, 280‐309 8. Haw L. Wong, Cross Flow Computation for Prediction of Ship Directional Stability, Hydrodynamics, Theory and Application, Department of Mechanical Engineering, University of Hong Kong, Vol. 1, 285‐290
9. B. V. Korvin‐Kroukovsky (2009) Directional Stability and Steering of Ships in Oblique Waves, Journal of the American Society of the Naval Engineers, Vol. 73, Issue 3, 483‐487.
10. Ship Factors that affect Manoeuvring, SHIPS SALES.COM

| MA
RIN
E F
RO
NT
IER
@ U
niKL
15 MIMET Technical Bulletin Volume 1 (2) 2010
Feature Article 2
A WATER FUELLED ENGINE FOR FUTURE MARINE CRAFT
AZMAN ISMAIL*, BAKHTIAR ARIFF BAHARUDIN
Department of Marine Construction and Maintenance Technology
Malaysian Institute of Marine Engineering Technology, Universiti Kuala Lumpur
Received: 23 May 2010; Revised: 19 July 2010 ; Accepted: 22 July 2010
ABSTRACT
The search for alternative energy is active in replacing the depletion of the reserve petroleum. The increase of oil price
makes it more critical and suitable for new technology development. Therefore there is a need to develop a new and cost
‐saving technology especially for marine applications that meet severe regulations for environmental protection. The
need for environment‐friendly engines is high to cater to this requirement nowadays. For whatever application, the cost
competitiveness remains the most important. The water‐fuelled engine is the best solution. Water is available every‐
where and no need to worry about the rising oil price. While reducing emissions, it can save money and time, give more
profit and at the same time keeping environment clean and preventing global warming.
Keyword: Alternative energy, water fuel, hydrogen, electrolysis, environmental‐friendly.
*Corresponding Author: Tel.: +605‐6909055
Email Address: [email protected]
INTRODUCTION
The price of oil keeps increasing but the re‐
serve oil keeps reducing and surely one day it
will diminish. Therefore more research and
development are needed to explore for new
alternative energy to run the ships effectively
at lower cost with abundant supply.
Solar can be used as alternative sources, but
there will be no light during night, therefore it
cannot guarantee a constant supply. If wind is
used, sometimes it blows well but sometimes
it does not blow so much. Sometimes it can
cause havoc (typhoon). In addition, the same
problem can happen if using current (water/
wave) as energy sources. The water itself can
be used as the main source of energy. Fur‐
thermore, the greenhouse effect will melt the
iceberg in the Artic and Antarctica thus pro‐
ducing a lot of water. Good resource man‐
agement is needed to prevent more dry land
being flooded by this enormous source of wa‐
ter. This water can be used as fuel for internal
combustion engine and at the same time pre‐
venting the disaster from happening.
Water covers 70% of the earth. Water con‐
tains two atoms of hydrogen and one atom of
oxygen, H2O. By electrolysis process, water
breaks into two parts of hydrogen and one
part of oxygen gases. The hydrogen is used as
fuel and release oxygen to the environment
thus can prevent greenhouse effect. In order
to enable hydrogen as fuel, a customised en‐
gine system is needed. The objective of the
study is to expose and look at the possibility
of water‐fuelled engine for future marine
craft.

| MA
RIN
E F
RO
NT
IER
@ U
niKL
16 MIMET Technical Bulletin Volume 1 (2) 2010
Methodology
In this case, water is used as fuel for in‐ternal combustion engines in marine craft with minimal adjustment or changes. The equipment such as electrolysis chamber, control circuit and the water tank are the only changes needed to convert a petrol/diesel burning engine into a wa‐ter burner. The existing battery and electrical system can be used to run this system easily. It requires no fancy storage or plumbing.
Internal combustion is defined as a thermo‐vapor process since no liquid is in‐volved in the reaction. Most people are un‐aware that most of the petrol/diesel in a stan‐dard internal combustion engine is actually consumed, (cooked, and finally, broken down) in the catalytic converter after the fuel has been partially burnt in the engine. This means that most of the fuel consumed is used only to
cool down the combustion process, a pollution‐ridden and inefficient means of doing that.
A water‐fuelled engine system is shown
in the Figure 1.0. From the water tank, water
will be channeled to the electrolysis chamber.
The water is pumped sufficiently to replenish
and maintain the liquid level in the electrolysis
chamber. The water level in the electrolysis
chamber is set and controlled so that it well
submerses the stainless steel pipe electrodes
and yet leave some headroom for the hydro‐
gen/oxygen vapor pressure to build up. The
electrolysis chamber will vary in size with the
size of the engine being used. For example, a
quarter capacity is big enough for the ordinary
car type engine (small engine).
Fig. 1 : A water‐fuelled engine system.

| MA
RIN
E F
RO
NT
IER
@ U
niKL
17 MIMET Technical Bulletin Volume 1 (2) 2010
Stainless steel pipes are used as elec‐trodes in the electrolysis chamber while making sure it has a symmetric 1 to 5 mm gap in between these two pipes. The closer it is to 1mm gap the better. The electrodes are vibrated with a 0.5 to 5A electrical pulse which breaks the water into its component gases which is oxygen and hydrogen. The theoretical power required to produce hydro‐gen from water is 79 kW per 1,000 cubic feet of hydrogen gas.
The key can be turned on when the pres‐
sure reached 30 to 60 psi to start the engine. High pressure could increase electrolysis efficiency. By pushing the throttle, more energy is sent to the electrodes thus produces more vapors to the cyl‐inders (i.e. fuel vapor on demand). Then the idle max‐flow rate is set to get the most efficient use of power.
The heat from exhaust is used to heat the seawater in the desalination tank, which will re‐move the salt from seawater. The steam con‐denses in the process and is pumped to the water tank. Larger diameter of pipelines for exhaust is required to produce more fresh water.
This hydrogen fuel does not need oxygen from the atmosphere to burn, which is an im‐provement over fossil fuels in saving the oxygen in the air supply. However, in this case, the hydro‐gen and oxygen are combined and ignited in the motor cylinder. The resultant flame is extremely hot and force is produced to move the piston. In fact, when hydrogen burns perfectly, the only product produced is water.
The water contains hydrogen and hydrox‐ide ion which can be represented as equation be‐low:
H2O → H+ + OH‐ …………………………....(1)
Reaction at cathode:
2H+ + 2e‐ → H2 ……………………………...(2)
Reaction at anode:
4OH‐ → 2H2O + O2 + 4e‐ ………………….(3)
Or can be simplified as:
2(H2O) → 2H2 + O2 ………………………..(4)
This means that two parts of hydrogen and one part of oxygen gases are produced during the electrolysis process. Hydrogen is collected at the negative pole (cathode, Eq.2) and oxygen at the positive (anode, Eq.3). The hydrogen and oxygen are introduced directly into the electrolysis cham‐ber plus water. It is dangerous to store com‐pressed hydrogen in tank. As a result, the hydro‐gen is only produced in real time based on the system requirement. Only a certain amount of hydrogen is allowable in the electrolysis chamber to maintain constant flow of supply to the engine. This will prevent the problems associated with storing pressurized hydrogen.
For extra safety precaution, a flashback arrestor unit is installed before the engine for accidental backfire protection for the electrolysis chamber. This will prevent the ignition from the engine from transferring to the electrolysis chamber which can cause explosion. All vapor/duct junc‐tions must be air‐tight and can hold full pressure without leakage. This system is considered suc‐cessful and properly adjusted when full power range at lower temperature and minimum vapor flow is obtained without blowing the pressure safety valve.
This type of engine can give instantaneous start‐ing in any weather, elimination of fire hazards, cooler motor operation and fulfilling all motor requirements in power and speed. The engine would run for as long as water flows over the sys‐tem and regular maintenance will ensure this sys‐tem runs effectively. The technology can be en‐joyed for many years at very low expense as it is one of the most practical free‐energy devices, marked by extraordinary simplicity and effective‐ness. This system used low electricity out of the ship's battery, to separate water into gas, burn efficiently and provide tons of energy as needed.

| MA
RIN
E F
RO
NT
IER
@ U
niKL
18 MIMET Technical Bulletin Volume 1 (2) 2010
An engine (as with all internal combustion engines) turns heat energy into mechanical en‐ergy. The mechanical energy is used to turn the electric generator which changes mechanical en‐ergy into electrical energy. Since the water‐fuelled engine also produces mechanical energy, it can also be used to run as an electric generator.
The advantages for water‐fuelled engine are:
No more bunkering is needed therefore save time and money. ‘Bunkering of wa‐ter’ can be done during travelling from one port to another port. Water is avail‐able everywhere.
Increase ship’s mileage with longer dis‐tance at no cost thus increases transport efficiency and minimising the operation costs all the way.
When burned, the only product is water without harmful chemicals emitted from this system thus cleaning up emissions that are hazardous to health. The overall effect is a dramatic reduction in harmful emissions.
Hydrogen burns completely therefore no
carbon deposits is produced and this pre‐vents future carbon build up.
The water produced will cool the engine via heat transfer thus protecting the envi‐ronment and the engine. This will greatly enhance the engine power and perform‐ance.
A calmer, quieter and much smoother engine & gearshifts. This is due to the ef‐fect of water has on the combustion cycle inside the engine.
Enjoy a longer life expectancy of engine, especially pistons, valves, rings and bear‐ings.
In today's high fuel prices, this simple technology will become more valuable asset.
No more oil spill thus keeping the sea clean.
Fig. 2: General arrangement

| MA
RIN
E F
RO
NT
IER
@ U
niKL
19 MIMET Technical Bulletin Volume 1 (2) 2010
Current development Hydrogen Oceanjet 600
Ivo Veldhuis and Howard Stone, together with Dr Neil Richardson and Dr Steve Turnock of Southampton's Ship Science Department are working on a container ship capable of 65 knots and powered by hydrogen fuel. The re‐search started in the late nineties. It is a brave new approach to an established industry in order to cater worldwide fuel shortages and the increasing demand of manufacturers to deliver their products to the consumers faster. Smaller and faster is the mantra associated with car manufacturers, and those in the con‐sumer of electronics industry but it is not the main factor when designing a container ship which travel thousands of nautical miles laden with cargo. In the world of seaborne freight, the bigger is better.
The future of sea freight lie in a new breed of container vessels which travel two and half times the speed of their traditional counterparts but carry less containers, allow‐ing for more sailings between busy ports and therefore delivering cargo within a smaller time frame. At 8,500TEU (one TEU equates to one 20ft container), current container ships are leviathans of the ocean at 335m long. This size is reduced to just 600TEU per ship thus increased the present maximum speed of 25 knots (46.3 kph) to a whopping 65 knots (120.4 kph).
Ship Design
The design can be qualified by achievable engineering. In order to prove the concept, a new ship design must capable of completing the 18,000km roundtrip from Yokohama to L.A in half the time, thus allowing for double the amount of sailings per week. Hydrogen Ocean‐jet 600 is a work in progress which is fuelled exclusively by liquid hydrogen and powered by four gas turbine engines. The Oceanjet repre‐sents an ambitious new set of thinking and
offers real solutions to an industry to the new business improvements.
Speed of 65 knots requires an extremely high level of propulsion power for the size of the craft proposed (175m/600TEU). With this in mind, Oceanjet will utilised gas turbine engines derived from similar turbine engines as those found on a Boeing 747, each capable of 49.2 MW of propul‐sive power when fuelled by hydrogen. This pro‐pulsive power has to be translated into forward speed, and waterjets is used to give a high propul‐sive efficiency at this high speed.
The design proposed allows for four such 2.5m‐wide waterjets, two inside each demi‐hull transoms of each catamaran hull. This type of pro‐pulsion system is capable of rotating the outgoing waterjet flow and so the entire propulsion force is utilised to steer the ship at 65 knots.
The schematic layout of the ship design, is a catamaran with long and twin hulls known as a 'semi SWATH' (Small Water plane Area Twin Hull), an ideal shape to avoid unwanted wave resis‐tance. A significant part of the vessel's buoyancy is located beneath the waterline. As a result there is limited wave interaction and this translates into reduced wave resistance.
Crucially, this type of design creates an aero‐foil‐shaped air cavity for running the ship with minimal foil friction. The hydrofoils create a verti‐cal lift force that reduces the draught of the cata‐maran and consequently reduces the ship's sur‐face area exposed to seawater. At such high‐speeds frictional resistance between seawater and the ship's hull surface is the biggest resistance component. By reducing the draught via the hy‐drofoils, the frictional resistance is reduced. An additional advantage from using the hydrofoils is damping of the ships motions.
Another benefit of the catamaran layout lies in the speed of loading and unloading it creates. Whereas conventional mono‐hulled container ships require cargo to be loaded vertically, via cranes, this design will allows for horizontal 'drive on and drop' container delivery, making the proc‐ess a lot swifter.

| MA
RIN
E F
RO
NT
IER
@ U
niKL
20 MIMET Technical Bulletin Volume 1 (2) 2010
Fuel system In maintaining such a speed for a long time
about 3,000 tonnes diesel are required on‐board. That is about the same weight as the cargo. Methanol and ethanol are also too heavy. Therefore hydrogen is used in the fuel system. It releases a lot more energy per kilo‐gram than conventional fuels, and the fuel de‐livery system devised can use both liquid and gaseous hydrogen, so no fuel is wasted.
0.86kg of liquid hydrogen per second is required in order to operate the turbines at speed of 64 knots. This means 176 m³ of hydro‐gen burned every hour. For a ship to travel the distances required, it would therefore require a fuel storage capability of 14,500 m³. The design of the Oceanjet allows for ten separate but in‐terconnected fuel tanks, with a total storage capacity of 1,001 tonnes of liquid hydrogen.
Safety first
Naturally, the use of liquid hydrogen raises a number of key safety questions, not least how volatile a liquid fuel can be inside a ship travel‐ling in excess of 60 knots. Because of hydrogen behaves differently compared to other conven‐tional fuels, it requires a different approach al‐together. Current shipbuilding regulations do not allow for the use of liquid hydrogen as a fuel source.
The liquefied hydrogen is kept at ‐253°C for safety reason. A safety system can vent the
hydrogen quickly in the event of an accident. Liquid hydrogen turns to gas instantaneously when in contact with the air and does not linger and burn longer like other fuels such as kero‐sene.
SMART H‐2 Project
The progress within the SMART‐H2 has been excellent. Already launched is an auxiliary engine on board a whale watching ship “Elding”. The opening ceremony was held at the harbour of Reykjavik, Iceland on April 24th 2008 when media and guests were invited on the first trial run of using hydrogen on board a commer‐cial vessel.
Fig. 3: Hydrogen Oceanjet 600
Fig. 4 “Elding”

| MA
RIN
E F
RO
NT
IER
@ U
niKL
21 MIMET Technical Bulletin Volume 1 (2) 2010
Car industry
A small group of local scientists in Malaysia have invented a technology called Hydrogen Fuel Technology (HFT) which could reduce petrol con‐sumption up to 50 percent. The HFT system was designed to fit all types of cars with particular em‐phasis on national cars, namely Proton Perdana, Proton Waja, Proton Wira, Proton Iswara, Proton Saga and Perodua Kancil. The prototype has been tested in Proton Waja for a period of over two years and Perodua Kancil for one month. For every 10 li‐tres of petrol, the system uses 20 litres of water to generate a fuel capacity of 20 litres. The mixture of petrol, hydrogen and oxygen will flow into the carburettor and the engine, enabling the car to run as usual.
Besides that, a foreign car manufacturer Ford had introduced the Ford Focus H2RV which used an internal combustion engine powered by hydrogen, boosted by a supercharger, with a Ford patented Modular Hybrid Transmission System (MHTS) which incorporates a 300‐volt electric motor for full hybrid operation. The MHTS system can be used interchangeably. Hy‐drogen engines have logged thousands of hours on dynamometers, and more than 10,000 miles on the road.
Table 1: H2RV vehicles specifications
In comparison, the basis for the H2RV is its hydrogen‐powered internal combustion engine which is regarded as a transition or "bridging" strategy to stimulate the hydrogen infrastruc‐ture and related hydrogen technologies includ‐ing on‐board hydrogen fuel storage, hydrogen fuel dispensing and hydrogen safety sensors.
Table 2: H2RV performance
Hydrogen producing ship.
The Hydrogen Challenger GmbH devel‐oped a worldwide patented wind‐hydrogen‐production ship. Several wind turbines with dif‐ferent heights and power outputs are installed and operating on a ship. This ship may anchor in some areas with strong wind for instance in Bremerhaven or Helgoland, and the ship can produce hydrogen and oxygen gases from the regenerative energy (wind energy). The ex‐tracted electricity will be applied into the elec‐trolysis of water, which will split the water molecule into hydrogen and oxygen, and these gases will be continuously compressed into the high‐pressure storage tanks on the ship. With fully loaded storage tanks, the gases are sold to the customer.
Discussion
Problems associated and possible solution with hydrogen as fuel;
Hydrogen embrittlement. In an internal combustion engine, one of the problems with the burning of hydrogen is embrittlement which occurs when the walls of the cylinder become saturated with hydrogen ions. This will cause loss of ductility of metals due to corrosion as a result of intergranular at‐tack which may not readily be visible. The metal becomes fragile or porous and can shatter or fracture upon impact, thus damaging the en‐gine.

| MA
RIN
E F
RO
NT
IER
@ U
niKL
22 MIMET Technical Bulletin Volume 1 (2) 2010
As to embrittlement, the acidity of water has been found to have great effect on the speed and the degree to which a material can be dissolved. A metal corrodes because of the acidity of the solution in which it is immersed due to an interchange of hydrogen ions in the solution with the atoms of the exposed metal. When the solution is in liquid form, the metal is dissolved into the solution and hydrogen tends to plate out on the piece. Once a hydrogen film has deposited on the exposed surfaces, the dis‐solving of the metal will cease. Oxygen plays an important part in this process since the oxygen that dissolved in water will react with the film of hydrogen to eliminate it by forming water which allows the corrosion process to proceed.
This problem can be solved by coating the
pistons/cylinders ceramic. It cannot be delayed as these items will rust, either by sheer use or by neglect (i.e. letting it sits) and fitted with a stainless steel exhaust.
Frosting. Some places such as in Europe are colder
than Malaysia climate. In colder condition, the water inside the system can be easily getting frosted and disturb the system. In order to solve this problem, the heating coils to prevent water from freezing in the system.
Hydrogen storage.
Pure hydrogen is dangerous to be stored in high‐pressure tanks. Like all fuels, hydrogen has inherent hazards and must be handled care‐fully. In fact, hydrogen has been used for years in industrial processes and as a fuel by NASA, and has earned an excellent safety record. Like other fuels, hydrogen can be handled and used safely.
In this case, hydrogen and oxygen were generated. All hydrogen and oxygen produced get consumed by the engine instantly. The suit‐able size of tank for certain pressure is needed to maintain constant flow of supply to the en‐gine. The presence of oxygen and water vapour
in the system makes hydrogen very safe. The mixture of hydrogen and oxygen give a power‐ful combustible gas but it is not explosive com‐pared to pure hydrogen. It does not need cool‐ing and will be ignited only by the strong spark inside the engine. The hydrogen can be com‐pressed into a crystal matrix form in order to make it safer but it is not so cost‐effective.
Speed control.
In getting the right speed at the right time and to maintain a constant supply, a control circuit is attached to the electrolysis chamber. This circuit (Figure 5.0) will produce square pulse signal which 'plays' the stainless steel electrodes like a tuning fork. The faster speed is needed, the wider the pulses go into the elec‐trolysis chamber to create more hydrogen gases as needed. So when the throttle is pushed, it will electrically create more hydrogen gases for immediate consumption. On demand, low‐high flow rate is needed, from idle to maximum power. This signal is the input to the circuit as the primary control (i.e. throttle level = pulse width = gas rate).
For carburettor, the built‐in vents need to
be sealed and making a single way air‐intake. The throttle circuit is set in order to maintain minimum gas flow at idle and maximum gas flow at full power without blowing the pressure relief valve. In this way, the mixture is con‐trolled by the strength of the pulse (i.e. “width” at the optimum pulse frequency). If there is in‐sufficient power at any throttle setting, some variables need to be changed such as the pulse frequency, the gap between the electrodes, the size (bigger) of the electrodes, or make a higher output pulse voltage (last resort).
Excess heat. Excess heat due to combustion of hydrogen and oxygen can be rectified by recent material achievements and when the hydrogen is burned, water is produced thus cool down the engine down via heat transfer.

| MA
RIN
E F
RO
NT
IER
@ U
niKL
23 MIMET Technical Bulletin Volume 1 (2) 2010
Big oil companies. For business survival, big oil companies may
stop the emergence of this technology. These companies can buy the patent and keep the secret quietly. Many claims they have the tech‐nology but not many has come forward to prove this. The rest have either been threat‐ened, sold out or keep the secret to themselves. Apparently, it is not a good idea to threaten big oil companies. Nowadays, with the increase of oil price and soon the depletion of the fossil fuel, this technology will have a better chance.
Recommendation
Water can be fully utilised. A lot of benefit can be extracted from it. There were some recommenda‐tions regarding a water fuelled engine;
This technology must be developed for the benefit of all. Big oil companies will cover up this innovation but with the current situation such as higher oil price, the depletion of oil in future, and higher coal price, it will strongly push the ship owners for other al‐
ternative which is water as fuel. There are a lot of benefits can be get from this technol‐ogy.
Thorough research and development must be done to design and optimise the engine capability to accept water as fuel so as to fully utilise this technology at lower cost, meet owner requirement to get maximum profit and most importantly make it safe for all.
Reliable data analysis and statistics must be recorded persistently for future reference
thus the design can be simplified and impro‐vised. This will con‐vince the ship owners to use this water‐fuelled engine on‐board of their ship. It is the right time to make a mindset shift for water fuelled en‐gine.
Reduce petroleum demand and economy dependability since water is available for free everywhere and only a little of it is used. Global warming provides more than enough water supply. It is the ultimate solu‐tion for non depend‐ency on fossil fuels.
Eliminate harmful exhaust emissions that pollute the environment and contribute to global warming. This clean‐burning fuel will add only water and oxygen into the atmos‐phere instead of polluting it.
The engine that run on water could be an interesting project, thus give a great reward of never having to pay for petrol/diesel for‐ever and helping humanity at the same time.
Fig. 5: Electric circuit diagram for control unit

| MA
RIN
E F
RO
NT
IER
@ U
niKL
24 MIMET Technical Bulletin Volume 1 (2) 2010
Financial assistance is needed to make this engine into a reality. This will be a test run project in order to get the prototype and fi‐nally get the practical design which is afford‐able for all.
Conclusions
Based on the discussion, water is the solu‐tion to energy problems as petrol dependency is a national security hazard. Petrol will increase in price and soon will deplete. Therefore, water is the best alternative. Water‐fuelled engines offer a cost effective and immediate solution to the en‐ergy crisis and pollution nowadays. In some de‐sign aspects, a thorough research and develop‐ment is needed to get a better practical design and free energy is hard to believe until it is actu‐ally happens.
Nowadays, the industry has been tightly controlled by industrialists with political allies that have exploited mainly the transporta‐tion industry including shipping through cabotage or cartell practices. The key to overcoming this stronghold is the public enlightenment alterna‐tives and making these alternatives available to the public. This water‐fuelled engine could be‐come a threat to those who already well estab‐lished in the petroleum business.
Water is universal and a very powerful source of energy. It is an ideal fuel of the future. This fuel is re‐useable and does not give off any toxic chemicals. Therefore, diesel /petrol as a fuel are not necessary now. It is just an option. When water is used, it creates new opportunities, both economic and in ship design. It will become more investment in greener fuel production to fuel fu‐ture marine craft. The transition to a water‐fuelled engine is going to be a huge national and international challenge. Good support from all parties is needed to realise this technology for future used.
Acknowledgement
Thanks to Pn. Puteri Zarina Megat Khalid for checking my writing aspect, Mr. Fauzuddin
Ayob, Dr. Mohd Yuzri Mohd Yusof, Pn. Nurshah‐nawal Yaakob and Mr. Ahmad Azmeer Roslee for their constructive opinion in reviewing my paper. Big thanks to Mr. Fuaad Ahmad Subki for his guid‐ance and invaluable knowledge. Their expert ad‐vice proved invaluable.
References
Documents;
1. En Fuaad Ahmad Sabki, Advanced Marine De‐sign Lecture Notes, 2008, UTM.
2. Klaas Van Dokkum, Ship Knowledge: Covering Ship Design, Construction and Operation, 3rd Edition, 2006, DOKMAR, Netherland.
3. B.R.Clayton and R.E.D.Bishop, Mechanics of Marine Vehicles, 1981, University College Lon‐don.
4. Robert Boylested and Louis Nashelsky, Elec‐tronic Devices and Circuit Theory, 6th Edition, 1996, Prentice Hall, New Jersey.
5. Joseph J.Carr, Elements of Electronic Instrumen‐tation and Measurement, 3rd Edition, 1997, Prentice Hall, Singapore.
6. Stephen Chambers, Apparatus for Producing Orthohydrogen and/or Parahydrogen, US Pat‐ent 6126794, uspto.gov.
7. Stanley Meyer, Method for the Production of a Fuel Gas, US Patent 4936961, uspto.gov
8. Creative Science & Research, Fuel From Water, fuelless.com
9. Carl Cella, A Water‐Fuelled Car, Nexus Maga‐zine Oct‐Nov 1996
10. Peter Lindemann, Where in the World is All the Free Energy, free‐energy.cc
11. George Wiseman, The Gas‐Saver and HyCO Series, eagle‐research.com
12. C. Michael Holler, The Dromedary Newsletter and SuperCarb Techniques
13. Stephen Chambers, Prototype Vapor Fuel System, xogen.com

| MA
RIN
E F
RO
NT
IER
@ U
niKL
25 MIMET Technical Bulletin Volume 1 (2) 2010
Websites:
1. http://www.schatzlab.org/h2safety.html; 9.00am, 23 Mac 2008.
2. http://www.angelfire.com/sd/ZSPdomain/HydrogenHomepage/Cprop.html; 9.05am, 23 Mac 2008.
3. http://en.wikipedia.org/wiki/Hydrogen; 9.10am, 23 Mac 2008.
4. http://media.uow.edu.au/news/2005/1104c/index.html; 9.15am, 23 Mac 2008.
5. http://www.spiritofmaat.com/archive/feb2/carplans.htm; 9.15am, 23 Mac 2008.
6. http://en.wikipedia.org/wiki/Solar_Powered_Desalination_Unit; 9.15am, 23 Mac 2008.
7. http://www.raindancewatersystems.com/desalinators.html; 9.20am, 23 Mac 2008.
8. http://www.gas‐water‐car.com/; 9.20am, 23 Mac 2008.
9. http://jalopnik.com/cars/alternative‐energy/water‐engine; 9.20am, 23 Mac 2008.
10. http://www.eetimes.com/news/latest/showArticle.jhtml?articleID=199601111; 9.20am, 23 Mac 2008.
11. http://www.dimewater.com/desalination.html; 9.30am, 23 Mac 2008.
12. http://www.dolphindesalinators.com/operations.html; 9.30am, 23 Mac 2008.
13. http://www.ingentaconnect.com/content/els/01968904/1997/00000038/00000010/art00161; 9.30am, 23 Mac 2008.
14. http://books.google.com.my9.30am, 23 Mac 2008.
15. http://www.fuellesspower.com/water2.htm; 9.35am, 23 Mac 2008.
16. http://www.able2know.org/forums/about26695.html; 9.35am, 23 Mac 2008.
17. http://www.btimes.com.my/Current_News/BT/Saturday/Corporate/BT548344.txt/Article/; 2.00pm, 30 April 2008.
18. http://www.autoworld.com.my/forum/allposts.asp?summary=1&Forum=ap469682640&access=1&sta
tus=1&subject=Hydrogen+Fuel+Tech+By+Malaysia%3F; 2.00pm, 30 April 2008.
19. http://www.autointell.com/News‐2003/August‐2003/August‐2003‐2/August‐13‐03‐p1.htm; 2.00pm, 30 April 2008.
20. http://www.focaljet.com/allsite/content/h2rv.html; 2.10pm, 30 April 2008.
21. http://fuelcellsworks.com/Supppage37.html; 2.10pm, 30 April 2008.
22. http://www.theage.com.au/news/environment/benvironmentb‐iceland‐aims‐to‐be‐free‐of‐fossil‐fuels/2008/01/25/1201157669193.html?page=3; 2.10pm, 30 April 2008.
23. http://www.soton.ac.uk/ses/news/stories/hydrogenship.html; 2.20pm, 30 April 2008.
24. http://www.newenergy.is/naha/; 2.20pm, 30 April 2008.
25. http://www.greencarcongress.com/2008/01/whale‐watching.html; 2.20pm, 30 April 2008.
26. http://www.hydrogen‐challenger.de/index_english.htm; 2.30pm, 30 April 2008.
27. http://www.accagen.com/p‐electrolyzers.htm; 2.30pm, 30 April 2008.

| MA
RIN
E F
RO
NT
IER
@ U
niKL
26 MIMET Technical Bulletin Volume 1 (2) 2010
Feature Article 3
SHIP REGISTERED IN THE PAST DECADE AND THE TRENDS IN SHIP REGISTRATION
IN MALAYSIA: THE PREDICTION FOR THE NEW BUILDING AND DESIGN DEMAND
IN THE NEXT FIVE YEARS
SAMSOL AZHAR ZAKARIA* Department of Marine Design Technology
Malaysian Institute of Marine Engineering Technology, Universiti Kuala Lumpur
Received: 25 May 2010; Revised: 8 July 2010 ; Accepted: 14 July 2010
ABSTRACT
Malaysia marine industry has been one of the key stepping stones to economic growth and prosperity all along its history.
In recent years, the shipping sector has expanded considerably. There has been a considerable increase in the number of
ships in operation, both in the international and domestic markets. Unfortunately, the economic crisis arrives at a mo‐
ment in time when the Malaysian shipping sector is starting to boom and facing multiple challenges, including fierce
competition from companies, human factor, piracy and terrorist threats of the international trade system. This paper
describes the trend in ship registration in Malaysia. Also, from the analysis the prediction for new building and design
demand in future is presented.
Keywords Ship registration, shipbuilding, shipping
*Corresponding Author: Tel.: +605‐6909049
Email address: [email protected]
INTRODUCTION
Malaysia’s fleet, which was ranked in
21st position with the largest registered
deadweight tonnage at the beginning of
2006, has dropped to 23rd position at begin‐
ning of 2009 under the UNCTAD Maritime
Review as shown Table 1. [1]
A major national fleet expansion is espe‐
cially taking place in the petroleum and gas
tankers sector. Among the ship owners
ahead with their expansion drive in the off‐
shore shipping includes Bumi Armada
Bhd,Tanjung Offshore,Alam Maritim Re‐
sources Bhd, Scomi Marine Bhd and Petra
Perdana Bhd. In the tanker sector, MISC Bhd,
Gagasan Carrier Sdn Bhd, Malaysian Bulk
Carrier Bhd, Nepline Berhad, Global Carrier
Bhd and Swee Joo Shipping have placed or‐
ders for more ships, including Very Large
Crude Carriers (VLCC). [2]
The global financial crisis really started
to show its effects in the middle of 2007 and
into 2008. Around the world stock markets
have fallen, large financial institutions have
collapsed or been bought out, and govern‐
ments in even the wealthiest nations have
had to come up with rescue packages to bail
out their financial systems. In this conjunc‐
tion, growth in international seaborne trade
decelerated in 2008, expanding by 3.6 per
cent as compared with 4.5 per cent in 2007. [1]Furthermore, the fall down in global dem‐
mand has significant impacted growth in the
world trade merchandise. In Malaysia, the
situation directly affects some 14 shipping
lines, which has caused them to reduce the
number of vessels they have in service.
Some orders for new ships have also been
cancelled.

| MA
RIN
E F
RO
NT
IER
@ U
niKL
27 MIMET Technical Bulletin Volume 1 (2) 2010
Table 1: Global maritime Fleet Ranking (as of 1 January
2009), Source: [1]
2.0 Malaysian Shipping: An Overview.
The Malaysian economy contracted moder‐
ately by 1.7% in 2009 as recovery strengthened
in the second half of the year. [3] The demand for
ocean transportation in Malaysia’s international
trade is very high and this is largely because of
the size of the country’s external trade sector
and its high dependence on foreign trade. The
shipping industry in Malaysian comprises in two
sector:
1. International Shipping
2. Domestic Shipping
2.1 Regulatory Aspects of Shipping
Shipping is under the jurisdiction of the Ministry
of Transport. The Maritime Division of the Ministry
is the administrative body responsible for the over‐
all development of the shipping industry, while Ma‐
rine Department is responsible for acting as registry
of ships besides enforcing rules and regulations re‐
lating to standards and safety of shipping in Malay‐
sia. Shipping in Malaysia is regulated by the Mer‐
chant Shipping Ordinance (MSO) 1952 that was ex‐
tended to both Sabah and Sarawak.
In order to own a Malaysian ship the person
must be a Malaysian citizen or corporations which
satisfy the requirement such as:
1. incorporation is incorporated in Malaysia
2. the principal office of the corporation is in

| MA
RIN
E F
RO
NT
IER
@ U
niKL
28 MIMET Technical Bulletin Volume 1 (2) 2010
Malaysia
3. the management of the corporation is car‐
ried out mainly in Malaysia
4. the majority, or if the percentage is deter‐
mined by Minister, then the percentage so
determined , of the directors of the corpora‐
tion are Malaysia citizen
2.2 Ship Registration
Registration of ships in Malaysia follow an
almost identical practices as in United Kingdom
from which much of existing Malaysian mari‐
time laws and administrative practices are in‐
volved. The Merchant Ship Ordinance (1952)
provides for registration of ships in Malaysia.
Port of Registries for national flag vessels are
Port Klang, Penang, Kuching and Kota Kinabalu.
The registry provision of MSO 1952 were ex‐
tended to Sabah and Sarawak by the Merchant
Shipping(Amendment and Extension) Act 1977
(Act A393) on June 1991.While, Labuan offers
registration of non national flags as part of an
International Registry subject to specific condi‐
tion .
2.3 List of ship registered in the past decade in
Malaysia (1996 – 2006)
Compilation of this data mainly refers to
Marine Department Malaysia [4] and Malaysian
Maritime Yearbook 2007‐2008 (from Malaysian
Shipowner’s Association) [2]. This general data
was segregate based on type of vessel, name of
vessel, shipowner, GRT and year of registration.
(Appendix 1 – Table 2 to Table 10)
Table 2: Number of Ships Registered in Malaysia by
Type (New Classification) and weight, 2001‐2006
Table 3 : Tug boat Registered in Malaysia(1996‐2006)
Table 4 : Barge Registered in Malaysia (1996‐2006)
Table 5 : General Cargo Carrier Registered in Malay‐
sia (1996‐2006)
Table 6 : Anchor Handling Tug & Supply Registered
in Malaysia(1996‐2006)
Table 7 : LNG Registered in Malaysia (1996‐2006)
Table 8: Tankers Registered in Malaysia(1996‐2006)
Table 9 : Bulk Carrier Registered in Malaysia (1996‐
2006)
Table 10: Passenger Ship Registered in Malaysia
(1996‐ 2006)
Table 11: Container Ships Registered in Malaysia
(1996‐ 2006)
3.0 Trends in ship registration in Malaysia (2001
‐2006)
From the analysis shown in Figure 1, it
clearly shows that Malaysian merchant fleet has
grown at a modest pace over the years with 284
vessels was registered in 2006 with GRT reach to
33,238,000 tons. This is mainly due to the policy
of government, to actively involve in develop‐
ment of Malaysian merchant fleet to reduce de‐
pendence on foreign shipping services and em‐
phasizing on greater self sufficient in shipping
services.
The domestic shipping services and its chain
which comprises shipping lines such as tug
boat, barges, passenger ships, also show the
positive growth with increasing number of ves‐
sels registered in 2006 ,where tug boats and
barge dominates the numbers and tonnage in
registration (Figure 2 and Figure 3). It is esti‐
mated that there are about 300 Malaysian ship‐
ping lines owning or operating about 3500 ships
totaling 9.09 million GRT in Peninsular Malaysia,
Sabah and Sarawak [4].

| MA
RIN
E F
RO
NT
IER
@ U
niKL
29 MIMET Technical Bulletin Volume 1 (2) 2010
Total Number of Barge Registered in Malaysia (2001-2006)
42
31
45
5755
62 11991
8489704551
0
10
20
30
40
50
60
70
2001 2002 2003 2004 2005 2006Year
No.
of Ship
s
0
2000
4000
6000
8000
10000
12000
14000
GR
T ('0
00)
No. of ships GRT
Total Ship Registered in Malaysia (2001-2006)283 284
251
229
131
170
33238
338286 639 1181 1357
0
50
100
150
200
250
300
2001 2002 2003 2004 2005 2006Year
No.
of
Sh
ips
0
5000
10000
15000
20000
25000
30000
35000
GR
T (
'000
)
No. of Ships GRT
Figure 1: Total Ship Registered
in Malaysia (2001‐2006)
Figure 3 : Total Number of Barge Registered
in Malaysia (2001‐2006)

| MA
RIN
E F
RO
NT
IER
@ U
niKL
MIMET Technical Bulletin Volume 1 (2) 2010
The domestic shipping sector also consists of
liner shipping services and non‐liner services es‐
pecially in the transportation of general and bulk
cargo. Non‐ liner service is more important com‐
ponent due to its covers the oil & gas sector, off‐
shore supply vessel, and also crude oil & product
tankers serving between local refineries and con‐
sumption centers. For example, the LNG vessels
registered in 2001‐2006 show that the constant
growth and reaching to 194000 ton GRT (see
Figure 5). In term of GRT , for LNG and LPG are
stagnant with around 190,000 GRT per year from
2003 until 2006. The AHTS as part of offshore
support vessel show the rapid growth, where in
2005 the total registered vessels by local mari‐
Total Number of Tug Boat Registered in Malaysia(2001-2006)
3336
5964
58
68
1211964
1469
0
10
20
30
40
50
60
70
80
2001 2002 2003 2004 2005 2006
Year
0
200
400
600
800
1000
1200
1400
1600
No. of ships GRT
Total Number of LNG & LPG Registered in Malaysia (2001-2006)
1
3
2
3
2
1
0
93
191194
189190
0
0.5
1
1.5
2
2.5
3
3.5
2001 2002 2003 2004 2005 2006Year
No. of Ship
s
0
50
100
150
200
250
GRT('00
0)
No. of ships GRT
Figure 5 : Total Number of LNG &
LPG Registered in Malaysia (2001‐2006)
Figure 4 : Total Number of Tug Boat Registered
in Malaysia (2001‐2006)

| MA
RIN
E F
RO
NT
IER
@ U
niKL
31 MIMET Technical Bulletin Volume 1 (2) 2010
time players is 30. The demand for oil tankers
increase in 2005 and gradually reduced in the
following years in 2006 (see Figure 6). The de‐
mand for Bulk, Grain, Ore, Log carrier however
seems decreasing over the years. This pattern
also followed by full container ship with an ex‐
ception of the year 2006 where it hits 118,000
GRT on that year.
4.0 Prediction for new building in next five years.
Based on the analysis, ship registered in
Malaysia its show that the domestic and coastal
trade is have a significant structural changes
which are also having positive effects on local
ports including by generating greater volume of
trade and widening shipping connectivity ant its
chain likes barges and tugs. The changes and
trends is predict to be accentuate over the next
five years with strong implications to develop‐
ment of shipping and ports in this region. An‐
other significant development is that, aside
from expansion in the volume of trade, coastal
shipping companies, especially liner operators,
are now expanding market outreach by linking
their domestic shipping services with calls at
regional port. Local ports such as Northport,
Westport , Port of Tanjung Pelepas, Penang
Port, Bintulu are among the ports which have
recorded increased ship calls ( source [5] : Fed‐
eration of Malaysian Port Operating Companies
‐FMPOC). Cargo volumes at the nation's ports
are expected to increase further due to the im‐
plementation of an ambitious free‐trade agree‐
ment (FTA) between the Association of South‐
east Asian Nations (ASEAN) and China. In Janu‐
ary 2010, the ASEAN‐5 (Malaysia, Singapore,
Philippines, Thailand and Indonesia) and Brunei
signed an FTA with China, creating the world's
third‐largest trade block. The agreement elimi‐
nates tariffs on 90% of goods traded between
the countries and China and is expected to
boost volumes of trade between them. Four
other states, Laos, Cambodia, Vietnam and
Myanmar, are on course to join the trade bloc
in 2015.[6]
Several container liner operators have in
recent years started to introduce new and addi‐
tional service at regional ports such as Ho Chi
Minh, Bangkok, Yangoon, Cittagong as well as
Jakarta. Therefore, parallel with this widening
outreach the prediction for new building and
Total Number of Petroluem Tankers Registered in Malaysia(2001-2006)
4
1
5
3
0
7
67
92
0
23
513
0
1
2
3
4
5
6
7
8
2001 2002 2003 2004 2005 2006Year
No. of sh
ips
0
10
20
30
40
50
60
70
80
90
100
GRT('00
0)
No. of ships GRT
Figure 6 : Total Number of Petroleum Tankers
Registered in Malaysia(2001‐2006)
| MA
RIN
E F
RO
NT
IER
@ U
niKL
32 MIMET Technical Bulletin Volume 1 (2) 2010
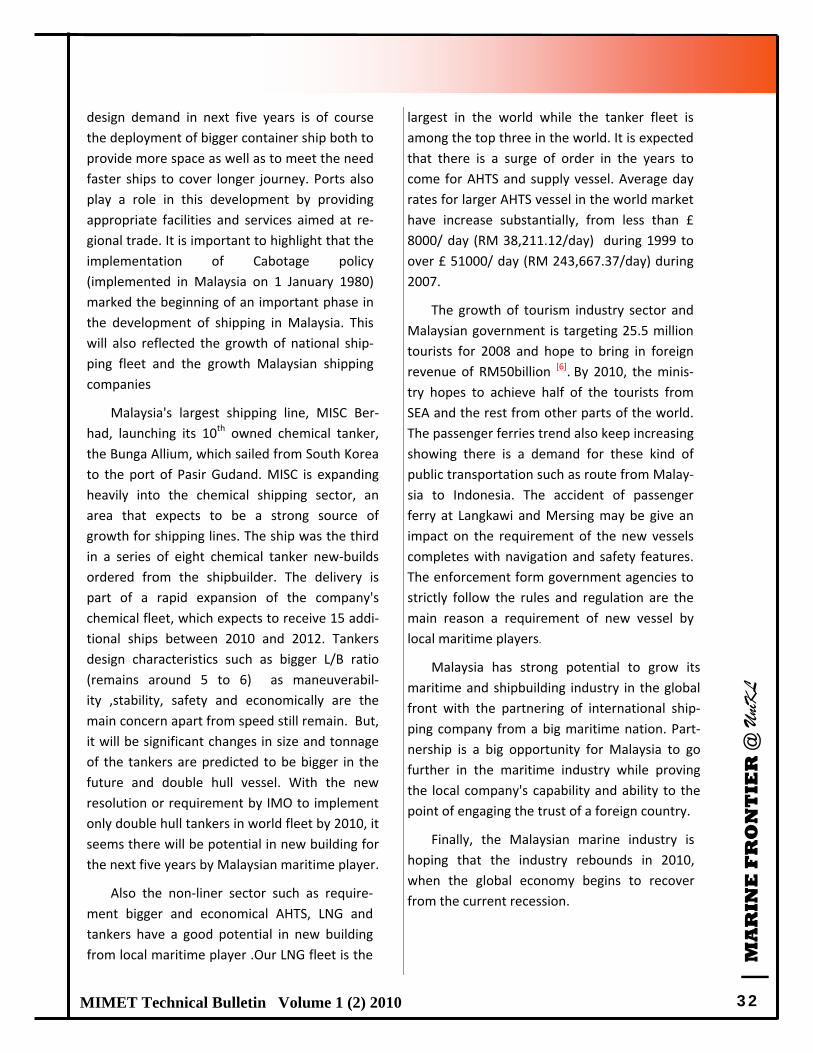
design demand in next five years is of course
the deployment of bigger container ship both to
provide more space as well as to meet the need
faster ships to cover longer journey. Ports also
play a role in this development by providing
appropriate facilities and services aimed at re‐
gional trade. It is important to highlight that the
implementation of Cabotage policy
(implemented in Malaysia on 1 January 1980)
marked the beginning of an important phase in
the development of shipping in Malaysia. This
will also reflected the growth of national ship‐
ping fleet and the growth Malaysian shipping
companies
Malaysia's largest shipping line, MISC Ber‐
had, launching its 10th owned chemical tanker,
the Bunga Allium, which sailed from South Korea
to the port of Pasir Gudand. MISC is expanding
heavily into the chemical shipping sector, an
area that expects to be a strong source of
growth for shipping lines. The ship was the third
in a series of eight chemical tanker new‐builds
ordered from the shipbuilder. The delivery is
part of a rapid expansion of the company's
chemical fleet, which expects to receive 15 addi‐
tional ships between 2010 and 2012. Tankers
design characteristics such as bigger L/B ratio
(remains around 5 to 6) as maneuverabil‐
ity ,stability, safety and economically are the
main concern apart from speed still remain. But,
it will be significant changes in size and tonnage
of the tankers are predicted to be bigger in the
future and double hull vessel. With the new
resolution or requirement by IMO to implement
only double hull tankers in world fleet by 2010, it
seems there will be potential in new building for
the next five years by Malaysian maritime player.
Also the non‐liner sector such as require‐
ment bigger and economical AHTS, LNG and
tankers have a good potential in new building
from local maritime player .Our LNG fleet is the
largest in the world while the tanker fleet is
among the top three in the world. It is expected
that there is a surge of order in the years to
come for AHTS and supply vessel. Average day
rates for larger AHTS vessel in the world market
have increase substantially, from less than £
8000/ day (RM 38,211.12/day) during 1999 to
over £ 51000/ day (RM 243,667.37/day) during
2007.
The growth of tourism industry sector and
Malaysian government is targeting 25.5 million
tourists for 2008 and hope to bring in foreign
revenue of RM50billion [6]. By 2010, the minis‐
try hopes to achieve half of the tourists from
SEA and the rest from other parts of the world.
The passenger ferries trend also keep increasing
showing there is a demand for these kind of
public transportation such as route from Malay‐
sia to Indonesia. The accident of passenger
ferry at Langkawi and Mersing may be give an
impact on the requirement of the new vessels
completes with navigation and safety features.
The enforcement form government agencies to
strictly follow the rules and regulation are the
main reason a requirement of new vessel by
local maritime players.
Malaysia has strong potential to grow its
maritime and shipbuilding industry in the global
front with the partnering of international ship‐
ping company from a big maritime nation. Part‐
nership is a big opportunity for Malaysia to go
further in the maritime industry while proving
the local company's capability and ability to the
point of engaging the trust of a foreign country.
Finally, the Malaysian marine industry is
hoping that the industry rebounds in 2010,
when the global economy begins to recover
from the current recession.
| MA
RIN
E F
RO
NT
IER
@ U
niKL
33 MIMET Technical Bulletin Volume 1 (2) 2010
References
[1] UNCTAD, Review Maritime Transport 2009,
[2] Malaysian Shipowners’ Association, Malaysian Maritime
Yearbook 2007‐2008, page 123‐216,
[3] Bank Negara Malaysia‐ Annual Report 2009,
[4] Marine Department of Malaysia –Registration,
[5] Federation of Malaysian Port Operating Companies –
FMPOC Magazine,
[6] Business Monitor International, Malaysia Shipping Report
Q2 2010.
Internet source :
[1] www.mot.gov.my
[2] www.lloydslist.com
[3] www.malaysianshipowners.org
[4] www.marine.gov.my
[5] www.portsworld.com

| MA
RIN
E F
RO
NT
IER
@ U
niKL
34 MIMET Technical Bulletin Volume 1 (2) 2010
Type of ship
2001 2002 2003 2004 2005 2006
BIL No.
GRT ( '
000)
NRT ( '
000)
DWT ( '
000)
BIL No.
GRT ( '
000)
NRT ( '
000)
DWT ( '
000)
BIL No.
GRT ( '
000)
NRT ( '
000)
DWT ( '
000)
BIL No.
GRT ( '
000)
NRT ( '
000)
DWT ( '
000)
BIL No.
GRT ( '
000)
NRT ( '
000)
DWT ( '
000)
BIL No.
GRT ( ' 000)
NRT ( ' 000)
DWT ( ' 000)
Oil Tanker 11 14 7 15 4 6 3 10 4 161 101 305 13 722 436 1,362 14 561 341 108 5 9 4 11,473
LNG, LPG Carrier 1 ‐ ‐ ‐ 1 93 28 76 3 190 57 155 2 189 57 152 3 194 58 55 2 191 57 2
Chemical/Petroleum Tanker
4 67 28 111 1 5 2 8 5 23 13 39 3 13 8 24 7 92 37 29 ‐ ‐ ‐ ‐
Bulk, Grain, Ore, Log Carrier
5 96 54 155 2 32 17 52 2 32 17 50 2 56 34 103 1 47 27 10 1 13 7 19
General Cargo, Semi Container
19 26 13 29 10 31 17 35 7 11 2 2 7 5 2 5 1 1 1 ‐ 10 2,264 1,174 9
Passenger, General/Passenger Ship
27 2 ‐ ‐ 8 3 1 1 26 7 2 20 21 6 2 0 21 4 2 23 35 26 96 ‐
RO‐RO ‐ ‐ ‐ ‐ 1 11 4 4 2 49 15 ‐ ‐ ‐ ‐ ‐ 1 9 3 4 1 9 3 280
Full Container 4 12 5 5 10 64 32 87 1 5 3 7 1 4 2 4 4 23 12 14 5 118 68 95
Anchor Handling Tug & Supply (AHTS)
9 3 1
6 4 1 3 9 8 2 57 18 16 5 15 30 41 12 148 16 21 6 433
Barge 42 51 19 38 31 45 14 47 45 70 22 3 57 89 30 143 55 84 26 12 62 11,991 3,657 4,386
Landing Craft 5 2 ‐ ‐ ‐ ‐ ‐ ‐ 7 4 1 ‐ 8 5 2 3 7 4 1 5 8 5 2 ‐
Tug Boat 33 4 1 ‐ 36 6 1 ‐ 59 9 3 ‐ 64 11 3 1 58 12 4 90 68 1,469 444 59
Fisshing Vessel ‐ ‐ ‐ ‐ ‐ ‐ ‐ ‐ 7 ‐ ‐ ‐ 5 1 0 ‐ 18 2 1 8 21 25 1 ‐
Pleasure Vessel 4 ‐ ‐ ‐ ‐ ‐ ‐ ‐ 5 ‐ ‐ ‐ 2 0 0 ‐ 3 ‐ ‐ 2 3 16 9 ‐
Government Ship ‐ ‐ ‐ ‐ ‐ ‐ ‐ ‐ 7 ‐ ‐ ‐ 12 1 0 ‐ ‐ ‐ ‐ ‐
Others 6 9 3 ‐ 21 38 11 11 40 70 21 25 36 65 20 27 60 284 155 81 47 17,081 8,268 10,259
Total 170 286 131 353 131 338 131 334 229 639 261 663 251 1,181 600 1,839 283 1,357 678 590 284 33,238 13,796 27,015
Table 2: Number of Ships Registered in Malaysia by Type (New Classification) and weight, 2001‐2006
Appendix 1

| MA
RIN
E F
RO
NT
IER
@ U
niKL
35 MIMET Technical Bulletin Volume 1 (2) 2010
NO SHIP NAME OWNER/OPERATOR GRT DWT NRT LENGTH
(L) BREADTH
(B) DEPTH (D)
YEAR OF REGISTRY
1 Bosta Kayung No 11 Borneo Shipping & Timber Agencies Sdn bhd
61.00 1996
2 Bosta Kayung No 12 Borneo Shipping & Timber Agencies Sdn bhd
61.00 ‐
17.00 21.56 6.77 2.59 1996
3 Bosta Kayung No 15 Borneo Shipping & Timber Agencies Sdn bhd
163.00 1996
4 Bosta Kayung No 16 Borneo Shipping & Timber Agencies Sdn bhd
64.00 1996
5 Canggih 7 Canggih Shipping sdn bhd 99.00 1996
6 Canggih No 1 Canggih Shipping sdn bhd 91.00 1996
7 Cathay 28 Oriental Grandeur Sdn Bhd 43.18 ‐ 10.71 16.38 4.88 1.83 1996
8 Costal 45 Coastal Transport (Malaysia) Sdn Bhd 60.00 1996
9 Continental No 1 Tung Yuen Tug Boat Sdn Bhd 70.88 1996
10 Dai Feng Hang Hock Peng Furniture & General Contractor Sdn Bhd
42.77 1996
11 Delta 3 United Orix Leasing Bhd 100.00 ‐ 8.00 22.71 6.70 2.43 1996
12 Dikson 4 Dickson Marine Co Sdn Bhd 18.00 1996
13 Ever commander Pengagkutan Kekal Sdn Bhd 91.70 ‐ 33.64 20.12 5.88 2.20 1996
14 Ever Plying Pengangkutan Kekal Sdn Bhd 38.71 1996
15 Ever Profit Pengangkutan Kekal Sdn Bhd 38.71 1996
16 Ever Star Pengangkutan Kekal Sdn Bhd 75.00 1996
17 Ever Sunny Pengangkutan Kekal Sdn Bhd 38.71 1996
18 Ever Trust Pengangkutan Kekal Sdn Bhd 38.71 1996
19 Flora Ocarina Development Sdn Bhd 155.00 ‐ 47.00 23.61 7.60 3.20 1996
20 Hung Ann No 2 WTK Realty Sdn Bhd 81.00 1996
21 Jaysiang 1 Jaysiang Shipping Sdn Bhd 36.00 ‐ 9.69 15.15 4.75 2.44 1996
22 Kencana Murni Lunar Shipping Sdn Bhd 107.00 ‐ 6.41 22.06 6.70 2.90 1996
23 Kendredge 3 Kendredge Sdn bhd 104.73 ‐ 25.53 20.91 6.68 1.98 1996
24 Kionhim 99 LKC Shipping Line Sdn Bhd 186.00 ‐ 55.00 24.36 7.92 3.65 1996
25 Power 6 Natural Power Sdn Bhd 95.52 ‐ 35.53 20.48 6.10 2.44 1996
26 Promex 16 Penguin Maritme Sdn Bhd 95.00 ‐ 18.00 20.74 6.10 2.75 1996
27 Rajang 2 Tristar Shipping & Trading Sdn Bhd 41.00 ‐ 9.00 15.75 4.57 2.13 1996
28 Rebecca No 1 Laut Sepakat Sdn Bhd 123.00 1996
29 Rising No 2 Rising Transport Sdn Bhd 78.00 1996
30 Sang Collie Sang Muara Sdn Bhd 228.00 1996
31 Shin Yang 25 Shin Yang Shiping Sdn Bhd 58.00 ‐ 8.00 18.48 5.09 2.44 1996
32 Shin Yang 26 Shin Yang Shiping Sdn Bhd 58.00 ‐ 8.00 18.48 5.09 2.44 1996
33 Shin Yang 33 Shin Yang Shipping Sdn Bhd 58.00 1996
34 Sing Meu 2 KingLory Shipping Sdn Bhd 93.00 ‐ 28.00 19.41 6.07 2.71 1996
35 Smooth Trend No 5 United Orix Leasing Bhd 84.00 1996
36 Surplus Well 1 Surplus Well Sdn Bhd 94.15 ‐ 28.48 20.27 6.03 2.44 1996
37 Timberwell No 1 Timberwell Enterprise Sdn Bhd 85.00 1996
38 Tong Seng No 10 Mee Lee Shipping Sdn Bhd 100.00 1996
39 Tung Yuen 16 Shin Yang Shipping Sdn Bhd 33.41 ‐ 7.39 16.37 4.01 1.98 1996
40 Brantas 25 Brantas Sdn Bhd 144.00 ‐ 44.00 22.04 7.30 3.20 1997
41 Cathay 8 United Orix Leasing Malaysia Berhad 59.91 ‐ 12.87 16.82 4.88 2.29 1997
42 Chico United Orix Leasing Berhad 88.45 ‐ 13.70 19.28 6.40 3.05 1997
43 Chiong Hin No 8 Chung Sie Chiong 90.00 1997
44 Crystal No 2 Hong Leong Leasing Sdn Bhd 49.00 1997
45 Destiny Empayar Semarak Sdn Bhd 152.00 170.83 46.00 23.13 7.60 3.50 1997
46 East Ocean 2 Samsilamsan Shipping Sdn Bhd 191.00 1997
47 Fordeco 19 Fordeco Sdn Bhd 98.00 37.00 20.73 6.40 2.65 1997
48 GHKO No 1 GHKO Shipping Company Sdn Bhd 86.00 1997
49 Global I Kai Lee Shipping Sdn Bhd 99.00 ‐ 10.00 23.10 6.10 2.75 1997
50 Hin Leong 98 Puh Tye Shipping Sdn Bhd 78.00 115.22 19.00 20.92 5.49 2.44 1997
Table 3 : Tug boat Registered in Malaysia(1996‐2006)

| MA
RIN
E F
RO
NT
IER
@ U
niKL
36 MIMET Technical Bulletin Volume 1 (2) 2010
NO SHIP NAME OWNER/OPERATOR GRT DWT NRT LENGTH
(L) BREADTH
(B) DEPTH (D)
YEAR OF REGISTRY
51 Ilham Tiga Ilham Marine Services Sdn Bhd 46.00 27.70 13.00 16.75 5.00 2.13 1997
52 Jayatung No 3 Rajang Palmcorp Sdn Bhd 120.96 1997
53 Jimi Huak 96 Lea Wah Enterprise Sdn Bhd 56.07 ‐ 15.44 18.74 4.88 2.32 1997
54 Jinway No 21 Bonworld Shipping Sdn Bhd 36.00 1997
55 King Rich 96 Trans‐Sungai Development Sdn Bhd 114.81 ‐ 32.27 21.76 6.98 2.90 1997
56 Kresna Raya I See Song & Sons Sdn Bhd 60.96 1997
57 Kuari Rakyat No 8 Kuari Rakyat Sdn Bhd 90.32 1997
58 Puh Tye No 5 Puh Tye Shipyard Sdn Bhd 76.00 1997
59 Rank No 1 Multi Rank Sdn Bhd 28.00 1997
60 Riki 15 Perkapalan Pelayaran Sdn Bhd 96.00 ‐ 33.00 20.66 6.19 2.36 1997
61 Ronmas No 6 Ronmas Shipping Sdn Bhd 81.00 1997
62 Ronmas No 7 Ronmas Shipping Sdn Bhd 99.00 1997
63 Sabahtug No 9 Cowie Marine Transportation Sdn Bhd
55.73 1997
64 Sarinto 2 Samlimsan Shipping Sdn Bhd 191.00 1997
65 Seawell 9 Seawall Sdn Bhd 60.00 1997
66 Seraya No 3 GoodWood (Sabah) Sdn Bhd 97.00 1997
67 Sili Suai No 6 KTS Equiment Rental Sdn Bhd 70.00 1997
68 Sili Suai No 8 KTS Equiment Rental Sdn Bhd 59.00 1997
69 Sin Matu 18 Sin Matu Sdn Bhd 106.00 1997
70 Sin Matu 22 Sin Matu Sdn Bhd 97.00 1997
71 Sing Hong 97 Lee Siew Hee 81.00 1997
72 Solid Marigin No 1 Solid Margin Sdn Bhd 91.00 1997
73 Swee Swee Joo Coastal Shipping Sdn Bhd 117.00 1997
74 Ta Ho No 1 Chieng Lee Hiong 93.00 1997
75 Tai Feng Long Wang Nieng Lee Holdings Berhad 43.00 1997
76 Togo Super Kim Huak Trading Sdn Bhd 67.09 1997
77 Transspacific 1 Merit Metro Sdn Bhd 186.00 1997
78 Trumpco Satu Trumpco Sdn Bhd 83.20 1997
79 Bosta Kayung No 17 Borneo Shipping & Timber Agencies Sdn bhd
136.00 1998
80 Bosta Kayung No 18 Borneo Shipping & Timber Agencies Sdn bhd
66.31 1998
81 Cathay 38 United Orix Leasing Malaysia Berhad 59.91 ‐ 12.87 16.82 4.88 2.29 1998
82 Cormorant 1 Penguin Maritime Sdn Bhd 104.00 ‐ 32.00 20.26 6.70 2.90 1998
83 Dikson 8 Dickson Marine Co Sdn Bhd 123.28 1998
84 Ever Splendid Pengangkutan Kekal Sdn Bhd 38.71 1998
85 Haggai 1 Brantas Sdn Bhd 99.00 ‐ 29.10 22.56 6.46 2.44 1998
86 Juara Juara Marin Sdn Bhd 172.00 ‐ 51.00 22.85 7.60 3.70 1998
87 Klih 1 Kuala Lumpur Indholding Bhd 109.00 ‐ 33.00 20.31 6.80 3.43 1998
88 Poh lee hong 3 Hock Peng Furniture & General Contractor Sdn Bhd
69.00 1998
89 Poh Thai No 1 Ngie Lee Dockyard Sdn Bhd 40.09 1998
90 Seawell 83 Double Dynasty Sdn Bhd 178.00 ‐ 54.00 24.26 7.60 3.50 1998
91 Sharon WTK Realty Sdn Bhd 82.00 ‐ 23.00 18.45 5.88 2.29 1998
92 Silvia WTK Realty Sdn Bhd 77.00 ‐ 21.00 18.45 6.10 2.44 1998
93 Singawan Bunga Shing Liang Shipping Sdn Bhd 105.00 1998
94 Bosta Kayung No 19 Borneo Shipping & Timber Agencies Sdn bhd
66.31 1999
95 Brantas 22 Brantas Sdn Bhd 144.05 1999
96 Bumban Jaya Mega shipping Sdn Bhd 87.71 1999
97 Cathay 58 Oriental Grandeur Sdn Bhd 36.11 ‐ 7.68 16.18 4.11 2.13 1999
98 Cathay 68 Oriental Grandeur Sdn Bhd 58.00 ‐ 50.00 17.20 5.70 2.62 1999
99 Haggai 1 Vital Focus Shipping Sdn Bhd 99.26 ‐ 29.10 22.56 6.46 2.44 1999

| MA
RIN
E F
RO
NT
IER
@ U
niKL
37 MIMET Technical Bulletin Volume 1 (2) 2010
NO SHIP NAME OWNER/OPERATOR GRT DWT NRT LENGTH
(L) BREADTH
(B) DEPTH (D)
YEAR OF REGISTRY
100 Highline 1 Highline Shipping Sdn Bhd 192.00 1999
101 Hongdar 99 Hung Leong Shipping Sdn Bhd 132.00 1999
102 Kendredge 2 Kendredge Sdn bhd 136.00 1999
103 Keng Seng Yoe Tian Sang 41.63 ‐ 12.10 15.35 4.88 2.31 1999
104 Kuantan Kuantan Port Consortium Sdn Bhd 319.00 ‐ 95.00 28.46 9.60 4.36 1999
105 Sin Matu No 23 Sin Matu Sdn Bhd 135.00 1999
106 Teknik Juara Lunar Offshore Sdn Bhd 253.00 1999
107 Cathay 78 Oriental Grandeur Sdn Bhd 40.57 ‐ 8.11 17.07 4.88 1.92 2000
108 Coastal 55 Coastal Transport (Sandakan) Sdn Bhd
60.00 ‐
11.00 18.60 5.90 2.40 2000
109 Ever Achieve Pengagkutan Kekal Sdn Bhd 63.76 2000
110 Fordeco 30 Fordeco Sdn Bhd 103.00 ‐ 31.00 23.04 6.82 3.63 2000
111 Haggai 3 Vital Focus Shipping Sdn Bhd 115.00 2000
112 Highline 21 Highline Shipping Sdn Bhd 102.46 ‐ 31.33 20.76 6.55 2.44 2000
113 Kendredge Kendredge Sdn bhd 144.00 2000
114 Reignmas No 1 Reignmas Shipping Sdn Bhd 136.97 2000
115 Sabahtug No 10 Cowie Marine Transportation Sdn Bhd
81.00 2000
116 Syukur Northport (Malaysia) Bhd 169.00 2000
117 Teraya 1 Huang Teck Soo Sdn Bhd 45.69 2000
118 Teraya 11 Huang Teck Soo Sdn Bhd 36.64 2000
119 Transcend 1 Maju Kidurong Shipping 91.00 2000
120 Botany bay Friendly Avenue Sdn Bhd 75.22 ‐ 12.61 19.51 6.30 2.92 2001
121 Cathay 26 Oriental Grandeur Sdn Bhd 66.39 2001
122 Cathay 36 Oriental Grandeur Sdn Bhd 66.39 2001
123 Destiny No 4 Destiny Shipping Agency (M) Sdn Bhd 165.00 2001
124 Inai Teratai 122 Inai Kiara Sdn Bhd 149.00 2001
125 Jaya Raya LKC Shipping Line Sdn Bhd 91.00 2001
126 Jayaraya LKC Shipping Line Sdn Bhd 91.00 2001
127 Kismet 11 Bontalia Shipping Sdn Bhd 88.73 2001
128 Robin 6 Robin Welding & Engineering Sdn Bhd
153.00 ‐
7.78 13.02 3.32 1.04 2001
129 Sabahtug No 11 Cowie Marine Transportation Sdn Bhd
144.00 2001
130 Sapah No 51 Cowie Marine Transportation Sdn Bhd
49.00 2001
131 Sapah No 52 Cowie Marine Transportation Sdn Bhd
55.73 2001
132 Serdadu Jaya Kionhim Shipping Sdn Bhd 2001
133 Shinta Perkasa Lee Teng Hooi & Sons Trd Sdn Bhd 92.35 2001
134 Singawan Wira Shing Liang Shipping Sdn Bhd 105.06 2001
135 Suria Permata Pengangkutan Kekal Sdn Bhd 125.00 2001
136 Triwise Lau Hua Ching 80.79 ‐ 26.96 19.42 5.37 2.23 2001
137 Cathay 56 Oriental Grandeur Sdn Bhd 145.00 ‐ 14.43 18.73 7.32 2.44 2002
138 Danum 2 Ajang Shipping Sdn Bhd 475.00 2002
139 Destiny No 3 Destiny Shipping Agency (M) Sdn Bhd 432.00 2002
140 Fonlink 1 Fonlink Shipping Sdn Bhd 85.12 2002
141 Gerak Cekap Fast Meridian Sdn Bhd 171.00 2002
142 GerakPantas Fast Meridian Sdn Bhd 171.00 2002
143 Gerak Tegas Fast Meridian Sdn Bhd 164.00 2002
144 Gunung Damai 1 Gunung Damai Shipping Sdn Bhd 265.00 2002
145 Gunung Damai 1 LKC Shipping Line Sdn Bhd 265.00 2002
146 Highline 23 Highline Shipping Sdn Bhd 207.00 2002
147 Highline 26 Highline Shipping Sdn Bhd 271.00 2002
148 Hilal Bintulu Port Sdn Bhd 242.00 65.40 73.00 24.00 9.60 3.60 2002
149 Hock Mew XII Seawell Sdn Bhd 76.22 2002
150 Inai Teratai 85 Inai Kiara Sdn Bhd 83.00 2002

| MA
RIN
E F
RO
NT
IER
@ U
niKL
38 MIMET Technical Bulletin Volume 1 (2) 2010
NO SHIP NAME OWNER/OPERATOR GRT DWT NRT LENGTH
(L) BREADTH
(B) DEPTH (D)
YEAR OF REGISTRY
151 Jemaja Wang Nieng Lee Holdings Berhad 110.00 2002
152 Jin Hwa 8 Yimanda Corporation Sdn Bhd 52.71 2002
153 Kantan Mesra Kantan Jaya Marine Services (Pg) Sdn Bhd
232.00 2002
154 Kismet 12 Bontalia Shipping Sdn Bhd 83.29 2002
155 Sinar Pelutan 1 Woodman Avenue Sdn Bhd 256.00 2002
156 Spring Star 1 Daily Venture Corporation Sdn Bhd 141.36 2002
157 Sungai Silat 1 Woodman Mewah Sdn Bhd 271.00 2002
158 Triple Light Inai Kiara Sdn Bhd 149.00 2002
159 Tuton Fast Meridian Sdn Bhd 171.00 2002
160 Bosta Kayung No 20 Borneo Shipping & Timber Agencies Sdn bhd
239.00 2003
161 Cathay 76 Oriental Grandeur Sdn Bhd 78.46 2003
162 Cathay 96 Oriental Grandeur Sdn Bhd 38.16 2003
163 Chin Ung 1 Sawai Jugah Sendirian Berhad 46.83 2003
164 Danum 11 Shin Yang Shipping 89.00 ‐ 27.00 22.00 6.10 2.70 2003
165 Danum 6 Shin Yang Shipping Sdn Bhd 89.00 ‐ 27.00 22.00 6.10 2.70 2003
166 Danum 8 Shin Yang Shipping Sdn Bhd 475.00 ‐ 143.00 34.92 11.40 4.95 2003
167 Dolson Zengo corporation Sdn Bhd 139.50 2003
168 Dolxin Zengo corporation Sdn Bhd 137.20 2003
169 Dolyi Zengo corporation Sdn Bhd 138.60 2003
170 Epic Challenger Epic OffShore (M) Sdn Bhd 404.00 2003
171 Ever Armada Pengagkutan Kekal Sdn Bhd 131.87 2003
172 Fonlink No 2 Fonlink Shipping Sdn Bhd 120.90 2003
173 Fordeco 25 Fordeco Shipping Sdn Bhd 202.00 2003
174 Fordeco 33 Fordeco Shipping Sdn Bhd 83.00 2003
175 Godri Satu Godrimaju Sdn Bhd 120.00 2003
176 Grand Marine No 1 Grand Marine Shipping Sdn Bhd 434.00 2003
177 Highline 29 Highline Shipping Sdn Bhd 271.00 ‐ 82.00 28.21 8.60 4.12 2003
178 Highline 32 Highline Shipping Sdn Bhd 427.00 2003
179 Highline 35 Highline Shipping Sdn Bhd 187.00 2003
180 Inai Teratai 321 Inai Kiara Sdn Bhd 379.48 2003
181 Inai Teratai 72 Inai Kiara Sdn Bhd 97.50 2003
182 Indah Abadi 1 Woodman Indah Sdn Bhd 267.00 81.00 28.83 8.54 3.80 2003
183 Jin Hwa 10 Wong Sie Tuong 114.00 2003
184 Kendredge 5 Kendredge Sdn bhd 127.00 2003
185 Kinsing Jaya Kionhim shipping Sdn Bhd 56.48 2003
186 Kline 1 Tenaga Shipping Sdn Bhd 246.00 2003
187 Poly 7 Omni Maritme Sdn Bhd 139.80 2003
188 Reignmas 3 Reignmas Shipping Sdn Bhd 155.00 2003
189 Royco 119 Royston Cole Marine Sdn Bhd 194.00 2003
190 Salik Elik Sdn Bhd 86.25 2003
191 Sing Hong 98 Lee Ting Hock 86.25 2003
192 Sung Fatt Sung Fatt Shipping Sdn Bhd 54.39 ‐ 26.87 19.51 5.18 2.13 2003
193 Sung Tahi lee 3 Sung Tahi Lee Sdn Bhd 144.00 2003
194 Sungai Julan 1 Woodman Layun Sdn Bhd 271.00 2003
195 Target Target Shipping Sdn Bhd 220.00 2003
196 Taurians Three Bonafile Shipbuilders & Repairs Sdn Bhd
171.00 2003
197 Tobi 9 James Lau King Wee 102.46 2003
198 Tri zip Lau Hua Ching 60.00 2003

| MA
RIN
E F
RO
NT
IER
@ U
niKL
39 MIMET Technical Bulletin Volume 1 (2) 2010
NO SHIP NAME OWNER/OPERATOR GRT DWT NRT LENGTH
(L) BREADTH
(B) DEPTH (D) YEAR OF
REGISTRY
199 Cahaya 5 Straight Ace Sdn Bhd 117.00 ‐ 36.00 21.96 6.10 3.05 2004
200 Cathay 17 Oriental Grandeur Sdn Bhd 89.78 ‐ 13.09 19.68 6.10 2.44 2004
201 Cathay 86 Oriental Grandeur Sdn Bhd 40.39 ‐ 11.92 13.14 4.90 2.50 2004
202 Epic Sasa Epic Industri (M) Sdn Bhd 229.00 2004
203 Epillars Eastern Pillars Shipping Sdn Bhd 122.00 2004
204 Ever Master Pengangkutan Kekal Sdn Bhd 101.28 2004
205 Everbright 9 Midas Choice Sdn Bhd 253.00 2004
206 Fordeco 35 Fordeco Sdn Bhd 194.00 2004
207 Fordeco 37 Fordeco Sdn Bhd 93.00 28.00 21.24 6.00 2.88 2004
208 Fordeco 39 Fordeco Sdn Bhd 93.00 28.00 21.24 6.00 2.88 2004
209 Goldlion Baker Marine Sdn Bhd 391.00 2004
210 Harbour Aquarius Harbour Agencies(Sibu) Sdn Bhd 150.00 2004
211 Inai Teratai 31 Inai Kiara Sdn Bhd 425.00 2004
212 Jin Hwa 12 Teck Sing Hing Shipping Sdn Bhd 128.00 2004
213 Jin Hwa 15 Gimhwak Enterprise Sdn Bhd 128.00 2004
214 Kentjana No 6 Sawai Jugah Sdn Bhd 52.26 2004
215 Rembros 21 Scyii Brothers Shipyard Sdn Bhd 114.00 2004
216 Sabahtug No 12 Cowie Marine Transportation Sdn Bhd 144.00 2004
217 Se Mariam 1 Se Mariam Sdn Bhd 247.00 2004
218 Se Mariam 2 Se Mariam Sdn Bhd 247.00 2004
219 Searights Satu Right Attitude Sdn Bhd 177.00 2004
220 Sungai Layun 1 Woodman Enterprise Sdn Bhd 261.00 ‐ 79.00 28.82 8.54 3.80 2004
221 Texaron 1 Brantas Sdn Bhd 62.91 ‐ 24.50 17.88 4.90 2.36 2004
222 Ever Venus Pengangkutan Kekal Sdn Bhd 133.20 ‐ 46.88 21.30 6.70 2.90 2005
223 Johan Pioneer 1 Johan Shipping Sdn Bhd 269.00 ‐ 81.00 28.07 8.60 4.12 2005
26293.40

| MA
RIN
E F
RO
NT
IER
@ U
niKL
40 MIMET Technical Bulletin Volume 1 (2) 2010
NO
SHIP NAME OWNER/OPERATOR GRT DWT NRT LENGTH
(L) BREADTH
(B) DEPTH (D)
YEAR OF REGISTRY
1 Bangga Ocean Contract Sdn Bhd 2,132.00 1996
2 Bestvic 11 Hong Leong Sdn Bhd 1317.00 ‐ 376.00 67.30 18.29 4.27 1996
3 Bestco 98 Ling Peng Noon Shipyard Sdn Bhd 602.00 1996
4 Bonggoya 83 Syarikat Pengangkutan Bonggoya Sdn Bhd 1,097.00 1996
5 Bonspeed Bonspeed Shipping Sdn Bhd 703.00 ‐ 211.00 54.88 17.07 3.05 1996
6 Boo Hin No 26 Hong Leong Leasing Sdn Bhd 1,368 1996
7 Canggih 8 Canggih Shipping Sdn Bhd 839.00 ‐ 252.00 52.67 17.07 3.66 1996
8 Dimensi 1 WTK heli‐Logging Sdn Bhd 256.00 612.00 77.00 35.11 12.19 2.44 1996
9 Econ 9 Akasuria Sdn Bhd 635.00 1996
10 Fel 7 Mee Lee Shipping Sdn Bhd 909.00 ‐ 1293.00 69.49 19.20 3.66 1996
11 Fordeco No 26 Fordeco Sdn Bhd 644.00 1996
12 Fordeco No 20 Fordeco Sdn Bhd 1078.00 1996
13 Fordeco No 23 Fordeco Sdn Bhd 1041.00 1996
14 Fordeco No 2301 Fordeco Sdn Bhd 927.00 ‐ 589.00 57.60 22.00 4.00 1996
15 Gantisan Satu Lembaga Letrik Sabah 1961.00 ‐ 589.00 57.60 22.00 4.00 1996
16 King Rich 168 Trans‐Sungai Development Sdn Bhd 849.00 ‐ 265.00 52.68 17.07 3.66 1996
17 Kingglory 8 Kinglory Shipping Sdn Bhd 1273.00 1996
18 Kingglory 9 Kinglory Shipping Sdn Bhd 1273.00 1996
19 Labu Jaya Omni Maritime Sdn Bhd 702.00 ‐ 211.00 52.67 17.07 3.05 1996
20 Legendary 1 Kii Ek Ho 522.00 ‐ 157.00 43.89 15.24 3.05 1996
21 Legendary 2 Kii Ek Ho 522.00 ‐ 158.00 43.89 15.24 3.05 1996
22 Legendary 3 Rimbunan Hijau Sdn Bhd 251.00 ‐ 189.00 35.12 12.19 1996
23 Legendary 4 Mrloh Shiiung Ming 499.00 150.00 42.14 1524.00 3.05 1996
24 Liga No 2 Liga Muhibbah Sdn Bhd 829.00 1996
25 Linau 26 Shin Yang Shipping Sdn Bhd 1223.00 ‐ 367.00 69.66 18.30 3.66 1996
26 Linau 30 Shin Yang Shipping Sdn Bhd 1622.00 ‐ 953.00 61.45 18.30 4.57 1996
27 Linau 38 Shin Yang Shipping Sdn Bhd 1444.00 ‐ 433.00 69.66 18.29 4.27 1996
28 Linau 39 Shin Yang Shipping Sdn Bhd 1444.00 ‐ 433.00 69.66 18.29 4.27 1996
29 Lingco 151 Tekun Enterprise Sdn Bhd 410.00 ‐ 123.00 43.89 12.19 3.05 1996
30 MAC PB 3 Muhibbah Engineering (M) Bhd 188.00 ‐ 56.00 26.33 12.19 2.44 1996
31 Malian Maju Ma Lien Shipping Sdn Bhd 841.00 ‐ 253.00 52.67 17.07 3.66 1996
32 Manjung Damai United Orix Leasing Berhad 616.00 ‐ 185.00 52.67 15.24 3.05 1996
33 Mayong No 10 Mayong (S)Sdn Bhd 243.00 1996
34 Mayong No 2 United Orix Leasing Bhd 482.00 1996
35 Mee Le No 9 Mee Lee Shipping Sdn Bhd 836.00 1996
36 Megakina 9 Megakina Shipping Sdn Bhd 943.00 ‐ 283.00 58.52 17.07 3.66 1996
37 Meranti 35 Shin Yang Shipping Sdn Bhd 1444.00 ‐ 433.00 69.66 18.29 4.27 1996
38 Nan Hai Wehaai Shipping Sdn Bhd 1093.00 ‐ 328.00 58.52 17.07 4.27 1996
39 One Up 36 Syarikat One Up Sdn Bhd 722.00 1996
40 Otimber V Hornbilland Bhd 750.00 1996
41 Power 3 Natural Power Sdn Bhd 763.00 1996
42 Rakan Daya I Hong Leong Leasing Sdn Bhd 710.00 1996
43 Rising No 1 Rising Transpot Sdn Bhd 507.00 1996
44 Sea Kite RS&L Marine Sdn Bhd 37.03 1996
45 Sebangun II Borneo Shipping& Timber Agencies Sdn Bhd 1349.00 1996
46 Sigma 2 Sigma Ray Shipping Sdn Bhd 1277.00 1996
47 Sin Lian No 5 Hong Leong Leasing Sdn Bhd 642.00 1996
48 Singa Besar 10 United Orix Leasing Bhd 291.00 1996
49 Singamas Ngang Hock Kung 443.00 1996
50 Support Station 3 Amble Strategy Sdn Bhd 6135.00 1996
Table 4 : Barge Registered in Malaysia (1996‐2006)

| MA
RIN
E F
RO
NT
IER
@ U
niKL
41 MIMET Technical Bulletin Volume 1 (2) 2010
NO
SHIP NAME OWNER/OPERATOR GRT DWT NRT LENGTH
(L) BREADTH
(B) DEPTH (D)
YEAR OF REGISTRY
51 SYN Kiong No5 Cowie Marine Transportation Sdn Bhd 702.00 1996
52 Tristar II Daily Venture Sdn Bhd 833.00 1996
53 Vision 8 Next Corporation Sdn Bhd 2132.00 1996
54 Vision 9 Next Corporation Sdn Bhd 2132.00 1996
55 Vision 10 Next Corporation Sdn Bhd 1854.00 1996
56 Wah Hai Satu Wah Hai Marine Supplies (M) Sdn Bhd 498.00 1996
57 Wang Hin Lee No 2 Hoo Chong Yiang 322.00 1996
58 Warisan 2 Lembing Megah Sdn Bhd 741.00 1996
59 Yan Yan 5 Marine Quest Sdn Bhd 839.00 1996
60 Bestvic 18 Hong Leong Sdn Bhd 1446.00 1997
61 Blue Sky 99 Blue Sky Shipping Sdn Bhd 838.00 ‐ 251.00 52.70 17.07 3.66 1997
62 Bonspeed Tiga Bonspeed Shipping Sdn Bhd 914.00 ‐ 275.00 52.70 18.30 3.66 1997
63 Borneo Lighter 21 Kionhim Shipping Sds Bhd 519.00 ‐ 156.00 43.90 15.22 3.00 1997
64 Cathay 2 Oriental Grandeur Sdn Bhd 322.00 ‐ 97.00 35.11 12.19 3.05 1997
65 Cathay 18 Oriental Grandeur Sdn Bhd 259.00 600.00 77.00 35.11 12.19 2.44 1997
66 Cathay 183 Oriental Grandeur Sdn Bhd 634.00 1600.00 190.00 51.46 15.24 3.00 1997
67 Dong Feng Jaya 1 Dong Feng Gravel Merchant Sdn Bhd 730.00 ‐ 219.00 55.34 15.72 2.75 1997
68 Dynaroy Empayar Semarak Sdn Bhd 1625.00 2462.08 488.00 70.23 19.51 4.57 1997
69 EK Soon Ching 99 Reignmas Shipping Sdn Bhd 341.00 ‐ 103.00 38.90 12.15 2.42 1997
70 Entimau No 9 Globular Sdn Bhd 844.00 1997
71 Faedah Mulia dua Faedah Mulia Sdn Bhd 553.00 ‐ 166.00 46.82 15.24 3.05 1997
72 Fauna Ocarina Development Sdn Bhd 553.00 1997
73 Fordeco No 6 Fordeco Sdn Bhd 995.00 1997
74 Fordeco No 31 Fordeco Sdn Bhd 3028.00 1997
75 Fortuna No 9 John Wong Su Kiong 839.00 1997
76 Ging lee No 1 Dragonic Shipping Sdn Bhd 633.00 1997
77 Kian Lee No 7 Lee Ling Timber Sdn Bhd 838.00 1997
78 Kiong Min I Pengangkutan Kiong Min Sdn Bhd 664.00 1997
79 Kkong Thai No 1 Umas Sdn Bhd 477.00 1997
80 Kong Thai No3 Umas Sdn Bhd 477.00 1997
81 Kong Thai No 5 Umas Sdn Bhd 477.00 1997
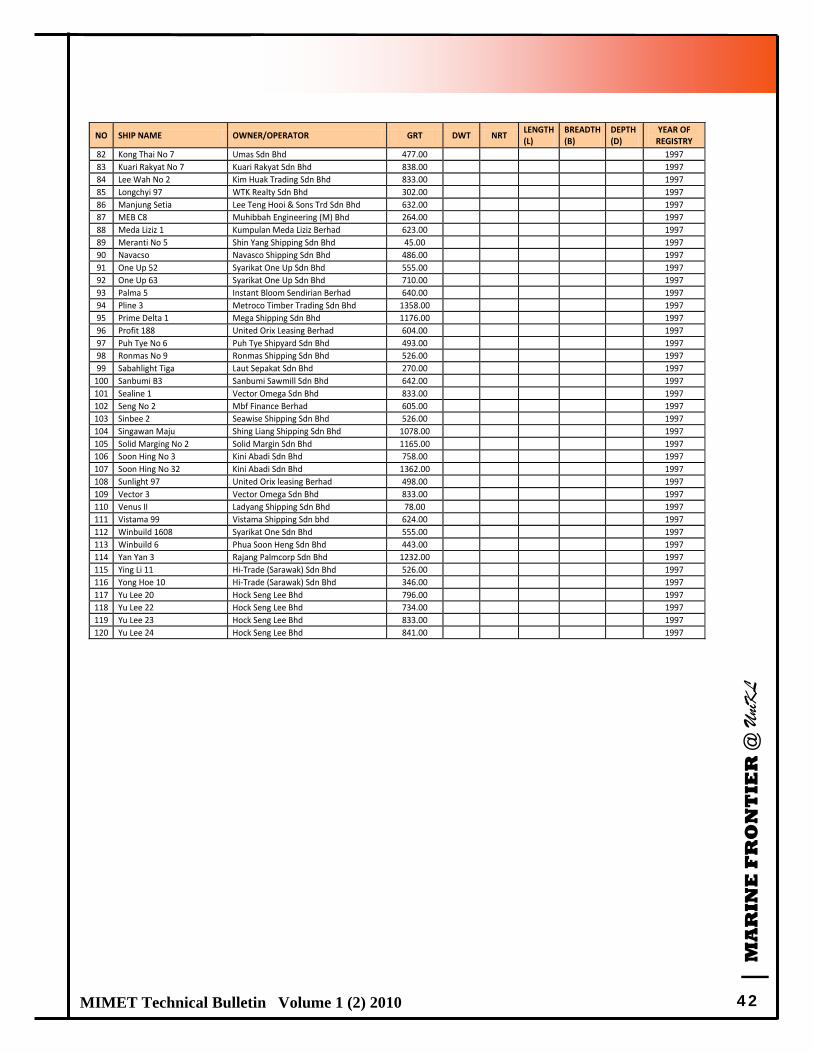
| MA
RIN
E F
RO
NT
IER
@ U
niKL
42 MIMET Technical Bulletin Volume 1 (2) 2010
NO SHIP NAME OWNER/OPERATOR GRT DWT NRT LENGTH (L)
BREADTH (B)
DEPTH (D)
YEAR OF REGISTRY
82 Kong Thai No 7 Umas Sdn Bhd 477.00 1997
83 Kuari Rakyat No 7 Kuari Rakyat Sdn Bhd 838.00 1997
84 Lee Wah No 2 Kim Huak Trading Sdn Bhd 833.00 1997
85 Longchyi 97 WTK Realty Sdn Bhd 302.00 1997
86 Manjung Setia Lee Teng Hooi & Sons Trd Sdn Bhd 632.00 1997
87 MEB C8 Muhibbah Engineering (M) Bhd 264.00 1997
88 Meda Liziz 1 Kumpulan Meda Liziz Berhad 623.00 1997
89 Meranti No 5 Shin Yang Shipping Sdn Bhd 45.00 1997
90 Navacso Navasco Shipping Sdn Bhd 486.00 1997
91 One Up 52 Syarikat One Up Sdn Bhd 555.00 1997
92 One Up 63 Syarikat One Up Sdn Bhd 710.00 1997
93 Palma 5 Instant Bloom Sendirian Berhad 640.00 1997
94 Pline 3 Metroco Timber Trading Sdn Bhd 1358.00 1997
95 Prime Delta 1 Mega Shipping Sdn Bhd 1176.00 1997
96 Profit 188 United Orix Leasing Berhad 604.00 1997
97 Puh Tye No 6 Puh Tye Shipyard Sdn Bhd 493.00 1997
98 Ronmas No 9 Ronmas Shipping Sdn Bhd 526.00 1997
99 Sabahlight Tiga Laut Sepakat Sdn Bhd 270.00 1997
100 Sanbumi B3 Sanbumi Sawmill Sdn Bhd 642.00 1997
101 Sealine 1 Vector Omega Sdn Bhd 833.00 1997
102 Seng No 2 Mbf Finance Berhad 605.00 1997
103 Sinbee 2 Seawise Shipping Sdn Bhd 526.00 1997
104 Singawan Maju Shing Liang Shipping Sdn Bhd 1078.00 1997
105 Solid Marging No 2 Solid Margin Sdn Bhd 1165.00 1997
106 Soon Hing No 3 Kini Abadi Sdn Bhd 758.00 1997
107 Soon Hing No 32 Kini Abadi Sdn Bhd 1362.00 1997
108 Sunlight 97 United Orix leasing Berhad 498.00 1997
109 Vector 3 Vector Omega Sdn Bhd 833.00 1997
110 Venus II Ladyang Shipping Sdn Bhd 78.00 1997
111 Vistama 99 Vistama Shipping Sdn bhd 624.00 1997
112 Winbuild 1608 Syarikat One Sdn Bhd 555.00 1997
113 Winbuild 6 Phua Soon Heng Sdn Bhd 443.00 1997
114 Yan Yan 3 Rajang Palmcorp Sdn Bhd 1232.00 1997
115 Ying Li 11 Hi‐Trade (Sarawak) Sdn Bhd 526.00 1997
116 Yong Hoe 10 Hi‐Trade (Sarawak) Sdn Bhd 346.00 1997
117 Yu Lee 20 Hock Seng Lee Bhd 796.00 1997
118 Yu Lee 22 Hock Seng Lee Bhd 734.00 1997
119 Yu Lee 23 Hock Seng Lee Bhd 833.00 1997
120 Yu Lee 24 Hock Seng Lee Bhd 841.00 1997

| MA
RIN
E F
RO
NT
IER
@ U
niKL
43 MIMET Technical Bulletin Volume 1 (2) 2010
NO SHIP NAME OWNER/OPERATOR GRT DWT NRT LENGTH (L)
BREADTH (B)
DEPTH (D)
YEAR OF REGISTRY
121 Carrier 1 Equal Tranport Sdn Bhd 256.00 1998
122 Cathay 22 Oriental Grandeur Sdn Bhd 257.00 1998
123 Cathay 181 United Orix Leasing Malaysia Sdn Bhd 630.00 1998
124 Ekoon No 8 Dong Guan Enterprise Sdn Bhd 164.00 1998
125 Ketara Tiga Port Klang Offshore Pilling Sdn Bhd 639.00 1998
126 Labroy 149 LKC Shipping Line Sdn Bhd 948.00 1998
127 Low Kim Chuan 1 Lkc Shipping Line Sdn Bhd 865.00 1998
128 Lucky Star Miri Housing Development Realty Sdn Bhd
1998
129 MAC PB 9 Muhibbah Engineering (M) Bhd 502.00 1998
130 MEB B 15 Muhibbah Engineering (M) Bhd 516.00 1998
131 Petrobiz Satu Kembang Suci Sdn Bhd 158.00 1998
132 Thompson No 1 Omni Maritime Sdn Bhd 553.00 1998
133 Tidalmarine Perkasa Tidalmarine Engineering Sdn Bhd 44.00 1998
134 Wantas 1 Wantas Shipping (Langkawi) Sdn Bhd 399.00 1998
135 Atilla 23 Tinjar Transport Sdn Bhd 1067.00 1999
136 Barges Island 19 Tristar Navigation Company 616.00 1999
137 Benzoil No 1 Banzoil Shipping Sdn Bhd 604.00 1999
138 Bersama Abadi 2201 Megah Mewah Shipping Sdn Bhd 1279.00 1999
139 Cathay 182 Oriental Grandeur Sdn Bhd 633.00 1999
140 MEB B22 Muhibbah Engineering (M) Bhd 2920.00 1999
141 Reignmas No 2 Reignmas Shipping Sdn Bhd 838.00 1999
142 Teknik Mutiara TI Jaya Sdn Bhd 20.56 1999
143 Tidalmarine Putra Tidalmarine Engineering Sdn Bhd 799.00 1999
144 Tidalmarine Putri Tidalmarine Engineering Sdn Bhd 799.00 1999
145 Vger 4 lee Teng Hooi & Sons Trd Sdn Bhd 1171.00 1999
146 Well Leader No 3 Katas Credit Leasing Sendirian Berhad 158.00 1999
147 Asiapride 102 Bonafile Shipbuilder & Repair Sdn Bhd 3137.00 2000
148 Bebas Jaya Tiga Nam Hua Shipping Sdn Bhd 1,368.00 2000
149 Big Fair DB1 Hong Lian Shipping Sdn Bhd 811.00 2000
150 Fordeco No 17 Fordeco Sdn Bhd 1078.00 2000
151 Golden Peace Hung Tung Trading (Sarawak) Sendirian Berhad
259.44 2000
152 Golden Sea No 29 Tawau Tug Service Sdn Bhd 627.00 2000
153 Golden Sea No 36 Tawau Tug Service Sdn Bhd 642.00 2000
154 Golden Sea No 41 Cowie Marine Transportation Sdn Bhd 868.00 2000
155 Golden Sea No 42 Tawau Tug Service Sdn Bhd 642.00 2000
156 Kiong Nguong 106 Koinhim Shipping Sdn Bhd 1078.00 2000
157 Linau 46 Shin Yang Shipping Sdn Bhd 1829.00 2000
158 Low Kim Chuan 8 Lkc Shipping Line Sdn Bhd 1434.00 2000
159 MAC PB 15 Muhibbah Engineering (M) Bhd 466.00 2000
160 MEB JB2 Muhibbah Engineering (M) Bhd 735.00 2000
161 Sealink Pacific 108 Sealink Pacific Sdn Bhd 1368.00 2000
162 Singa Besar 3 Rong Rong Marketing Sdn Bhd 1168.00 2000
163 Singa Besar 5 Tropical Energy Sdn bhd 1692.00 2000

| MA
RIN
E F
RO
NT
IER
@ U
niKL
44 MIMET Technical Bulletin Volume 1 (2) 2010
NO SHIP NAME OWNER/OPERATOR GRT DWT NRT LENGTH (L)
BREADTH (B)
DEPTH (D)
YEAR OF REGISTRY
164 Singa Besar 11 Yong Yong Trading Sdn Bhd 259.00 2000
165 Singa Besar 15 Singa Cerah Sdn Bhd 260.00 2000
166 Sung Thai Lee 2 Sung Thai Lee Sdn Bhd 1002.00 2000
167 Zambatek 88 Focus Fleet Sdn Bhd 1899.00 2000
168 Alliance 88 Dickson Marine Co Sdn Bhd 181.00 2001
169 Atilla 24 Tinjar Transport Sdn Bhd 1279.00 2001
170 Atilla 25 Tinjar Transport Sdn Bhd 1,067.00 2001
171 Bagusia No1 Bagusia Sdn Bhd 522.00 2001
172 Bosta Jaya 18 Borneo Shipping & Timber Agencies Sdn Bhd
799.00 2001
173 Dunga 2302 LKC Shipping Line Sdn Bhd 1811.00 2001
174 Entimau No 2 Globular Sdn Bhd 512.00 2001
175 Linau 48 Shin Yang Shipping Sdn Bhd 1829.00 2001
176 Linau 49 Shin Yang Shipping Sdn Bhd 812.00 2001
177 Linau 50 Shin Yang Shipping Sdn Bhd 895.00 2001
178 Malindo No 2 Msgear Shipping Sdn Bhd 1218.00 2001
179 Monarch 39 Castalia Sdn Bhd 1073.00 2001
180 Sane No 1 Syarikat Sebangun Sdn Bhd 2132.00 2001
181 Sin Matu 25 Sin Matu Sdn Bhd 1468.00 2001
182 Singawan Raya Shing Liang Shipping Sdn Bhd 1069.00 2001
183 Tairen II W & Y Enterprise Sdn Bhd 666.00 2001
184 Togo Satu Globular Sdn Bhd 519.00 2001
185 Bonggoya 90 Syarikat Pengangkutan Bonggoya Sdn Bhd
1,368.00 2002
186 Dynaroy No 3 Destiny Shipping Agency(m) Sdn Bhd 3072.00 2002
187 Pelepas Trainer Pelabuhan Tanjung Pelepas Sdn Bhd 256.00 2002
188 Reignmas Jaya Reignmas Shipping Sdn Bhd 1416.00 2002
189 Serafine 02 Bonafile Shipbuilders & Repairs Sdn Bhd 1352.00 2002
190 Asiapride 3048 Bonafile Shipbuilder & Repair Sdn Bhd 3137.00 2003
191 Asiapride 30617 Bonafile Shipbuilder & Repair Sdn Bhd 3137.00 2003
192 Atilla 32 Tinjar Transport Sdn Bhd 419.00 2003
193 Azimat 1 Azimat Engineering Services Sdn Bhd 256.00 2003
194 Botany 1203 Friendly Avenue Sdn Bhd 256.00 2003
195 Cathay 151 Oriental Grandeur Sdn Bhd 512.00 2003
196 Cathay 189 Oriental Grandeur Sdn Bhd 729.00 2003
197 Modermott Derrick Barge No 26
Barmada Modermott (L) Limited 11213.00 2003
198 Penaga Warni LKC Shipping Line Sdn Bhd 2142.00 2003
199 Pulau Keladi Pekerjaan Piasau Konkerit Sdn Bhd 930.00 2003
200 Sealink Pacific 202 Sutherfield Resources Sdn Bhd 2641.00 2003
201 Sealink U285 Sealink Sdn Bhd 2641.00 2003
202 Sealink U286 Euroedge Sdn Bhd 2641.00 2003

| MA
RIN
E F
RO
NT
IER
@ U
niKL
45 MIMET Technical Bulletin Volume 1 (2) 2010
NO SHIP NAME OWNER/OPERATOR GRT DWT NRT LENGTH (L)
BREADTH (B)
DEPTH (D)
YEAR OF REGISTRY
203 Sin Tung 120 CB Industrial Product Sdn Bhd 258.00 2003
204 Singa Besar 19 Rong Rong Marketing Sdn Bhd 249.00 2003
205 Singa Besar 21 Rong Rong Marketing Sdn Bhd 2167.00 2003
206 Tai Hin 13 Lee Sooi Sean 256.00 2003
207 Tian Li 28 John Wong Su Kiong And Fong Nyet Len 728.00 2003
208 Asiapride 3087 Bonafile Shipbuilder & Repair Sdn Bhd 3137.00 2004
209 Asiapride 3093 Bonafile Shipbuilder & Repair Sdn Bhd 3137.00 2004
210 Asiapride 3095 Bonafile Shipbuilder & Repair Sdn Bhd 3137.00 2004
211 Botany 1801 Friendly Avenue Sdn Bhd 634.00 2004
212 Cathay 188 Oriental Grandeur Sdn Bhd 631.00 2004
213 Emerald Ampangship & Marine Sdn Bhd 4472.00 2004
214 Fordeco No 29 Fordeco Sdn Bhd 1416.00 2004
215 Forest Prime No 2 Sipoh Shipping & Exporter Sdn Bhd 1446.00 2004
216 Gainline No 5 Gainline Enterprise Sdn Bhd 702.00 2004
217 Lucky Way Coastal Transport(Sandakan)Sdn Bhd 896.00 2004
218 Mariam 281 Se Mariam Sdn Bhd 3327.00 2004
219 Muhibbah B25 Muhibbah Engineering 1217.00 2004
220 Mihibbah B26 Muhibbah Engineering (M) BHd 634.00 2004
221 Muhibbah B27 Muhibbah Engineering (M) BHd 634.00 2004
222 Pertiwi VII Pertiwi Shipping Sdn Bhd 468.00 2004
223 Sealink Pacific 288 Sutherfield Resources Sdn Bhd 2987.00 2004
224 Sealink Pacific 382 Navitex Shipping Sdn Bhd 2641.00 2004
225 Silversea No 1 Makjaya Sdn Bhd 947.00 2004
226 Silversea No 2 Makjaya Sdn Bhd 947.00 2004
227 Silversea No 3 Makjaya Sdn Bhd 835.00 2004
228 Silversea No 4 Cowie Marine Transportation Sdn Bhd 835.00 2004
229 Silversea No 5 Cowie Marine Transportation Sdn Bhd 1298.00 2004
230 Sinar Samudera Alam Kejora Sdn Bhd 1271.00 2004
231 Singa Besar I Rong Rong Marketing Sdn Bhd 1252.00 2004
232 Singa Besar 27 Rong Rong Marketing Sdn Bhd 249.00 2004
233 Singa Besar 29 Rong Rong Marketing Sdn Bhd 1404.00 2004
234 Soon Hing No7 Kini Abadi Sdn Bhd 737.00 2004
235 Sonn Hing No 168 Kini Abadi Sdn Bhd 737.00 2004
236 Taclobo 1 Kwantas Oil Sdn Bhd 1342.96 2004
237 Taclobo 3 Kwantas Oil Sdn Bhd 109.62 2004
238 Wantas V Wantas Shipping (Langkawi) Sdn Bhd 629.00 2004
239 Asiapride 23117 Fast Meridian Sdn Bhd 1338.00 2005
240 Luna Jaya Lunar Shipping Sdn Bhd 1981.00 2005
241 Luna Mulia Lunar Shipping Sdn Bhd 8484.00 2006
96320.58

| MA
RIN
E F
RO
NT
IER
@ U
niKL
46 MIMET Technical Bulletin Volume 1 (2) 2010
NO SHIP NAME OWNER/OPERATOR GRT DWT NRT LENGTH
(L) BREADTH
(B) DEPTH (D)
YEAR OF REGISTRY
1 Able Ensign Tauladan Gigih Sdn Bhd 3898 98.66 16.33 8.4 1996
2 Amanah Amanah International Finance
Sdn Bhd 3007
5119 89.5 16.2 7.2 1996
3 Bahagia Maju Ngee Tai Shipping Sdn Bhd 498 40.35 11.57 3.7 1996
4 Bintang Harapan Fajar Lawas Sdn Bhd 494 1996
5 Budi Suryana Budisukma Sdn Bhd 3007 5115.52 89.5 16.21 7.2 1996
6 Gee Hong Fokus Marine Sdn Bhd 9896 1996
7 Ginhoting Ginhotin Sdn Bhd 305 1996
8 Golden line Rasa Shipping Sdn Bhd 118.00 1996
9 Hiap Kin No 2 Hiap Kian Enterprise Sdn Bhd 162.00 1996
10 Hung Ann No 3 WTK Realty Sdn Bhd 69.00 1996
11 Hung Lee vl Hung Lee shipping Sdn Bhd 1593.00 1996
12 Ing Hua Seng Ing Hua Seng Shipping Sdn Bhd 497.00 1996
13 Ing Hua Soon 96 Ling Liong Kiik 180.00 1996
14 Joy 97 Bendindang Ak Manjah 301.00 1996
15 Kahing dua Tetap Sugih Sdn Bhd 1220.00 1996
16 Kedah Cement l Jumewah Shipping Sdn Bhd 10508.00 1996
17 Kim Ma No 2 Welldone Shipping Sdn Bhd 233.00 1996
18 Kim Yuen 95 Tang Siong Tiang 241.00 1996
19 Kong Jun No 2 Malsuria Holding (M) Sdn Bhd 1,773.00 1996
20 Lada Kargo l Belait Shipping Co Sdn Bhd 1,023.00 1996
21 Lee Ung Su Tung Jem 127.00 1996
22 Mega Harapan Hua Tai Shipping Sdn Bhd 427.00 1996
23 Otimber 111 Hornbilland Bhd 699.00 1996
24 Petu 9 Pito Shipping Sdn.Bhd 738.00 1996
25 Qian Feng Wang Hin Leong Shipping Sdn.Bhd
499.00
1996
26 Raja Balleh Pelangi Sakti Sdn.Bhd 80.00 1996
27 Rinwood Jaya No11
Ling Kiong hua 666.00
1996
28 Riverbank Star Riverbank Shipping Sdn.Bhd 528.00 1996
29 Riverbank Riverbank Shipping Sdn.Bhd 495.00 1996
30 Ronsan 88 Premier Fairview Sdn.Bhd 149.00 1996
31 Salura Salura Sdn Bhd 200.00 1996
32 San Tai Lee 1 Lau Kiing Ling 198.00 1996
33 Senari Harvest Venture Sdn.Bhd 1476.00 1996
34 Shinline 4 Shinline Sdn.Bhd 5,615.00 1996
35 Song Kian Baru Soon Hai Kee Shipping Sdn.Bhd 381.00 1996
36 Song Yong Wang Ling Soon Chiong 182.00 1996
37 Soon Thai Crest Enrich sdn.Bhd 397.00 1996
38 Superior Star Yong Hung Shipping Sdn.Bhd 1523.00 1996
39 Swee Joo Satu Swee Joo Coastal Shipping Sdn.Bhd
638.00
1996
40 Transallied Maju Trans‐Allied Sdn.Bhd 374.00 1996
41 Unity II Golden Dollars Shipping Sdn.Bhd
876.00
1996
42 Wei Ling Hong Yang Shipping Sdn.Bhd 408.00 1996
43 Yiaw Yang Dunmas Shipping Sdn.Bhd 5577.00 1996
44 Vistama 96 Vistama Shipping Sdn.Bhd 311.00 1996
45 Able Fusilier Tauladan Gigih Sdn Bhd 5691 1997
46 Buana Indah Roundtree Shipping Sdn Bhd 439 43.42 9.76 3.18 1997
47 Builder Fortune Chong Fui Shipping &
Forwarding Sdn Bhd 2679
80.22 14 8.7 1997
48 Demak Indah 1 Wang Nieng Lee Holdings
Berhad 439
43.42 9.76 3.18 1997
49 Eco Charger Charger Shipping Sdn Bhd 138.52 1997
50 Etlee Ling Yeo Tung 259 1997
Table 5 : General Cargo Carrier Registered in Malaysia (1996‐2006)

| MA
RIN
E F
RO
NT
IER
@ U
niKL
47 MIMET Technical Bulletin Volume 1 (2) 2010
NO SHIP NAME OWNER/OPERATOR GRT DWT NRT LENGTH
(L) BREADTH
(B) DEPTH (D)
YEAR OF REGISTRY
51 Fonwell Fonwell Shipping Sdn Bhd 291 1997
52 Gihock Irama Marine Sdn Bhd 6377 111.39 18.6 10.2 1997
53 Ging San Hon Ging San Hon Shipping Sdn Bhd 498 1997
54 Hung Lee ll Wah Leang Shipping Sdn Bhd 362.12 1997
55 Ing Hua Seng 2 Ing Hua Seng Shipping Sdn Bhd 731.00 1997
56 Ing Kua Seng 2 Ing Hua Seng Shipping Sdn Bhd 731.00 1997
57 Jamaliah West‐Mall Corporation Sdn Bhd 479.00 1997
58 Jin Hwa Tele Kenyalang Engineering Sdn Bhd
5359.00 754.22 44.55 12.18 2.71 1997
59 Kahing Tiga Tetap Sugih Sdn Bhd 1224.00 1997
60 Lian moh No 1 Chiu Nik Kiong 720.00 1997
61 Lick Teck Fonwell Shipping Sdn Bhd 291.00 1997
62 Lipan Burau Lipan Enterprise & shipping Sdn Bhd
433.00
1997
63 Maju Borneo Swee Joo Coastal Shipping Sdn Bhd
581.00
1997
64 Megaline No 1 Borneoply Shipping Sdn Bhd 347.00 1997
65 Melati Mas Timor Offshore Sdn Bhd 3960.00 6414 90.41 20 7.7 1997
66 Moh Hin No 2 GHwoods Sdn Bhd 193.00 1997
67 Mulia Abadi Nam Hua Shipping Sdn Bhd 499.00 1997
68 Ngie Tai No 5 Nutrajaya Shipping(M)Sdn.Bhd 3084.00 1997
69 Pioneer 87 Chieng Tiew Sing 26.00 1997
70 Riki 13 Riveron Shipping Sdn.Bhd 560.00 1997
71 Ronmas No 8 Ronmas Shipping Sdn.Bhd 732.00 1997
72 San Shun San Sun Shipping Sdn.Bhd 445.00 1997
73 Selamat Bahagia United Orix Leasing Bhd 498.00 1997
74 Senayong Jaya Senayong Jaya Sdn.Bhd 428.00 1997
75 Shinline 5 Shinline Sdn.Bhd 5,554.00 1997
76 Sigma 1 Sigma Ray Shipping Sdn.Bhd 636.00 1997
77 Sin Moh Soon Tiang Chiong Ming 288.00 1997
78 Sri Nam Hua 8 Virgo Metro Sdn.Bhd 499.00 1997
79 Surya Baru Chua Eng Seng 462.00 1997
80 Teck lee Sanleean Shipping Sdn.Bhd 339.00 1997
81 Tiasa indah 96 Wong Sii Kieng 66.00 1997
82 Transources Cargo 18
Transport Resources Sdn.Bhd 308.00
1997
83 Transources Cargo 19
Transport Resources Sdn.Bhd 308.00
1997
84 Vertexto 22 Compass Transport Sdn.Bhd 1142.00 1997
85 Yong Hing 12 Tan Tiew Yong 556.00 1997
86 Yung Fah Satu Yung Fah Sdn.Bhd 418.00 1997
87 Zimyin Zim Yin Shipping Sdn.Bhd 526.00 1997
88 Zuria Bonkinmas Shipping Sdn.Bhd 481.00 1997
89 Bersatu Abadi Nam Hua Shipping Sdn Bhd 497 1998
90 Foresline 3 Shinera Shipping Sdn Bhd 453 1998
91 Ingtai Ing Tai Shipping Sdn Bhd 344.00 1998
92 Lai Lai No 51 Lai Lai Development Sdn Bhd 89.00 1998
93 Lian seng hin 3 swee Joe Coastal shipping Sdn Bhd
586.00
1998

| MA
RIN
E F
RO
NT
IER
@ U
niKL
48 MIMET Technical Bulletin Volume 1 (2) 2010
NO SHIP NAME OWNER/OPERATOR GRT DWT NRT LENGTH
(L) BREADTH
(B) DEPTH (D)
YEAR OF REGISTRY
94 Marineline No 1 Sin Min Shipping Sdn Bhd 181.00 1998
95 Megaline No 7 Tropical Vision Sdn Bhd 350.00 1998
96 Nepline Teratai Nepline Berhad 2696.00 1998
97 Singawan Timbul Lau Hui Lee 88.00 1998
98 Sung Hing No 2 Tang Sing Kian 384.00 1998
99 Thailine 8 Thailine Sdn.Bhd 6,178.00 94.59 18.8 13 1998
100 Thailine 8 Thailine Sdn.Bhd 6,178.00 1998
101 Yong Hua 2 Yong Hua Marine Sdn.Bhd 2359.00 80.29 21.34 4.88 1998
102 Fortuneline 2000 Master Ace Territory Sdn Bhd 383 37 10.2 3.8 1999
103 Guan Hoe Huat No 3
Guan Hoe Huat Fishmeal Co Sdn Bhd
250.00
1999
104 Ing Soon Lee No 1 Ing Soon Lee Shipping Sdn Bhd 569.00 1999
105 Lian Soon Ting Yew kun 196.00 1999
106 Linau 42 Shin Yang Shipping Sdn Bhd 386.00 1999
107 Megaline No 9 Tropical Vision Sdn Bhd 336.00 1999
108 MMM Belinda Pan Pacific Shipping Sdn Bhd 5922.00 1999
109 Santa Suria Bendera Mawar Sdn.Bhd 10889.00 15746 139.35 21.2 12.4 1999
110 Shing Lian No 2 Shing Lian Realty Sdn.Bhd 231.00 1999
111 Shinline 6 Shinline Sdn.Bhd 5,555.00 91.87 18.8 12.9 1999
112 Shinline 8 Shinline Sdn.Bhd 5,433.00 1999
113 Crystal No 1 Ing Tai Shipping Sdn Bhd 235 2000
114 Galactic Dolphin E & W Freights & Logistics Sdn
Bhd 4477 2000
115 Mas Sutra Metro Prominent Sdn Bhd 609.20 2000
116 New Time 1 Yasmore Timbers Sdn Bhd 444.00 839.7 37.6 11.08 3.65 2000
117 Shinline 9 Shinline Sdn.Bhd 5,551.00 2000
118 Transveneer 200 Empayar Semarak Sdn.Bhd 434.00 37.54 11.08 3.65 2000
119 Transveneer Jaya Empayar Semarak Sdn.Bhd 434.00 37.54 11.06 3.65 2000
120 Transveneer Pearl Oriental Evermare Sendirian Berhad
436.00 37.81 11.08 3.66 2000
121 Wave Ruler Chromis Import & Export Sdn.Bhd
956.00
2000
122 Bonsonic Zim Yin Shipping Sdn Bhd 712 2001
123 Falcom Wise‐Synergy Sdn Bhd 27 2001
124 Fonwell No 2 Fonwell Shipping Sdn Bhd 255 2001
125 Lawas Mewah united orix Leasing Bhd 996.00 2001
126 Lawas Venture Katex Shipping Sdn Bhd 356.00 2001
127 Lee Chiong Hing No 3
Tie Teck Yew 494.00
2001
128 Lee Hong Sii Tiung Lok 181.00 2001
129 Mee Nguong 2 Chiew Tieng Ping 135.00 2001
130 Mee Nguong 3 Chiew Tieng Ping 135.00 2001

| MA
RIN
E F
RO
NT
IER
@ U
niKL
49 MIMET Technical Bulletin Volume 1 (2) 2010
NO SHIP NAME OWNER/OPERATOR GRT DWT NRT LENGTH
(L) BREADTH
(B) DEPTH (D)
YEAR OF REGISTRY
131 Mee Nguong 5 Chiew Tieng Ping 1323.00 2001
132 Mee Nguong 6 Chiew Tieng Ping 194.00 2001
133 New Time 2 Oriental Evermore Sendirian Berhad
418.00
2001
134 Nikka Bonai Shipping Sdn.Bhd 1886.00 2001
135 Rena Asas Mewah Sdn.Bhd 1238.00 65.01 11 5.7 2001
136 Riverbank Emas Pansutria Sdn.Bhd 492.00 2001
137 Riverbank Rainbow
Pansutria Sdn.Bhd 492.00
2001
138 Sentosa Jaya JP Lines Sdn.Bhd 1,660.00 2001
139 Thailine 2 Thailine Sdn.Bhd 5,552.00 2001
140 Thailine 5 Thailine Sdn.Bhd 5,601.00 2001
141 Tina Kusin Jaya Sdn.Bhd 1673.00 3865 68.01 13 7 2001
142 Alica Realink Sdn Bhd 1591 2002
143 Cora 1 Coralink Shipping Sdn Bhd 206 2002
144 Rampai Rampai Kembara Sdn.Bhd 671.00 2002
145 Santa Suria II Samudera Sempurna Sdn.Bhd 10598.00 16767 136.24 22.3 12.18 2002
146 Sinmah Ting Pin Lu 641.00 2002
147 Thailine 3 Thailine Sdn.Bhd 5,582.00 2002
148 Transveneer Glory Oriental Evermare Sendirian Berhad
474.00
2002
149 Transveneer United
Oriental Evermare Sendirian Berhad
468.00
2002
150 Cathay SP 1 OG Marine Sdn Bhd 457 2003
151 Linau 15 Shin Yang Shipping Sdn Bhd 857.00 2003
152 Marugawa Marugawa Sdn Bhd 1643.00 64.3 14 5.4 2003
153 Meu Huat Meu Huat Navigation Sdn Bhd 706.00 2003
154 New Primeline Mathew Apoi Njau 153.00 2003
155 Sinlehinn Rajang Line Sdn.Bhd 229.00 2003
156 Thailine 6 Thailine Sdn.Bhd 7,633.00 2003
157 Malayan Progress Malayan Navigation Co Sdn Bhd 1193.00 1605 64.4 11.5 6.3 2004
158 Malayan succes Malayan Navigation Co Sdn Bhd 997.00 2004
159 Man Kee 88 Perkapalan Man Kee (88) Sdn Bhd
330.00
2004
160 Maricom No 5 Maricom Shipping Sdn Bhd 713.00 2004
161 MV Borcos Sabhan 1
Syarikat Borcos Shipping Sdn Bhd
219.00
2004
162 MV Borcos Sabhan 2
Syarikat Borcos Shipping Sdn Bhd
219.00
2004
163 MV Borcos Sabhan 3
Syarikat Borcos Shipping Sdn Bhd
219.00
2004
164 MV Borcos Sabhan 4
Syarikat Borcos Shipping Sdn Bhd
219.00
2004
165 Psalm 23 Jaya Coastal Transport Sdn.Bhd 134.00 2004
166 Bima Lima Sribima (M) Shipping Sdn Bhd 243 2005
4486.00

| MA
RIN
E F
RO
NT
IER
@ U
niKL
50 MIMET Technical Bulletin Volume 1 (2) 2010
NO SHIP NAME OWNER/OPERATOR GRT DWT NRT LENGTH
(L) BREADTH
(B) DEPTH (D)
YEAR OF REGISTRY
1 Dickson 4 Dickson Marine Co sdn Bhd 18.00 1996
2 Jetta 7 Clamshell Dredging Sdn Bhd 99.38 0.00 54.15 17.14 6.71 2.44 1996
3 Kencana Murni Lunar shipping sdn BHd 107.00 0.00 6.41 22.06 6.70 2.90 1996
4 Sealink Maju Sealink Sdn Bhd 223.00 0.00 66.00 27.08 8.60 4.35 1996
5 Setia Cekal Alam Maritim (M) Sdn Bhd 994.00 750.00 299.00 56.89 12.80 4.88 1996
6 Jetta 8 Clamshell Dredging Sdn Bhd 87.67 92.30 25.95 18.00 6.71 2.44 1997
7 Suria I Lunar Shipping Sdn Bhd 86.00 0.00 14.15 19.82 6.52 2.93 1997
8 Armada Merak Bumi Armada Navigation Sdn Bhd
75.00 ‐
22.00 19.94 6.00 2.60 1997
9 Armada Mutiara Bumi Armada Navigation Sdn Bhd
75.00 ‐
22.00 19.94 6.00 2.60 1997
10 Armada Tuah 6 Bumi Armada Navigation Sdn Bhd
663.00 0.00 199.00 39.59 11.60 4.96 1998
11 Jetta 16 See Yong & Son Construction sdn Bhd
8765.00 0.00 21.41 18.30 6.71 2.44 1998
12 Oliserve Beta Oilerve Marine Sdn Bhd 443.00 1998
13 Oliserve Beta Oilerve Marine Sdn Bhd 443.00 1998
14 Ajang Harapan Ajang Shipping Sdn Bhd 3757.00 2920.00 1127.00 70.81 18.29 8.27 1998
15 Jetta 17 See Yong & Son Construction sdn Bhd
493.00 45.00 7.66 16.50 5.18 2.13 1999
16 MV Setia Jaguh Alam Maritim (M) Sdn Vhd 2023.00 2024.76 609.00 59.65 15.00 6.80 1999
17 MV Shema Seri Mukali Sdn Bhd 339.00 1999
18 Shema Seri Mukali Sdn Bhd 339.00 1999
19 Armada Tuah 7 Bumi Armada Navigation Sdn Bhd
799.00
2000
20 Sealink Maju 2 Sealink Sdn Bhd 223.00 176.00 77.00 27.01 9.00 4.25 2000
21 Armada Hydro Bumi Armada Navigation Sdn Bhd
353.00 302.69 106.00 34.80 8.50 3.80 2000
22 Cathay 16 Oriental Grandeur Sdn Bhd 93.15 0.00 12.78 17.56 7.70 2.49 2001
23 Cathay 6 Oriental Grandeur Sdn Bhd 90.44 0.00 8.42 16.00 7.62 2.44 2001
24 Jetta 22 See Yong & Son Construction sdn Bhd
8,671,00 0.00 25.02 17.57 6.71 2.44 2001
25 Armada Tuah 9 Bumi armada Navigation Sdn Bhd
1,178.00 ‐
353.00 55.55 13.80 5.50 2001
26 Sealink Cassandra Sealink Sdn Bhd 490.00 580.00 147.00 45.31 11.00 3.50 2001
27 Tugau Bintulu Port Sdn Bhd 33.00 ‐ 10.00 13.16 4.60 2.30 2001
28 Ajang Ikhlas Ajang Shipping Sdn Bhd 475.00 143.00 34.92 11.40 4.95 2002
29 Armada Tuah 8 Bumi Armada Navigation Sdn Bhd
1,173,00 1382.33 353.00 54.69 13.80 5.50 2002
30 Armada Tuah 9 Bumi Armada Navigation Sdn Bhd
1,178,00 1382.33 353.00 55.55 13.80 5.50 2002
31 Ella Deli‐Boyee Sdn Bhd 339.00 2002
32 MV Ella Deli‐Boyee Sdn Bhd 339.00 2002
33 Armada Salman Bumi Armada Navigation Sdn Bhd
2,83.00 2,400.00 851.00 61.27 20.00 6.50 2002
34 Armada Tugas 1 Bumi armada Navigation Sdn Bhd
499.00 ‐
149.00 45.31 11.00 3.50 2002
35 Borcos Tasneem 1 Syarikat Borcos Shipping Sdn Bhd
1,369.00 ‐
410.00 52.90 13.80 5.50 2002
36 MV Setia Gagah Alam Maritim (M) Sdn Bhd 1,188.00 860.00 356.00 55.00 13.30 6.00 2002
37 MV Setia Handal Alam Maritim (M) Sdn Bhd 681.00 ‐ 204.00 45.64 11.58 4.20 2002
38 Armada Tuah 10 Bumi Armada Navigation Sdn Bhd
1,178,00 0.00 353.00 54.69 13.80 5.50 2003
39 Permint Indah Jasa Merin (Malaysia) Sdn Bhd
1075.00
2003
40 Permint Perkasa Jasa Merin (Malaysia) Sdn Bhd
1075.00 0.00 352.00 55.58 13.80 5.50 2003
41 Armada Firman Bumi Armada Navigation Sdn Bhd
3,351.00 2,977.00 1,005.00 68.16 20.00 6.50 2003
42 Armada Tuah 100 Bumi Armada Navigation Sdn Bhd
1,178.00 ‐
696.00 66.04 16.00 6.50 2003
43 Armada Tugas 2 Bumi armada Navigation Sdn Bhd
846.00 889.00 253.00 46.81 13.80 4.50 2003
44 Borcos Takdir Syarikat Borcos Shipping Sdn Bhd
1,369.00
2003
45 Royco 99 Royston Cole Marine Sdn Bhd 381.00 2003
46 Sarku Santubong Sarku Resources Sdn Bhd 2,999.00 ‐ 899.00 75.09 17.25 7.00 2003
47 Saz Supply Ajang Shipping Sdn Bhd 492.00 ‐ 147.00 42.74 11.00 3.43 2003
48 Sealink Vanessa 3 Sealink Sdn Bhd 496.00 575.00 149.00 45.31 11.00 3.50 2003
49 Sealink Victoria 3 Sealink Sdn Bhd 1,058.00 976.00 299.00 56.69 12.19 5.18 2003
50 Statesman Service Tidewater Offshore Sdn Bhd 999.00 2003
Table 6 : Anchor Handling Tug & Supply Registered in Malaysia(1996‐2006)

| MA
RIN
E F
RO
NT
IER
@ U
niKL
51 MIMET Technical Bulletin Volume 1 (2) 2010
NO SHIP NAME OWNER/OPERATOR GRT DWT NRT LENGTH
(L) BREADTH
(B) DEPTH (D)
YEAR OF REGISTRY
51 Tanjung Jara Forsayth Offshore Pteltd 1,495.00 2003
52 Armada Tuah 20 Bumi Armada Navigation Sdn Bhd
1,333,00 1457.00 399.00 55.54 15.00 5.50 2004
53 Inai Lily 1 Inai Kiara sdn bhd 69.00 2004
54 MV Epic Sasa Epic Industri (M) Sdn Bhd 229.00 0.00 69.00 27.03 8.53 4.27 2004
55 MV Setia Emas Alam Maritim (M) Sdn Vhd 964.00 2004
56 Perkasa II Tidalmarine Engineering Sdn Bhd
1927.00
2004
57 Sealink Maju 6/Sealink Maju 7
Sealink Sdn Bhd 254.00
2004
58 Ajang Safa Ajang Shipping Sdn Bhd 297.00 ‐ 89.00 27.88 9.50 3.80 2004
59 Armada Tuah 21 Bumi armada Navigation Sdn Bhd
1,333.00 1,458.15 399.00 55.54 15.00 5.50 2004
60 Armada Tuah 22 Bumi armada Navigation Sdn Bhd
1.333.00 1,458.15 399.00 55.54 15.00 5.50 2004
61 Armada Tugas 3 Bumi armada Navigation Sdn Bhd
499.00 ‐
149.00 45.31 11.00 3.50 2004
62 Armada Tugas 4 Bumi armada Navigation Sdn Bhd
491.00 ‐
147.00 37.86 11.40 4.93 2004
63 Dayang Pertama Desb Marine Services Sdn Bhd 3,387.00 ‐ 1,016.00 69.36 20.00 6.50 2004
64 Gulf Fleet No 63 Tidewater Offshore Sdn Bhd 738.00 2004
65 Inlet Amble strategy Sdn Bhd 1,241.00 2004
66 Mutiara Lestari Marine Sdn Bhd 1,512.00 2004
67 Palmas Service Jasa Merin (malaysia) Sdn Bhd 722.00 2004
68 Permint Aman Jasa Merin (malaysia) Sdn Bhd 1,210.00 3,703.00 216.00 51.61 12.19 4.27 2004
69 Ajang Ikhtiar Ajang Shipping Sdn Bhd 803.00 0.00 241.00 42.04 12.60 5.30 2005
70 Ajang Indah Ajang Shipping Sdn Bhd 496.00 0.00 149.00 37.95 11.40 4.95 2005
71 M.V Tanjung Huma Tanjung Offshore Servies Sdn Bhd
1,601.00 0.00 480.00 56.39 16.00 5.50 2005
72 MVSetia Fajar Alam Maritim (M) Sdn Vhd 1,470.00 0.00 441.00 54.12 14.60 5.50 2005
73 MV Setia Indah Alam Maritim (M) Sdn Vhd 1365.00 2005
74 MV Setia Lestari Alam Maritim (M) Sdn Vhd 1470.00 0.00 441.00 58.70 14.60 5.50 2005
75 MV Setia Mega Alam Maritim (M) Sdn Vhd 496.00 0.00 149.00 37.81 11.40 4.95 2005
76 MV Setia Nurani Alam Maritim (M) Sdn Vhd 1523.00 0.00 441.00 54.11 14.60 5.50 2005
77 Permint damai Jasa Merin (Malaysia) Sdn Bhd
1212.00 0.00 363.00 55.58 13.80 5.50 2005
78 Sealink Maju 21 Sealink Sdn Bhd 499.00 0.00 149.00 35.01 11.80 4.80 2005
79 Sealink Maju 4/Sealink Maju 5
Sealink Sdn Bhd 248.00 0.00 76.00 28.03 8.60 4.11 2005
80 Armada Tuah 23 Bumi armada Navigation Sdn Bhd
1,333.00 ‐
399.00 55.54 15.00 5.50 2005
81 Bima Lima Sribima (M) Shipping Sdn Bhd 243.00 ‐ 72.00 36.00 8.00 3.30 2005
82 M.V. Tanjung Manis Tanjung Offshore Services Sdn Bhd
915.00 ‐
274.00 41.36 12.60 5.20 2005
83 MV Setia Kasturi Alam Maritim (M) Sdn Bhd 1,443.00 ‐ 431.00 54.92 13.30 6.00 2005
84 Sealink Vanessa 4 Sealink Sdn Bhd 496.00 ‐ 149.00 45.31 11.00 3.50 2005
85 Armada Tuah 23 Bumi Armada Navigation Sdn Bhd
1333.00 0.00
399.00 55.54 15.00 5.50 2006
86 Armada Tuah 24 Bumi Armada Navigation Sdn Bhd
1333.00 0.00
399.00 55.54 15.00 5.50 2006
87 Madindra Langkawi Viva Omega Sdn Bhd 1,356.00 2006
88 MV Setia Padu Alam Maritim (M) Sdn Vhd 1470.00 1361.71 441.00 54.12 14.60 5.50 2006
89 MV Setia Rentas Alam Maritim (M) Sdn Vhd 1470.00 0.00 460.00 54.12 14.60 5.50 2006
90 Ajang Hikmah Ajang Shipping Sdn Bhd 3,351.00 ‐ 1,005.00 68.16 20.00 6.50 2006
91 Dayang Seri Viva Omega Sdn Bhd 780.00 2006
92 Permint Murni Jasa Merin (malaysia) Sdn Bhd 1,210.00 2006
93 JMM Hadhari Jasa Merin (Malaysia) Sdn Bhd
1212.00 0.00
363.00 52.30 13.80 5.50 2007
94 JMM Seri Besut Jasa Merin (Malaysia) Sdn Bhd
1212.00
2007
95 Redang Dickson Marine Co Sdn Bhd 441.00 ‐ 128.00 32.59 10.00 4.90 2007
21,032.64

| MA
RIN
E F
RO
NT
IER
@ U
niKL
52 MIMET Technical Bulletin Volume 1 (2) 2010
NO SHIP NAME OWNER/OPERATOR GRT DWT NRT LENGTH
(L) BREADTH
(B) DEPTH (D)
YEAR OF REGISTRY
1 Puteri Zamrud MISC Bhd 86205 73519 25861 263 43 22 1996
2 Aman Sendai MISC Bhd 16336 9201 4901 125 26 13 1997
3 Puteri Firus MISC Bhd 86205 73519 25861 263 43 22 1997
4 Aman Hakata MISC Bhd 16336 9201 4901 125 25 13 1998
5 Armada Puteri Bumi Armada Navigation Sdn Bhd 2856 2000
6 Puteri Delima Satu MISC Bhd 94430 76190 28329 266 43 21 2002
7 Puteri Intan Satu MISC Bhd 94430 76190 28329 266 43 21 2002
8 Puteri Nilam Satu MISC Bhd 94446 76197 28333 268 43 26 2003
9 Puteri Firus Satu MISC Bhd 94446 76197 28333 268 43 26 2004
10 Puteri Zamrud Satu MISC Bhd 94446 76197 28333 268 43 26 2004
11 Puteri Mutiara Satu MISC Bhd 94446 76197 28333 268 43 26 2005
12 Seri Alam MISC Bhd 95729 83483 28718 272 43 21 2005
13 Seri Amanah MISC Bhd 95729 83483 28718 272 43 21 2005
14 Seri Anggun MISC Bhd 95729 83483 28718 272 43 21 2006
15 Seri Angkasa MISC Bhd 83483 83483 28718 272 43 21 2006
1145252.000
Table 7 : LNG Registered in Malaysia (1996‐2006)

| MA
RIN
E F
RO
NT
IER
@ U
niKL
53 MIMET Technical Bulletin Volume 1 (2) 2010
NO SHIP NAME OWNER/OPERATOR GRT DWT NRT LENGTH
(L) BREADTH
(B) DEPTH (D)
YEAR OF REGISTRY
1 Eagle 8 Sempurna Bunkering Services(M) Sdn Bhd
49.00
1996
2 Eagle Baltimore MISC Bhd 57456.00 1996
3 Eagle Beaumont MISC Bhd 57456.00 1996
4 Eagle Boston MISC Bhd 57456.00 1996
5 Kah Soon Baru 95 Lau Ngee Leong 5500.00 0.00 30.00 28.69 4.60 1.98 1996
6 Million Line 1 Kau Siong Sdn Bhd 61.00 0.00 29.00 27.90 4.81 2.17 1996
7 MMM Jackson Pan Malaysian Marine Services Sdn Bhd
4409.00
1996
8 Nepline Delima Nepline Berhad 4,629,00 1996
9 Nis Hin 96 Nishin shipping Sdn Bhd 57.00 0.00 33.00 28.97 4.53 2.10 1996
10 Petro Ranger Enerfrate Sdn Bhd 6,718,00 1996
11 Seng Seng No 1 Patroleum Master Seng Sdn Bhd
92.00
1996
12 Suhaila Synergy Point Sdn Bhd 659.00 1996
13 Tung Shing Master Petrobiz Sdn Bhd 49.00 0.00 21.00 24.02 4.92 1.53 1996
14 Armada Perkasa Bumi Armada Navigation Sdn Bhd
32665.00
1997
15 Bunga Kelana Dua MISC Bhd 57017.00 105400.00 32719.00 235.81 42.00 21.00 1997
16 Bunga Kelana Satu MISC Bhd 57017.00 105400.00 32719.00 235.81 42.00 21.00 1997
17 Bunga Melati Dua MISC Bhd 22254.00 32126.00 8766.00 168.98 30.00 15.20 1997
18 Bunga Melati Satu MISC Bhd 22254.00 32126.00 8766.00 168.98 30.00 15.20 1997
19 Catherine Kamakura Sdn Bhd 140.00 0.00 75.00 34.55 6.09 2.25 1997
20 Domino SS Shipping Sdn Bhd 672.00 0.00 313.00 57.00 9.20 4.00 1997
21 Eagle Birmingham MISC Bhd 57456.00 1997
22 Eagle Charlotte MISC Bhd 57949.00 1997
23 Eagle Colombus MISC Bhd 57949.00 1997
24 Geruda Satu Geruda Shipping Sdn Bhd 210.00 0.00 101.00 38.75 7.93 2.44 1997
25 Gloryang Kaikura Services Sdn Bhd 270.00 0.00 156.00 40.89 7.93 2.89 1997
26 Mandat Bersama Mandat Bersama Sdn Bhd 4242.00 1997
27 Metro One Metro Sedia Transport Sdn Bhd
217.00 0.00 111.00 34.99 7.96 2.86 1997
28 Mewah Jaya Eusolid Sdn Bhd 158.00 0.00 81.00 33.75 6.80 2.30 1997
29 MMM Houston Malaysian Ocean Line Sdn Bhd
4509.00
1997
30 Princess Amelia SMT Transport Sdn Bhd 187.00 0.00 81.00 36.07 7.30 2.44 1997
31 Ramai Dua Chen Yii Shipping Sdn Bhd 214.00 0.00 116.00 34.91 7.92 2.58 1997
32 Selendang Mutiara Wawasan Shipping Sdn Bhd 29,965,00 46000.00 12354.00 176.37 32.26 18.90 1997
33 Selendang Permata
Wawasan Shipping Sdn Bhd 29,965,00 46000.00 12354.00 176.37 32.26 18.90 1997
34 Venice Rejang Venice Sdn Bhd 367.00 0.00 176.00 41.40 8.54 3.66 1997
35 Bunga Kelana 3 MISC Bhd 57017.00 105400.00 32719.00 235.81 42.00 21.00 1998
36 Eagle Albany MISC Bhd 57929.00 1998
37 Eagle Austin MISC Bhd 58156.00 1998
38 Eagle Pneonix MISC Bhd 65346.00 1998
39 Hoe Hup 99 Harvesville Sdn Bhd 323.00 520.00 153.00 44.00 7.00 3.00 1998
40 Hoe Hup No 5 Sri Similaju Corporation Sdn Bhd
206.00
1998
41 Laju Jaya No 1 Bantumaju Sdn Bhd 382.00 1998
42 M T Sun Diamond Sun Up Shipping Co Sdn Bhd 5340.00 1998
43 Mesra 128 Perkapalan Mesra Sdn Bhd 2688.00 0.00 807.00 87.12 14.40 6.50 1998
44 Miri Cheery Semua Shipping Sdn Bhd 1358.00 1998
45 Nova Nova Adiwarna Sdn Bhd 459.00 1998
46 Selendang Gemala Wawasan Shipping Sdn Bhd 29,965,00 46000.00 12272.00 176.37 32.26 18.90 1998
47 Selendang Kencana
Wawasan Shipping Sdn Bhd 29,965,00 46000.00 12354.00 176.37 32.26 18.90 1998
48 Selendang Ratna Wawasan Shipping Sdn Bhd 29,965,00 45363.00 11997.00 176.37 32.26 18.90 1998
49 Selendang Sari Wawasan Shipping Sdn Bhd 29,965,00 45363.00 11997.00 176.37 32.26 18.90 1998
50 Selendang Tiara Tiara Navigation Sdn Bhd 39,755,00 1998
Table 8 : Tankers Registered in Malaysia(1996‐2006)

| MA
RIN
E F
RO
NT
IER
@ U
niKL
54 MIMET Technical Bulletin Volume 1 (2) 2010
NO SHIP NAME OWNER/OPERATOR GRT DWT NRT LENGTH
(L) BREADTH
(B) DEPTH (D)
YEAR OF REGISTRY
51 Semua Bersatu Semua Shipping Sdn Bhd 3,878,00 5810.00 1741.00 97.47 16.50 8.50 1998
52 Sun Diamond Sun Up Shipping Sdn Bhd 5,340,00 1998
53 Alam Bitara Bitara Shipping Sdn Bhd 28932.00 45513.00 11802.00 173.10 32.20 18.80 1999
54 Bunga Kelana 4 MISC Bhd 57017.00 105400.00 32719.00 235.81 42.00 21.00 1999
55 Bunga Kelana 5 MISC Bhd 57017.00 105400.00 32719.00 235.81 42.00 21.00 1999
56 Bunga Kelana 6 MISC Bhd 57017.00 105400.00 32719.00 235.81 42.00 21.00 1999
57 Bunga Melati 3 MISC Bhd 22116.00 31983.00 8678.00 168.98 30.00 15.20 1999
58 Bunga Melati 4 MISC Bhd 22116.00 31983.00 8678.00 168.98 30.00 15.20 1999
59 Bunga Melati 5 MISC Bhd 22116.00 31983.00 8678.00 168.98 30.00 15.20 1999
60 Eagle Anaheim MISC Bhd 57929.00 1999
61 Eagle Atlanta MISC Bhd 57929.00 1999
62 Eagle Augusta MISC Bhd 58156.00 1999
63 Hoe Hup No 7 Hoe Hup Seven Sdn Bhd 185.00 1999
64 Jasa Maju 1 Semua Shipping Sdn Bhd 3166.00 4998.00 1790.00 93.06 15.40 7.80 1999
65 Laju Jaya No 2 Meroni(buntulu) Sdn Bhd 258.00 1999
66 Linau 45 Shin Yang Shipping Sdn Bhd 115.00 ‐ 71.00 31.62 5.80 2.80 1999
67 Sibu Glory Grolite Shipping Sdn Bhd 673.00 ‐ 380.00 54.37 11.58 3.65 1999
68 Bunga Kenanga MISC Bhd 40037.00 73096.00 20900.00 220.68 32.24 20.20 2000
69 Bunga Melati 6 MISC Bhd 22116.00 31983.00 8678.00 168.98 30.00 15.20 2000
70 Bunga Melati 7 MISC Bhd 22116.00 31983.00 8678.00 168.98 30.00 15.20 2000
71 Central Star 2 Mujur Suria Sdn Bhd 307.00 2000
72 Hoe Hup 18 Holiday Park Sdn Bhd 95.00 110.79 32.00 31.71 5.48 2.37 2000
73 Hoe Hup No 6 Hoe Hup Six Shipping Sdn Bhd
174.00
2000
74 Jasa Ketiga Semua Shipping Sdn Bhd 3321.00 4999.00 1858.00 95.01 15.60 7.80 2000
75 Penrider Progresif Cekap Sdn Bhd 740.00 ‐ 341.00 54.78 11.00 4.50 2000
76 Petro Foremost Shipet Maritime Sdn Bhd 7,678,00 12632.61 3852.00 118.91 21.50 11.00 2000
77 Petro Venture Shipet Maritime Sdn Bhd 4,974,00 2000
78 Sejati Mohamad Umar Bin Ahmat 626.00 ‐ 38.82 20.15 4.88 1.83 2000
79 Alam Bistari Bistari Shipping Sdn Bhd 28539.00 47172.00 12385.00 173.10 32.20 19.10 2001
80 Alam Budi Alam Budi Sdn Bhd 28539.00 47065.00 12385.00 173.10 32.20 19.10 2001
81 Cathay Tk1 Oriental Grandeur Marine Sdn Bhd
369.00
2001

| MA
RIN
E F
RO
NT
IER
@ U
niKL
55 MIMET Technical Bulletin Volume 1 (2) 2010
NO SHIP NAME OWNER/OPERATOR GRT DWT NRT LENGTH
(L) BREADTH
(B) DEPTH (D)
YEAR OF REGISTRY
82 Domino No3 Meroni(buntulu) Sdn Bhd 482.00 772.00 201.00 42.73 12.20 3.05 2001
83 Metro No 2 Metro Sedia Transport Sdn Bhd
497.00
2001
84 Sutra Dua Sutrajaya Shipping Sdn Bhd 4,521,00 2001
85 Tuba No 5 Marine Teamwork Sdn Bhd 140.00 2001
86 Wec 9 WEC Transport Service Sdn Bhd
927.00 ‐
573.00 68.12 11.00 5.00 2001
87 Danum Yayasan Sabah Dua Shipping Sdn Bhd
4792.00 7959.00 2430.00 103.06 18.20 8.95 2002
88 Eagle Tacoma MISC Bhd 58166.00 2002
89 Eagle Vermont MISC Bhd 161223.00 2002
90 Eagle Virginia MISC Bhd 161233.00 2002
91 Oriental Glory Glow Quest Sdn Bhd 1,824,00 2997.83 730.00 79.60 13.40 6.80 2002
92 Samudra Dua Prosperline Shipping Sdn Bhd
276.00 ‐
129.00 38.16 9.22 2.60 2002
93 Ajang Medina Ajang Shipping Sdn Bhd 487.00 ‐ 147.00 42.86 10.50 3.20 2003
94 Atlantic Ocean Special Pyramid Sdn Bhd 1992.00 2003
95 Bunga kasturi MISC Bhd 156967.00 299999.00 99493.00 317.69 60.00 29.70 2003
96 Eagle Tampa MISC Bhd 58166.00 2003
97 Eagle Toledo MISC Bhd 58166.00 2003
98 Eagle Trenton MISC Bhd 58166.00 2003
99 Eagle Tucson MISC Bhd 58166.00 2003
100 Jasa Maju 2 Semado Maritim Sdn Bhd 4999.00 2003
101 Kelisa BHL Marine(M) Sdn Bhd 294.00 301.00 90.00 37.70 7.50 3.60 2003
102 Lynn Lau Hue Kuok & Sons Sdn Bhd
204.00 ‐
112.00 39.29 7.34 2.76 2003
103 Senawang Azam Fowarding & Trading Sdn Bhd
3,120,00
2003
104 Sutra Empat Sutrajaya Shipping Sdn Bhd 4,599,00 2003
105 Tuah Sejagat Victory Supply Sdn Bhd 198.00 537.95 155.00 41.47 8.00 3.50 2003
106 Bunga Kelana 10 MISC Bhd 58194.00 105173.00 31243.00 234.88 42.00 21.30 2004
107 Bunga Kelana 7 MISC Bhd 58194.00 105173.00 31243.00 234.88 42.00 21.30 2004
108 Bunga Kelana 8 MISC Bhd 58194.00 105173.00 31243.00 234.88 42.00 21.30 2004
109 Bunga Kelana 9 MISC Bhd 58194.00 105173.00 31243.00 234.88 42.00 21.30 2004
110 Eagle Vienna MISC Bhd 161233.00 2004
111 Gagasan Melaka Gagasan Carriers Sdn Bhd 4464.00 7744.27 2450.00 99.00 18.20 8.80 2004
112 Hailam Satu Zengo Marine Sdn Bhd 166.00 2004
113 Maritime Kelly Anne
Wawasan Shipping Sdn Bhd
29211.00 44488.00 11658.00 173.40 32.20 18.70 2004
114 Maritime Tuntiga Wawasan Shipping Sdn Bhd
29211.00 44488.00 11658.00 173.40 32.20 18.70 2004
115 Mewah Sejati Victory Supply Sdn Bhd 480.00 1000.00 314.00 57.00 10.00 4.50 2004
116 MMM Ashton Malaysian Merchant Marine Bhd
2479.00
2004
117 Tuah Kuatan Victory Supply Sdn Bhd 195.00 2004
118 Bunga Kasturi Dua
MISC Bhd 157098.00 298100.00 99808.00 317.69 60.00 29.70 2005
119 Eagle Valencia MISC Bhd 160046.00 2005
120 Eagle Venice MISC Bhd 160046.00 306997.70 109299.00 318.40 58.00 28.55 2005
121 Maritime North Wawasan Shipping Sdn Bhd
29174.00
2005
122 Bunga Kasturi Tiga
MISC Bhd 157300.00 300325.00 99363.00 316.00 60.00 29.70 2006
123 Bunga Kasturi Empat
MISC Bhd 157300.00 300325.00 99363.00 317.69 60.00 29.70 2006
124 Sealink Pacific 330
Sealink Sdn Bhd 6,638,00 ‐
1991.00 96.62 34.00 7.31 2006
125 Sealink Pacific 389
Sealink Sdn Bhd 4,598,00
2006
1281377.00

| MA
RIN
E F
RO
NT
IER
@ U
niKL
56 MIMET Technical Bulletin Volume 1 (2) 2010
NO SHIP NAME OWNER/OPERATOR GRT DWT NRT LENGTH
(L) BREADTH
(B) DEPTH (D)
YEAR OF REGISTRY
1 Selendang Mayang Mayang Navigation Sdn Bhd 18,507.00 28,260.00 165.92 26.02 14.20 1996
2 Cathay 12
United Orix Leasing Malaysia Berhad
259.00
1997
3 Eco Champion Ecochamp Shipping Sdn Bhd 12,859.00 1997
4 MMM Diana Ample Remark Sdn Bhd 76,515.00 1997
5 Nerano PNSL Berhad 15,847.00 1997
6 Selendang Intan Intan Navigation Sdn Bhd 28,097.00 47,290.00 181.10 31.00 16.60 1997
7 Selendang Kasa Kasa Navigation Sdn Bhd 18,507.00 28,260.00 165.92 26.00 14.00 1997
8 Selendang Nilam Nilam Navigation Sdn Bhd 28,097.00 1997
9 Selendang Ayu Ayu Navigation Sdn Bhd 39,755.00 1998
10 Seri Ibonda
Palmbase Maritime (M) Sdn Bhd
16,311.00 27,272.00 162.77 26.60 13.50 1998
11 Bunga Saga 9 MISC Bhd 38972.00 73127.00 218.70 32.25 19.00 1999
12 Alam Aman II Katella Sdn Bhd 27306.00 47301.00 182.11 31.00 16.70 2001
13 Eco Vigour Vigour Shipping Sdn Bhd 17,265.00 2001
14 Eco Vision Vision Shipping Sdn Bhd 17,264.00 2001
15 Handy Islander MISC Bhd 15,833.00 2002
16 Pacific Selesa MISC Bhd 16,041.00 2002
17 Sea Maestro MISC Bhd 15,888.00 2002
18 Sea Maiden MISC Bhd 15,888.00 2002
19 Gangga Negara MISC Bhd 15,880.00 2003
20 Handy Gunner MISC Bhd 16,041.00 2003
21 Handy Roseland MISC Bhd 16,041.00 2003
22 Marquisa MISC Bhd 16,041.00 2003
23 Pacific Mattsu MISC Bhd 16,041.00 2003
24 Alam Maju MBC Maju Sdn Bhd 27986.00 2004
25 Alam Mutiara MBC Mutiara Sdn Bhd 27986.00 2004
555,227.00
Table 9 : Bulk Carrier Registered in Malaysia (1996‐2006)

| MA
RIN
E F
RO
NT
IER
@ U
niKL
57 MIMET Technical Bulletin Volume 1 (2) 2010
NO SHIP NAME OWNER/OPERATOR GRT DWT NRT LENGTH
(L) BREADTH
(B) DEPTH (D)
YEAR OF REGISTRY
1 Bahagia Baru 96 Trillion Leader Sdn Bhd 68 1996
2 Ban Hock Soon Ling Heng Ang 31 1996
3 Bobo Chiong Wee Kiong 31 1996
4 Campur Campur Sunrise Entity Sdn Bhd 95 36.71 3.95 1.83 1996
5 Duta Pangkor 8 Pangkor‐Lumut Ekspres Feri Sdn Bhd
107 36.78 4.35 2.1 1996
6 Flying Eagle Ling Kong Mou 44 1996
7 Husqvarna Sarawak Hock Ghim Enterprise Sdn Bhd 76 1996
8 King Soon Balleh 96 Hu Moi Ngiok 55 1996
9 Layang Indah Sealink Sdn Bhd 95 24.12 5.94 2.84 1996
10 Pertama Speed Ling Kui Sunn 27 1996
11 Sing Ann Lai 2020 Tan Jiak Kean 59 1996
12 Srijaya Wong Lang Kiew 44 1996
13 Supersonic No 5 Law Yong Keng 59 1996
14 Tinjar No 3 Huong Tuong Siew 31 1996
15 Tuto Express No 10 Tuto Express Shipping Sdn Bhd 26 1996
16 Tuto No 12 Tuto Express Shipping Sdn Bhd 27 1996
17 Usahasama Syarikat Feri Usahasama Sdn Bhd 111.69 19.1 9.14 2.35 1996
18 Vision 2005 Miri River Travel Enterprise Sdn Bhd
19 1996
19 Vovo Express Chiong Chung Hong 31 1996
20 Wahwah Speed Swegim Enterprise Sdn Bhd 34 1996
21 Zon 1 Langkawi Ferry Services Sdn Bhd 178.27 53.17 21.96 8.4 2.5 1996
22 Zon 2 Langkawi Saga Travel & Tours Sdn Bhd
178.27 1996
23 Asean 97 Peter Lau Hieng Wung 35 1997
24 Bahagia 2020 Lim Kuok Chuong 60 33.94 3.23 1.74 1997
25 Bahagia No 1 Ekspres Bahagia Sdn Bhd 82 1997
26 Begawan Laju Lau Oi Phen 33 1997
27 Benuong Shorewell Shipping Sdn Bhd 198 20.4 9.8 2.45 1997
28 Beruit No 1 Kong Kim Sien 35 1997
29 Champur Baru Debon Enterprise Sdn Bhd 107 1997
30 Ekspres Bahagia II Ekspres Bahagia (Langkawi) Sdn Bhd
178 46.58 40.4 5.33 2.17 1997
31 Good Success 818 Thang Nam Hoi 56 1997
32 Hocksoon Wong Lang Kiew 43 1997
33 Hope King 168 Hock Ghim Enterprise Sdn Bhd 61 35.47 3.3 1.71 1997
34 Husqvarna Kita Swegim Enterprise Sdn Bhd 60 36.04 3.21 1.67 1997
35 Impian 2 Langkawi Ferry Services Sdn Bhd 118 28.25 5.5 3.2 1997
36 Impian 3 Langkawi Ferry Services Sdn Bhd 60 18.69 24.05 5.5 2.1 1997
37 Kawan Express No 1 Kawan Laut Sdn Bhd 315 41.7 6.1 1.9 1997
38 Lambaian 1 Langkawi Ferry Services Sdn Bhd 118 30.26 28.25 5.5 3.2 1997
39 Laris Rohana Binti Hujil 41 1997
40 Maju Balleh Ting Chuo Won 42 1997
41 Nurshah Zamboanga Penang Shipbuilding Corporation Sdn Bhd
78 34.5 3.68 2 1997
42 Pan Silver 1 Pan Silver Ferry Sdn Bhd 56 1997
43 Pertama Voyage Ong Bon Chong 42 1997
44 Pioneer 97 Kong Shaw Hock 57 1997
45 Public Express No 11 Law Yong Keng 30 1997
46 Punan Rajah Tukang Ak Pichang 33 1997
47 Rasa Sayang 1 Sanergy Marine Sdn Bhd 142 23.06 8.17 2.15 1997
48 Tinjar No 2 Mrhuong Tuong Kee 29 1997
49 Tung Kiong No 7 Tan Jiak Kean 28 1997
50 Wanlee No 1 Standrich Sdn Bhd 77 37.65 3.68 1.64 1997
Table 10: Passenger Ship Registered in Malaysia(1996‐2006)

| MA
RIN
E F
RO
NT
IER
@ U
niKL
58 MIMET Technical Bulletin Volume 1 (2) 2010
NO SHIP NAME OWNER/OPERATOR GRT DWT NRT LENGTH
(L) BREADTH
(B) DEPTH (D)
YEAR OF REGISTRY
51 Bobo 6 Chiong Wee Luk 33 1998
52 Bon Voyage Ling Siew Sung 28 26.09 3.41 1.24 1998
53 Concorde 98 Yong Hie Sieng 45 1998
54 Ekspres Bahagia 5 Ekspres Bahagia (Langkawi) Sdn Bhd
35 1998
55 Hubungan 1 Sun Power Ferry Sdn Bhd 82 21.7 4.8 1.9 1998
56 Kudat Express Wong Leong Kee & Son Sdn Bhd 116 34.5 4.12 1.6 1998
57 Lambaian 3 Langkawi Ferry Services Sdn Bhd 118 1998
58 Leisure World 1 Luxury Solution Sdn Bhd 4,077 1998
59 Pan Silver 2 Pan Silver Ferry Sdn Bhd 60 1998
60 Pan Silver 3 Pan Silver Ferry Sdn Bhd 60 1998
61 Penaga Penang Port Sdn Bhd 279 1998
62 Pertama Rejang Chua Chun Keong 35 1998
63 Pintas Samudra 2 Yong Choo Kui Shipyard Sdn Bhd 136 35.48 4.52 2.1 1998
64 Salbiah Dua Yiing Hee Ing @ Yung Hee Ing 33 1998
65 Seagull Express 3 Sea‐Gull Express & Accommodation Sdn Bhd
121 29.2 4.87 2.8 1998
66 Tomcat Eksklusif Anggun Sdn Bhd 41 13.56 5.7 1.85 1998
67 Tomcat 2 Eksklusif Anggun Sdn Bhd 48 4.75 15.3 5.7 1.85 1998
68 Yanmarline Express Yanmarline Express Sdn Bhd 73 36.15 3.63 1.9 1998
69 Angel Ekspress Rowvest Sdn Bhd 111 1999
70 Ekspres Bahagia III Ekspres Bahagia (Langkawi) Sdn Bhd
135 34.04 36.07 4.12 1.45 1999
71 Ekspres Bahagia 6 Fast Ferry Ventures Sdn Bhd 92 1999
72 Ekspres Bahagia 8 Ekspres Bahagia (Langkawi) Sdn Bhd
97 1999
73 Feri Wawasan Belait Shipping Co Sdn Bhd 445 1999
74 Indomal Express 88 Damai Ferry Service Sdn Bhd 90.06 17.22 21.12 4.62 1.95 1999
75 Kenangan 1 Langkawi Ferry Services Sdn Bhd 81 1999
76 Kenangan 2 Langkawi Ferry Services Sdn Bhd 144 28 5.8 1.9 1999
77 Kenangan 3 Langkawi Ferry Services Sdn Bhd 156 24.4 29.7 6.25 1.65 1999
78 Pelican Eksklusif Anggun Sdn Bhd 41.39 1999
79 Weesam Express 5 Sunrise Energy Sdn Bhd 231 37.4 5.5 1.85 1999
80 Alaf Baru 1 Fast Ferry Ventures Sdn Bhd 118.71 21.27 5.3 1.4 2000
81 Alaf Baru 2 Langkawi Ferry Services Sdn Bhd 115 2000
82 Bo Bo No 2 Chiong Wee Yiing 33 2000
83 Ekspres Bahagia 9 Ekspres Bahagia (Langkawi) Sdn Bhd
111 2000
84 Jupiter Superstar Express Sdn Bhd 183 29.7 6.4 2.2 2000
85 Labuan Express Lima Syarikat Lista Sdn Bhd 179 37.72 4.72 2.05 2000
86 Marine Star 3 Sun Power Ferry Sdn Bhd 82 28.71 3.66 1.6 2000
87 Mars Superstar Express Sdn Bhd 183 29.7 6.4 2.2 2000

| MA
RIN
E F
RO
NT
IER
@ U
niKL
59 MIMET Technical Bulletin Volume 1 (2) 2010
NO SHIP NAME OWNER/OPERATOR GRT DWT NRT LENGTH
(L) BREADTH
(B) DEPTH (D)
YEAR OF REGISTRY
88 New Frontier Express No 2
Ling Heng Seek 87 32.97 3.66 1.34 2000
89 Pan Silver 5 Pan Silver Ferry Sdn Bhd 120 36.8 4.95 2.13 2000
90 Pluto Superstar Express Sdn Bhd 183 29.7 6.4 2.2 2000
91 Putai Jaya Ting Chuo Won 56 2000
92 Zuhairi Capital Surge Sdn Bhd 119.92 23.4 8.3 2.85 2000
93 Bahagia 2002 Lim Kuok Chuong 51 2001
94 Bo Bo No 5 Chiong Wee Yiing 33 2001
95 Cinta Baru Kong Kim Sien 36 2001
96 Ekspres Bahagia 10 Ekspres Bahagia (Langkawi) Sdn Bhd
91 2001
97 Fortune Express 1 Jferry Services Sdn Bhd 99 33.37 4.12 2.13 2001
98 Fortune Express 2 Jferry Services Sdn Bhd 99 2001
99 Jaya Express Ting Chu Kee 30 2001
100 Kenangan 6 Langkawi Ferry Services Sdn Bhd 170 29.3 6.8 1.43 2001
101 Langkawi Coral 2 Langkawi Saga Travel & Tours Sdn Bhd
175 28.85 6.8 1.65 2001
102 Langkawi Coral 3 Langkawi Saga Travel & Tours Sdn Bhd
53.42 2001
103 New Frontiers No 3 Sunrise Entity Sdn Bhd 99 2001
104 Puteri Jentayu Salang Indah Resorts Sdn Bhd 74 2001
105 RS Express Yong Choo Kui 200 37.26 5 2.04 2001
106 Sejahtera Pertama Jetacorp Sdn Bhd 99 2001
107 Sofu Rasa Sayang Lee In Jee 51.09 2001
108 Soon Hua Hong Soon Hua Hong Enterprise Sdn Bhd
298 2001
109 Tawindo No 1 Osin Motor Sdn Bhd 94 2001
110 Yieng Hee No 1 Tiong Chiong Ming 29 2001
111 Yieng Hee No 2 Tiong Chiong Ming 26 2001
112 Yieng Lee No 1 Tiong Chiong Ming 29 2001
113 Coral Island 1 Ekspres Bahagia (Langkawi) Sdn Bhd
332 35.1 7.95 3 2002
114 Ekspres Bahagia 7 Ekspres Bahagia (Langkawi) Sdn Bhd
43.82 2002
115 Excel Express 1 Ekspres Bahagia (Langkawi) Sdn Bhd
99 2002
116 Malaysia Express 1 Tunas Rupat Follow Me Express Sdn Bhd
194 32.5 7 3.5 2002
117 Mas Indera Kayangan Masindra Shipping (M) Sdn Bhd 1,065 2002
118 Mid‐East Express No 1 Mid‐East Transport Sdn Bhd 119 34.8 4.22 1.5 2002
119 New Frontiers No 5 Sunrise Entity Sdn Bhd 99 2002
120 Alaf Baru 3 Langkawi Ferry Services Sdn Bhd 123.25 2003

| MA
RIN
E F
RO
NT
IER
@ U
niKL
60 MIMET Technical Bulletin Volume 1 (2) 2010
NO SHIP NAME OWNER/OPERATOR GRT DWT NRT LENGTH
(L) BREADTH
(B) DEPTH
(D)
YEAR OF REGISTRY
121 Alaf Baru 6 Langkawi Ferry Services Sdn Bhd 123.25 2003
122 Asian Vision Sri Jaya Shipping Sdn Bhd 42 2003
123 Bahagia 20 Bahagia 2020 Sdn Bhd 56 2003
124 Bahagia No 8 Ekspres Bahagia Sdn Bhd 132 2003
125 Duta Pangkor 1 Pangkor-Lumut Ekspres Feri Sdn Bhd 149 2003
126 Duta Pangkor 2 Pangkor-Lumut Ekspres Feri Sdn Bhd 79 2003
127 Duta Pangkor 3 Pangkor-Lumut Ekspres Feri Sdn Bhd 79 2003
128 Ekspres Nusa Satu Nusantara Ferry Services Sdn Bhd 106 2003
129 Excel Express 2 Ekspres Bahagia (Langkawi) Sdn Bhd 132 2003
130 Excel Express 3 Ekspres Bahagia (Langkawi) Sdn Bhd 132 2003
131 Kapit Boleh 168 Swegim Enterprise Sdn Bhd 52 2003
132 Labuan Express Enam Double Power Sdn Bhd 144 39 4.2 2.3 2003
133 Labuan Express Tujuh Hwong Lee (M) Sdn Bhd 158 35.8 4.42 1.86 2003
134 Labuan Express Lapan Hwong Lee (M) Sdn Bhd 99 2003
135 Mid-East Express No 2 Mid-East Transport Sdn Bhd 126 2003
136 Nasuha Capital Surge Sdn Bhd 119.92 23.4 8.3 2.85 2003
137 New Frontiers No 6 Sunrise Entity Sdn Bhd 119 2003
138 Pulau Payar Penang Port Sdn Bhd 16.47 2003
139 Pulau Pinang Penang Port Sdn Bhd 16.47 2003
140 Sarawak Boleh 168 Swegim Enterprise Sdn Bhd 87 32.94 3.91 1.85 2003
141 Tawindo No 2 Osin Motor Sdn Bhd 116 2003
142 Tawindo No 3 Osin Motor Sdn Bhd 143 2003
143 Weesam Express 6 Yong Choo Kui Shipyard Sdn Bhd 215 2003
144 Achilles 2 Yong Choo Kui Shipyard Sdn Bhd 63 2004
145 Bo Bo Satu Chiong Chung Heng 42 2004
146 Coral Island 3 Ekspres Bahagia (Langkawi) Sdn Bhd 133 36.74 4.28 1.5 2004
147 Duta Pangkor 5 Pangkor-Lumut Ekspres Feri Sdn Bhd 124 2004
148 Khai Kiong Express Sim Meng Hiang 36 2004
149 Lady Yasmin Yasmin Marine Technology Sdn Bhd 21.94 2004
150 Pintas Samudera 8 Inmiss Shipping Sdn Bhd 92 2004
151 Sejahtera 2 Jetacorp Sdn Bhd 187 37.7 4.76 1.5 2004
152 Sejahtera 3 Jetacorp Sdn Bhd 161 2004
153 Wawasan Perdana Labuan Ferry Corporation Sdn Bhd 1,101 2004
154 Sri Labuan Lima Trans-Link Sdn Bhd 137 36.76 4.28 1.5 20706.94
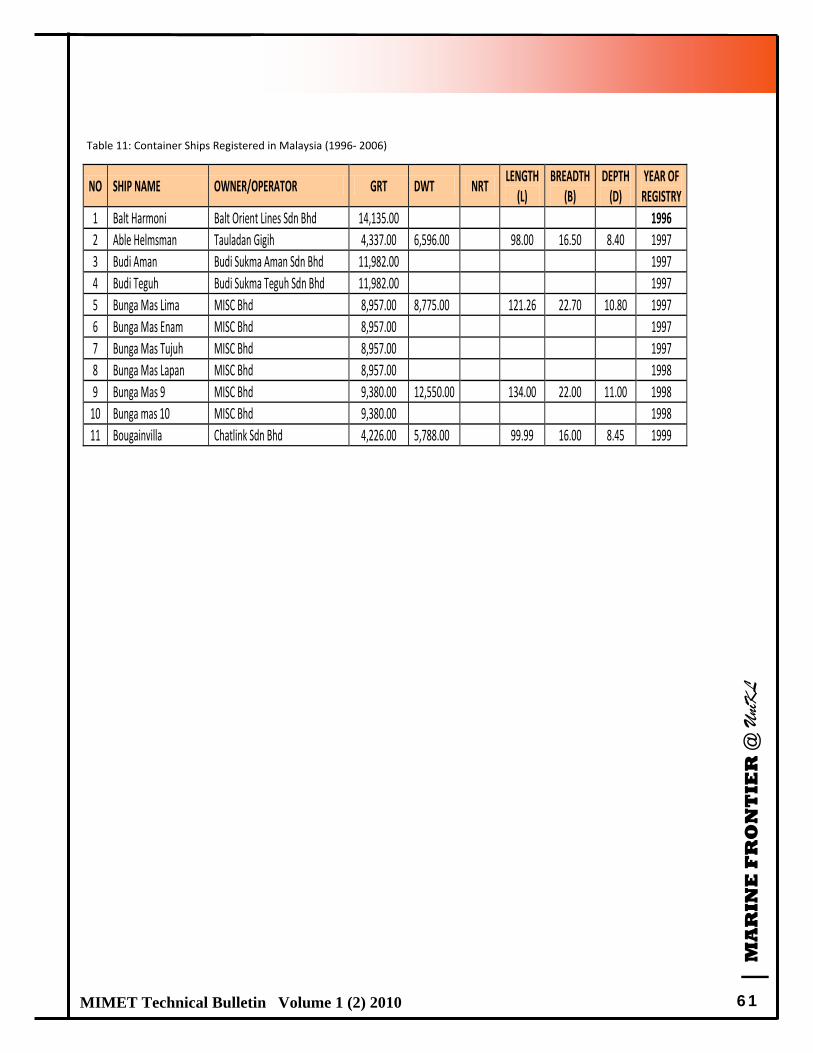
| MA
RIN
E F
RO
NT
IER
@ U
niKL
61 MIMET Technical Bulletin Volume 1 (2) 2010
NO SHIP NAME OWNER/OPERATOR GRT DWT NRT LENGTH
(L) BREADTH
(B) DEPTH (D)
YEAR OF REGISTRY
1 Balt Harmoni Balt Orient Lines Sdn Bhd 14,135.00 1996
2 Able Helmsman Tauladan Gigih 4,337.00 6,596.00 98.00 16.50 8.40 1997
3 Budi Aman Budi Sukma Aman Sdn Bhd 11,982.00 1997
4 Budi Teguh Budi Sukma Teguh Sdn Bhd 11,982.00 1997
5 Bunga Mas Lima MISC Bhd 8,957.00 8,775.00 121.26 22.70 10.80 1997
6 Bunga Mas Enam MISC Bhd 8,957.00 1997
7 Bunga Mas Tujuh MISC Bhd 8,957.00 1997
8 Bunga Mas Lapan MISC Bhd 8,957.00 1998
9 Bunga Mas 9 MISC Bhd 9,380.00 12,550.00 134.00 22.00 11.00 1998
10 Bunga mas 10 MISC Bhd 9,380.00 1998
11 Bougainvilla Chatlink Sdn Bhd 4,226.00 5,788.00 99.99 16.00 8.45 1999
Table 11: Container Ships Registered in Malaysia (1996‐ 2006)
| MA
RIN
E F
RO
NT
IER
@ U
niKL
62 MIMET Technical Bulletin Volume 1 (2) 2010
Feature Article 4
FEASIBILITY STUDY ON THE USAGE OF PALM OIL AS ALTERNATIVE NON
PETROLEUM‐BASED HYDRAULIC FLUID IN MARINE APPLICATION
AZRI HAMIM AB ADZIS*
Department of Advance Science & Advance Technology
Malaysian Institute of Marine Engineering Technology, Universiti Kuala Lumpur
Received: 21 May 2010; Revised: 9 July 2010 ; Accepted: 13 July 2010
ABSTRACT
Most hydraulic applications on land or sea utilize petroleum‐based hydraulic fluid as the working fluid. Fluid leakages are
quite common and in marine application fluid are easily leaked into sea water causing pollutions. An alternative hydraulic
fluid with similar properties as petroleum‐based fluids at lower cost is required to be used in marine applications to mini‐
mize impact on the environment. Water‐based or synthetic fluids such as water‐glycol, phosphate ether and synthetic
esters are expensive and have certain disadvantages compared with petroleum‐based fluid such as relatively low operat‐
ing temperature, viscosity changes with temperature fluctuation and corrosive against rubber seal. An alternative fluid
may inhibit some of the above weaknesses but can be acceptable if the cost is lower. The purpose of this case study is to
determine the suitability of palm oil mixture as hydraulic fluid with similar capabilities with petroleum based fluid. (Data
on palm oil properties are to be obtained from literature research and a comparison with petroleum based fluid will be
made). Suitability will be determined from the fluids’ suitability to maintain viscosity at very high pressure and varying
temperature and also its impact on the environment. Further research on palm oil characteristic in high pressure pumps
and hydraulic equipments compatibility is needed.
Keyword: Hydraulics fluid, palm oil, marine, alternative
*Corresponding Author: Tel.: +605‐6909055
Email address: [email protected]
1. INTRODUCTION
Hydraulics always leaks! It may sound like a
catchy commercial but most hydraulic users
will testify on the truthfulness of the state‐
ment. As the most common hydraulic fluid
base is mineral oil or petroleum based oil, any
leakage can be considered as a potential envi‐
ronmental disaster related to petroleum
products. These petroleum products and
other additive in the hydraulic fluids can harm
the marine life and wreck havoc to the eco‐
system. Experience from past incidents of
petroleum spills shows that irreparable harm
to the environment as seen in the Exxon Val‐
dez oil spill where thousands of marine ani‐
mals were killed [1]. While a disaster of such
magnitude may not be a suitable comparison
with leaks of hydraulics fluids, the fact re‐
mains that petroleum byproducts are harmful
to the environment.
The problems with petroleum based hydraulic
fluids are the non‐biodegradability of the fluid
and the harmful effect it has on the environ‐
ments. Any spills can kill of marine life or con‐
taminate the environments making the spillage
site to be inhabitable for a long period.
Additionally, the toxicity of most hydraulic
fluid additives and the occupational health
and safety issue, lead to an environmentally
safer alternative of petroleum based fluids in
environmental sensitive areas.
The New York State Department of Environ‐
mental Conservation, NYSDEC, legally required
the reporting of any petroleum products spill‐

| MA
RIN
E F
RO
NT
IER
@ U
niKL
63 MIMET Technical Bulletin Volume 1 (2) 2010
age and appropriate steps must be taken to con‐
tain the spillage from polluting soils or under‐
ground water sources. The seriousness of the
regulation can be demonstrated by a spill incident
at a site own by the Brookhaven National Labora‐
tory (BNL) in New York. A ruptured hydraulic hose
has resulted in the removal of 50 cubic yards of
contaminated soil and disposed as toxic material.
This incident has led BNL to adopt the usage of
environmentally safer hydraulic fluid based from
canola oil [2].
In order to make a hydraulic fluid to be safer for
the environment the hydraulic fluid must be read‐
ily biodegradable or in other word the fluid must
be able to be completely converted to carbon
dioxide and water quickly and naturally by diges‐
tion or consumption process by naturally occur‐
ring organism in water, oil and soil systems [2].
Any spillage can then be cleaned up normally
without the added cost of hazardous material
handlings.
To obtain the biodegradable features, previous
researches has lead to the application of synthetic
base fluid such as synthetic esters and polyglycols
(organophosphate and polyalphaolefin). These
synthetics base fluids were developed mainly for
high temperature and/or fire risk operations and
are able to biodegrade easily compared to petro‐
leum based fluids [3]. The synthetics based fluids
perform better compared to petroleum based
fluids in term of viscosity at low and high tem‐
peratures, volatility, pour point, wear protections
and oxidations [3]. However, synthetic esters are
expensive to produce and even for their superior
lubrication performance, the high costs limit its
usage. Polyglycols are less costly but can be quite
toxic to living organisms especially when mixed
with lubricating additives [3,4].
Thus, a cheaper non toxic alternative to be used is
vegetable oil as the base oil for hydraulic fluids.
Among vegetable oils which has been researched
and developed as hydraulic fluids are the canola oil,
rapeseed oil, soybean oil and palm oil.
Properties of Hydraulic Fluid
Primary purpose of hydraulic fluids is to maintain
lubrication and fluid characteristics while in use
within the system so as to maintain appropriate
pressure to operate hydraulic actuators (cylinders
and motors) assemblies in machineries on demand.
An ideal hydraulic fluid will have the following char‐
acteristics [3, 5,6]:
1. Constants viscosity at all temperature range
2. High anti‐wear characteristics
3. Thermal stability
4. Hydrolytic stability
5. Low chemical corrosiveness
6. Low cavitation tendencies
7. Long life
8. Fire resistance
9. Readily biodegradable
10. Low toxicity
11. Low cost
Viscosity
For hydraulic fluids, the temperature effect on
viscosity is very important. A good fluid can main‐
tain a minimum required viscosity at high operat‐
ing temperature yet does not become too viscous
at lower temperature. Too much viscosity may
result in difficulty for the fluid to transmit hydrau‐
lic power at low temperature especially at system
start.
Anti Wear
The ability of the fluid to coat moving metal parts
with a thin protective oil film. The oil film will re‐

| MA
RIN
E F
RO
NT
IER
@ U
niKL
64 MIMET Technical Bulletin Volume 1 (2) 2010
duce wear due to metal‐to‐metal contact thus
prolonging the life of the equipments. Most hy‐
draulic fluids have anti‐wear additive added to it
to obtain anti wear properties.
Most common anti wear additive for petroleum
based fluid is the zinc dithiophosphate (ZDP)
which is a highly toxic substance. As it is soluble in
water, its introduction to marine environment
can be hazardous.
Corrosion
A good hydraulic fluid has good hydrolytic stabil‐
ity i.e. able to prevent any water which may enter
the fluid from causing rust to metal. Usually, a
rust inhibitor is added to the fluid to obtain good
rust protection.
Oxidation
The presence of water and oxygen (air) in the
fluid may cause fluids to oxidize and further in‐
crease the chance of rust formation. Oxidize fluid
will also cause chemical corrosions due to in‐
crease in acidity.
Flammability
A high flash point (the maximum temperature
before ignition) is necessary for hydraulic fluid as
most fluid works at high temperatures. Petro‐
leum based fluid have a relatively high flash
point of around 150oC. For extreme environ‐
ments, a fire resistant fluid is required to prevent
accidental ignitions.
Effect of Mineral Based Fluid on Marine Environ‐
ment
Hydraulic fluids can enter the environment
from spills and leaks in machines and from leaky
storage tanks. When these fluids spilled on soil,
some of the ingredients in the hydraulic fluids
mixture may stay on the top, while others may
sink into the groundwater. In water, some in‐
gredients of hydraulic fluids will transfer to the
bottom and stay there. Marine organism that
live near spillage area may ingest some hydrau‐
lic fluid ingredients. Some organism may die
from the poisoning and some will have traces of
the hydraulic fluid in their system causing defor‐
mations or poisoning the upper food chains.
Eventually, the hydraulic fluids will degrade in
the environment, but complete degradation
may take more than a year and continue to af‐
fect living organism during the degradation
process [7]. Prolong contact with human can
increase cancer risk especially on skin [8]. The
International Convention for the Prevention of
Pollution From Ships, 1973 (MARPOL 73/78)
forbid the discharge of oily waste to the sea
which cover all petroleum products in any
forms [9].
Vegetable‐based Fluid
In order to be accepted as a fluid of choice for
hydraulic application, vegetable based fluid must
have similar characteristics as the commonly
used petroleum based hydraulic fluid. As men‐
tioned earlier, the purpose of the hydraulic fluids
is to maintain appropriate pressure to operate
actuators and at the same time lubricate and
protect moving mechanical parts from wear and
corrosion. To maintain the pressure, the fluids
are constantly pumped thus creating a built up
of heat, subjecting the fluid to temperature
variations and also constant mechanical stresses
[4].
Vegetable oil provides better anti‐wear perform‐
ance and generally exhibit lower friction coeffi‐
cient and are easily biodegradable. These prop‐
erties are due to the composition of the oils
which contain unsaturated hydrocarbons and
naturally occurring esters. The problems are that
there are prone to oxidize rapidly, changes in
viscosity at the lower and upper temperature
range and low water resistance. Vegetable es‐
ters oils based on polyunsaturated fatty acid

| MA
RIN
E F
RO
NT
IER
@ U
niKL
65 MIMET Technical Bulletin Volume 1 (2) 2010
tends to oxidize rapidly, even at a moderately
increased operating temperature. As the tem‐
perature increases, the oils thicken due to its
tendency to enter into viscosity‐increasing reac‐
tions in the presence of atmospheric oxygen.
Similar reaction occurs when the temperature
drops as the oil will begin to solidify. Rapeseed
oil, corn oil, and sunflower oil have a solidifica‐
tion point of ‐16oC, ‐20oC and ‐17oC respectively
[4, 7, 10]. Palm oil is even worst, solidifying at a
relatively high temperature of 34.1oC [11]. Even
as the temperatures drop and approaching the
solidification temperatures, the oils will experi‐
enced a marked increase in viscosity and may
cause problem in cold weather [8]. These prob‐
lems however can be easily fixed by mixing the
vegetable oil with synthetic esters and/or by
adding additives to improve its anti oxidant and
pour point properties [7]. While the cost of syn‐
thetic ester is very high, by mixing it with vegeta‐
ble oil base will bring the total cost of the base
oil down compared to a fully synthetic solution.
New antioxidants that are suitable for vegetable
oil yet harmless to the environment are also
needed as current antioxidants are designed for
mineral oils and some are quite toxic.
Oxidative stability is dependant on the predomi‐
nant fatty acids present in the vegetable oil. Oils
containing mostly saturated fatty acids will have
good oxidative stability compared to a vegetable
oil containing oleic acid or other monounsatu‐
rated fatty acids. Oils that contain mostly poly‐
unsaturated fatty acids exhibit poor oxidative
stability [8]. In other words, the oxidative stabil‐
ity is inversely proportional to the degree of un‐
saturation. The three most cultivated vegetable
oils, the palm oil, soybean oil, and the rapeseed
oil consist mainly of monounsaturated and poly‐
unsaturated fatty acids. These lead to a general
consensus of vegetable oils poor oxidative stabil‐
ity compared with petroleum based oil and also
the fully saturated synthetics such as synthetic
esters, organophosphate and polyalphaolefin
(PAOs) [8]. So as to provide for comparable per‐
formance, vegetable oils formulations generally
require higher doses of antioxidants [6]. Due to
the oxidative instability of these major vegetable
oils, vegetable oils with high saturated acids is to
be used due to the high solidification points.
On the positive side, vegetable oils offer excel‐
lent lubricity and have a high intrinsic viscosity
and extreme‐pressure properties. Well‐
formulated vegetable oil‐based hydraulic fluids
can pass the demanding Vickers 35VQ25 or Deni‐
son T5D‐42 vane pump wear tests. Vegetable oil
can perform satisfactorily for years under mild
climate and operating conditions, provided the
oil are kept free of water contamination [10].
Klein et al suggested that vegetable oil used as
hydraulic fluid base oil can exhibit better low‐
temperature stability without the need for the
addition of pour point depressant or synthetic
esters by adding ethylene oxide and/or propyl‐
ene oxide into the base oil. Among the base oil
tested for this process are the coconut oil, palm
oil, palm kernel oil, peanut oil, cotton oil, soy‐
bean oil, sunflower oil and rapeseed oil. The
resultant mixture produced ethoxylated and/or
propoxylated base oil has been proven to have
better pour point characteristic. This develop‐
ment can result in inexpensive base oil for hy‐
draulic fluid as fewer additives are needed to
make the fluid suitable for hydraulics applica‐
tions [7].
Aside from chemical processes to increase the sta‐
bility of the vegetable oils, there is an alternative
method where genetic modifications is employ on
oil producing crops. Recent advances in genetic

| MA
RIN
E F
RO
NT
IER
@ U
niKL
66 MIMET Technical Bulletin Volume 1 (2) 2010
engineering and hybrid breeding technology
have made it possible to alter the physical prop‐
erties of vegetable oils by changing their fatty
acid profiles. This has allowed an improvement
of the oxidation stability by increasing the oleic
content of the oil. The resulting high oleic base
stock oils with additional antioxidants have
been shown to be as good as or better than
petroleum oils in oxidation stability trials [10].
Examples of the usage of vegetable oil based
hydraulic fluids are the Sawfish logging robot
deployed by the Triton Logging, a Canadian
company, in Lois Lake, British Columbia. The
underwater robot harvested submerged trees
using a hydraulic grappling pincer and electric
chain saw. The hydraulic grappler is powered
with vegetable oil instead of petroleum based
or synthetic based hydraulic fluids. The com‐
pany aim is to harvest the dead but well pre‐
served submerged forest thus eliminating the
need to cut down living trees onshore and at
the same time did not pollute the aquatic envi‐
ronment of the lake [12].
Feasibility of Palm‐Oil Based Fluid
Many research and developments of hydraulic
fluids made from vegetable oils has been done in
Europe and the United States focusing on rape‐
seed, soybean and canola oils by various inde‐
pendence and government sponsored laborato‐
ries such as the New York’s Brookhaven National
Laboratory, Albuquerque’s Sandia National Labo‐
ratory and the University of Iowa as early as
1991 [2,6]. These researches and the subsequent
commercial products show that rapeseed and
soybeans oils are suitable for hydraulic fluids
base oils and with its additives, able to perform
almost equally with petroleum based and syn‐
thetic fluids. However, these oils are sources and
processes in Europe or the United States and to
utilize these environmentally friendly oils in the
South East Asia region will be costly in term of
imports and transportation. Further with the
region own petroleum reserves especially in Ma‐
laysia, it is more economic to continue using pe‐
troleum based hydraulic fluids rather than im‐
porting the bio fluids from overseas.
As one of the world top vegetable oil, palm oil
can be a possible choice for further development
as a base oil for hydraulic fluids especially since
palm oil can be found in abundance in Malaysia.
Palm oil contains over 40% oleic acid and around
35% palmitic acid. Almost 60% of fatty acids of
the oil are unsaturated while stearic, palmitic
and myristic are saturated [13]. The suitability of
palm oil as hydraulic fluid base oil is compared
with other vegetable oil through the melting
point and iodine values as shown in table 1 be‐
low.
Table 1: Common vegetable oil melting
points and iodine values [11]
The iodine value is a measure of unsaturation of
vegetable oil. The saturated property of the oil
imparts a strong resistance to oxidative rancid‐
ity. Thus the thermal and oxidative of the oil can
be improved if the oil has lower iodine value. A
high iodine value indicates that the oil needs to
be mix with ethylene oxide and/or propylene

| MA
RIN
E F
RO
NT
IER
@ U
niKL
67 MIMET Technical Bulletin Volume 1 (2) 2010
oxide or other anti‐oxidant additives [8]. The
melting point indicates at which temperature
the oil will start to solidify thus making it useless
as hydraulic fluid base oil. A high melting point
will require the oil to be treated with more addi‐
tives to reduce its melting point to practical val‐
ues. Table 1 showed that the palm kernel oil and
palm oil have relatively low iodine values com‐
pared to other vegetable oils. This indicates that
palm kernel oil and palm oil have better anti‐
oxidant properties compared to rapeseed oil and
soybean oil hence require less anti‐oxidant addi‐
tive. The downside is that the melting points are
relatively high at 24oC for the kernel oil and 35oC
for the palm oil. More additives are required to
bring down the melting points of palm oils to be
comparable with rapeseed oil and soybean oil.
Researchers from Universiti Malaysia Tereng‐
ganu have experimented crude palm oil mixed
with Irgalube 343 additive for a hydraulic test rig
using the mixed fluid to actuate hydraulics linear
and rotary cylinders. It is reported that after
more than 100 hours of continuous testing, the
fluid mixture demonstrate an increased of vis‐
cosity. Obviously, further experiments with
other types of additives are necessary to obtain
palm oil mixture which is capable to sustain its
viscosity after hours of usage [13].
Another palm oil based hydraulic fluid research
was done by the Malaysian Palm Oil Board
(MPOB) under the Ministry of Plantation Indus‐
tries and Commodities. The result was a success‐
ful production of a hydraulic fluid with viscosity
grade ISO 46 with good viscosity index and mod‐
erately low pour point. The properties of the
palm based hydraulic fluid developed by MPOB
compared with typical petroleum based fluid are
given in table 2 [14] .
Table 2: Properties of the MPOB Palm Based Hydraulic Fluid,
Hy‐Gard Petroleum Based Fluid and AMSOIL Synthetics [14]
Based from the researches of MPOB, palm oil
based hydraulic fluid is reported feasible espe‐
cially for use in temperate climate i.e. in tropical
countries. Comparing palm oil based hydraulic
fluid with petroleum based hydraulic fluid and
AMSOIL synthetic esters hydraulic fluid for com‐
mon hydraulic applications, palm based fluid
have similar properties except for its low pour
point.
Conclusion
The feasibility of using vegetable oil based hy‐
draulic fluids has already been proven with the
development and commercial availability of
rapeseed oil and soybean oil based hydraulic
fluids in Europe and the United State. Comparing
the properties of raw, unprocessed palm oil with
other major vegetable oil indicates the possibil‐
ity of utilizing palm oil as base oil for hydraulics
fluid for temperate climate due to the high melt‐
ing point and pour point of palm oil compared
with other vegetable oils (rapeseed, canola, soy‐
beans etc). Several researches has been done by
Malaysian researchers on the palm based hy‐
draulic fluid and its suitable additive.

| MA
RIN
E F
RO
NT
IER
@ U
niKL
68 MIMET Technical Bulletin Volume 1 (2) 2010
The technology to produce hydraulic fluid from
palm oil is already available. What is needed is
the capability to manufacture the fluid in size‐
able quantities at an acceptable cost to pro‐
mote usage especially in the maritime field. Fur‐
ther step to be taken is the will of the Malaysian
government to regulate the usage of environ‐
mentally unsafe hydraulic fluids in Malaysian
waters. Legislation has played a major role in
Europe in promoting vegetable oil based fluid in
high risk area. Germany for example mandated
the use of environmentally friendly fluid in its
waterways by prohibiting the use of petroleum
based fluid on its inland waters. The legislation
resulted in Germany having 45% market share
of vegetable based fluids and lubricants in
Europe mainly produced from rapeseed oil [10].
If similar legislation can be applied in Malaysia,
more interest can be expected in producing
palm based hydraulic fluids for use in Malaysian
waters.
References:
1. Skinner, Samuel K; Reilly, William K. (May 1989) (PDF).
The Exxon Valdez Oil Spill. National Response Team. (online)
http://www.akrrt.org/Archives/Response_Reports/
ExxonValdez_NRT_1989.pdf (Accessed March 9, 2008).
2. Brookhaven National Laboratory. “Biobased Hydraulic
Fluid Use at Brookhaven National Laboratory.” (online)
http://www.bnl.gov/esd/pollutionpreve/docs/P2%
20Award%20Nominations/Biobased%20Hydraulics.pdf
(Accessed March 9, 2008)
3. Honary, Lou A. T. “Soybean Based Hydraulic Fluid.”
United States Patent Number 5,972,855. 26 Oct 1999
4. Isbell, A. T. “Agricultural Research Series: Biodegradable
Plant‐Based Hydraulic Fluid.” USDA News and Event. Nov 1998.
http://www.ars.usda.gov/is/AR/archive/nov98/oil1198.htm
United State Department of Agriculture (1998)
5. Johnson, Glenn. Ed. “Environmentally Safe Hydraulic Oils
Part 1 & 2. Articles posted on Feb 20, 2008. http://
www.processonline.com.au/articles/749‐Environmentally‐safe‐
hydraulic‐oils‐Part‐1
6. Rose, B and Rivera P. “Replacement of Petroleum Based
Hydraulic Fluids with a Soybean Based Alternative.” United
State Department of Energy. http://www.er.doe.gov/epic/docs/
soypaper.htm
7. Klein et al. “Triglyceride‐Based Base Oil for Hydraulic Oils.”
United States Patent Number 5,618,779. 8 April 1997
8. Rudnick, R.L. “Synthetics, Mineral Oil, and Bio‐Based Lubri‐
cants: Chemistry and Technology.” CRC Press. 2005
9. IMO (1997). “MARPOL 73/78, Consolidated Edition 1997.”
London. International Maritime Organization.
10. Nelson, J. “Harvesting Lubricants.” The Carbohydrate Econ‐
omy. Vol 3, Issue No. 1. Fall 2000
11. Calais, P. and Clark, A.R. “Waste Vegetable Oil as Diesel
Replacement Fuel.” (2004) Murdoch University and Western
Australia Renweable Fuels Association, Western Australia
12. Tenenbaum, J.D. “Underwater Logging: Submarines Redis‐
covers Lost Woods.” Environmental Health Perspectives. Vol‐
ume 112, Number 15. November 2004.
13. Wan Nik, W.B, Ani F.N., and Masjuki, H.H. “Rheology of
Environmental Friendly Hydraulic Fluid: Effect of Aging Period,
Temperature and Shear.” Proceedings of the 1st International
Conference on Natural Resources Engineering & Technology
2006 24‐25th July 2006, Putrajaya, Malaysia.
14. Yeong, S.K; Ooi, TL and Salmiah A. “Palm‐Based Hydraulic
Fluid.” MPOB TT No. 281. MPOB Information Series, June 2005

| MA
RIN
E F
RO
NT
IER
@ U
niKL
69 MIMET Technical Bulletin Volume 1 (2) 2010
Feature Article 5
JOINING OF DISSIMILAR MATERIALS BY DIFFUSION BONDING/ DIFFUSION
WELDING FOR SHIP APPLICATION
FAUZUDDIN AYOB*
Department of Marine Design Technology
Malaysian Institute of Marine Engineering Technology, Universiti Kuala Lumpur
Received: 20 September 2010; Revised: 27 October 2010 ; Accepted: 28 October 2010
ABSTRACT
The diffusion bonding process is normally used to fabricate parts that require high quality and strong welds, involving
intricate parts that are costly or impossible to manufacture by conventional means or when the materials used are not
suitable in a conventional fabrication process. This specialized welding process has found considerable acceptance in the
manufacturing of aerospace, nuclear and electronics components.
Explosion bonding/ welding is being applied in the mass production of ‘triclad’ of aluminum and steel joining which used
as transition joints for ship of steel hull and aluminum superstructure and other ship applications. Some disadvantages of
this process are it requires high energy explosive materials to be used and have to be conducted remotely as it produces
incredible noise. Diffusion bonding shall be explored as the alternative process to the production of these transition
joints.
Keywords: Diffusion, bonding, welding, explosion bonding
*Corresponding Author: Tel.: +605‐6909002
Email address: [email protected]
DEFINITION AND PRINCIPLE OF DIFFUSION
BONDING
Referring to the “AWS Master Chart of Weld‐
ing Processes” of American Welding Society, a
relationship between diffusion bonding/ diffu‐
sion welding with other solid state welding
processes as well as other available welding
processes was derived as in Fig. 1

| MA
RIN
E F
RO
NT
IER
@ U
niKL
70 MIMET Technical Bulletin Volume 1 (2) 2010
Diffusion bonding is a joining process between
materials wherein the principal mechanism for
joint formation is solid state diffusion. Coales‐
cence of the faying surface is accomplished
through the application of pressure at evevated
temperature. No melting and only limited macro‐
scopic deformation or relative motion of the parts
occurs during bonding. Microscopic deformation
followed by recrystallization occurs. Near the
bond zone, self diffusion in the same materials
and inter diffusion between the materials takes
place simultaneously. New crystalline forms of the
original elements and inter‐metallic compounds
may grow during the process (Paulonis, “Diffusion
Welding and Brazing”).
Other terms which are sometimes used synony‐
mously with diffusion bonding include diffusion
welding, solid state bonding, pressure bonding,
isostatic bonding , and hot press bonding.
A three‐stage mechanistic model, as de‐
scribed by Paulonis (“Advanced Diffusion Weld‐
ing Process”), shows the weld formation by diffu‐
sion bonding. See Fig. 2
OBJECTIVE
To describe the concept of diffusion bonding/
welding on the joining of dissimilar materials
such as aluminum alloy and steel of various car‐
bon contents for ship applications.
OUTCOMES
The expected outcomes of this brief paper are:
The influences of the bonding process parame‐
ters such as bonding pressure, temperatures,
holding time (duration of pressure), vacuuming
and the effect of the post‐bond heat treatment
on the mechanical and metallographic proper‐
ties of aluminum and steel joining would be
able to be analyzed, discussed and established.
The effect of various carbon contents in steel and
aluminum alloys on the joints properties will also
be able to be analyzed, discussed and established.
Optimum conditions and parameters of diffusion
bonding that would result in ultimate strength and
quality characteristics of diffusion bonded steel to
aluminum alloy are able to be determined.
The above expected outcomes would make possi‐
ble for the industrial production of aluminum and
steel joining by diffusion bonding for ship applica‐
tions
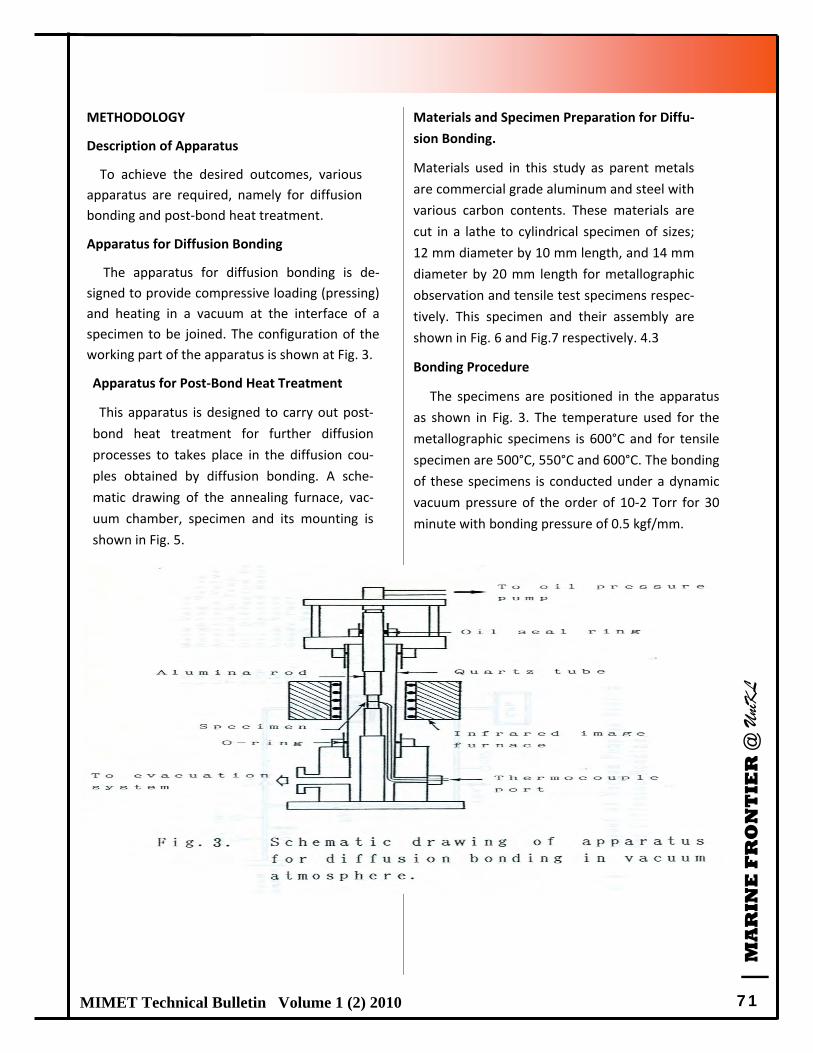
| MA
RIN
E F
RO
NT
IER
@ U
niKL
71 MIMET Technical Bulletin Volume 1 (2) 2010
METHODOLOGY
Description of Apparatus
To achieve the desired outcomes, various
apparatus are required, namely for diffusion
bonding and post‐bond heat treatment.
Apparatus for Diffusion Bonding
The apparatus for diffusion bonding is de‐
signed to provide compressive loading (pressing)
and heating in a vacuum at the interface of a
specimen to be joined. The configuration of the
working part of the apparatus is shown at Fig. 3.
Apparatus for Post‐Bond Heat Treatment
This apparatus is designed to carry out post‐
bond heat treatment for further diffusion
processes to takes place in the diffusion cou‐
ples obtained by diffusion bonding. A sche‐
matic drawing of the annealing furnace, vac‐
uum chamber, specimen and its mounting is
shown in Fig. 5.
Materials and Specimen Preparation for Diffu‐
sion Bonding.
Materials used in this study as parent metals
are commercial grade aluminum and steel with
various carbon contents. These materials are
cut in a lathe to cylindrical specimen of sizes;
12 mm diameter by 10 mm length, and 14 mm
diameter by 20 mm length for metallographic
observation and tensile test specimens respec‐
tively. This specimen and their assembly are
shown in Fig. 6 and Fig.7 respectively. 4.3
Bonding Procedure
The specimens are positioned in the apparatus
as shown in Fig. 3. The temperature used for the
metallographic specimens is 600°C and for tensile
specimen are 500°C, 550°C and 600°C. The bonding
of these specimens is conducted under a dynamic
vacuum pressure of the order of 10‐2 Torr for 30
minute with bonding pressure of 0.5 kgf/mm.
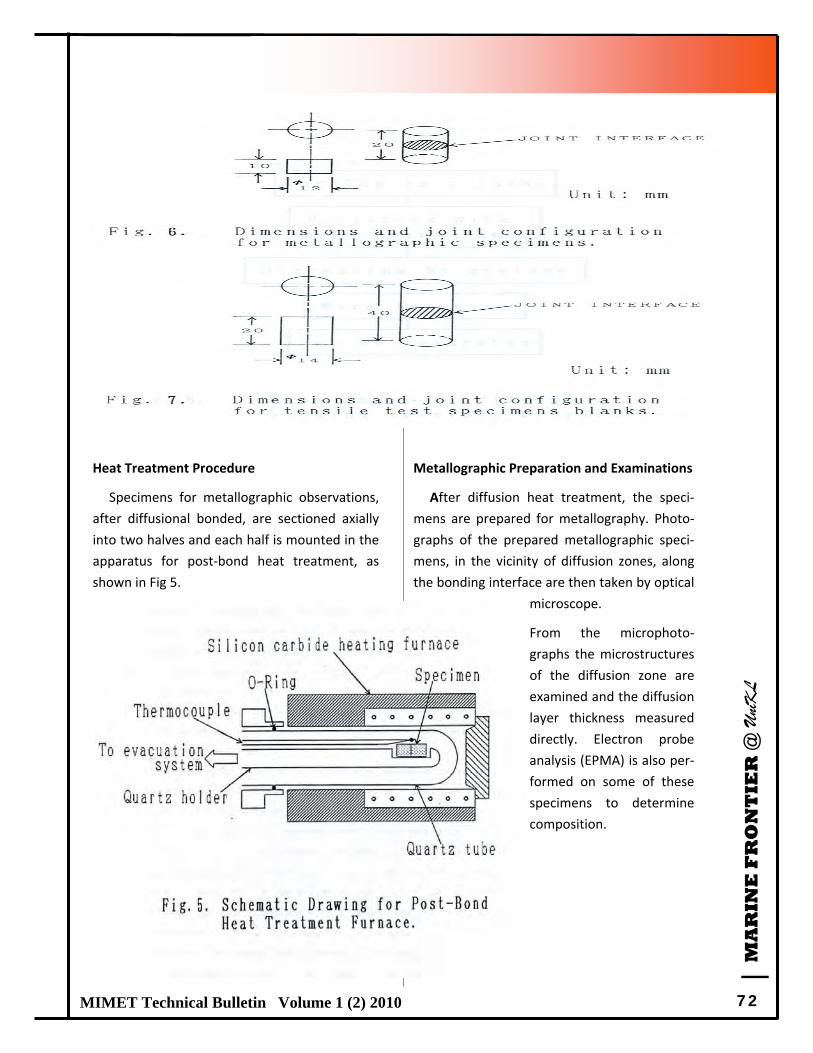
| MA
RIN
E F
RO
NT
IER
@ U
niKL
72 MIMET Technical Bulletin Volume 1 (2) 2010
Heat Treatment Procedure
Specimens for metallographic observations,
after diffusional bonded, are sectioned axially
into two halves and each half is mounted in the
apparatus for post‐bond heat treatment, as
shown in Fig 5.
Metallographic Preparation and Examinations
After diffusion heat treatment, the speci‐
mens are prepared for metallography. Photo‐
graphs of the prepared metallographic speci‐
mens, in the vicinity of diffusion zones, along
the bonding interface are then taken by optical
microscope.
From the microphoto‐
graphs the microstructures
of the diffusion zone are
examined and the diffusion
layer thickness measured
directly. Electron probe
analysis (EPMA) is also per‐
formed on some of these
specimens to determine
composition.

| MA
RIN
E F
RO
NT
IER
@ U
niKL
73 MIMET Technical Bulletin Volume 1 (2) 2010
Preparation and procedure for Mechanical
Properties Testing
Tensile test are carried out at a crosshead
speed of 1.0 mm/min at room temperature. The
ultimate strength and location of fracture are
determined. The fractured surfaces are analyzed
by X‐ray diffractometer using Cu‐k radiation.
Fractured surfaces are observed by Scanning
Electron Microscope (SEM) and fractographs ex‐
amined. SEM photographs of these interface
fractured specimens are also taken.
The metallographic specimens are also used
for hardness testing. In this test, the microhard‐
ness tester of the Vickers hardness testing ma‐
chine is employed with loads of 5 and 10 grams.
The hardness is measured across the bonding
interface.
BENEFITS OF DIFFUSION BONDING/ WELDING
The diffusion bonding process is normally used
to fabricate parts, when highly‐quality and high‐
strength welds are required, where part shapes
are intricate and would be costly or impossible
to manufacture by conventional means or when
the materials used possess unique properties
that interfere with, or area difficult to maintain
during conventional fabrication processing. This
specialized welding process has found consider‐
able acceptance in the manufacturing of aero‐
space, nuclear and electronics components.
Further research of this concept would be
beneficial at University level as it will focus on
the development and validation of new joining
techniques specifically for the dissimilar materi‐
als such as between steel and aluminum alloy.
The potential success of a possible research will
contribute enormously to the development of a
new welding technology and scientific knowl‐
edge to the university and as an alternative fab‐
rication and production methods in the marine
and other related industries. Joining of alumin‐
ium superstructure to steel deck and aluminium
decks (or even bulkheads) to steel hulls and
other ship’s components fabrication, fitting and
mounting are examples of possibility of utilizing
diffusion bonding technique in marine construc‐
tion.
CONCLUSION AND RECOMMENDATION
Realizing the important and benefits of the diffu‐
sion bonding/ welding as mentioned above, it is
recommended that further research to be con‐
ducted at UniKL MIMET that would benefit the aca‐
demic fraternity in particular and the related indus‐
tries in general.
REFERENCES
1.AWS. 1938. “The AWS Master Chart of Welding Process”.
AWS Welding Handbook American Welding Society, Miami,
Florida
2.D.F. Paulonis, “Diffusion Welding and Brazing”, Pratt and
Whitney Aircraft Group, United Technologies, USA.
3. D.F. Paulonis, “Advanced Diffusion Welding Process”, Pratt
and Whitney Aircraft Group, United Technologies, USA.
4.Tadashi Momono, 1990. “Diffusion Bonding of Cast Iron to
Steel under Atmospheric Pressure”, Casting Science and Tech‐
nology, The Japan Foundrymen Society, Japan.

| MA
RIN
E F
RO
NT
IER
@ U
niKL
74 MIMET Technical Bulletin Volume 1 (2) 2010
Feature Article 6
DEVELOPMENT OF LEGAL FRAMEWORK GOVERNING THE CARRIAGE OF LIQUIFIED
NATURAL GAS (LNG) WITHIN COASTAL WATER FROM CARRIER ASPECT
(OPERATIONAL PROCEDURE)
ASMAWI BIN ABDUL MALIK*
Department of Marine Construction & Maintenance Technology
Malaysian Institute of Marine Engineering Technology, Universiti Kuala Lumpur
Received: 12 July 2010; Revised: 2 August 2010 ; Accepted: 18 August 2010
ABSTRACT
The inevitable LNG evolution into coastal waters had reflected the lack and absence of clear guidelines on legal frame‐
work for governing the carriage of liquefied natural gas (LNG) within coastal water. IMO (Agenda item 21, MSC 83/
INF.3/2007) does not pay much attention to sustainable coastal water transport development due to the novelty of such
industry and the traditional procedures of UN developmental bodies, that normally needs sufficient time to consider new
and emerging phenomenon in their agenda of work. Thus it is a major source of inefficiency and unsafe operation of the
LNG carriage along the coast line. To date, there is no extension for LNG carriage within coastal waters on every estab‐
lished rules and regulation. The main purpose of this study is to develop a legal framework model for the LNG transporta‐
tion and carriage by using the IDEF0 structured modeling technique. The modeling process is divided into three phases,
(i) the information gathering, (ii) the model development and (ii) the experts’ evaluation and validation. In the first phase,
information on existing current legal practices were obtained through the literature study from applicable rules, regula‐
tions, conventions, procedures, policies, research papers and accident cases. In the second phase, a process model was
drafted through an iterative process using the IDEF0 and the questionnaire is developed. From the questionnaire pilot
test, each question blocks has shown an acceptable Cronbach’s Alpha value which is above 0.70. In the third phase, the
preliminary of legal framework model is tested through forty five (45) potential respondents from various fields in legal
practices and thirty eight (38) responded. A promising result was obtained where data exhibit normal distribution trend,
even though every group has their own stand on the legal framework. The ANOVA output has generated P‐values of
0.000. If P is less than or equal to the a‐level, one or more mean value are significantly different. Through data correla‐
tion test, the correlated element blocks show a range of 0.0 to 0.4. A legal framework model for the LNG carriage within
coastal water was constructed in the stand alone mode covering each aspect.
Keywords: Legal framework model, LNG carriage, structured modelling technique definition, Cronbach’s Alpha, ANOVA and Correlation.
*Corresponding Author: Tel.: +605‐6909051
Email address: [email protected]
INTRODUCTION
In tandem with the increasing Liquefied Natu‐
ral Gas (LNG) production in the emerging mar‐
ket, the LNG is depleting fast and will be re‐
quired on a major scale to feed the world’s
biggest gas market. Therefore, attention is
needed to focus largely on the safety and secu‐
rity of LNG transported by marine transporta‐
tion at commercial facilities near populated
areas. As the nation’s LNG facility become de‐
veloped, there is no special framework for the
LNG coastal transportation. In response to the
overall safety and security environment re‐
quirement, it is wise to seek a coastal water
legal framework covering a broader under‐
standing of hazardous chemical marine ship‐
ments and efforts to secure them. Recognizing
these fatal factors is important in promoting
for a legal framework for LNG transportation in
coastal water.

| MA
RIN
E F
RO
NT
IER
@ U
niKL
75 MIMET Technical Bulletin Volume 1 (2) 2010
Objective of the Research
The research on development of legal frame‐
work governing the carriage of LNG within
coastal water is expected to derive:
relevant element(s) for a legal framework
on the carriage of LNG within coastal water
3.0 Research Statement
In order to create relevant legal framework ele‐
ment (s), several situations identified are to in‐
fluence factors for safe transportation. The
situations are as follows:
Liberalization of importers power and gas
market.
Number of receiving or discharging
Geographical topography that reduces the
ability of LNG transportation.
The high cost of pipeline network and de‐
gasification area development and invest‐
ment.
As people keep pace with the development,
energy plans faces high resistance of NIMBY
and BANANA which stand for Not In My
Backyard (NIMBY) and Build Absolutely
Nothing Anywhere Near Anything
(BANANA), are being highlighted from the
end user perspective where people per‐
ceive the LNG storage as a time bomb.
Imbalance in demand and supply of the LNG.
Methodology

| MA
RIN
E F
RO
NT
IER
@ U
niKL
76 MIMET Technical Bulletin Volume 1 (2) 2010
Background and Problem Statement
The paper (Industries Energy, Utilities & Mining,
2007) has highlighted as the following:
The situation has indirectly rerouted the
existing LNG system into a new market regime
especially on its facilities from onshore to the
coastal trend. It has induced the market player
to get into this particular regime as it requires
no land requisition. Thus a real ‘new world gas
market’ began to emerge. However a ‘world gas
market’ should not be confused with the much
more flexible world oil market (Jensen, 2004).
The Industries Energy, Utilities & Mining (2007)
also highlighted on the regulatory aspects fol‐
lows:
Although several frameworks have
been developed by the LNG players such as Ball
et al, (2006), who proposed a legal framework
for the Taiwanese government it is specifically
for procurement activities in Taiwan. As in Not‐
teboom et al (2004), the only focused area in
Snøhvit project Norway is on LNG port manage‐
ment. There is no formal framework to govern
the carriage of this particular dangerous goods
carriage. Hence, a special attention on the de‐
velopment of the Legal Framework on the
Coastal Water for LNG transportation and appli‐
cation is required.
The immediate sign of market demand is
the clear indication that LNG transportation will
centre on the downstream activities as compared to
the upstream. Product distribution which cover the
following aspects:
Overcoming problems associated with the trans‐
portation of LNG by land.
Towards cost effective LNG transportation in
downstream market activities.
Provision of a healthy, safe and secure environ‐
ment of LNG transportation /carriage within
coastal water.
Morimoto (2006) estimated the world LNG
consumption exponentially rises from 139 m/tons
to 286 m/tons in his JGC Fiscal Interim Result. The
above prediction is supported by Nilsen (2007),
research on LNG Trade Volume, where momen‐
tous growth of short‐term trade from 1998 to
2006 as shown in Figure 2.1. Thus, existing facili‐
ties need to be tripled by 2020 by all means and
sizes as in Figure 2.2.
“Many companies are struggling to optimize their LNG portfolio of assets and contracts in a way that maximizes value. Opportunities
for ‘arbitrage’ profits require ever more clever valuation and modeling. The compa-nies that identify, assess and manage the
increasingly complex interdependencies and uncertainties in the evolving LNG market will be the ones who take the profits. LNG relies on two vital ingredients – infrastructure and
gas”
“Taking account of regulatory risk “LNG op-erations are spreading to many new loca-
tions. The maturity and format of regulatory frameworks vary considerably. The economic viability of an LNG chain can be influenced significantly by national or regional regula-tion, particularly on regasification facilities.”
“Many companies are struggling to optimize their LNG portfolio of assets and contracts in a way that maximizes value. Opportunities
for ‘arbitrage’ profits require ever more clever valuation and modeling. The compa-nies that identify, assess and manage the
increasingly complex interdependencies and uncertainties in the evolving LNG market will be the ones who take the profits. LNG relies on two vital ingredients – infrastructure and
gas”

| MA
RIN
E F
RO
NT
IER
@ U
niKL
77 MIMET Technical Bulletin Volume 1 (2) 2010
Figure 2.1: LNG Trade Volume 1998, 2002 & 2006
(Nilsen, 2007)
Figure 2.2: Outlook for World LNG Demand (Morimoto 2006)
The future LNG export terminals will be
larger as to cater the needs and supply, based
in remote locations with no infrastructure and
subjected to extreme weather conditions.
Therefore, conventional construction ap‐
proaches will no longer be cost and time effec‐
tive. The direction for future development has
been reinforced by the few inventions of sub‐
players of the Oil & Gas Company such as the
following and in Figure 2.3.
Proposed development of smaller scale re‐
gasification terminals.
Proposed development of Liquefaction hubs.
Alternative source and uses of LNG.
Gas storage for peak sharing.
Proposed development of Shipboard regasi‐
fication.

| MA
RIN
E F
RO
NT
IER
@ U
niKL
78 MIMET Technical Bulletin Volume 1 (2) 2010
Figure 2.3 Illustration of Future Expansion in Coastal Water (Kaalstad, 2006).
Traditionally, the regulation of maritime
transport operations by seafaring countries has
been motivated by the desire to establish and
maintain:
Standards as regards maritime safety and
the protection of the marine environment;
Participation of national fleets in the trans‐
port of its trade (although by and large in the
OECD there exists unrestricted market ac‐
cess);
Commercial regulations aimed at facilitat‐
ing the orderly conduct of business; and
The ability of sea carriers to operate tradi‐
tional co‐operative liner services despite
the presence of laws in many countries
aimed at preventing anti‐competitive be‐
haviors.
As mentioned by Luketa, A. et al (2008); such,
the risk mitigation and risk management ap‐
proaches suggested in the 2004 report are still
appropriate for use with the larger capacity
ships. Proactive risk management approaches
can reduce both the potential and the hazards
of such events. The approaches could include:
Improvements in ship and termi‐
nal safety/security systems,
Modifications to improve effec‐
tiveness of LNG tanker escorts, vessel
movement control zones, and safety
operations near ports and terminals,
Improved surveillance and
searches, and
Improved emergency response
coordination and communications
with first responders and public
safety officials.
In this particular project research, the quanti‐
tative survey technique is being applied. The
result from the quantitative input, will be
tested through descriptive statistic and the
interference statistic. The descriptive statistic
will interrogate the sample characteristic and
the interference will drill into sample popula‐
tion.
Results on Carrier Aspect – Operational Proce‐
dure
Table 3.1 shows the analysis on the sur‐
vey data obtained from the block of question‐
naires aimed at confirming ‘Operational Proce‐
dure’ as an element of the legal framework. The
table shows an overall mean of 4.0683 and an
overall standard deviation of 0.3869. Question
1, 2, 8, 9 and 10 return with individual means
above 4.0. Question 10 “LNG ships handling
procedures while in harbour and restricted ba‐
sin are more stringent” scores the highest mean
4.526 with standard deviation of 0.647. The rest
of the questions (question 3, 4, 5, & 7) return
with individual means lower than 4.0. Question
6 “Coastal LNG ships require more crew than
deep sea LNG ships” returns with the lowest
mean of 3.368 and with standard deviation of
1.207.

| MA
RIN
E F
RO
NT
IER
@ U
niKL
79 MIMET Technical Bulletin Volume 1 (2) 2010
Table 3.1: Carrier Aspect – Operational Procedure
Figure 3.1: B1 Graphical Summary
Figure 3.1 shows the graphic plot of the
analysis on this block of data. It shows p‐value is
0.378. As the level of significance is above 0.05,
the data is in normal distribution. The variance is
0.1497. The skewness is ‐0.499290 indicating
that the distribution is left‐skewed. The confi‐
dence intervals at 95% confident level are:
µ (mean) is between 3.7915 and 4.3451.
σ (standard deviation) is between
0.2661 and 0.7063.
the median is between 3.7534 and
4.4294.
4 .64 .44 .24 .03 .83 .63 .4
M e d i a n
M e a n
4 .44 .34 .24 .14 .03 .93 .8
A n d e r s o n - D a r l i n g N o r m a l i t y T e s t
V a r i a n c e 0 . 1 4 9 7S k e w n e s s - 0 . 4 9 9 2 9 0K u r t o s i s - 0 . 8 8 1 5 3 7N 1 0
M in im u m 3 . 3 6 8 4
A - S q u a r e d
1 s t Q u a r t i l e 3 . 7 6 3 2M e d ia n 4 . 1 1 8 43 r d Q u a r t i l e 4 . 4 2 6 8M a x im u m 4 . 5 2 6 3
9 5 % C o n f i d e n c e I n t e r v a l f o r M e a n
3 . 7 9 1 5
0 . 3 6
4 . 3 4 5 1
9 5 % C o n f id e n c e I n t e r v a l f o r M e d ia n
3 . 7 5 3 4 4 . 4 2 9 4
9 5 % C o n f id e n c e I n t e r v a l f o r S t D e v
0 . 2 6 6 1 0 . 7 0 6 3
P - V a lu e 0 . 3 7 8
M e a n 4 . 0 6 8 3S t D e v 0 . 3 8 6 9
9 5 % C o n f i d e n c e I n t e r v a l s
S u m m a r y f o r B 1 A v e r a g e o f Q u e s t i o n

| MA
RIN
E F
RO
NT
IER
@ U
niKL
80 MIMET Technical Bulletin Volume 1 (2) 2010
Figure 3.2: Probability Plot of B1 Data
Discussion on Result
The result discussion will cover on demo‐
graphic of the respondents, data distribution and
ANOVA and also correlation. The raw data is exe‐
cuted by using Minitab Software and SPSS Statis‐
tical Software
Demographic
Significantly, the majority of the feed‐
back by the respondents are on the ‘positive
mode or positive inclination’ toward the re‐
search hypothesis. The returned status of the
questionnaire is 84.4%. The respondents are
92.1% men which reflect oil and gas industry
practice where they usually prefer male em‐
ployees.
The 81.6% respondents are over 30
years of age, which indicates the respondents
have enough experience to be involved in this
survey and all of the respondents have formal
education. It means that they have been
equipped with relevant knowledge on the oil and
gas operation. Above 75% said that they are well
aware of the LNG business development.
Distribution
To expand the idea of a drawn up legal
framework, every legal aspect needs to be veri‐
fied through the survey. Questionnaires need to
be developed from the hypothesis legal frame‐
work, then each of it need to be correlated. Be‐
fore proceeding into the data collection, the
questionnaires need to be subjected through
pilot test so that only effective questionnaires
are sent out. Selective target groups who have
legal knowledge will be taken into considera‐
tion. Based on Kreijie and Morgan,(1970), De‐
termine Sample Size for Research Education
and Physiological Measurement, the author has
selected the 45 number of sample size. Then as
referred to Nazila (2007), she quoted Abdul
Ghafar (1999), when samples came from one
population it is categorized as case study sam‐
ple. In relation with current project, selected
group is being considered which have know
how knowledge on the LNG carriage. The data
collection and compilation is needed during the
second phase of project. The data is collected
according to requirement of the application
where it is able to represent to the situation
required.
B 1 A v e r a g e o f Q u e s t io n
Perc
ent
5 . 04 . 54 . 03 . 53 . 0
9 9
9 5
9 0
8 0
7 0
6 05 04 03 0
2 0
1 0
5
1
M e a n
> 0 .1 0 0
4 .0 6 8S tD e v 0 .3 8 6 9N 1 0R J 0 .9 6 7P - V a lu e
P r o b a b i l i t y P l o t o f B 1 A v e r a g e o f Q u e s t i o nN o r m a l

| MA
RIN
E F
RO
NT
IER
@ U
niKL
81 MIMET Technical Bulletin Volume 1 (2) 2010
From the result in Table 3.1, it shows that the
mean value have ‘Relevant’ status. The differ‐
ence between mean and variance is ± 0.3869
which is 9.51%. The result is way above the alpha
value (5%) is mainly due to Q3 to Q6. These
questions are about ‘Manning’ issue. It is under‐
standable because there are 84.21% not directly
involved on the operation. They may not truly
understand the basic requirement of LNG crew
task. From the highest mean of question 10, it
shows the majority of the respondents agreed
on the coastal LNG operation demands for detail
LNG ship operation procedure and handling.
Closing Remarks
The legal framework on the LNG car‐
riage within coastal water is the extended ver‐
sion of the current legal guide. As it is a new
revolution that LNG carriage will inevitable
come to the coastal zones, there is no literature
of what have been done previously. This is high‐
lighting the new milestone of the legal develop‐
ment. Hence, this study was conducted to iden‐
tify the legal framework component as to en‐
sure safe and secure coastal water operation.
This study shows that legal framework is re‐
quired in term of carrier aspect as identified at
Figure 8.1. However, from this study we also
know that the most important factor is safe
handling. The legal framework is expected to
reduce the implication and impact to the sur‐
rounding in the event of mishandling or any
mishaps.
Figure 8.1 Legal Framework for Coastal LNG Carriage
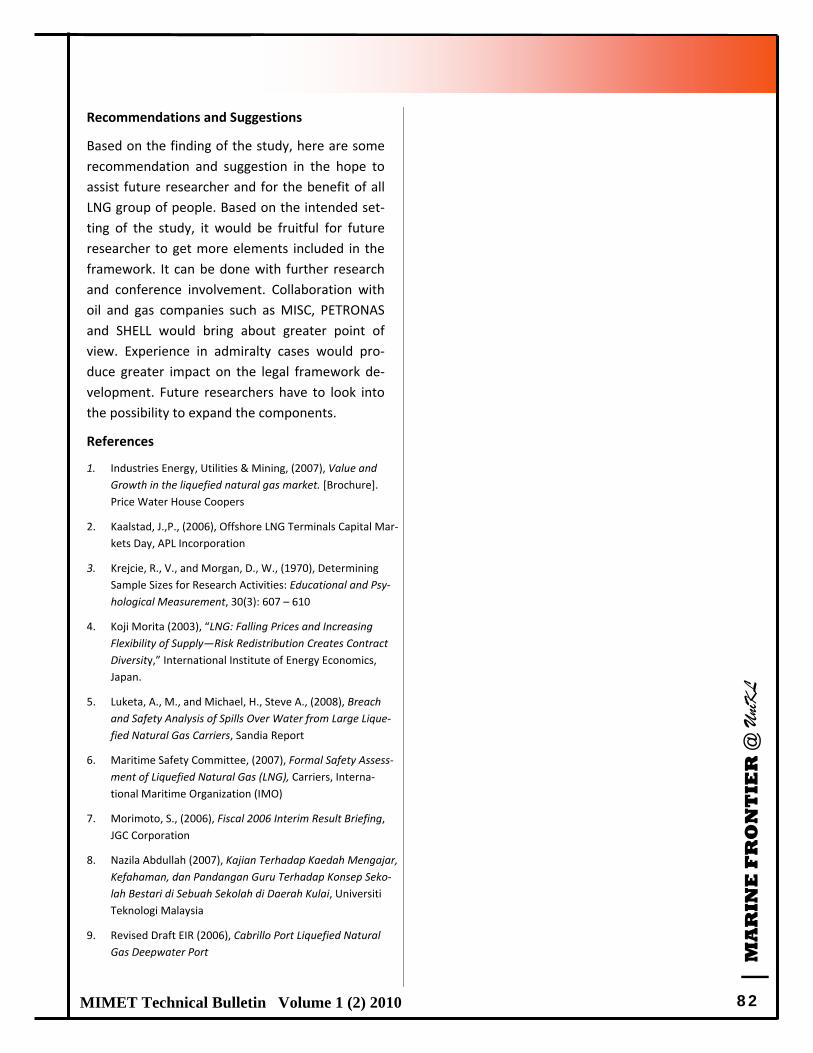
| MA
RIN
E F
RO
NT
IER
@ U
niKL
82 MIMET Technical Bulletin Volume 1 (2) 2010
Recommendations and Suggestions
Based on the finding of the study, here are some
recommendation and suggestion in the hope to
assist future researcher and for the benefit of all
LNG group of people. Based on the intended set‐
ting of the study, it would be fruitful for future
researcher to get more elements included in the
framework. It can be done with further research
and conference involvement. Collaboration with
oil and gas companies such as MISC, PETRONAS
and SHELL would bring about greater point of
view. Experience in admiralty cases would pro‐
duce greater impact on the legal framework de‐
velopment. Future researchers have to look into
the possibility to expand the components.
References
1. Industries Energy, Utilities & Mining, (2007), Value and
Growth in the liquefied natural gas market. [Brochure].
Price Water House Coopers
2. Kaalstad, J.,P., (2006), Offshore LNG Terminals Capital Mar‐
kets Day, APL Incorporation
3. Krejcie, R., V., and Morgan, D., W., (1970), Determining
Sample Sizes for Research Activities: Educational and Psy‐
hological Measurement, 30(3): 607 – 610
4. Koji Morita (2003), “LNG: Falling Prices and Increasing
Flexibility of Supply—Risk Redistribution Creates Contract
Diversity,” International Institute of Energy Economics,
Japan.
5. Luketa, A., M., and Michael, H., Steve A., (2008), Breach
and Safety Analysis of Spills Over Water from Large Lique‐
fied Natural Gas Carriers, Sandia Report
6. Maritime Safety Committee, (2007), Formal Safety Assess‐
ment of Liquefied Natural Gas (LNG), Carriers, Interna‐
tional Maritime Organization (IMO)
7. Morimoto, S., (2006), Fiscal 2006 Interim Result Briefing,
JGC Corporation
8. Nazila Abdullah (2007), Kajian Terhadap Kaedah Mengajar,
Kefahaman, dan Pandangan Guru Terhadap Konsep Seko‐
lah Bestari di Sebuah Sekolah di Daerah Kulai, Universiti
Teknologi Malaysia
9. Revised Draft EIR (2006), Cabrillo Port Liquefied Natural
Gas Deepwater Port

| MA
RIN
E F
RO
NT
IER
@ U
niKL
83 MIMET Technical Bulletin Volume 1 (2) 2010
Feature Article 7
OBSERVATION ON VARIOUS TECHNIQUES OF NETWORK RECONFIGURATION
WARDIAH DAHALAN*
Department of Marine Electric and Electronics Technology
Malaysian Institute of Marine Engineering Technology, Universiti Kuala Lumpur
Received: 27 May 2010; Revised: 2 August 2010 ; Accepted: 12 October 2010
ABSTRACT
The shipboard power system supplies energy to sophisticated systems for weapons, communications, navigation, and
operation. After a fault is encountered, reconfiguration of a shipboard power system becomes a critical activity that is
required to either restore service to a lost load or to meet some operational requirements of the ship. Reconfiguration
refers to changing the topology of the power system in order to isolate system damage and/or optimize certain charac‐
teristics of the system related to power efficiency. When finding the optimal state, it is important to have a method that
finds the desired state within a short amount of time, in order to allow fast response for the system. Since the reconfigu‐
ration problem is highly nonlinear over a domain of discrete variables, various techniques have been proposed by the
researchers. The main tasks of this thesis include reviewing the shipboard power system characteristics, studying and
reviewing shipboard power system integrated protection, shipboard power distribution systems and typical loads of ship‐
board power system. A variety of techniques used in previous works have been explained in methodologies review.
Many criteria and concepts are used as the basis for consideration in order to achieve the desired objectives.
Keyword: Reconfiguration, Fault Location, Service restoration, Distribution Power System
*Corresponding Author: Tel.: +605‐6909018
Email address: [email protected]
INTRODUCTION
The Navy ship electric power system supplies
energy to the weapons, communication sys‐
tems, navigation systems, and operation sys‐
tems. The reliability and survivability of a Ship‐
board Power Systems (SPS) are critical to the
mission of a ship, especially under battle condi‐
tions. SPS are geographically spread all along
the ship. They consist of various components
such as generators, cables, switchboards, load
centres, circuit breakers, bus transfer switches,
fuse and load.
The generators in SPS are connected in ring
configuration through generator switchboards
[1]. Bus tie circuit breakers interconnect the
generator switchboards which allow for the
transfer of power from one switchboard to
another. Load centers and some loads are
supplied from generator switchboards. Load
centers in turn supply power to power panels
to which different loads are connected. Feed‐
ers then supply power to load centers and
power panels. The distribution of loads is ra‐
dial in nature. For vital loads, two sources of
power (normal and alternate) are provided
from separate sources via automatic bus
transfers (ABTs) or manual bus transfers
(MBTs). Further, vital loads are isolated from
non‐vital loads to accommodate load shed‐
ding during an electrical system causality.
Circuit breakers(CBs) and fuses are provided at
different locations in order to remove faulted
loads, generators or distribution systems from
unfaulted portions of the system. These faults
could be due to material causalities of individual
loads or cables or due to widespread system

| MA
RIN
E F
RO
NT
IER
@ U
niKL
84 MIMET Technical Bulletin Volume 1 (2) 2010
fault due to battle damage. Because of the
faults and after isolating the fault, there are
unfaulted sections which are left without sup‐
ply. It is required to quickly restore supply to
these unfaulted sections of the SPS. This is ac‐
complished by changing the configuration of
the system by opening and/or closing some
switches (CBsMBTs/ABTs) to restore supply to
maximum load in the unfaulted section of SPS
to continue the present mission [28].
Shipboard Power System Characteristics
Today’s SPS generally use three‐phase power
generated and distributed in an ungrounded
configuration. The ungrounded systems can
keep equipment in continued operations in the
event of the single‐phase ground fault. Un‐
grounded systems mean all cabling are insulated
from the ship hull. Thus, it optimizes continuity
of power (increase equipment reliability).
SPS have different characteristics from typical
utility power systems in overall configuration
and load characteristics. Some of the unique
characteristics of the SPSs are as follows: [38]
There is very little rotational inertia relative
to load in SPS.
SPS are geographically smaller than utility
power systems.
SPS is an isolated system with no power
supply from outside power system.
SPS has a wider frequency range compared
to the terrestrial power system.
Shipboard prime movers typically have
shorter time constant than prime movers in
terrestrial power systems.
Due to the limited space on shipboard, SPS
does not have a transmission system.
The electric power in SPS is transmitted
through short cables. It leads to less power
loss and voltage drop as copared to terrestrial
power systems.
There is a large portion of nonlinear loads rela‐
tive to the power generation capability.
In SPS, a large number of electric components
are tightly coupled in a small space.
A fault happens in one part of the SPS may af‐
fect other parts of the SPS.
A large number of electronic loads, such as
combat, control and communication
sensors, radiators, and computers are sensitive
to power interruptions and power quality.
Some electrical components, which affect the
reconfiguration process, are unique to SPS such
as Automatic Bus Transfers (ABT), Manual Bus
Transfers (MBT), Low Voltage Protection de‐
vices (LVPs), and Low Voltage Release devices
(LVRs).
Due to these unique characteristics of the SPS,
some of the mathematical expediencies used in
terrestrial power system analysis may not be appli‐
cable to SPS accordingly. For example, infinite
buses and slack buses do not have manifestations
in SPSs. Constant voltage, constant frequency, and
constant power simplifications are usually invalid in
SPS. Also, the SPSs are tightly coupled both electri‐
cally and mechanically, requiring integrated model‐
ling of both systems [44]. A brief overview of the
loads in the SPS is explained in the following sec‐
tion.
Loads in the SPS
The loads in the SPS provide various services to
the ship. According to the importance of the ser‐
vices being provided, the loads in the SPS can be
classified into non‐vital, semi‐vital, and vital‐loads
in increasing priority order as follows:
Non‐vital (Non‐essential) ‐ Readily sheddable
loads that can be immediately secured without

| MA
RIN
E F
RO
NT
IER
@ U
niKL
85 MIMET Technical Bulletin Volume 1 (2) 2010
adversely affecting ship operations, survivability,
or life. Examples are hotel loads such as heating
and galley; ship, avionics, and ground support
equipment shops; aircraft fueling systems; refrig‐
eration systems; and other loads that can be
shut down for a short time until full electric
power capability is restored.
Semi‐vital (Semi‐essential) ‐ Loads important to
the ship but that can be shut down or switched
to the alternate plant in order to prevent total
loss of ship’s electrical power. Examples include
aircraft and cargo elevators, assault systems,
some radar, communications, and seawater ser‐
vice pumps.
Vital (Essential) – Non‐sheddable loads that af‐
fects the survivability of ship or life. Power to
these loads is not intentionally interrupted as
part of a load shedding scheme. Examples of vi‐
tal loads are generators, boilers, and their auxil‐
iaries; close‐in weapon systems; electronic coun‐
termeasures; tactical data system equipments
with volatile memories; medical and dental op‐
erating rooms; and primary air search radar.
The vital loads are required to be connected to
two independent power sources in the SPS. If a
load is classified as vital load at any major mis‐
sion of the ship, such as propulsion system, it has
to be connected to the SPS through Automatic
Bus Transfer (ABT). ABT is a device that can
sense the loss of power from normal power
source. When normal power is absent, ABT can
automatically disconnect the load from the nor‐
mal power and switch the load’s power flow
from an alternate power source. ABTs are de‐
signed to transfer loads very quickly. If a load is
classified as a vital load in some missions and a
non‐vital load in other missions, such as the
lighting system, the load is connected to its SPS
through a Manual Bus Transfer (MBT). MBT is a
device, like an ABT, that can connect loads either
to a normal power source or to an alternate
power source. But unlike the ABT, the MBT must
be shifted manually by an operator when the
operator notices that the load’s primary source
of power becomes unavailable. Loads that are
classified as non‐vital loads in any missions are
connected to only one power source in the SPS.
The electric loads are hard wired to their source
(s) at the time of ship construction. How “vital”
they are is determined at that time and does not
change unless the power system hardware is
modified [36]. One of the important aspects in
considering loads in SPS is Protection and inte‐
grated power system is one type of protection in
SPS.
Integrated Power System (IPS)
The IPS design is applied because it is simpler
and cheaper, and better to centrally produce a
commodity such as electricity, than to locally
produce it with the user of commodity. In the
IPS, the ship service and the propulsion loads are
provided by a common set of generators. The
integrated power systems are currently used for
a wide range of ship applications. The primary
advantage of using integrated power systems is
the flexibility to shift power between the propul‐
sion and mission‐critical loads as needed. The
integrated power system can also improve the
survivability and reliability of the SPS. It has been
identified as the next generation technology for
SPS platform and an important step to achieve
the all‐electric ship initiative [44].
In SPSs, different faults may occur because of
equipment insulation failures, over voltages
caused by switching surges, or battle damage.
Shipboard power protection systems are re‐
quired to detect faults and undesirable condi‐
tions and quickly remove the faults from the
power system.
Shipboard power protection systems are also
required to maintain power balance for the re‐

| MA
RIN
E F
RO
NT
IER
@ U
niKL
86 MIMET Technical Bulletin Volume 1 (2) 2010
maining part of the power system automatically
and quickly. Therefore, an integrated power pro‐
tection system is necessary for SPSs to maximize
service continuity and minimize loss‐of‐load
caused by accidental system abnormal behaviour
or hostile damage. Special characteristics of the
shipboard power system, such as short cable
length, high impedance grounding, and multiple
possible system operation configurations, im‐
pose unique challenges on designing the protec‐
tion system for shipboard power systems. A well
‐designed protection system should protect the
overall power system from the effect of system
components that have been faulted and should
adapt to the power system reconfiguration prac‐
tices without any human intervention [39].
The integrated power system has two essential
functions: fault detection and post‐fault recon‐
figuration. Currently, there are three available
fault detection schemes including over‐current,
distance, and differential schemes. The over‐
current fault detection scheme is difficult to co‐
ordinate for minimizing the fault isolation of
power systems having multiple sources at differ‐
ent locations, such as shipboard power systems.
The distance fault detection scheme is also not
suitable for a shipboard power system with short
transmission and distribution lines. On the other
hand, the differential fault detection scheme is
faster and more reliable for shipboard power
systems with system level measurements. Ship‐
board power system fast fault detection can be
implemented by the dynamic‐zone‐selection
based differential protection scheme, which trips
only the required circuit breakers to isolate the
fault. Shipboard power post‐fault reconfigura‐
tion function, also called fast reconfiguration
function, will evaluate the outcome of the fault
and reconfigure the unfaulted part of the power
system to minimize the loss‐of‐load.
The main objective of Shipboard power distribu‐
tion systems are designed to minimize the size
and weight, save money, and improve the surviv‐
ability of the vessel. Additionally, shipboard
power distribution systems are desired to pos‐
sess the ability to continually transfer power to
vital systems during and after fault conditions.
There are two possible types of shipboard power
distribution architecture radial and zonal.
Radial electric Power Distribution
Distribution lines are usually radial and operate
at low‐level voltages in a radial shipboard power
system. Current shipboard radial electric power
distribution systems have multiple generators
(typically three or four), which are connected to
switchboards. The generators could be steam
turbine, gas turbines, or diesel engines. The gen‐
erators are operated either in a split plant or a
parallel configuration. The 450V, 60Hz three
phase ac power is then distributed to load cen‐
ters. Each load is classified as being nonessential,
semi‐essential, or essential . If there is any gen‐
eration capacity loss, a load shedding algorithm
will be initiated based on load priority
In a current navy ship power system, three‐
phase step‐down power transformers are nor‐
mally used. Both the transformer primary and
secondary windings are connected in a delta,
resulting in no reliable current path from the
power lines to the ship’s hull. Therefore, the sys‐
tem has a high impedance ground and will not
be affected by single phase grounded fault.
Zonal electric power distribution
The zonal power distribution system consists of
two main power distribution buses running lon‐
gitudinally along the port and starboard side of
the ship. One main bus would be positioned well
above the waterline while the other would be
located below the waterline, which maximizes
the distance between buses and improves the
survivability [47]. The effects of damage to the

| MA
RIN
E F
RO
NT
IER
@ U
niKL
87 MIMET Technical Bulletin Volume 1 (2) 2010
distributed system and other equipment should
not disturb generators. The zonal architecture is
flexible and saves the cost for short switchboard
feeder cables and elimination of distribution
transformers. A zonal distribution system also
allows for equipment installation and testing
prior to zone assembly [46].
Need for Reconfiguration
Faults in a shipboard power system may occur
due to material casualties of individual loads or
widespread fault due to battle damage. In addi‐
tion to load faults, casualties can happen to ca‐
bles, power generating equipment, or power
distribution buses. If the fault is severe, such as a
generator fault, it may cause a power deficiency
to the remaining power system, system load
generation unbalance, and even an entire sys‐
tem collapse. After the fault has occurred, pro‐
tective devices operate to isolate the faulted
section. But, this may lead to unfaulted sections
that are not getting supplied. Therefore, it is re‐
quired to restore supply automatically and
quickly to these un‐faulted sections of the ship‐
board power system to improve the system sur‐
vivability. This can be achieved by changing the
configuration of the system by opening and/or
closing switches to restore supply to maximum
load in the un‐faulted sections of the shipboard
power system. Reconfiguration can be aimed at
supplying power to high priority loads and/or
supplying power to maximum amount of loads
depending upon the situation. The need recon‐
figuration is also proposed to maintain power
balance of the remaining power system parts
after fault detection and isolation. Fast recon‐
figuration is necessary for a shipboard power
system considering the unique shipboard power
system characteristics.
Methodologies Reviews
In recent years, several reconfiguration method‐
ologies have been proposed for power systems.
With the advancement in the power system, the
topology of power systems has become more
complicated. However, in previous reconfigura‐
tion methodologies, no generic methodology was
proposed for the reconfiguration of a power sys‐
tem with a complicated topology. Most of the
previous reconfiguration methodologies are to‐
pology dependent. New reconfiguration method‐
ologies need to be researched and developed for
power systems with large scale and complicated
topologies [44].
There are slight differences between reconfigu‐
ration of terrestrial power system and shipboard
power system.
Reconfiguration of terrestrial power system
The reconfiguration approach for power system
can be implemented in centralized manner or in
decentralized manner. In centralized approach,
various methods are applied to the reconfigura‐
tion approach, such as evolutionary program‐
ming, heuristic method, artificial intelligent
method, etc.
The main advantage of the centralized ap‐
proaches for power system reconfiguration is that
it is easy for the central controller to access re‐
quired information for reconfiguration reasoning.
The central controller in a centralized approach
can directly gather data from the sensors
throughout the entire system. When there are
changes in the system, the central controller
can easily update its database for reconfigura‐
tion. The disadvantage of the centralized ap‐
proach for reconfiguration is that it may lead to
the single point of failure in the system if the
system lacks redundancy.
The main advantage of the decentralized ap‐
proach for power system reconfiguration is the
robustness. The decentralized approach is im‐

| MA
RIN
E F
RO
NT
IER
@ U
niKL
88 MIMET Technical Bulletin Volume 1 (2) 2010
mune to the single point of failure because
there is no central controller in the approach.
Also the decentralized approach has more flexi‐
bility and scalability compared to the central‐
ized approach. However, the controllers in the
decentralized system have limited access to the
information of the system for control decisions.
So, compared to the centralized approach, it is
harder for the decentralized system to achieve
the global optimal solution based on the limited
information each controller has.
Many of the proposed automatic reconfiguration
methodologies are developed for distribution
system reconfiguration. The distribution system
is usually reconfigured for restoring the loads in
the distribution system, decreasing the power
loss in the distribution system, stabilizing the
distribution system, etc.
Schmidt et al [3] put forward a fast integer pro‐
gramming based reconfiguration methodology
to minimize the power loss in a distribution sys‐
tem. The power loss in the distribution system is
the electric power that is consumed by transmis‐
sion equipments, such as transformers, cables,
wires, etc. This methodology is only applicable to
radial power systems.
Tzeng et al [4] proposed a feeder reconfiguration
methodology for the distribution system. In that
particular research, dynamic programming is
used to find the optimal switching actions for
load balancing in a distribution system. In a
power system, the loads get electric power sup‐
ply from load feeders. The load feeders that sup‐
plies more loads need more current injections
than those load feeder supplying lesser loads.
This will cause the imbalanced current distribu‐
tion in the power system. With the same loads
supplied in the power system, the imbalanced
current distribution in the power system leads to
more power loss than balanced current distribu‐
tion in the power system. The imbalanced cur‐
rent in the power system also leads to the over
current problem and stability problem. The load
feeders in the power system need to be bal‐
anced by switching the circuit breakers and
other switching devices so that the current dis‐
tribution in the power system can be balanced..
Gomes et al [5] proposed a heuristic reconfigura‐
tion methodology to reduce the power loss in a
distribution system. In this work, the optimal
power flow and sensitivity analysis are used to
find the reconfiguration solution. This reconfigu‐
ration methodology is only applicable to radial
power systems.
Hsu et al [6] proposed a reconfiguration method‐
ology for transformer and feeder load balancing
in a distribution system. When the number of
loads that are supplied through a load feeder
increases, the current injection to the load
feeder increases. The current that flows through
the transformer is connected to the load feeder
increases, too. It may lead to the risk of over cur‐
rent on the transformers and the transmission
lines in the system. The proposed reconfigura‐
tion methodology is based on heuristic search.
Another heuristic search based reconfiguration
algorithm was proposed by Wu et al [51]. In the
research, the reconfiguration methodology was
applied to the radial power system for service
restoration, load balancing, and maintenance of
the power system. Zhou, et al [7] put forward a
heuristic reconfiguration methodology for distri‐
bution system to reduce the operating cost in a
real time operation environment. The operation
cost in the power system is the power loss in the
distribution system. The operation cost reduc‐
tion is based on the long term operation of the
power system.
The knowledge based systems, such as expert
systems, have also been applied to the recon‐
figuration of power systems for a long time.
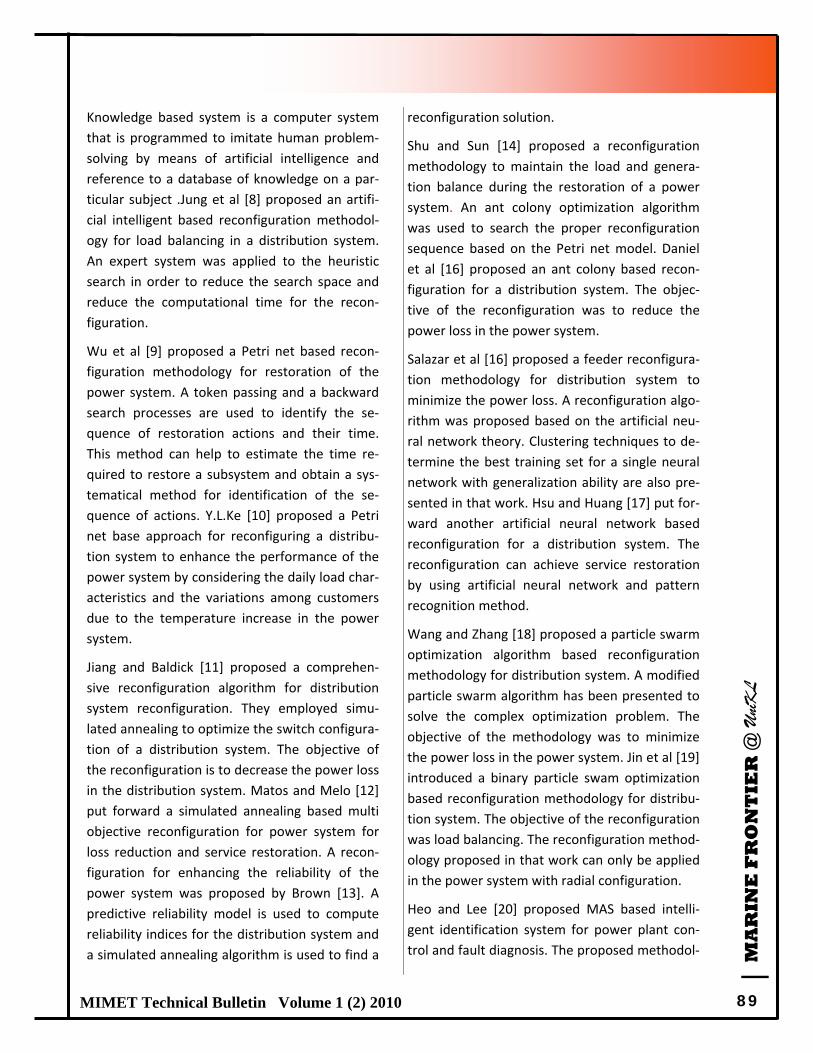
| MA
RIN
E F
RO
NT
IER
@ U
niKL
89 MIMET Technical Bulletin Volume 1 (2) 2010
Knowledge based system is a computer system
that is programmed to imitate human problem‐
solving by means of artificial intelligence and
reference to a database of knowledge on a par‐
ticular subject .Jung et al [8] proposed an artifi‐
cial intelligent based reconfiguration methodol‐
ogy for load balancing in a distribution system.
An expert system was applied to the heuristic
search in order to reduce the search space and
reduce the computational time for the recon‐
figuration.
Wu et al [9] proposed a Petri net based recon‐
figuration methodology for restoration of the
power system. A token passing and a backward
search processes are used to identify the se‐
quence of restoration actions and their time.
This method can help to estimate the time re‐
quired to restore a subsystem and obtain a sys‐
tematical method for identification of the se‐
quence of actions. Y.L.Ke [10] proposed a Petri
net base approach for reconfiguring a distribu‐
tion system to enhance the performance of the
power system by considering the daily load char‐
acteristics and the variations among customers
due to the temperature increase in the power
system.
Jiang and Baldick [11] proposed a comprehen‐
sive reconfiguration algorithm for distribution
system reconfiguration. They employed simu‐
lated annealing to optimize the switch configura‐
tion of a distribution system. The objective of
the reconfiguration is to decrease the power loss
in the distribution system. Matos and Melo [12]
put forward a simulated annealing based multi
objective reconfiguration for power system for
loss reduction and service restoration. A recon‐
figuration for enhancing the reliability of the
power system was proposed by Brown [13]. A
predictive reliability model is used to compute
reliability indices for the distribution system and
a simulated annealing algorithm is used to find a
reconfiguration solution.
Shu and Sun [14] proposed a reconfiguration
methodology to maintain the load and genera‐
tion balance during the restoration of a power
system. An ant colony optimization algorithm
was used to search the proper reconfiguration
sequence based on the Petri net model. Daniel
et al [16] proposed an ant colony based recon‐
figuration for a distribution system. The objec‐
tive of the reconfiguration was to reduce the
power loss in the power system.
Salazar et al [16] proposed a feeder reconfigura‐
tion methodology for distribution system to
minimize the power loss. A reconfiguration algo‐
rithm was proposed based on the artificial neu‐
ral network theory. Clustering techniques to de‐
termine the best training set for a single neural
network with generalization ability are also pre‐
sented in that work. Hsu and Huang [17] put for‐
ward another artificial neural network based
reconfiguration for a distribution system. The
reconfiguration can achieve service restoration
by using artificial neural network and pattern
recognition method.
Wang and Zhang [18] proposed a particle swarm
optimization algorithm based reconfiguration
methodology for distribution system. A modified
particle swarm algorithm has been presented to
solve the complex optimization problem. The
objective of the methodology was to minimize
the power loss in the power system. Jin et al [19]
introduced a binary particle swam optimization
based reconfiguration methodology for distribu‐
tion system. The objective of the reconfiguration
was load balancing. The reconfiguration method‐
ology proposed in that work can only be applied
in the power system with radial configuration.
Heo and Lee [20] proposed MAS based intelli‐
gent identification system for power plant con‐
trol and fault diagnosis. The proposed methodol‐

| MA
RIN
E F
RO
NT
IER
@ U
niKL
90 MIMET Technical Bulletin Volume 1 (2) 2010
ogy can achieve the online adaptive identifica‐
tion for control in real time power plant opera‐
tion and offline identification for fault diagnosis.
Enacheanu et al [21] proposed a distribution sys‐
tem architecture that can make the reconfigura‐
tion in the power easy to achieve. The reconfigu‐
ration in that work is to locate and isolate the
faults in the power system. A remote agent is
used in that work as a central controller for the
reconfiguration of power systems.
Nagata et al [22] proposed MAS based restora‐
tion methodology for power systems. The MAS
proposed was composed of bus agents and a
single facilitator agent. The bus agent decides a
suboptimal target configuration after faults oc‐
cur. A facilitator agent was developed to act as a
manager for the decision process. The existence
of the facilitator agents make the methodology
centralized. Liu et al [37] put forward another
restoration method for the power system. How‐
ever, this method is also centralized because the
restoration decision is made with the help of
coordinating agents that have global information
in the MAS.
Nagata et al [50] improved the method proposed
in [22]. In the MAS proposed in [50], the coordi‐
nation functions were distributed to several fa‐
cilitator agents instead of one facilitator agent.
The facilitator agents coordinate with each other
autonomously. However, each facilitator agent
works as centralized coordinator in the local
area. So the MAS proposed in that work is not
completely decentralized. The proposed restora‐
tion can only be applied to a radial power sys‐
tem. Also, the reconfiguration method was
tested on a small power system simulated on a
PC. The agents’ performance in the restoration
for a large power system was not provided.
Wang et al [24] proposed a fuzzy logic and evolu‐
tionary programming based reconfiguration
methodology for distribution systems. In this
research, a fuzzy mutation controller is imple‐
mented to adaptively update the mutation rate
during the evolutionary process. The objective of
the reconfiguration is to reduce the power loss
in the distribution system. Zhou et al [25] put
forward another fuzzy logic based reconfigura‐
tion methodology for distribution system. A
fuzzy logic based reconfiguration was developed
for the purpose of restoration and load balanc‐
ing in a real‐time operation environment. Kuo
and Hsu [26] proposed a service restoration
methodology using fuzzy logic approach. In this
research, the fuzzy logic based approach was
estimated the loads in a distribution system and
devised a proper service restoration plan follow‐
ing a fault.
Various methods have been applied to the re‐
configuration process of the terrestrial power
system. However, most of the reconfiguration
methodologies are centralized. A central control‐
ler is a requirement to gather data from the
power system, make reconfiguration decisions
after calculation and analysis.
Shipboard Power System Reconfiguration
Compared to the terrestrial power systems, the
SPS has its unique characteristics. Based on the
unique characteristics of the SPS, some recon‐
figuration methods have been proposed. Some
of the significant literature of the SPS reconfigu‐
ration process of the SPS is reviewed below.
Butler and Sarma [27] propose a heuristics based
general reconfiguration methodology for
AC radial SPSs. The reconfiguration process is
applied to the SPS for service restoration. The
reconfiguration process is based on the initial
configuration and desired configuration details
of the system, such as the list of load con‐
nected /disconnected to the SPS, list of available
component (cables, circuit breakers, etc) in the
SPS, etc.

| MA
RIN
E F
RO
NT
IER
@ U
niKL
91 MIMET Technical Bulletin Volume 1 (2) 2010
Again Butler and Sarma [28] put forward an opti‐
mization method that can be applied to the re‐
configuration of SPS. The objective for reconfigu‐
ration is to maximize the load restored in the
SPS. A commercial software package is used for
solving the optimization problem in the recon‐
figuration process. Butler and Sarma [29] im‐
prove the reconfiguration methodology pro‐
posed in [28]. The reconfiguration methodology
is similar to the reconfiguration methodology
proposed in [28]. However, in this work, more
constraints, such as voltage constraints for buses
in the SPS, are applied to the reconfiguration
compared to the work in [28]. In [27] and [28],
the reconfiguration methodology is imple‐
mented by using a commercial optimization soft‐
ware, which cannot provide a real time perform‐
ance.
Srivastava and Butler [32] proposed an auto‐
matic rule based expert system for the recon‐
figuration process of an SPS. The objective of the
reconfiguration process is to supply the de‐
energized loads after battle damage or cascading
faults. In the event of battle damage or cascad‐
ing faults, a failure assessment (FAST) system
detects faults, identifies faulted components in
damaged sections, and determines de‐energized
loads. The reconfiguration method uses the out‐
put of a FAST system, real time data, topology
information and electrical parameters of various
components to perform reconfiguration for load
restoration of an SPS.
Again Srivastava and Butler [33] proposed a
probability based pre‐hit reconfiguration
method. In this research, the reconfiguration
actions are determined on the estimation of the
damage that a weapon hit may cause before the
weapon hit happens. The objective of the recon‐
figuration in this work is to restore the service in
SPS and reduce the damage caused by weapon
hit. This probabilistic reconfiguration methodol‐
ogy has two major modules: weapon damage
assessment (WDA) module and pre‐hit recon‐
figuration module. The main goal of the WDA is
to compute the expected probability of damage
(EPOD) value for each electrical component in an
SPS. The pre‐hit reconfiguration module takes
the EPOD calculated by WDA as the input, and
determines the reconfiguration actions to re‐
duce the damage to the SPS that may be caused
by the weapon hit.
Again the same author, Butler and Sarma [34] pro‐
posed automated self‐healing strategy for recon‐
figuration for service restoration in Naval SPS. A
model of the 3‐D layout of the electrical network of
shipboard power system using a geographical infor‐
mation system was explained. A self‐healing system
is a system that when subjected to a contingency
(or threat) is able to access the impact of the contin‐
gency, contain it and then automatically perform
corrective action to restore the system to the best
possible (normal) state to perform its basic func‐
tionality.
In recent years, Multi Agent System (MAS) tech‐
nologies have been applied to the reconfigura‐
tion process in SPS. Srivastava et al [30] pro‐
posed MAS based reconfiguration methodology
for automatic service restoration in the SPS. In
this work, the overall function of the MAS is to
detect and locate the fault(s), determine faulted
equipments, determine de‐energized loads, and
perform an automated service restoration on
the SPS to restore de‐energized loads. The MAS
also gives an output list of restorable loads and
switching actions required to restore each load.
The restoration methodology proposed in this
research work is not completely decentralized.
Feliachi et al [35] proposed a new scheme for an
energy management system in the form of the
distributed control agents for the reconfigura‐
tion of the SPS. The control agents’ task is to en‐
sure supply of the various load demands while

| MA
RIN
E F
RO
NT
IER
@ U
niKL
92 MIMET Technical Bulletin Volume 1 (2) 2010
taking into account of system constraints and
load priorities. A graph theoretic self‐stabilizing
maximum flow algorithm for the implementation
of the agents’ strategies has been developed to
find a global solution using load information and
a minimum amount of communication. Although
a simulation platform is developed to implement
parts of the reconfiguration system, the simula‐
tion platform proposed in [35] is not a real time
solution and cannot provide bandwidth require‐
ment and latency performance of the system.
Solanki et al [34] proposed an MAS reconfigura‐
tion methodology for SPS. In this work the re‐
configuration process can isolate the fault and
restore the power supply quickly and autono‐
mously. Also, this reconfiguration methodology
can be applied only to radial SPS. Solanki and
Schulz [36] demonstrated the MAS for the re‐
configuration of the SPS and the implementa‐
tion of the MAS. In the simulation of the recon‐
figuration process in [36] and [34], the MAS and
SPS are implemented on the same PC. The com‐
munication bandwidth of the MAS cannot be
researched by using this simulation platform.
Sun et al [37] put forward a complete reconfigu‐
ration methodology for the reconfiguration of
the SPS. The objective of the reconfiguration is
to restore the loads in the SPS. The research is
no central controller in the MAS. Each agent
works independently and autonomously. The
reconfiguration methodology proposed in this
research, cannot be applied to SPSs with ring
and mesh structure.
E.J. William [48] proposed an Artificial Neural
Network Algorithm (ANN) to determine fault
locations on shipboard Electrical Distribution
System (EDS). It traces the location of the fault
on SPS. The EDS is protected when faults are lo‐
cated and isolated as quickly as possible. The
goal is to increase the availability of shipboard
EDS by locating and isolating faults by using
Power system CAD (PSCAD) and ANN analysis.
However the only problem with this is that the
fault path accuracy is unpredictable and require
sensitive current measurement device.
Kai Huang and Srivastava [42] proposed a novel
Algorithm for agent Based Reconfiguration of
Ring‐structured Shipboard Power System. The
goal of this research is to avoid the redundant
information accumulation (RIA) problem in a
multi‐agent system during the reconfiguration
process of SPS. The RIA problem is like a posi‐
tive feedbacks loop and makes the information
flow in the system unstable. Thus, the authors
use the spanning tree protocol to detect and
break the ring structure in an agent system.
Discussion
The literature review has revealed some impor‐
tant points which most of the reconfiguration
methodologies for terrestrial power system and
SPS are centralized solutions. Also, the simula‐
tion scenarios in these researches are not in real
time and cannot provide the bandwidth require‐
ment latency performance of the system. From
the analysis, the number of the researcher for
terrestrial power system is greater than ship‐
board power system (SPS). There are only a few
numbers of researchers who explore in the area
of shipboard power system. Most of the cases
are studied by the same researchers like Sarma,
Buttler and Sarasvarti. The number of researches
which focus on reconfiguration on fault location
for shipboard power system is very few as com‐
pared to the terrestrial power system.
From the literature, several approaches and
methods have been proposed in the reconfigura‐
tion process for SPS. They vary in term of func‐
tions and applications. Many classical techniques
have been employed for the solution of the re‐
configuration problem such as genetic algo‐
rithms (GA)[44,45], simulated annealing [12],
| MA
RIN
E F
RO
NT
IER
@ U
niKL
93 MIMET Technical Bulletin Volume 1 (2) 2010
particle swarm optimization (PSO)[13,18] tabu
search[21], Multi Agent System (MAS) [20‐22]
and etc. Generally, most of the techniques apply
sensitivity analysis and gradient based optimiza‐
tion algorithms by linearizing the objective func‐
tion and the system constraints around an oper‐
ating point [51]. The results reported in the lit‐
erature were promising and encouraging for fur‐
ther research in this direction [51].
More recently, a new evolutionary computation
technique, called Differential Evolutionary (DE)
algorithm has been proposed and introduced [8].
The algorithm is inspired by biological and socio‐
logical motivations and can take care of optimal‐
ity on rough, discontinuous and multi‐modal sur‐
faces. The DE has three main advantages: it can
find near optimal solution regardless the initial
parameter values, its convergence is fast and it
uses few number of control parameter. In addi‐
tion, DE is simple in coding, easy to use and it
can handle integer and discrete optimization.
The performance of DE algorithm was compared
to that of different heuristic techniques. It is
found that the convergence speed of DE is sig‐
nificantly better than GA[10]. Meanwhile in [12],
the performance of DE was compared to PSO.
The comparison was performed on suite of 34
widely used benchmark problems. It was found
that, DE is the best performing algorithm as it
finds the lowest fitness value for most of the
problems considered in that study. Also, DE is
robust: it is able to reproduce the same results
consistently over many trials, whereas the per‐
formance of PSO is far more dependent on the
randomized initialization of the individuals [12].
In addition, the DE algorithm has been used to
solve high dimensional function optimization (up
to 1000 dimensions) [12]. It is found that, it has
superior performance on a set of widely used
benchmark functions.
Conclusion
From the observation of the previous works,
most of the reconfiguration objectives in meth‐
odology are almost similar even the methods
utilized are different. Among the most familiar
objectives are minimizing the fuel cost, maximize
the load restored, improving the voltage profile
and enhancing power system voltage stability in
both normal and contingency conditions. The
results are compared to those reported in the
literature. Among the methods proposed, DE
algorithm seems to be promising approach for
engineering problem due to the great character‐
istics and its advantages. A novel DE‐based ap‐
proach is proposed to solve the reconfiguration
for service restoration problem in shipboard
power system in recent year. However, GA algo‐
rithm and MAS algorithm are still applicable in
the system.
Reference:
[1] N.D.R. Sarma, V.C.Prasad, K.S. Prakasa Rao, V. Sankar,
Oct 1994. “A New Network Reconfiguration Technique for
Service Restoration in Distribution Networks”, IEEE Trans.
on Power Delivery, Vol. 9, No. 4.
[2] S. Civanlar, J. J. Grainger, H. Yin, and S. S. H. Lee, Jul.
1998. “Distribution Feeder Reconfiguration for Loss Reduc‐
tion”, IEEE Transactions on Power Delivery, vol. 3, no. 3,
pp. 1217‐1223.
[3] H. P. Schmidt, N. Ida, N. Kagan, and J. C. Guaraldo, Aug.
2005. “Fast Reconfiguration of Distribution Systems Con‐
sidering Loss Minimization”, IEEE Transactions on Power
Systems, vol. 20, no. 3, pp. 1311‐1319.
[4] Y. M. Tzeng, Y. L. Ke, M. S. Kang, Apr. 2006. “Generic
Switching Actions of Distribution System Operation Using
Dynamic Programming Method”, IEEE Industrial and Com‐
mercial Power Systems Technical Conference.
[5] F. V. Gomes, S. Carneiro Jr., J. L. R. Pereira, M. P. Vina‐
gre, 4, Nov. 2006. “A New Distribution System Reconfigu‐
ration Approach Using Optimum Power Flow and Sensitiv‐
ity Analysis for Loss Reduction”, IEEE Transaction on Power
Systems, vol. 21, no. pp. 1616‐1623.
[6] Peponis, G. and Papadopoulos, M., Nov. 1995.
“Reconfiguration of Radial Distribution Networks: Appli‐

| MA
RIN
E F
RO
NT
IER
@ U
niKL
94 MIMET Technical Bulletin Volume 1 (2) 2010
cation of Heuristic Methods on Large‐Scale Networks”,
IEE Proceedings Generation,Transmission and Distribu‐
tion, Vol. 142, No. 6, pp. 631‐637.
[7] Jung, K.‐H.; Kim, H. and Ko, Y., Oct. 1993. “Network
Reconfiguration Algorithm for Automated Distribution
Systems based on Artificial Intelligence Approach”, IEEE
Transactions on Power Delivery, Vol. 8, No. 4, pp. 1933‐
1941.
[8] R.Storn, K. Price, 1995. “Differential evolution – a sim‐
ple and efficient adaptive scheme for global optimization
over continuous spaces” Technical report TR‐95‐012.ICSI.
[9] Wu, J.S.; Liu, C.C.; Liou, K.L. and Chou, R.F., Feb. 1997.
“A Petri Net Algorithm for Scheduling of Generic Restora‐
tion Actions”, IEEE Transactions on Power Systems, Vol.
12, No. 1, pp. 69‐76.
[10] D.Karaboga, S.Okdem, 2004. “A simple and global
optimization algorithm for engineering problems: differ‐
ential evolution algorithm”, Turkish Journal of Electronics
and Engineering.
[11] Jiang, D. and Baldick, R., May 1996. “Optimal Electric
Distribution System Switch Reconfiguration and Capacitor
Control”, IEEE Transactions on Power Systems, Vol. 11, No.
2, pp. 890‐897.
[12] Matos, M.A. and Melo, P., “Multiobjective Recon‐
figuration for Loss Reduction and
Service Restoration using Simulated Annealing”, Interna‐
tional Conference on Electric Power
Engineering, PowerTech Budapest 99, 1999, pp. 213
[13] J.Vesterstrom, R.Thomsen, 2004. “A comparative
study of differential evolution, particle swarm optimiza‐
tion, and evolutionary algorithms on numerical benchmark
problems, IEEE congress on Evolutionary computation, 980
– 987.
[14] H. Shu, X. Sun, 2005. “A Novel Approach to Distribu‐
tion Network Reconfiguration Considering the Priority of
Customers”, IEEE Transmission and Distribution Confer‐
ence and Exhibition: Asia and Pacific.
[15] L. C. Daniel, I. H. Khan, S. Ravichandran, Dec. 2005.
“Distribution Network Reconfiguration For Loss Reduction
Using Ant Colony System Algorithm”, IEEE INDICON Annual
Conference, pp. 619‐622.
[16] H. Salazar, R. Gallego, R. Romero, July 2006. “Artificial
Neural Networks and Clustering Techniques Applied in the
Reconfiguration of Distribution Systems”, IEEE Transac‐
tions on Power Delivery, vol. 21, no. 3.
[17] Hsu, Y.Y. and Huang, H.M., May 1995. “Distribution
System Service Restoration using the Artificial Neural
Network Approach and Pattern Recognition Method”, IEE
Proceedings of Generation, Transmission and Distribution,
Vol. 142, No. 3, pp. 251‐256
[18] C. R. Wang, Y. E. Zhang, Aug. 2006. “Distribution Net‐
work Reconfiguration Based on Modified Particle Swarm
Optimization Algorithm”, International Conference on Ma‐
chine Learning and Cybernetics, pp. 2076‐2080.
[19] X. Jin, J. Zhao, Y. Sun, K. Li, B. Zhang, Nov. 2004.
“Distribution Network Reconfiguration for Load Balancing
using Binary Particle Swarm Optimization”, International
Conference on Power System Technology, vol. 1, no. 1, pp.
507‐510.
[20] J. S. Heo and K. Y. Lee, Jul. 2006. “A Multi‐Agent System
‐Based Intelligent Identification System for Power Plant
Control and Fault‐Diagnosis”, IEEE Congress on Evolutionary
Computation, pp. 1544‐1551.
[21] M.A.Abido, 2002. “Optimal Power Flow using Tabu
Search Algorithm”, Electric power components & System,
469‐483.
[22]. T. Nagata, H. Watanabe, M. Ohno, H. Sasaki, Dec.
2000. “A multi‐agent approach to power system restora‐
tion”, International Conference on Power System Technol‐
ogy in 2000, vol. 3, pp. 1551‐1556.
[23] K. L. Butler, N. D. R. Sarma, Whitcomb, H. Do Carmo,
and H. Zhang, Apr. 1998. “Shipboard systems deploy auto‐
mated protection”, IEEE Computer Applications in Power,
vol. 11, no. 2, pp. 31‐36.
[24] Wang, G.S.; Wang, P.Y.; Song, Y.H. and Johns, A.T.,
1996. “Co‐ordinated System of Fuzzy Logic and Evolution‐
ary Programming based Network Reconfiguration for Loss
Reduction in Distribution Systems”, Proceedings of the
Fifth IEEE International Conference on Fuzzy Systems, Vol.
3, pp. 1838‐1844.
[25] Zhou, Q.; Shirmohammadi, D. and Liu, W.‐H.E., May
1997. “Distribution Feeder Reconfiguration for Service Res‐
toration and Load Balancing”, IEEE Transactions on Power
Systems, Vol. 12, No. 2, pp. 724‐729
[26] Kuo, H.C. and Hsu, Y.Y., Oct. 1993. “Distribution System
Load Estimation and Service Restoration Using a Fuzzy Set
Approach”, IEEE Transactions on PWRD, Vol. 8, No. 4, pp.
1950‐ 1957.

| MA
RIN
E F
RO
NT
IER
@ U
niKL
95 MI
[27] Butler, K. L, Sarma, N.D.R., Jan. 2000. “General Recon‐
figuration Methodology for AC Radial Shipboard Power
Systems”, IEEE Power Engineering Society Winter Meeting,
2000, vol. 2, pp.23‐27.
[28] Butler, K. L, Sarma, N.D.R., Apr. 1999. “A New Method
of Network Reconfiguration for Service Restoration in Ship‐
board Power Systems”, IEEE Transmission and Distribution
Conference, 1999, vol. 2, pp. 11‐16.
[29] Butler, K. L, Sarma, N.D.R., Nov. 2001. “Network Recon‐
figuration for Service Restoration in Shipboard Power Sys‐
tem Distribution Systems”, IEEE Transactions on Power
Systems, vol. 16, pp. 653‐661.
[30] S. K. Srivastava, H. Xiao, and K. L Butler‐Purry, Nov.
2002. “Multi‐Agent System for Automated Service Restora‐
tion of Shipboard Power Systems”, 15th International Con‐
ference on Computer Applications in Industry and Engineer‐
ing (CAINE‐2002), San Diego, CA, 7‐9.
[31] Butler, K. L, Sarma, N.D.R., Jul. 2003. “Intelligent Net‐
work Reconfiguration of Shipboard Power Systems”, IEEE
Power Engineering Society General Meeting, 2003, vol. 4, pp.
13‐17.
[32] S. Srivastava, K. L. Butler‐Burry, “Expert System
Method for Automatic Reconfiguration for Restoration of
Shipboard Power Systems”, IEE Proceedings on Generation,
Transmission and Distribution, vol. 153, no.3, May 2006, pp.
253‐260
[34] S. K. Srivastava, K. L. Butler, 2005. “A Pre‐hit Probabilis‐
tic Reconfiguration Methodology for Shipboard Power Sys‐
tems”, IEEE Electric Ship Technologies Symposium, pp. 99‐
104.
[35] J. M. Solanki, N. N. Schulz, W. Gao, Oct. 2005.
“Reconfiguration for Restoration of Power Systems Using a
Multi‐agent System”, Proceedings of the 37th Annual
North American Power Symposium, pp. 390‐395.
[36] A. Feliachi, K. Schoder, S. Ganesh, H. J. Lai, Jun. 2006.
“Distributed Control Agent Approach to Energy Manage‐
ment in Electric Shipboard Power System”, IEEE Power Engi‐
neering Society General Meeting.
[37] J. M. Solanki,N. N. Schulz, Nov. 2005. “Using Intelligent
Multi‐agent System for Shipboard Power Systems Recon‐
figuration”, Proceedings of the 13th International Intelligent
Systems Application to Power Systems.
[38] L. Sun and D. A. Cartes, 2004. “Reconfiguration of ship‐
board radial power system using intelligent agents,” Pro‐
ceedings. of Electrical Machine Technology Symposium.
[39] Yan Huang, Dec. 2005. “Fast Reconfiguration Algorithm
Development for Shipboard Power System”, Master of Sci‐
ence Thesis, Mississppi State University,
[40] Butler, K. L, Sarma, N.D.R., 2005 “Visualization for ship‐
board Power Systems”, Proceedings of the 36th Hawai
International Conference on system Sciences.
[41] R.Jayabalan and B. Fahimi., 2004. ”Naval Shipboard
Power System”, University of Texas at Arlington 416S.College
St. Arlington, Texas.
[42] Butler, K. L, Sarma, N.D.R., May 2004. “Self‐Healing
Reconfiguration for Restoration of Naval Shipboard Power
Systems”, IEEE Transactions on power systems, vol. 19, pp.
2.
[43] Kai Huang, David A. Cartes, S. K. Srivastava, 2005. “A
Novel Algorithm for Agent Based Reconfiguration of Ring‐
structured Shipboard Power System” IEEE member, Me‐
chanical Engineering Department, Centre of Advance Power
System Florida State University Tallahassee, FL, USA.
[44] Xiuxia Yang, Yi Zhang, 2005. “Intelligent Real‐time Fault
Restoration of the Large Shipboard Power System Based on
Genetic Algorithm”, International Journal of Information
Technology, Vol 11 No. 12.
[45] K. R. Padamati, Dec. 2007. “Reconfiguration of Ship‐
board Power System using a Genetic Algorithm”, Master of
Science Thesis, Mississppi State University.
[46] 2003. “1547 IEEE Standard for Interconnecting Distrib‐
uted Resources with Electric Power Systems”. The Institute
of Electrical and Electronics Engineers.
[47] B. R. Gautam, N. N. Schulz and A. K. Srivastava, 2007.
“Development of Survivability Index for Distribution System
Including Islanding”, Proceedings of the IEEE PES North
American Power Symposium, New Mexico, USA.
[48] E.J.William “ANN Relays Used to Determine Fault Loca‐
tions on Shipboard Electrical Distribution Systems’. Depart‐
ment of Electrical and Computer Engineering at the Univer‐
sity of Idaho, Moscow.
[49] T. Nagata, H. Fujita, H. Sasaki, Nov. 2005.
“Decentralized Approach to Normal Operations for Power
System Network”, Proceedings of the 13th International
Conference on Intelligent Systems Application to Power
Systems.
[50] Wu, J.S.; Tomsovic, K.L. and Chen, C.S., Oct. 1991. “A
Heuristic Search Approach to Feeder Switching Operations
for Overload, Faults, Unbalanced Flow and Maintenance”,
IEEE Transactions on Power Delivery, Vol. 6, No. 4, pp. 1579‐
1586.

| MA
RIN
E F
RO
NT
IER
@ U
niKL
96 MIMET Technical Bulletin Volume 1 (2) 2010
Feature Article 8
MOVING FORWARD TO BE A HIGH PERFORMANCE CULTURE ORGANIZATION:
A CASE OF UNIVERSITY KUALA LUMPUR
AZIZ ABDULLAH*
Department of Marine Construction and Maintenance Technology
Malaysian Institute of Marine Engineering Technology, Universiti Kuala Lumpur
Received: 6 September 2010; Revised: 28 September 2010; Accepted: 28 September 2010
ABSTRACT
This brief paper seeks to expound the move forward undertaken by University Kuala Lumpur (UniKL) to be a high perform‐
ance culture organization within a significant short period of time since its inception in early 2002. It further explores
organizational sharing of shared core values held by members that help distinguish it from other similar organizations
that offer a wide range of engineering technology courses in the higher education sector. It seeks to show that high per‐
formance culture of UniKL is made possible through a strong commitment by all members to excel in whatever they aspire
to achieve.
Keyword: Core Values, High Performance Culture, Commitment, Integrity, Innovation, Teamwork, Excellence
*Corresponding Author: Tel.: +605‐6909048
Email address: [email protected]
INTRODUCTION
University Kuala Lumpur (UniKL) was estab‐
lished in 2002 with the vision to make it a
leading technical entrepreneurial university in
Malaysia and the region. To realize this vision
it focuses on the ‘hands on’ that stresses
more on the application of knowledge. Its
mission, thus, is to produce enterprising
global technical entrepreneurs in specific
technical areas of specialization namely, Com‐
puter Engineering and Telecommunication,
Aviation, Automotive, Product Design and
Manufacturing, Chemical and Bioengineering
Technology, Medical Sciences and Marine
Engineering Technology.
UniKL is wholly owned by MARA under the
Ministry of Rural and Regional Development
and mandated by the government to upgrade
the status of technical education in Malaysia.
It has ten (10) branch campuses offering vari‐
ous diplomas, foundation, undergraduate
and postgraduate programmes, that focus on
providing strong technological knowledge
and entrepreneurial skills to fulfill the de‐
mands of industries. It practices the concept
of ‘One Campus, One Specialization’, eg
UniKL MIMET (Lumut branch campus) spe‐
cializes in marine engineering technology
with focus on ship design and construction,
while UniKL MIAT (Sepang branch campus)
specializes in aviation technology.
In ensuring the knowledge and capabilities of
its graduates meet local industry needs it ac‐
tively collaborates with various ministries and
agencies such as the Ministry of Entrepre‐
neur and Co‐operative Development (MECD);
marine, civil aviation and transport depart‐
ments, as well as other related local and in‐
ternational relevant organizations that deal,
among others, in aviation and maritime ac‐
tivities to help ensure standards of gradu‐
ates’ proficiency and skills match the indus‐
try’s specific needs.
| MA
RIN
E F
RO
NT
IER
@ U
niKL
97 MIMET Technical Bulletin Volume 1 (2) 2010
Positive transformation from its traditional or‐
ganizational culture towards a performance‐
driven culture helps UniKL’s success in remaining
competitive and excelling in the areas of techni‐
cal entrepreneurship. This success was mani‐
fested through the Ministry of Higher Educa‐
tion’s announcement on July 12, 2010 with re‐
spect to the rating for Institutions of Higher
Learning (Setara) that extolled UniKL as one of
the top 18 universities of Malaysia to attain the
‘Excellent’ rating. This high rating is attributable
to its entrepreneurial achievements driven by a
strong organizational performance–driven cul‐
ture. This culture refers to an accepted set of
organizational core values that serve as the foun‐
dation for the transformation process.
LITERATURE REVIEW
In transforming UniKL’s traditional culture to‐
wards a performance ‐ driven culture the need
to understand organizational structure and man‐
agement styles across cultures was further ex‐
plored (Dimitrov, 2005). Issues on culture, dif‐
ferences, motivation, and diversity were ex‐
plored in order to gain further understanding
with regards to similar issues at UniKL.
Exploring of culture dimensions (Hofstede,
1980a) that identified dimensions along which
organizational cultures differ, namely individual‐
ism, uncertainty avoidance, power distance and
masculinity help provide a glimpse of how those
dimensions fit into UniKL’s culture transforma‐
tional drive. It was observed that the cultural
dimensions as expounded by Hofstede were pre‐
sent within the organizational culture of UniKL
but they were within a positive context namely,
there is a high degree of collectivism, low uncer‐
tainty avoidance, low power distance and equal
balance of gender responsibility. These observa‐
tions would help inculcate stronger bonding
among organizational members of UniKL.
Examining the relationship between organiza‐
tional culture and transformational leadership
(Xenikou and Simosi, 2006) revealed that trans‐
formational leadership of organizational culture
influences organizational performance. The
group further explored the findings to help it
rationalize UniKL’s transformation from its tradi‐
tional culture towards one that extols a perform‐
ance driven organizational culture.
UniKL’s organizational culture is uniquely differ‐
ent from other institutions of higher learning
because it focuses more on application of knowl‐
edge (the hands‐on), without reducing the im‐
portance of knowledge acquisition itself. Thus,
further review (Rchildress and Esenn, 2006) on
findings concerning the combination of knowl‐
edge and skill that can be shared along the same
parallels with UniKL’s transformation towards a
performance‐driven culture was sought. It re‐
vealed, among other things, a finding that in or‐
der to achieve high performance, the secret lies
in developing personal core values and behaviors
that can help unlock the potential power of high‐
performance teams through individuals, which in
turn, can help produce winning organizations.
SIGNIFICANCE OF PAPER
This paper is significantly important be‐
cause it involves, among others, a specific study
on the organizational culture of a local university
that collectively bears part of a crucial common
responsibility with other universities in helping
to sustain Malaysia as a competitive nation in
producing qualified and capable professionals
through its training and educational system to
meet the increasing demands of Malaysia’s busi‐
ness and industrial growth. In exploring further
on how organizational culture may influence to
help achieve competitive advantage in an educa‐
tional organization that produces qualified and

| MA
RIN
E F
RO
NT
IER
@ U
niKL
98 MIMET Technical Bulletin Volume 1 (2) 2010
capable professionals to meet Malaysia’s indus‐
try needs, it has been decided that the focus
should be on a local technical university. Uni‐
versity Kuala Lumpur (UniKL), that was founded
through a national agenda to upgrade the status
of technical education in Malaysia to a level that
can help meet the needs of local industries and
sustain Malaysia’s economic growth towards a
developed‐nation status by year 2020 is consid‐
ered suitable for this study. A study of the or‐
ganizational culture of UniKL was chosen be‐
cause it is a good example of an educational or‐
ganization that has managed to go through an
organizational culture transformation from a
traditional to a performance‐driven culture. It is
therefore most appropriate that lessons learnt
from this transformation be shared for the bene‐
fit of everyone.
UNDERSTANDING OF HIGH PERFORMANCE
CULTURE (HPC)
Organizational Culture, in simple term, is the way
organizational members do things in their or‐
ganization. It is a system of shared meaning held
by members that distinguishes the organization
from other organizations (Robbins and Judge,
2009). Culture drives an organization, its actions
and results. It guides how employees think, act
and feel. It is the "operating system" of the
company, the organizational DNA. A perform‐
ance culture is based on discipline. This disci‐
pline promotes decisiveness and standards of
excellence and ensures direct accountability.
Such discipline is a main reason why commit‐
ments and expectations are always clear. As
such, high performance organization is one that
gives more focus and commitment to achieve
better results through a performance ‐ driven
culture.
MAKING HIGH PERFORMANCE CULTURE WORK
Four basic factors that contribute towards making
high performance culture works at UniKL have been
identified. Although these factors are commonly
found in most organizations, it is appropriate that
they are further elaborated for better understand‐
ing. The factors are as follows;
Openness and trust:
When there is openness and trust, frankness
prevails. Frankness is encouraged because it
implies a willingness to speak the unspeakable.
An environment of trust reduces defensiveness
when issues are raised. People react more hon‐
estly, ask questions more frequently, and are
more spontaneous with their comments and
ideas. The organization derives greater value
from its talent, and employees get to develop
their competence and contribute to success.
Managed differences:
Interpersonal differences result in conflicts. Con‐
flicts are addressed and unfulfilled commitments
are exposed. This results in better ability to
learn from the conflicts and take proactive action
to correct potential differences. Alternatives and
options are looked at without a pre‐determined
outcome when people become less presumptu‐
ous. People express real opinions and move be‐
yond the perceived "safe talk." Issues can then
be resolved more effectively.
Simplicity and focus:
Making things simple, less complex and being
more focused ensures precise focus is directed
towards implementation of objectives with clar‐
ity and precision that define what needs to be
accomplished and how to accomplish it. There is
a commitment at all levels to remove, not add,
complexity from the way of doing business. Be‐
ing result‐driven and having fun are not seen as

| MA
RIN
E F
RO
NT
IER
@ U
niKL
99 MIMET Technical Bulletin Volume 1 (2) 2010
mutually exclusive, but rather compatible and
dependent on one another. Changes occur, as do
positive results.
Playing to people's strengths:
Leaders know their people and effectively match
talent and task. Matching talent and task helps
reduce wasted talent. Overly talented people
may however complement those less talented to
help in the smooth running of departments
within UniKL. Leaders understand their people's
strengths and how best to elicit these strengths
from them. These organizational members focus
more on building synergies, learning and build‐
ing on strengths and opportunities that help re‐
duce internal weaknesses and neutralizing exter‐
nal threats rather than on merely closing gaps
that may only help address current problems,
not potential or future problems.
CORE VALUES AND STANDARDS BEHAVIOR OF
EXCELLENCE (SBE)
Core values are the primary or dominant
values that are accepted throughout the organi‐
zation. In striving for high performance culture,
UniKL had chosen a strong culture that has a
greater impact on employee behavior. It is ob‐
served that UniKL’s strong culture results in the
organization’s core values being both intensely
held and widely shared by organizational mem‐
bers. Consistently, a strong culture can have a
great influence on the behavior of its members
because its high degree of sharing and intensity
creates an internal climate of high behavioral
control.
The five (5) primary or dominant core values that
are intensely held and widely shared by organ‐
izational members throughout the organization
are identified as commitment, integrity, team‐
work, innovation and excellence. These core val‐
ues form the basis for the performance appraisal
of organizational members with respect to the
Key Performance Index (KPI) of UniKL. Under
each core value UniKL further itemizes three (3)
sub‐performance dimensions known as Stan‐
dards Behavior of Excellence (SBE) that provides
a measurement on a Scale of 1 to 5. Thus, the
performance of every organizational member of
UniKL can be measured and weaknesses cor‐
rected to ensure that UniKL’s quest for high per‐
formance culture organization can be achieved
and maintained by its organizational members.
The core values and their sub‐performance di‐
mensions are as listed below;
Commitment
Punctual.
Gets things done
Delivers results
Integrity
Honest.
Honors promises.
Complies with rules and regula‐
tions.
Teamwork
Cooperative.
Provides support.
Puts organization first
Innovation
Competitive.
Generates and shares ideas.
Makes things better
Excellence
Passionate.
Performs beyond expectation.
Strives to be the best

| MA
RIN
E F
RO
NT
IER
@ U
niKL
100 MIMET Technical Bulletin Volume 1 (2) 2010
Commitment
This core value refers to the willingness to do or
act beyond the normal call of duty. Objectives
are pursued until they are achieved. Organiza‐
tional members shall never give up and shall
overcome all obstacles or challenges to achieve
the organizational objectives. Nothing less than
success is acceptable. In other words, commit‐
ment is not just the willingness to work due to
some form of motivation but rather the willing‐
ness to do something for the love of doing it,
for the joy and fun of doing it. The reward or
satisfaction is when the job is completed with
the highest quality. Table 1 shows the meas‐
urements for ‘Commitment’.
Integrity
This is a trait in us which makes us completely trust‐
worthy in all situations, at all times and everywhere.
A person with integrity will not succumb to tempta‐
tions, carnal desires, self‐gratification or personal
ambition. He values his honour more than anything
else. Integrity is higher than ethics in that one may
be ethical in office or home but not so outside the
office or home. A person of integrity on the other
hand will be ethical all the time, in all situations and
everywhere. Table 2 shows the measurements for
‘Integrity’.
Table 1. Measurements for Commitment

| MA
RIN
E F
RO
NT
IER
@ U
niKL
101 MIMET Technical Bulletin Volume 1 (2) 2010
Table 2. Measurements for Integrity
Table 3. Measurements for Teamwork

| MA
RIN
E F
RO
NT
IER
@ U
niKL
102 MIMET Technical Bulletin Volume 1 (2) 2010
Teamwork
This trait refers to the “I” versus “We”. A team
player is selfless and is always concerned about
the whole team rather than his own self. In‐
deed, others are looked upon as either equals
or even more important than his own self. A
team player is usually more open‐minded,
ready to acknowledge his own weaknesses in
order to turn them into strengths. One who
cannot admit mistakes are either foolish, igno‐
rant, arrogant or egoistic. Such people cannot
be a team player, unless he or she is prepared
to change. Table 3 shows the measurements
for ‘Teamwork’.
Innovation
Innovative spirit refers to a readiness to look for
better ways of doing things. A better way could
be a faster way or a cheaper way or more effi‐
cient way of doing things. An innovative person
is never satisfied with the status quo. He is not
complacent and will always feel that the room
for improvement is the largest in the world. One
of Matsushita’s engineers told him that he could
no longer improve the design of the face of the
TV they were producing. Matsushita told him,
“how come the human face can have billions of
different features on much smaller size than the
face of a TV. I am sure you can create new de‐
signs given that the face of the TV is much bigger
than the face of a human being”. Table 4 below
shows the measurements for ‘Innovation’.
Table 4. Measurements for Innovation

| MA
RIN
E F
RO
NT
IER
@ U
niKL
103 MIMET Technical Bulletin Volume 1 (2) 2010
Table 5. Measurements for Excellence
Excellence
Excellence is the highest or the best quality one
can achieve. According to a Hadith, the Holy
Prophet was reported to have said, “Whatever
you do, you must do well”. In other words, a
Muslim cannot be doing anything that is not of
high quality. Unfortunately, most often the qual‐
ity of our work is always low. The Qur’an uses
the word “al‐ihsan” to mean excellence which is
higher than that required to be “just” or “fair”.
Indeed, justice or fairness is the minimum stan‐
dard that is required by the Qur’an. This is be‐
cause Islam does not allow us to be unfair or un‐
just. “To excel” means to extol the virtues of “al‐
ihsan” which in one definition “to do something
as though you see Allah, and since you cannot
see Allah, know that He sees you”. Table 5 be‐
low shows the measurements for ‘Excellence’.
SUCCESS FACTOR OF HIGH PERFORMANCE
CULTURE
Success of High Performance Culture is attrib‐
uted to the fact that when an organization has
clearly articulated strategic intent and core val‐
ues, along with disciplined people, it needs less
hierarchy. When organizational members have
disciplined thought, they need less bureaucracy.
When they have disciplined action and strong
leadership capability, they need less excessive
controls. This is especially true with a reduced
hierarchy within the organization of UniKL. The
top management is easily reachable by all organ‐
izational members, more so in this era of im‐
proved means of communication that brought
about advances in Information and Communica‐
tion technology.
Although the organizational structure of UniKL is
far from the flattened or contemporary structure
commonly found in typical dynamic organiza‐
tions, the structure itself creates less bureauc‐
racy that requires less excessive controls. It is
observed that the main factor contributing to‐
wards the success of UniKL becoming a high per

| MA
RIN
E F
RO
NT
IER
@ U
niKL
104 MIMET Technical Bulletin Volume 1 (2) 2010
Figure 1. UniKL transforming its traditional culture to a per‐formance‐driven culture
formance culture organization is the transforma‐
tion from its traditional culture towards a per‐
formance‐driven culture organization as charac‐
terized by the following Figure 1.
Looking at the attributes of a performance–
driven culture a critical point that can be ob‐
served is the focus on the external. Focusing on
the external includes external stakeholders such
as the customers as well as own family mem‐
bers. UniKL’s most important customer, namely
the students, is the actual drivers who drive or‐
ganizational members to become high perform‐
ance workers through the embrace of a positive
work culture.
The role of high‐performance workers would not
be sustainable without balancing work and fam‐
ily lives. Proper balancing of work and family
lives by organizational members that is well sup‐
ported by management helps sustain high per‐
formance‐driven culture in the organization. On
the contrary, traditional organizational work cul‐
ture would have focused on the internal, which
is directed more towards own self, while neglect‐
ing important external stakeholders.
Sourcing on issues concerning balancing work
and family (Peter Berg et al., 2003) revealed that
the culture of the workplace can have a signifi‐
cant impact on the ability of workers to balance
their work and family lives. The article further
examined the effects of high‐performance work
practices on workers’ views about whether the
company helps them balance work and family.
Based on previous surveys the article managed
to show that a high‐commitment work environ‐
ment characterized by high‐performance work
practices and intrinsically rewarding jobs posi‐
tively influences workers’ perceptions that the
organization is helping them achieve this work
and family balance. This finding is in line with
what exists at UniKL with regards to work life
balance, rewards and recognition.
Like in any other organizational culture, making
it succeed and maintaining its success would

| MA
RIN
E F
RO
NT
IER
@ U
niKL
105 MIMET Technical Bulletin Volume 1 (2) 2010
have become a major issue without manage‐
ment’s commitment with regards to rewards
and recognition, and UniKL is no exception. Con‐
versely, high performance culture comes with a
conviction that without management’s commit‐
ment with regards to rewards and recognition
UniKL may not be able to sustain its high per‐
formance‐driven culture.
Evaluation of organizational members’ core val‐
ues and overall performance measurements as
translated through the organizational KPI results
in the following rewards and benefits;
Annual Increment
Promotion
Recognition & Awards
Merit Increment
Merit Performance Reward/Bonus
Special Incentives , that include Umrah,
Vacation, Training
Retirement Benefits, that include golden
handshake, gratuity, higher employer
contribution of EPF
CONCLUSION
The change from UniKL’s traditional organ‐
izational culture to a performance ‐ driven
culture helps transform the university to be‐
come a high performance culture organiza‐
tion within a short period of time since in‐
ception in 2002.
Organizational sharing of shared values held
by members helps distinguish it from other
similar organizations that offer a wide range
of engineering technology courses in the
higher education sector.
High performance culture of UniKL is made
possible by a strong commitment by mem‐
bers to excel in whatever they aspire to
achieve. Strong commitment is reinforced
through effective and transparent evaluation
of organizational members’ core values and
overall performance measurements as trans‐
lated through annual organizational KPI that
results in fair rewards and benefits.
Within the context of UniKL’s organizational
members who extol the virtues of “al‐ihsan”
which means “to do something as though
you see Allah, and since you cannot see Al‐
lah, know that He sees you” it implies that
they are taking their commitment towards
their work to a spiritual level beyond nor‐
mal ethical dimensions.
REFERENCES
1. Berg, P., Kalleberg, A., and Appelbaum, E. (2003). Balanc‐
ing Work and Family: The Role of High‐Commitment Envi‐
ronments, Journal of Industrial Relations, Vol 42 Issue 2,
Blackwell Publishing Ltd.
2. Dimitrov, D. (2005). Cultural Differences for Organizational
Learning and Training. International Journal of the Diver‐
sity, Vol 5, No 4, Common Ground Publishing.
3. Hofstede, G (1980a). Culture’s Consequences. Beverly Hills,
CA: Sage
4. Robbins, S.P and Judge, T.A.(2009). Organizational Behav‐
ior. 13th Edition. Pearson Prentice Hall, USA.
5. Rchildress, J and Esenn, D. (2006). Secret of A Wining Cul‐
ture: Building High‐Performance Teams. Prentice Hall,
India.
6. Xenikou, A and Simosi, M, (2006). Organizational Culture
and Transformational Leadership as Predictors of Business
Unit Performance. Journal of Managerial Psychology, Vol
21 Issue 6, Emerald Group Publishing Ltd.

| MA
RIN
E F
RO
NT
IER
@ U
niKL
106 MIMET Technical Bulletin Volume 1 (2) 2010
Feature Article 9
TIME‐DOMAIN SIMULATION OF PNEUMATIC TRANSMISSION LINE
MOHD YUZRI MOHD YUSOP*
Deputy Dean Academic & Technology
Malaysian Institute of Marine Engineering Technology, Universiti Kuala Lumpur
Received: 28 October 2010; Revised: 2 November 2010; Accepted: 2 November 2010
ABSTRACT
Pneumatic equipment is widely used in industries for transferring energy or signal. Efficient modelling and simulation in
time domain for gas filled transmission line is of great importance that will provide the foundation for complex pneu‐
matic systems. The basic physical relationships in pneumatics are well established. In this paper, the finite difference
model combined with the lumped model is used to simulate the dynamics of air filled polyurethane pneumatic transmis‐
sion line in time domain. Compared with the experimental data, the simulation results show certain consistency, espe‐
cially in the response frequency. The radial expansion of the transmission line due to high working pressure is also con‐
sidered in the simulation algorithm.
Keywords: Pneumatic, transmission line, time‐domain simulation, finite‐difference, lumped modelling.
*Corresponding Author: Tel.: +605‐6909004
Email address: [email protected]
INTRODUCTION
In recent decade, there has been great devel‐
opments and interest in utilising pneumatic
system as a transmission medium. Advan‐
tages of pneumatic systems are that pneu‐
matic components are relatively cheap reli‐
able and can be easily and cheaply main‐
tained. It is also much cleaner than hydraulic
systems. However, the elastic nature of the
compressed air will pose difficulties in achiev‐
ing high accuracy control.
There are mature theories on steady state
analysis of pneumatic systems but the dy‐
namic analysis of pneumatic systems still re‐
quires further research. Manning (1968) used
the method of characteristics for pneumatic
line flows. The perfect gas state equation and
the isentropic relations, together with the
perfect gas relation for sonic velocity are used
to replace the density and pressure in the
continuity and momentum equations by using
the velocity terms. For simplicity, the heat
transfer, viscosity, three‐dimensional effects
and local changes in entropy across travelling
pressure waves are neglected. The determi‐
nation of characteristic lines is the key point
of this method. Separating the transmission
line into sections and treating each of them as
a volume in time‐domain simulation has pre‐
viously been investigated by Krus (1999) and
(Xue and Yusop, 2005).
Krus (1999) established the distributed model
according to the state principle of thermody‐
namics. (Xue and Yusop, 2005) meanwhile
utilise the equation of flow passing through
an orifice to calculate the mass flow rate.
Considering the transmission line as an elec‐
tric circuit, the time domain models were
established by Franco (2004). This paper in‐
vestigates the time domain simulation of a
pneumatic transmission line. The one‐
dimensional Navier‐Stokes equations are

| MA
RIN
E F
RO
NT
IER
@ U
niKL
107 MIMET Technical Bulletin Volume 1 (2) 2010
used to model the pneumatic transmission line
Tannehill et al. (1997), which combines the
lumped model (Xue and Yusop, 2005) to simulate
the air dynamics in the transmission line. The
experiment set‐up is shown in Figure 1.
Figure 1: Experiment Set‐Up
The valve is opened until the transmission line
reaches a steady state. The valve is then closed
and the system is allowed to reach a different
steady state. Pressure transducers are used to
record the pressure during this process. At the
same time a mass flow meter is used to record
the steady state mass flow rate. The simulation
is then performed to verify the transient proc‐
ess of the fluid in the transmission line after the
valve is fully closed.
The blocked transmission line is considered to
have N number of segments. Hence N numbers
of pressure transducers are needed to capture
the changes in air pressures along a 4m polyure‐
thane pneumatic transmission line which has an
internal diameter of 5.0mm and a thickness of
1.5mm. The change in system temperature is not
considered in this study and the temperature is
assumed to be constant at an ambient tempera‐
ture of 20°C. The change in transmission line di‐
ameter due to high system pressure is consid‐
ered during the simulation.
MATHEMATICAL MODEL
For a general three‐dimensional Navier‐Stokes
equation, the following assumptions are made:
1. The swirl of the working fluid in each cross sec‐
tion along the transmission line is omitted.
2. The change in fluid properties along the radial
direction is omitted.
3. Perfect gas is considered ‐
The equations are then reduced to one‐dimensional
format as follows:
For continuity equation:
(1)
and for momentum equation:
(2)
where ρ is the density, ux being the velocity
along the axial direction, p is the pressure, R is
the gas constant, T is the system temperature
and μ is the dynamic viscosity.
RTp
0
xuxt

| MA
RIN
E F
RO
NT
IER
@ U
niKL
108 MIMET Technical Bulletin Volume 1 (2) 2010
In order to update the boundary conditions, the
first and the last segments are considered as
two volumes (Xue and Yuzri, 2005).
The equation used to calculate the mass flow rate
passing through the orifice is used, which is:
(3)
where the mass flow parameter is as shown below
in equation (4).
(4)
is the mass flow rate passing the orifice
while Cd is the discharge coefficient. A is the ori‐
fice cross‐sectional area, Pu is the upstream stag‐
nation pressure (absolute), Tu is the upstream
stagnation temperature (absolute), γ is the spe‐
cific heat ratio and Pvc is the static pressure at the
vena contracta or throat.
Equation 4 is only valid when
Otherwise the flow is considered to be choked and
Cm will be constant at a value of 0.0405. Note that
the ratio of specific heats g for air is 1.4.
EXPERIMENT AND SIMULATION
The transmission line diameter is first calibrated
by experiment to determine the influence of the
system pressure onto changes in its radial dimen‐
sion. Highly incompressible liquid (water) is in‐
jected into a polyurethane transmission line
which is blocked at one end. Different pressures
are then applied to the other end. By recording
changes in the liquid height, the transmission line
diameter changes can then be determined. Ex‐
periment results are listed in Table 1.
Table 1: Transmission Line Diameter Calibrations
It is assumed that the high pressure applied only ex‐
pands the transmission line along the radial direction
and do not influence the dimension along the axial
direction. The initial volume occupied by the water is
m3. Based on the assumption above,
the relationship between the applied pressure and
the internal diameter of the transmission line is as
shown in Figure 2.
uumdd TPACCM
12
1
2
u
vc
u
vcm P
P
P
P
RC
Pressure [bar] Liquid Height [mm]
0 95.82
1 94.46
2 93.72
3 92.32
4 91.59
5 90.85
6 89.27
7 88.37
61088.1
dM
528.0s
vcP
P

| MA
RIN
E F
RO
NT
IER
@ U
niKL
109 MIMET Technical Bulletin Volume 1 (2) 2010
Figure 2: Transmission Line Diameter Calibrations
The relationship between the transmission line
di‐ ameter and the
applied pres‐
sure is as shown in equation (5).
(5)
The valve is first opened until the transmission
line reaches a steady state. N pressure trans‐
ducers are used to record pressures corre‐
sponding to the N segments, and a mass flow
meter is used to record air mass flow rate under
the steady state condition. All these recorded
values are then used as the system initial condi‐
tions for the simulation. The transient pressure
values recorded by the pressure transducers at
different positions along the transmission line
when the valve is closed are as shown in Figure
3.
005.0103 5 pd
Figure 3: Experiment Results for Blocked Transmission
Line (PT=Measured Pressure by Pressure Transducer)
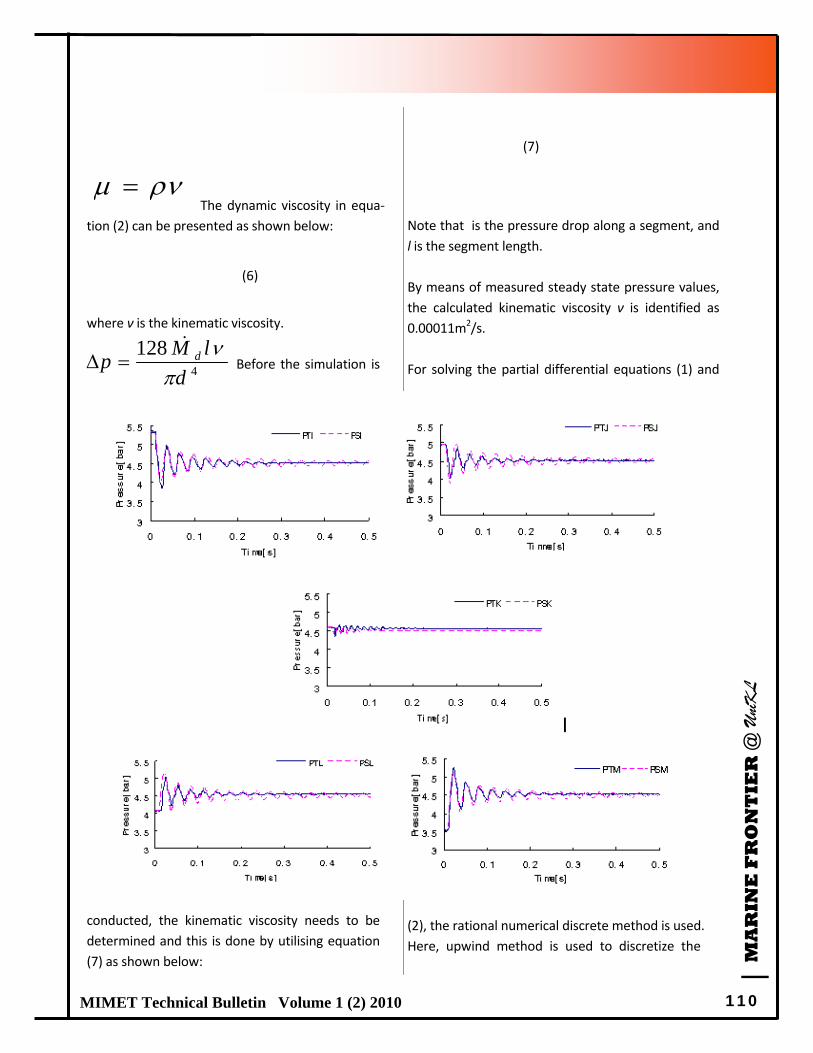
| MA
RIN
E F
RO
NT
IER
@ U
niKL
110 MIMET Technical Bulletin Volume 1 (2) 2010
The dynamic viscosity in equa‐
tion (2) can be presented as shown below:
(6)
where ν is the kinematic viscosity.
Before the simulation is
conducted, the kinematic viscosity needs to be
determined and this is done by utilising equation
(7) as shown below:
(7)
Note that is the pressure drop along a segment, and
l is the segment length.
By means of measured steady state pressure values,
the calculated kinematic viscosity ν is identified as
0.00011m2/s.
For solving the partial differential equations (1) and
(2), the rational numerical discrete method is used.
Here, upwind method is used to discretize the
4
128
d
lMp d
p

| MA
RIN
E F
RO
NT
IER
@ U
niKL
111 MIMET Technical Bulletin Volume 1 (2) 2010
PDE equations (1) and (2). Comparisons between
simulation and experiment results are as shown in
Figure 4. Figure 4: Comparisons between Simulation and Experiment
Results (PS=Simulated Pressure)
DISCUSSION
The transmission line diameter calibration experi‐
ment shows that the relationship between the di‐
ameter and the exerted pressure is close to linear.
This is then applied to the simulation algorithm to
investigate the influence of the working pressure
on the transmission line diameter expansion as
shown in Figure 2.
Figure 3 shows the pressure response in the
transmission line after the valve is closed. When
the valve is fully closed, the air will continue to
flow downstream of the transmission line due to
the presence of higher pressure and momentum
at the upstream of the transmission line. There‐
fore the pressure downstream of the transmis‐
sion line will continue to increase until it reaches
a peak value at which the velocity downstream is
close to zero. The fluid then starts to flow in the
opposite direction in the transmission line since
the pressure downstream is larger than the pres‐
sure upstream. When the upstream pressure
reaches new peak value, the fluid flows down‐
stream again. This process repeats itself though
the peak pressure values reached as the time
progresses at different transmission line posi‐
tions will gradually decreases due to the viscosity
effect imposed on the travelling air. Finally, the
system reaches a new steady state in which all
the pressures along the transmission line arrived
at a same constant value.
A combined transmission line model is proposed
in this paper. The simulation is based on the com‐
bination of finite difference model McCloy (1980)
and lumped model (Xue and Yusop, 2005). The
lumped model is used to update the boundary
conditions, which is then applied to the first and
the last segments. The parameters for the other
segments are updated by means of finite differ‐
ence model in the simulation algorithm.
Simulation results show good consistency com‐
pared with the experiment data especially in the
pressure frequency response. The simulation re‐
sults also show that the air in the transmission
line took a longer time to reach a new steady
state compared with the experiment results. This
is due to the fact that perfect gas is assumed. Per‐
fect gas assumes that the force between the at‐
oms or molecules in the gas is negligible. The oc‐
cupied volume of the atoms or molecules in the
gas is also omitted under perfect gas conditions.
On the other hand, under real gas conditions, due
to the existence of the aforementioned factors,
the influence of friction on the working fluid is
larger. Furthermore when the atoms or molecules
in the air hit the blocked end of the transmission
line with a certain momentum, some of these at‐
oms or molecules are bounced back from the
blocked end of the transmission line which is in
the opposite direction of the air flow. The direct
influence of this is a reduction in the total air en‐
ergy and this result in an earlier dissipation of the
pressure wave in the captured data compared to
the simulated results.
CONCLUSION
A time domain model describing the dynamics of air
in a pneumatic transmission line is presented by con‐
sidering changes in air density, pressure and mass
flow rate. The combined models are proposed to
simulate the dynamics of trapped air in a blocked
transmission line. In order to update the boundary
conditions, the first and the last segments are consid‐
ered as two lumped volumes and these are then con‐
nected to the transmission line segments using an
orifice model. The transmission line segments are
expressed by means of finite difference model. The
effectiveness of the proposed model is depicted

| MA
RIN
E F
RO
NT
IER
@ U
niKL
112 MIMET Technical Bulletin Volume 1 (2) 2010
through comparisons of simulated pressure re‐
sponses against pressures measured by practical ex‐
periments. The simulated results can be concluded to
be successful since it does match well with the cap‐
tured experimental data though the simulated results
show longer system transient state.
REFERENCES
1. Franco, W. and Sorli, M. (2004). Time‐domain Models for
Pneumatic Transmission Lines. Power Transmission and
Motion Control (PTMC 2004). 257‐269.
2. Krus, P. (1999). Distributed Modelling for Simulation
of Pneumatic Systems. 4th JHPS International Sympo‐
sium. 443‐452.
3. Manning, J.R. (1968). Computerized Method of Char‐
acteristics Calculations for Unsteady Pneumatic Line
Flows. Transactions of the ASME, Journal of Basic
Engineering. 231‐240.
4. McCloy, D. (1980). Control of Fluid Power: Analysis
and Design. 2nd Edition, John Wiley & Sons.
5. Tannehill, J.C., Anderson, D.A. and Pletcher, R.H.
(1997). Computational Fluid Mechanics and Heat
Transfer. 2nd Edition. Taylor & Francis.
6. Xue Y. and Yusop M.Y.M. (2005). Time Domain Simula‐
tion of Air Transmission Lines. 8th International Sympo‐
sium on Fluid Control, Measurement and Visualization
(FLUCOME). Paper 277.

| MA
RIN
E F
RO
NT
IER
@ U
niKL
113 MIMET Technical Bulletin Volume 1 (2) 2010
Feature Article 10
REQUIREMENTS OF INTERNATIONAL MARITIME LAWS IN THE DESIGN AND CON‐STRUCTION OF A CHEMICAL TANKER
AMINUDDIN MD AROF*, FIRDAUS TASNIM CHE PA, ISMAIL FAHMI JAMHURI, A’DLIN RAJA YAHYA
Department of Marine & Design Technology
BET Naval Architecture & Shipbuilding
Malaysian Institute of Marine Engineering Technology, Universiti Kuala Lumpur
Received: 28 October 2010; Revised: 2 November 2010; Accepted: 2 November 2010
ABSTRACT
A Chemical tanker is a ship that carries chemical products with a high degree of purity and corrosiveness. These types of
cargoes are different from other cargoes in that they have a lot more potential for danger to men and the environment.
Such dangers could include flammability, toxicity and corrosive properties of extreme nature. In order to reduce the risk
of accident, adherence to safety regulations and practices is extremely important. In ensuring safety of chemical tankers
at sea, ship builders and ship owners need to observe all legal requirements through various international conventions
and codes that have been introduced by IMO to enable their ships meet the qualification for the award of a Certificate of
Class for Hull and Machinery issued by recognized Classification Societies on behalf of their flag states.
Keywords: IMO, SOLAS, MARPOL
*Corresponding Author: Tel.: +605‐6909021
Email address: [email protected]
INTRODUCTION
The industrial use of chemical grew
massively as the wings of globalisation and
trade spread over the past several decades.
Since the sea surface is the only avenue for
transporting goods in bulk quantities across
the oceans, the trade of chemicals via the wa‐
ter‐route is of vital importance for the indus‐
try and global trade. Apart from the different
types of ships, there are ships which special‐
ize in carrying dangerous chemicals and they
are commonly known as chemical tankers. A
Chemical tanker is a ship that carries chemical
products with a high degree of purity and cor‐
rosiveness. It is generally smaller than prod‐
uct carriers and has many compartments
within the cargo tank to enable the simulta‐
neous transportation of various chemical
products. Each cargo tank is composed of
separate pipelines to prevent pollution of the
cargo. These types of cargoes are different
from other cargoes in that they have a lot
more potential for danger to men and the
environment as compared to other cargoes.
Such dangers could include flammability, tox‐
icity and corrosive properties of extreme na‐
ture. Hence, in order to reduce the risk of ac‐
cident, a strict adherence to safety regula‐
tions and practices is extremely important.
Safety is the state or condition of being
protected against physical, social, psychological,
technical, economical or other types of conse‐
quences of failure, damage, error or harm that
may either affect human, things or the environ‐
ment. Excellent safety of the ship, her crew and
the marine environment starts with a good
ship’s structural design. Different ships are sub‐
jected to different risks and for a chemical
tanker, the risk is very high.

| MA
RIN
E F
RO
NT
IER
@ U
niKL
114 MIMET Technical Bulletin Volume 1 (2) 2010
LEGAL REQUIREMENTS AND CONSTRAINTS
In ensuring safety of chemical tankers at
sea, ship builders and ship owners need to ob‐
serve all legal requirements imposed through
various conventions and codes by the Interna‐
tional Maritime Organization (IMO). This will en‐
able their ships meet the qualification for the
award of a certificate of Class for Hull and Ma‐
chinery issued by designated classification socie‐
ties. The IMO divides chemical tanker into three
(3) groups namely vessels designed to carry the
most hazardous cargo; vessels designed to carry
less hazardous cargo than the first; and the ves‐
sels designed to carry the least hazardous chemi‐
cals (ICS, 2002). Among IMO’s conventions, the
International Convention for the Prevention of
Pollution from Ships, 1973 (MARPOL) and the
International Convention for the Safety of Life at
Sea, 1974 (SOLAS) are the most important trea‐
ties implemented to ensure the safety of chemi‐
cal tankers.
The main criterion for the safety of a
chemical tanker is the ship needs to be con‐
structed in double hull. MARPOL was amended
in 1992 to make mandatory for tankers of 5,000
dead‐weight‐tonnes (DWT) and above to be fit‐
ted with a double hull after July 1993. Double
hull is a hull design and construction method
where the bottom and sides of the ship have two
complete layers of watertight hull surface. The
outer layer acts as the normal hull of the ship,
and the inner hull forms a redundant barrier to
seawater in case the outer hull is damaged.
Figure 1: Different types of Hull
The space in between the two hull layers is
often used as storage tanks for fuel or ballast water.
Double hulls are a more extensive safety measure
than double bottoms, which have two hull layers
only at the bottom of the ship and not the sides. In
low energy casualties, double hulls can prevent
flooding beyond the penetrated compartment.
MARPOL Annex 1 Chapter 4 Regulation 14 had in‐
troduced the requirement to have segregated bal‐
last tanks for all tankers. This means that the ballast
tanks which are empty when carrying the cargo and
only loaded with ballast water for the return leg
must be positioned where the impact of collision
likely to be the greatest. The ship should also be
included with cofferdam type segregation or bulk‐
head of the sandwich type. The sandwich type bulk‐
head between two adjoining tanks must be at least
760 mm but are usually broader to make it practical
for human entry.
Class 1 vessels need to be constructed with
the emphasis on the prevention of cargo escaping
as a result of collision or stranding. The construction
specification requires all cargo tanks to be shielded
by ballast tank, double bottom and cofferdams. As a
result, actual cargo tank bulkheads are protected by
void spaces or other tanks. Stability is also taken
into account as a result of flooding of one or more
wing tanks or void spaces as a result or standing.
Vessels in Class 2 must be designed along similar
lines, but the criterion is less stringent in some ar‐
eas. Vessels in Class 3 are judged to carry cargo
which is less hazardous and are currently not re‐
quired to have an inner and outer skin as in Class 1
and 2. The main restriction
appears to be the limited
dimensions of any one cargo
tank. New vessels over 5000
DWT are required to have
double hulls.

| MA
RIN
E F
RO
NT
IER
@ U
niKL
115 MIMET Technical Bulletin Volume 1 (2) 2010
Since chemical products have high pu‐
rity and corrosiveness, corrosion protection and
prevention is very important. The popular types
of chemical tanker plate material is made from
special types of stainless steel with a high resis‐
tant to corrosion from acid. Stainless steel used
for bulkheads can be solid stainless steel or mild
steel clad with stainless steel. Rubber is some‐
times used to line tanks carrying products
mainly acids, which are unsuitable for use with
stainless steel or coating. Zinc silicate is fre‐
quently used in tanks designed to carry alcohol
as well as some types of solvents and other
chemicals. It is necessary to inspect zinc coated
bulkhead after they have been dried to ensure
the coating has not been softened or otherwise
damaged.
The requirement for coating application
is under MARPOL Annex II (Regulations for the
Control of Pollution by Noxious Liquid Sub‐
stances). Before coating application, the steel
temperature and relative air humidity in the tank
are two basic factors to observe in ensuring the
correct coating application. The application of
coating starts from the bottom of the tank to the
ceiling, because during application the evapo‐
rated solvents may flow to the bottom of the
tank. Hence, the air in the tank is both renewed
and dehumidified to keep clean atmosphere and
steady temperature and humidity conditions.
Figure 2: Application of coating
The sequence of coating application also plays an
important rule. If we consider a coating system of
two parts (2 coatings), then we should apply the
first coating to all tank surfaces for a specific dry
film thickness. At this stage, as we approach the
ceiling we must cover the tank bottom to avoid any
overspray.
Figure 3: Coating application sequence
Some cargoes are required to be carried at
certain temperatures. For that reason, heating coils
are installed in the cargo tanks to keep the cargo at
the required temperature. The heating substance is
oil or water coming from a heat exchanger, so en‐
able the cargo to be carried at a desired range of
temperatures (ExxonMobil, 2002). Chemical tankers
must have a system for tank heating in order to
maintain the viscosity of certain cargoes. Typically
this system consists of a boiler which pumps pres‐
surized steam through so‐called “heating coils”
made from stainless steel pipes in the cargo tanks,
thus transferring heat into the cargo, which circu‐
lates in the tank by convection.
In SOLAS Chapter II‐2, Regulation 4 Para‐
graph 5.5, tankers are also required to be fitted with
an inert gas system. With the inert gas system, the
protection against a tank explosion is achieved by
keeping the oxygen content low. It will reduce the
hydrocarbon gas concentration of tank atmosphere
to a safe proportion. The problem is that impurities
such as carbon and moisture are normally present
in flue gases and it is difficult to use a conventional
inert gas system with some chemical.

| MA
RIN
E F
RO
NT
IER
@ U
niKL
116 MIMET Technical Bulletin Volume 1 (2) 2010
Figure 4 : Typical arrangement of Inert Gas System
Besides that, IMO also introduced emer‐
gency towing arrangement to enable vessels to
be operated and controlled in cases of mechani‐
cal failures. Under SOLAS Chapter II‐1, Regulation
3‐4, as for any other ships, navigational equip‐
ment of tankers needs to be duplicated. All new
tankers of 20,000 DWT and above have to be
fitted with an emergency towing arrangement
fitted at both end of the ships.
Figure 5: Emergency towing arrangements
In ensuring the safety of personnel and
navigation, personal life saving appliances and radio
communication system are very important. Under
SOLAS Chapter 3 Part B, there is a requirement for
at least one lifebuoy on each side of the ship to be
fitted with a buoyant lifeline equal in length to not
less than twice the height at which it is stowed
above the waterline at any time or 30 meters,
whichever is greater. Not less than half of the life‐
buoys must have self‐igniting
lights, not less than two of which
must be provided with self activat‐
ing smoke signals which must be
capable of quick release from navi‐
gating bridge. Besides that, a suf‐
ficient number of survival craft
shall be carried for persons on‐
board and must be placed at areas
that are readily accessible. En‐
closed lifeboat must be provided
and for all chemical tanker. Life‐
boats must be equipped with self‐
contained air support system (if
the cargo emits toxic gases). In addition, these life‐
boats must afford protection against fire for at least
eight minutes (where the cargo is flammable).

| MA
RIN
E F
RO
NT
IER
@ U
niKL
117 MIMET Technical Bulletin Volume 1 (2) 2010
Figure 6: Enclosed life boat with self contained air support system
For safety of navigation, installation of
radio communication equipment is important.
At least three (3) two‐way VHF radiotelephone
apparatus shall be provided on every cargo ship
of 500 gross tonnage and upwards. Furthermore,
ships also need to be fitted with a Global Mari‐
time Distress and Safety System (GMDSS) for the
purpose of providing a maritime mobile service
identity. In this case, INMARSAT identity and
ship’s serial number may be transmitted by the
ship’s equipment and used to identify the ship in
emergency situation (SOLAS Regulation 2).
Figure 7: Layout cargo pump‐room with carbon dioxide fire‐extinguishing system
A chemical tanker is a vessel that has high
risk of explosion. Chemical tanker Kemal Ka suffered
explosion on board on 13th June 2010, 13 nautical
miles off Almedina, near Chipiona and on 29th Feb‐
ruary 2004, a chemical tanker The Bow Mariner
sinks after an explosion off the coast of Virginia. As
a result, under SOLAS Chapter II‐2 Regulation 7, fire
detection and alarm system must be installed in the
tanker especially at places periodically unattended
such as machinery spaces, the main propulsion and
associated machinery. Smoke detector should be
fitted at all stairways, corridors and escape routes.
Under regulation 10, ships constructed on or after
1st July 2002, are required to be fitted with suitable
fire fighting systems that can be operated from a
readily accessible position outside the pump‐room.
Cargo pump‐rooms shall be provided with a system
suitable for machinery spaces for ships in category
A. In this case, a carbon dioxide (CO2) fire‐
extinguishing system complying with the provisions
of the Fire Safety Systems Code, such as the alarms
giving audible warning of the release of fire extin‐
guishing medium shall be safe for use in a flamma‐
ble cargo vapour/air mixture. A notice shall be ex‐
hibited at the controls stating that, due to the elec‐
trostatic ignition hazard, the system is to be used
only for fire extinguishing and not for inerting pur‐
poses. The extin‐
guishing method of
CO2 gas is based on
the reduction of the
oxygen level in air to
a certain level of CO2
concentration. Com‐
bustion cannot be
sustained in an at‐
mosphere containing
a minimum of 34% of
CO2.

| MA
RIN
E F
RO
NT
IER
@ U
niKL
118 MIMET Technical Bulletin Volume 1 (2) 2010
When transporting a bulk cargo which is
liable to emit a toxic or flammable gas, or cause
oxygen depletion in the cargo space, an appro‐
priate instrument for measuring the concentra‐
tion of gas or oxygen in the air shall be provided
together with detailed instructions for its use
(SOLAS Chapter 6, Regulation 3). In Chapter VII of
SOLAS (Carriage of Dangerous Goods) the chemi‐
cal tanker which carries dangerous and hazard‐
ous cargoes are required to carry an appropriate
document as evidence of such compliance. The
document of compliance is normally issued by a
classification society at the same time as the
safety equipment certificate is issued.
CONCLUSION
In a nutshell, each class of vessel needs
special requirements due to its unique opera‐
tion. All safety requirements are very important
in the process of designing any ship. This is to
ensure the vessels to be in seaworthy condition
and safe for navigation as well as to avoid any
threat either to the crew or goods being carried.
The rules and regulations are made after de‐
tailed examinations on the causes of previous
accidents at sea. However, these conventions
are soft laws and only impose minimum require‐
ments. Flag states, port states, ship classification
societies and other law enforcement bodies will
then enforce their regulations after adopting the
conventions into their own laws or standards.
Shipowners will strive to minimize cost and maxi‐
mise profit in the operation of chemical tankers
and other vessels. The various legal require‐
ments imposed by IMO will inherently result in
higher acquisition and operating costs. Neverthe‐
less, the safety assurance provided by the imple‐
mentation of the various provisions from the
IMO conventions should never be underesti‐
mated.
REFERENCES
1. Baptist, C. (2000), Tanker Handbook for Deck Officers,
8th Edition, Brown, Son & Ferguson Ltd, Glasgow.
2. ExxonMobil (2002), Marine Environmental & Safety
Criteria for Industry Vessels in Exxonmobil Service,
Exxonmobil.
3. IMO (2004), SOLAS, Consolidated Edition, IMO
Publication, London.
4. IMO (2006), MARPOL, Consolidated Edition,
IMOPublication, London.
5. ICS (2002), Tanker Safety Guide Chemicals, Third
Edition, International Chamber of Shipping, London.

| MA
RIN
E F
RO
NT
IER
@ U
niKL
119 MIMET Technical Bulletin Volume 1 (2) 2010
UNIKL MIMET AND ALAM SHIP MANAGEMENT SDN BHD (ASMSB)
RESEARCH COLLABORATION
STEERING COMMITTEE MEETING 21ST JUNE 2010
UniKL MIMET and Alam Ship Management Sdn Bhd (ASMSB) Collaboration lead to the first
Steering Committee Meeting that was attended by nine UniKL MIMET representatives and
seven from ASMSB. Two project titles were proposed: Ship Control and Monitoring System
(SCAMS) and Testing and Commissioning (T&C) System. Project Technical Team was
formed and the MOU contents were reviewed during the meeting. Progress follow up was
done through the Project Meeting on the 1st August 2010 whereby UniKL MIMET validated
the SCAMS system and on the 18th August 2010 UniKL MIMET reviewed the documents
provided by ASMSB.
R & D ACTIVITIES

| MA
RIN
E F
RO
NT
IER
@ U
niKL
120 MIMET Technical Bulletin Volume 1 (2) 2010
INDUSTRIAL VISIT
R & D ACTIVITIES
PLASTIC TECHNOLOGY CENTER,
SIRIM HEADQUARTERS, S.ALAM 10TH AUGUST 2010
Industrial visit to Plastic Technology Centre, SIRIM Head Quarters in Shah Alam on the 10th August
2010 is to discuss the possibilities of utilizing Rice Husk Bio‐Composite material as an alternative
to natural wood for marine application. UniKL MIMET delegations consist of Deputy Dean, Dr.
Mohd. YuzriMohdYusop, R&D Coordinator, Mrs. NurshahnawalYaacob and three other lecturers,
Mr. Asmawi Abdul Malik, Mr. ZulzamriSalleh and Mrs. SyajaratunnurYaakup given the opportunity
to observe the production of the Rice Husk Bio‐Composite material and made a conclusion on ex‐
ploring further of the bio panel (in terms of capability and durability) in marine application espe‐
cially on wooden boat building and composite boat building.

| MA
RIN
E F
RO
NT
IER
@ U
niKL
121 MIMET Technical Bulletin Volume 1 (2) 2010
CALL FOR PAPERS
To inculcate the research culture amongst academics, Universiti Kuala Lumpur Malaysian Institute of Marine Engineer-ing Technology (UniKL MIMET) is publishing the Marine Frontier@UniKL Research Bulletin. For a start, the bulletin will be published four times a year, in January, April, July and October. Original research papers, which have not been pub-lished or currently being considered for publication elsewhere, will be considered.
Accepted Types of Research
The papers accepted for the bulletins must be based on any of the following types of research:
Basic research (pure basic research and strategic basic research)
Applied research
Experimental development
Critical review
Pure basic research is experimental and theoretical work undertaken to acquire new knowledge without looking for long-terms benefits other than advancement of knowledge.
Strategic basic research is experimental and theoretical work undertaken to acquire new knowledge directed into specified broad areas in the expectation of useful discoveries. It provides the broad base of knowledge necessary for the solution of recognised practical problems.
Applied research is original work undertaken primarily to acquire new knowledge with a specific application in view. It is undertaken either to determine possible use for the findings of basic research or to determine new ways of achieving some specific and predetermined objectives.
Experimental development is systematic work, using existing knowledge gained from research or practical experience that is directed to producing new materials, products or devices, to installing new processes, systems and services, or to improving substantially those already produced or installed.
Critical review is a comprehensive preview and critical analysis of existing literature. It must also propose a unique lens, framework or model that helps understand specific body of knowledge or address specific research issues.
Condition of Acceptance
The editorial board considers all papers on the condition that:
They are original
The authors hold the property or copyright of the paper
They have not been published already
They are not under consideration for publication elsewhere, nor in press elsewhere
They use non-discriminatory language
The use of proper English (except for manuscripts written in Bahasa Melayu-applicable for selective only)
All papers must be typed on A4 size page using Microsoft Words. The complete paper must be approximately 3, 000 to 7, 000 words long (excluding references and appendixes). The format is described in detail in the next section.
All papers are reviewed by the editorial board and evaluated according to:
Originality
Significance in contributing new knowledge
Technical adequacy
Appropriateness for the bulletin
Clarity of presentation
All papers will be directed to the appropriate team and/or track. The papers will be reviewed by reviewer(s) and/or editor. All review comments and suggestions should be addressed in the final submission if the paper is accepted for publication, copyright is transferred to the bulletin.
Please submit your paper directly to the Chief Editor- [email protected] or the Executive Editor- [email protected] for publication in the next issue of the Marine Frontier@UniKL.