Embed Size (px)
Citation preview

8/7/2019 Marinho&Stuermer - 2000
http://slidepdf.com/reader/full/marinhostuermer-2000 1/17
Advances in Unsaturated Geotechnics - Geotechnical Special Publication - 99 - ASCE - pp. 125-141.
-1 Marinho & Stuermer
The Influence of the compaction energy on the SWCC of a residual soil
Fernando A. M. Marinho 1 and Mônica M. Stuermer 2
Abstract
The proliferation of the use of the soil water characteristic curve (SWCC) toobtain the unsaturated soil parameters is unavoidable and in some cases desired.However, the complex interrelation between soil water content and soil water suctionmakes the adequate indirect determination of the unsaturated soil parameters adifficult task. There are many aspect to be considered when using SWCC forpredicting mechanical or hydraulic behaviour of the soil. The paper describes a studyinvolving a residual soil of Gneiss, compacted using three different compactionenergies. Soil water characteristic curves (SWCC) are obtained with volumemeasurement during the drying process and the soil suction was obtained using thefilter paper method. The filter paper was placed in direct contact with the soil sample.Discussions on the relationship between the compaction energy, SWCC shape and thedrying behaviour of the soil samples are given.
Introduction
The soil water characteristic curves (SWCC) has been used to obtainunsaturated soil parameters (mechanical and hydraulic) via some model. The use of models to obtain the SWCC itself is also common practice. Any model for obtainingthe SWCC should consider the effect of the soil type and its stress history. The soiltype may be considered explicitly (a soil specific model) or implicitly (determiningfew experimental points). Generally speaking the models of the first type do notconsider the structure of the soil or may consider it through an empirical parameter
1 University of São Paulo (USP) - Brazil - [email protected] University Mackenzie - Brazil - Former MSc Student at USP - [email protected]

8/7/2019 Marinho&Stuermer - 2000
http://slidepdf.com/reader/full/marinhostuermer-2000 2/17
Advances in Unsaturated Geotechnics - Geotechnical Special Publication - 99 - ASCE - pp. 125-141.
-2 Marinho & Stuermer
basically related to the density of the sample. The second type of model may have thestructure indirectly considered, since it uses some actual measurements. In addition tothis particular aspect of the use of the SWCC for predicting the unsaturated soil
parameters there is the effect of the stress history. In natural soils this may be areflection of the overconsolidation under saturated state or due to a process of dissecation or yet a compaction procedure. In compacted soils, the compaction energyand the initial water content may control the SWCC shape at some level of suction.
The soil water characteristic curves relates the amount of water that can beretained into the pores of a porous material with the soil water suction. This amountof water can be quantified in gravimetric or volumetric way. It is useful to make useof other parameters such as void ratio to have a better visualisation of thephenomenon involved.
Any porous material may have a range of pore sizes and these pores can storewater. One can say that the material has a capacity for storing water. The water isstored in small spaces where the surface effect is significant. In this way some energyhas to be applied to withdraw the water from the pores. The relation between thisenergy and the amount of water withdraw is known as soil water characteristic curve.The bigger the size of the pore the smaller the energy required to empty that pore. Itshould be pointed out that the energy required to empty a pore is the same that may beused to shrink the soil sample. If shrinkage of the soil is not possible, due to theproximity of the particles, the soil will desaturate.
It is found in the literature that the relation between gravimetric water contentand suction is, in some cases, fairly independent of the initial dry unit weight (e.g.Olsen and Langfelder, 1965; Marinho and Chandler, 1993, among others). However,considering the enormous and broad use of the SWCC, it may be useful to look inmore detail the influence of the initial dry unit weight on the SWCC.
Olson and Langfelder (1965) carried out a series of tests using five differentsoils where the suction at the compaction water content was determined using the axistranslation technique. The results are presented in figure 1 in terms of gravimetricwater content. Each soil was compacted statically using a different pressure and a
range of water contents, which resulted in different initial void ratio for each sample.The symbols shown in figure 1 do not represent experimental points; they are plottedjust to facilitate the identification of the soils tested. The connections between thepoints indicate the same compaction pressure. These curves do not represent theSWCC. By plotting the data in this way one can say that the relation between watercontent and suction is practically independent of the compaction pressure, for thepressures used and for the soils tested.

8/7/2019 Marinho&Stuermer - 2000
http://slidepdf.com/reader/full/marinhostuermer-2000 3/17

8/7/2019 Marinho&Stuermer - 2000
http://slidepdf.com/reader/full/marinhostuermer-2000 4/17
Advances in Unsaturated Geotechnics - Geotechnical Special Publication - 99 - ASCE - pp. 125-141.
-4 Marinho & Stuermer
1 10 100 1000 10000Suction (kPa)
0
5
10
15
20
25
30
Water Content (%)
static compaction
kneading compaction
kneading compaction
static compaction (Goose Lane Clay)
(Champaign Till)
Figure 2 - Relation between gravimetric water content and suction for Goose Lane
Clay and Champaign till under static compaction and under kneadingcompaction (data from Olson & Langfelder, 1965).
From the data presented it could be concluded that the influence of the initialdry unit weight on the SWCC is negligible and the type of mechanical compression(e.g. static or kneading compaction) may give different relation between gravimetricwater content and suction. However, the data presented by Olson and Langfelder(1965) did not allow for the SWCC to be obtained. The results are for differentsamples and not for the same sample on drying.
In order to try to identify the effect of stress history on the SWCC, data fromliterature were analysed. The result is presented in figure 3, in terms of suctioncapacity (between 100kPa and 1000kPa) versus liquid limit of the corresponding soil.After the data were plotted it was possible to identify an upper and lower limits of that relation. The slurry line refers to samples prepared using water content above theliquid limit. The line related to stiff soils is almost horizontal, indicating the highenergy required to extract water from the pores of the soils.
Comparing the results from literature with those obtained from the data of Olson & Langfelder (1965), it can be observed that the suction capacity obtained ishigher than the expected values in some cases. The lower the liquid limit the smallerwill be that effect. In figure 3 these results are identified by its correspondingcompaction procedure (static compaction, SC or kneading compaction, KC).
8/7/2019 Marinho&Stuermer - 2000
http://slidepdf.com/reader/full/marinhostuermer-2000 5/17
Advances in Unsaturated Geotechnics - Geotechnical Special Publication - 99 - ASCE - pp. 125-141.
-5 Marinho & Stuermer
25 35 45 55 65 75 85
LL (%)
0
5
10
15
20
25
Suction Capacity, C (%)
SCSCSCSCSCSC
KCKC
SCSCSC
KCKC
SCSCSC
SCSCSC
Slurry
S t iff
Figure 3 - Relation between the suction capacity (C) and liquid limit (LL).
This paper presents the results of a series of drying tests carried out oncompacted residual soil of gneiss under different energy of compaction. The soilssuction was measured using the filter paper technique. The filter paper was placed indirect contact with the soil sample. At higher soil water contents this procedure willmeasure matric suction, and , as the sample dries, there will be a gradual transition to
a measurement of total suction The results also show the influence of the energy onthe shrinkage process.
The soil tested
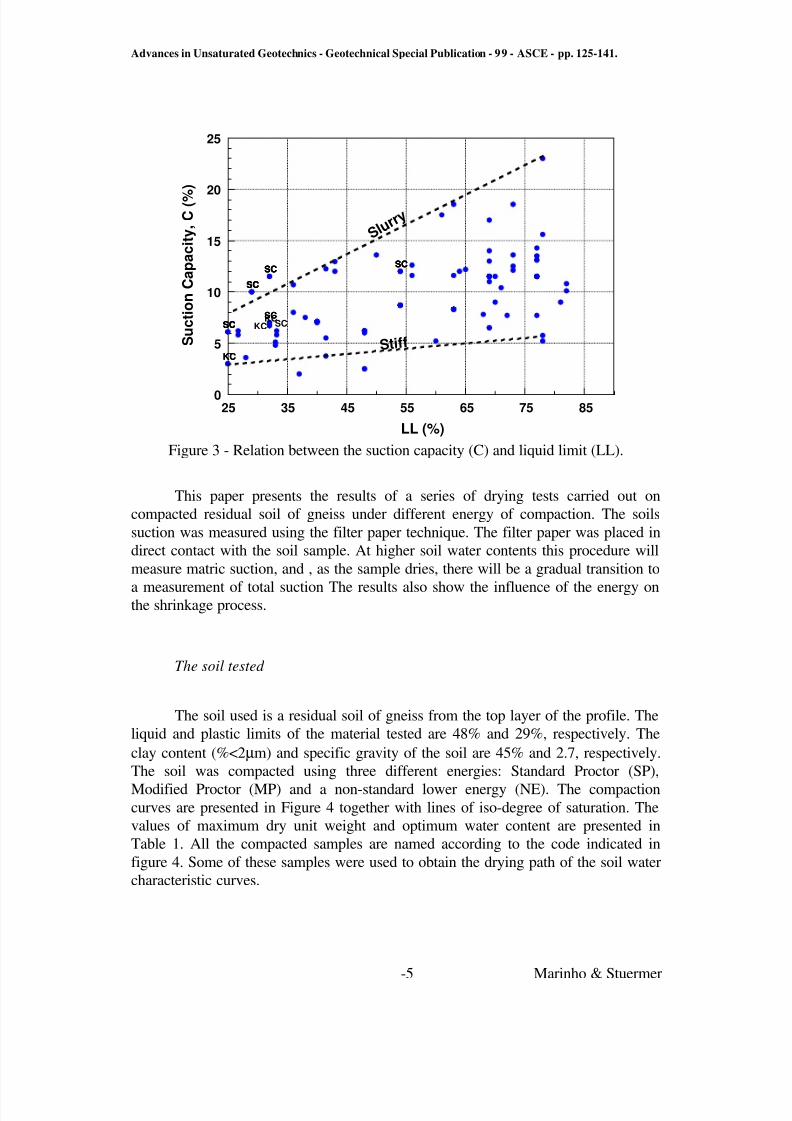
The soil used is a residual soil of gneiss from the top layer of the profile. Theliquid and plastic limits of the material tested are 48% and 29%, respectively. Theclay content (%<2 µm) and specific gravity of the soil are 45% and 2.7, respectively.The soil was compacted using three different energies: Standard Proctor (SP),Modified Proctor (MP) and a non-standard lower energy (NE). The compactioncurves are presented in Figure 4 together with lines of iso-degree of saturation. Thevalues of maximum dry unit weight and optimum water content are presented inTable 1. All the compacted samples are named according to the code indicated infigure 4. Some of these samples were used to obtain the drying path of the soil watercharacteristic curves.
8/7/2019 Marinho&Stuermer - 2000
http://slidepdf.com/reader/full/marinhostuermer-2000 6/17
Advances in Unsaturated Geotechnics - Geotechnical Special Publication - 99 - ASCE - pp. 125-141.
-6 Marinho & Stuermer
Compaction Energy γ γγ γ dmax (kN/m 3) wopt (%)
Standard Proctor (SP) 15,4 25
Modified Proctor (MP) 16,7 19Non Standard Energy (NE) 14,3 28
Table 1: Compaction parameters.
12 14 16 18 20 22 24 26 28 30 32 34
Water Content (%)
12
13
14
15
16
17
18
Dry Unit Weigth (kN/m3)
SP 01
SP 02
SP 03
SP 04
SP 05SP 06 SP 07
SP 08 SP 09
SP 10SP 11
MP 01MP 02
MP 03 MP 04
MP 05
NE 01 NE 02
NE 03
NE 04NE 05
Standard Proctor (SP)Modified Proctor (MP)Non Standard Energy (NE)
S = 1 0 0 %
S = 9 0 %
S = 5 0 %
Figure 4: Compaction curves for three different energies.
Suction measurements
The suction measurements were obtained with the filter paper method usingWhatman n o 42, quantitative filter paper. The calibration curve used was the onesuggested by Chandler et al (1992).
Twenty-one samples were used to obtain the soil suction and the soil watercharacteristic curves. Five samples using the modified proctor (MP), eleven samplesusing the standard proctor (SP) and five samples with the non-standard energy (NE).All samples were weighted and some of them had their volume determined bymeasuring the external dimension of the sample, using a vernier calliper reading to0.01mm. After determining the mass and volume, five filter papers were placed ineach sample after compaction. The filter paper were placed in direct contact with thesoil sample. This procedure will give matric suction for higher soil water content and,
8/7/2019 Marinho&Stuermer - 2000
http://slidepdf.com/reader/full/marinhostuermer-2000 7/17
Advances in Unsaturated Geotechnics - Geotechnical Special Publication - 99 - ASCE - pp. 125-141.
-7 Marinho & Stuermer
as the soil dries, there is a tendency for the measurement of total suction. This is dueto the reduction of contacts between the filter paper and the soil water. In this case thetransference of water from the soil to the filter paper start to be via vapour. The
sample and the filter papers were wrapped in two layers of cling film and left forseven days inside a polystyrene box. The temperature variation inside the box duringthe process of equilibrium, between the filter paper and the soil, was less than 2 oC.The filter papers were weighted using an electronic balance reading to 0.0001g. Theuse of electronic balance together with plastic bags should be made with care. Theplastic may induce some static that affects the readings. It is recommended to use aspacer between the balance plate and the plastic bag.
Initial Characteristics of the Samples
The determination of the characteristic curves started at the compaction watercontent. This procedure does not allow for the determination of the SWCC at verylow values of suction. The suction measured after compaction and the volumetriccharacteristics of the sample are presented in figures 5 to 7, according to the energy of compaction. It is important to emphasize that the results presented in this way do notrepresent the soil water characteristic curves for the soil.

8/7/2019 Marinho&Stuermer - 2000
http://slidepdf.com/reader/full/marinhostuermer-2000 8/17
Advances in Unsaturated Geotechnics - Geotechnical Special Publication - 99 - ASCE - pp. 125-141.
-8 Marinho & Stuermer
0.6
0.7
0.8
0.9
1
1.1
Initial Void Ratio SP 01
SP 02
SP 03
SP 04SP 05SP 06 SP 07
SP 08
SP 09
SP 10 SP11
12 17 22 27water content (%)
0
20
40
60
80
100
Inital Degree of Saturation (%)
SP 01
SP 02
SP 03 SP 04SP 05
SP 06SP 07
SP 08SP 09
SP 10 SP11
SP 01
SP 02
SP 03
SP 04SP 05 SP 06SP 07
SP 08
SP 09
SP 10SP11
10 100 1000initial suction (kPa)
12141618202224
262830
water content (%)
SP 01
SP 02
SP 03SP 04
SP 05
SP 06
SP 07
SP 08
SP 09
SP 10SP11
SP 01
SP 02
SP 03SP 04
SP 05
SP 06SP 07
SP 08
SP 09SP 10
SP11
e = 0.77
e = 1,00
(a)
(b)
(c)
(d)
(e)
Figure 5: Initial conditions of the samples compacted using the standard proctor
energy.

8/7/2019 Marinho&Stuermer - 2000
http://slidepdf.com/reader/full/marinhostuermer-2000 9/17
Advances in Unsaturated Geotechnics - Geotechnical Special Publication - 99 - ASCE - pp. 125-141.
-9 Marinho & Stuermer
0.5
0.6
0.7
0.8
0.9
1
1.1
Initial Void Ratio
MP1MP2
MP3MP4
MP5
12 17 22 27water content (%)
0
20
40
60
80
100
Initial Degree of Saturation (%)
MP1
MP2
MP3
MP4MP5
MP1MP2
MP3
MP4
MP5
MP1
MP2
MP3MP4MP5
e = 0.77
(a)
(b)
(c)
(d)
10 100 1000suction (kPa)
12141618202224262830
water content (%)
MP1
MP2
MP3
MP4
MP5
(e)
e = 0.55
Figure 6: Initial conditions of the samples compacted using the modified proctor.

8/7/2019 Marinho&Stuermer - 2000
http://slidepdf.com/reader/full/marinhostuermer-2000 10/17
Advances in Unsaturated Geotechnics - Geotechnical Special Publication - 99 - ASCE - pp. 125-141.
-10 Marinho & Stuermer
0.5
0.6
0.7
0.8
0.9
1
1.1
Initial Void Ratio
NE1 NE2
NE3
NE4NE5
12 17 22 27water content (%)
0
20
40
60
80
100
Intial Degree of Saturation (%)
NE1NE2
NE3
NE4
NE5
NE1NE2
NE3
NE4NE5
NE1
NE2
NE3
NE4
NE5
e = 0.77
(a)
(b)
(c)
(d)
10 100 1000suction (kPa)
12141618202224262830
water content (%)
NE1
NE2
NE3
NE4
NE5
(e)
e = 1 .2
Figure 7: Initial conditions of the samples compacted using the non-standard proctor.

8/7/2019 Marinho&Stuermer - 2000
http://slidepdf.com/reader/full/marinhostuermer-2000 11/17
Advances in Unsaturated Geotechnics - Geotechnical Special Publication - 99 - ASCE - pp. 125-141.
-11 Marinho & Stuermer
The Soil Water Characteristic Curves
Figures 8, 9 and 10 show the soil water characteristic curves obtained in adrying process for the samples SP, PM and NE, respectively. One can observe onfigure 8e and 9e, the different paths followed by the samples according with the initialwater content. This behaviour is also related with the initial degree of saturation.
SP 02SP 03SP 04SP 05SP 06SP 07SP 08SP 09SP 10SP 11SP 01
0.5
0.6
0.7
0.8
0.9
1
1.1
V
oid Ratio
0 5 10 15 20 25 30water content (%)
01020
30405060708090
100
Degree of Saturation (%)
10 100 1000 10000 100000
suction (kPa)
0
5
10
15
20
25
30
water content (%)
w op
(a)
(b)
(c)
(d)
(e)
Figure 8: Soil Water Characteristic Curves for the samples compacted using the
standard Proctor
Using the results obtained it is possible to identify three types of samples:

8/7/2019 Marinho&Stuermer - 2000
http://slidepdf.com/reader/full/marinhostuermer-2000 12/17
Advances in Unsaturated Geotechnics - Geotechnical Special Publication - 99 - ASCE - pp. 125-141.
-12 Marinho & Stuermer
1. Samples compacted above the optimum water content (all energies).2. Samples compacted above the optimum water content but with different void
ratio (at a specific energy).3. Samples compacted at the same void ratio and different water content (at aspecific energy).
10 100 1000 10000 100000
suction (kPa)
0
5
10
15
20
w (%)
0.5
0.6
0.7
0.8
0.9
1
1.1
MP 01MP 02MP 03MP 04MP 05
0 5 10 15 20 25 30
w (%)
010
2030405060708090
100
w op
(a) (c)
(b) (d)
(e)
Figure 9: Soil Water Characteristic Curves for the samples compacted using the
modified Proctor.
The samples compacted with water content higher than the optimum watercontent started the drying process at a zone where the amount of water lost (in
8/7/2019 Marinho&Stuermer - 2000
http://slidepdf.com/reader/full/marinhostuermer-2000 13/17
Advances in Unsaturated Geotechnics - Geotechnical Special Publication - 99 - ASCE - pp. 125-141.
-13 Marinho & Stuermer
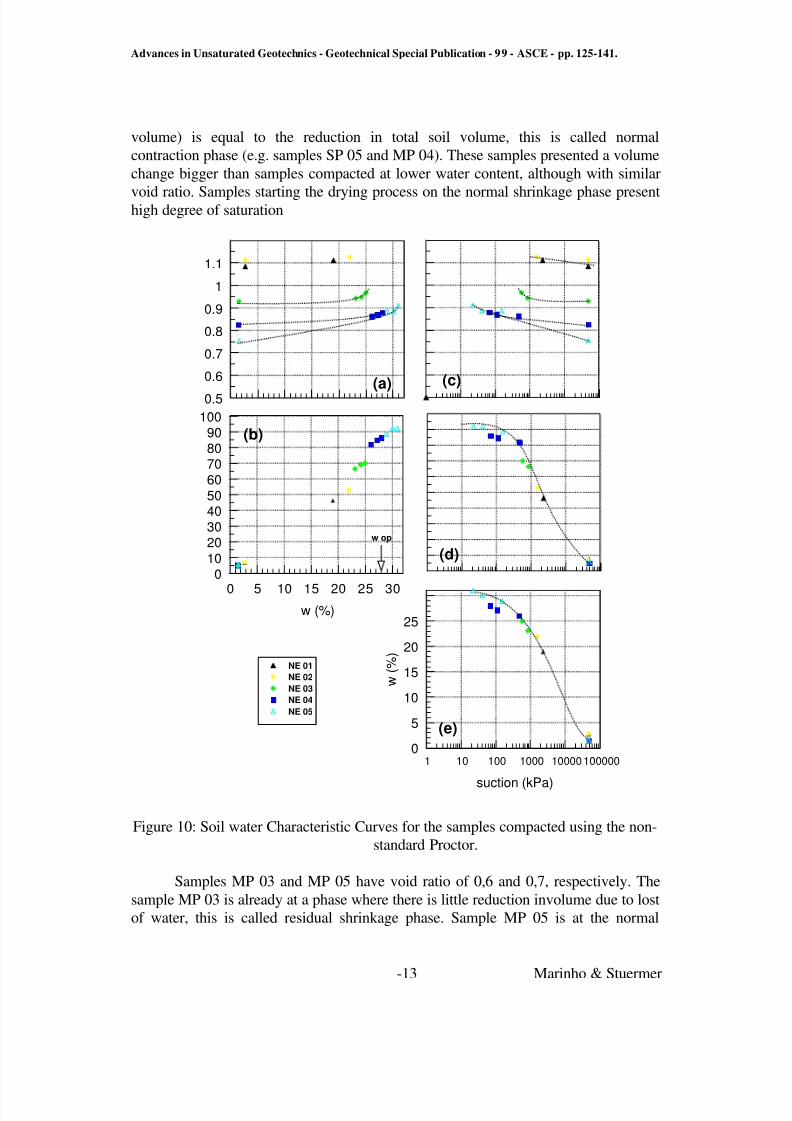
volume) is equal to the reduction in total soil volume, this is called normalcontraction phase (e.g. samples SP 05 and MP 04). These samples presented a volumechange bigger than samples compacted at lower water content, although with similar
void ratio. Samples starting the drying process on the normal shrinkage phase presenthigh degree of saturation
1 10 100 1000 10000 100000
suction (kPa)
0
5
10
15
20
25
w (%)
NE 01NE 02NE 03NE 04NE 05
0.5
0.6
0.7
0.8
0.9
1
1.1
0 5 10 15 20 25 30w (%)
0102030405060708090
100
w op
(a)
(b)
(c)
(d)
(e)
Figure 10: Soil water Characteristic Curves for the samples compacted using the non-
standard Proctor.
Samples MP 03 and MP 05 have void ratio of 0,6 and 0,7, respectively. Thesample MP 03 is already at a phase where there is little reduction involume due to lostof water, this is called residual shrinkage phase. Sample MP 05 is at the normal

8/7/2019 Marinho&Stuermer - 2000
http://slidepdf.com/reader/full/marinhostuermer-2000 14/17
Advances in Unsaturated Geotechnics - Geotechnical Special Publication - 99 - ASCE - pp. 125-141.
-14 Marinho & Stuermer
phase. The difference observed in the shrinkage process is related to the initial degreeof saturation and void ratio.
The samples MP 02 and MP 04 have an initial void ratio of approximately0,64. For the same value of suction these two samples presented degree of saturationand water content different. Sample MP 02 has a much lower initial degree of saturation (68%) than sample MP 04 (98%). The shrinkage of these samples isaffected by the initial degree of saturation and water content. After the general airentry point (GAE) the relation between degree of saturation and water content ispractically a straight line for some samples, i.e., void ratio is constant.
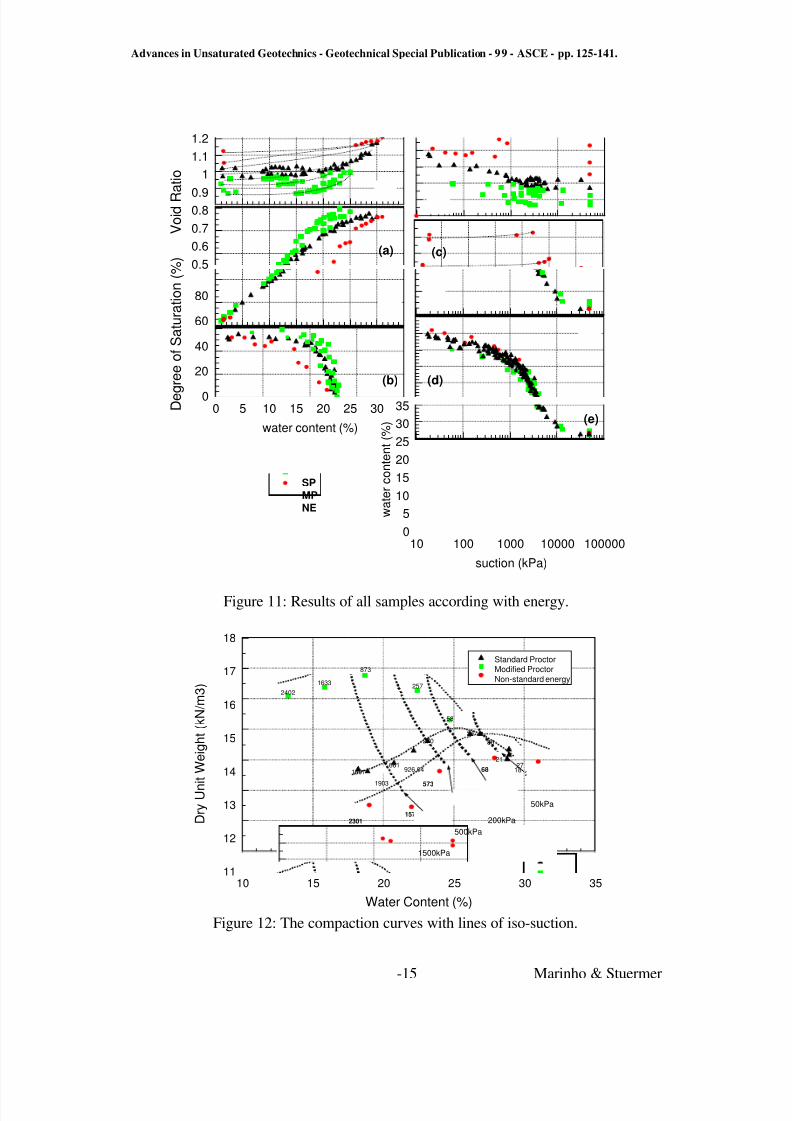
Figure 11 resumes the soil water characteristic relations of all samplesobtained with the three compaction energies. The higher the energy of compaction thehigher is the degree of saturation for the same suction up to the GAE. At some pointafter the GAE the curves of all energies become practically unique. This phenomenonmay be due to the fact that the pore size distribution of the saturated pores is equal. Italso should be point out that at very high level of suction the suction measured mightbe a combination of matrix and total suction, although the osmotic suction in this caseseems to be small. It may also be that for higher suctions, the Electro-chemicalseffects are stronger than capillary effects.
The curves obtained show, what may be called a pseudo-pre-consolidationeffect of the compaction on the storage capacity. For suction values smaller thanGAE, the soil behaviour is ruled specially by that effect.
Figure 12 presents the three compaction curves obtained showing the suctionfor each sample just after compaction. Lines of equal values of suction are alsoshown. One can observe that there is a dependence of the dry unit weight on thesuction after compaction, since the iso-lines of suction are not vertical.
The GAE point occurs for suction values of about 1,000 kPa, 2,000 kPa, and500kPa respectively for SP, MP and NE samples. The residual water content ( θr) isreached for suction value of about 15,000 kPa, with residual degree of saturation (Sr)approximately of 2% for the three curves. After GAE the behaviour of all samples are
practically the same. It can be observed that the volume change, up to the GAE, forsample compacted above the optimum water content is 75%, 55% and 35% of thetotal shrinkage for the energies standard (SP), modified (MP) and non-standard (NE),respectively. In some a great amount of shrinkage is still due to occur after the GAE,down to the zero water content.
8/7/2019 Marinho&Stuermer - 2000
http://slidepdf.com/reader/full/marinhostuermer-2000 15/17
Advances in Unsaturated Geotechnics - Geotechnical Special Publication - 99 - ASCE - pp. 125-141.
-15 Marinho & Stuermer
10 100 1000 10000 100000
suction (kPa)
05
101520253035
water content (%)
SPMPNE
0.50.60.70.80.9
11.11.2
Void Ratio
0 5 10 15 20 25 30
water content (%)
0
20
40
60
80
Degree of Saturation (%) (a)
(b)
(c)
(d)
(e)
Figure 11: Results of all samples according with energy.
10 15 20 25 30 35
Water Content (%)
11
12
13
14
15
16
17
18
Dry Unit Weight (kN/m3)
1691661
27054
21
1903
926.04
86
2718
24021633
873
257
58
23011574
573
68 22
Standard ProctorModified ProctorNon-standard energy
1500kPa
500kPa200kPa
50kPa
Figure 12: The compaction curves with lines of iso-suction.

8/7/2019 Marinho&Stuermer - 2000
http://slidepdf.com/reader/full/marinhostuermer-2000 16/17
Advances in Unsaturated Geotechnics - Geotechnical Special Publication - 99 - ASCE - pp. 125-141.
-16 Marinho & Stuermer
Figure 13 presents the drying curves for some of the samples (SP 11, MP 03,MP 05, NE 04 and NE 05) plotted over the compaction curves. It can be observed thatduring the drying process the samples SP 11 and NE 05 practically follow the
compaction curve, rising the dry density until the GAE point. After this value of suction, the gradient of increase of the dry density is reduced. At this point the suctionreduces its efficiency of shrinkage. As expected in samples compacted with themodified Proctor the increase in suction could not increase the dry unit weight in thesame way it had occurred with the smaller energies.
0 2 4 6 8 10 12 14 16 18 20 22 24 26 28 30 32
Water Content (%)
12
13
14
15
16
17
18
Dry Unit Weight (kN/m3)
SP 01
SP 02
SP 03
SP 04
SP 05SP 06
SP 07
SP 08SP 09
SP 10SP 11
MP 01MP 02
MP 03 MP 04
MP 05
NE 01 NE 02
NE 03
NE 04 NE 05
Normal ProctorModified ProctorNon-standard energySP 11MP 05NE 05MP 03NE 04
S = 1 0 0 %
S = 9 0 %
S = 5 0 %
drying curves
Figure 13: Drying curves of the samples SP11, MP05, NE05, MP03 and NE04, over
the compaction curves.
Conclusions
At a particular energy of compaction the initial water content affect theSWCC. During the drying process samples compacted near the optimum water
content or below it, always presented smaller suction than samples compacted at wetof optimum
The GAE is not greatly affected by the compaction water content. On the otherhand the energy of compaction affects the GAE of the soil. The compaction energyseems to affect the level of suction that is controlled by capillary phenomena.
The soil water characteristic curves embraces not only the relationshipbetween gravimetric or volumetric water content and suction (soil water characteristic
8/7/2019 Marinho&Stuermer - 2000
http://slidepdf.com/reader/full/marinhostuermer-2000 17/17
Advances in Unsaturated Geotechnics - Geotechnical Special Publication - 99 - ASCE - pp. 125-141.
curve, SWCC), but also the relation between void ratio and suction. The soil watercharacteristic curve is affected by the energy of compaction, considering thedifferences between the energies used in this study. The energy of compaction
obviously affects the relation between void ratio and water content and inconsequence it affects the quantitative aspect of the relationship between void ratioand suction.
The volume change of the samples after the GAE can be significant,particularly for samples that were compacted using low energy.
References
CHANDLER,R.J.; CRILLY, M.S. and MONTGOMERY-SMITH,G. (1992) - "Alow-cost method of assessing clay desiccation for low-rise buildings". - Proc. of the Institute of Civil Engineering, 92 - n.2 - pp.82-89.
OLSON, R.E. and LANGFELDER, L.J. (1965) - "Pore pressures in unsaturated soils"- Journal of the Soil Mechanics and Foundations Division - ASCE - July. SM4 -pp.127-150.
MARINHO, F.A.M. and CHANDLER, R.J. (1993) - "Aspects of the behaviour of clays on drying" - Unsaturated Soils - ASCE Geotechnical Special Publication nº39 - Edited by Houston, S.L. and Wray, W.K. - pp. 77-90.
Acknowledgement
The work presented in this paper is part of a research project sponsored by theSão Paulo State agency (FAPESP). The second author is grateful for the sponsorshipby the Brazilian Government agency CAPES.