Embed Size (px)
Citation preview
Mark Cresswell
Impacts: Sea-level Change
69EG6517 – Impacts & Models of Climate Change
Topics• Introduction
• Measuring sea-level change
• Some facts
• Summary
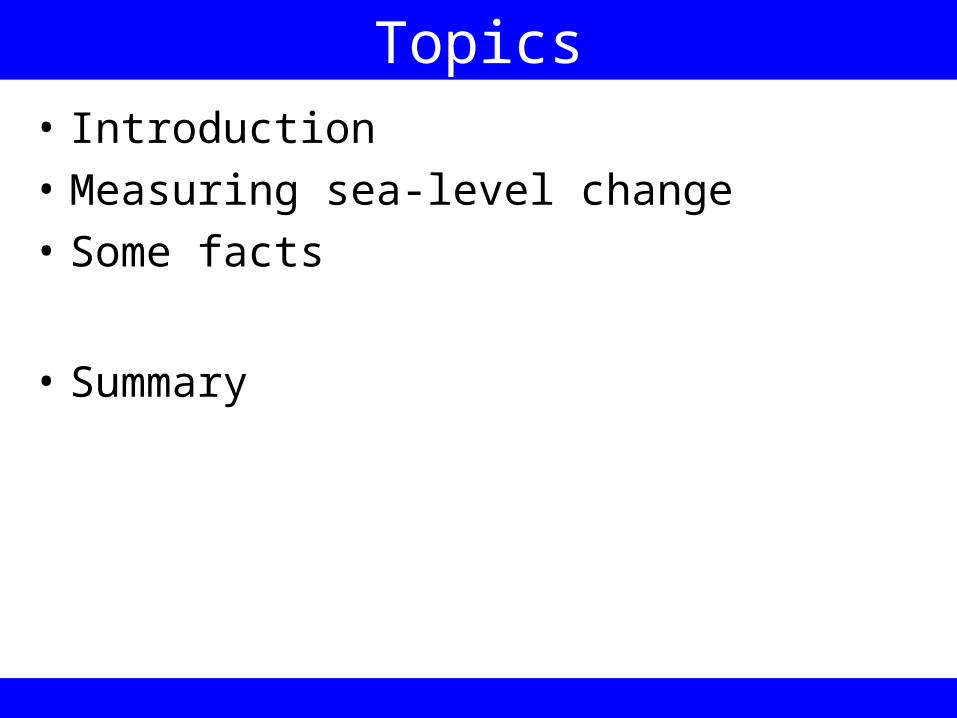
Introduction• The term “sea-level change” refers to a
change in the mean-sea-level for sentinel ports across the globe
• MSL is the average of high and low water marks
• Tidal surges may occur as a result of storm events – making coastal zones vulnerable but not necessarily due to a change in MSL
• Sea-level change is primarily due to thermal expansion and not “more water”
Measuring Sea-level Change• Changes in sea-level are recorded by the
Permanent Service for Mean Sea Level (PSMSL) at the Proudman Oceanographic Laboratory (POL) on Merseyside
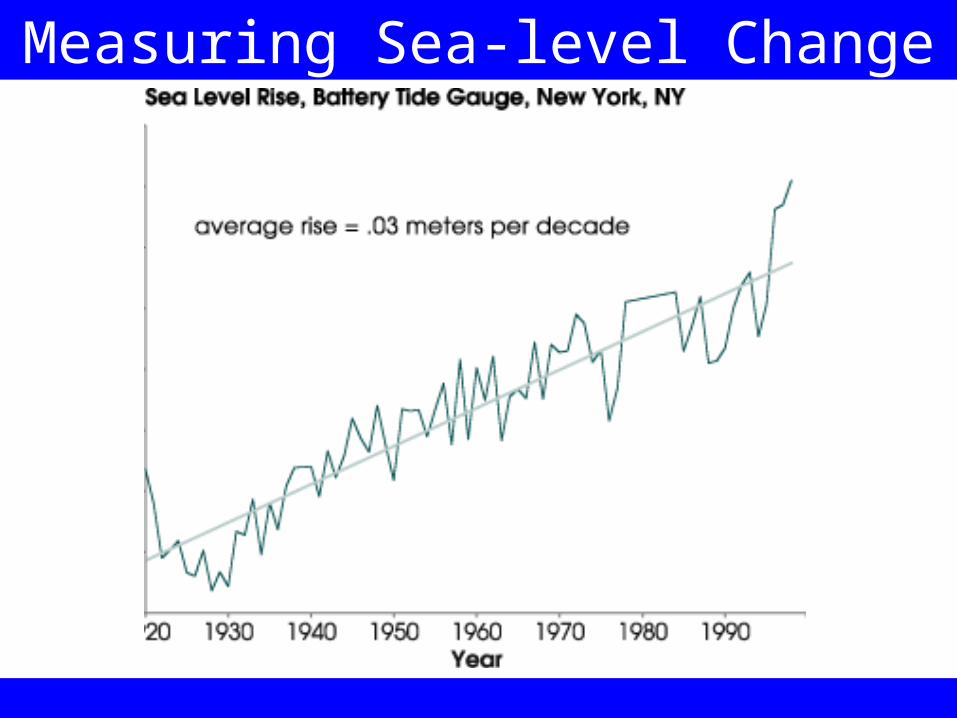
• Tide gauge data from around the world are collated at POL and trends in sea level are derived from time series extending back many decades or even centuries
Measuring Sea-level Change
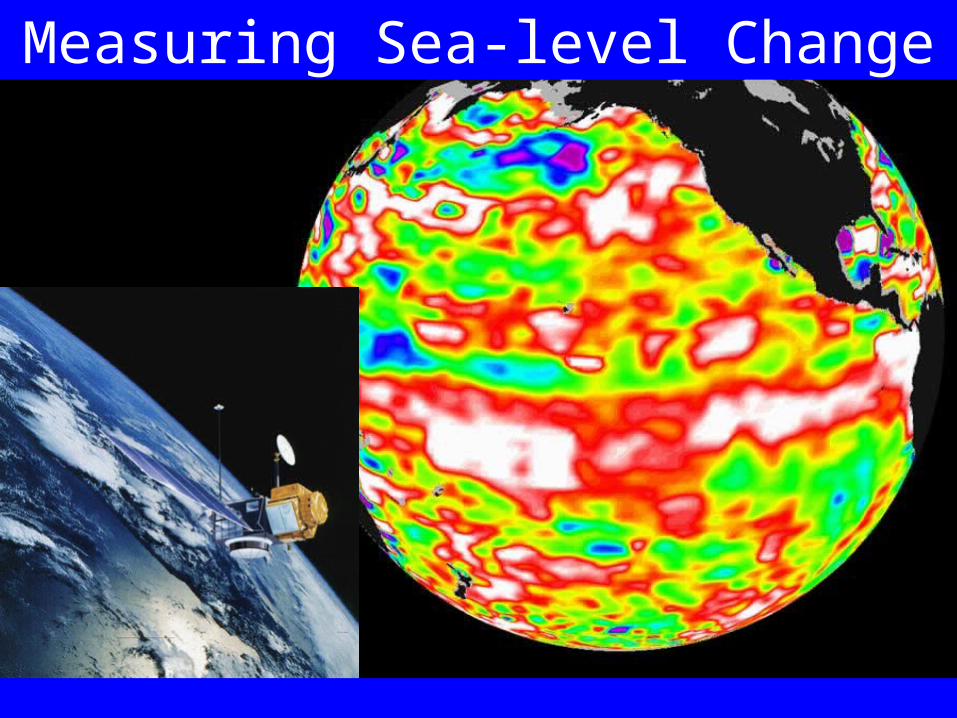
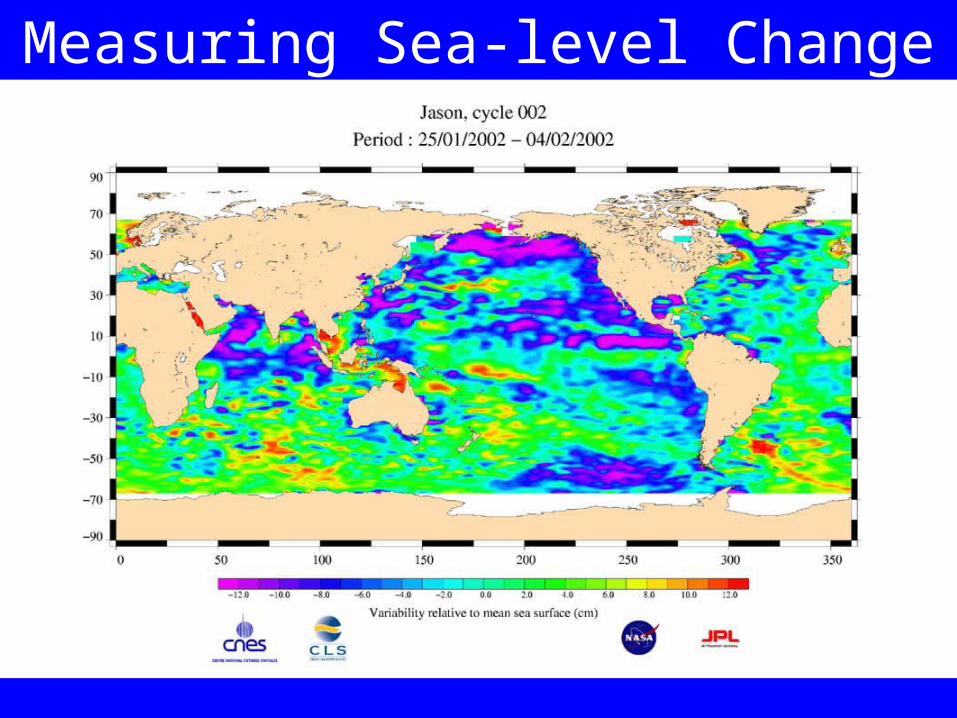
Measuring Sea-level Change• Sea-level is routinely measured from
altimetric satellites such as TOPEX-POSEIDON and JASON
• The significant wave height is determined from the return time of energy emitted from TOPEX
• As water expands in response to thermal forcing, TOPEX can be used to derive a proxy of SST as well as wave height
Measuring Sea-level Change
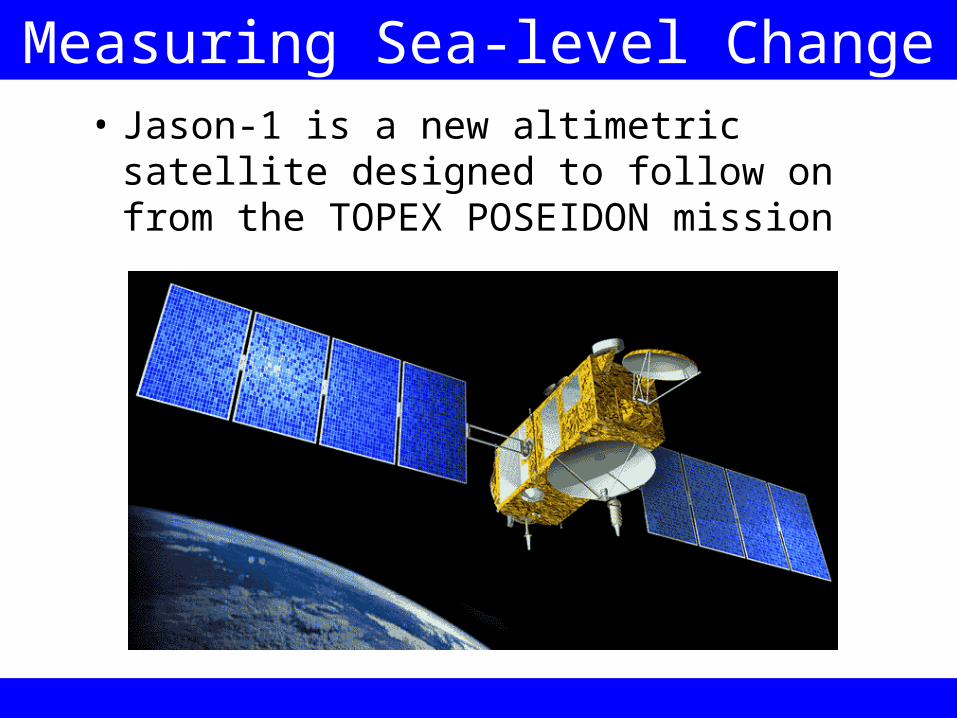
Measuring Sea-level Change• Jason-1 is a new altimetric satellite
designed to follow on from the TOPEX POSEIDON mission
Measuring Sea-level Change
Some facts• Some components of future sea-level rise can be
modelled regionally using coupled ocean-atmosphere models
• The most common method of obtaining scenarios is to apply global mean estimates from simple models
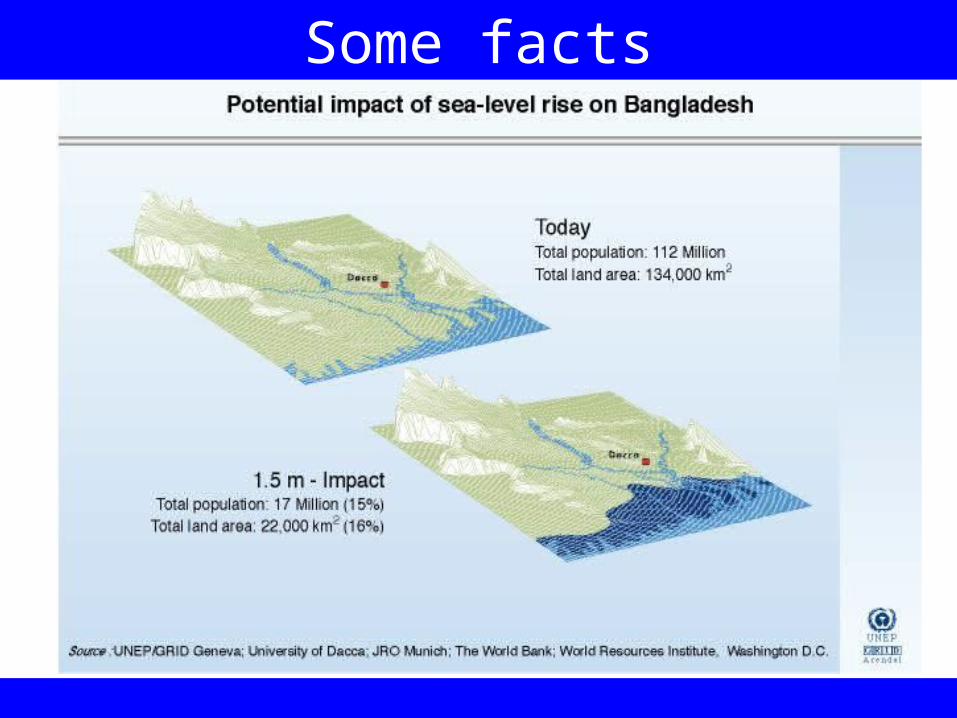
• Changes in the occurrence of extreme events such as storm surges can lead to major coastal impacts
Some facts
Some facts• Global mean sea-level has risen by about 0.1-
0.2mm a year over the past 3000 years and by about 1-2mm a year since 1900 with a central value of 1.5mm per year
• It is believed (IPCC) that sea-level will rise by 0.09-0.88 metre between 1990 and 2100
• Higher MSL will increase the frequency of existing extreme levels associated with storm waves and surges.
Some facts• Sea-level will tend to increase in association
with a warmer climate as a result of:
– Thermal expansion of seawater– Melting of small mountain glaciers and ice caps– Melting of the Greenland ice cap– Changes in the mass balance of the Antarctic ice cap
Some facts• As seawater warms, its density decreases – thus
a given mass of ocean water will occupy a greater volume as the ocean warms – thereby tending to increase the average sea level
• A globally uniform ocean warming by 3ºC would cause a sea-level rise of about 2.4 m
• Complete melting of all mountain glaciers and ice caps is estimated to raise sea level by some 50± 10 cm (Harvey 2000 after Warrick et al. 1996)
Some facts• Greenland is of particular concern because of its
large ice mass – enough to raise sea-level by about 7.4 m if it was to melt
• A regional warming of about 6ºC would be sufficient to provoke the eventual melting of the entire ice mass (Letréguilly et al. 1991)
• Some models show that increased temperatures lead to enhanced snowfall over both Greenland and Antarctic ice sheets – however Greenland ice cores show a reverse relationship
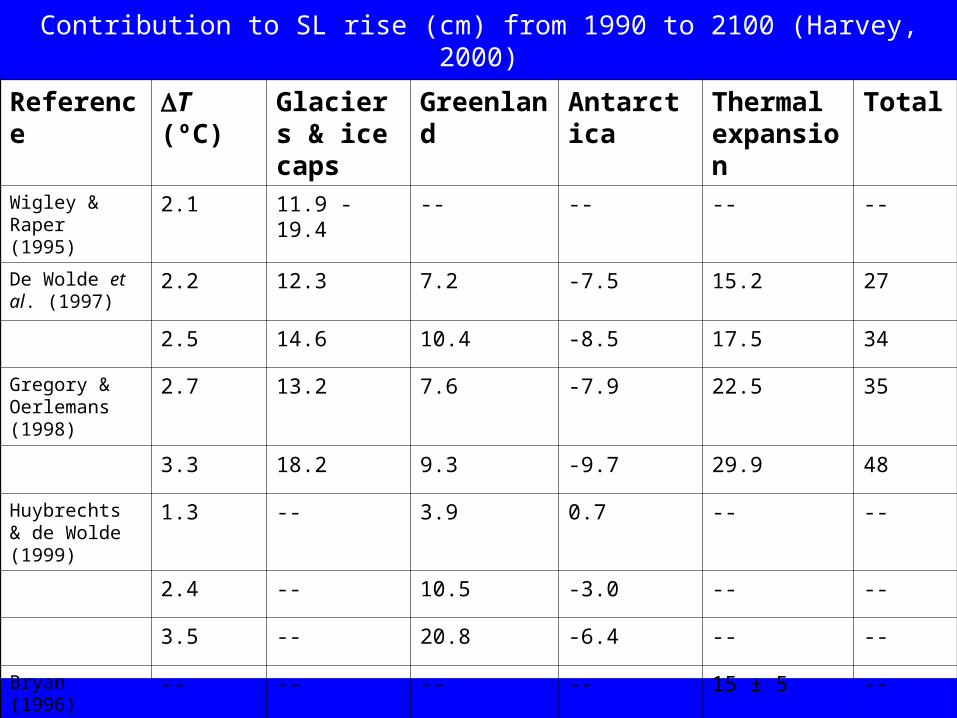
Contribution to SL rise (cm) from 1990 to 2100 (Harvey, 2000)
Reference T (ºC) Glaciers & ice caps
Greenland Antarctica Thermal expansion
Total
Wigley & Raper (1995)
2.1 11.9 - 19.4 -- -- -- --
De Wolde et al. (1997)
2.2 12.3 7.2 -7.5 15.2 27
2.5 14.6 10.4 -8.5 17.5 34
Gregory & Oerlemans (1998)
2.7 13.2 7.6 -7.9 22.5 35
3.3 18.2 9.3 -9.7 29.9 48
Huybrechts & de Wolde (1999)
1.3 -- 3.9 0.7 -- --
2.4 -- 10.5 -3.0 -- --
3.5 -- 20.8 -6.4 -- --
Bryan (1996) -- -- -- -- 15 ± 5 --


![Dr Mark Cresswell Statistical Forecasting [Part 2] 69EG6517 – Impacts & Models of Climate Change](https://img.pdfslide.net/doc/110x75/56649f535503460f94c77c42/dr-mark-cresswell-statistical-forecasting-part-2-69eg6517-impacts-models.jpg)