Embed Size (px)
Citation preview
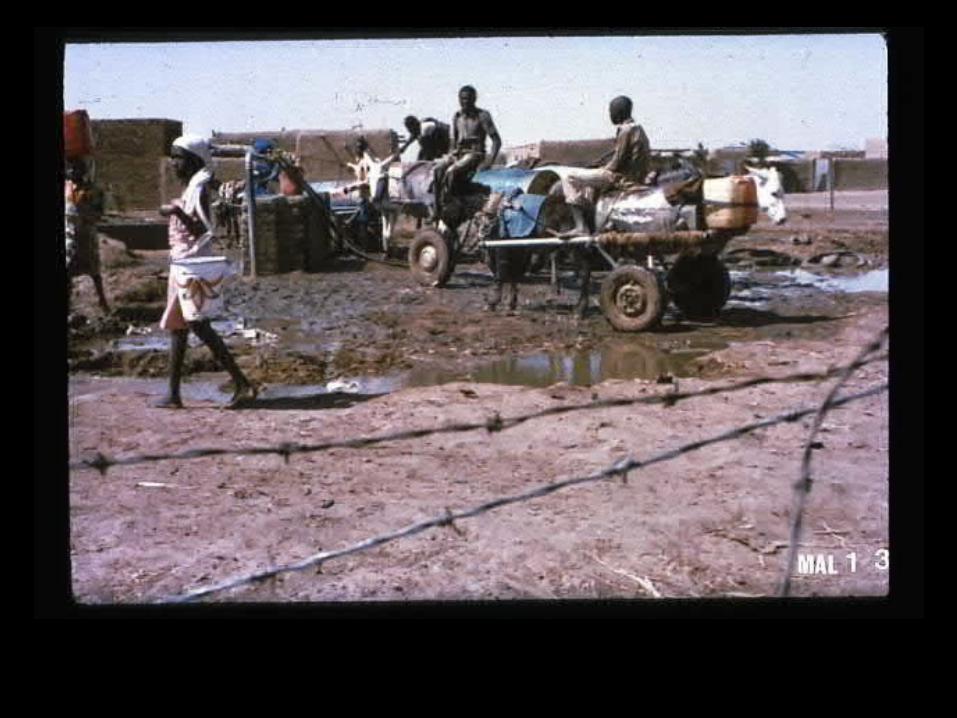
Vulnerability &Health
Climate &
Climate ChangeDr Mark Cresswell
Topics The ‘problem’ of malaria & health end-users Malaria – background GIS & Remote Sensing Spatial and Temporal change MARA
The future………..
Problem - Health Health and disease often has a spatial
component Climatic, environmental and socio-economic
variables affect health Epidemics and outbreaks spread across a
region – either as a function of movement of people or environmental factors
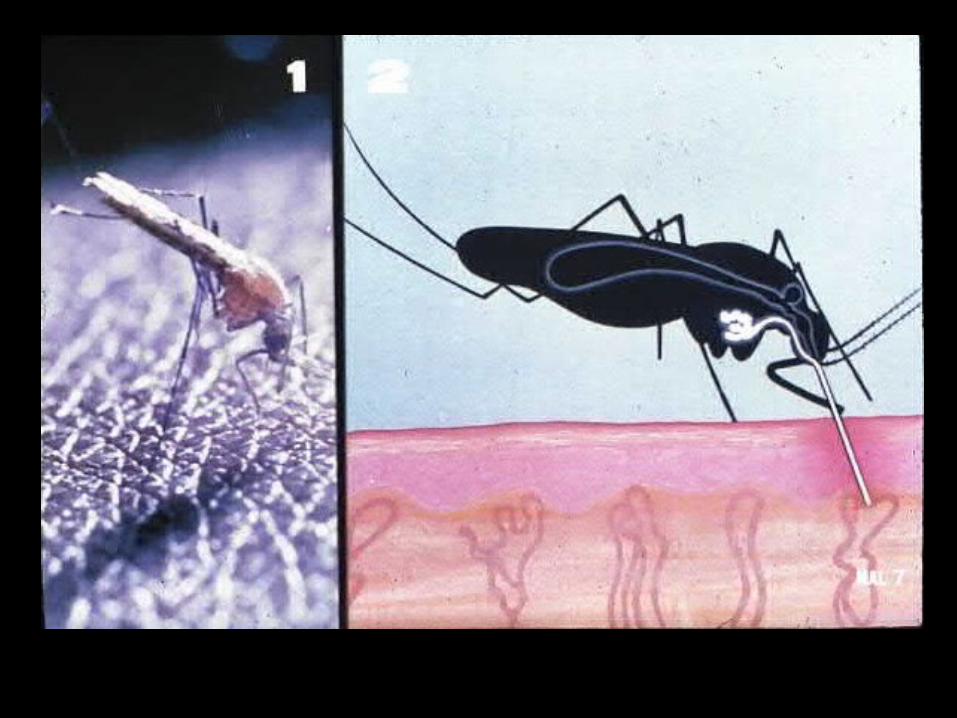
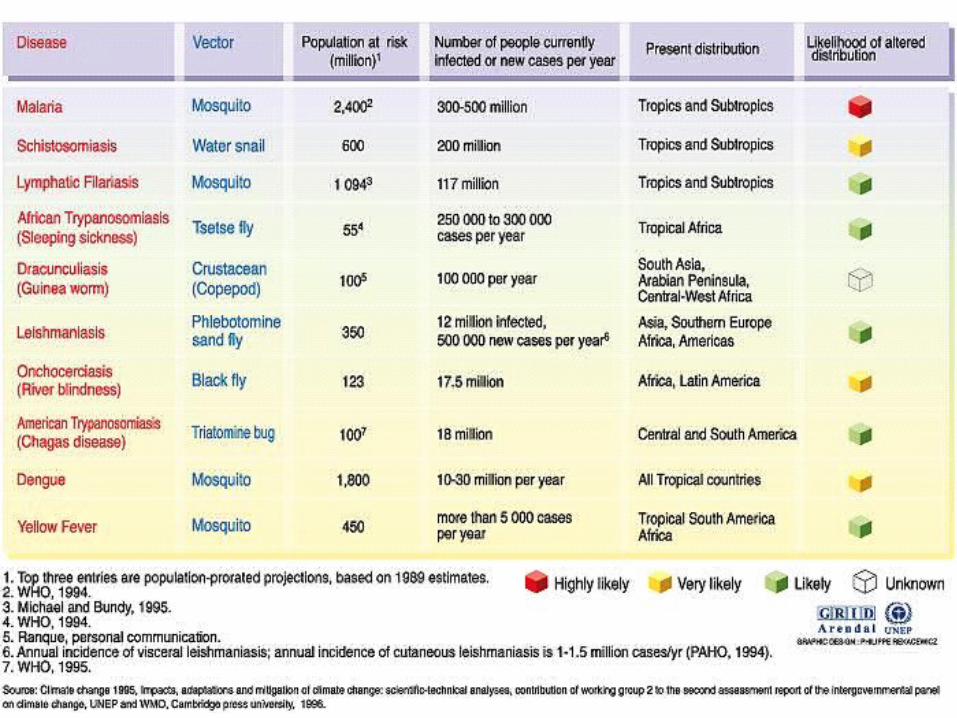
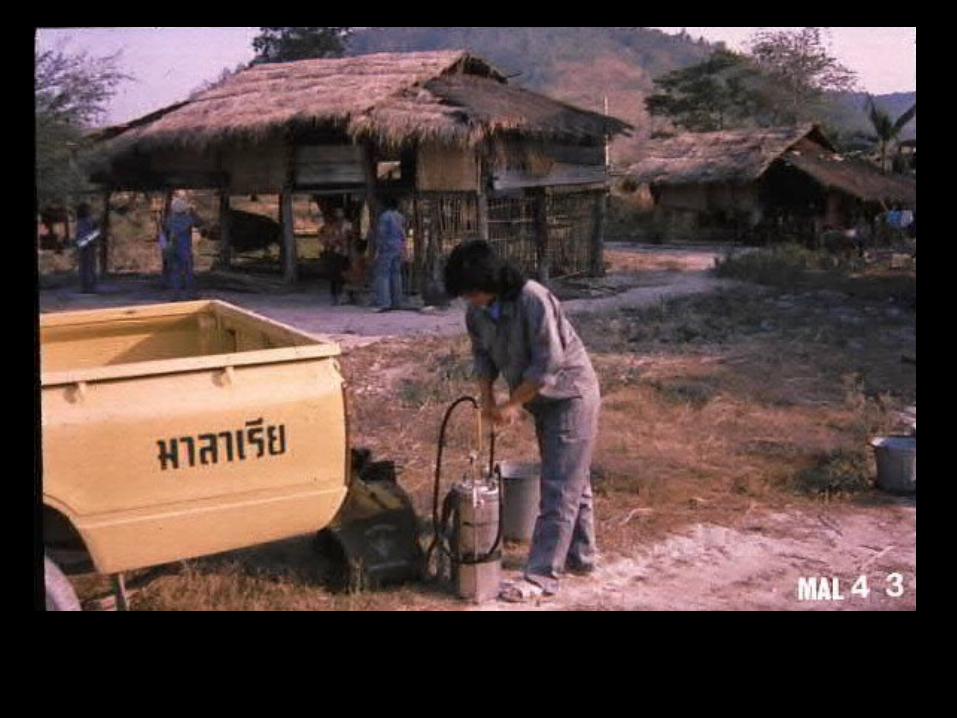
Problem - malaria Malaria is a tropical disease Symptoms are caused by a parasite (of the
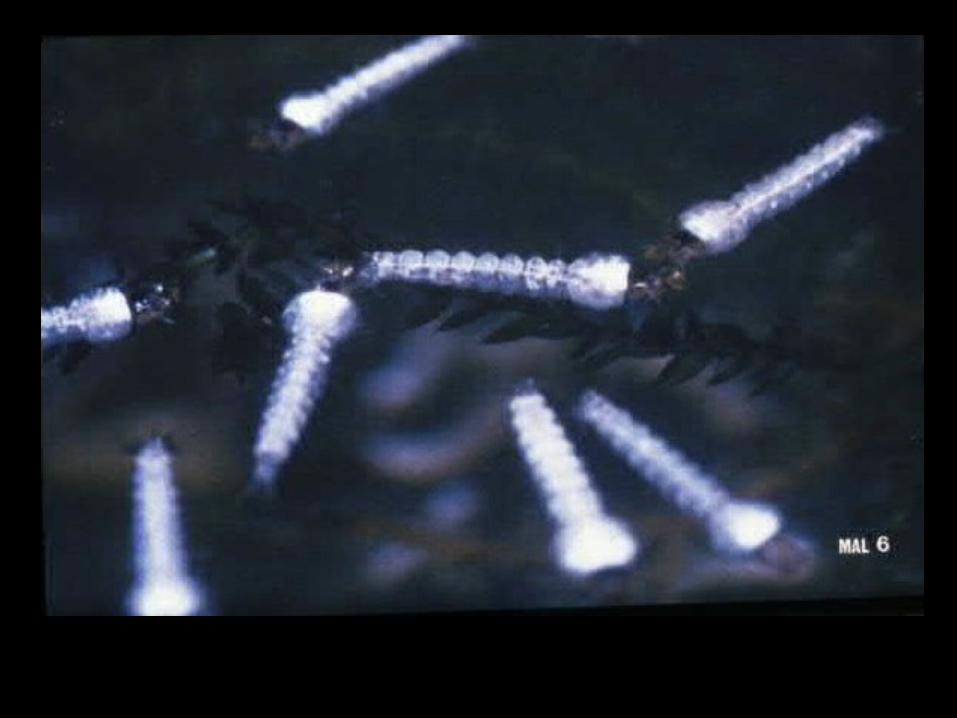
genus Plasmodium) Parasite is transmitted by a Vector (female
mosquito of the genus Anopheles) Malaria kills mostly children (~2M/yr
WHO estimate)
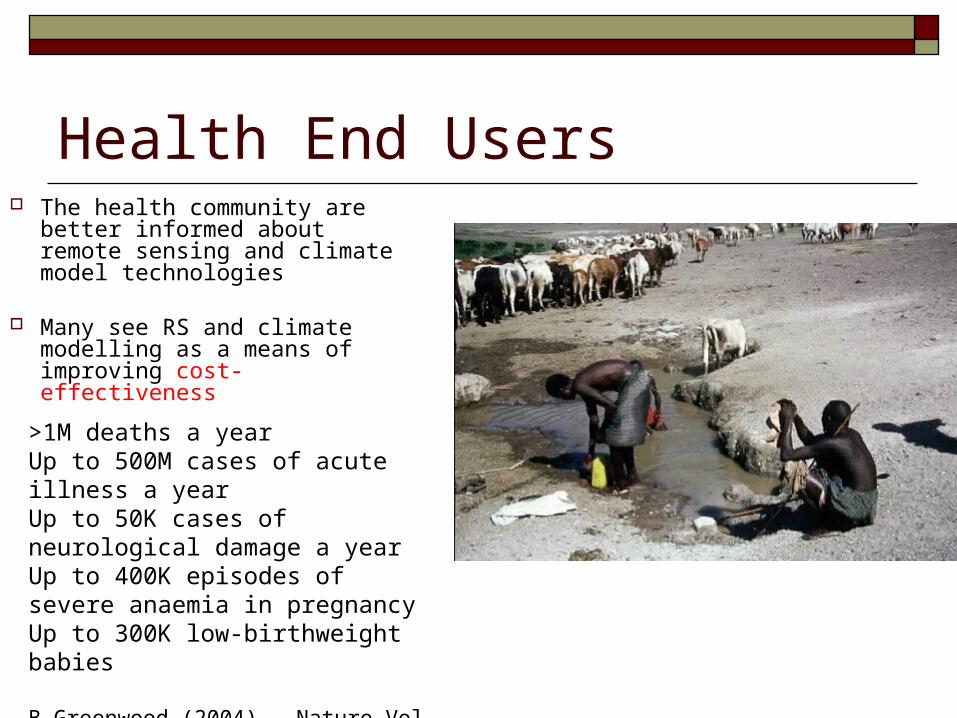
Health End Users The health community are better
informed about remote sensing and climate model technologies
Many see RS and climate modelling as a means of improving cost-effectiveness
>1M deaths a yearUp to 500M cases of acute illness a yearUp to 50K cases of neurological damage a yearUp to 400K episodes of severe anaemia in pregnancyUp to 300K low-birthweight babies
B Greenwood (2004) – Nature Vol 430, 2004
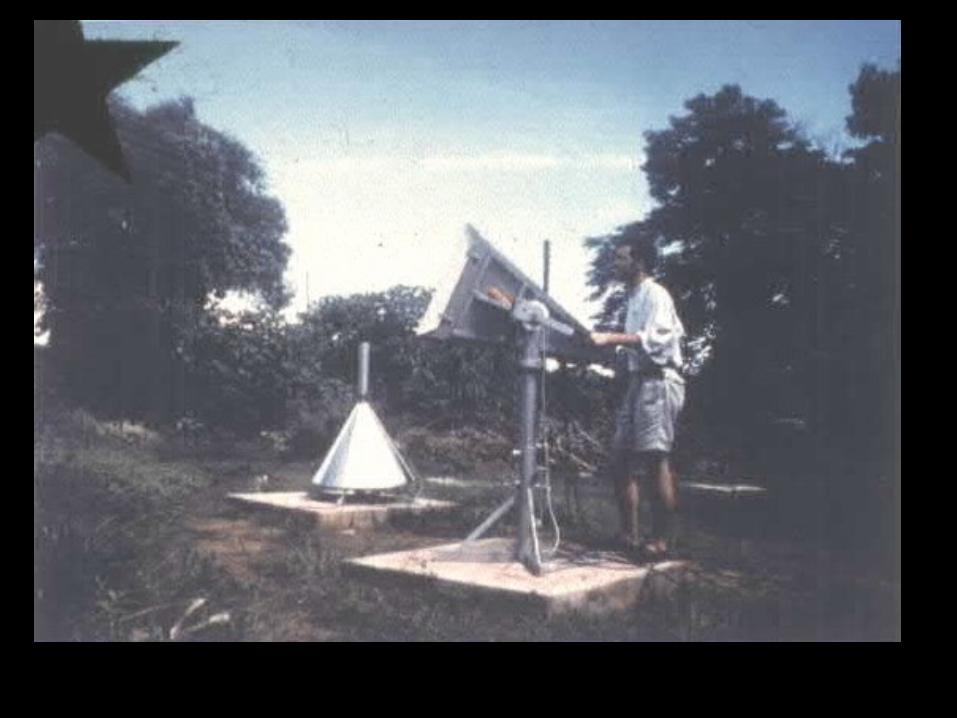
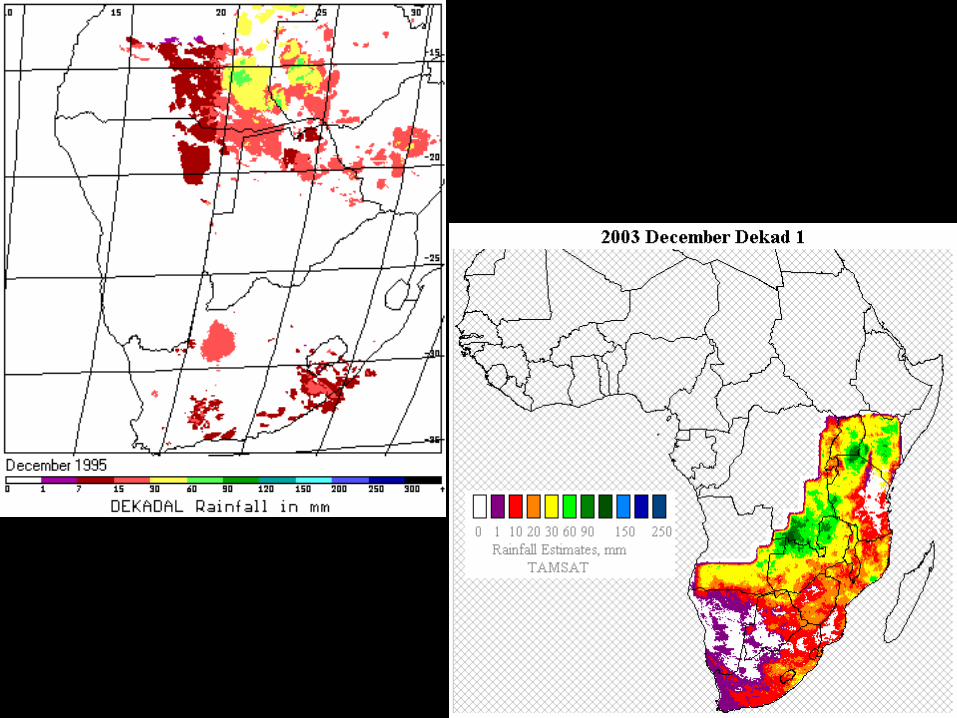
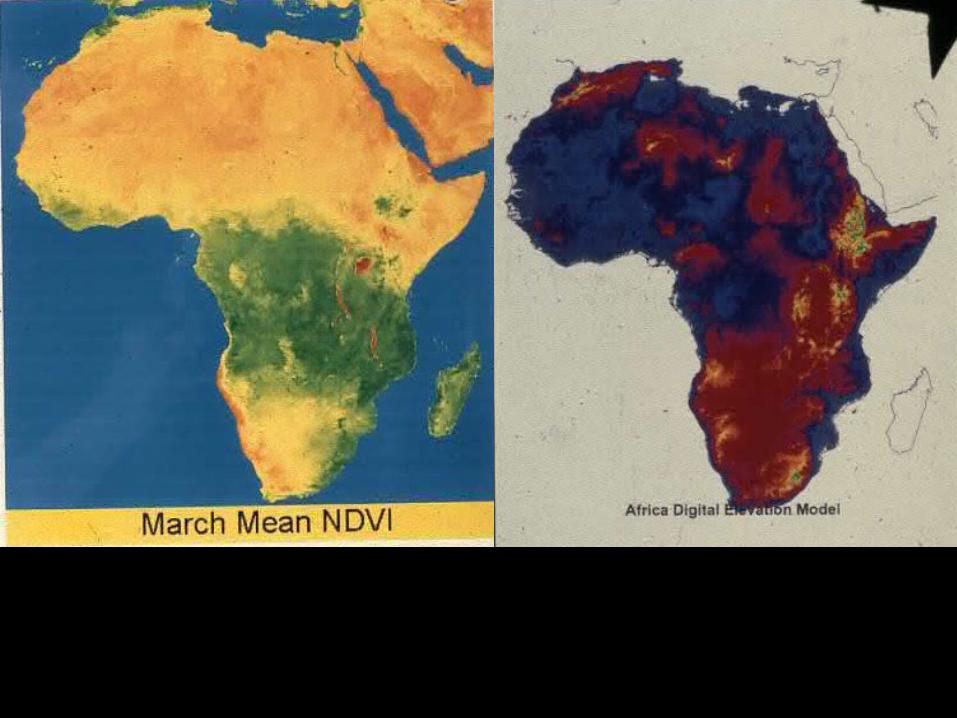
The most fundamental environmental controlling factors are:
Temperature (development and survival)
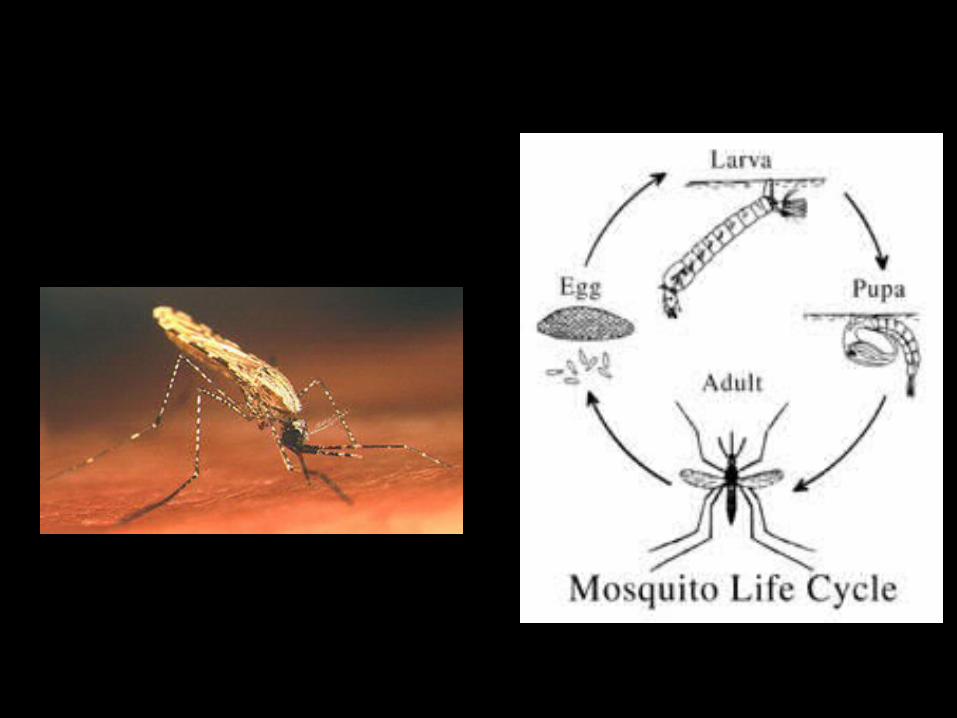
Rainfall (needed for mosquito breeding cycle)
Humidity (often a threshold of 60%RH is quoted)
Vegetation (linked to humidity in some ways)
If the air is too dry the insect will desiccate – it uses night-time feeding and vegetation microhabitat strategies for survival
The following projected changes to our climate will make the prevalence of diseases such as malaria more acute:
•Enhanced precipitation in wet season•Warmer temperatures in upland areas as temperatures rise•Changes in vegetation patterns•Floods in lowland areas•Migration of refugees as a result of extreme weather
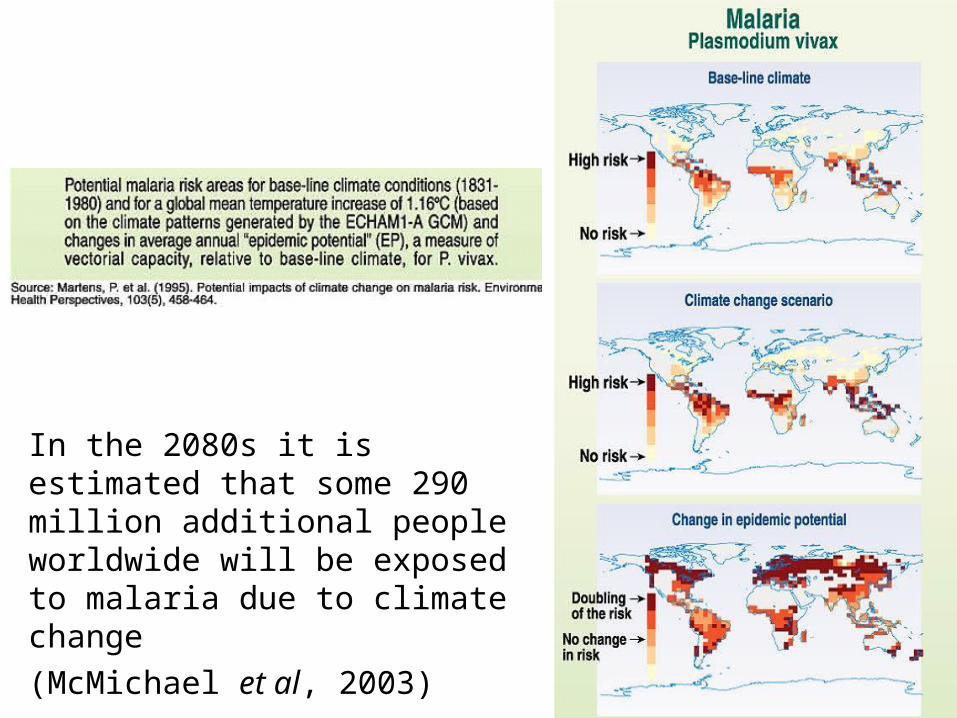
In the 2080s it is estimated that some 290 million additional people worldwide will be exposed to malaria due to climate change
(McMichael et al, 2003)


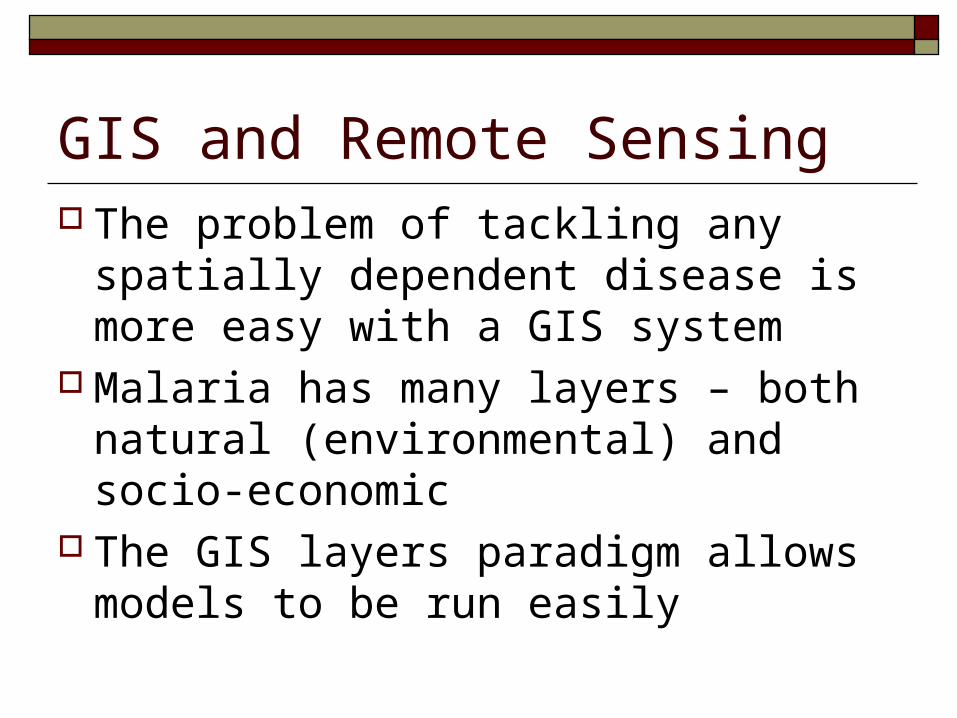
GIS and Remote Sensing The problem of tackling any spatially
dependent disease is more easy with a GIS system
Malaria has many layers – both natural (environmental) and socio-economic
The GIS layers paradigm allows models to be run easily
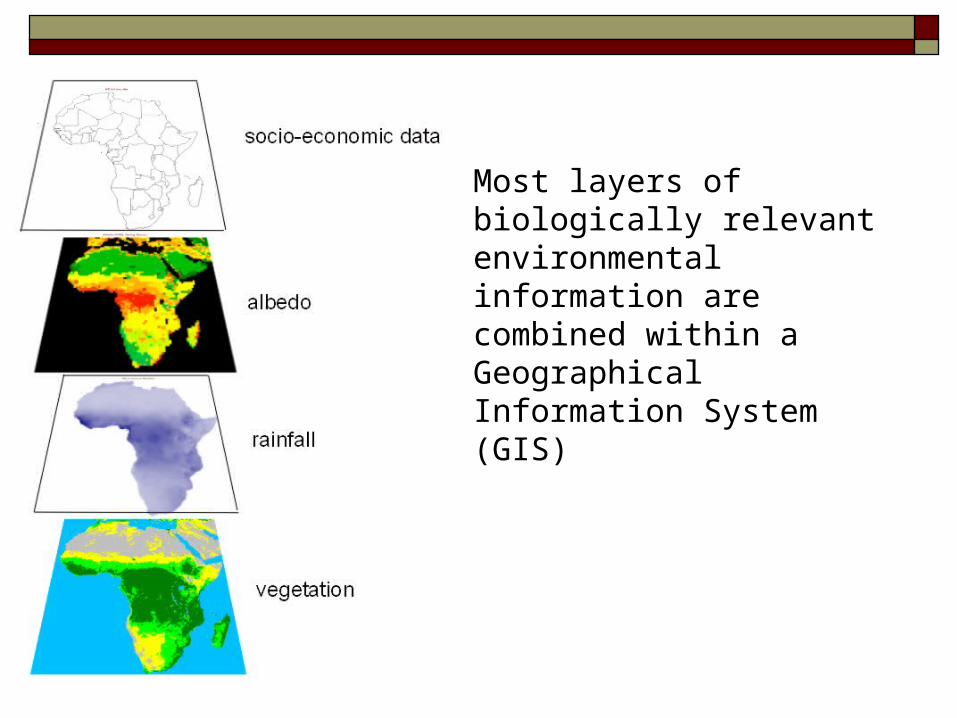
Most layers of biologically relevant environmental information are combined within a Geographical Information System (GIS)

NOAA-AVHRR
METEOSAT

Meteosat

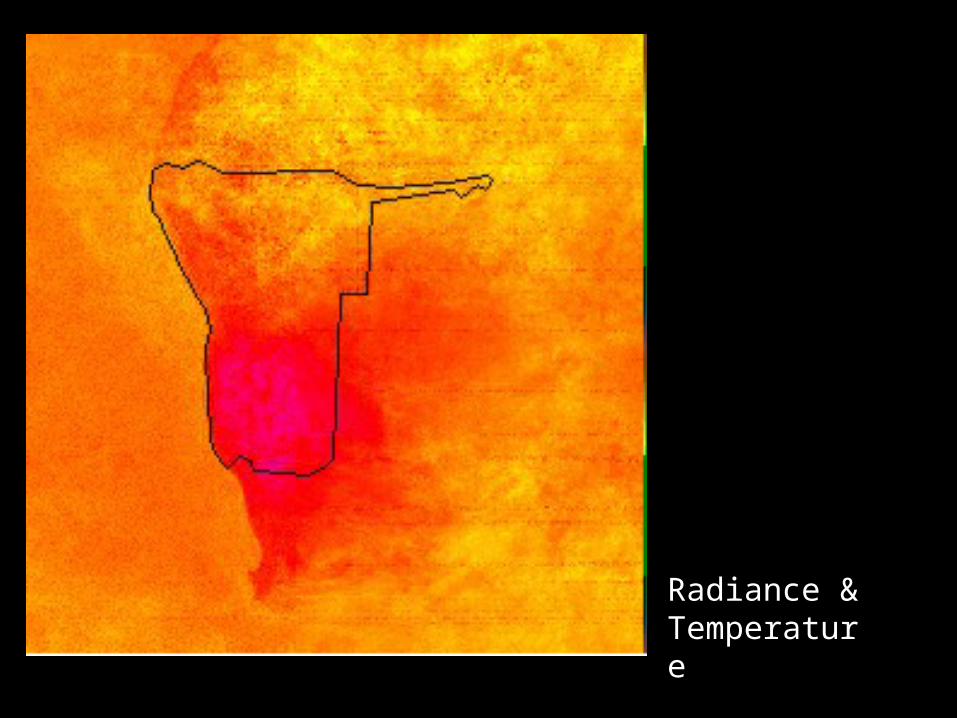
Radiance & Temperature
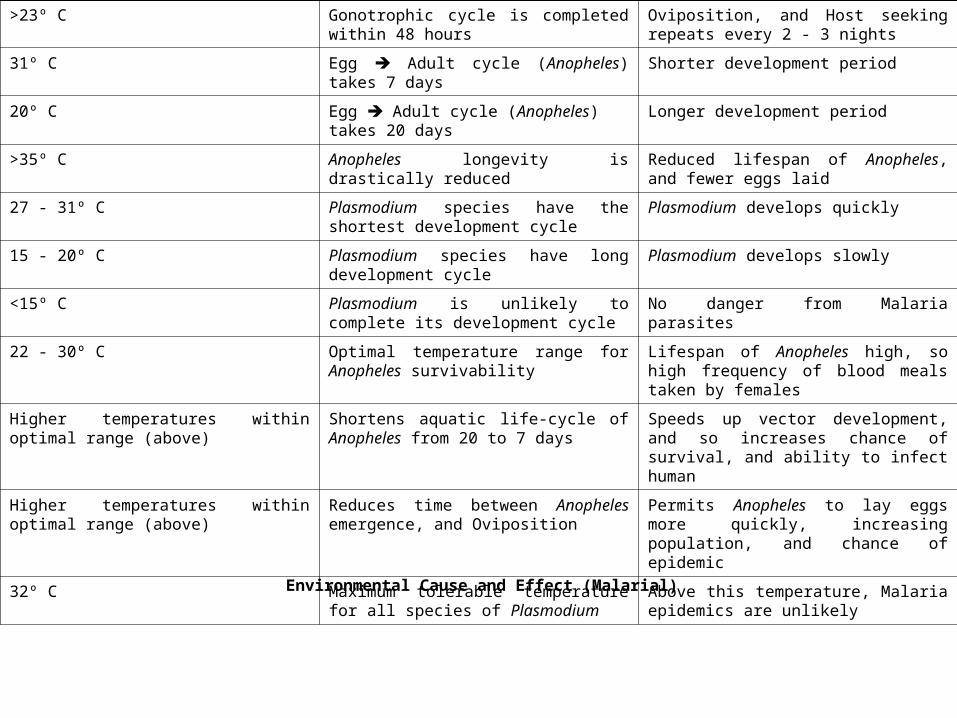
>23º C Gonotrophic cycle is completed within 48 hours
Oviposition, and Host seeking repeats every 2 - 3 nights
31º C Egg Adult cycle (Anopheles) takes 7 days Shorter development period
20º C Egg Adult cycle (Anopheles)takes 20 days
Longer development period
>35º C Anopheles longevity is drastically reduced Reduced lifespan of Anopheles, and fewer eggs laid
27 - 31º C Plasmodium species have the shortest development cycle
Plasmodium develops quickly
15 - 20º C Plasmodium species have long development cycle
Plasmodium develops slowly
<15º C Plasmodium is unlikely to complete its development cycle
No danger from Malaria parasites
22 - 30º C Optimal temperature range for Anopheles survivability
Lifespan of Anopheles high, so high frequency of blood meals taken by females
Higher temperatures within optimal range (above)
Shortens aquatic life-cycle of Anopheles from 20 to 7 days
Speeds up vector development, and so increases chance of survival, and ability to infect human
Higher temperatures within optimal range (above)
Reduces time between Anopheles emergence, and Oviposition
Permits Anopheles to lay eggs more quickly, increasing population, and chance of epidemic
32º C Maximum tolerable temperature for all species of Plasmodium
Above this temperature, Malaria epidemics are unlikely
Environmental Cause and Effect (Malarial)
Spatial & Temporal change Malaria transmission patterns follow
environmental conditions Spatial limits set by rainfall, temperature and
vegetation Seasonal nature of environmental factors
explains seasonal cyclicity of malaria Malaria “season” follows rainy season
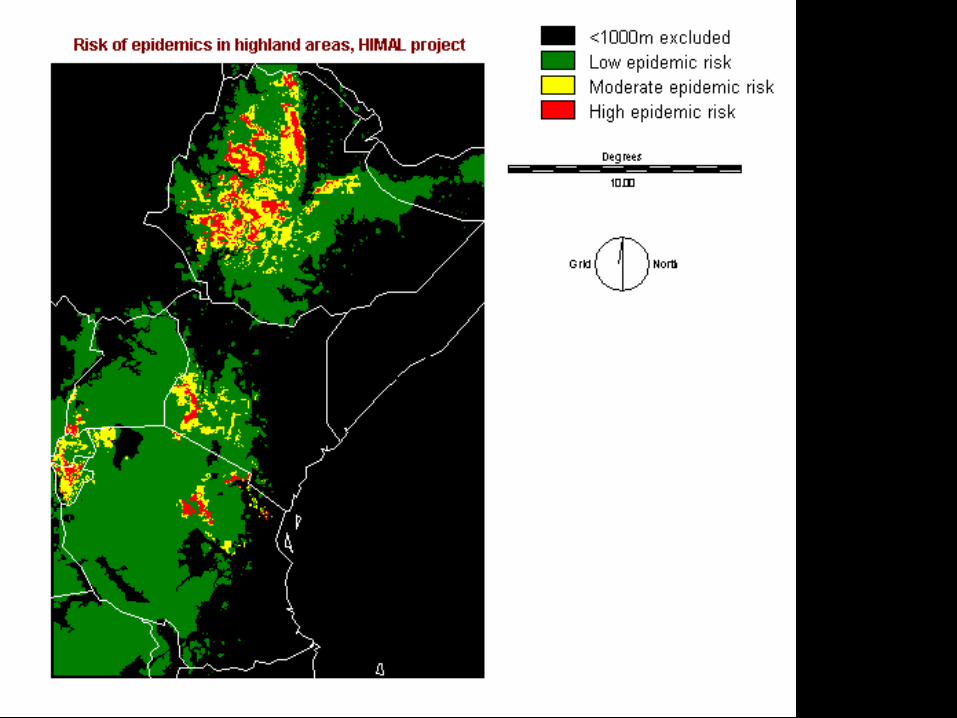
Risk Mapping We can use a GIS to host a combined risk
model using a number of relevant epidemiological equations – driven by remotely sensed data
Forecasts of possible outbreaks can be used to assist mitigation activities

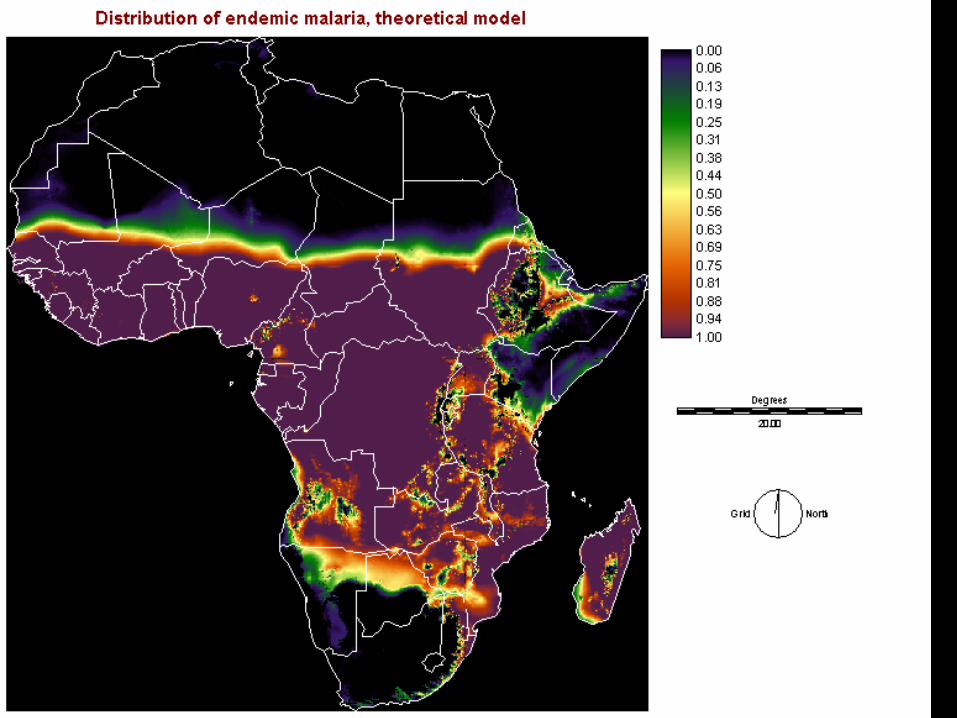
MARA Mapping Malaria Risk in Africa MARA/ARMA has provided the first
continental maps of malaria distribution and the first evidence-base burden of disease estimates
The Eco-System and Health Analysis Workshop (ESHAW) in West Africa has produced the first sub-continental malaria transmission risk map in 1999
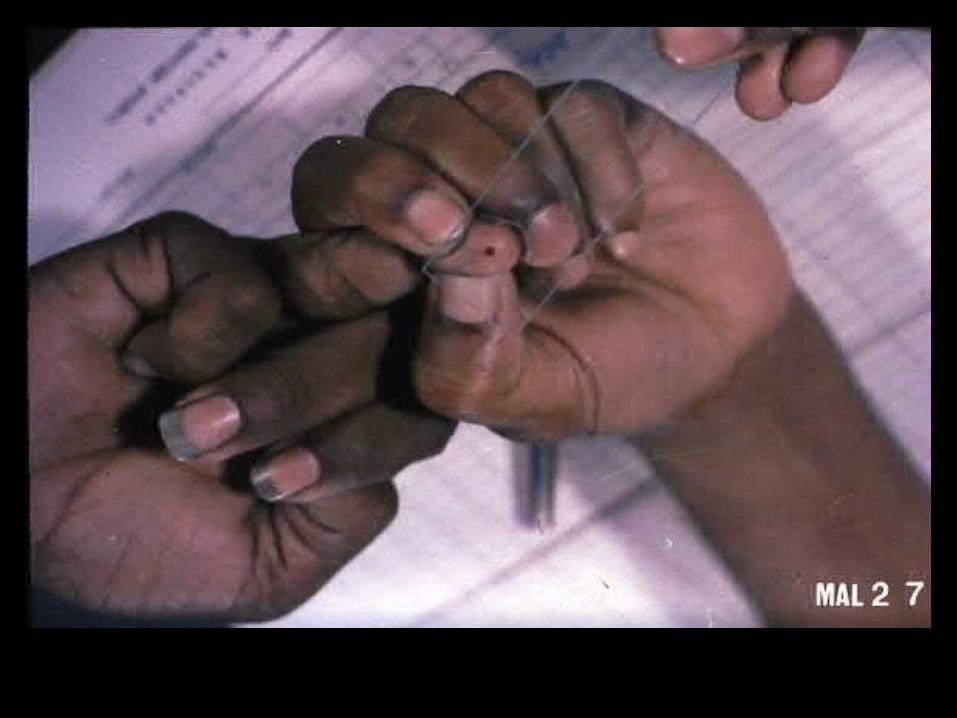
MARA Method Observed case data is collected from a wide a
geographical area as possible (historical records and newly generated data)
All data is georeferenced and inserted into a relational database
Geostatistical analyses are used in GIS linked to the database to create spatial queries
Independent models are used to create a variety of modelled indictors and risk factors
MARA Method Predictive modelling allows estimation of data in
areas where no empirical observations exist Where gaps exist, interpolation methods are used –
sometimes with environmental information as a means of weighting risk
Data used is primarily: Incidence Entomological Inoculation Rate (EIR) Parasite ratio (parasite prevalence)
MARA Method Objective is atlas providing seasonality,
endemicity and geographical specificity A hierarchy of spatial scales is used:
Continental scale (broad, climate based) Sub-continental (uses ecological zones) Regional or national scale (ecology and climate) 30 km2 scale at administrative units

The future….. Malaria Vaccine Initiative (MVI) Funded by Bill & Melinda Gates
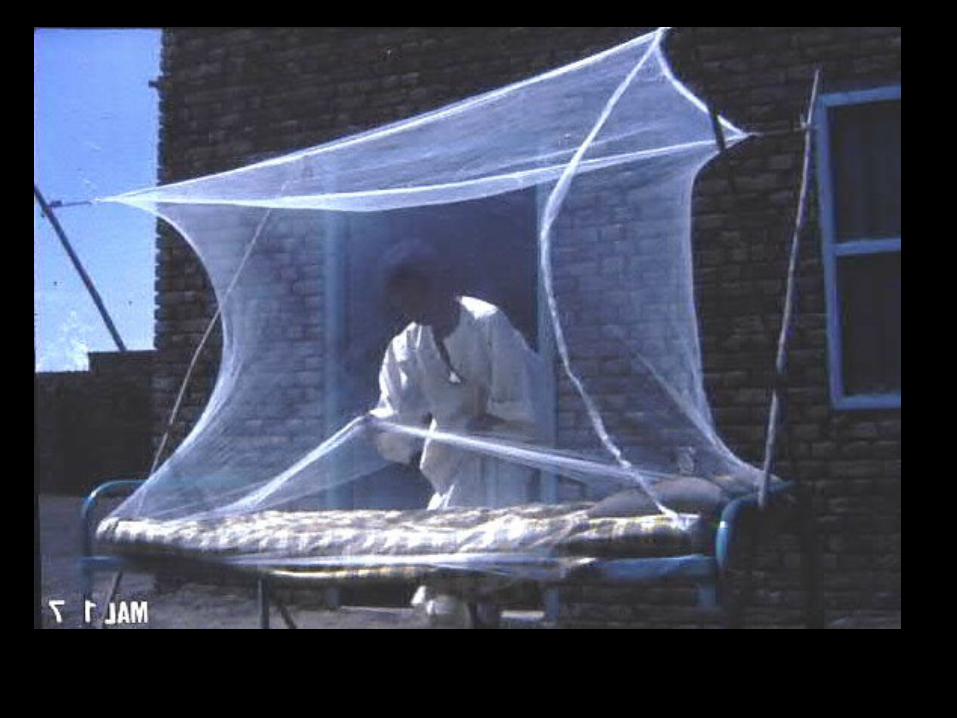
Artemesin based prophylactics Improved education Bednets and control meaures DDT spraying

Malaria Model prevalence and ERA rainfall
University of Liverpool


![Dr Mark Cresswell Statistical Forecasting [Part 1] 69EG6517 – Impacts & Models of Climate Change](https://img.pdfslide.net/doc/110x75/56649dc35503460f94ab5553/dr-mark-cresswell-statistical-forecasting-part-1-69eg6517-impacts-models.jpg)
![Dr Mark Cresswell Statistical Forecasting [Part 2] 69EG6517 – Impacts & Models of Climate Change](https://img.pdfslide.net/doc/110x75/56649f535503460f94c77c42/dr-mark-cresswell-statistical-forecasting-part-2-69eg6517-impacts-models.jpg)