Embed Size (px)
Citation preview
Market Opportunities in Commercial Real EstateGay CororatonSenior Economist, Director of Housing and Commercial ResearchNational Association of REALTORS®
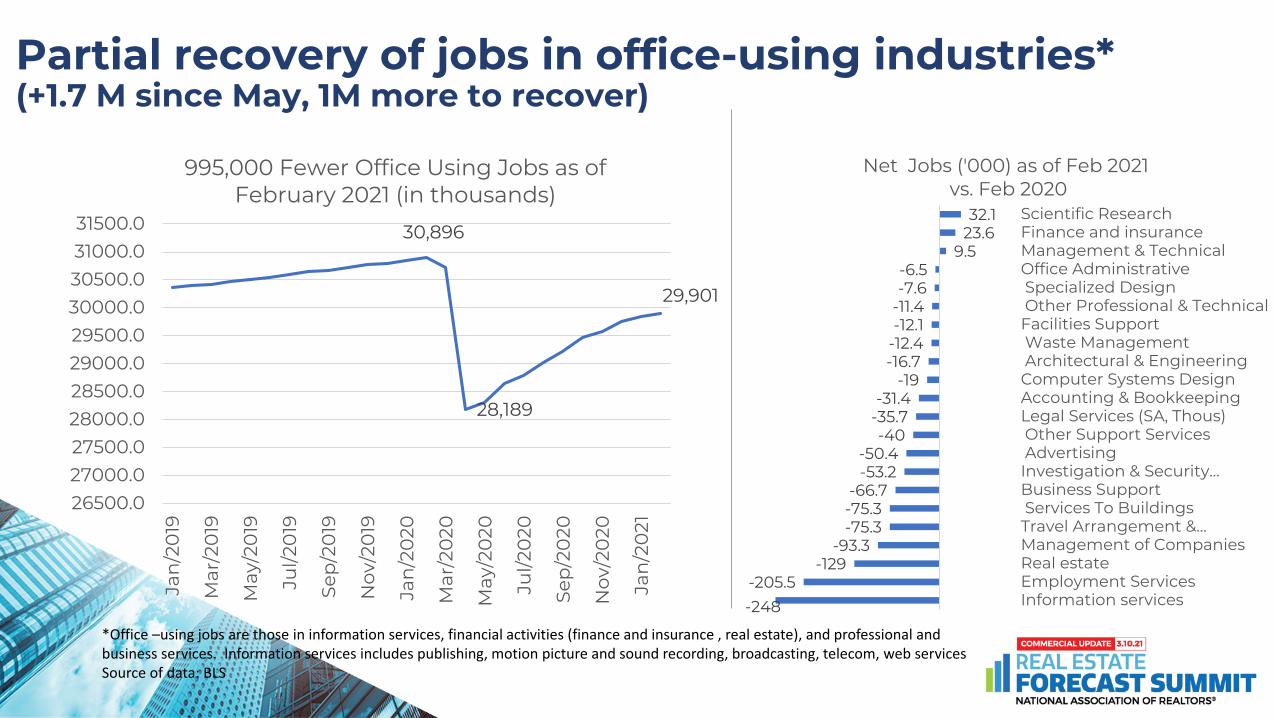
Partial recovery of jobs in office-using industries*(+1.7 M since May, 1M more to recover)
*Office –using jobs are those in information services, financial activities (finance and insurance , real estate), and professional and business services. Information services includes publishing, motion picture and sound recording, broadcasting, telecom, web servicesSource of data: BLS
30,896
28,189
29,901
26500.027000.027500.028000.028500.029000.029500.030000.030500.031000.031500.0
Jan
/20
19
Mar
/20
19
May
/20
19
Jul/2
019
Sep
/20
19
Nov
/20
19
Jan
/20
20
Mar
/20
20
May
/20
20
Jul/2
020
Sep
/20
20
Nov
/20
20
Jan
/20
21
995,000 Fewer Office Using Jobs as of February 2021 (in thousands)
-248-205.5
-129-93.3
-75.3-75.3-66.7
-53.2-50.4
-40-35.7-31.4
-19-16.7-12.4-12.1-11.4-7.6-6.5
9.523.632.1
Information servicesEmployment ServicesReal estateManagement of CompaniesTravel Arrangement &… Services To BuildingsBusiness SupportInvestigation & Security… Advertising Other Support ServicesLegal Services (SA, Thous)Accounting & BookkeepingComputer Systems Design Architectural & Engineering Waste ManagementFacilities Support Other Professional & Technical Specialized DesignOffice AdministrativeManagement & TechnicalFinance and insuranceScientific Research
Net Jobs ('000) as of Feb 2021vs. Feb 2020
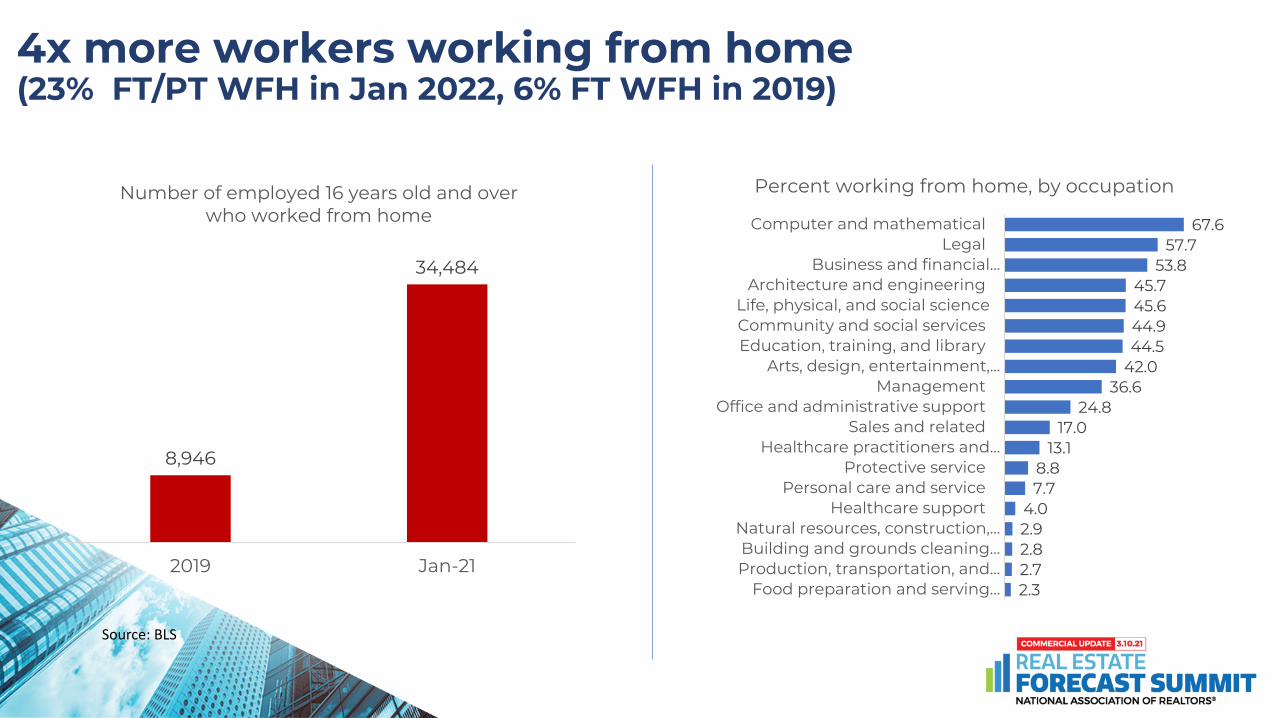
4x more workers working from home(23% FT/PT WFH in Jan 2022, 6% FT WFH in 2019)
Source: BLS
8,946
34,484
2019 Jan-21
Number of employed 16 years old and over who worked from home 67.6
57.753.8
45.745.644.944.5
42.036.6
24.817.0
13.18.87.7
4.02.92.82.72.3
Computer and mathematical Legal
Business and financial… Architecture and engineering
Life, physical, and social science Community and social services Education, training, and library
Arts, design, entertainment,… Management
Office and administrative support Sales and related
Healthcare practitioners and… Protective service
Personal care and service Healthcare support
Natural resources, construction,… Building and grounds cleaning…
Production, transportation, and… Food preparation and serving…
Percent working from home, by occupation
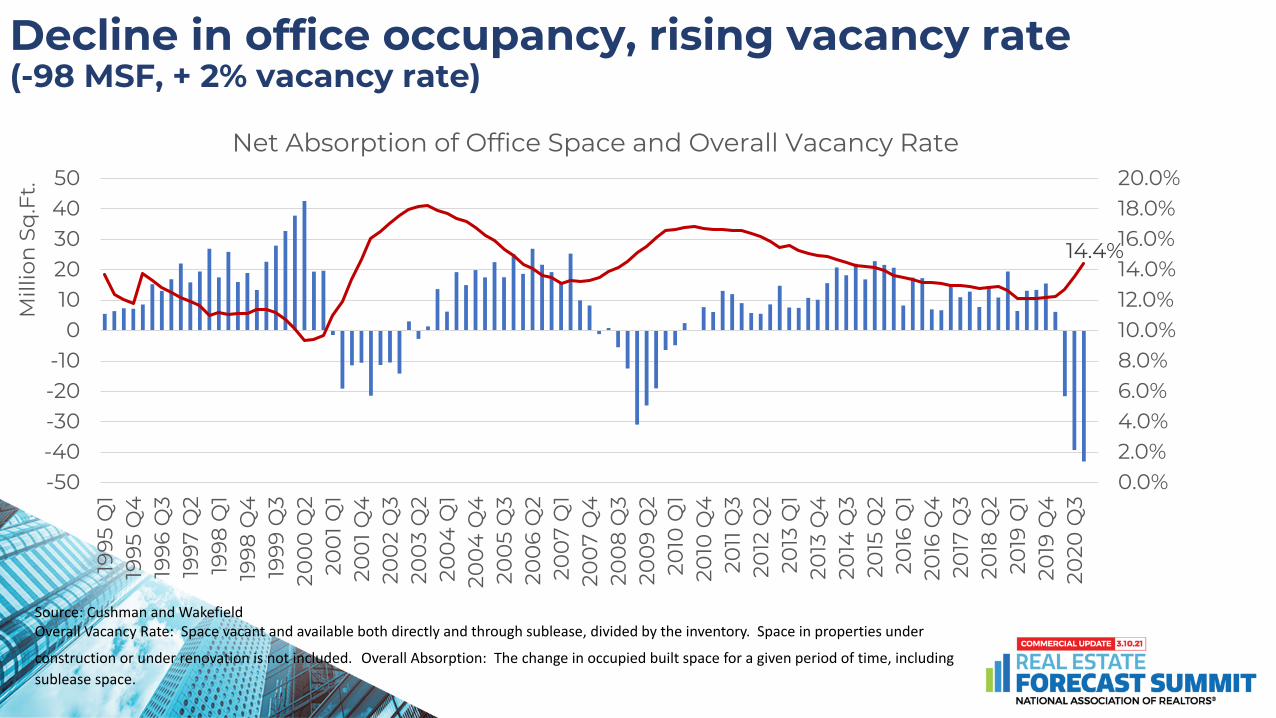
Decline in office occupancy, rising vacancy rate(-98 MSF, + 2% vacancy rate)
Source: Cushman and WakefieldOverall Vacancy Rate: Space vacant and available both directly and through sublease, divided by the inventory. Space in properties under
construction or under renovation is not included. Overall Absorption: The change in occupied built space for a given period of time, including sublease space.
14.4%
0.0%2.0%4.0%6.0%8.0%10.0%12.0%14.0%16.0%18.0%20.0%
-50-40-30-20-10
01020304050
1995
Q1
1995
Q4
1996
Q3
1997
Q2
1998
Q1
1998
Q4
1999
Q3
200
0 Q
220
01 Q
120
01 Q
420
02
Q3
200
3 Q
220
04
Q1
200
4 Q
420
05
Q3
200
6 Q
220
07
Q1
200
7 Q
420
08
Q3
200
9 Q
220
10 Q
120
10 Q
420
11 Q
320
12 Q
220
13 Q
120
13 Q
420
14 Q
320
15 Q
220
16 Q
120
16 Q
420
17 Q
320
18 Q
220
19 Q
120
19 Q
420
20 Q
3
Mill
ion
Sq
.Ft.
Net Absorption of Office Space and Overall Vacancy Rate
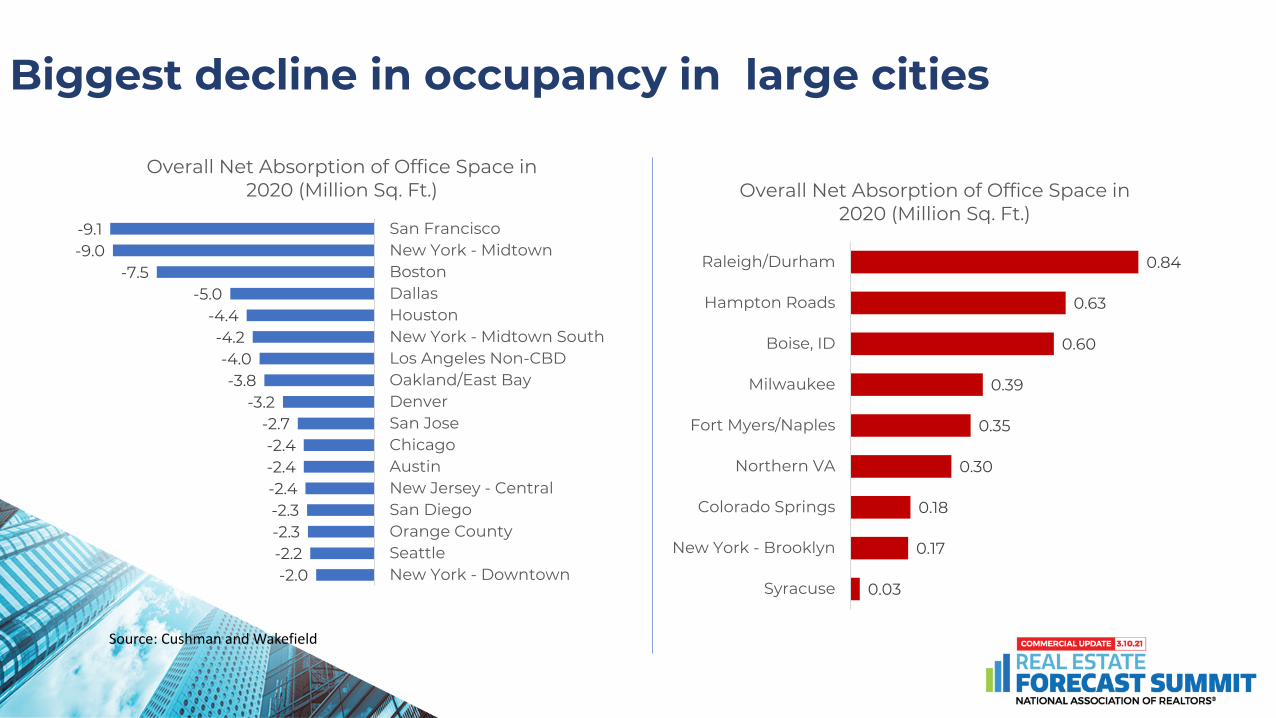
Biggest decline in occupancy in large cities
Source: Cushman and Wakefield
-2.0-2.2-2.3-2.3-2.4-2.4-2.4
-2.7-3.2
-3.8-4.0
-4.2-4.4
-5.0-7.5
-9.0-9.1
New York - DowntownSeattleOrange CountySan DiegoNew Jersey - CentralAustinChicagoSan JoseDenverOakland/East BayLos Angeles Non-CBDNew York - Midtown SouthHoustonDallasBostonNew York - MidtownSan Francisco
Overall Net Absorption of Office Space in 2020 (Million Sq. Ft.)
0.03
0.17
0.18
0.30
0.35
0.39
0.60
0.63
0.84
Syracuse
New York - Brooklyn
Colorado Springs
Northern VA
Fort Myers/Naples
Milwaukee
Boise, ID
Hampton Roads
Raleigh/Durham
Overall Net Absorption of Office Space in 2020 (Million Sq. Ft.)
Source: Cushman and Wakefield
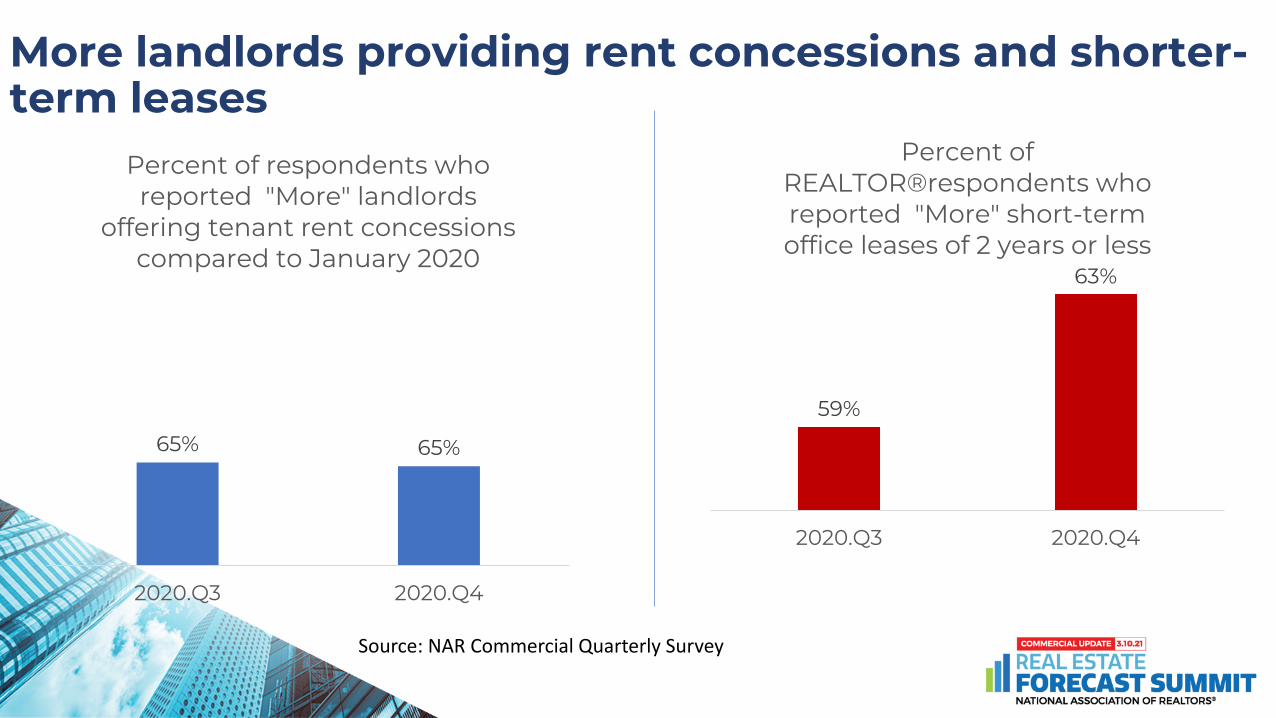
More landlords providing rent concessions and shorter-term leases
Source: NAR Commercial Quarterly Survey
65% 65%
2020.Q3 2020.Q4
Percent of respondents who reported "More" landlords
offering tenant rent concessions compared to January 2020
59%
63%
2020.Q3 2020.Q4
Percent of REALTOR®respondents who reported "More" short-term office leases of 2 years or less
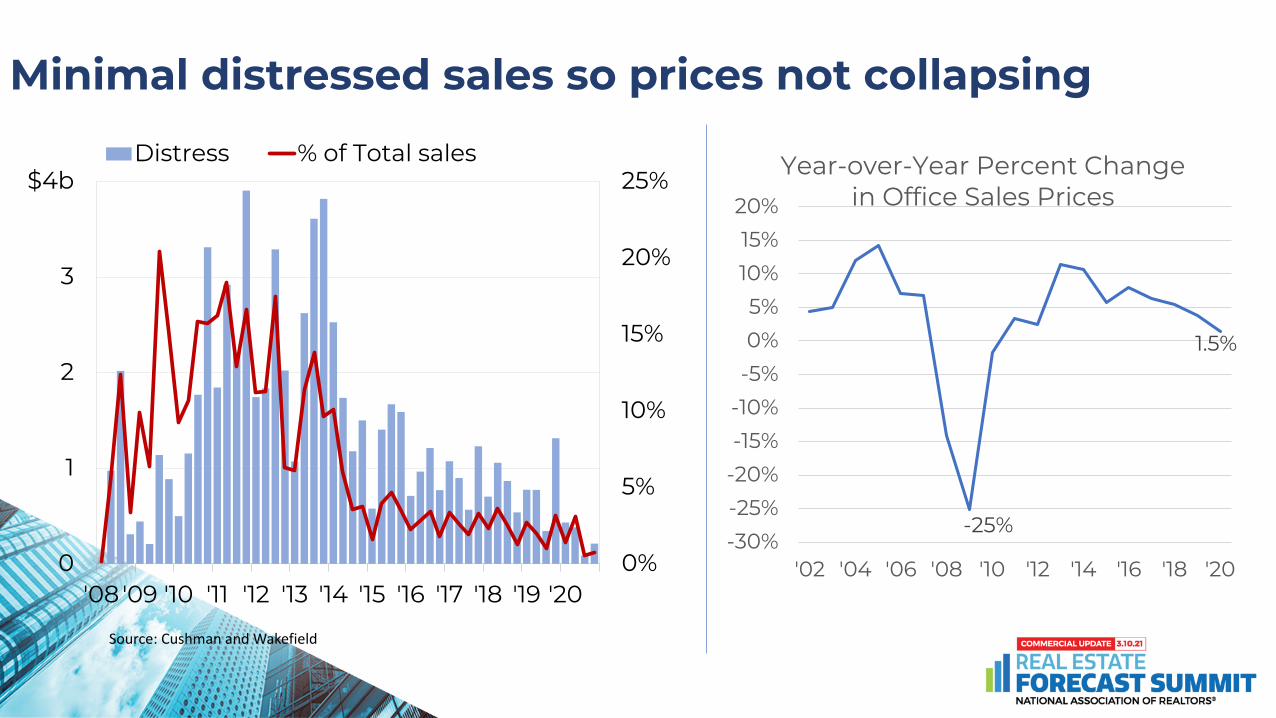
Minimal distressed sales so prices not collapsing
Source: Cushman and Wakefield
0%
5%
10%
15%
20%
25%
0
1
2
3
$4b
'08 '09 '10 '11 '12 '13 '14 '15 '16 '17 '18 '19 '20
Distress % of Total sales
-25%
1.5%
-30%-25%-20%-15%-10%-5%0%5%
10%15%
20%
'02 '04 '06 '08 '10 '12 '14 '16 '18 '20
Year-over-Year Percent Change in Office Sales Prices
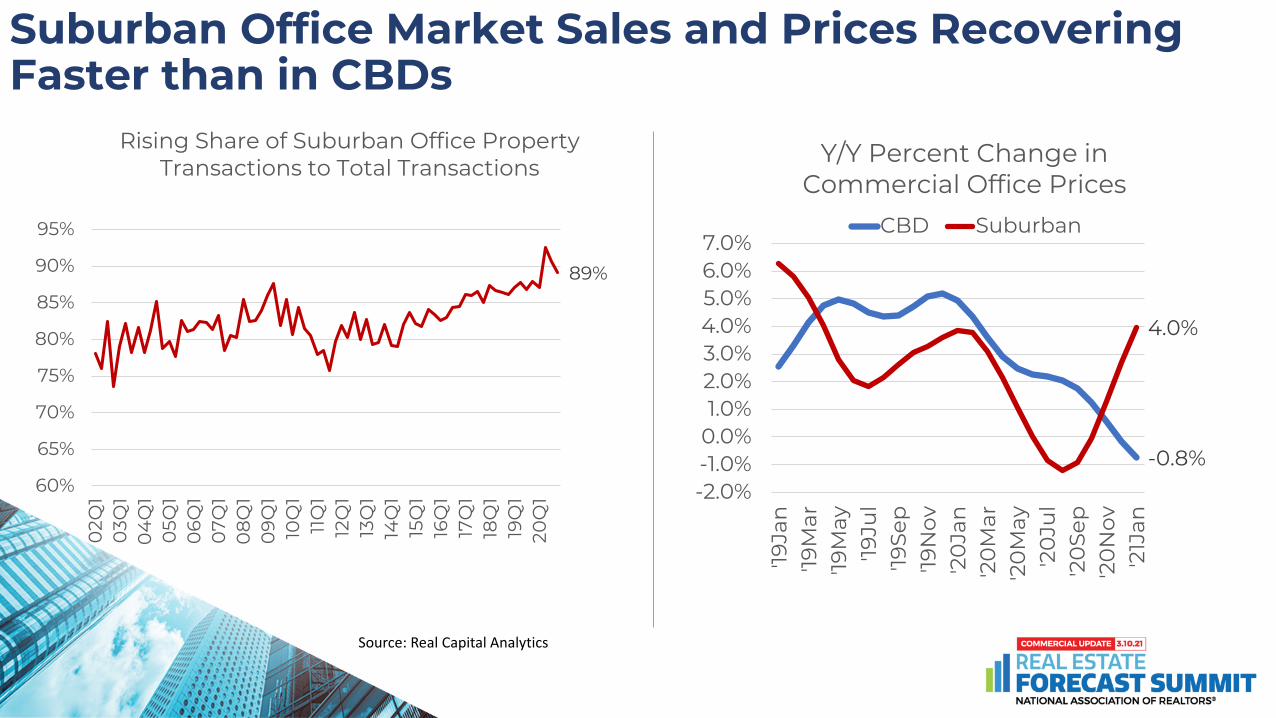
Suburban Office Market Sales and Prices Recovering Faster than in CBDs
Source: Real Capital Analytics
89%
60%
65%
70%
75%
80%
85%
90%
95%
02Q
10
3Q1
04
Q1
05Q
10
6Q1
07Q
10
8Q1
09Q
110
Q1
11Q
112
Q1
13Q
114
Q1
15Q
116
Q1
17Q
118
Q1
19Q
120
Q1
Rising Share of Suburban Office Property Transactions to Total Transactions
-0.8%
4.0%
-2.0%-1.0%0.0%1.0%2.0%3.0%4.0%5.0%6.0%7.0%
'19Ja
n'19
Mar
'19M
ay'19
Jul
'19Se
p'19
Nov
'20
Jan
'20
Mar
'20
May
'20
Jul
'20
Sep
'20
Nov
'21J
an
Y/Y Percent Change in Commercial Office Prices
CBD Suburban
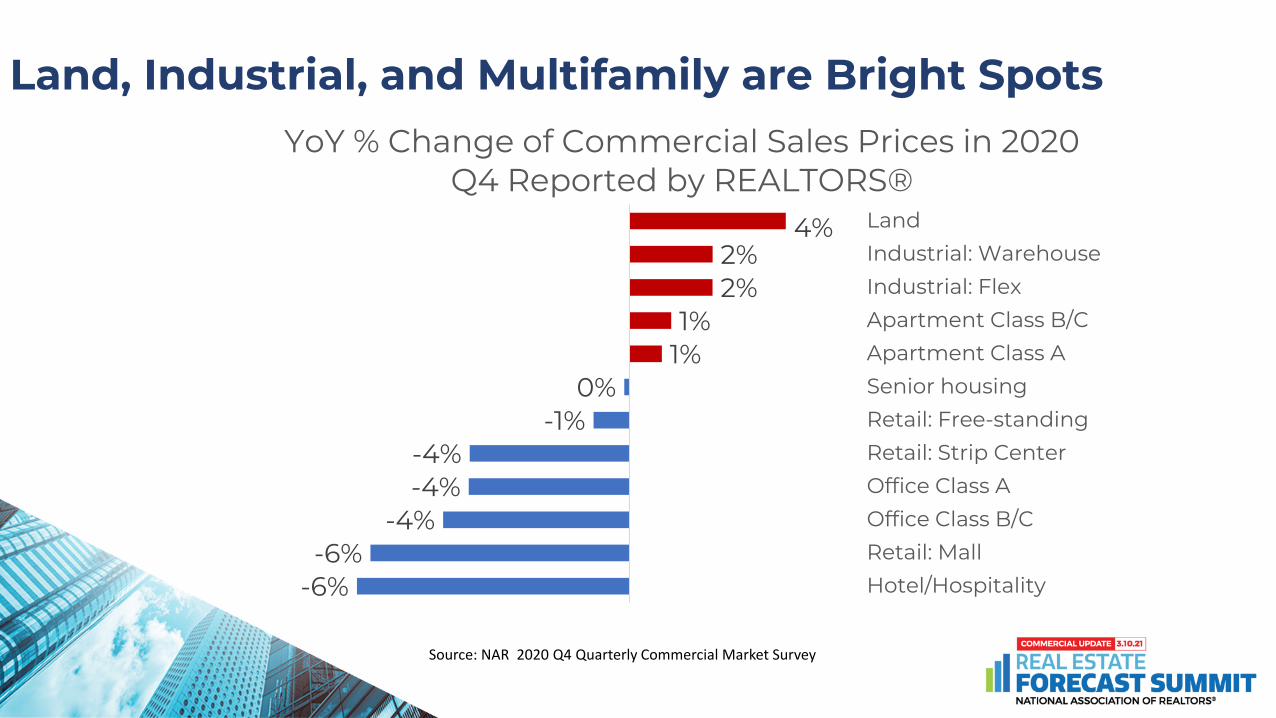
Land, Industrial, and Multifamily are Bright Spots
Source: NAR 2020 Q4 Quarterly Commercial Market Survey
-6%-6%
-4%-4%-4%
-1%0%
1%1%
2%2%
4%
Hotel/HospitalityRetail: MallOffice Class B/COffice Class ARetail: Strip CenterRetail: Free-standingSenior housingApartment Class AApartment Class B/CIndustrial: FlexIndustrial: WarehouseLand
YoY % Change of Commercial Sales Prices in 2020 Q4 Reported by REALTORS®
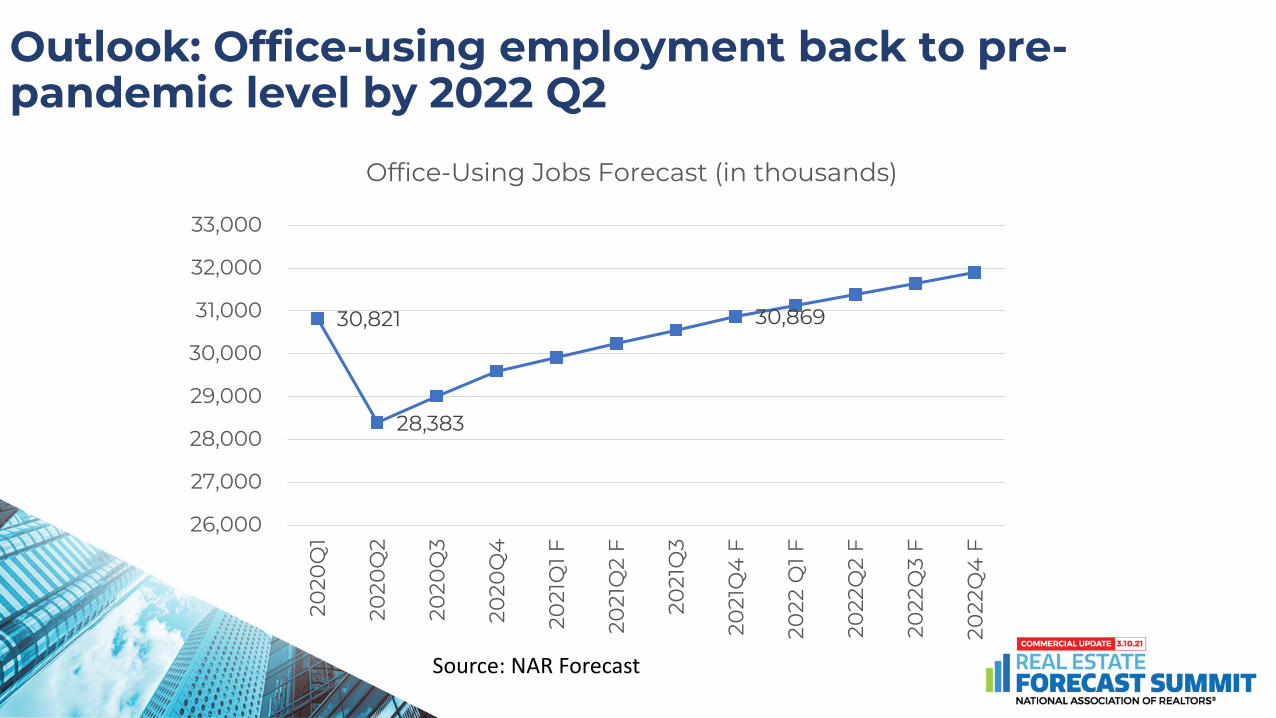
Outlook: Office-using employment back to pre-pandemic level by 2022 Q2
Source: NAR Forecast
30,821
28,383
30,869
26,000
27,000
28,000
29,000
30,000
31,000
32,000
33,000
2020
Q1
2020
Q2
2020
Q3
2020
Q4
20
21Q
1 F
2021
Q2
F
2021
Q3
2021
Q4
F
2022
Q1 F
2022
Q2
F
2022
Q3
F
2022
Q4
F
Office-Using Jobs Forecast (in thousands)
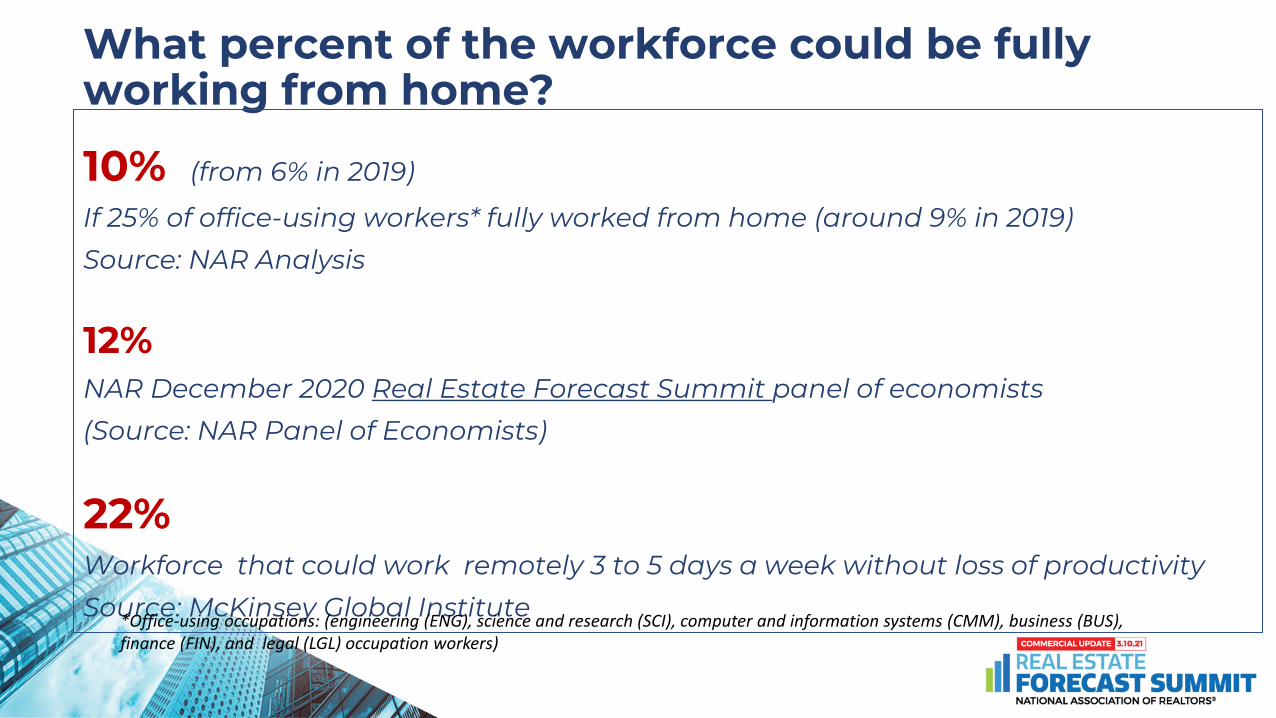
What percent of the workforce could be fully working from home?
10% (from 6% in 2019)
If 25% of office-using workers* fully worked from home (around 9% in 2019)Source: NAR Analysis
12%NAR December 2020 Real Estate Forecast Summit panel of economists (Source: NAR Panel of Economists)
22%Workforce that could work remotely 3 to 5 days a week without loss of productivitySource: McKinsey Global Institute*Office-using occupations: (engineering (ENG), science and research (SCI), computer and information systems (CMM), business (BUS),
finance (FIN), and legal (LGL) occupation workers)
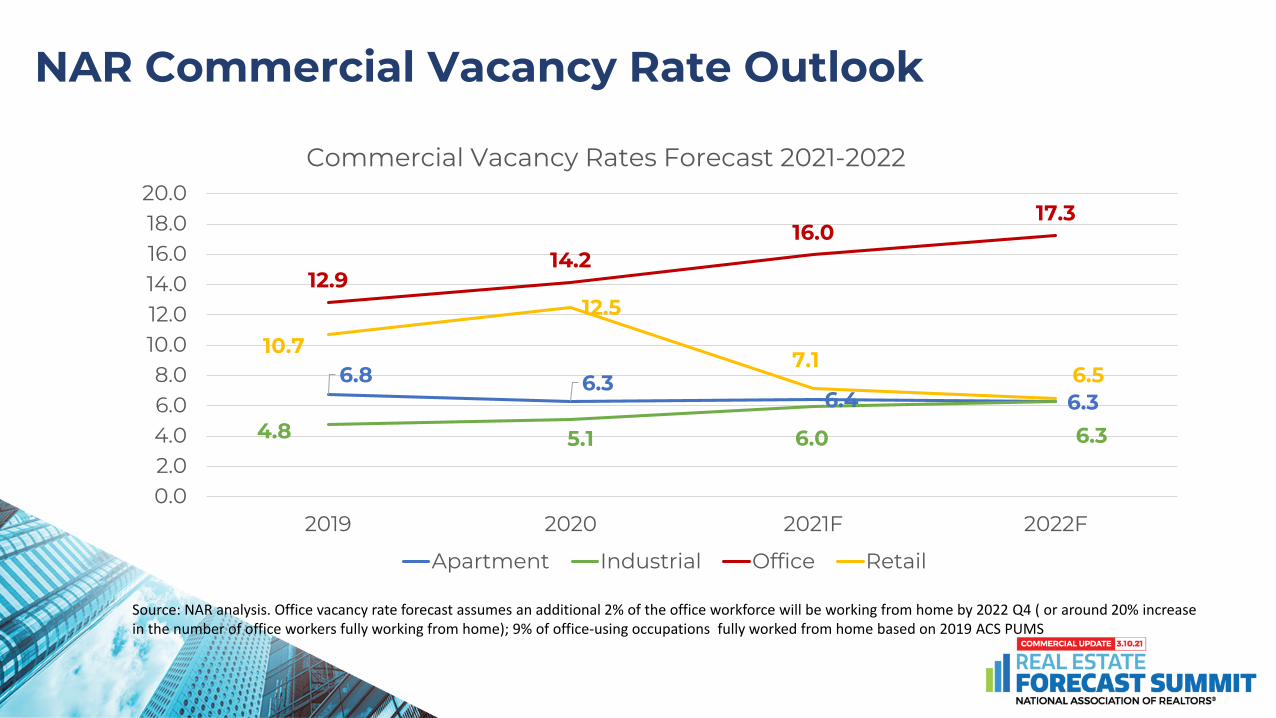
NAR Commercial Vacancy Rate Outlook
Source: NAR analysis. Office vacancy rate forecast assumes an additional 2% of the office workforce will be working from home by 2022 Q4 ( or around 20% increase in the number of office workers fully working from home); 9% of office-using occupations fully worked from home based on 2019 ACS PUMS
6.8 6.36.4 6.3
4.8 5.1 6.0 6.3
12.914.2
16.017.3
10.7
12.5
7.16.5
0.02.04.06.08.0
10.012.014.016.018.020.0
2019 2020 2021F 2022F
Commercial Vacancy Rates Forecast 2021-2022
Apartment Industrial Office Retail
Source: NAR
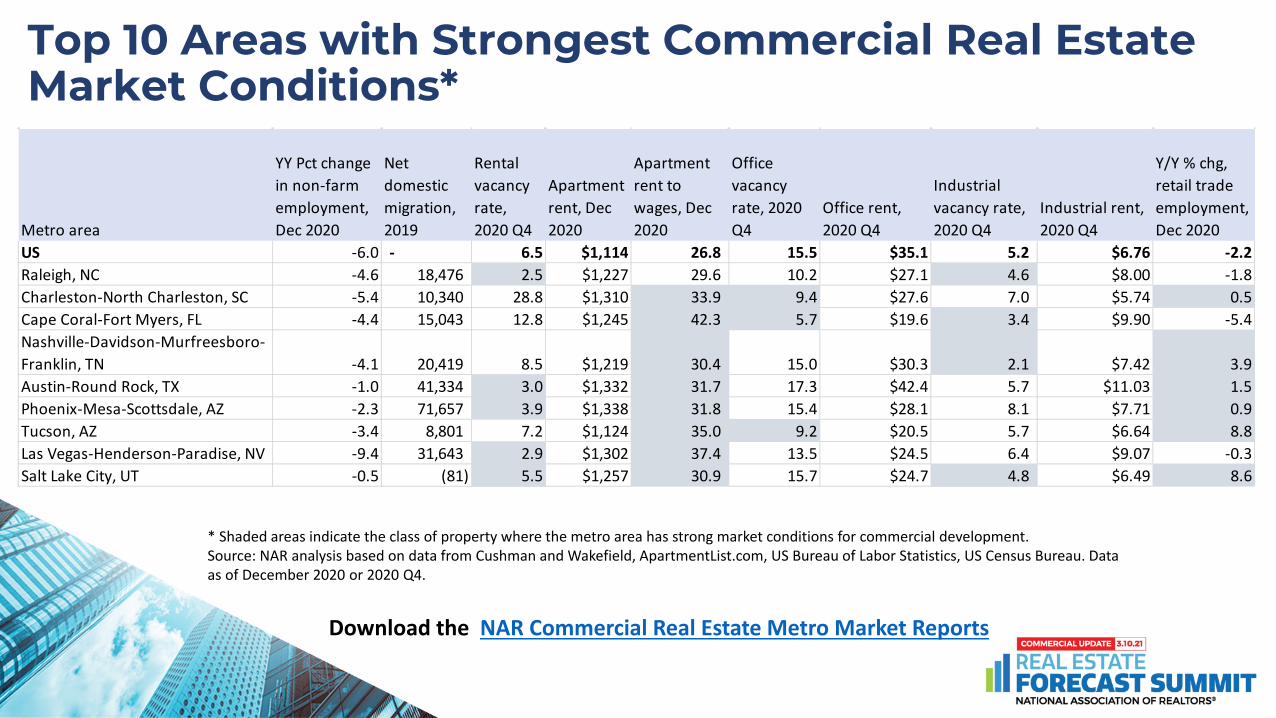
* Shaded areas indicate the class of property where the metro area has strong market conditions for commercial development.Source: NAR analysis based on data from Cushman and Wakefield, ApartmentList.com, US Bureau of Labor Statistics, US Census Bureau. Data as of December 2020 or 2020 Q4.
Top 10 Areas with Strongest Commercial Real Estate Market Conditions*
Download the NAR Commercial Real Estate Metro Market Reports
Metro area
YY Pct change in non-farm employment, Dec 2020
Net domestic migration, 2019
Rental vacancy rate, 2020 Q4
Apartment rent, Dec 2020
Apartment rent to wages, Dec 2020
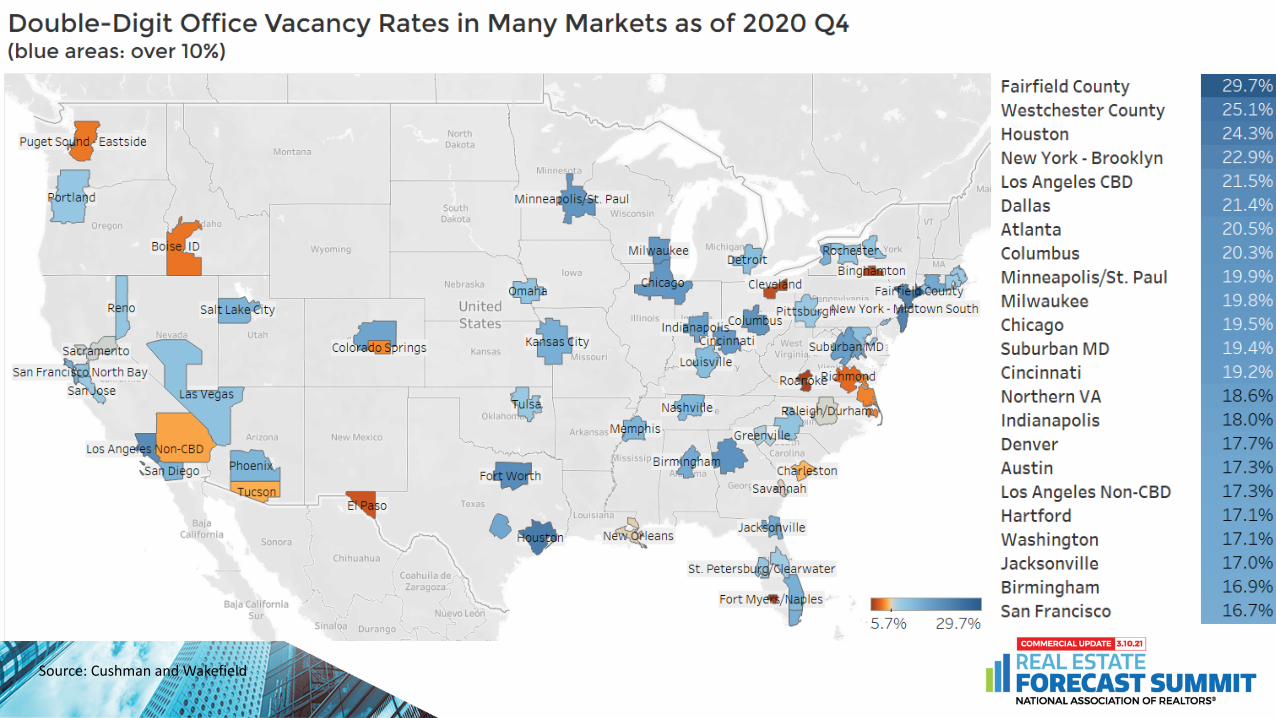
Office vacancy rate, 2020 Q4
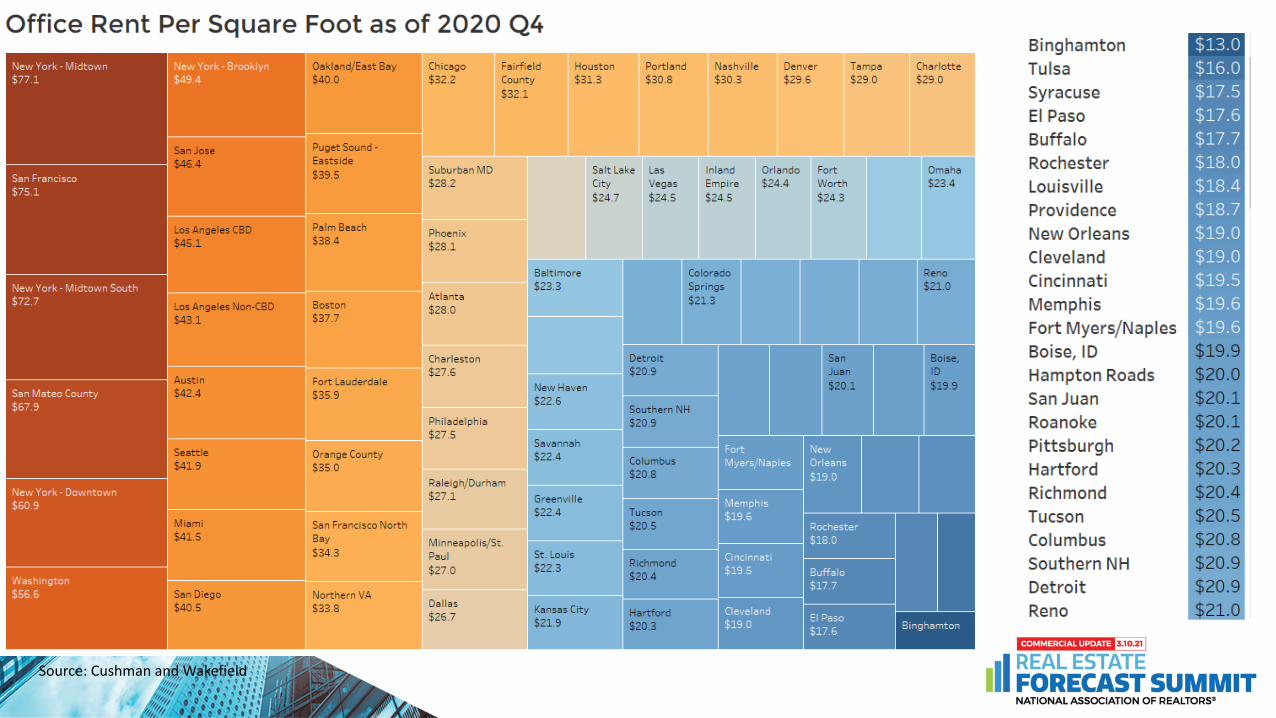
Office rent, 2020 Q4
Industrial vacancy rate, 2020 Q4
Industrial rent, 2020 Q4
Y/Y % chg, retail trade employment, Dec 2020
US -6.0 - 6.5 $1,114 26.8 15.5 $35.1 5.2 $6.76 -2.2Raleigh, NC -4.6 18,476 2.5 $1,227 29.6 10.2 $27.1 4.6 $8.00 -1.8Charleston-North Charleston, SC -5.4 10,340 28.8 $1,310 33.9 9.4 $27.6 7.0 $5.74 0.5Cape Coral-Fort Myers, FL -4.4 15,043 12.8 $1,245 42.3 5.7 $19.6 3.4 $9.90 -5.4Nashville-Davidson-Murfreesboro-Franklin, TN -4.1 20,419 8.5 $1,219 30.4 15.0 $30.3 2.1 $7.42 3.9Austin-Round Rock, TX -1.0 41,334 3.0 $1,332 31.7 17.3 $42.4 5.7 $11.03 1.5Phoenix-Mesa-Scottsdale, AZ -2.3 71,657 3.9 $1,338 31.8 15.4 $28.1 8.1 $7.71 0.9Tucson, AZ -3.4 8,801 7.2 $1,124 35.0 9.2 $20.5 5.7 $6.64 8.8Las Vegas-Henderson-Paradise, NV -9.4 31,643 2.9 $1,302 37.4 13.5 $24.5 6.4 $9.07 -0.3Salt Lake City, UT -0.5 (81) 5.5 $1,257 30.9 15.7 $24.7 4.8 $6.49 8.6


APPENDIX:MARKET DATA
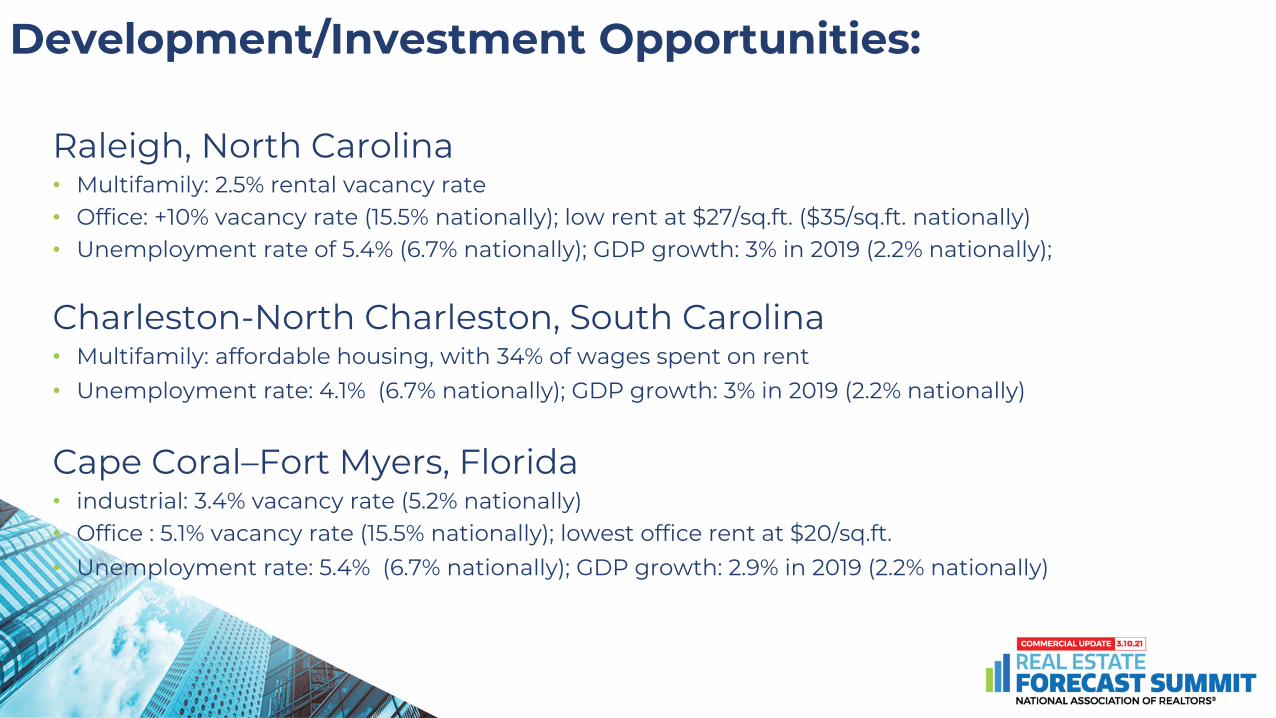
Development/Investment Opportunities:
Raleigh, North Carolina• Multifamily: 2.5% rental vacancy rate• Office: +10% vacancy rate (15.5% nationally); low rent at $27/sq.ft. ($35/sq.ft. nationally)• Unemployment rate of 5.4% (6.7% nationally); GDP growth: 3% in 2019 (2.2% nationally);
Charleston-North Charleston, South Carolina• Multifamily: affordable housing, with 34% of wages spent on rent• Unemployment rate: 4.1% (6.7% nationally); GDP growth: 3% in 2019 (2.2% nationally)
Cape Coral–Fort Myers, Florida• industrial: 3.4% vacancy rate (5.2% nationally) • Office : 5.1% vacancy rate (15.5% nationally); lowest office rent at $20/sq.ft. • Unemployment rate: 5.4% (6.7% nationally); GDP growth: 2.9% in 2019 (2.2% nationally)
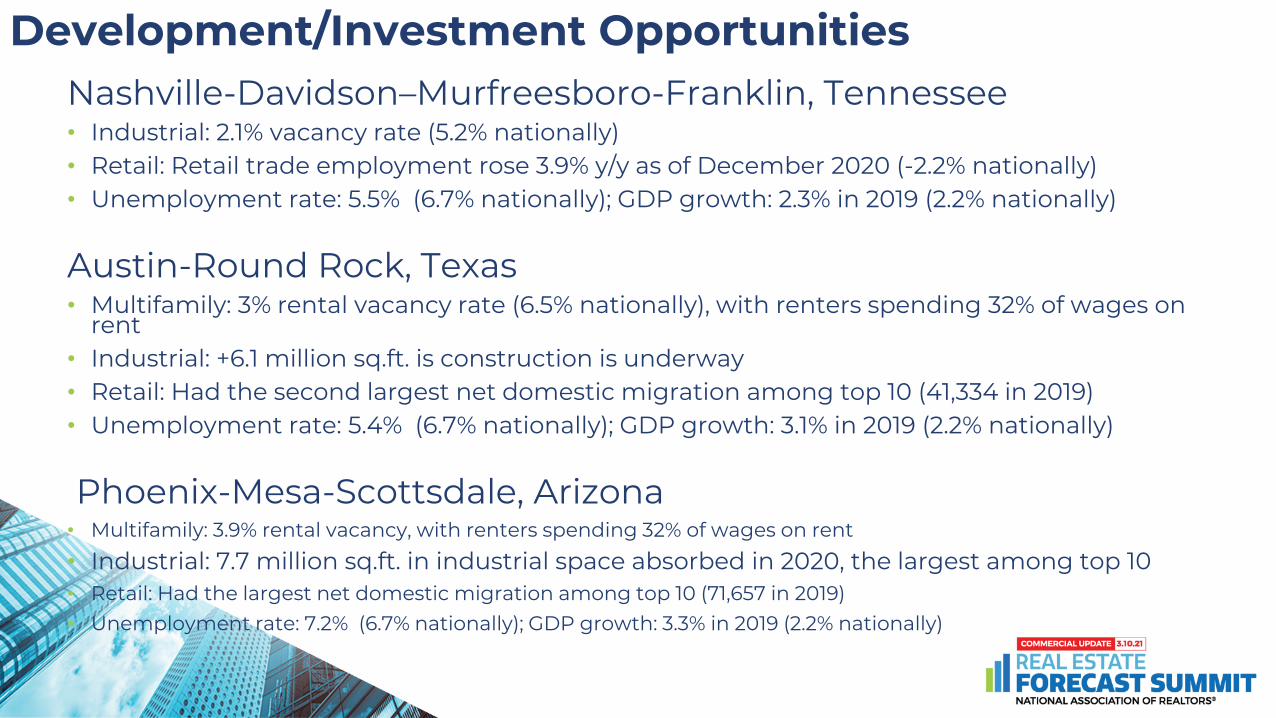
Development/Investment Opportunities Nashville-Davidson–Murfreesboro-Franklin, Tennessee• Industrial: 2.1% vacancy rate (5.2% nationally)• Retail: Retail trade employment rose 3.9% y/y as of December 2020 (-2.2% nationally)• Unemployment rate: 5.5% (6.7% nationally); GDP growth: 2.3% in 2019 (2.2% nationally)
Austin-Round Rock, Texas • Multifamily: 3% rental vacancy rate (6.5% nationally), with renters spending 32% of wages on
rent• Industrial: +6.1 million sq.ft. is construction is underway• Retail: Had the second largest net domestic migration among top 10 (41,334 in 2019)• Unemployment rate: 5.4% (6.7% nationally); GDP growth: 3.1% in 2019 (2.2% nationally)
Phoenix-Mesa-Scottsdale, Arizona• Multifamily: 3.9% rental vacancy, with renters spending 32% of wages on rent
• Industrial: 7.7 million sq.ft. in industrial space absorbed in 2020, the largest among top 10• Retail: Had the largest net domestic migration among top 10 (71,657 in 2019)• Unemployment rate: 7.2% (6.7% nationally); GDP growth: 3.3% in 2019 (2.2% nationally)
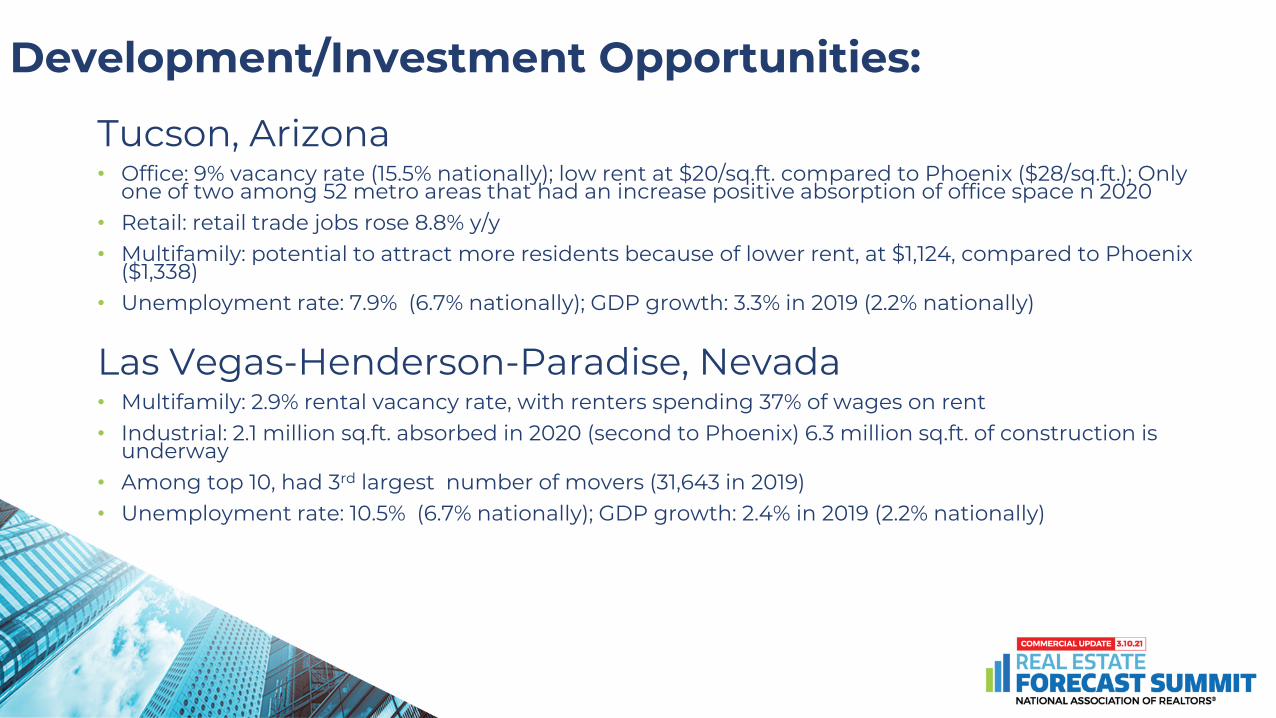
Development/Investment Opportunities:
Tucson, Arizona• Office: 9% vacancy rate (15.5% nationally); low rent at $20/sq.ft. compared to Phoenix ($28/sq.ft.); Only
one of two among 52 metro areas that had an increase positive absorption of office space n 2020 • Retail: retail trade jobs rose 8.8% y/y • Multifamily: potential to attract more residents because of lower rent, at $1,124, compared to Phoenix
($1,338)• Unemployment rate: 7.9% (6.7% nationally); GDP growth: 3.3% in 2019 (2.2% nationally)
Las Vegas-Henderson-Paradise, Nevada • Multifamily: 2.9% rental vacancy rate, with renters spending 37% of wages on rent• Industrial: 2.1 million sq.ft. absorbed in 2020 (second to Phoenix) 6.3 million sq.ft. of construction is
underway• Among top 10, had 3rd largest number of movers (31,643 in 2019)• Unemployment rate: 10.5% (6.7% nationally); GDP growth: 2.4% in 2019 (2.2% nationally)
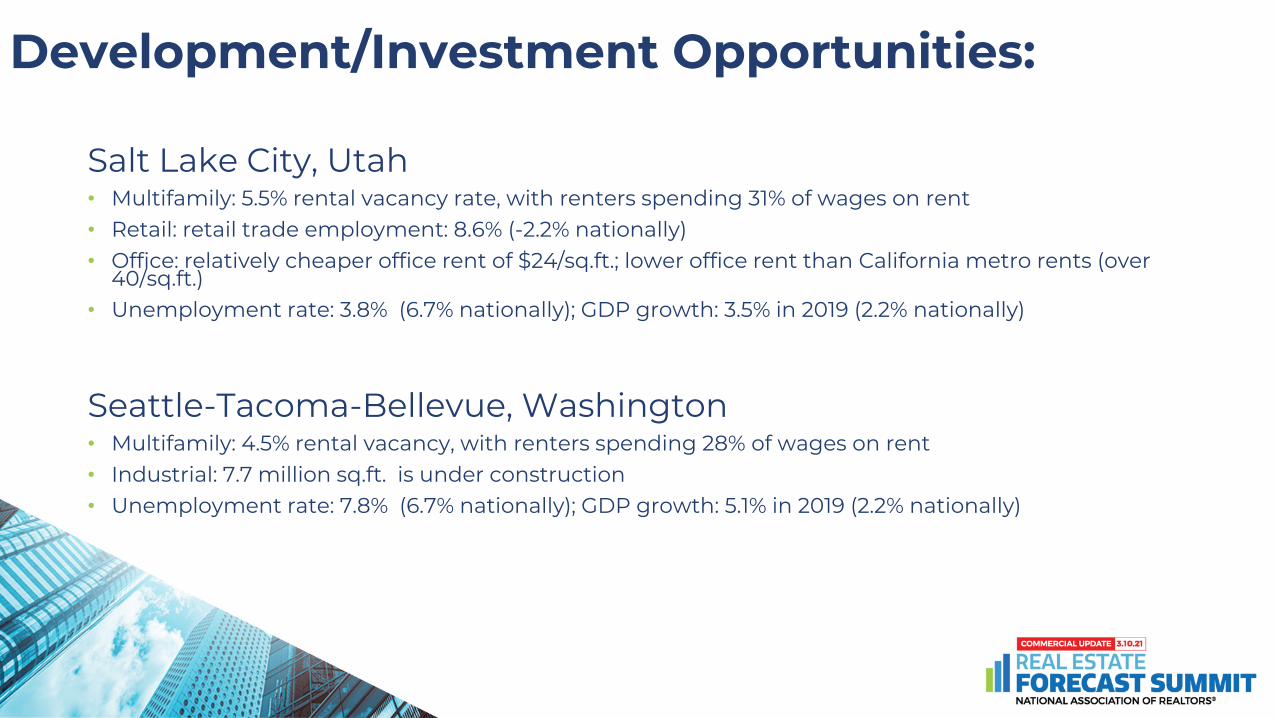
Development/Investment Opportunities:
Salt Lake City, Utah• Multifamily: 5.5% rental vacancy rate, with renters spending 31% of wages on rent• Retail: retail trade employment: 8.6% (-2.2% nationally)• Office: relatively cheaper office rent of $24/sq.ft.; lower office rent than California metro rents (over
40/sq.ft.)• Unemployment rate: 3.8% (6.7% nationally); GDP growth: 3.5% in 2019 (2.2% nationally)
Seattle-Tacoma-Bellevue, Washington• Multifamily: 4.5% rental vacancy, with renters spending 28% of wages on rent • Industrial: 7.7 million sq.ft. is under construction• Unemployment rate: 7.8% (6.7% nationally); GDP growth: 5.1% in 2019 (2.2% nationally)
Source: Cushman and Wakefield
Source: Cushman and Wakefield
Source: Cushman and Wakefield
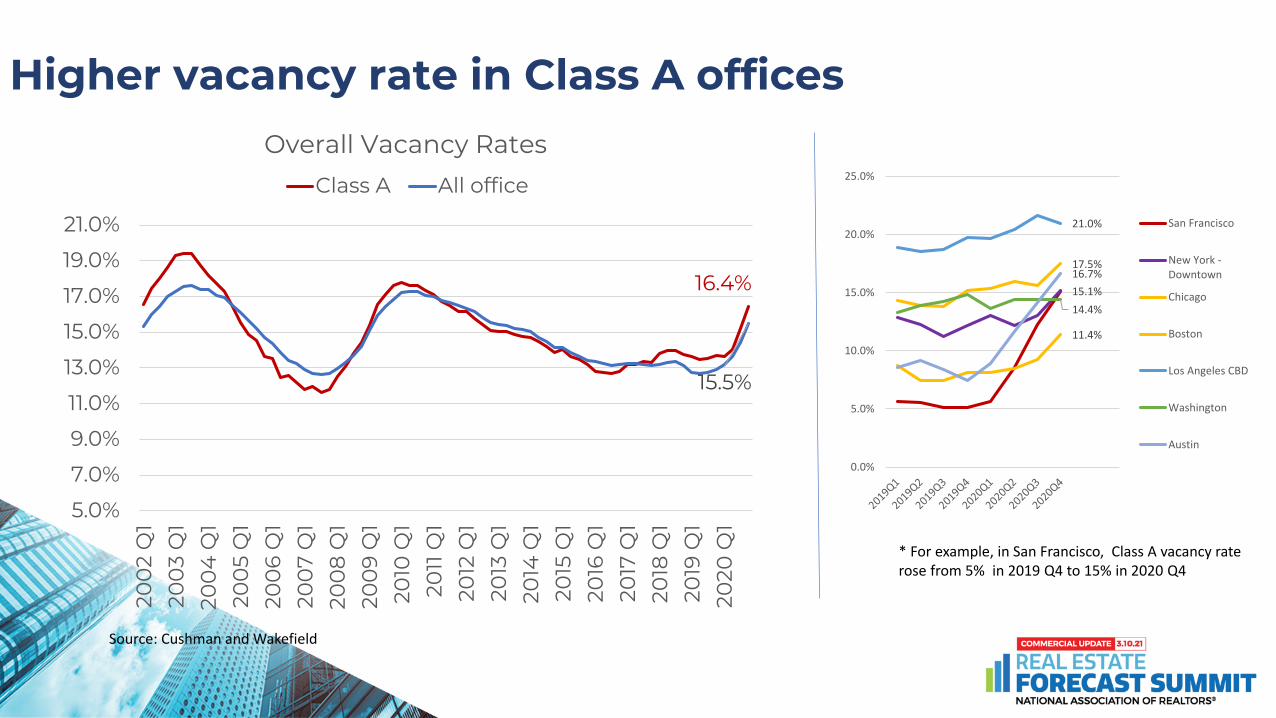
Higher vacancy rate in Class A offices
Source: Cushman and Wakefield
16.4%
15.5%
5.0%
7.0%
9.0%
11.0%
13.0%
15.0%
17.0%
19.0%
21.0%
200
2 Q
120
03
Q1
200
4 Q
120
05
Q1
200
6 Q
120
07
Q1
200
8 Q
120
09
Q1
2010
Q1
2011
Q1
2012
Q1
2013
Q1
2014
Q1
2015
Q1
2016
Q1
2017
Q1
2018
Q1
2019
Q1
2020
Q1
Overall Vacancy RatesClass A All office
* For example, in San Francisco, Class A vacancy rate rose from 5% in 2019 Q4 to 15% in 2020 Q4
15.1%
17.5%
11.4%
21.0%
14.4%
16.7%
0.0%
5.0%
10.0%
15.0%
20.0%
25.0%
San Francisco
New York -Downtown
Chicago
Boston
Los Angeles CBD
Washington
Austin


![Welcome [greateroshkosh.com] · Real Estate Cost Analysis Real Estate Cost Analysis Cost Segregation (New Buildings) Commercial Energy Efficiency Deduction (179D) P Create Opportunities](https://img.pdfslide.net/doc/110x75/5f086ea97e708231d421fbc9/welcome-real-estate-cost-analysis-real-estate-cost-analysis-cost-segregation.jpg)