Embed Size (px)
Citation preview
7/31/2019 Market Outlook 100712
http://slidepdf.com/reader/full/market-outlook-100712 1/14
Market Outlook July 10, 2012
www.angelbroking.com
Market Outlook July 10, 2012
Dealer’s Diary
The Indian markets are expected to open flat to positive mirroring the SGX Nifty
and Asian stocks which are trading higher in the opening trade. Asian stocks rose,
with the benchmark regional index heading for its first advance in four days, as
mining companies gained after metal prices increased and industry bellwether
Alcoa Inc. reported better-than-expected profit.
The release of results from Alcoa is seen as the unofficial start of the earnings
season, as the company is typically the first Dow component to release its results.
Stocks in US saw moderate weakness during trading on Monday but ended the
session well off their worst levels of the day as lingering economic concerns
weighed on the markets. Uncertainty about the situation in Europe also generated
some selling pressure, as euro zone finance ministers hold another meeting in
Brussels.
China’s imports rose less than anticipated in June while export growth slowed,
adding pressure on the government to support expansion after inflation data
yesterday showed demand softening. Indian shares fell notably on Monday,mirroring a weak trend across Asia and Europe as dismal economic data from the
U.S. and Japan coupled with worries about a slowing Chinese economy kept
investors on edge.
Markets Today The trend deciding level for the day is 17,407 / 5,278 levels. If NIFTY trades above
this level during the first half-an-hour of trade then we may witness a further rally
up to 17,471 – 17,549 / 5,298 – 5,321 levels. However, if NIFTY trades below
17,407 / 5,278 levels for the first half-an-hour of trade then it may correct up to
17,328 – 17,265 / 5,255 – 5,235 levels.
SENSEX
NIFTY
News Analysis HZL – a better bet in the non-ferrous space over Hindalco
TVS Motor is looking for a technological tie-up with BMW
Refer detailed news analysis on the following page
Net Inflows (July 6, 2012)
FII 1,942 1,334 609 1,926 47,920
MFs 272 517 (246) (732) (6,579)
FII Derivatives (July 9, 2012)
Index Futures 1,074 1,010 65 13,780
Stock Futures 1,077 1,385 (308) 25,218
Gainers / Losers
Manappuram Finance 33 5.8 IVRCL LTD 49 (6.7)
Engineers India 239 4.5 JSW ENERGY 53 (5.0)
Wockhardt 924 4.4 GMR Infra 25 (5.0)
JPINFRATEC 56 1.9 ADANI POWER 49 (4.8)
Indraprastha Gas 246 1.8 Chambal Fert 77 (4.7)
BSE Sensex (0.7) (129.1) 17,392
Nifty (0.8) (41.8) 5,275
MID CAP (1.2) (75.7) 6,238
SMALL CAP (1.1) (72.2) 6,750
BSE HC (0.7) (45.7) 6,896
BSE PSU (0.9) (69.6) 7,308
BANKEX (0.8) (92.0) 12,173
AUTO (1.1) (106.2) 9,381
METAL (1.6) (170.1) 10,832
OIL & GAS (0.5) (42.1) 8,019
BSE IT (0.1) (4.0) 5,651
Dow Jones (0.3) (36.2) 12,736NASDAQ (0.2) (5.6) 2,932
FTSE (0.6) (35.3) 5,627
Nikkei (1.4) (123.9) 8,897
Hang Seng (1.9) (372.6) 19,428
Straits Times (1.7) (49.5) 2,929
Shanghai Com (2.4) (52.8) 2,171
INFY 1.2 0.5 $44.1
WIT (1.0) (0.1) $8.6IBN (0.5) (0.2) $33.4
HDB 0.2 0.1 $33.4
Advances 1,070 424
Declines 1,798 103
Unchanged 101 2
BSE 1,818
NSE 8,430
7/31/2019 Market Outlook 100712
http://slidepdf.com/reader/full/market-outlook-100712 2/14
www.angelbroking.com
Market Outlook July 10, 2012
HZL – A better bet in the non-ferrous space over Hindalco
Prices of non-ferrous metals (alongside non-ferrous stocks) have declined steeply
over the past one year on the back of escalating sovereign credit crisis in Europe.
Prices of aluminium and zinc are below the cost of production for several smelters
around the world. Several big players such as Rio Tinto and Alcoa have already
announced production cuts over the past six months. Hence, we do not expect
current levels of base metal prices to sustain over the medium term. In light of the
anticipated increase in the prices of base metals, we analyzed the likely impact on
the stock price performances of Hindalco and Hindustan Zinc (HZL).
Hindalco’s stock performance is likely to be determined by the timely
commencement of its upcoming projects, timely development of captive assets and
the movement in aluminium prices in our view. We believe Hindalco stock’s
correlation with LME aluminium prices (in INR terms) will remain lower than
historical levels. On the other hand, with a strong balance sheet, lower capex
requirements, 12% growth in EPS over FY2012-14 and compelling valuations, we
believe HZL is an attractive bet at current price levels. Moreover, with a strong
correlation (83%) between aluminium and zinc prices, we believe HZL is a better
way to play upside in base metal prices.
As highlighted in our report
on Hindalco dated June 13, 2012, we anticipate project delays alongside lower
profitability from its aluminium business during FY2013-14. On June 26, 2012,
Hindalco announced that it had delayed the commissioning of its Mahan smelter
(earlier scheduled to commission during 1QFY2013), in-line with our expectations.
Hindalco’s stock had astrong correlation with INR-denominated LME aluminium prices since the past 22
years. However, over the past one year, this correlation has dropped significantly
mainly on account of project delays. Further, with massive aluminium capacity
expansion ahead, we believe stock performance will be determined by the timely
commencement of these projects, timely development of captive assets and the
movement in spot aluminium prices. Hence, Hindalco will no longer be a 100%
proxy on aluminium prices over the coming 2-3 years in our view.
Although zinc and aluminium
metals have different cost structures, there is high correlation between the prices of
these metals. The correlation between zinc and aluminium prices since the past 20years has been 83%. Even over the past one year, zinc and aluminium prices have
witnessed declines of similar quantum – zinc and aluminium prices declined by
23% and 25%, respectively. Hence, we believe any rise in aluminium prices hereon
should also be accompanied by an increase in zinc prices and vice versa. With a
cash-rich balance sheet and rising production of zinc, lead and silver over
FY2012-14, HZL remains our top pick in the non-ferrous space. Valuing the stock
at 4.0x FY2014 EV/EBITDA,
7/31/2019 Market Outlook 100712
http://slidepdf.com/reader/full/market-outlook-100712 3/14
www.angelbroking.com
Market Outlook July 10, 2012
TVS Motor is looking for a technological tie-up with BMW
TVS Motor (TVSL) is in talks with BMW's motorcycle division, BMW Motorrad, for a
technological tie-up for high-end bikes. As per media reports, the partnership will
likely involve a technology-sharing pact and may also extend to joint marketing.
While management has refrained from divulging any further details regarding thepartnership, it has stated that the sale of equity stake is not being considered. We
believe the technological-sharing pact with BMW will help TVSL acquire
technological know-how to develop more powerful motorcycles and extend its
premium bike range, where it currently has Apache (160cc and 180cc). While the
development is certainly positive for the company in the long run, it is unlikely to
have any significant impact on the positioning of TVSL in the domestic motorcycle
industry in the near term as BMW currently offers products in the >600cc category,
which has a very limited domestic market. At ` 40, the stock is trading at 7.5x
FY2014E earnings. Post the recent run-up in the stock price (~20% over the past
one month),
Quarterly Bloomberg Brokers Consensus Estimate
Net profit 232 180 29 223 4
Net profit 1,019 845 21 1,326 -23
Net sales 9,568 7,485 27.8 8,852 8.1
Net profit 2,426 1,722 40.9 2,316 4.7
Net sales 14,676 10,797 36 12,980 13
Net profit 3,233 2,408 34 2,919 11
Economic and Political News
GAAR panel for modification of norms, reduction of examples
RBI concerned over slow deposit growth: IBA
Congress keen on Hamid Ansari as Vice President
OMO will depend on liquidity situation: RBI

7/31/2019 Market Outlook 100712
http://slidepdf.com/reader/full/market-outlook-100712 4/14
www.angelbroking.com
Market Outlook July 10, 2012
Corporate News
Infosys likely to pare FY2013 revenue growth forecast
ONGC starts release of gas for Palatana power project
RCom sets price range of US$1.09-1.32 for Singapore IPO
Big brands to remain primary growth drivers: Godrej
Source: Economic Times, Business Standard, Business Line, Financial Express, Mint
7/31/2019 Market Outlook 100712
http://slidepdf.com/reader/full/market-outlook-100712 5/14
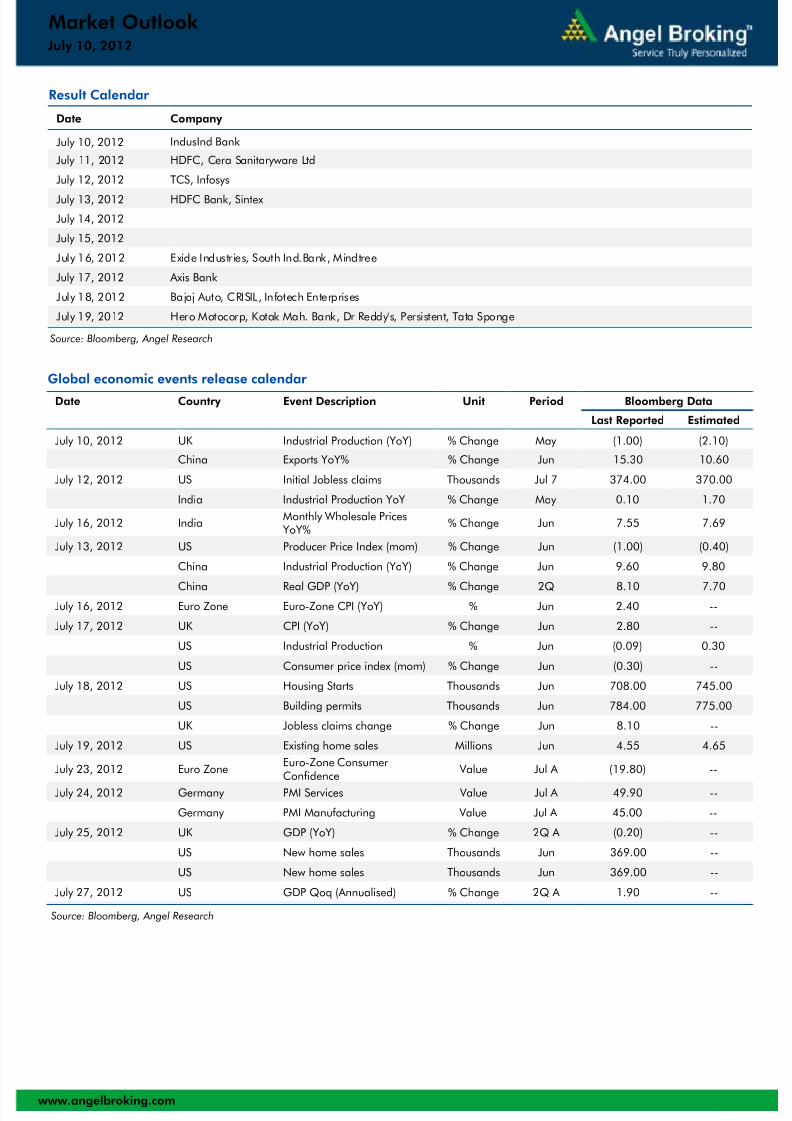
Date Company
July 10, 2012 IndusInd Bank
July 11, 2012 HDFC, Cera Sanitaryware Ltd
July 12, 2012 TCS, Infosys
July 13, 2012 HDFC Bank, Sintex
July 14, 2012
July 15, 2012
July 16, 2012 Exide Industries, South Ind.Bank, Mindtree
July 17, 2012 Axis Bank
July 18, 2012 Bajaj Auto, CRISIL, Infotech Enterprises
July 19, 2012 Hero Motocorp, Kotak Mah. Bank, Dr Reddy's, Persistent, Tata Sponge
Source: Bloomberg, Angel Research
Result Calendar
Global economic events release calendar
Date Country Event Description Unit Period Bloomberg Data
Last Reported Estimated
July 10, 2012 UK Industrial Production (YoY) % Change May (1.00) (2.10)
China Exports YoY% % Change Jun 15.30 10.60
July 12, 2012 US Initial Jobless claims Thousands Jul 7 374.00 370.00
India Industrial Production YoY % Change May 0.10 1.70
July 16, 2012 IndiaMonthly Wholesale PricesYoY%
% Change Jun 7.55 7.69
July 13, 2012 US Producer Price Index (mom) % Change Jun (1.00) (0.40)
China Industrial Production (YoY) % Change Jun 9.60 9.80
China Real GDP (YoY) % Change 2Q 8.10 7.70July 16, 2012 Euro Zone Euro-Zone CPI (YoY) % Jun 2.40 --
July 17, 2012 UK CPI (YoY) % Change Jun 2.80 --
US Industrial Production % Jun (0.09) 0.30
US Consumer price index (mom) % Change Jun (0.30) --
July 18, 2012 US Housing Starts Thousands Jun 708.00 745.00
US Building permits Thousands Jun 784.00 775.00
UK Jobless claims change % Change Jun 8.10 --
July 19, 2012 US Existing home sales Millions Jun 4.55 4.65
July 23, 2012 Euro ZoneEuro-Zone ConsumerConfidence
Value Jul A (19.80) --
July 24, 2012 Germany PMI Services Value Jul A 49.90 --
Germany PMI Manufacturing Value Jul A 45.00 --
July 25, 2012 UK GDP (YoY) % Change 2Q A (0.20) --
US New home sales Thousands Jun 369.00 --
US New home sales Thousands Jun 369.00 --
July 27, 2012 US GDP Qoq (Annualised) % Change 2Q A 1.90 --
Source: Bloomberg, Angel Research
www.angelbroking.com
July 10, 2012
Market Outlook
7/31/2019 Market Outlook 100712
http://slidepdf.com/reader/full/market-outlook-100712 6/14
Market Strategy
July 10, 2012
www.angelbroking.com
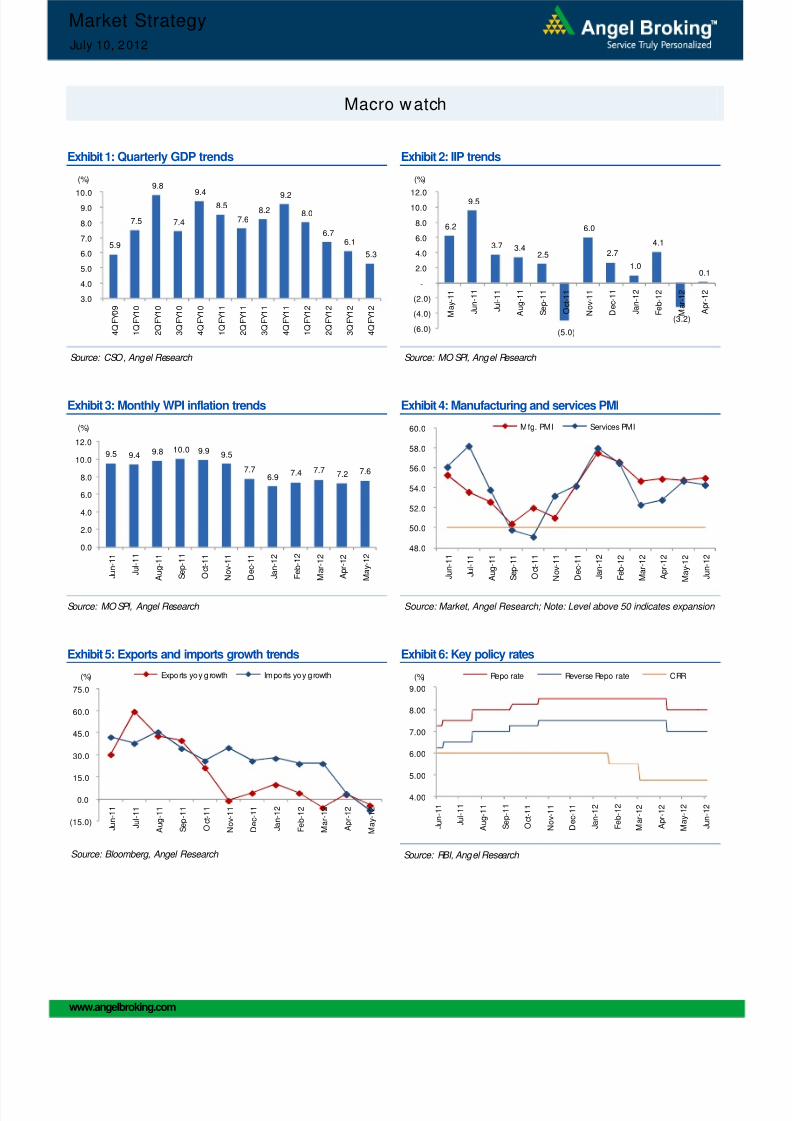
Macro watch
Exhibit 1: Quarterly GDP trends
5.9
7.5
9.8
7.4
9.48.5
7.68.2
9.2
8.0
6.76.1
5.3
3.0
4.0
5.0
6.0
7.0
8.0
9.010.0
4 Q F Y 0 9
1 Q F Y 1 0
2 Q F Y 1 0
3 Q F Y 1 0
4 Q F Y 1 0
1 Q F Y 1 1
2 Q F Y 1 1
3 Q F Y 1 1
4 Q F Y 1 1
1 Q F Y 1 2
2 Q F Y 1 2
3 Q F Y 1 2
4 Q F Y 1 2
(%)
Source: CSO, Angel Research
Exhibit 2: IIP trends
6.2
9.5
3.7 3.42.5
(5.0)
6.0
2.7
1.0
4.1
(3.2)
0.1
(6.0)
(4.0)
(2.0)
-
2.0
4.0
6.0
8.0
10.012.0
M a y - 1
1
J u n - 1
1
J u
l - 1 1
A u g - 1
1
S e p - 1
1
O c
t - 1 1
N o v - 1
1
D e c - 1
1
J a n - 1
2
F e
b - 1
2
M a r - 1
2
A p r - 1
2
(%)
Source: MO SPI, Angel Research
Exhibit 3: Monthly WPI inflation trends
9.5 9.4 9.8 10.0 9.9 9.5
7.76.9
7.4 7.77.2 7.6
0.0
2.0
4.0
6.0
8.0
10.0
12.0
J u n - 1
1
J u l - 1 1
A u g - 1
1
S e p - 1
1
O c t - 1 1
N o v - 1
1
D e c - 1
1
J a n - 1
2
F e b - 1
2
M a r - 1 2
A p r - 1 2
M a y - 1
2
(%)
Source: MO SPI, Angel Research
Exhibit 4: Manufacturing and services PMI
48.0
50.0
52.0
54.0
56.0
58.0
60.0
J u n - 1
1
J u l - 1 1
A u g - 1
1
S e p - 1
1
O c t - 1 1
N o v - 1
1
D e c - 1
1
J a n - 1
2
F e b - 1
2
M a r - 1 2
A p r - 1 2
M a y - 1
2
J u n - 1
2
Mfg. PMI Services PMI
Source: Market, Angel Research; Note: Level above 50 indicates expansion
Exhibit 5: Exports and imports growth trends
(15.0)
0.0
15.0
30.0
45.0
60.0
75.0
J u n - 1
1
J u
l - 1 1
A u g - 1
1
S e p - 1
1
O c
t - 1 1
N o v - 1
1
D e c - 1
1
J a n - 1
2
F e
b - 1
2
M a r - 1
2
A p r - 1
2
M a y - 1
2
Exports yoy growth Imports yoy growth(%)
Source: Bloomberg, Angel Research
Exhibit 6: Key policy rates
4.00
5.00
6.00
7.00
8.00
9.00
J u n - 1
1
J u
l - 1 1
A u g - 1
1
S e p - 1
1
O c
t - 1 1
N o v - 1
1
D e c - 1
1
J a n - 1
2
F e
b - 1
2
M a r - 1
2
A p r - 1
2
M a y - 1
2
J u n - 1
2
Repo rate Reverse Repo rate CRR(%)
Source: RBI, Angel Research
7/31/2019 Market Outlook 100712
http://slidepdf.com/reader/full/market-outlook-100712 7/14
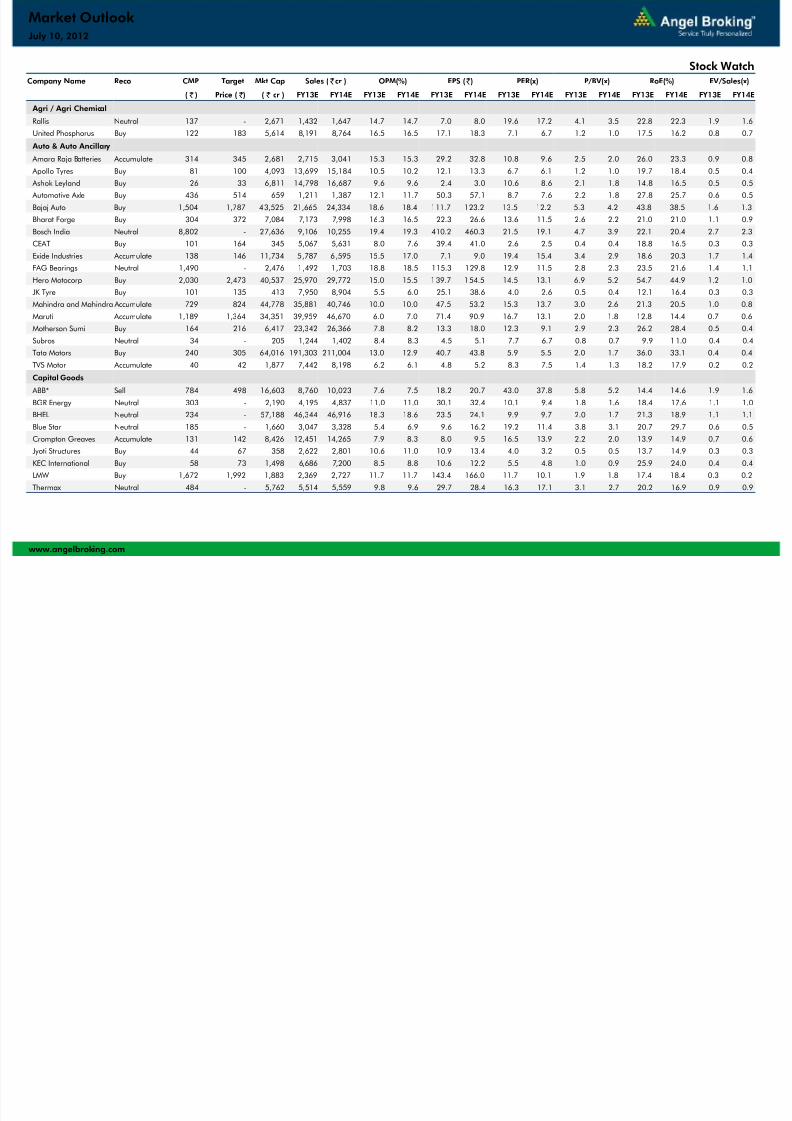
Company Name Reco CMP Target Mkt Cap Sales ( cr ) OPM(%) EPS () PER(x) P/BV(x) RoE(%) EV/Sales(x)
( ) Price ( ) ( cr ) FY13E FY14E FY13E FY14E FY13E FY14E FY13E FY14E FY13E FY14E FY13E FY14E FY13E FY14E
Agri / Agri Chemical
Rallis Neutral 137 - 2,671 1,432 1,647 14.7 14.7 7.0 8.0 19.6 17.2 4.1 3.5 22.8 22.3 1.9 1.6
United Phosphorus Buy 122 183 5,614 8,191 8,764 16.5 16.5 17.1 18.3 7.1 6.7 1.2 1.0 17.5 16.2 0.8 0.7
Auto & Auto Ancillary
Amara Raja Batteries Accumulate 314 345 2,681 2,715 3,041 15.3 15.3 29.2 32.8 10.8 9.6 2.5 2.0 26.0 23.3 0.9 0.8
Apollo Tyres Buy 81 100 4,093 13,699 15,184 10.5 10.2 12.1 13.3 6.7 6.1 1.2 1.0 19.7 18.4 0.5 0.4
Ashok Leyland Buy 26 33 6,811 14,798 16,687 9.6 9.6 2.4 3.0 10.6 8.6 2.1 1.8 14.8 16.5 0.5 0.5
Automotive Axle Buy 436 514 659 1,211 1,387 12.1 11.7 50.3 57.1 8.7 7.6 2.2 1.8 27.8 25.7 0.6 0.5Bajaj Auto Buy 1,504 1,787 43,525 21,665 24,334 18.6 18.4 111.7 123.2 13.5 12.2 5.3 4.2 43.8 38.5 1.6 1.3
Bharat Forge Buy 304 372 7,084 7,173 7,998 16.3 16.5 22.3 26.6 13.6 11.5 2.6 2.2 21.0 21.0 1.1 0.9
Bosch India Neutral 8,802 - 27,636 9,106 10,255 19.4 19.3 410.2 460.3 21.5 19.1 4.7 3.9 22.1 20.4 2.7 2.3
CEAT Buy 101 164 345 5,067 5,631 8.0 7.6 39.4 41.0 2.6 2.5 0.4 0.4 18.8 16.5 0.3 0.3
Exide Industries Accumulate 138 146 11,734 5,787 6,595 15.5 17.0 7.1 9.0 19.4 15.4 3.4 2.9 18.6 20.3 1.7 1.4
FAG Bearings Neutral 1,490 - 2,476 1,492 1,703 18.8 18.5 115.3 129.8 12.9 11.5 2.8 2.3 23.5 21.6 1.4 1.1
Hero Motocorp Buy 2,030 2,473 40,537 25,970 29,772 15.0 15.5 139.7 154.5 14.5 13.1 6.9 5.2 54.7 44.9 1.2 1.0
JK Tyre Buy 101 135 413 7,950 8,904 5.5 6.0 25.1 38.6 4.0 2.6 0.5 0.4 12.1 16.4 0.3 0.3
Mahindra and Mahindra Accumulate 729 824 44,778 35,881 40,746 10.0 10.0 47.5 53.2 15.3 13.7 3.0 2.6 21.3 20.5 1.0 0.8
Maruti Accumulate 1,189 1,364 34,351 39,959 46,670 6.0 7.0 71.4 90.9 16.7 13.1 2.0 1.8 12.8 14.4 0.7 0.6
Motherson Sumi Buy 164 216 6,417 23,342 26,366 7.8 8.2 13.3 18.0 12.3 9.1 2.9 2.3 26.2 28.4 0.5 0.4
Subros Neutral 34 - 205 1,244 1,402 8.4 8.3 4.5 5.1 7.7 6.7 0.8 0.7 9.9 11.0 0.4 0.4
Tata Motors Buy 240 305 64,016 191,303 211,004 13.0 12.9 40.7 43.8 5.9 5.5 2.0 1.7 36.0 33.1 0.4 0.4
TVS Motor Accumulate 40 42 1,877 7,442 8,198 6.2 6.1 4.8 5.2 8.3 7.5 1.4 1.3 18.2 17.9 0.2 0.2
Capital Goods
ABB* Sell 784 498 16,603 8,760 10,023 7.6 7.5 18.2 20.7 43.0 37.8 5.8 5.2 14.4 14.6 1.9 1.6BGR Energy Neutral 303 - 2,190 4,195 4,837 11.0 11.0 30.1 32.4 10.1 9.4 1.8 1.6 18.4 17.6 1.1 1.0
BHEL Neutral 234 - 57,188 46,344 46,916 18.3 18.6 23.5 24.1 9.9 9.7 2.0 1.7 21.3 18.9 1.1 1.1
Blue Star Neutral 185 - 1,660 3,047 3,328 5.4 6.9 9.6 16.2 19.2 11.4 3.8 3.1 20.7 29.7 0.6 0.5
Crompton Greaves Accumulate 131 142 8,426 12,451 14,265 7.9 8.3 8.0 9.5 16.5 13.9 2.2 2.0 13.9 14.9 0.7 0.6
Jyoti Structures Buy 44 67 358 2,622 2,801 10.6 11.0 10.9 13.4 4.0 3.2 0.5 0.5 13.7 14.9 0.3 0.3
KEC International Buy 58 73 1,498 6,686 7,200 8.5 8.8 10.6 12.2 5.5 4.8 1.0 0.9 25.9 24.0 0.4 0.4
LMW Buy 1,672 1,992 1,883 2,369 2,727 11.7 11.7 143.4 166.0 11.7 10.1 1.9 1.8 17.4 18.4 0.3 0.2
Thermax Neutral 484 - 5,762 5,514 5,559 9.8 9.6 29.7 28.4 16.3 17.1 3.1 2.7 20.2 16.9 0.9 0.9
www.angelbroking.com
July 10, 2012
Market Outlook
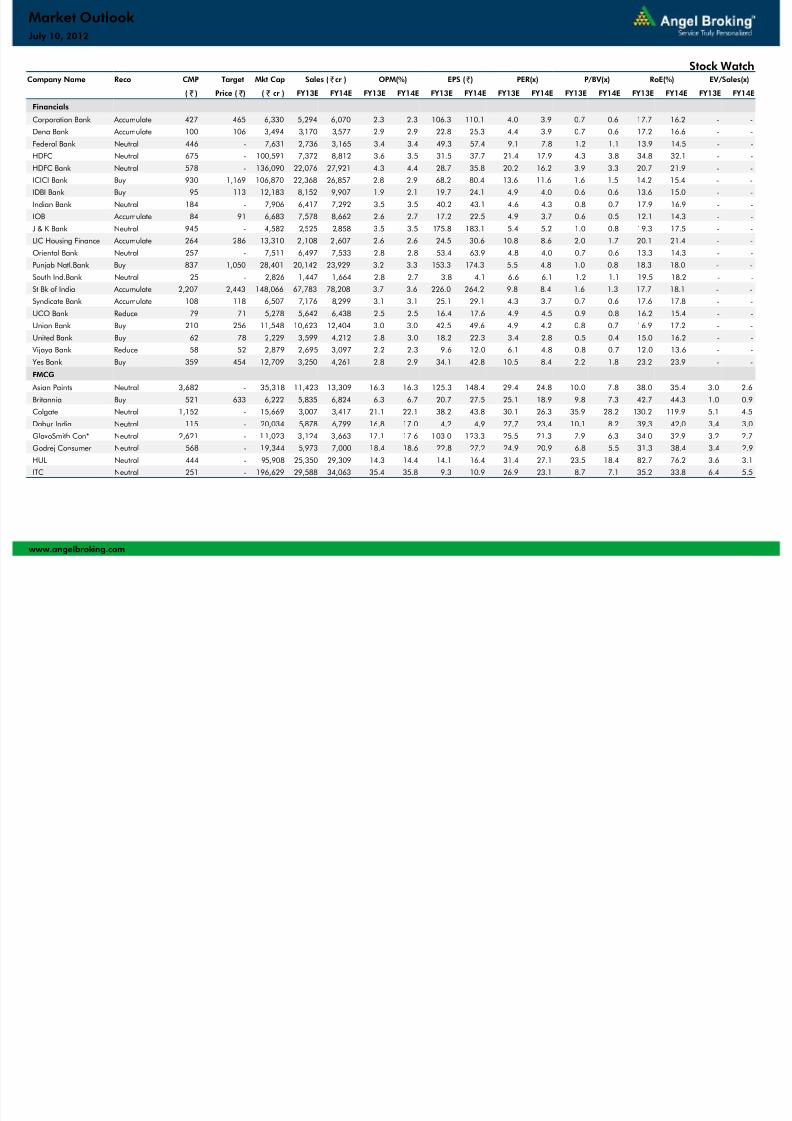
Stock Watch
7/31/2019 Market Outlook 100712
http://slidepdf.com/reader/full/market-outlook-100712 8/14
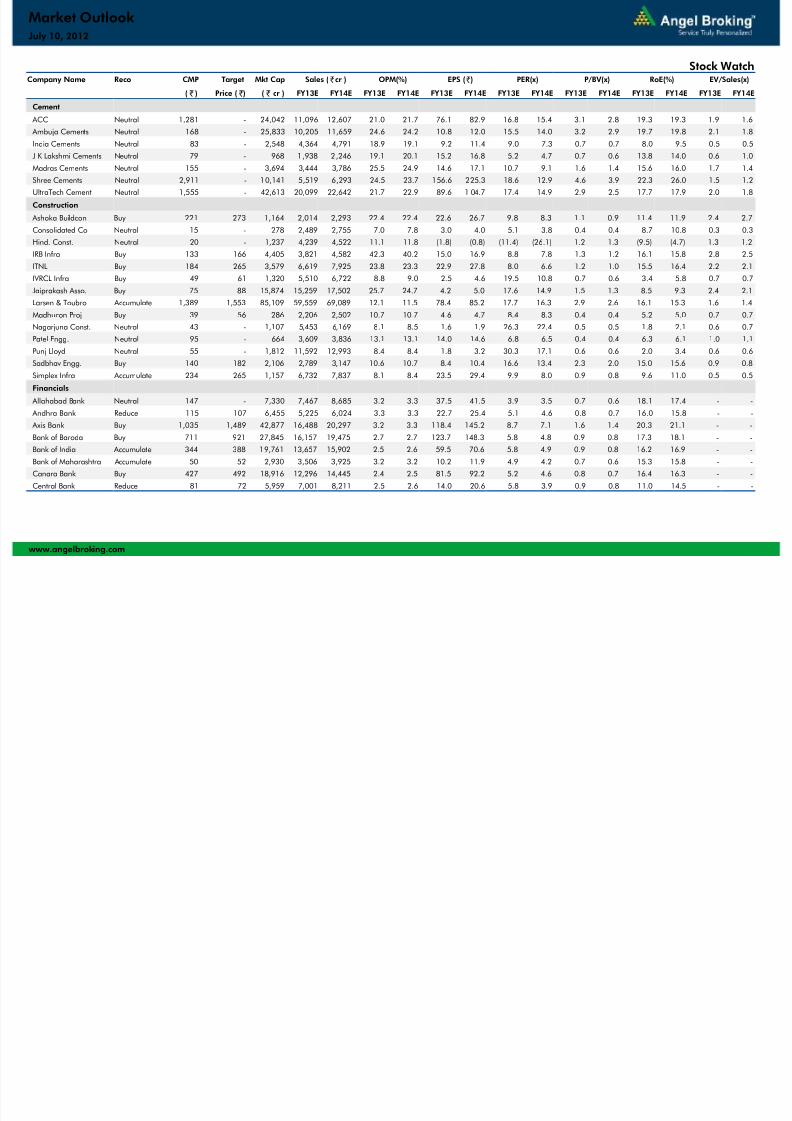
Company Name Reco CMP Target Mkt Cap Sales ( cr ) OPM(%) EPS () PER(x) P/BV(x) RoE(%) EV/Sales(x)
( ) Price ( ) ( cr ) FY13E FY14E FY13E FY14E FY13E FY14E FY13E FY14E FY13E FY14E FY13E FY14E FY13E FY14E
Cement
ACC Neutral 1,281 - 24,042 11,096 12,607 21.0 21.7 76.1 82.9 16.8 15.4 3.1 2.8 19.3 19.3 1.9 1.6
Ambuja Cements Neutral 168 - 25,833 10,205 11,659 24.6 24.2 10.8 12.0 15.5 14.0 3.2 2.9 19.7 19.8 2.1 1.8
India Cements Neutral 83 - 2,548 4,364 4,791 18.9 19.1 9.2 11.4 9.0 7.3 0.7 0.7 8.0 9.5 0.5 0.5
J K Lakshmi Cements Neutral 79 - 968 1,938 2,246 19.1 20.1 15.2 16.8 5.2 4.7 0.7 0.6 13.8 14.0 0.6 1.0
Madras Cements Neutral 155 - 3,694 3,444 3,786 25.5 24.9 14.6 17.1 10.7 9.1 1.6 1.4 15.6 16.0 1.7 1.4
Shree Cements Neutral 2,911 - 10,141 5,519 6,293 24.5 23.7 156.6 225.3 18.6 12.9 4.6 3.9 22.3 26.0 1.5 1.2
UltraTech Cement Neutral 1,555 - 42,613 20,099 22,642 21.7 22.9 89.6 1 04.7 17.4 14.9 2.9 2.5 17.7 17.9 2.0 1.8Construction
Ashoka Buildcon Buy 221 273 1,164 2,014 2,293 22.4 22.4 22.6 26.7 9.8 8.3 1.1 0.9 11.4 11.9 2.4 2.7
Consolidated Co Neutral 15 - 278 2,489 2,755 7.0 7.8 3.0 4.0 5.1 3.8 0.4 0.4 8.7 10.8 0.3 0.3
Hind. Const. Neutral 20 - 1,237 4,239 4,522 11.1 11.8 (1.8) (0.8) (11.4) (26.1) 1.2 1.3 (9.5) (4.7) 1.3 1.2
IRB Infra Buy 133 166 4,405 3,821 4,582 42.3 40.2 15.0 16.9 8.8 7.8 1.3 1.2 16.1 15.8 2.8 2.5
ITNL Buy 184 265 3,579 6,619 7,925 23.8 23.3 22.9 27.8 8.0 6.6 1.2 1.0 15.5 16.4 2.2 2.1
IVRCL Infra Buy 49 61 1,320 5,510 6,722 8.8 9.0 2.5 4.6 19.5 10.8 0.7 0.6 3.4 5.8 0.7 0.7
Jaiprakash Asso. Buy 75 88 15,874 15,259 17,502 25.7 24.7 4.2 5.0 17.6 14.9 1.5 1.3 8.5 9.3 2.4 2.1
Larsen & Toubro Accumulate 1,389 1,553 85,109 59,559 69,089 12.1 11.5 78.4 85.2 17.7 16.3 2.9 2.6 16.1 15.3 1.6 1.4
Madhucon Proj Buy 39 56 286 2,206 2,502 10.7 10.7 4.6 4.7 8.4 8.3 0.4 0.4 5.2 5.0 0.7 0.7
Nagarjuna Const. Neutral 43 - 1,107 5,453 6,169 8.1 8.5 1.6 1.9 26.3 22.4 0.5 0.5 1.8 2.1 0.6 0.7
Patel Engg. Neutral 95 - 664 3,609 3,836 13.1 13.1 14.0 14.6 6.8 6.5 0.4 0.4 6.3 6.1 1.0 1.1
Punj Lloyd Neutral 55 - 1,812 11,592 12,993 8.4 8.4 1.8 3.2 30.3 17.1 0.6 0.6 2.0 3.4 0.6 0.6
Sadbhav Engg. Buy 140 182 2,106 2,789 3,147 10.6 10.7 8.4 10.4 16.6 13.4 2.3 2.0 15.0 15.6 0.9 0.8
Simplex Infra Accumulate 234 265 1,157 6,732 7,837 8.1 8.4 23.5 29.4 9.9 8.0 0.9 0.8 9.6 11.0 0.5 0.5
Financials Allahabad Bank Neutral 147 - 7,330 7,467 8,685 3.2 3.3 37.5 41.5 3.9 3.5 0.7 0.6 18.1 17.4 - -
Andhra Bank Reduce 115 107 6,455 5,225 6,024 3.3 3.3 22.7 25.4 5.1 4.6 0.8 0.7 16.0 15.8 - -
Axis Bank Buy 1,035 1,489 42,877 16,488 20,297 3.2 3.3 118.4 145.2 8.7 7.1 1.6 1.4 20.3 21.1 - -
Bank of Baroda Buy 711 921 27,845 16,157 19,475 2.7 2.7 123.7 148.3 5.8 4.8 0.9 0.8 17.3 18.1 - -
Bank of India Accumulate 344 388 19,761 13,657 15,902 2.5 2.6 59.5 70.6 5.8 4.9 0.9 0.8 16.2 16.9 - -
Bank of Maharashtra Accumulate 50 52 2,930 3,506 3,925 3.2 3.2 10.2 11.9 4.9 4.2 0.7 0.6 15.3 15.8 - -
Canara Bank Buy 427 492 18,916 12,296 14,445 2.4 2.5 81.5 92.2 5.2 4.6 0.8 0.7 16.4 16.3 - -
Central Bank Reduce 81 72 5,959 7,001 8,211 2.5 2.6 14.0 20.6 5.8 3.9 0.9 0.8 11.0 14.5 - -
www.angelbroking.com
July 10, 2012
Market Outlook
Stock Watch
7/31/2019 Market Outlook 100712
http://slidepdf.com/reader/full/market-outlook-100712 9/14
Company Name Reco CMP Target Mkt Cap Sales ( cr ) OPM(%) EPS () PER(x) P/BV(x) RoE(%) EV/Sales(x)
( ) Price ( ) ( cr ) FY13E FY14E FY13E FY14E FY13E FY14E FY13E FY14E FY13E FY14E FY13E FY14E FY13E FY14E
Financials
Corporation Bank Accumulate 427 465 6,330 5,294 6,070 2.3 2.3 106.3 110.1 4.0 3.9 0.7 0.6 17.7 16.2 - -
Dena Bank Accumulate 100 106 3,494 3,170 3,577 2.9 2.9 22.8 25.3 4.4 3.9 0.7 0.6 17.2 16.6 - -
Federal Bank Neutral 446 - 7,631 2,736 3,165 3.4 3.4 49.3 57.4 9.1 7.8 1.2 1.1 13.9 14.5 - -
HDFC Neutral 675 - 100,591 7,372 8,812 3.6 3.5 31.5 37.7 21.4 17.9 4.3 3.8 34.8 32.1 - -
HDFC Bank Neutral 578 - 136,090 22,076 27,921 4.3 4.4 28.7 35.8 20.2 16.2 3.9 3.3 20.7 21.9 - -
ICICI Bank Buy 930 1,169 106,870 22,368 26,857 2.8 2.9 68.2 80.4 13.6 11.6 1.6 1.5 14.2 15.4 - -
IDBI Bank Buy 95 113 12,183 8,152 9,907 1.9 2.1 19.7 24.1 4.9 4.0 0.6 0.6 13.6 15.0 - -Indian Bank Neutral 184 - 7,906 6,417 7,292 3.5 3.5 40.2 43.1 4.6 4.3 0.8 0.7 17.9 16.9 - -
IOB Accumulate 84 91 6,683 7,578 8,662 2.6 2.7 17.2 22.5 4.9 3.7 0.6 0.5 12.1 14.3 - -
J & K Bank Neutral 945 - 4,582 2,525 2,858 3.5 3.5 175.8 183.1 5.4 5.2 1.0 0.8 19.3 17.5 - -
LIC Housing Finance Accumulate 264 286 13,310 2,108 2,607 2.6 2.6 24.5 30.6 10.8 8.6 2.0 1.7 20.1 21.4 - -
Oriental Bank Neutral 257 - 7,511 6,497 7,533 2.8 2.8 53.4 63.9 4.8 4.0 0.7 0.6 13.3 14.3 - -
Punjab Natl.Bank Buy 837 1,050 28,401 20,142 23,929 3.2 3.3 153.3 174.3 5.5 4.8 1.0 0.8 18.3 18.0 - -
South Ind.Bank Neutral 25 - 2,826 1,447 1,664 2.8 2.7 3.8 4.1 6.6 6.1 1.2 1.1 19.5 18.2 - -
St Bk of India Accumulate 2,207 2,443 148,066 67,783 78,208 3.7 3.6 226.0 264.2 9.8 8.4 1.6 1.3 17.7 18.1 - -
Syndicate Bank Accumulate 108 118 6,507 7,176 8,299 3.1 3.1 25.1 29.1 4.3 3.7 0.7 0.6 17.6 17.8 - -
UCO Bank Reduce 79 71 5,278 5,642 6,438 2.5 2.5 16.4 17.6 4.9 4.5 0.9 0.8 16.2 15.4 - -
Union Bank Buy 210 256 11,548 10,623 12,404 3.0 3.0 42.5 49.6 4.9 4.2 0.8 0.7 16.9 17.2 - -
United Bank Buy 62 78 2,229 3,599 4,212 2.8 3.0 18.2 22.3 3.4 2.8 0.5 0.4 15.0 16.2 - -
Vijaya Bank Reduce 58 52 2,879 2,695 3,097 2.2 2.3 9.6 12.0 6.1 4.8 0.8 0.7 12.0 13.6 - -
Yes Bank Buy 359 454 12,709 3,250 4,261 2.8 2.9 34.1 42.8 10.5 8.4 2.2 1.8 23.2 23.9 - -
FMCG
Asian Paints Neutral 3,682 - 35,318 11,423 13,309 16.3 16.3 125.3 148.4 29.4 24.8 10.0 7.8 38.0 35.4 3.0 2.6Britannia Buy 521 633 6,222 5,835 6,824 6.3 6.7 20.7 27.5 25.1 18.9 9.8 7.3 42.7 44.3 1.0 0.9
Colgate Neutral 1,152 - 15,669 3,007 3,417 21.1 22.1 38.2 43.8 30.1 26.3 35.9 28.2 130.2 119.9 5.1 4.5
Dabur India Neutral 115 - 20,034 5,878 6,799 16.8 17.0 4.2 4.9 27.7 23.4 10.1 8.2 39.3 42.0 3.4 3.0
GlaxoSmith Con* Neutral 2,621 - 11,023 3,124 3,663 17.1 17.6 103.0 123.3 25.5 21.3 7.9 6.3 34.0 32.9 3.2 2.7
Godrej Consumer Neutral 568 - 19,344 5,973 7,000 18.4 18.6 22.8 27.2 24.9 20.9 6.8 5.5 31.3 38.4 3.4 2.9
HUL Neutral 444 - 95,908 25,350 29,309 14.3 14.4 14.1 16.4 31.4 27.1 23.5 18.4 82.7 76.2 3.6 3.1
ITC Neutral 251 - 196,629 29,588 34,063 35.4 35.8 9.3 10.9 26.9 23.1 8.7 7.1 35.2 33.8 6.4 5.5
www.angelbroking.com
July 10, 2012
Market Outlook
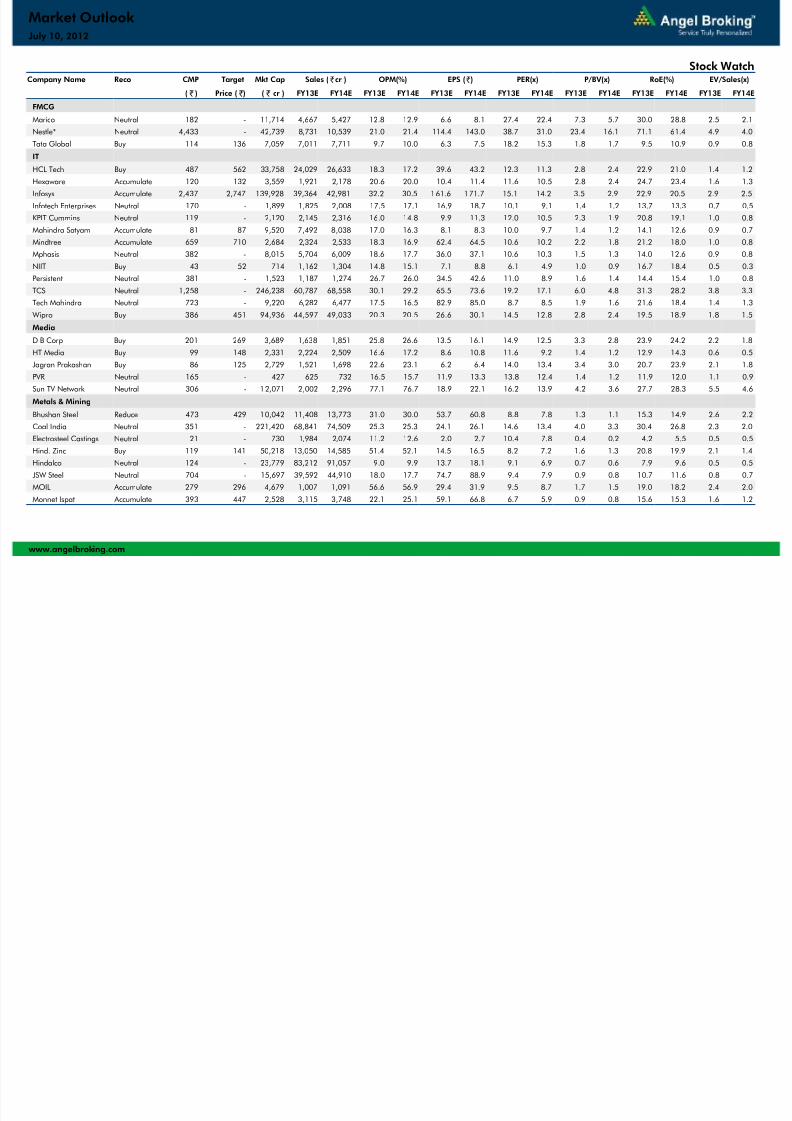
Stock Watch
7/31/2019 Market Outlook 100712
http://slidepdf.com/reader/full/market-outlook-100712 10/14
Company Name Reco CMP Target Mkt Cap Sales ( cr ) OPM(%) EPS () PER(x) P/BV(x) RoE(%) EV/Sales(x)
( ) Price ( ) ( cr ) FY13E FY14E FY13E FY14E FY13E FY14E FY13E FY14E FY13E FY14E FY13E FY14E FY13E FY14E
FMCG
Marico Neutral 182 - 11,714 4,667 5,427 12.8 12.9 6.6 8.1 27.4 22.4 7.3 5.7 30.0 28.8 2.5 2.1
Nestle* Neutral 4,433 - 42,739 8,731 10,539 21.0 21.4 114.4 143.0 38.7 31.0 23.4 16.1 71.1 61.4 4.9 4.0
Tata Global Buy 114 136 7,059 7,011 7,711 9.7 10.0 6.3 7.5 18.2 15.3 1.8 1.7 9.5 10.9 0.9 0.8
IT
HCL Tech Buy 487 562 33,758 24,029 26,633 18.3 17.2 39.6 43.2 12.3 11.3 2.8 2.4 22.9 21.0 1.4 1.2
Hexaware Accumulate 120 132 3,559 1,921 2,178 20.6 20.0 10.4 11.4 11.6 10.5 2.8 2.4 24.7 23.4 1.6 1.3
Infosys Accumulate 2,437 2,747 139,928 39,364 42,981 32.2 30.5 161.6 171.7 15.1 14.2 3.5 2.9 22.9 20.5 2.9 2.5Infotech Enterprises Neutral 170 - 1,899 1,825 2,008 17.5 17.1 16.9 18.7 10.1 9.1 1.4 1.2 13.7 13.3 0.7 0.5
KPIT Cummins Neutral 119 - 2,120 2,145 2,316 16.0 14.8 9.9 11.3 12.0 10.5 2.3 1.9 20.8 19.1 1.0 0.8
Mahindra Satyam Accumulate 81 87 9,520 7,492 8,038 17.0 16.3 8.1 8.3 10.0 9.7 1.4 1.2 14.1 12.6 0.9 0.7
Mindtree Accumulate 659 710 2,684 2,324 2,533 18.3 16.9 62.4 64.5 10.6 10.2 2.2 1.8 21.2 18.0 1.0 0.8
Mphasis Neutral 382 - 8,015 5,704 6,009 18.6 17.7 36.0 37.1 10.6 10.3 1.5 1.3 14.0 12.6 0.9 0.8
NIIT Buy 43 52 714 1,162 1,304 14.8 15.1 7.1 8.8 6.1 4.9 1.0 0.9 16.7 18.4 0.5 0.3
Persistent Neutral 381 - 1,523 1,187 1,274 26.7 26.0 34.5 42.6 11.0 8.9 1.6 1.4 14.4 15.4 1.0 0.8
TCS Neutral 1,258 - 246,238 60,787 68,558 30.1 29.2 65.5 73.6 19.2 17.1 6.0 4.8 31.3 28.2 3.8 3.3
Tech Mahindra Neutral 723 - 9,220 6,282 6,477 17.5 16.5 82.9 85.0 8.7 8.5 1.9 1.6 21.6 18.4 1.4 1.3
Wipro Buy 386 451 94,936 44,597 49,033 20.3 20.5 26.6 30.1 14.5 12.8 2.8 2.4 19.5 18.9 1.8 1.5
Media
D B Corp Buy 201 269 3,689 1,638 1,851 25.8 26.6 13.5 16.1 14.9 12.5 3.3 2.8 23.9 24.2 2.2 1.8
HT Media Buy 99 148 2,331 2,224 2,509 16.6 17.2 8.6 10.8 11.6 9.2 1.4 1.2 12.9 14.3 0.6 0.5
Jagran Prakashan Buy 86 125 2,729 1,521 1,698 22.6 23.1 6.2 6.4 14.0 13.4 3.4 3.0 20.7 23.9 2.1 1.8
PVR Neutral 165 - 427 625 732 16.5 15.7 11.9 13.3 13.8 12.4 1.4 1.2 11.9 12.0 1.1 0.9
Sun TV Network Neutral 306 - 12,071 2,002 2,296 77.1 76.7 18.9 22.1 16.2 13.9 4.2 3.6 27.7 28.3 5.5 4.6Metals & Mining
Bhushan Steel Reduce 473 429 10,042 11,408 13,773 31.0 30.0 53.7 60.8 8.8 7.8 1.3 1.1 15.3 14.9 2.6 2.2
Coal India Neutral 351 - 221,420 68,841 74,509 25.3 25.3 24.1 26.1 14.6 13.4 4.0 3.3 30.4 26.8 2.3 2.0
Electrosteel Castings Neutral 21 - 730 1,984 2,074 11.2 12.6 2.0 2.7 10.4 7.8 0.4 0.2 4.2 5.5 0.5 0.5
Hind. Zinc Buy 119 141 50,218 13,050 14,585 51.4 52.1 14.5 16.5 8.2 7.2 1.6 1.3 20.8 19.9 2.1 1.4
Hindalco Neutral 124 - 23,779 83,212 91,057 9.0 9.9 13.7 18.1 9.1 6.9 0.7 0.6 7.9 9.6 0.5 0.5
JSW Steel Neutral 704 - 15,697 39,592 44,910 18.0 17.7 74.7 88.9 9.4 7.9 0.9 0.8 10.7 11.6 0.8 0.7
MOIL Accumulate 279 296 4,679 1,007 1,091 56.6 56.9 29.4 31.9 9.5 8.7 1.7 1.5 19.0 18.2 2.4 2.0
Monnet Ispat Accumulate 393 447 2,528 3,115 3,748 22.1 25.1 59.1 66.8 6.7 5.9 0.9 0.8 15.6 15.3 1.6 1.2
www.angelbroking.com
July 10, 2012
Market Outlook
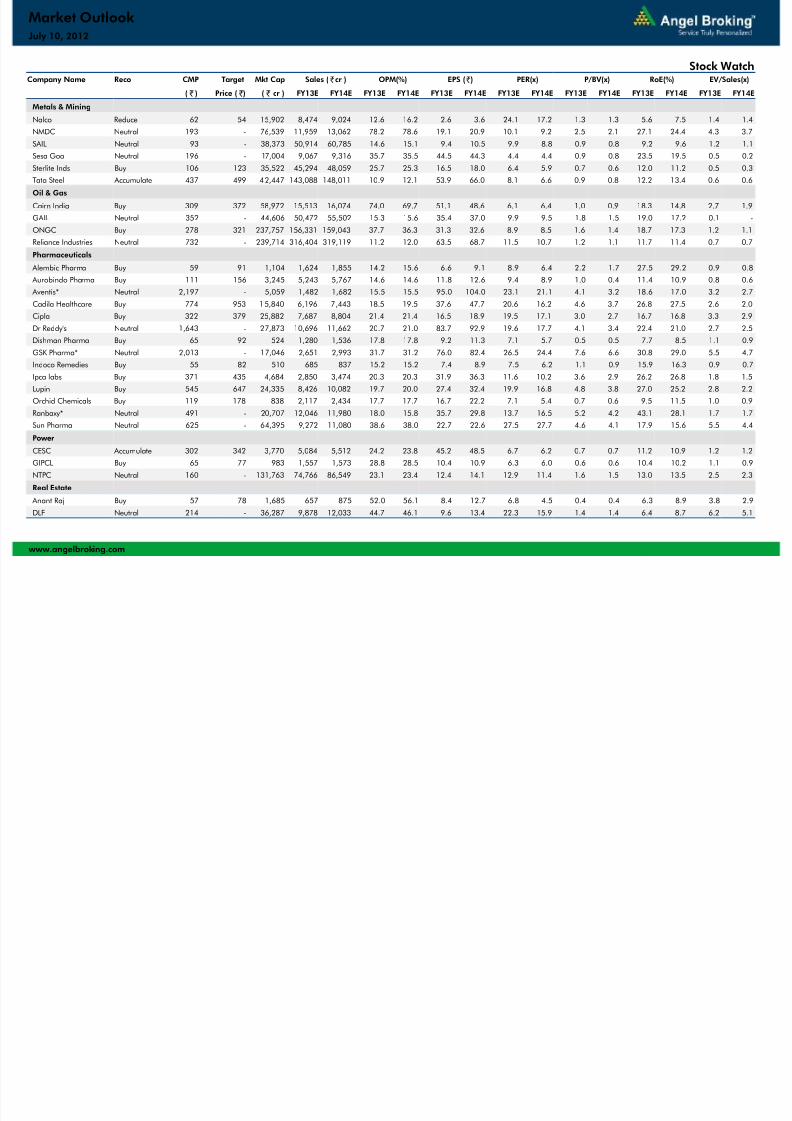
Stock Watch
7/31/2019 Market Outlook 100712
http://slidepdf.com/reader/full/market-outlook-100712 11/14
Company Name Reco CMP Target Mkt Cap Sales ( cr ) OPM(%) EPS () PER(x) P/BV(x) RoE(%) EV/Sales(x)
( ) Price ( ) ( cr ) FY13E FY14E FY13E FY14E FY13E FY14E FY13E FY14E FY13E FY14E FY13E FY14E FY13E FY14E
Metals & Mining
Nalco Reduce 62 54 15,902 8,474 9,024 12.6 16.2 2.6 3.6 24.1 17.2 1.3 1.3 5.6 7.5 1.4 1.4
NMDC Neutral 193 - 76,539 11,959 13,062 78.2 78.6 19.1 20.9 10.1 9.2 2.5 2.1 27.1 24.4 4.3 3.7
SAIL Neutral 93 - 38,373 50,914 60,785 14.6 15.1 9.4 10.5 9.9 8.8 0.9 0.8 9.2 9.6 1.2 1.1
Sesa Goa Neutral 196 - 17,004 9,067 9,316 35.7 35.5 44.5 44.3 4.4 4.4 0.9 0.8 23.5 19.5 0.5 0.2
Sterlite Inds Buy 106 123 35,522 45,294 48,059 25.7 25.3 16.5 18.0 6.4 5.9 0.7 0.6 12.0 11.2 0.5 0.3
Tata Steel Accumulate 437 499 42,447 143,088 148,011 10.9 12.1 53.9 66.0 8.1 6.6 0.9 0.8 12.2 13.4 0.6 0.6
Oil & GasCairn India Buy 309 372 58,972 15,513 16,074 74.0 69.7 51.1 48.6 6.1 6.4 1.0 0.9 18.3 14.8 2.7 1.9
GAIL Neutral 352 - 44,606 50,472 55,502 15.3 15.6 35.4 37.0 9.9 9.5 1.8 1.5 19.0 17.2 0.1 -
ONGC Buy 278 321 237,757 156,331 159,043 37.7 36.3 31.3 32.6 8.9 8.5 1.6 1.4 18.7 17.3 1.2 1.1
Reliance Industries Neutral 732 - 239,714 316,404 319,119 11.2 12.0 63.5 68.7 11.5 10.7 1.2 1.1 11.7 11.4 0.7 0.7
Pharmaceuticals
Alembic Pharma Buy 59 91 1,104 1,624 1,855 14.2 15.6 6.6 9.1 8.9 6.4 2.2 1.7 27.5 29.2 0.9 0.8
Aurobindo Pharma Buy 111 156 3,245 5,243 5,767 14.6 14.6 11.8 12.6 9.4 8.9 1.0 0.4 11.4 10.9 0.8 0.6
Aventis* Neutral 2,197 - 5,059 1,482 1,682 15.5 15.5 95.0 104.0 23.1 21.1 4.1 3.2 18.6 17.0 3.2 2.7
Cadila Healthcare Buy 774 953 15,840 6,196 7,443 18.5 19.5 37.6 47.7 20.6 16.2 4.6 3.7 26.8 27.5 2.6 2.0
Cipla Buy 322 379 25,882 7,687 8,804 21.4 21.4 16.5 18.9 19.5 17.1 3.0 2.7 16.7 16.8 3.3 2.9
Dr Reddy's Neutral 1,643 - 27,873 10,696 11,662 20.7 21.0 83.7 92.9 19.6 17.7 4.1 3.4 22.4 21.0 2.7 2.5
Dishman Pharma Buy 65 92 524 1,280 1,536 17.8 17.8 9.2 11.3 7.1 5.7 0.5 0.5 7.7 8.5 1.1 0.9
GSK Pharma* Neutral 2,013 - 17,046 2,651 2,993 31.7 31.2 76.0 82.4 26.5 24.4 7.6 6.6 30.8 29.0 5.5 4.7
Indoco Remedies Buy 55 82 510 685 837 15.2 15.2 7.4 8.9 7.5 6.2 1.1 0.9 15.9 16.3 0.9 0.7
Ipca labs Buy 371 435 4,684 2,850 3,474 20.3 20.3 31.9 36.3 11.6 10.2 3.6 2.9 26.2 26.8 1.8 1.5
Lupin Buy 545 647 24,335 8,426 10,082 19.7 20.0 27.4 32.4 19.9 16.8 4.8 3.8 27.0 25.2 2.8 2.2Orchid Chemicals Buy 119 178 838 2,117 2,434 17.7 17.7 16.7 22.2 7.1 5.4 0.7 0.6 9.5 11.5 1.0 0.9
Ranbaxy* Neutral 491 - 20,707 12,046 11,980 18.0 15.8 35.7 29.8 13.7 16.5 5.2 4.2 43.1 28.1 1.7 1.7
Sun Pharma Neutral 625 - 64,395 9,272 11,080 38.6 38.0 22.7 22.6 27.5 27.7 4.6 4.1 17.9 15.6 5.5 4.4
Power
CESC Accumulate 302 342 3,770 5,084 5,512 24.2 23.8 45.2 48.5 6.7 6.2 0.7 0.7 11.2 10.9 1.2 1.2
GIPCL Buy 65 77 983 1,557 1,573 28.8 28.5 10.4 10.9 6.3 6.0 0.6 0.6 10.4 10.2 1.1 0.9
NTPC Neutral 160 - 131,763 74,766 86,549 23.1 23.4 12.4 14.1 12.9 11.4 1.6 1.5 13.0 13.5 2.5 2.3
Real Estate
Anant Raj Buy 57 78 1,685 657 875 52.0 56.1 8.4 12.7 6.8 4.5 0.4 0.4 6.3 8.9 3.8 2.9
DLF Neutral 214 - 36,287 9,878 12,033 44.7 46.1 9.6 13.4 22.3 15.9 1.4 1.4 6.4 8.7 6.2 5.1
www.angelbroking.com
July 10, 2012
Market Outlook
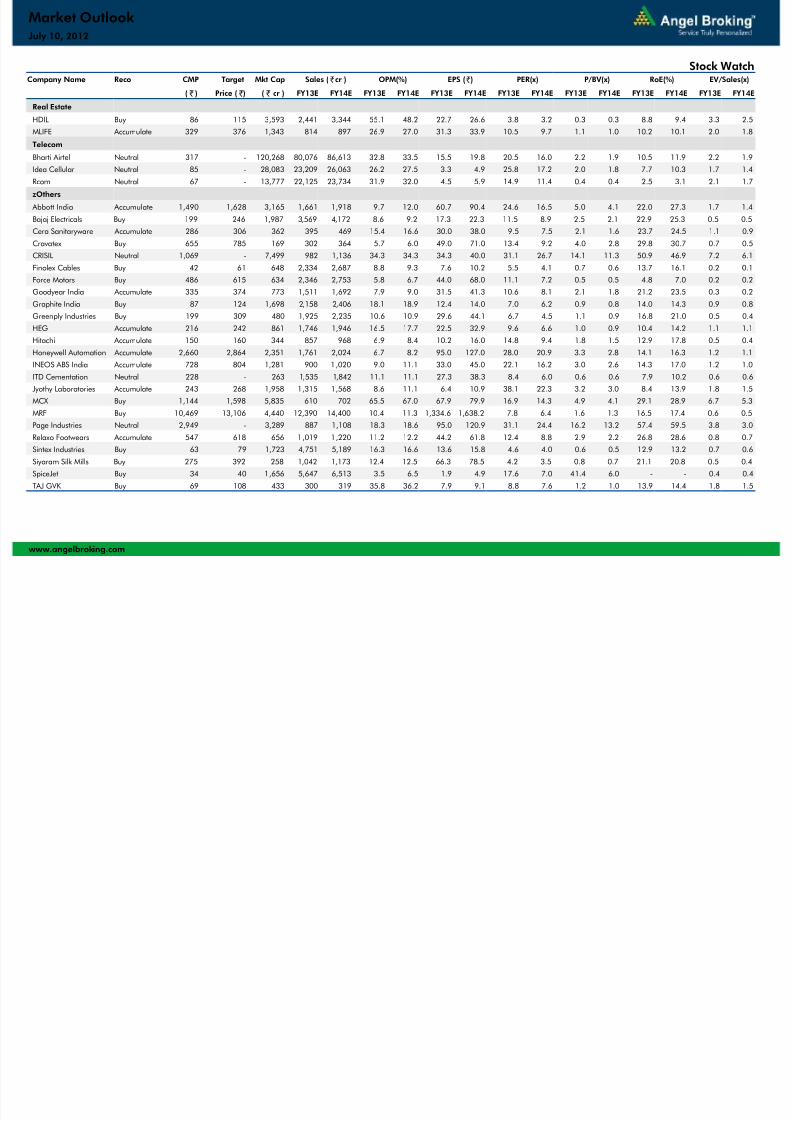
Stock Watch
7/31/2019 Market Outlook 100712
http://slidepdf.com/reader/full/market-outlook-100712 12/14
Company Name Reco CMP Target Mkt Cap Sales ( cr ) OPM(%) EPS () PER(x) P/BV(x) RoE(%) EV/Sales(x)
( ) Price ( ) ( cr ) FY13E FY14E FY13E FY14E FY13E FY14E FY13E FY14E FY13E FY14E FY13E FY14E FY13E FY14E
Real Estate
HDIL Buy 86 115 3,593 2,441 3,344 55.1 48.2 22.7 26.6 3.8 3.2 0.3 0.3 8.8 9.4 3.3 2.5
MLIFE Accumulate 329 376 1,343 814 897 26.9 27.0 31.3 33.9 10.5 9.7 1.1 1.0 10.2 10.1 2.0 1.8
Telecom
Bharti Airtel Neutral 317 - 120,268 80,076 86,613 32.8 33.5 15.5 19.8 20.5 16.0 2.2 1.9 10.5 11.9 2.2 1.9
Idea Cellular Neutral 85 - 28,083 23,209 26,063 26.2 27.5 3.3 4.9 25.8 17.2 2.0 1.8 7.7 10.3 1.7 1.4
Rcom Neutral 67 - 13,777 22,125 23,734 31.9 32.0 4.5 5.9 14.9 11.4 0.4 0.4 2.5 3.1 2.1 1.7
zOthers Abbott India Accumulate 1,490 1,628 3,165 1,661 1,918 9.7 12.0 60.7 90.4 24.6 16.5 5.0 4.1 22.0 27.3 1.7 1.4
Bajaj Electricals Buy 199 246 1,987 3,569 4,172 8.6 9.2 17.3 22.3 11.5 8.9 2.5 2.1 22.9 25.3 0.5 0.5
Cera Sanitaryware Accumulate 286 306 362 395 469 15.4 16.6 30.0 38.0 9.5 7.5 2.1 1.6 23.7 24.5 1.1 0.9
Cravatex Buy 655 785 169 302 364 5.7 6.0 49.0 71.0 13.4 9.2 4.0 2.8 29.8 30.7 0.7 0.5
CRISIL Neutral 1,069 - 7,499 982 1,136 34.3 34.3 34.3 40.0 31.1 26.7 14.1 11.3 50.9 46.9 7.2 6.1
Finolex Cables Buy 42 61 648 2,334 2,687 8.8 9.3 7.6 10.2 5.5 4.1 0.7 0.6 13.7 16.1 0.2 0.1
Force Motors Buy 486 615 634 2,346 2,753 5.8 6.7 44.0 68.0 11.1 7.2 0.5 0.5 4.8 7.0 0.2 0.2
Goodyear India Accumulate 335 374 773 1,511 1,692 7.9 9.0 31.5 41.3 10.6 8.1 2.1 1.8 21.2 23.5 0.3 0.2
Graphite India Buy 87 124 1,698 2,158 2,406 18.1 18.9 12.4 14.0 7.0 6.2 0.9 0.8 14.0 14.3 0.9 0.8
Greenply Industries Buy 199 309 480 1,925 2,235 10.6 10.9 29.6 44.1 6.7 4.5 1.1 0.9 16.8 21.0 0.5 0.4
HEG Accumulate 216 242 861 1,746 1,946 16.5 17.7 22.5 32.9 9.6 6.6 1.0 0.9 10.4 14.2 1.1 1.1
Hitachi Accumulate 150 160 344 857 968 6.9 8.4 10.2 16.0 14.8 9.4 1.8 1.5 12.9 17.8 0.5 0.4
Honeywell Automation Accumulate 2,660 2,864 2,351 1,761 2,024 6.7 8.2 95.0 127.0 28.0 20.9 3.3 2.8 14.1 16.3 1.2 1.1
INEOS ABS India Accumulate 728 804 1,281 900 1,020 9.0 11.1 33.0 45.0 22.1 16.2 3.0 2.6 14.3 17.0 1.2 1.0
ITD Cementation Neutral 228 - 263 1,535 1,842 11.1 11.1 27.3 38.3 8.4 6.0 0.6 0.6 7.9 10.2 0.6 0.6
Jyothy Laboratories Accumulate 243 268 1,958 1,315 1,568 8.6 11.1 6.4 10.9 38.1 22.3 3.2 3.0 8.4 13.9 1.8 1.5MCX Buy 1,144 1,598 5,835 610 702 65.5 67.0 67.9 79.9 16.9 14.3 4.9 4.1 29.1 28.9 6.7 5.3
MRF Buy 10,469 13,106 4,440 12,390 14,400 10.4 11.3 1,334.6 1,638.2 7.8 6.4 1.6 1.3 16.5 17.4 0.6 0.5
Page Industries Neutral 2,949 - 3,289 887 1,108 18.3 18.6 95.0 120.9 31.1 24.4 16.2 13.2 57.4 59.5 3.8 3.0
Relaxo Footwears Accumulate 547 618 656 1,019 1,220 11.2 12.2 44.2 61.8 12.4 8.8 2.9 2.2 26.8 28.6 0.8 0.7
Sintex Industries Buy 63 79 1,723 4,751 5,189 16.3 16.6 13.6 15.8 4.6 4.0 0.6 0.5 12.9 13.2 0.7 0.6
Siyaram Silk Mills Buy 275 392 258 1,042 1,173 12.4 12.5 66.3 78.5 4.2 3.5 0.8 0.7 21.1 20.8 0.5 0.4
SpiceJet Buy 34 40 1,656 5,647 6,513 3.5 6.5 1.9 4.9 17.6 7.0 41.4 6.0 - - 0.4 0.4
TAJ GVK Buy 69 108 433 300 319 35.8 36.2 7.9 9.1 8.8 7.6 1.2 1.0 13.9 14.4 1.8 1.5
www.angelbroking.com
July 10, 2012
Market Outlook
Stock Watch
7/31/2019 Market Outlook 100712
http://slidepdf.com/reader/full/market-outlook-100712 13/14
Company Name Reco CMP Target Mkt Cap Sales ( cr ) OPM(%) EPS () PER(x) P/BV(x) RoE(%) EV/Sales(x)
( ) Price ( ) ( cr ) FY13E FY14E FY13E FY14E FY13E FY14E FY13E FY14E FY13E FY14E FY13E FY14E FY13E FY14E
zOthers
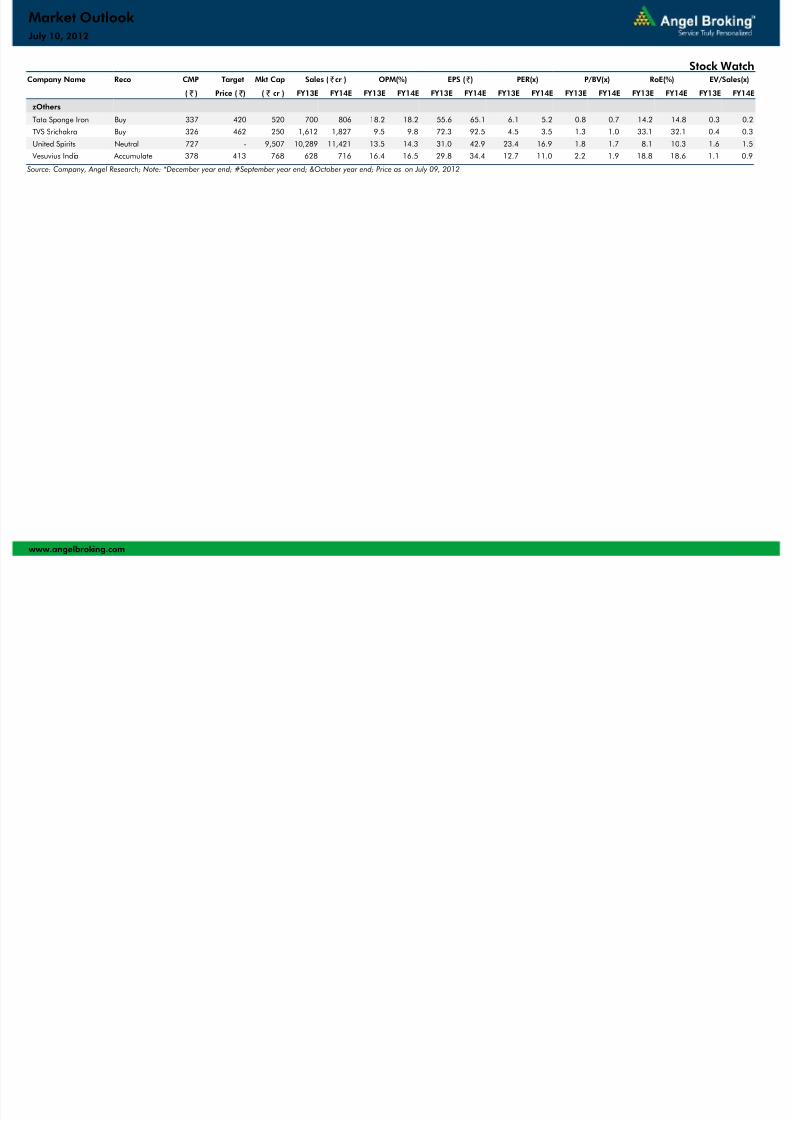
Tata Sponge Iron Buy 337 420 520 700 806 18.2 18.2 55.6 65.1 6.1 5.2 0.8 0.7 14.2 14.8 0.3 0.2
TVS Srichakra Buy 326 462 250 1,612 1,827 9.5 9.8 72.3 92.5 4.5 3.5 1.3 1.0 33.1 32.1 0.4 0.3
United Spirits Neutral 727 - 9,507 10,289 11,421 13.5 14.3 31.0 42.9 23.4 16.9 1.8 1.7 8.1 10.3 1.6 1.5
Vesuvius India Accumulate 378 413 768 628 716 16.4 16.5 29.8 34.4 12.7 11.0 2.2 1.9 18.8 18.6 1.1 0.9
Source: Company, Angel Research; Note: *December year end; #September year end; &October year end; Price as on July 09, 2012
www.angelbroking.com
July 10, 2012
Market Outlook
Stock Watch
7/31/2019 Market Outlook 100712
http://slidepdf.com/reader/full/market-outlook-100712 14/14
July 10, 2012
Market Outlook


![British Columbia Labour Market Outlook 2010 - 2020 · Labour Market OutlookLabour Market Outlook British Columbia Labour Market Outlook: 2010-2020 [2] B.C. Labour Market Outlook,](https://img.pdfslide.net/doc/110x75/5e167e8e481eae63a43f8127/british-columbia-labour-market-outlook-2010-2020-labour-market-outlooklabour-market.jpg)