Embed Size (px)
Citation preview
THINK AHEAD. STAY AHEAD.
MARKET OUTLOOK:
WHAT’S NEW…WHAT’S THE RISK?
JANUARY 2017
Michael White, CFA
Portfolio Manager
1
-----------------------------------
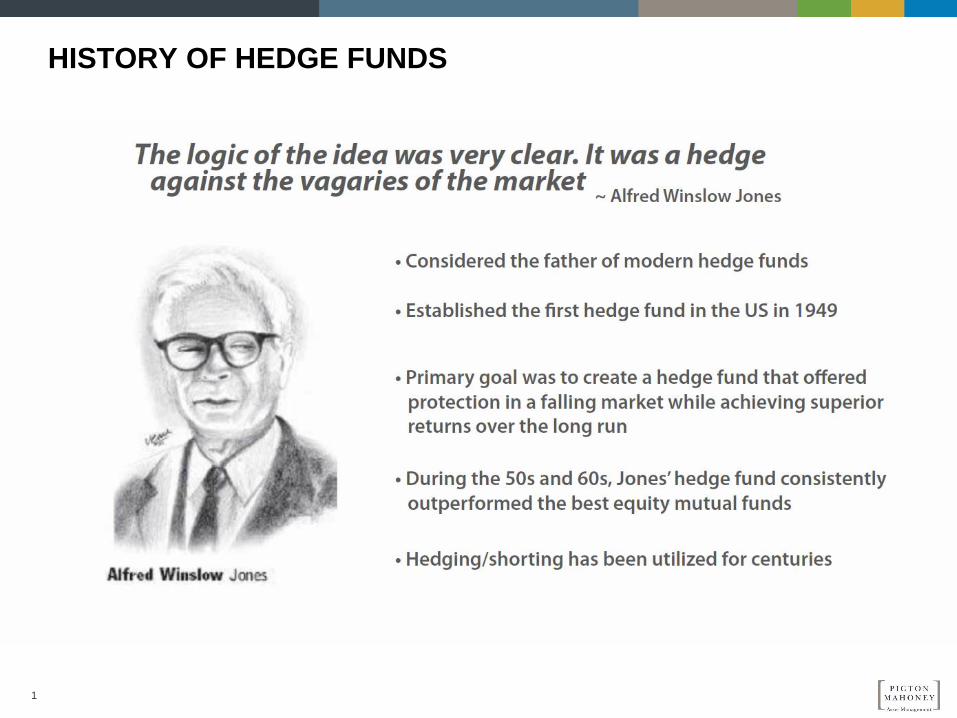
HISTORY OF HEDGE FUNDS
2
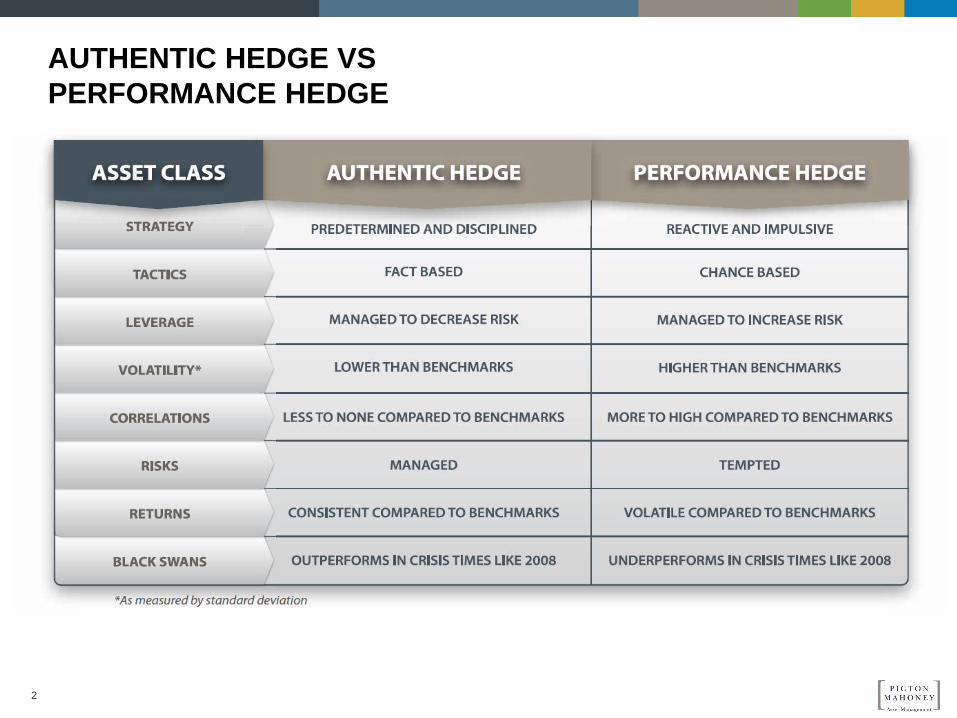
AUTHENTIC HEDGE VS
PERFORMANCE HEDGE
3
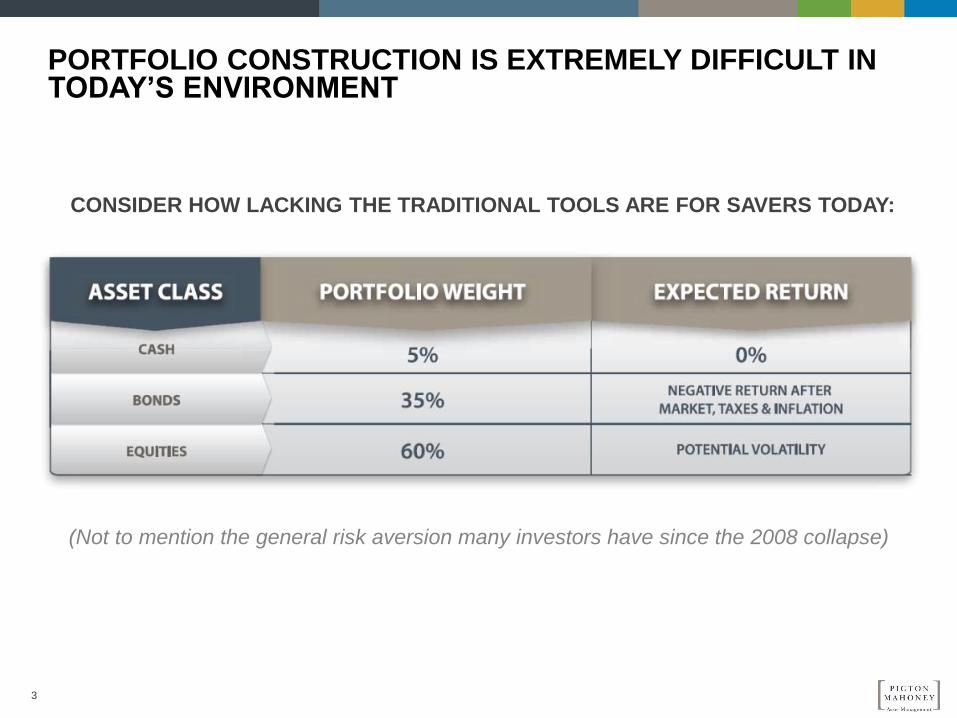
PORTFOLIO CONSTRUCTION IS EXTREMELY DIFFICULT IN TODAY’S ENVIRONMENT
CONSIDER HOW LACKING THE TRADITIONAL TOOLS ARE FOR SAVERS TODAY:
(Not to mention the general risk aversion many investors have since the 2008 collapse)
4
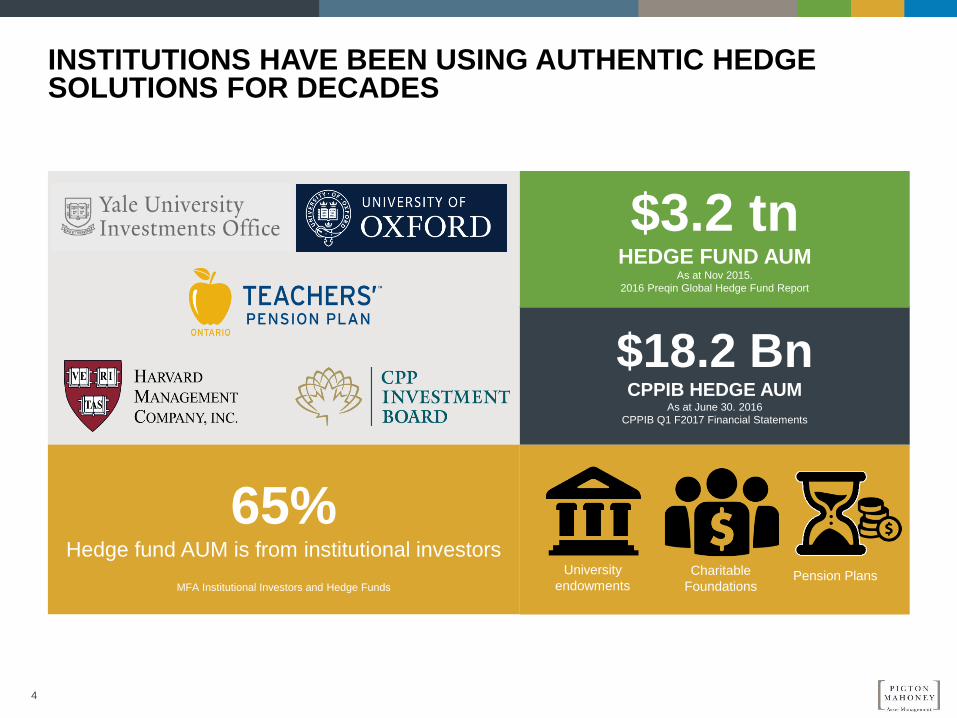
65%
Hedge fund AUM is from institutional investors
MFA Institutional Investors and Hedge Funds
INSTITUTIONS HAVE BEEN USING AUTHENTIC HEDGE SOLUTIONS FOR DECADES
$18.2 Bn CPPIB HEDGE AUM
As at June 30. 2016
CPPIB Q1 F2017 Financial Statements
$3.2 tn HEDGE FUND AUM
As at Nov 2015.
2016 Preqin Global Hedge Fund Report
University
endowments Charitable
Foundations Pension Plans
5
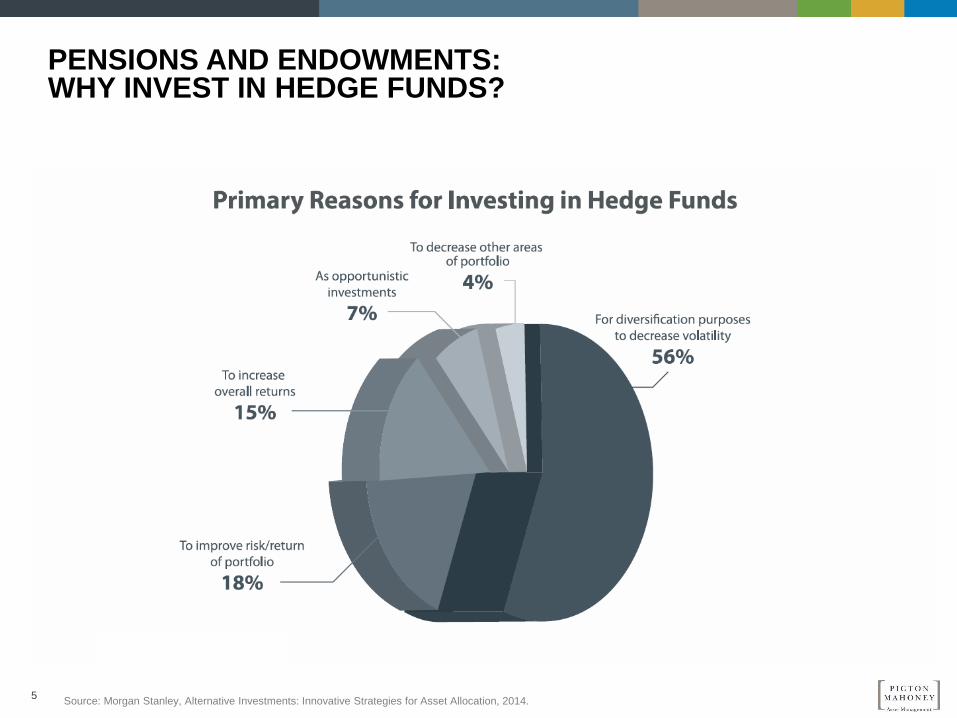
PENSIONS AND ENDOWMENTS: WHY INVEST IN HEDGE FUNDS?
Source: Morgan Stanley, Alternative Investments: Innovative Strategies for Asset Allocation, 2014.
6
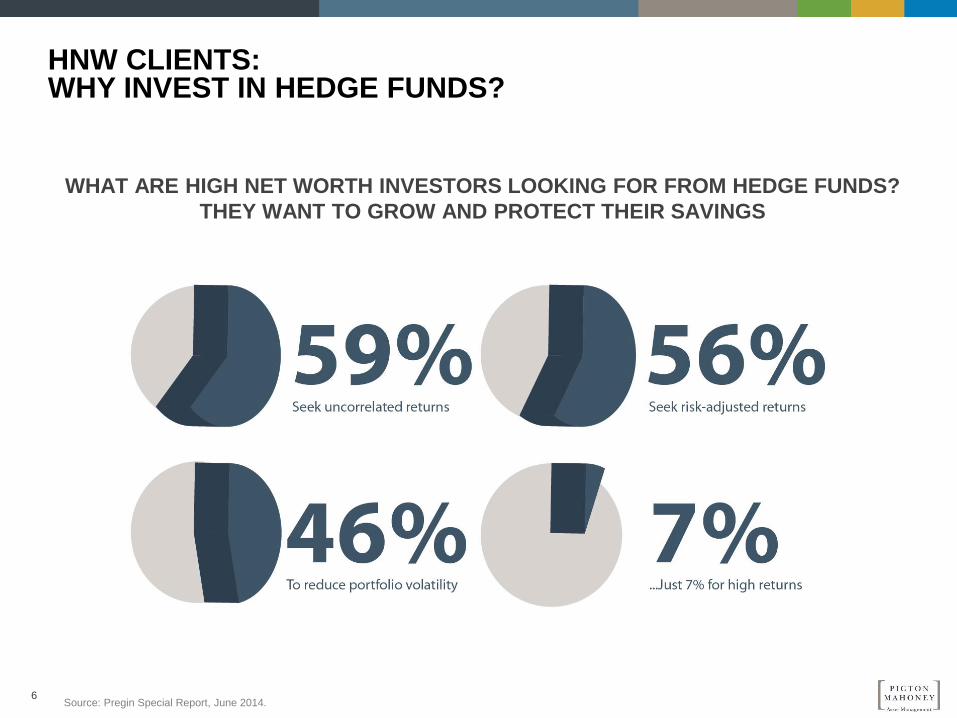
HNW CLIENTS: WHY INVEST IN HEDGE FUNDS?
WHAT ARE HIGH NET WORTH INVESTORS LOOKING FOR FROM HEDGE FUNDS?
THEY WANT TO GROW AND PROTECT THEIR SAVINGS
Source: Pregin Special Report, June 2014.
7
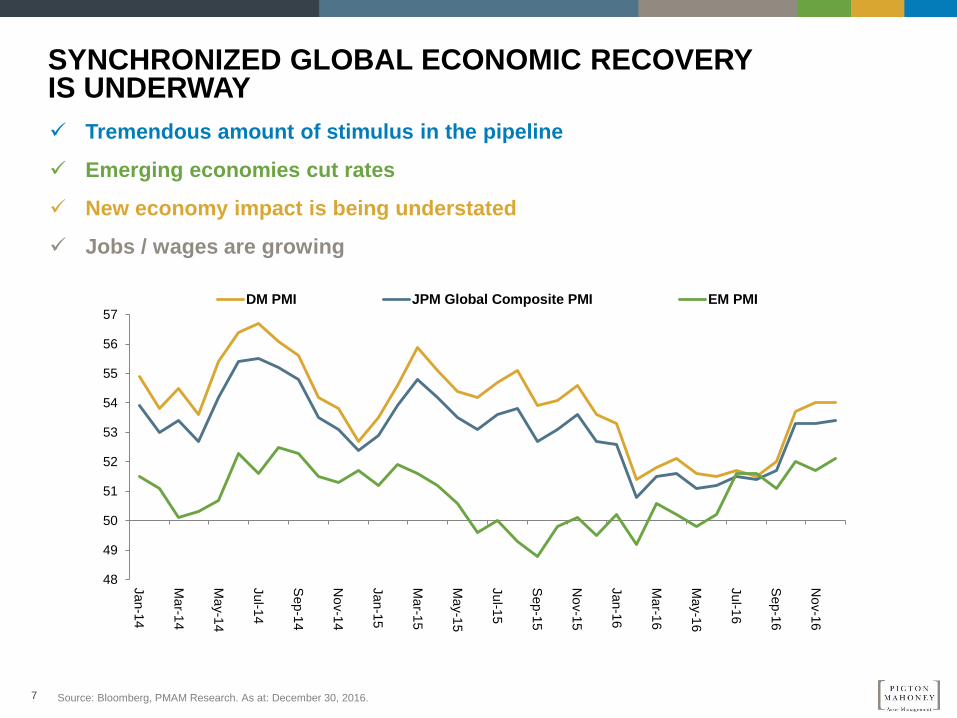
SYNCHRONIZED GLOBAL ECONOMIC RECOVERY IS UNDERWAY
Tremendous amount of stimulus in the pipeline
Emerging economies cut rates
New economy impact is being understated
Jobs / wages are growing
Source: Bloomberg, PMAM Research. As at: December 30, 2016.
48
49
50
51
52
53
54
55
56
57
Jan-1
4
Ma
r-14
Ma
y-1
4
Jul-1
4
Sep-1
4
No
v-1
4
Jan-1
5
Ma
r-15
Ma
y-1
5
Jul-1
5
Sep-1
5
No
v-1
5
Jan-1
6
Ma
r-16
Ma
y-1
6
Jul-1
6
Sep-1
6
No
v-1
6
DM PMI JPM Global Composite PMI EM PMI
8
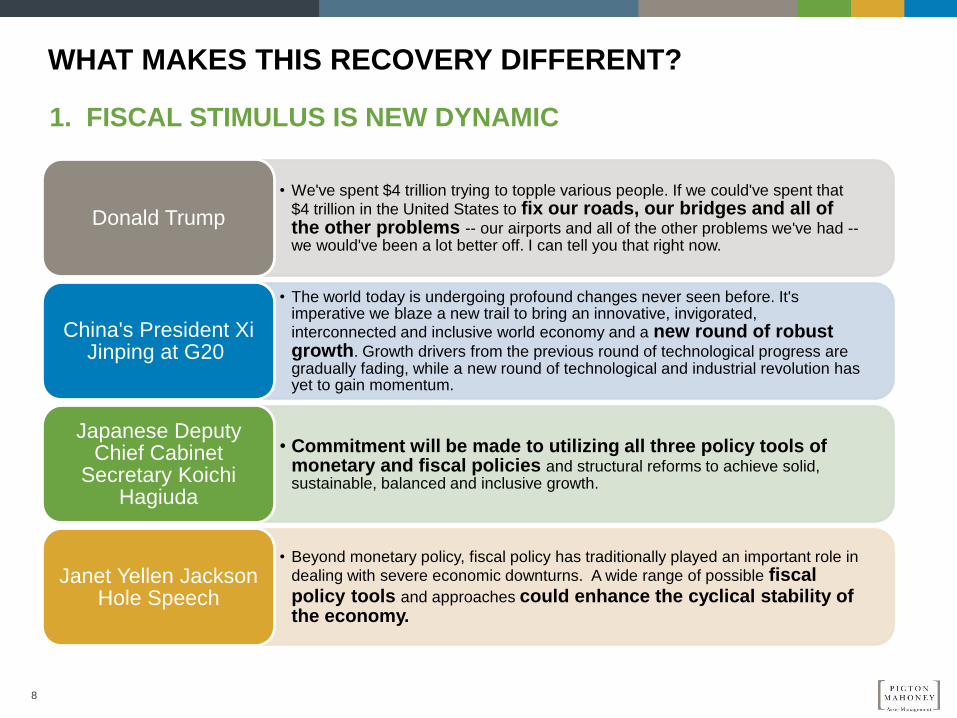
WHAT MAKES THIS RECOVERY DIFFERENT?
• We've spent $4 trillion trying to topple various people. If we could've spent that
$4 trillion in the United States to fix our roads, our bridges and all of the other problems -- our airports and all of the other problems we've had -- we would've been a lot better off. I can tell you that right now.
Donald Trump
• The world today is undergoing profound changes never seen before. It's imperative we blaze a new trail to bring an innovative, invigorated, interconnected and inclusive world economy and a new round of robust growth. Growth drivers from the previous round of technological progress are gradually fading, while a new round of technological and industrial revolution has yet to gain momentum.
China's President Xi Jinping at G20
• Commitment will be made to utilizing all three policy tools of monetary and fiscal policies and structural reforms to achieve solid, sustainable, balanced and inclusive growth.
Japanese Deputy Chief Cabinet
Secretary Koichi Hagiuda
• Beyond monetary policy, fiscal policy has traditionally played an important role in
dealing with severe economic downturns. A wide range of possible fiscal policy tools and approaches could enhance the cyclical stability of the economy.
Janet Yellen Jackson Hole Speech
1. FISCAL STIMULUS IS NEW DYNAMIC
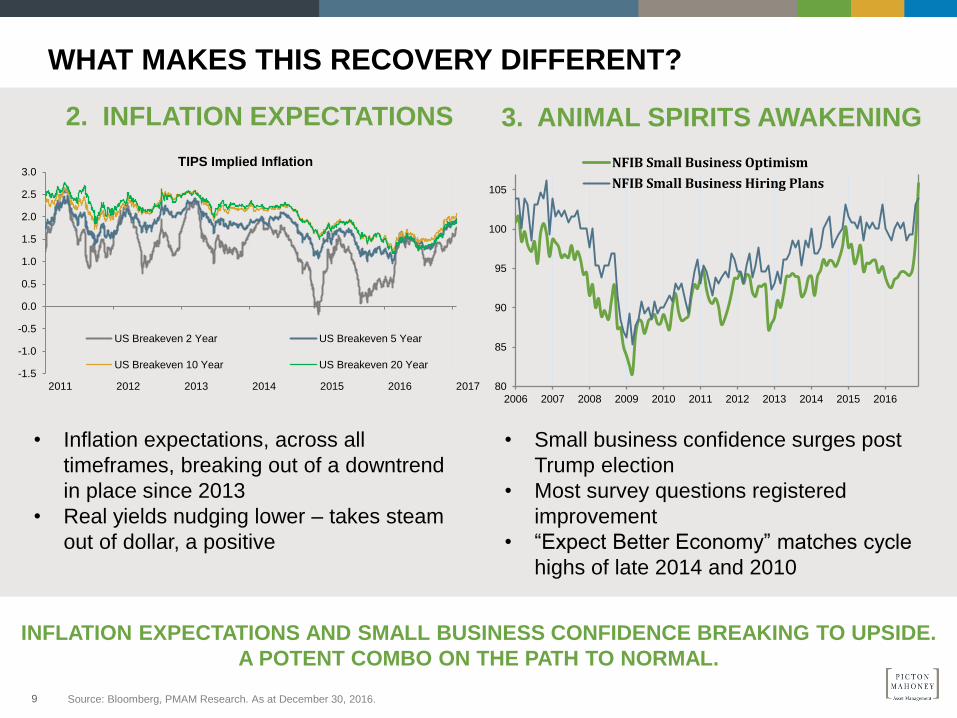
INFLATION EXPECTATIONS AND SMALL BUSINESS CONFIDENCE BREAKING TO UPSIDE.
A POTENT COMBO ON THE PATH TO NORMAL.
• Inflation expectations, across all
timeframes, breaking out of a downtrend
in place since 2013
• Real yields nudging lower – takes steam
out of dollar, a positive
• Small business confidence surges post
Trump election
• Most survey questions registered
improvement
• “Expect Better Economy” matches cycle
highs of late 2014 and 2010
WHAT MAKES THIS RECOVERY DIFFERENT?
2. INFLATION EXPECTATIONS 3. ANIMAL SPIRITS AWAKENING
Source: Bloomberg, PMAM Research. As at December 30, 2016.
-1.5
-1.0
-0.5
0.0
0.5
1.0
1.5
2.0
2.5
3.0
2011 2012 2013 2014 2015 2016 2017
TIPS Implied Inflation
US Breakeven 2 Year US Breakeven 5 Year
US Breakeven 10 Year US Breakeven 20 Year
80
85
90
95
100
105
2006 2007 2008 2009 2010 2011 2012 2013 2014 2015 2016
NFIB Small Business Optimism
NFIB Small Business Hiring Plans
9
10 Source: Bloomberg, Picton Mahoney Asset Management. As at December 31, 2016. Updated quarterly.
Atlanta Fed chart source: RBC Research. As at: April 30, 2016.
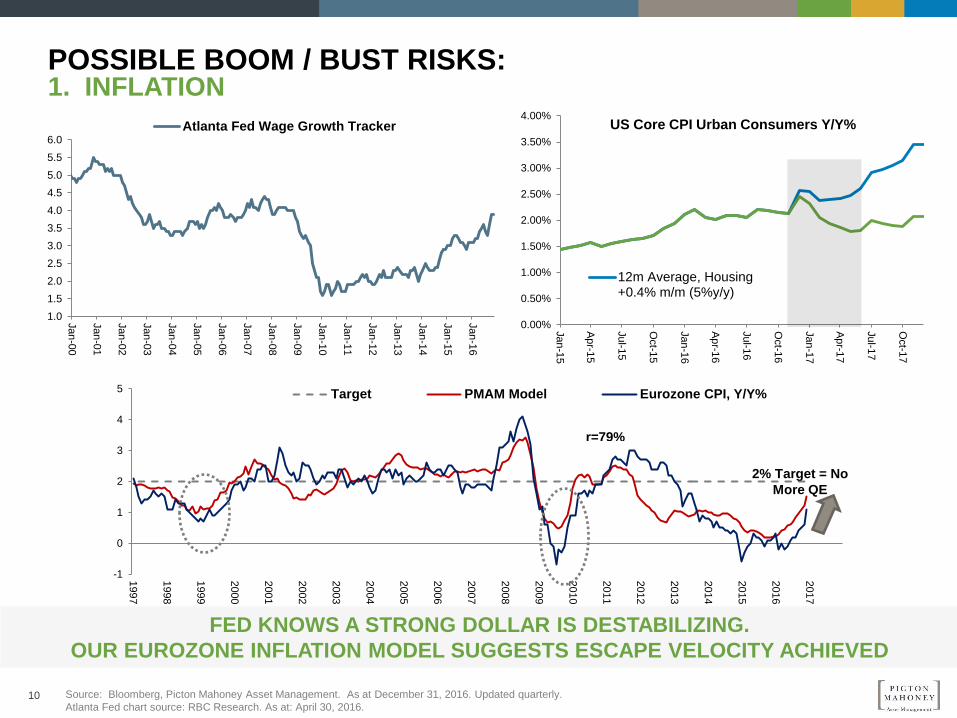
FED KNOWS A STRONG DOLLAR IS DESTABILIZING.
OUR EUROZONE INFLATION MODEL SUGGESTS ESCAPE VELOCITY ACHIEVED
0.00%
0.50%
1.00%
1.50%
2.00%
2.50%
3.00%
3.50%
4.00%
Jan
-15
Ap
r-15
Jul-1
5
Oct-1
5
Jan
-16
Ap
r-16
Jul-1
6
Oct-1
6
Jan
-17
Ap
r-17
Jul-1
7
Oct-1
7
US Core CPI Urban Consumers Y/Y%
12m Average, Housing+0.4% m/m (5%y/y)
-1
0
1
2
3
4
5
1997
1998
1999
2000
2001
2002
2003
2004
2005
2006
2007
2008
2009
2010
2011
2012
2013
2014
2015
2016
2017
Target PMAM Model Eurozone CPI, Y/Y%
r=79%
2% Target = No
More QE
1.0
1.5
2.0
2.5
3.0
3.5
4.0
4.5
5.0
5.5
6.0
Jan
-00
Jan
-01
Jan
-02
Jan
-03
Jan
-04
Jan
-05
Jan
-06
Jan
-07
Jan
-08
Jan
-09
Jan
-10
Jan
-11
Jan
-12
Jan
-13
Jan
-14
Jan
-15
Jan
-16
Atlanta Fed Wage Growth Tracker
POSSIBLE BOOM / BUST RISKS: 1. INFLATION
11
Source: Bloomberg, PMAM Research. As at: Dec 30, 2016.
Source: Morgan Stanley Research. As at: Nov 30, 2016.
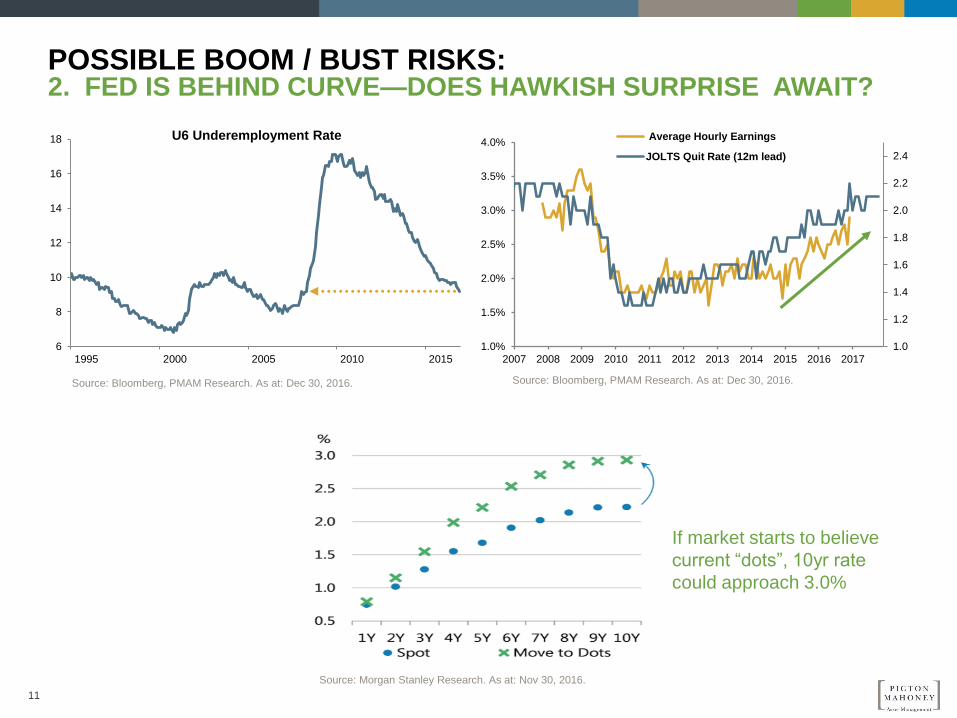
If market starts to believe
current “dots”, 10yr rate
could approach 3.0%
Source: Bloomberg, PMAM Research. As at: Dec 30, 2016.
POSSIBLE BOOM / BUST RISKS: 2. FED IS BEHIND CURVE—DOES HAWKISH SURPRISE AWAIT?
6
8
10
12
14
16
18
1995 2000 2005 2010 2015
U6 Underemployment Rate
1.0
1.2
1.4
1.6
1.8
2.0
2.2
2.4
1.0%
1.5%
2.0%
2.5%
3.0%
3.5%
4.0%
2007 2008 2009 2010 2011 2012 2013 2014 2015 2016 2017
Average Hourly Earnings
JOLTS Quit Rate (12m lead)
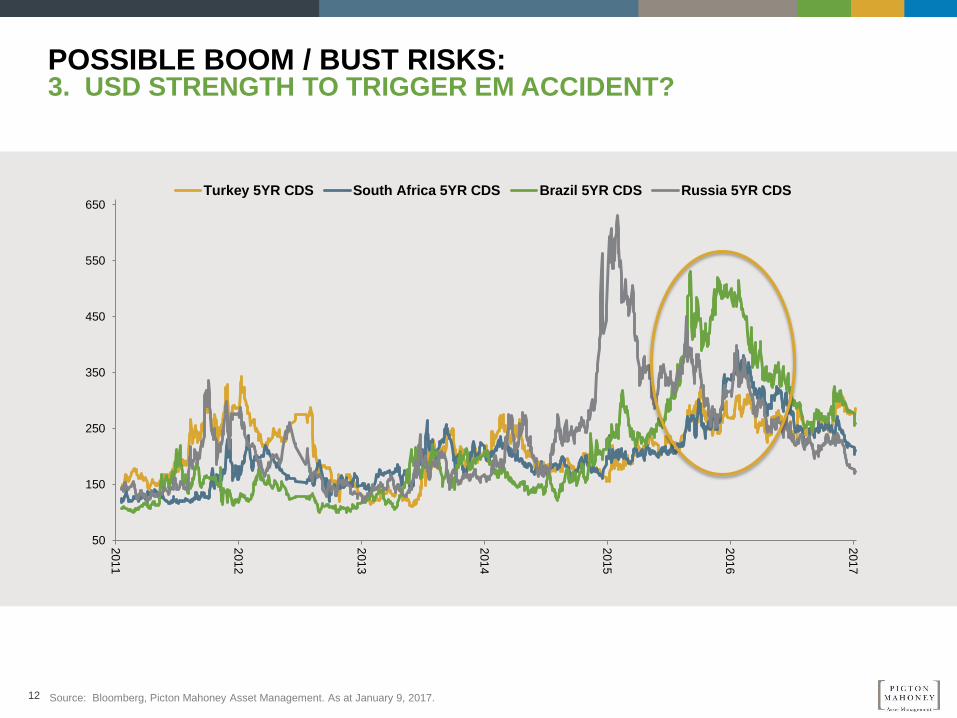
12 Source: Bloomberg, Picton Mahoney Asset Management. As at January 9, 2017.
50
150
250
350
450
550
650
201
1
201
2
201
3
201
4
201
5
201
6
201
7
Turkey 5YR CDS South Africa 5YR CDS Brazil 5YR CDS Russia 5YR CDS
POSSIBLE BOOM / BUST RISKS: 3. USD STRENGTH TO TRIGGER EM ACCIDENT?
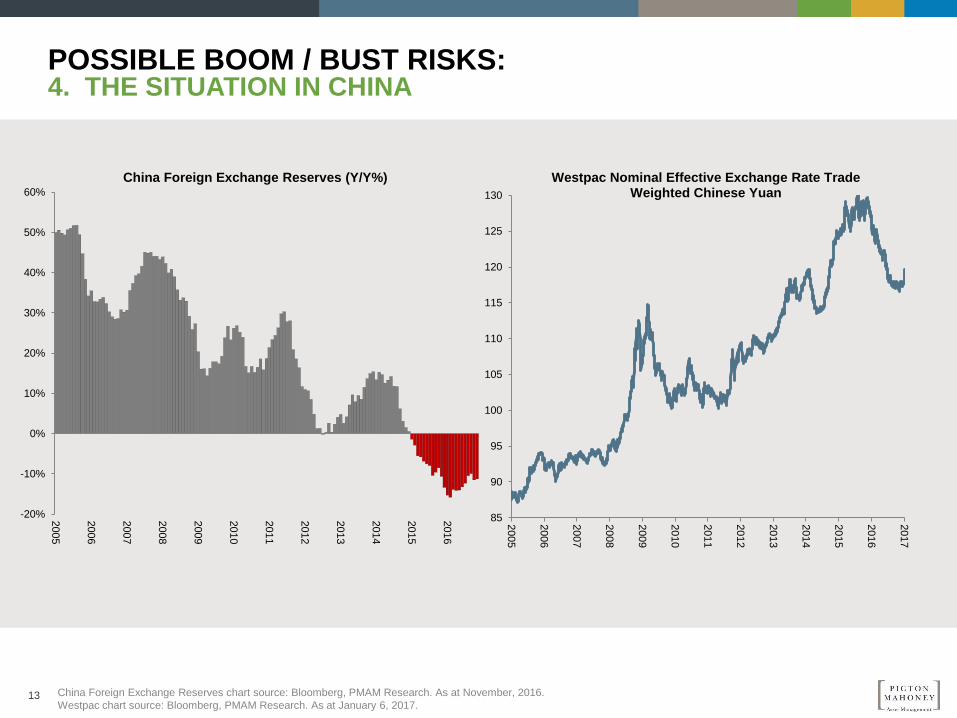
13
China Foreign Exchange Reserves chart source: Bloomberg, PMAM Research. As at November, 2016.
Westpac chart source: Bloomberg, PMAM Research. As at January 6, 2017.
POSSIBLE BOOM / BUST RISKS: 4. THE SITUATION IN CHINA
-20%
-10%
0%
10%
20%
30%
40%
50%
60%
2005
2006
2007
2008
2009
2010
2011
2012
2013
2014
2015
2016
China Foreign Exchange Reserves (Y/Y%)
85
90
95
100
105
110
115
120
125
130
2005
2006
2007
2008
2009
2010
2011
2012
2013
2014
2015
2016
2017
Westpac Nominal Effective Exchange Rate Trade Weighted Chinese Yuan
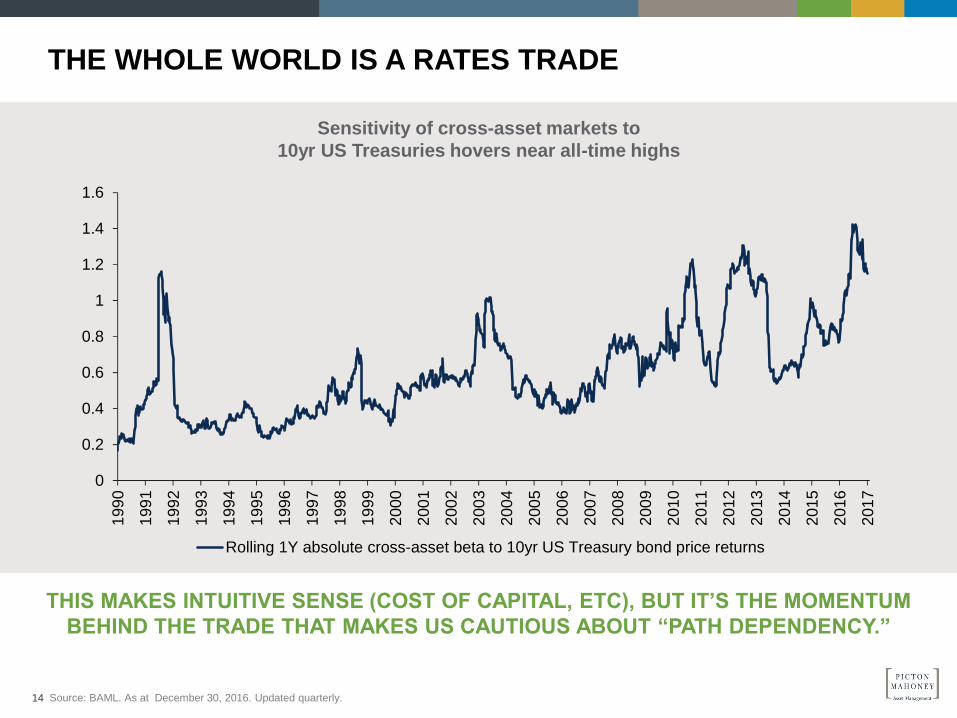
THIS MAKES INTUITIVE SENSE (COST OF CAPITAL, ETC), BUT IT’S THE MOMENTUM
BEHIND THE TRADE THAT MAKES US CAUTIOUS ABOUT “PATH DEPENDENCY.”
THE WHOLE WORLD IS A RATES TRADE
14 Source: BAML. As at December 30, 2016. Updated quarterly.
Sensitivity of cross-asset markets to
10yr US Treasuries hovers near all-time highs
0
0.2
0.4
0.6
0.8
1
1.2
1.4
1.6
199
0
199
1
199
2
199
3
199
4
199
5
199
6
199
7
199
8
199
9
200
0
200
1
200
2
200
3
200
4
200
5
200
6
200
7
200
8
200
9
201
0
201
1
201
2
201
3
201
4
201
5
201
6
201
7
Rolling 1Y absolute cross-asset beta to 10yr US Treasury bond price returns
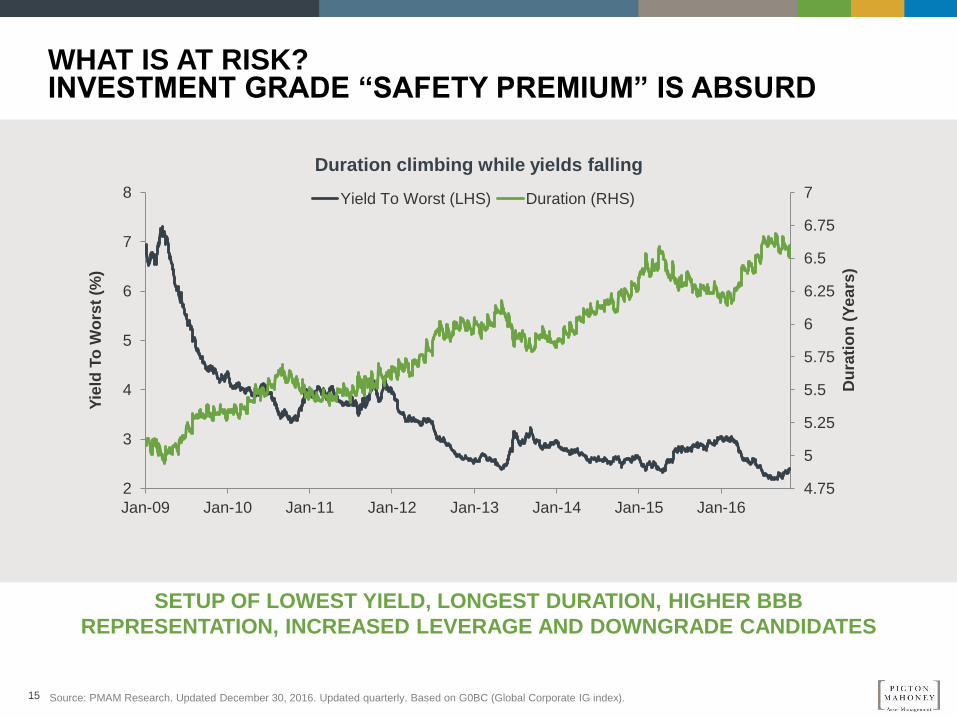
15 Source: PMAM Research. Updated December 30, 2016. Updated quarterly. Based on G0BC (Global Corporate IG index).
SETUP OF LOWEST YIELD, LONGEST DURATION, HIGHER BBB
REPRESENTATION, INCREASED LEVERAGE AND DOWNGRADE CANDIDATES
WHAT IS AT RISK? INVESTMENT GRADE “SAFETY PREMIUM” IS ABSURD
4.75
5
5.25
5.5
5.75
6
6.25
6.5
6.75
7
2
3
4
5
6
7
8
Jan-09 Jan-10 Jan-11 Jan-12 Jan-13 Jan-14 Jan-15 Jan-16
Du
rati
on
(Y
ea
rs)
Yie
ld T
o W
ors
t (%
)
Duration climbing while yields falling
Yield To Worst (LHS) Duration (RHS)
16
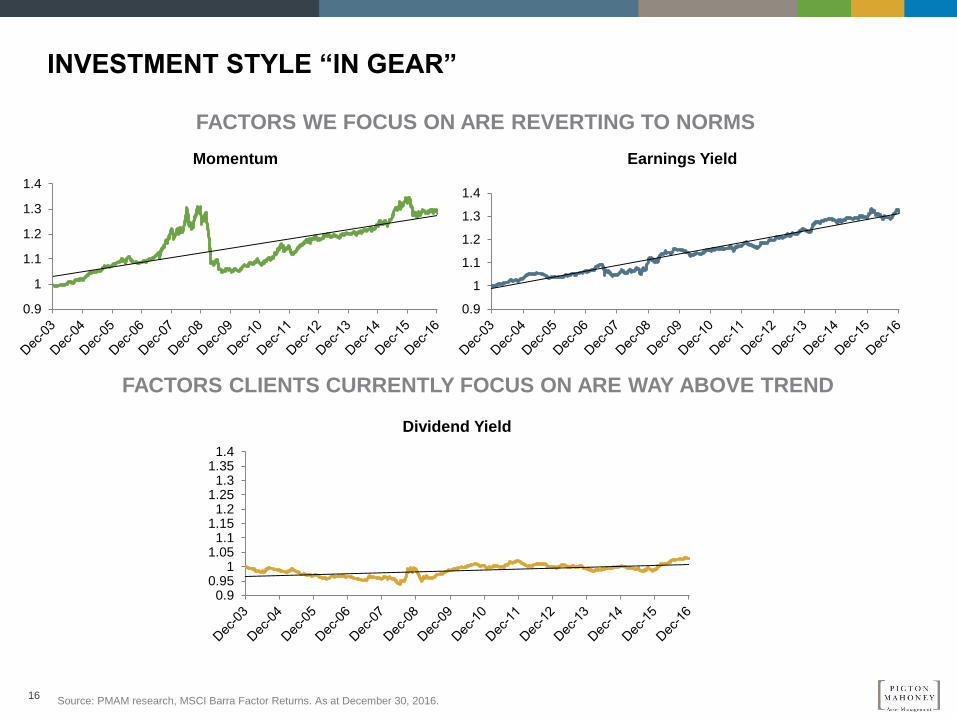
INVESTMENT STYLE “IN GEAR”
FACTORS WE FOCUS ON ARE REVERTING TO NORMS
FACTORS CLIENTS CURRENTLY FOCUS ON ARE WAY ABOVE TREND
Source: PMAM research, MSCI Barra Factor Returns. As at December 30, 2016.
0.9
1
1.1
1.2
1.3
1.4
Momentum
0.9
1
1.1
1.2
1.3
1.4
Earnings Yield
0.90.95
11.05
1.11.15
1.21.25
1.31.35
1.4
Dividend Yield
17
MARKET OUTLOOK (AS AT END Q4/16)
THIS TIME IS DIFFERENT (FOR NOW)
Unlike past false starts this cycle, there are real signs that global economies are entering a more typical late cycle recovery. Trump election is a beacon for great handoff from global monetary policy largesse to fiscal policy stimulus. It appears that “animal spirits” are awakening after a long bunker mentality.
WE REMAIN CONSTRUCTIVE ON EQUITIES / NEGATIVE ON GOVERNMENT BONDS
• After years of “yield chasing”, investors have considerable catch-up ahead of them to position for a more typical cyclical recovery
• Earnings should start growing again while rates are still low enough to keep P/Es elevated
• We maintain bias to cyclicality at the expense of defensive / dividend yielders
NEW MARKET MANTRA: “INFLATE TILL IT BREAKS”
• Strong possibility of boom / bust type of market in 2017
RISKS TO MONITOR:
• Fed is behind the curve and hikes rates more aggressively than expected
• US$ strength is too much for the global economy / markets to bear
• China slowdown and currency devaluation
• Economy slows quicker than expected as financial conditions tighten
• Rise of populism and/or destabilizing regime shifts (trade wars, geopolitical risks)
18
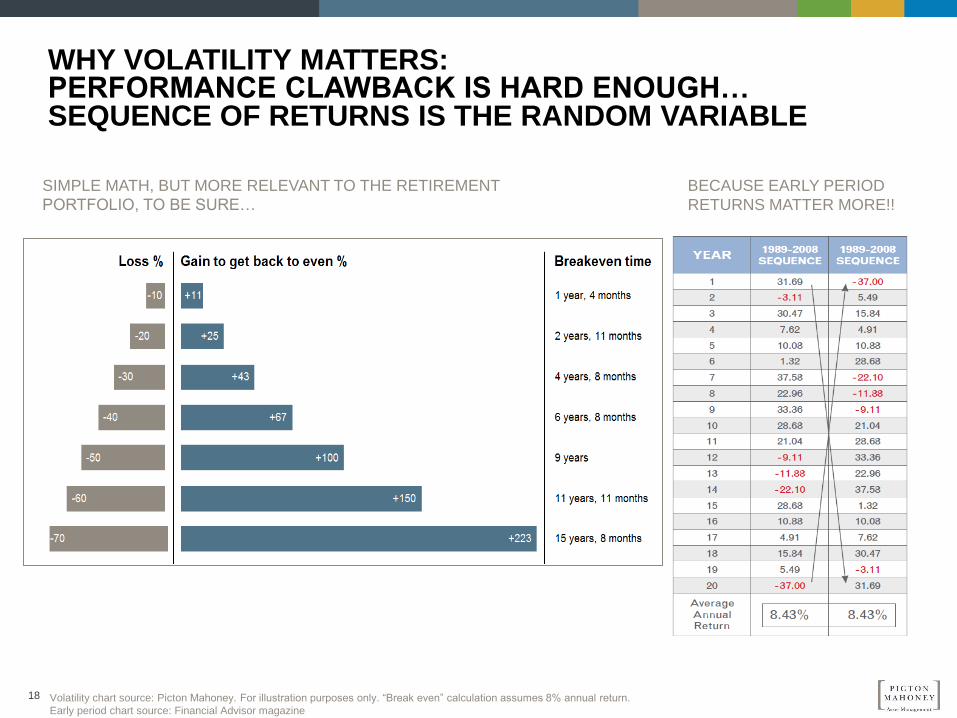
WHY VOLATILITY MATTERS: PERFORMANCE CLAWBACK IS HARD ENOUGH… SEQUENCE OF RETURNS IS THE RANDOM VARIABLE
-10
SIMPLE MATH, BUT MORE RELEVANT TO THE RETIREMENT
PORTFOLIO, TO BE SURE…
-20
-30 +43
-40 +67
-50 +100
-60 +150
-70 +223
BECAUSE EARLY PERIOD
RETURNS MATTER MORE!!
Volatility chart source: Picton Mahoney. For illustration purposes only. “Break even” calculation assumes 8% annual return.
Early period chart source: Financial Advisor magazine
19
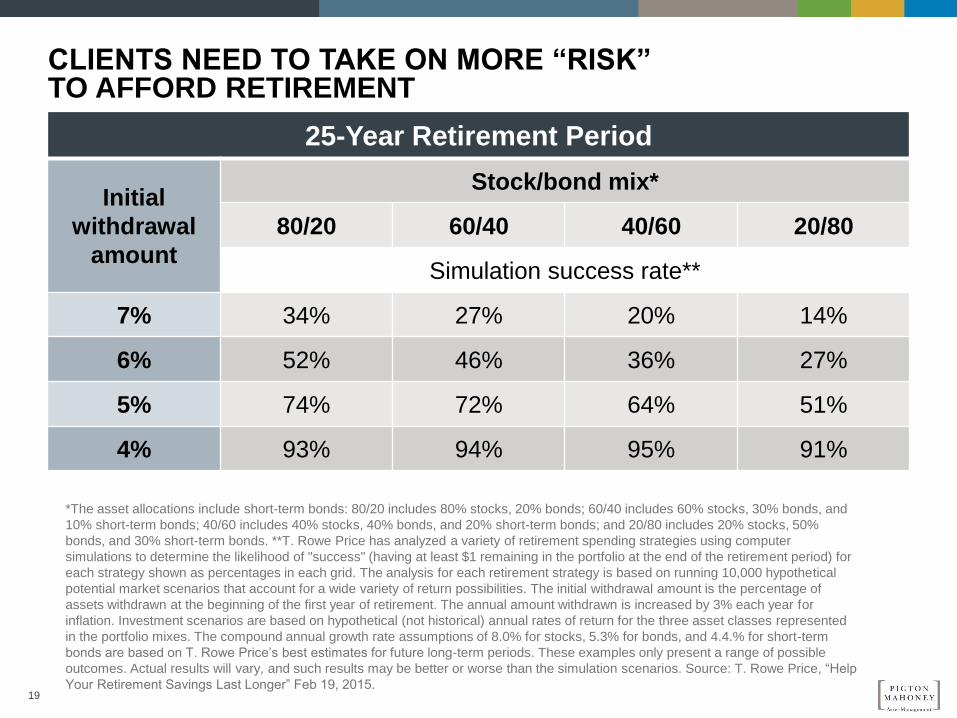
CLIENTS NEED TO TAKE ON MORE “RISK” TO AFFORD RETIREMENT
25-Year Retirement Period
Initial
withdrawal
amount
Stock/bond mix*
80/20 60/40 40/60 20/80
Simulation success rate**
7% 34% 27% 20% 14%
6% 52% 46% 36% 27%
5% 74% 72% 64% 51%
4% 93% 94% 95% 91%
*The asset allocations include short-term bonds: 80/20 includes 80% stocks, 20% bonds; 60/40 includes 60% stocks, 30% bonds, and
10% short-term bonds; 40/60 includes 40% stocks, 40% bonds, and 20% short-term bonds; and 20/80 includes 20% stocks, 50%
bonds, and 30% short-term bonds. **T. Rowe Price has analyzed a variety of retirement spending strategies using computer
simulations to determine the likelihood of "success" (having at least $1 remaining in the portfolio at the end of the retirement period) for
each strategy shown as percentages in each grid. The analysis for each retirement strategy is based on running 10,000 hypothetical
potential market scenarios that account for a wide variety of return possibilities. The initial withdrawal amount is the percentage of
assets withdrawn at the beginning of the first year of retirement. The annual amount withdrawn is increased by 3% each year for
inflation. Investment scenarios are based on hypothetical (not historical) annual rates of return for the three asset classes represented
in the portfolio mixes. The compound annual growth rate assumptions of 8.0% for stocks, 5.3% for bonds, and 4.4.% for short-term
bonds are based on T. Rowe Price’s best estimates for future long-term periods. These examples only present a range of possible
outcomes. Actual results will vary, and such results may be better or worse than the simulation scenarios. Source: T. Rowe Price, “Help
Your Retirement Savings Last Longer” Feb 19, 2015.
20
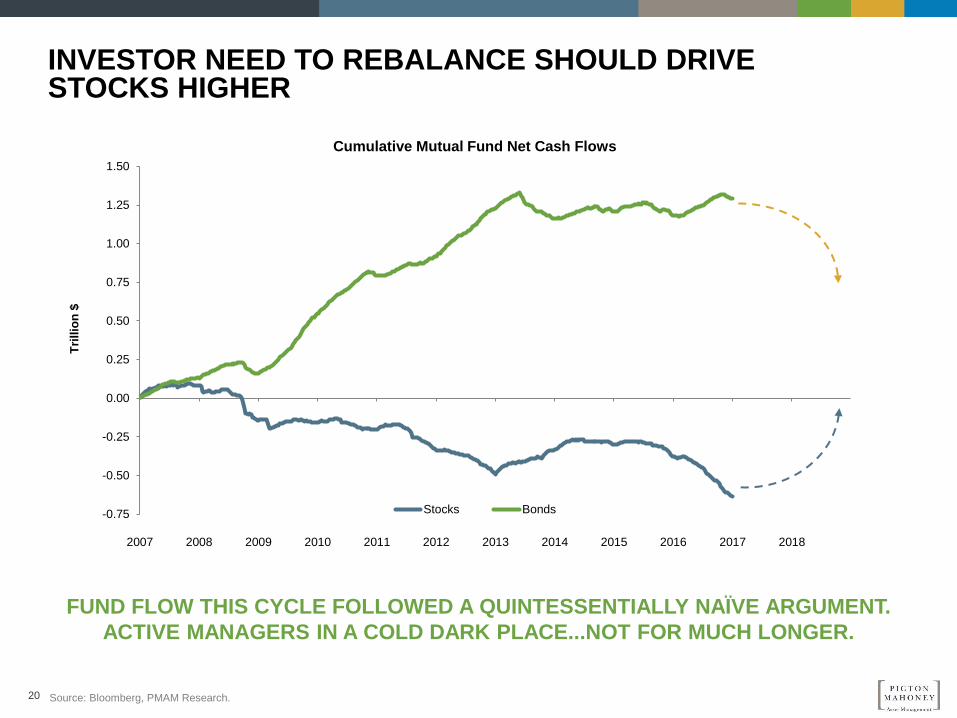
INVESTOR NEED TO REBALANCE SHOULD DRIVE STOCKS HIGHER
FUND FLOW THIS CYCLE FOLLOWED A QUINTESSENTIALLY NAÏVE ARGUMENT.
ACTIVE MANAGERS IN A COLD DARK PLACE...NOT FOR MUCH LONGER.
Source: Bloomberg, PMAM Research.
-0.75
-0.50
-0.25
0.00
0.25
0.50
0.75
1.00
1.25
1.50
2007 2008 2009 2010 2011 2012 2013 2014 2015 2016 2017 2018
Tri
llio
n $
Cumulative Mutual Fund Net Cash Flows
Stocks Bonds

THINK AHEAD. STAY AHEAD.
This report is published by Picton Mahoney Asset Management (PMAM) on January 11, 2017. It is provided as a general source of information
and should not be considered personal investment advice or an offer or solicitation to buy or sell securities. The information contained in this
report has been obtained from sources believed reliable however the accuracy and/or completeness of the information is not guaranteed by
PMAM, nor does PMAM assume any responsibility or liability whatsoever. All opinions expressed are subject to change without notification
This report is confidential and for dealer use only. Any review, re-transmission, dissemination or other use of this information by persons or
entities other than the intended recipient is prohibited.
PMAM-FFMULTI-PPT-JAN-2017