Embed Size (px)
Citation preview

For further product information please contact ICBC International Research Limited at (852) 2683 3888 Please read the important notice on last page
Stock Market Performance Price Abs %
20 May chg chgHK Equities Hang Seng Index 27,585 (108) (0.4)- Spot mth fut. 27,466 (Prem.:-119)
H-share Index 14,236 44 0.3- Spot mth fut. 14,178 (Prem.:-58)
Turnover HK$bn 137.8 2 1.3-% from HSI 20.7 0-% CBBC, wrnt 25.9 1
China Equities CSI 300 Index 4,755 24 0.5Sh Composite Index 15,337 210 1.4Sz Composite Index 2,619 52 2.0Asian Equities Nikkei 225 20,197 170 0.8Korea KOSPI 2,140 19 0.9Taiwan TWSE 9,685 (31) (0.3)India Sensex 30 27,837 192 0.7US/European Equities DJIA 18,285 (27) (0.1)S&P500 2,126 (2) (0.1)NASDAQ 5,072 2 0.0 UK FTSE 100 7,007 12 0.2 Germany DAX 11,848 (5) (0.0)France CAC40 5,133 16 0.3 Source: Bloomberg Other Indicators
Price Abs Chg20 May chg %
WTI oil $/bl 59.0 1.0 1.7 Gold $/troy oz 1,209.3 0.9 0.1 Cu fut. $/metric ton 6,220.0 0.0 0.0 Al fut. $/metric ton 1,783.5 (5.5) (0.3)Reuters/Jefferies CRB fut. 226.4 0.2 0.1 Baltic Dry Index 606.0 (14.0) (2.3)UST yield 3m % 0.02 0.01 UST yield 10y % 2.25 (0.041)HIBOR 3m % 0.39 (0.002)USD LIBOR 3m % 0.28 0.000
Source: Bloomberg HK Listco ADR US (Top Ten)
ADR cls HK cls ChgHK$ eqv. HK$ %
Petrochina 9.57 9.57 (0.03)China Mobile 103.60 103.60 0.00 HSBC 74.13 74.60 (0.63)China Life 37.78 37.75 0.09 Sinopec Corp 6.86 6.89 (0.43)Hutchison Whampo 113.61 114.10 (0.43)China Telecom 5.49 5.52 (0.47)Cheung Kong 167.45 167.70 (0.15)Sun Hung Kai 132.02 131.10 0.70 China Unicom 13.92 13.98 (0.46)
Implied HK cls Chg ptHSI 27,557 27,585 (28)H-share Index 14,233 14,236 (3)(Note: ADRs account for 34.4% weighting of HSI, 22.9% of H-share Index) Source: Bloomberg
Equity Research
Market Report VIEWPOINTS EXPRESS 21 May 2015
Comba Telecom (2342.HK) Boost from new international projects and domestic policy initiatives Comba Telecom announced three new international project wins in Argentina recently, further solidifying company’s brand value and market position in DAS (Distributed Antenna System) technology. Company would also benefit from MIIT’s new policies on facilitating faster and more affordable Internet connection in areas of Antennas & subsystems and wireless enhancement & access, due to 4G network build-out and network improvement. TMT Sector TMT Daily Update HIGHLIGHTS: Tencent’s Private Online Bank Launches Small Loans Alibaba ready to apply for Taiwan permit for Taobao Sales drive aims to tap demand in P2P lending New drivers for e-commerce eyed China has almost 1.3 billion mobile users, and half of them are on 3G or
4G

VIEWPOINTS EXPRESS – 21 May 2015 2
Equity Research
Comba Telecom Boost from new international projects and domestic policy initiatives Comba Telecom announced three new international project wins in Argentina recently, further solidifying company’s brand value and market position in DAS (Distributed Antenna System) technology. Company would also benefit from MIIT’s new policies on facilitating faster and more affordable Internet connection in areas of Antennas & subsystems and wireless enhancement & access, due to 4G network build-out and network improvement.
Enhanced brand value and market position in DAS technology on winning new international projects. Comba Telecom recently announced that it has been selected by a leading mobile operator group in Latin America to provide the wireless network infrastructure for mobile coverage at its corporate offices in Argentina. It also announced being awarded another two projects for Argentina: it will be deploying indoor wireless systems at the Ministro Pistarini International Airport in Ezeiza and the Jorge Newbery Airport in Buenos Aires. All of the above projects will adopt the ComFlex DAS (Distributed Antenna System) solution with multi-band, multi-operator functionality to optimize investment and improve signal distribution. The latest project wins strengthened company’s brand value and market position as a supplier and partner in large projects using DAS technology, on top of its past successful projects like wireless solutions in various airports in Mexico and Colombia and eight of the stadiums hosting the 2014 tournament in Brazil.
Benefiting from policies on faster and more affordable Internet connection. To promote “Internet +” and encourage public entrepreneurship and innovation, MIIT recently issued policies on facilitating faster and more affordable Internet connection. Comba Telecom would be highly likely to benefit in the following areas:
1) Antennas and subsystems: With the objective of the 4G network covering both urban and rural areas at a full scale, the total number of 4G base stations is expected to exceed 1.3 mn by end of 2015, compared to 0.73 mn by end of 2014. Company’s antennas and subsystems would benefit from order increase due to large-scale domestic 4G network build-out.
2) Wireless enhancement & access: With the average fees for mobile data traffic being reduced significantly, the demand for wireless enhancement would grow due to increasing mobile data traffic consumption. Company’s solutions like MDAS, DAS, and IDAS to increase capacity and improve quality would see growth opportunities. For wireless access, small cell solutions also have potential to be commercially launched widely due to its technological advantages.
Outlook & Valuation. The company now is trading at 16.7x 2015F PE, according to Bloomberg consensus. Against the backdrop of favorable domestic policies on development of communication industry, Comba Telecom, as a leading wireless solutions provider, sees good opportunities in the short run. In the long run, with the increasing investment on 5G technologies worldwide, company is expected to achieve further growth in the next generation evolution.
21 May 2015
Jianpeng Yu(852) 2683 3212
You Na(852) 2683 3231
[email protected] Sector Electronics Components Key Data
Ticker 2342.HKPrice (20 May) HKD2.8052W High HKD3.8352W Low HKD1.82Mkt. Cap. (HKD, mn) 4,705Total Issued Share (mn) 1,680 Shareholdings Structure TUNG LING FOK 32.92%YUE JUN ZHANG 10.09%ALLIANZ SE 4.42% Price performance
020406080100120140160
0.00.51.01.52.02.53.03.54.0
05/14 07/14 09/14 11/14 01/15 03/15 05/15Volume (RHS) Comba Telecom (LHS)
HSI (rebased) (LHS)
HK$ mn
% 1m 3m 6m2342.HK (1.4) 40.0 (22.4)HSI (1.0) 11.1 17.7 Next year forward PER
6
8
10
12
14
16
18
20
05/13 09/13 01/14 05/14 09/14 01/15
x
Mean
M+1SD
M-1SD
Source: Bloomberg, Company data

VIEWPOINTS EXPRESS – 21 May 2015 3
Equity Research
Valuation table
HKD mn Turnover Net Profit excl. SBC
EPS (HKD)
EV/EBITDA(x)
P/E(x)
P/B(x)
2013 5,720.6 -240.7 -0.14 42.56 -- 1.112014 6,733.2 151.1 0.09 11.59 30.42 1.24 2015E 7,376.8 302.8 0.17 6.98 16.67 1.092016E 7,241.2 366.2 0.20 6.29 14.00 0.96Source: Company, Bloomberg consensus
Income Statement HKD mn FY 2010 FY 2011 FY 2012 FY 2013 FY 2014 FY 2015 Est FY 2016 EstTurnover 5,191.4 6,354.2 6,332.9 5,720.6 6,733.2 7,376.8 7,241.2 - Cost of Revenue 3,251.7 4,027.5 4,717.0 4,355.0 4,973.2 Gross Profit 1,939.7 2,326.7 1,615.9 1,365.6 1,760.0 2,013.9 2,013.0 + Other Operating Income 34.2 42.7 61.1 58.7 51.2 - Operating Expenses 1,108.6 1,630.2 1,774.6 1,486.8 1,501.9 Operating profit (loss) 865.3 739.2 -97.7 -62.5 309.3 397.0 467.8 - Interest Expense 20.8 29.4 42.6 55.2 61.1 - Foreign Exchange Losses (Gains) -9.2 -9.8 15.4 52.4 59.2 - Net Non-Operating Losses (Gains) -3.0 -56.9 -7.6 -10.2 -13.1 Pretax Income 856.7 776.5 -148.1 -159.9 202.1 377.8 448.6 - Income Tax Expense 119.5 121.8 67.5 84.9 47.5 Income Before XO Items 737.2 654.7 -215.6 -244.7 154.5 302.8 366.2 - Extraordinary Loss Net of Tax 0.0 0.0 0.0 0.0 0.0 - Minority Interests 12.9 -4.3 -13.3 -4.0 3.5 Net Income 724.3 659.1 -202.4 -240.7 151.1 279.5 332.0 - Total Cash Preferred Dividends 0.0 0.0 0.0 0.0 0.0 - Other Adjustments -- -- -- -- 0.0 Net Inc Avail to Common Shareholders 724.3 659.1 -202.4 -240.7 151.1 302.8 366.2 Exceptional L(G) 2.0 -47.6 0.2 -0.5 -3.4 Tax Effect on Abnormal Items -0.3 7.5 0.0 0.1 0.8 Normalized Income 726.0 619.0 -202.1 -241.1 148.5 Basic EPS Before Abnormal Items 0.46 0.38 -0.12 -0.14 0.09 Basic EPS Before XO Items 0.46 0.40 -0.12 -0.14 0.09 0.15 0.16Basic EPS 0.46 0.40 -0.12 -0.14 0.09 0.15 0.16 Growth (YoY) 24.1 -12.8 -- -18.5 -- 65.9 6.7 Basic Weighted Avg Shares 1,580.0 1,648.1 1,657.6 1,664.2 1,670.8 Diluted EPS Before Abnormal Items 0.44 0.37 -0.12 -0.14 0.09 Diluted EPS Before XO Items 0.44 0.39 -0.12 -0.14 0.09 Diluted EPS 0.44 0.39 -0.12 -0.14 0.09 Diluted Weighted Avg Shares 1,641.2 1,688.1 1,657.6 1,664.2 1,678.1 Source: Company, Bloomberg consensus
VIEWPOINTS EXPRESS – 21 May 2015 4
Equity Research
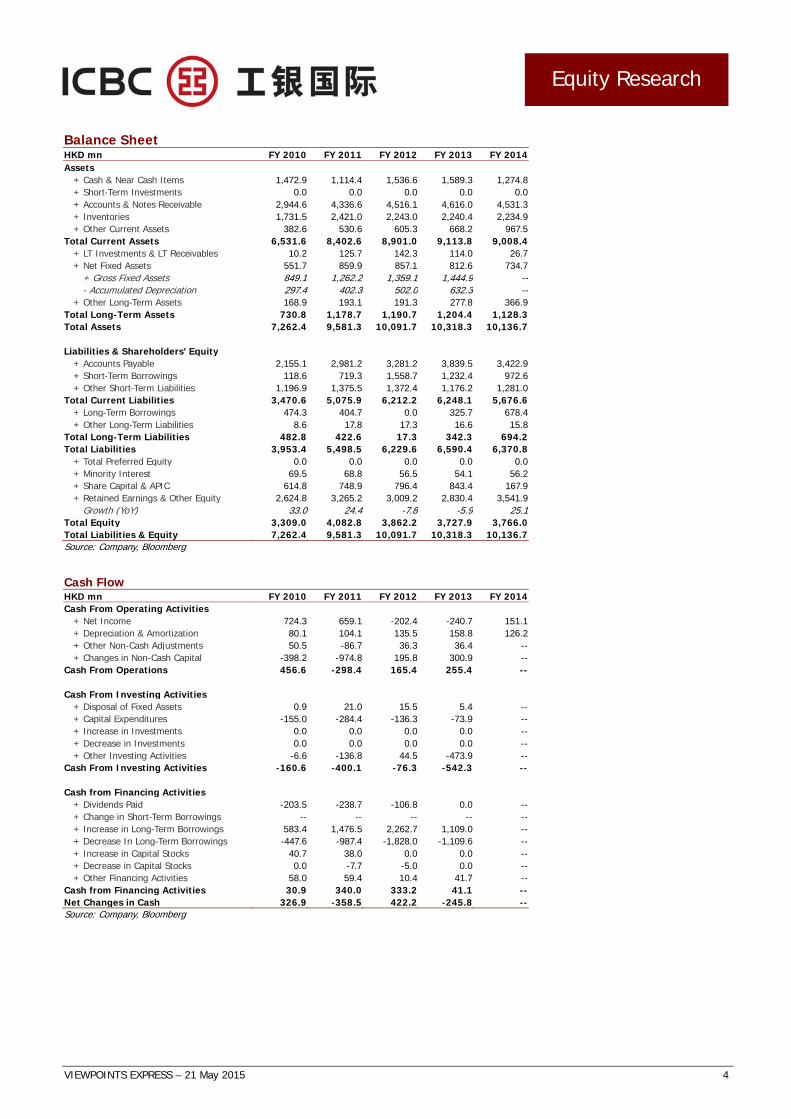
Balance Sheet HKD mn FY 2010 FY 2011 FY 2012 FY 2013 FY 2014Assets + Cash & Near Cash Items 1,472.9 1,114.4 1,536.6 1,589.3 1,274.8 + Short-Term Investments 0.0 0.0 0.0 0.0 0.0 + Accounts & Notes Receivable 2,944.6 4,336.6 4,516.1 4,616.0 4,531.3 + Inventories 1,731.5 2,421.0 2,243.0 2,240.4 2,234.9 + Other Current Assets 382.6 530.6 605.3 668.2 967.5Total Current Assets 6,531.6 8,402.6 8,901.0 9,113.8 9,008.4 + LT Investments & LT Receivables 10.2 125.7 142.3 114.0 26.7 + Net Fixed Assets 551.7 859.9 857.1 812.6 734.7 + Gross Fixed Assets 849.1 1,262.2 1,359.1 1,444.9 -- - Accumulated Depreciation 297.4 402.3 502.0 632.3 -- + Other Long-Term Assets 168.9 193.1 191.3 277.8 366.9Total Long-Term Assets 730.8 1,178.7 1,190.7 1,204.4 1,128.3Total Assets 7,262.4 9,581.3 10,091.7 10,318.3 10,136.7 Liabilities & Shareholders' Equity + Accounts Payable 2,155.1 2,981.2 3,281.2 3,839.5 3,422.9 + Short-Term Borrowings 118.6 719.3 1,558.7 1,232.4 972.6 + Other Short-Term Liabilities 1,196.9 1,375.5 1,372.4 1,176.2 1,281.0Total Current Liabilities 3,470.6 5,075.9 6,212.2 6,248.1 5,676.6 + Long-Term Borrowings 474.3 404.7 0.0 325.7 678.4 + Other Long-Term Liabilities 8.6 17.8 17.3 16.6 15.8Total Long-Term Liabilities 482.8 422.6 17.3 342.3 694.2Total Liabilities 3,953.4 5,498.5 6,229.6 6,590.4 6,370.8 + Total Preferred Equity 0.0 0.0 0.0 0.0 0.0 + Minority Interest 69.5 68.8 56.5 54.1 56.2 + Share Capital & APIC 614.8 748.9 796.4 843.4 167.9 + Retained Earnings & Other Equity 2,624.8 3,265.2 3,009.2 2,830.4 3,541.9 Growth (YoY) 33.0 24.4 -7.8 -5.9 25.1Total Equity 3,309.0 4,082.8 3,862.2 3,727.9 3,766.0Total Liabilities & Equity 7,262.4 9,581.3 10,091.7 10,318.3 10,136.7Source: Company, Bloomberg Cash Flow HKD mn FY 2010 FY 2011 FY 2012 FY 2013 FY 2014Cash From Operating Activities + Net Income 724.3 659.1 -202.4 -240.7 151.1 + Depreciation & Amortization 80.1 104.1 135.5 158.8 126.2 + Other Non-Cash Adjustments 50.5 -86.7 36.3 36.4 -- + Changes in Non-Cash Capital -398.2 -974.8 195.8 300.9 --Cash From Operations 456.6 -298.4 165.4 255.4 -- Cash From Investing Activities + Disposal of Fixed Assets 0.9 21.0 15.5 5.4 -- + Capital Expenditures -155.0 -284.4 -136.3 -73.9 -- + Increase in Investments 0.0 0.0 0.0 0.0 -- + Decrease in Investments 0.0 0.0 0.0 0.0 -- + Other Investing Activities -6.6 -136.8 44.5 -473.9 --Cash From Investing Activities -160.6 -400.1 -76.3 -542.3 -- Cash from Financing Activities + Dividends Paid -203.5 -238.7 -106.8 0.0 -- + Change in Short-Term Borrowings -- -- -- -- -- + Increase in Long-Term Borrowings 583.4 1,476.5 2,262.7 1,109.0 -- + Decrease In Long-Term Borrowings -447.6 -987.4 -1,828.0 -1,109.6 -- + Increase in Capital Stocks 40.7 38.0 0.0 0.0 -- + Decrease in Capital Stocks 0.0 -7.7 -5.0 0.0 -- + Other Financing Activities 58.0 59.4 10.4 41.7 --Cash from Financing Activities 30.9 340.0 333.2 41.1 --Net Changes in Cash 326.9 -358.5 422.2 -245.8 --Source: Company, Bloomberg

VIEWPOINTS EXPRESS – 21 May 2015 5
Equity Research
TMT Sector TMT Daily Update
HIGHLIGHTS: Tencent’s Private Online Bank Launches Small Loans Alibaba ready to apply for Taiwan permit for Taobao Sales drive aims to tap demand in P2P lending New drivers for e-commerce eyed China has almost 1.3 billion mobile users, and half of them are on
3G or 4G
Tencent’s Private Online Bank Launches Small Loans
WeBank, which is considered the first private Internet bank in China, launched its first loan product Weilidai for testing among a limited number of 50,000 selected users from Tencent’s (0700.HK) IM tool QQ. Weilidai offers personal loans up to RMB200,000 (US$32,000) free of guarantee or collateral.
Alibaba ready to apply for Taiwan permit for Taobao
Alibaba (BABA.US) is ready to apply to Taiwan’s authorities if needed for the relevant permit required to keep operating Taobao on the island. Taiwan said on Monday that Alibaba had half a year to wind down Taobao’s operations on the island, after it failed to apply for the permit required of a mainland company to do business there.
Sales drive aims to tap demand in P2P lending
More than 100 peer-to-peer lending platforms in China launched a sales campaign which has lured nearly 250,000 consumers who bought 1.1 billion yuan (US$177 million) in P2P products. The campaign was the first of its kind in the booming personal finance sector.
New drivers for e-commerce eyed
China will promote its e-commerce to the world and expand business in new sectors, said a senior official with the country’s top economic planner. The government pledged to create a favorable environment for e-commerce by cutting red tape, easing market access and lowering taxation.
China has almost 1.3 billion mobile users, and half of them are on 3G or 4G
The past year has seen massive growth for mobile broadband – 3G and 4G subscriptions – in China, according to new data released by China’s Ministry of Industry and Information Technology. The country now has 1.29 billion total mobile users, and as of April 49.9% of them have mobile broadband services.
21 May 2015
You Na(852) 2683 3231
Jianpeng Yu(852) 2683 3212

VIEWPOINTS EXPRESS – 21 May 2015 i
Equity Research
Major equity indices, commodity prices, currencies, interest ratesName Price Price Price Value Chg ---- Change (%) ---- Trailing Forward Historic Earnings
20 May High Low 1d 1d 5d 1m YTD PER (x) PER (x) PBR (x) Yld (%)HK EquitiesHSI 27,585 27,751 27,490 -108 (0.39) 1.23 1.81 16.86 11.70 13.26 1.51 8.55 -- HSI futures, May15 27,466 27,719 27,404 Prem: -119H-share Index 14,236 14,330 14,114 44 0.31 2.72 0.88 18.78 10.28 9.99 1.41 9.73 -- H-share futures, May15 14,178 14,340 14,108 Prem: -58 -HK$mn/% for below 3 series-HK mainboard turnover, HK$mn 137,778 136,034 144,247 211,005 43,938 HSI stocks to market turnover, % 20.7 20.6 30.0 26.5 28.8CBBC + warrants to mkt t/o, % 25.9 24.8 22.2 18.0 14.1China EquitiesShanghai Composite Index 4,446.3 4,520.5 4,432.3 28.74 0.65 1.61 5.44 37.46 22.11 18.04 2.59 4.52SzSE Constituent Stock Index 15,337.1 15,618.1 15,206.6 209.70 1.39 1.08 10.56 39.24 25.21 18.83 3.59 3.97Shanghai A-share Index 4,655.6 4,733.4 4,641.0 29.76 0.64 1.56 5.36 37.36 22.08 18.03 2.59 4.53Shenzhen A-share Index 2,739.5 2,784.2 2,702.1 54.52 2.03 7.10 25.14 85.30 65.26 39.13 5.74 1.53Shanghai B-share Index 484.7 493.8 473.9 11.28 2.38 14.42 28.70 66.70 33.66 23.09 2.39 2.97Shenzhen B-share Index 1,570.7 1,579.4 1,550.0 20.47 1.32 4.76 19.43 52.67 26.94 17.23 3.04 3.71Asian/Pacific EquitiesAustralia ASX200 Index 5,610.3 5,625.6 5,574.6 (5.20) (0.09) (1.83) (3.82) 3.68 20.55 16.47 2.02 4.87Taiwan TWSE Index 9,685.3 9,736.1 9,662.9 (31.46) (0.32) (0.40) 1.39 4.06 14.72 13.54 1.69 6.80Singapore STI Index 3,439.7 3,450.7 3,435.7 (14.36) (0.42) (0.39) (1.81) 2.21 15.52 14.26 1.35 6.44Thailand SET Index 1,520.1 1,530.9 1,518.4 (5.85) (0.38) 1.62 (2.58) 1.50 20.23 15.23 2.03 4.94Malaysia KLCI Index 1,810.1 1,812.6 1,808.0 0.39 0.02 0.39 (2.09) 2.77 17.32 16.58 2.06 5.77Nikkei 225 20,196.6 20,278.9 20,148.5 170.18 0.85 2.18 2.86 15.73 22.83 19.32 1.82 4.38Korea Composite Index 2,139.5 2,140.2 2,125.5 18.69 0.88 1.20 (0.33) 11.69 na na 1.07 na India Sensex 30 27,837.2 27,903.0 27,744.0 191.68 0.69 2.15 (0.18) 1.23 21.48 15.85 3.00 4.66US/European EquitiesDow Jones Index 18,285.4 18,350.1 18,272.6 (26.99) (0.15) 1.25 1.39 2.59 15.81 16.36 3.19 6.33S&P 500 Index 2,125.9 2,134.7 2,122.6 (1.98) (0.09) 1.30 1.21 3.25 18.78 17.98 2.91 5.32NASDAQ Index 5,071.7 5,097.5 5,050.2 1.71 0.03 1.81 1.54 7.09 30.30 22.22 3.70 3.30UK FTSE 100 Index 7,007.3 7,018.7 6,962.1 12.16 0.17 0.83 (0.64) 6.72 22.09 16.83 1.96 4.53Germany DAX Index 11,848.5 11,871.5 11,780.0 (4.86) (0.04) 4.38 (0.37) 20.83 19.13 14.95 1.83 5.23France CAC 40 INDEX 5,133.3 5,139.1 5,089.4 16.00 0.31 3.46 (1.05) 20.14 26.42 16.89 1.61 3.78Precious Metals ($/troy oz)Gold spot 1,209.3 1,213.1 1,203.4 0.89 0.07 (0.70) 1.23 1.80Silver spot 17.12 17.29 16.95 (0.01) (0.08) (0.06) 7.19 9.01Platinum spot 1,156.5 1,161.5 1,147.0 5.95 0.52 0.62 0.65 (4.26)Palladium spot 777.9 787.5 775.5 0.90 0.12 (1.18) 0.39 (2.49)Industrial Metals ($/metric ton)LME Copper 3-mth future 6,220.0 6,245.0 6,194.0 0.00 0.00 (2.89) 4.01 (1.27)LME Aluminium 3-mth future 1,783.5 1,801.5 1,780.0 (5.50) (0.31) (5.23) (1.46) (3.72)LME Nickel 3-mth future 13,115.0 13,120.0 12,785.0 25.00 0.19 (6.65) 2.46 (13.43)LME Zinc 3-mth future 2,200.0 2,243.0 2,193.5 (28.00) (1.26) (5.78) 1.01 1.01Oil, Gas and Coal FuturesWTI crude, Jul15, $/barrel 58.98 59.04 58.10 0.99 1.71 (4.08) (0.12) 4.83Heating oil, Jun15, cents/gallon 194.60 195.72 193.20 1.68 0.87 (2.95) 3.41 7.25Natural gas, Jun15, $/MMBtu 2.915 3.021 2.902 (0.03) (1.12) (0.68) 13.07 (1.29)Gasoline RBOB, Future, cents/gallon 204.11 204.22 200.38 4.61 2.31 0.03 5.67 42.21Coal, McCloskey, fob, Jan16, $/ton 56.26 -- -- 0.09 0.16 (1.23) 1.10 (10.54)Coal, McCloskey, cif, Jan16, $/ton 56.94 -- -- 0.17 0.30 (1.81) 0.12 (15.01)Commodity Composite FuturesReuters/Jefferies CRB futures, spot 226.43 227.23 226.00 0.21 0.09 (2.04) 1.67 (1.53)Shipping FreightsBaltic Dry Index 606.00 -- -- (14.00) (2.26) (4.42) 1.34 (22.51)CurrenciesCNY 6.2037 6.2070 6.2029 6.2069 6.2046 6.2017 6.2055Rmb NDF 12-mth 1421.2037 1475.7870 1396.1729 1428.2069 1403.2046 1611.2117 2212.1055CNH 6.2057 6.2104 6.2045 6.2095 6.2004 6.1962 6.2165HKD 7.7523 7.7528 7.7517 7.7520 7.7517 7.7500 7.7551USD Trade Wgt Index 87.5840 -- -- 89.3238 87.5727 90.7462 85.1343Euro 1.1094 1.1153 1.1062 1.1150 1.1354 1.0738 1.2098GBP 1.5536 1.5588 1.5473 1.5513 1.5745 1.4907 1.5577Yen 121.3500 121.4800 120.5800 120.6900 119.1500 119.1800 119.7800AUD 0.7875 0.7935 0.7861 0.7915 0.8113 0.7725 0.8175NZD 0.7307 0.7372 0.7282 0.7344 0.7484 0.7661 0.7797CHF 0.9372 0.9406 0.9337 0.9369 0.9167 0.9562 0.9943CAD 1.2208 1.2256 1.2169 1.2233 1.1958 1.2225 1.1621Interest Rates (%)HIBOR 3-mth, HKD 0.390 -- -- 0.392 0.388 0.390 0.381LIBOR 3-mth, USD 0.281 -- -- 0.281 0.274 0.276 0.256SHIBOR 3-mth, Rmb 3.071 -- -- 3.156 3.634 4.613 5.135Bond Yields (%)US treasury yield, 3-mth 0.015 0.015 0.010 0.010 0.015 0.010 0.036US treasury yield, 2-yr 0.585 0.609 0.577 0.613 0.576 0.520 0.665US treasury yield, 10-yr 2.248 2.283 2.227 2.289 2.293 1.890 2.171China treasury yield, 2-yr 2.700 -- -- 2.700 3.030 3.320 3.420China treasury yield, 10-yr 3.450 -- -- 3.450 3.400 3.700 3.650Source: Bloomberg
--------- Price ---------
--------- Price ---------
--------- Price ---------

VIEWPOINTS EXPRESS – 21 May 2015 ii
Equity Research
0.0
1.0
2.0
3.0
4.0
5.0
6.0
0.0
1.0
2.0
3.0
4.0
5.0
6.0
19 N
ov28
Nov
9 D
ec18
Dec
29 D
ec7
Jan
16 J
an27
Jan
5 Fe
b16
Feb
25 F
eb6
Mar
17 M
ar26
Mar
6 Ap
r15
Apr
24 A
pr5
May
14 M
ay
US, China Treasury Yield
US, 2y US, 10y
China, 2y China 10y
0.20
0.25
0.30
0.35
0.40
0.45
0.50
0.55
0.60
2.0
3.0
4.0
5.0
6.0
7.0
8.0
9.0
10.0
19 N
ov26
Nov
3 D
ec10
Dec
17 D
ec24
Dec
31 D
ec7
Jan
14 J
an21
Jan
28 J
an4
Feb
11 F
eb18
Feb
25 F
eb4
Mar
11 M
ar18
Mar
25 M
ar1
Apr
8 Ap
r15
Apr
22 A
pr29
Apr
6 M
ay13
May
20 M
ay
HIBOR, LIBOR, SHIBORSHIBOR 3m (L.S.) HIBOR 3m (R.S.)
$ LIBOR 3m (R.S.)
80
100
120
140
160
180
200
220
19 N
ov26
Nov
3 D
ec10
Dec
17 D
ec24
Dec
31 D
ec7
Jan
14 J
an21
Jan
28 J
an4
Feb
11 F
eb18
Feb
25 F
eb4
Mar
11 M
ar18
Mar
25 M
ar1
Apr
8 Ap
r15
Apr
22 A
pr29
Apr
6 M
ay13
May
20 M
ay
HK/China stock markets (Start = 100)HSI H-share IndexShanghai A Shenzhen A
90
100
110
120
130
19 N
ov26
Nov
3 D
ec10
Dec
17 D
ec24
Dec
31 D
ec7
Jan
14 J
an21
Jan
28 J
an4
Feb
11 F
eb18
Feb
25 F
eb4
Mar
11 M
ar18
Mar
25 M
ar1
Apr
8 Ap
r15
Apr
22 A
pr29
Apr
6 M
ay13
May
20 M
ay
HK/US stock markets (Start = 100)
HSI Dow
S&P500 NASDAQ
70
80
90
100
110
120
19 N
ov
28 N
ov
9 D
ec
18 D
ec
29 D
ec
7 Ja
n
16 J
an
27 J
an
5 Fe
b
16 F
eb
25 F
eb
6 M
ar
17 M
ar
26 M
ar
6 Ap
r
15 A
pr
24 A
pr
5 M
ay
14 M
ay
Metals (Start = 100)
Gold spot Copper future, LME Aluminium future, LME
40
60
80
100
120
140
19 N
ov26
Nov
3 D
ec10
Dec
17 D
ec24
Dec
31 D
ec7
Jan
14 J
an21
Jan
28 J
an4
Feb
11 F
eb18
Feb
25 F
eb4
Mar
11 M
ar18
Mar
25 M
ar1
Apr
8 Ap
r15
Apr
22 A
pr29
Apr
6 M
ay13
May
20 M
ay
Oil, gas, coal (Start = 100)Crude oil Natural gasGasoline RBOB Coal, f.o.b.
400
600
800
1000
1200
1400
19 N
ov28
Nov
9 D
ec18
Dec
29 D
ec7
Jan
16 J
an27
Jan
5 Fe
b16
Feb
25 F
eb6
Mar
17 M
ar26
Mar
6 Ap
r15
Apr
24 A
pr5
May
14 M
ay
Baltic Dry Index
7678808284868890929496
96100104108112116120124128132136
19 N
ov28
Nov
9 D
ec18
Dec
29 D
ec7
Jan
16 J
an27
Jan
5 Fe
b16
Feb
25 F
eb6
Mar
17 M
ar26
Mar
6 Ap
r15
Apr
24 A
pr5
May
14 M
ay
$ Index, Yen, EuroYen per $ (L.S.)
Eur per $100 (R.S.)
$ trade weighted index (R.S.)

VIEWPOINTS EXPRESS – 21 May 2015 iii
Equity Research
HK Listco ADR US closing, as of 20/5/2015 HSI: 27,585 HSCEI: 14,236ADR HK % premium/ ADR HK Avg. 20-day t/o HSI Index pt HSCEI Index pt
ADR HK price price discount (-) turnover turnover ADR HK wgt moved wgt movedStock Code Code (HK$) (HK$) to HK close (HK$mn) (HK$mn) (HK$mn) (HK$mn) (%) (pt) (%) (pt)HSBC HLDGS PLC HSBC 0005 74.127 74.60 -0.63% 773.6 1,428.0 920.0 2,451.5 11.63 (20.32) 0.00 0.00CHINA MOBILE CHL 0941 103.602 103.60 0.00% 541.9 2,071.1 516.2 1,903.9 0.00 0.00 0.00 0.00CHINA LIFE-H LFC 2628 37.785 37.75 0.09% 46.5 1,159.0 112.8 1,601.1 3.01 0.77 8.17 1.08PETROCHINA-H PTR 0857 9.567 9.57 -0.03% 86.0 581.4 192.1 1,206.9 2.17 (0.18) 5.87 (0.25)SHK PPT SUHJY 0016 132.023 131.10 0.70% 0.3 277.7 2.5 561.0 2.22 4.31 0.00 0.00CKH HOLDINGS CKHUY 0001 167.451 167.70 -0.15% 2.0 622.8 10.7 609.1 2.50 (1.02) 0.00 0.00HUTCHISON HUWHY 0013 113.611 114.10 -0.43% 7.4 361.0 6.9 444.4 2.61 (3.09) 0.00 0.00SINOPEC CORP-H SNP 0386 6.860 6.89 -0.43% 67.6 699.0 122.6 1,140.0 1.89 (2.26) 5.11 (3.16)CHINA SOUTHERN-H ZNH 1055 7.631 7.71 -1.02% 53.8 227.9 39.3 204.7 0.00 0.00 0.00 0.00CLP HOLDINGS CLPHY 0002 69.073 68.45 0.91% 1.4 125.7 1.7 167.0 1.39 3.50 0.00 0.00CHINA UNICOM CHU 0762 13.915 13.98 -0.46% 46.6 312.2 99.6 841.8 0.90 (1.14) 0.00 0.00SWIRE PACIFIC-A SWRAY 0019 105.199 104.50 0.67% 0.3 86.3 0.5 146.5 0.66 1.22 0.00 0.00POWER ASSETS HGKGY 0006 75.043 76.10 -1.39% 0.4 149.6 0.3 189.2 1.13 (4.34) 0.00 0.00BANK EAST ASIA BKEAY 0023 33.878 34.35 -1.37% 0.1 116.2 0.1 78.3 0.58 (2.19) 0.00 0.00ALUMINUM CORP-H ACH 2600 4.868 4.88 -0.24% 7.0 123.2 28.1 262.9 0.00 0.00 0.00 0.00CATHAY PAC AIR CPCAY 0293 19.722 19.84 -0.59% 0.4 71.2 2.2 80.1 0.25 (0.41) 0.00 0.00CHINA TELECOM-H CHA 0728 5.494 5.52 -0.47% 34.7 471.9 58.6 524.1 0.00 0.00 2.23 (1.49)YANZHOU COAL-H YZC 1171 7.241 7.29 -0.68% 4.5 116.8 8.6 192.7 0.00 0.00 0.00 0.00HUANENG POWER-H HNP 0902 10.789 10.72 0.65% 13.2 159.3 34.8 273.9 0.00 0.00 1.04 0.96TSINGTAO BREW-H TSGTY 0168 49.561 49.65 -0.18% 0.1 60.7 0.8 97.5 0.00 0.00 0.52 (0.13)SINOPEC SHANG-H SHI 0338 3.951 3.92 0.78% 12.5 95.3 20.6 315.6 0.00 0.00 0.00 0.00CHINA EAST AIR-H CEA 0670 5.783 5.82 -0.63% 26.1 215.3 20.0 162.1 0.00 0.00 0.00 0.00GUANGSHEN RAIL-H GSH 0525 4.979 5.00 -0.43% 3.6 56.6 6.4 60.5 0.00 0.00 0.00 0.00LENOVO GROUP LNVGY 0992 13.365 13.36 0.04% 7.4 208.1 11.2 383.0 0.00 0.00 0.00 0.00PCCW LTD PCCWY 0008 4.962 5.04 -1.56% 0.0 26.6 0.0 64.7 0.00 0.00 0.00 0.00SMIC SMI 0981 0.822 0.83 -0.99% 1.3 148.3 2.4 238.3 0.00 0.00 0.00 0.00TECHTRONIC IND TTNDY 0669 27.908 27.75 0.57% 0.9 138.4 1.1 107.7 0.00 0.00 0.00 0.00US OTC Traded (Not ADR)HKEX HKXCF 0388 287.610 288.40 -0.27% 0.1 2,088.4 0.2 3,638.2 3.46 (2.62) 0.00 0.00
Total: 34.40 (27.77) 22.93 (3.00)Source: Bloomberg

VIEWPOINTS EXPRESS – 21 May 2015 iv
Equity Research
H shares dually listed in Shanghai A-share market
Stock Exch Price HKD Price change % A-share A-share price Price change % H/A-shr --- H-share P/E (x) --- H-shr Yld (%) --- P/B (x) --- Code 20 May 1d 5d 1m Code RMB HKD 1d 5d 1m disc (%) Rpted Cur Yr Next Yr 12mth Cur Yr Cur Yr Next Yr
SHANGHAI ELECT-H 2727 7.97 0.0 4.5 (3.9) 601727 20.69 25.29 (1.0) 6.8 29.5 (68.5) 29.8 25.9 23.5 0.9 1.1 3.10 2.81LUOYANG GLASS-H 1108 6.78 2.3 4.5 (1.2) 600876 17 20.78 (2.6) 29.3 33.6 (67.4) n/a n/a n/a n/a n/a n/a n/aCHINA SHIPPING-H 2866 3.99 5.8 8.1 (9.3) 601866 9.75 11.92 7.1 5.0 12.8 (66.5) 9.1 -ve E 50.2 n/a 0.1 1.31 1.36METALLURGICAL-H 1618 4.15 1.2 4.0 1.0 601618 9 11.00 2.3 0.2 21.5 (62.3) 12.1 12.3 10.0 1.5 1.8 1.44 1.34CHINA COSCO HO-H 1919 6.02 0.0 1.9 (5.2) 601919 13 15.89 0.0 (1.4) 22.2 (62.1) 7.3 -ve E -ve E n/a 0.2 1.08 1.12JINGCHENG MAC-H 187 5.48 1.1 2.2 0.4 600860 11.73 14.34 1.3 (2.4) 9.5 (61.8) 62.3 n/a n/a n/a n/a 2.56 n/aYANZHOU COAL-H 1171 7.29 1.3 0.8 (6.7) 600188 14.72 17.99 (0.5) (0.8) (4.3) (59.5) 3.2 3.1 3.0 0.3 9.6 0.79 0.68CSR-H 1766 15 0.0 0.0 (15.3) 601766 29.45 36.00 0.0 0.0 (16.8) (58.3) 57.3 39.3 32.5 n/a 0.5 7.55 5.40NANJING PANDA-H 553 9.63 0.5 2.9 7.5 600775 18.88 23.08 (2.8) 0.5 24.2 (58.3) 562.7 n/a n/a n/a n/a 3.50 n/aALUMINUM CORP-H 2600 4.88 (1.6) 3.8 (0.6) 601600 9.56 11.69 (1.8) 10.6 14.1 (58.2) 66.5 38.0 28.9 n/a 0.6 1.05 0.99CHONGQING IRON-H 1053 2.17 1.4 1.9 (6.5) 601005 4.19 5.12 0.0 (2.1) (4.1) (57.6) 295.9 -ve E 74.0 n/a 4.7 n/a 0.59DALIAN PORT PD-H 2880 3.9 0.5 1.8 (7.1) 601880 7.42 9.07 (0.4) (6.3) (8.7) (57.0) 14.5 16.3 14.4 1.3 2.5 1.19 1.10CSSC OFFSHORE AN 317 33.6 7.7 20.0 (1.3) 600685 63.59 77.73 8.7 22.2 21.7 (56.8) 25.0 26.4 23.5 n/a 0.6 4.83 3.79CHINA RAIL GR-H 390 10.36 0.0 3.7 (9.9) 601390 19.56 23.91 (0.7) (2.6) (1.2) (56.7) 24.1 23.7 21.3 0.9 0.8 2.71 2.45CHINA SHIPPING D 1138 6.24 0.0 3.1 (12.5) 600026 11.53 14.09 0.0 5.4 (3.9) (55.7) 10.1 13.1 10.5 0.6 2.4 0.77 0.74TIANJIN CAP-H 1065 7.88 0.1 5.1 (6.4) 600874 14.55 17.79 0.7 1.9 (1.8) (55.7) 33.9 35.2 36.8 n/a 1.2 2.67 2.58MAANSHAN IRON-H 323 2.92 0.7 1.0 (3.0) 600808 5.32 6.50 (0.4) 1.3 0.2 (55.1) 16.7 30.2 16.8 n/a 1.3 0.67 0.67SICHUAN EXP-H 107 4.01 2.6 1.3 (6.3) 601107 7.19 8.79 0.4 (2.2) 2.9 (54.4) 8.7 8.6 7.8 2.5 3.6 1.21 1.10ZIJIN MINING-H 2899 2.99 0.0 0.0 (0.7) 601899 5.24 6.41 0.0 0.0 0.8 (53.3) 11.1 8.0 6.7 3.3 3.6 2.44 1.88CHINA OILFIELD-H 2883 14.88 1.2 (0.3) (8.5) 601808 25.93 31.70 (0.4) 0.2 (4.6) (53.1) 13.3 12.7 10.9 4.0 1.6 2.14 1.76BEIJING NORTH-H 588 3.69 1.4 6.0 (3.4) 601588 6.36 7.77 1.0 (3.2) (7.2) (52.5) 9.2 15.9 n/a 2.0 n/a 0.79 n/aANHUI EXPRESS-H 995 6.99 1.6 1.3 6.2 600012 11.69 14.29 2.5 7.1 37.5 (51.1) 12.0 10.5 9.6 4.1 4.4 1.61 1.48DATANG INTL PO-H 991 4.52 0.4 3.7 (1.3) 601991 7.5 9.17 0.1 (2.6) 3.0 (50.7) 17.6 21.9 17.9 3.6 1.6 1.48 1.27CHINA COAL ENE-H 1898 4.86 1.9 3.0 (1.8) 601898 8.04 9.83 0.0 (1.1) (0.9) (50.5) 7.1 5.4 4.7 0.6 5.0 0.71 0.64DONGFANG ELECT-H 1072 17.3 (0.7) 2.5 (6.5) 600875 27.01 33.02 (0.6) (0.0) 0.6 (47.6) 10.9 8.9 7.8 0.6 1.4 2.57 2.02CHINA RAIL CN-H 1186 14.88 0.5 6.0 (6.4) 601186 22.18 27.11 (0.9) (4.0) (14.6) (45.1) 35.4 18.8 17.3 1.3 1.3 2.62 2.36JIANGXI COPPER-H 358 15.36 (1.5) (1.2) (1.7) 600362 22.8 27.87 (1.3) (1.8) 3.7 (44.9) 7.9 5.6 5.4 1.6 2.8 1.28 1.08CHINA EAST AIR-H 670 5.82 6.2 4.1 (1.5) 600115 8.1 9.90 2.5 2.7 3.6 (41.2) 10.8 13.4 13.3 n/a 0.3 3.52 2.69SHENZHEN EXPRE-H 548 7.69 3.6 4.3 3.6 600548 9.86 12.05 0.3 (0.3) (7.9) (36.2) 18.4 18.0 15.6 3.2 2.7 1.58 1.50PETROCHINA-H 857 9.57 (0.5) 1.6 (4.0) 601857 12.17 14.88 (0.2) (2.1) (4.9) (35.7) 10.3 9.5 8.9 3.5 4.6 1.53 1.40GUANGSHEN RAIL-H 525 5 (2.5) (0.4) 3.5 601333 6.26 7.65 (0.9) (0.5) (3.4) (34.7) 19.5 16.2 16.0 1.2 2.6 1.20 1.15CHINA SOUTHERN-H 1055 7.71 3.2 9.5 2.8 600029 9.63 11.77 3.4 3.7 (7.8) (34.5) 9.0 12.3 13.4 0.6 0.2 2.32 1.92BAIYUNSHAN PH-H 874 30.2 0.3 1.0 (0.3) 600332 36.46 44.57 0.7 0.5 (0.2) (32.2) n/a 60.4 51.9 1.2 0.2 n/a 5.13AIR CHINA LTD-H 753 10.02 1.5 9.3 9.5 601111 11.25 13.75 0.7 (0.4) 1.6 (27.1) 8.0 11.4 11.8 0.7 1.3 2.55 2.04CITIC BANK-H 998 6.78 0.4 1.6 (1.7) 601998 7.42 9.07 (0.7) (2.6) (6.4) (25.2) n/a 9.0 8.6 n/a 2.6 n/a 1.54CHINA SHENHUA-H 1088 19.12 0.0 (1.1) (6.3) 601088 20.44 24.99 0.0 (2.0) (8.7) (23.5) 8.2 7.0 6.2 4.8 5.3 1.57 1.33SINOPEC CORP-H 386 6.89 (0.1) (0.1) 0.7 600028 7.31 8.94 (0.5) (3.1) 2.4 (22.9) 6.8 6.4 6.0 3.6 4.0 1.17 1.03HUANENG POWER-H 902 10.72 (1.3) 3.3 8.4 600011 10.84 13.25 0.0 (2.6) 15.0 (19.1) 31.3 44.7 34.7 4.4 1.3 2.29 2.25CHINA LIFE-H 2628 37.75 0.1 2.6 1.6 601628 36.59 44.73 (0.8) (4.8) (2.4) (15.6) 26.0 30.6 23.6 1.3 1.1 4.18 3.96HUADIAN POWER-H 1071 8.95 (1.3) 7.7 21.4 600027 8.48 10.37 0.0 (2.3) 3.5 (13.7) 292.9 -ve E 146.4 3.8 0.1 3.06 2.99MINSHENG BANK-H 1988 11.1 (0.4) (0.7) 4.9 600016 10.34 12.64 0.7 (0.7) (1.1) (12.2) 13.8 10.2 9.4 2.1 1.5 2.33 1.94GREAT WALL MOT-H 2333 53.35 (0.9) 0.9 (4.7) 601633 48.81 59.67 (0.7) 0.5 (8.2) (10.6) 44.1 35.8 31.2 1.9 0.5 11.93 8.85TSINGTAO BREW-H 168 49.65 (0.2) (0.3) (2.0) 600600 44.96 54.96 (0.2) (0.4) (3.3) (9.7) 36.1 30.8 25.8 1.1 0.7 5.71 4.90BANKCOMM-H 3328 7.55 0.8 0.0 (1.6) 601328 6.71 8.20 0.0 (1.0) (2.8) (8.0) 9.3 7.7 7.1 4.5 3.0 1.72 1.42ABC-H 1288 4.28 1.4 2.4 (2.1) 601288 3.69 4.51 (0.3) (0.8) (6.6) (5.1) 10.6 8.9 7.6 5.3 3.8 2.10 1.80CCB-H 939 7.57 0.5 3.0 1.6 601939 6.49 7.93 (0.2) (2.6) (5.1) (4.6) 11.1 9.2 8.3 5.0 4.1 2.22 1.92BANK OF CHINA-H 3988 5.22 0.6 3.0 (0.4) 601988 4.44 5.43 (0.4) (2.6) (6.3) (3.8) 10.9 9.9 9.0 4.5 3.7 1.85 1.65JIANGSU EXPRES-H 177 10.54 0.0 2.5 0.8 600377 8.48 10.37 0.6 (0.4) (1.4) 1.7 17.2 16.4 14.8 4.5 4.4 2.66 2.51CHINA PACIFIC-H 2601 41.8 0.4 3.6 2.8 601601 33.44 40.88 (0.6) (4.3) (1.9) 2.3 34.2 28.3 23.1 1.5 1.1 3.66 3.43CM BANK-H 3968 23.3 2.9 4.5 2.6 600036 18.04 22.05 2.3 2.9 1.3 5.7 15.5 12.2 11.4 3.6 1.8 3.07 2.51PING AN-H 2318 112.7 1.1 4.0 7.8 601318 85.57 104.60 0.2 (1.7) 0.0 7.7 40.1 33.1 26.7 0.8 0.6 6.29 5.27ANHUI CONCH-H 914 31.6 0.2 1.9 (0.6) 600585 23.44 28.65 (0.5) (0.3) (5.8) 10.3 22.3 11.0 9.9 2.6 1.6 3.97 3.02
H shares dually listed in Shenzhen A-share marketSHANDONG MOLON-H 568 5.46 1.7 3.4 6.0 002490 13.69 16.73 (0.1) 3.9 11.3 (67.4) 5.4 5.3 8.0 n/a 2.7 1.17 0.66SHANDONG XINHU-H 719 8.29 (0.5) 5.7 5.9 000756 15.37 18.79 (0.4) 9.9 11.4 (55.9) 30.5 n/a n/a 0.3 n/a 1.84 n/aSHANDONG CHEN-H 1812 5.93 0.3 0.7 12.5 000488 10.21 12.48 (0.2) (0.1) 21.7 (52.5) 8.4 8.5 6.3 2.9 4.2 0.76 0.71HISENSE KELON -H 921 8.01 1.0 8.5 7.7 000921 12.19 14.90 0.3 0.9 15.3 (46.2) 13.9 26.2 21.8 n/a n/a 17.72 n/aZOOMLION HEAVY-H 1157 5.75 3.6 7.7 2.7 000157 7.69 9.40 (0.3) 0.3 (5.2) (38.8) 6.4 4.6 3.9 1.1 5.0 1.29 0.98XINJIANG GOLD-H 2208 18.8 4.8 5.1 15.5 002202 22.32 27.28 3.3 6.0 10.8 (31.1) 15.5 54.0 54.7 2.7 0.9 3.12 3.09ZTE-H 763 27.65 4.7 8.9 18.4 000063 31.96 39.07 0.6 (1.7) 17.4 (29.2) 23.2 22.6 18.7 0.9 1.1 3.37 2.87ANGANG STEEL-H 347 6.39 (0.9) (3.9) 1.6 000898 7 8.56 (0.3) (7.2) (2.2) (25.3) 18.4 49.8 23.1 0.9 1.2 0.70 0.70WEICHAI POWER-H 2338 29.05 0.2 (0.7) (10.1) 000338 31.24 38.19 0.4 0.6 (7.2) (23.9) 5.8 6.2 5.7 1.1 1.9 2.14 1.63NORTHEAST ELEC-H 42 3.31 2.5 1.5 4.1 000585 6.65 8.13 0.6 3.6 7.3 262.0 n/a n/a n/a n/a n/a n/a n/a
Average: (32.5)Sources: Bloomberg, ICBCI
VIEWPOINTS EXPRESS – 21 May 2015 v
Equity Research
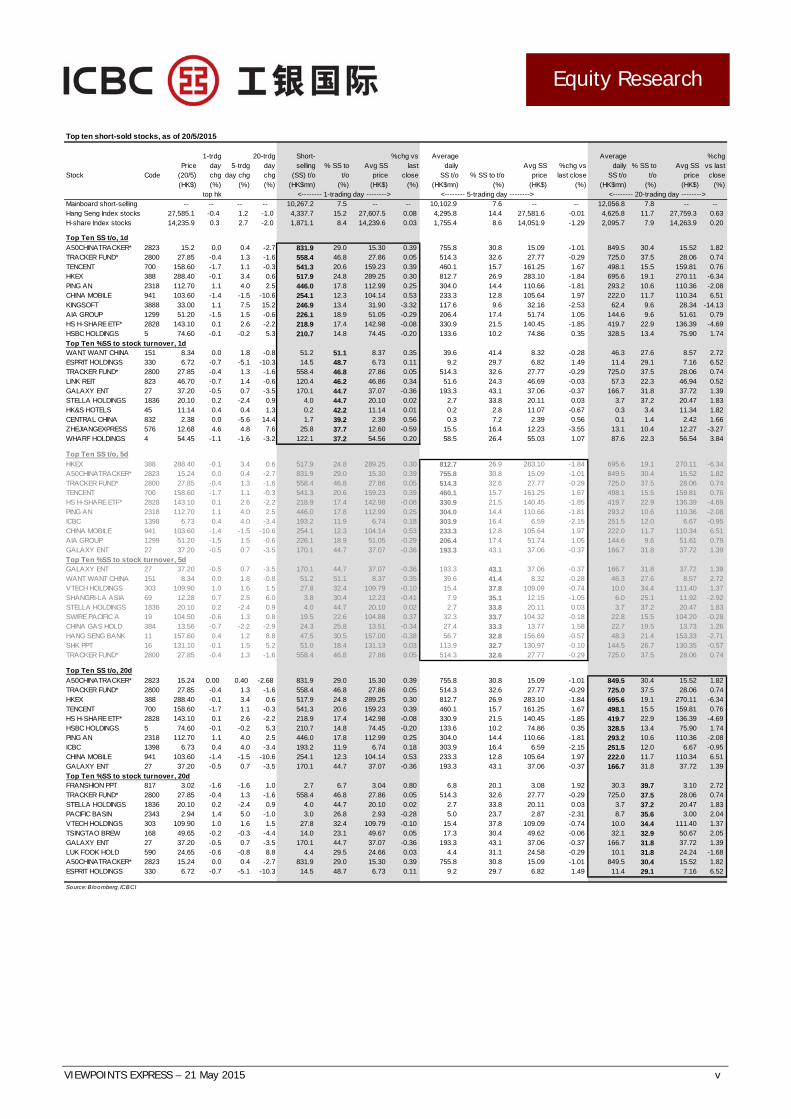
Top ten short-sold stocks, as of 20/5/2015
Stock CodePrice
(20/5)
1-trdg day chg
5-trdg day chg
20-trdg day chg
Short-selling
(SS) t/o% SS to
t/oAvg SS
price
%chg vs last
close
Average daily
SS t/o % SS to t/oAvg SS
price%chg vs last close
Average daily
SS t/o% SS to
t/oAvg SS
price
%chg vs last close
(HK$) (%) (%) (%) (HK$mn) (%) (HK$) (%) (HK$mn) (%) (HK$) (%) (HK$mn) (%) (HK$) (%)top hk <-------- 1-trading day --------> <-------- 5-trading day --------> <-------- 20-trading day -------->
Mainboard short-selling -- -- -- -- 10,267.2 7.5 -- -- 10,102.9 7.6 -- -- 12,056.8 7.8 -- -- Hang Seng Index stocks 27,585.1 -0.4 1.2 -1.0 4,337.7 15.2 27,607.5 0.08 4,295.8 14.4 27,581.6 -0.01 4,625.8 11.7 27,759.3 0.63H-share Index stocks 14,235.9 0.3 2.7 -2.0 1,871.1 8.4 14,239.6 0.03 1,755.4 8.6 14,051.9 -1.29 2,095.7 7.9 14,263.9 0.20
Top Ten SS t/o, 1d
A50CHINATRACKER* 2823 15.2 0.0 0.4 -2.7 831.9 29.0 15.30 0.39 755.8 30.8 15.09 -1.01 849.5 30.4 15.52 1.82TRACKER FUND* 2800 27.85 -0.4 1.3 -1.6 558.4 46.8 27.86 0.05 514.3 32.6 27.77 -0.29 725.0 37.5 28.06 0.74TENCENT 700 158.60 -1.7 1.1 -0.3 541.3 20.6 159.23 0.39 460.1 15.7 161.25 1.67 498.1 15.5 159.81 0.76HKEX 388 288.40 -0.1 3.4 0.6 517.9 24.8 289.25 0.30 812.7 26.9 283.10 -1.84 695.6 19.1 270.11 -6.34PING AN 2318 112.70 1.1 4.0 2.5 446.0 17.8 112.99 0.25 304.0 14.4 110.66 -1.81 293.2 10.6 110.36 -2.08CHINA MOBILE 941 103.60 -1.4 -1.5 -10.6 254.1 12.3 104.14 0.53 233.3 12.8 105.64 1.97 222.0 11.7 110.34 6.51KINGSOFT 3888 33.00 1.1 7.5 15.2 246.9 13.4 31.90 -3.32 117.6 9.6 32.16 -2.53 62.4 9.6 28.34 -14.13AIA GROUP 1299 51.20 -1.5 1.5 -0.6 226.1 18.9 51.05 -0.29 206.4 17.4 51.74 1.05 144.6 9.6 51.61 0.79HS H-SHARE ETF* 2828 143.10 0.1 2.6 -2.2 218.9 17.4 142.98 -0.08 330.9 21.5 140.45 -1.85 419.7 22.9 136.39 -4.69HSBC HOLDINGS 5 74.60 -0.1 -0.2 5.3 210.7 14.8 74.45 -0.20 133.6 10.2 74.86 0.35 328.5 13.4 75.90 1.74
Top Ten %SS to stock turnover, 1dWANT WANT CHINA 151 8.34 0.0 1.8 -0.8 51.2 51.1 8.37 0.35 39.6 41.4 8.32 -0.28 46.3 27.6 8.57 2.72ESPRIT HOLDINGS 330 6.72 -0.7 -5.1 -10.3 14.5 48.7 6.73 0.11 9.2 29.7 6.82 1.49 11.4 29.1 7.16 6.52TRACKER FUND* 2800 27.85 -0.4 1.3 -1.6 558.4 46.8 27.86 0.05 514.3 32.6 27.77 -0.29 725.0 37.5 28.06 0.74LINK REIT 823 46.70 -0.7 1.4 -0.6 120.4 46.2 46.86 0.34 51.6 24.3 46.69 -0.03 57.3 22.3 46.94 0.52GALAXY ENT 27 37.20 -0.5 0.7 -3.5 170.1 44.7 37.07 -0.36 193.3 43.1 37.06 -0.37 166.7 31.8 37.72 1.39STELLA HOLDINGS 1836 20.10 0.2 -2.4 0.9 4.0 44.7 20.10 0.02 2.7 33.8 20.11 0.03 3.7 37.2 20.47 1.83HK&S HOTELS 45 11.14 0.4 0.4 1.3 0.2 42.2 11.14 0.01 0.2 2.8 11.07 -0.67 0.3 3.4 11.34 1.82CENTRAL CHINA 832 2.38 0.0 -5.6 14.4 1.7 39.2 2.39 0.56 0.3 7.2 2.39 0.56 0.1 1.4 2.42 1.66ZHEJIANGEXPRESS 576 12.68 4.6 4.8 7.6 25.8 37.7 12.60 -0.59 15.5 16.4 12.23 -3.55 13.1 10.4 12.27 -3.27WHARF HOLDINGS 4 54.45 -1.1 -1.6 -3.2 122.1 37.2 54.56 0.20 58.5 26.4 55.03 1.07 87.6 22.3 56.54 3.84
Top Ten SS t/o, 5d
HKEX 388 288.40 -0.1 3.4 0.6 517.9 24.8 289.25 0.30 812.7 26.9 283.10 -1.84 695.6 19.1 270.11 -6.34A50CHINATRACKER* 2823 15.24 0.0 0.4 -2.7 831.9 29.0 15.30 0.39 755.8 30.8 15.09 -1.01 849.5 30.4 15.52 1.82TRACKER FUND* 2800 27.85 -0.4 1.3 -1.6 558.4 46.8 27.86 0.05 514.3 32.6 27.77 -0.29 725.0 37.5 28.06 0.74TENCENT 700 158.60 -1.7 1.1 -0.3 541.3 20.6 159.23 0.39 460.1 15.7 161.25 1.67 498.1 15.5 159.81 0.76HS H-SHARE ETF* 2828 143.10 0.1 2.6 -2.2 218.9 17.4 142.98 -0.08 330.9 21.5 140.45 -1.85 419.7 22.9 136.39 -4.69PING AN 2318 112.70 1.1 4.0 2.5 446.0 17.8 112.99 0.25 304.0 14.4 110.66 -1.81 293.2 10.6 110.36 -2.08ICBC 1398 6.73 0.4 4.0 -3.4 193.2 11.9 6.74 0.18 303.9 16.4 6.59 -2.15 251.5 12.0 6.67 -0.95CHINA MOBILE 941 103.60 -1.4 -1.5 -10.6 254.1 12.3 104.14 0.53 233.3 12.8 105.64 1.97 222.0 11.7 110.34 6.51AIA GROUP 1299 51.20 -1.5 1.5 -0.6 226.1 18.9 51.05 -0.29 206.4 17.4 51.74 1.05 144.6 9.6 51.61 0.79GALAXY ENT 27 37.20 -0.5 0.7 -3.5 170.1 44.7 37.07 -0.36 193.3 43.1 37.06 -0.37 166.7 31.8 37.72 1.39
Top Ten %SS to stock turnover, 5dGALAXY ENT 27 37.20 -0.5 0.7 -3.5 170.1 44.7 37.07 -0.36 193.3 43.1 37.06 -0.37 166.7 31.8 37.72 1.39WANT WANT CHINA 151 8.34 0.0 1.8 -0.8 51.2 51.1 8.37 0.35 39.6 41.4 8.32 -0.28 46.3 27.6 8.57 2.72VTECH HOLDINGS 303 109.90 1.0 1.6 1.5 27.8 32.4 109.79 -0.10 15.4 37.8 109.09 -0.74 10.0 34.4 111.40 1.37SHANGRI-LA ASIA 69 12.28 0.7 2.5 6.0 3.8 30.4 12.23 -0.41 7.9 35.1 12.15 -1.05 6.0 25.1 11.92 -2.92STELLA HOLDINGS 1836 20.10 0.2 -2.4 0.9 4.0 44.7 20.10 0.02 2.7 33.8 20.11 0.03 3.7 37.2 20.47 1.83SWIRE PACIFIC A 19 104.50 -0.6 1.3 0.8 19.5 22.6 104.88 0.37 32.3 33.7 104.32 -0.18 22.8 15.5 104.20 -0.28CHINA GAS HOLD 384 13.56 -0.7 -2.2 -2.9 24.3 25.8 13.51 -0.34 27.4 33.3 13.77 1.58 22.7 19.5 13.73 1.26HANG SENG BANK 11 157.60 0.4 1.2 8.8 47.5 30.5 157.00 -0.38 56.7 32.8 156.69 -0.57 48.3 21.4 153.33 -2.71SHK PPT 16 131.10 -0.1 1.5 5.2 51.0 18.4 131.13 0.03 113.9 32.7 130.97 -0.10 144.5 26.7 130.35 -0.57TRACKER FUND* 2800 27.85 -0.4 1.3 -1.6 558.4 46.8 27.86 0.05 514.3 32.6 27.77 -0.29 725.0 37.5 28.06 0.74
Top Ten SS t/o, 20d
A50CHINATRACKER* 2823 15.24 0.00 0.40 -2.68 831.9 29.0 15.30 0.39 755.8 30.8 15.09 -1.01 849.5 30.4 15.52 1.82TRACKER FUND* 2800 27.85 -0.4 1.3 -1.6 558.4 46.8 27.86 0.05 514.3 32.6 27.77 -0.29 725.0 37.5 28.06 0.74HKEX 388 288.40 -0.1 3.4 0.6 517.9 24.8 289.25 0.30 812.7 26.9 283.10 -1.84 695.6 19.1 270.11 -6.34TENCENT 700 158.60 -1.7 1.1 -0.3 541.3 20.6 159.23 0.39 460.1 15.7 161.25 1.67 498.1 15.5 159.81 0.76HS H-SHARE ETF* 2828 143.10 0.1 2.6 -2.2 218.9 17.4 142.98 -0.08 330.9 21.5 140.45 -1.85 419.7 22.9 136.39 -4.69HSBC HOLDINGS 5 74.60 -0.1 -0.2 5.3 210.7 14.8 74.45 -0.20 133.6 10.2 74.86 0.35 328.5 13.4 75.90 1.74PING AN 2318 112.70 1.1 4.0 2.5 446.0 17.8 112.99 0.25 304.0 14.4 110.66 -1.81 293.2 10.6 110.36 -2.08ICBC 1398 6.73 0.4 4.0 -3.4 193.2 11.9 6.74 0.18 303.9 16.4 6.59 -2.15 251.5 12.0 6.67 -0.95CHINA MOBILE 941 103.60 -1.4 -1.5 -10.6 254.1 12.3 104.14 0.53 233.3 12.8 105.64 1.97 222.0 11.7 110.34 6.51GALAXY ENT 27 37.20 -0.5 0.7 -3.5 170.1 44.7 37.07 -0.36 193.3 43.1 37.06 -0.37 166.7 31.8 37.72 1.39
Top Ten %SS to stock turnover, 20dFRANSHION PPT 817 3.02 -1.6 -1.6 1.0 2.7 6.7 3.04 0.80 6.8 20.1 3.08 1.92 30.3 39.7 3.10 2.72TRACKER FUND* 2800 27.85 -0.4 1.3 -1.6 558.4 46.8 27.86 0.05 514.3 32.6 27.77 -0.29 725.0 37.5 28.06 0.74STELLA HOLDINGS 1836 20.10 0.2 -2.4 0.9 4.0 44.7 20.10 0.02 2.7 33.8 20.11 0.03 3.7 37.2 20.47 1.83PACIFIC BASIN 2343 2.94 1.4 5.0 -1.0 3.0 26.8 2.93 -0.28 5.0 23.7 2.87 -2.31 8.7 35.6 3.00 2.04VTECH HOLDINGS 303 109.90 1.0 1.6 1.5 27.8 32.4 109.79 -0.10 15.4 37.8 109.09 -0.74 10.0 34.4 111.40 1.37TSINGTAO BREW 168 49.65 -0.2 -0.3 -4.4 14.0 23.1 49.67 0.05 17.3 30.4 49.62 -0.06 32.1 32.9 50.67 2.05GALAXY ENT 27 37.20 -0.5 0.7 -3.5 170.1 44.7 37.07 -0.36 193.3 43.1 37.06 -0.37 166.7 31.8 37.72 1.39LUK FOOK HOLD 590 24.65 -0.6 -0.8 8.8 4.4 29.5 24.66 0.03 4.4 31.1 24.58 -0.29 10.1 31.8 24.24 -1.68A50CHINATRACKER* 2823 15.24 0.0 0.4 -2.7 831.9 29.0 15.30 0.39 755.8 30.8 15.09 -1.01 849.5 30.4 15.52 1.82ESPRIT HOLDINGS 330 6.72 -0.7 -5.1 -10.3 14.5 48.7 6.73 0.11 9.2 29.7 6.82 1.49 11.4 29.1 7.16 6.52
Source: B loomberg, ICBCI
VIEWPOINTS EXPRESS – 21 May 2015 vi
Equity Research
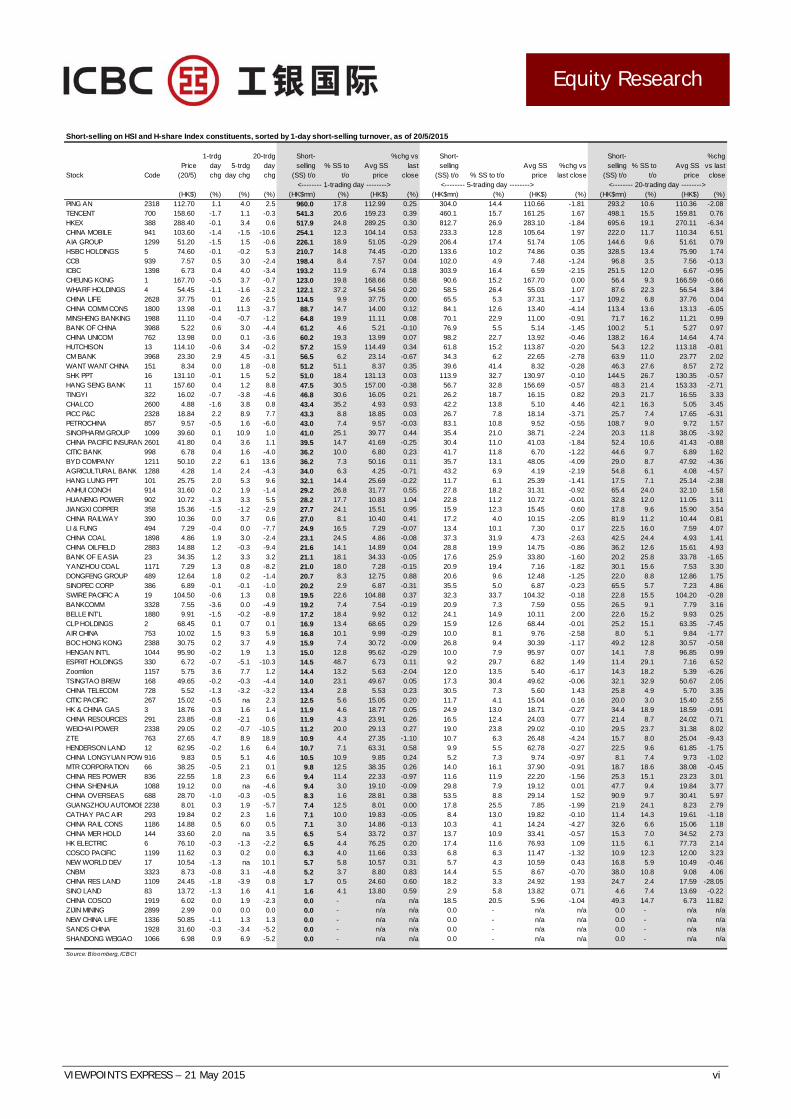
Short-selling on HSI and H-share Index constituents, sorted by 1-day short-selling turnover, as of 20/5/2015
Stock CodePrice
(20/5)
1-trdg day chg
5-trdg day chg
20-trdg day chg
Short-selling
(SS) t/o% SS to
t/oAvg SS
price
%chg vs last
close
Short-selling
(SS) t/o % SS to t/oAvg SS
price%chg vs last close
Short-selling
(SS) t/o% SS to
t/oAvg SS
price
%chg vs last close
<-------- 1-trading day --------> <-------- 5-trading day --------> <-------- 20-trading day -------->(HK$) (%) (%) (%) (HK$mn) (%) (HK$) (%) (HK$mn) (%) (HK$) (%) (HK$mn) (%) (HK$) (%)
PING AN 2318 112.70 1.1 4.0 2.5 960.0 17.8 112.99 0.25 304.0 14.4 110.66 -1.81 293.2 10.6 110.36 -2.08TENCENT 700 158.60 -1.7 1.1 -0.3 541.3 20.6 159.23 0.39 460.1 15.7 161.25 1.67 498.1 15.5 159.81 0.76HKEX 388 288.40 -0.1 3.4 0.6 517.9 24.8 289.25 0.30 812.7 26.9 283.10 -1.84 695.6 19.1 270.11 -6.34CHINA MOBILE 941 103.60 -1.4 -1.5 -10.6 254.1 12.3 104.14 0.53 233.3 12.8 105.64 1.97 222.0 11.7 110.34 6.51AIA GROUP 1299 51.20 -1.5 1.5 -0.6 226.1 18.9 51.05 -0.29 206.4 17.4 51.74 1.05 144.6 9.6 51.61 0.79HSBC HOLDINGS 5 74.60 -0.1 -0.2 5.3 210.7 14.8 74.45 -0.20 133.6 10.2 74.86 0.35 328.5 13.4 75.90 1.74CCB 939 7.57 0.5 3.0 -2.4 198.4 8.4 7.57 0.04 102.0 4.9 7.48 -1.24 96.8 3.5 7.56 -0.13ICBC 1398 6.73 0.4 4.0 -3.4 193.2 11.9 6.74 0.18 303.9 16.4 6.59 -2.15 251.5 12.0 6.67 -0.95CHEUNG KONG 1 167.70 -0.5 3.7 -0.7 123.0 19.8 168.66 0.58 90.6 15.2 167.70 0.00 56.4 9.3 166.59 -0.66WHARF HOLDINGS 4 54.45 -1.1 -1.6 -3.2 122.1 37.2 54.56 0.20 58.5 26.4 55.03 1.07 87.6 22.3 56.54 3.84CHINA LIFE 2628 37.75 0.1 2.6 -2.5 114.5 9.9 37.75 0.00 65.5 5.3 37.31 -1.17 109.2 6.8 37.76 0.04CHINA COMM CONS 1800 13.98 -0.1 11.3 -3.7 88.7 14.7 14.00 0.12 84.1 12.6 13.40 -4.14 113.4 13.6 13.13 -6.05MINSHENG BANKING 1988 11.10 -0.4 -0.7 -1.2 64.8 19.9 11.11 0.08 70.1 22.9 11.00 -0.91 71.7 16.2 11.21 0.99BANK OF CHINA 3988 5.22 0.6 3.0 -4.4 61.2 4.6 5.21 -0.10 76.9 5.5 5.14 -1.45 100.2 5.1 5.27 0.97CHINA UNICOM 762 13.98 0.0 0.1 -3.6 60.2 19.3 13.99 0.07 98.2 22.7 13.92 -0.46 138.2 16.4 14.64 4.74HUTCHISON 13 114.10 -0.6 3.4 -0.2 57.2 15.9 114.49 0.34 61.8 15.2 113.87 -0.20 54.3 12.2 113.18 -0.81CM BANK 3968 23.30 2.9 4.5 -3.1 56.5 6.2 23.14 -0.67 34.3 6.2 22.65 -2.78 63.9 11.0 23.77 2.02WANT WANT CHINA 151 8.34 0.0 1.8 -0.8 51.2 51.1 8.37 0.35 39.6 41.4 8.32 -0.28 46.3 27.6 8.57 2.72SHK PPT 16 131.10 -0.1 1.5 5.2 51.0 18.4 131.13 0.03 113.9 32.7 130.97 -0.10 144.5 26.7 130.35 -0.57HANG SENG BANK 11 157.60 0.4 1.2 8.8 47.5 30.5 157.00 -0.38 56.7 32.8 156.69 -0.57 48.3 21.4 153.33 -2.71TINGYI 322 16.02 -0.7 -3.8 -4.6 46.8 30.6 16.05 0.21 26.2 18.7 16.15 0.82 29.3 21.7 16.55 3.33CHALCO 2600 4.88 -1.6 3.8 0.8 43.4 35.2 4.93 0.93 42.2 13.8 5.10 4.46 42.1 16.3 5.05 3.45PICC P&C 2328 18.84 2.2 8.9 7.7 43.3 8.8 18.85 0.03 26.7 7.8 18.14 -3.71 25.7 7.4 17.65 -6.31PETROCHINA 857 9.57 -0.5 1.6 -6.0 43.0 7.4 9.57 -0.03 83.1 10.8 9.52 -0.55 108.7 9.0 9.72 1.57SINOPHARM GROUP 1099 39.60 0.1 10.9 1.0 41.0 25.1 39.77 0.44 35.4 21.0 38.71 -2.24 20.3 11.8 38.05 -3.92CHINA PACIFIC INSURAN 2601 41.80 0.4 3.6 1.1 39.5 14.7 41.69 -0.25 30.4 11.0 41.03 -1.84 52.4 10.6 41.43 -0.88CITIC BANK 998 6.78 0.4 1.6 -4.0 36.2 10.0 6.80 0.23 41.7 11.8 6.70 -1.22 44.6 9.7 6.89 1.62BYD COMPANY 1211 50.10 2.2 6.1 13.6 36.2 7.3 50.16 0.11 35.7 13.1 48.05 -4.09 29.0 8.7 47.92 -4.36AGRICULTURAL BANK 1288 4.28 1.4 2.4 -4.3 34.0 6.3 4.25 -0.71 43.2 6.9 4.19 -2.19 54.8 6.1 4.08 -4.57HANG LUNG PPT 101 25.75 2.0 5.3 9.6 32.1 14.4 25.69 -0.22 11.7 6.1 25.39 -1.41 17.5 7.1 25.14 -2.38ANHUI CONCH 914 31.60 0.2 1.9 -1.4 29.2 26.8 31.77 0.55 27.8 18.2 31.31 -0.92 65.4 24.0 32.10 1.58HUANENG POWER 902 10.72 -1.3 3.3 5.5 28.2 17.7 10.83 1.04 22.8 11.2 10.72 -0.01 32.8 12.0 11.05 3.11JIANGXI COPPER 358 15.36 -1.5 -1.2 -2.9 27.7 24.1 15.51 0.95 15.9 12.3 15.45 0.60 17.8 9.6 15.90 3.54CHINA RAILWAY 390 10.36 0.0 3.7 0.6 27.0 8.1 10.40 0.41 17.2 4.0 10.15 -2.05 81.9 11.2 10.44 0.81LI & FUNG 494 7.29 -0.4 0.0 -7.7 24.9 16.5 7.29 -0.07 13.4 10.1 7.30 0.17 22.5 16.0 7.59 4.07CHINA COAL 1898 4.86 1.9 3.0 -2.4 23.1 24.5 4.86 -0.08 37.3 31.9 4.73 -2.63 42.5 24.4 4.93 1.41CHINA OILFIELD 2883 14.88 1.2 -0.3 -9.4 21.6 14.1 14.89 0.04 28.8 19.9 14.75 -0.86 36.2 12.6 15.61 4.93BANK OF E ASIA 23 34.35 1.2 3.3 3.2 21.1 18.1 34.33 -0.05 17.6 25.9 33.80 -1.60 20.2 25.8 33.78 -1.65YANZHOU COAL 1171 7.29 1.3 0.8 -8.2 21.0 18.0 7.28 -0.15 20.9 19.4 7.16 -1.82 30.1 15.6 7.53 3.30DONGFENG GROUP 489 12.64 1.8 0.2 -1.4 20.7 8.3 12.75 0.88 20.6 9.6 12.48 -1.25 22.0 8.8 12.86 1.75SINOPEC CORP 386 6.89 -0.1 -0.1 -1.0 20.2 2.9 6.87 -0.31 35.5 5.0 6.87 -0.23 65.5 5.7 7.23 4.86SWIRE PACIFIC A 19 104.50 -0.6 1.3 0.8 19.5 22.6 104.88 0.37 32.3 33.7 104.32 -0.18 22.8 15.5 104.20 -0.28BANKCOMM 3328 7.55 -3.6 0.0 -4.9 19.2 7.4 7.54 -0.19 20.9 7.3 7.59 0.55 26.5 9.1 7.79 3.16BELLE INT'L 1880 9.91 -1.5 -0.2 -8.9 17.2 18.4 9.92 0.12 24.1 14.9 10.11 2.00 22.6 15.2 9.93 0.25CLP HOLDINGS 2 68.45 0.1 0.7 0.1 16.9 13.4 68.65 0.29 15.9 12.6 68.44 -0.01 25.2 15.1 63.35 -7.45AIR CHINA 753 10.02 1.5 9.3 5.9 16.8 10.1 9.99 -0.29 10.0 8.1 9.76 -2.58 8.0 5.1 9.84 -1.77BOC HONG KONG 2388 30.75 0.2 3.7 4.9 15.9 7.4 30.72 -0.09 26.8 9.4 30.39 -1.17 49.2 12.8 30.57 -0.58HENGAN INT'L 1044 95.90 -0.2 1.9 1.3 15.0 12.8 95.62 -0.29 10.0 7.9 95.97 0.07 14.1 7.8 96.85 0.99ESPRIT HOLDINGS 330 6.72 -0.7 -5.1 -10.3 14.5 48.7 6.73 0.11 9.2 29.7 6.82 1.49 11.4 29.1 7.16 6.52Zoomlion 1157 5.75 3.6 7.7 1.2 14.4 13.2 5.63 -2.04 12.0 13.5 5.40 -6.17 14.3 18.2 5.39 -6.26TSINGTAO BREW 168 49.65 -0.2 -0.3 -4.4 14.0 23.1 49.67 0.05 17.3 30.4 49.62 -0.06 32.1 32.9 50.67 2.05CHINA TELECOM 728 5.52 -1.3 -3.2 -3.2 13.4 2.8 5.53 0.23 30.5 7.3 5.60 1.43 25.8 4.9 5.70 3.35CITIC PACIFIC 267 15.02 -0.5 na 2.3 12.5 5.6 15.05 0.20 11.7 4.1 15.04 0.16 20.0 3.0 15.40 2.55HK & CHINA GAS 3 18.76 0.3 1.6 1.4 11.9 4.6 18.77 0.05 24.9 13.0 18.71 -0.27 34.4 18.9 18.59 -0.91CHINA RESOURCES 291 23.85 -0.8 -2.1 0.6 11.9 4.3 23.91 0.26 16.5 12.4 24.03 0.77 21.4 8.7 24.02 0.71WEICHAI POWER 2338 29.05 0.2 -0.7 -10.5 11.2 20.0 29.13 0.27 19.0 23.8 29.02 -0.10 29.5 23.7 31.38 8.02ZTE 763 27.65 4.7 8.9 18.9 10.9 4.4 27.35 -1.10 10.7 6.3 26.48 -4.24 15.7 8.0 25.04 -9.43HENDERSON LAND 12 62.95 -0.2 1.6 6.4 10.7 7.1 63.31 0.58 9.9 5.5 62.78 -0.27 22.5 9.6 61.85 -1.75CHINA LONGYUAN POW 916 9.83 0.5 5.1 4.6 10.5 10.9 9.85 0.24 5.2 7.3 9.74 -0.97 8.1 7.4 9.73 -1.02MTR CORPORATION 66 38.25 -0.5 2.1 0.1 9.8 12.5 38.35 0.26 14.0 16.1 37.90 -0.91 18.7 18.6 38.08 -0.45CHINA RES POWER 836 22.55 1.8 2.3 6.6 9.4 11.4 22.33 -0.97 11.6 11.9 22.20 -1.56 25.3 15.1 23.23 3.01CHINA SHENHUA 1088 19.12 0.0 na -4.6 9.4 3.0 19.10 -0.09 29.8 7.9 19.12 0.01 47.7 9.4 19.84 3.77CHINA OVERSEAS 688 28.70 -1.0 -0.3 -0.5 8.3 1.6 28.81 0.38 53.5 8.8 29.14 1.52 90.9 9.7 30.41 5.97GUANGZHOU AUTOMOB2238 8.01 0.3 1.9 -5.7 7.4 12.5 8.01 0.00 17.8 25.5 7.85 -1.99 21.9 24.1 8.23 2.79CATHAY PAC AIR 293 19.84 0.2 2.3 1.6 7.1 10.0 19.83 -0.05 8.4 13.0 19.82 -0.10 11.4 14.3 19.61 -1.18CHINA RAIL CONS 1186 14.88 0.5 6.0 0.5 7.1 3.0 14.86 -0.13 10.3 4.1 14.24 -4.27 32.6 6.6 15.06 1.18CHINA MER HOLD 144 33.60 2.0 na 3.5 6.5 5.4 33.72 0.37 13.7 10.9 33.41 -0.57 15.3 7.0 34.52 2.73HK ELECTRIC 6 76.10 -0.3 -1.3 -2.2 6.5 4.4 76.25 0.20 17.4 11.6 76.93 1.09 11.5 6.1 77.73 2.14COSCO PACIFIC 1199 11.62 0.3 0.2 0.0 6.3 4.0 11.66 0.33 6.8 6.3 11.47 -1.32 10.9 12.3 12.00 3.23NEW WORLD DEV 17 10.54 -1.3 na 10.1 5.7 5.8 10.57 0.31 5.7 4.3 10.59 0.43 16.8 5.9 10.49 -0.46CNBM 3323 8.73 -0.8 3.1 -4.8 5.2 3.7 8.80 0.83 14.4 5.5 8.67 -0.70 38.0 10.8 9.08 4.06CHINA RES LAND 1109 24.45 -1.8 -3.9 0.8 1.7 0.5 24.60 0.60 18.2 3.3 24.92 1.93 24.7 2.4 17.59 -28.05SINO LAND 83 13.72 -1.3 1.6 4.1 1.6 4.1 13.80 0.59 2.9 5.8 13.82 0.71 4.6 7.4 13.69 -0.22CHINA COSCO 1919 6.02 0.0 1.9 -2.3 0.0 - n/a n/a 18.5 20.5 5.96 -1.04 49.3 14.7 6.73 11.82ZIJIN MINING 2899 2.99 0.0 0.0 0.0 0.0 - n/a n/a 0.0 - n/a n/a 0.0 - n/a n/aNEW CHINA LIFE 1336 50.85 -1.1 1.3 1.3 0.0 - n/a n/a 0.0 - n/a n/a 0.0 - n/a n/aSANDS CHINA 1928 31.60 -0.3 -3.4 -5.2 0.0 - n/a n/a 0.0 - n/a n/a 0.0 - n/a n/aSHANDONG WEIGAO 1066 6.98 0.9 6.9 -5.2 0.0 - n/a n/a 0.0 - n/a n/a 0.0 - n/a n/a
Source: B loomberg, ICBCI

Sales Research Telephone: (852) 2683 3888 Fax: (852) 2683 3881 Telephone: (852) 2683 3888 Fax: (852) 2683 3222
Important Disclosures ICBCI Ratings BUY : Stock with potential return of over 15% over next 12 months HOLD : Stock with potential return of +15% to -15% over next 12 months SELL : Stock with potential loss of over 15% over next 12 months SPECULATIVE BUY : Stock with potential return of over 20% over next 3 months, with high volatility SPECULATIVE SELL : Stock with potential loss of over 20% over next 3 months, with high volatility
ICBCI is the wholly owned subsidiary of Industrial and Commercial Bank of China ICBC International Capital Limited and/or ICBC International Securities Limited have an investment banking relationship with Guangzhou ship, China Shenhua, Sinopec and/or one or more of its affiliates within the past 12 months.
Additional information is available upon request. The views expressed in this report accurately reflect the personal views of the analyst(s) about the subject securities or issuers; and no part of the compensation of the analyst(s) was, is, or will be, directly or indirectly, related to the inclusion of specific recommendations or views in this report.
ICBC International Research Limited Address: 37/F., ICBC Tower, 3 Garden Road, Central, Hong Kong Tel: (852) 2683 3888 Fax: (852) 2683 3900
General Disclosures DISTRIBUTION TO PROFESSIONAL INVESTORS IN HONG KONG AND IN PRC ONLY
THIS DOCUMENT HAS BEEN FURNISHED TO YOU SOLELY FOR YOUR INFORMATION AND MAY NOT BE REPRODUCED OR REDISTRIBUTED TO ANY OTHER PERSON.
The information herein is prepared and published by ICBC International Research Limited and its affiliates (collectively, “ICBCI”) and is strictly confidential to the recipient. This publication is intended for ICBCI, its clients or prospective clients, Industrial and Commercial Bank of China (“ICBC”), subsidiaries and branches of ICBC, to whom it has been delivered and may not be reproduced, transmitted or communicated, in whole or in part, to any other person without the prior written consent of ICBCI. To the extent that onward distribution is permitted by ICBCI, the recipient shall obtain independent local advice to comply with applicable laws and regulations before onward distribution.
This publication is (i) for your private information, and we are not soliciting any action based upon it; (ii) not to be construed as an offer to sell or a solicitation of an offer to buy any security in any jurisdiction where such offer or solicitation would be illegal; and based upon information from sources that we consider reliable, but has not been independently verified by ICBCI. This publication provides general information only. It is not intended to provide personal investment advice and it does not take into account the specific investment objectives, financial situation and the particular needs of any specific person.
This publication may contain information obtained from third parties, including ratings from credit ratings agencies and the distribution of third party content in any form is prohibited except with the prior written permission of the related third party. Third party content providers do not guarantee the accuracy, completeness, timeliness or availability of any information, including ratings, and are not responsible for any errors or omissions (negligent or otherwise), regardless of the cause, or for the results obtained from the use of such content. Third party content providers give no express or implied warranties, including, but not limited to, any warranties of merchantability of fitness for a particular purpose or use. Third party content providers shall not be liable for any direct, indirect, incidental, exemplary, compensatory, punitive, special or consequential damages, costs, expenses, legal fees, or losses (including lost income or profits and opportunity costs) in connection with any use of their content, including ratings. Credit ratings are statements of opinions and are not statements of fact or recommendations to purchase, hold or sell securities. They do not address the suitability of securities or the suitability of securities for investment purposes, and should not be relied on as investment advice.
Figures presented herein may refer to past performance or simulations based on past performance which are not reliable indicators of future performance. Where the information contains an indication of future performance, such forecasts may not be reliable indicator of future performance. Moreover, simulations are based on models and simplifying assumptions which may oversimplify and not reflect the future distribution of returns.
The facts described in this publication, as well as the opinions, estimates, forecasts and projections expressed in it are as of the date hereof and are subject to change without notice. No representation or warranty, express or implied, is made as to and no reliance should be placed on information contained in this publication. ICBCI accepts no liability whatsoever for any direct, indirect or consequential losses or damages arising from or in connection with the use or reliance of this publication or its contents. This publication is not intended to provide, and should not be relied upon as professional advice (including without limitation, accounting, legal or tax advice or investment recommendations) and is not to be taken in substitution for your exercise of judgment. ICBCI does not act as an adviser and assumes no fiduciary responsibility or liability for any consequences, financial or otherwise. Investors shall consider whether any information or recommendation in this publication is suitable for their particular circumstances and, if appropriate, seek professional advice, including tax advice.
Investors should consider this publication as only a single factor in making their investment decision and, as such, the report should not be viewed as identifying or suggesting all risks, direct or indirect, that may be associated with any investment decision. ICBCI produces a number of different types of research product including, among others, fundamental analysis, quantitative analysis and short term trading ideas; recommendations contained in one type of research product differ from recommendations contained in other types of research product, whether as a result of differing time horizons, methodologies or otherwise.
ICBCI, and/or its officers, directors and employees, may, to the extent permitted by applicable law and/or regulation, deal as principal, agent, or otherwise, or have long or short positions in, or buy or sell, the securities, options or other derivative instruments based thereon, of issuers or securities mentioned herein. ICBCI may, to the extent permitted by law, participate or invest in financing transactions with the issuer(s) of the securities referred to in this publication, perform services for or solicit business from such issuers. ICBCI may have served as manager or co-manager of a public offering of securities for, or currently may make a primary market in issues of, any or all of the entities mentioned in this report or may be providing, or have provided within the previous 12 months, other investment banking services, significant advice or investment services in relation to the investment concerned or a related investment. ICBCI may also act as market marker or liquidity provider in the financial instruments of the issuers.
ICBCI manages conflicts with respect to the production of research through its compliance policies and procedures (including, but not limited to, Conflicts of Interest, Chinese Wall and Confidentiality policies) as well as through the maintenance of Chinese walls and employee training.