Embed Size (px)
DESCRIPTION
For the complete report, get in touch with us at : [email protected]
Citation preview
Mobile Engagement and Promotional Services Market in IndiaFebruary 2013
2
SAMPLE
MOBILE ENGAGEMENT AND PROMOTIONAL SERVICES MARKET IN INDIA 2013.PPT
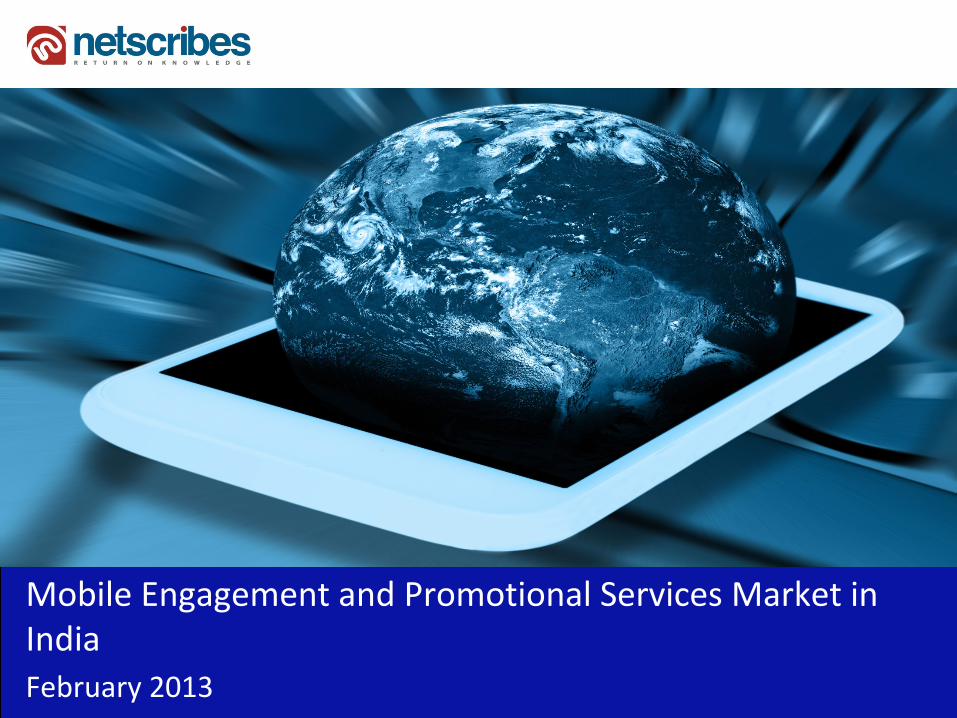
Executive Summary
Drivers:
MarketOverview
Drivers & Challenges
Market Trends
Player Profiles
Mobile engagement market in India was valued over INR xx mn as on Oct 2012
Mobile Ad market in India as on Sep 2012 was estimated at INR yy bn
Infotainment and mobile social media constitute the major types of m‐engagement activities which the companies in India have been predominantly indulging over the recent years
Location Specific Consumer Engagement and Promotion
Interactive Platform
Analytic Tools
Challenges:
Major Players
Low Smartphone & Tablet Penetration in Rural Areas
Affordability of Next Generation Mobile Networks
Low Awareness Levels amongst Commercial Users
Rise in Mobile Device Adoption
Wireless Subscriber Base
Introduction and Availability of Next Generation Cellular Networks
Increased Usage of Mobile VAS, Applications & Online Contents
3MOBILE ENGAGEMENT AND PROMOTIONAL SERVICES MARKET IN INDIA 2013.PPT
•Introduction•Market OverviewEcosystems and Frameworks
•Drivers and Challenges •Opportunities•Market Trends•Competitive Landscape•Recent Developments•Consumer Insights •Case Studies•Strategic Recommendations•Appendix
4
SAMPLE
MOBILE ENGAGEMENT AND PROMOTIONAL SERVICES MARKET IN INDIA 2013.PPT
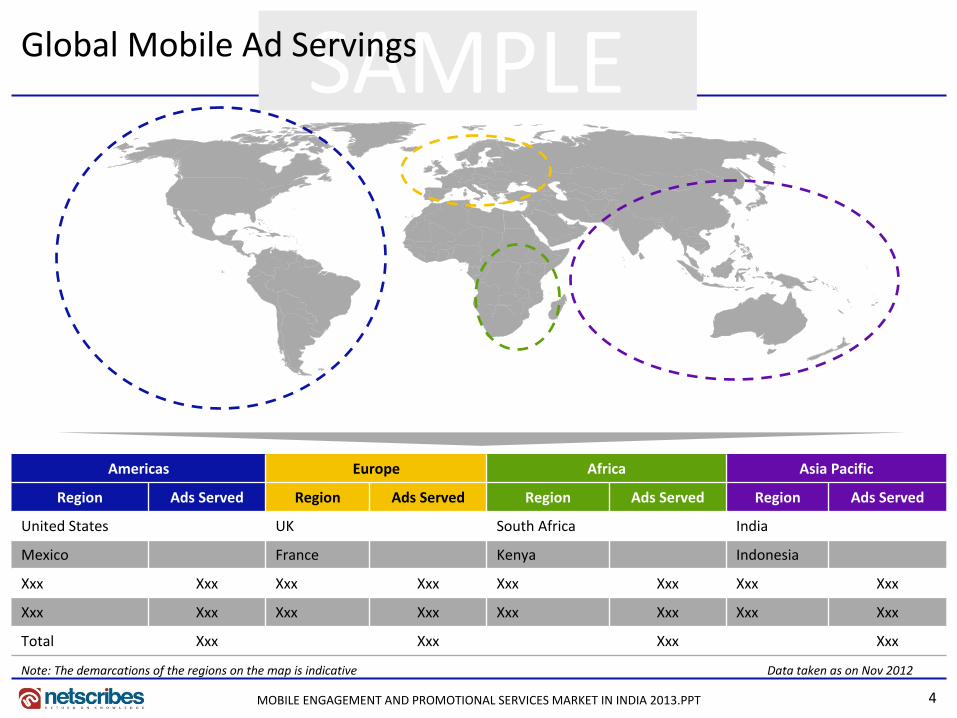
Global Mobile Ad Servings
Note: The demarcations of the regions on the map is indicative Data taken as on Nov 2012
Americas Europe Africa Asia Pacific
Region Ads Served Region Ads Served Region Ads Served Region Ads Served
United States UK South Africa India
Mexico France Kenya Indonesia
Xxx Xxx Xxx Xxx Xxx Xxx Xxx Xxx
Xxx Xxx Xxx Xxx Xxx Xxx Xxx Xxx
Total Xxx Xxx Xxx Xxx
5
SAMPLE
MOBILE ENGAGEMENT AND PROMOTIONAL SERVICES MARKET IN INDIA 2013.PPT
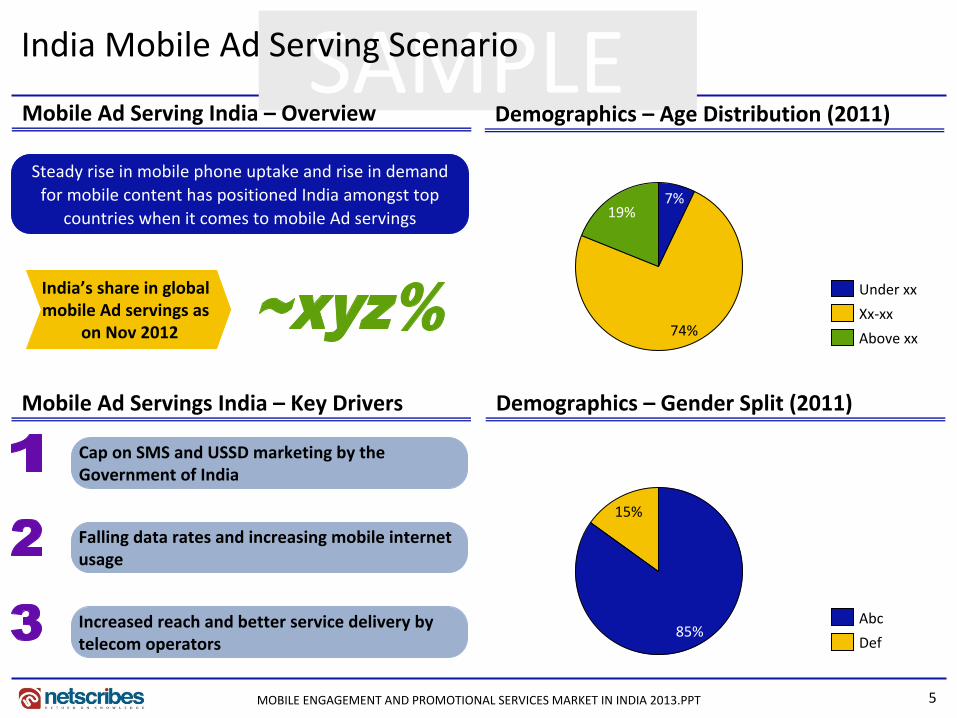
India Mobile Ad Serving Scenario
India’s share in global mobile Ad servings as
on Nov 2012
19%
74%
7%
Above xx
Xx‐xx
Under xx
Demographics – Age Distribution (2011)
Demographics – Gender Split (2011)
15%
85%Def
Abc
Steady rise in mobile phone uptake and rise in demand for mobile content has positioned India amongst top
countries when it comes to mobile Ad servings
Mobile Ad Serving India – Overview
Mobile Ad Servings India – Key Drivers
Cap on SMS and USSD marketing by the Government of India
Falling data rates and increasing mobile internet usage
Increased reach and better service delivery by telecom operators
6
SAMPLE
MOBILE ENGAGEMENT AND PROMOTIONAL SERVICES MARKET IN INDIA 2013.PPT
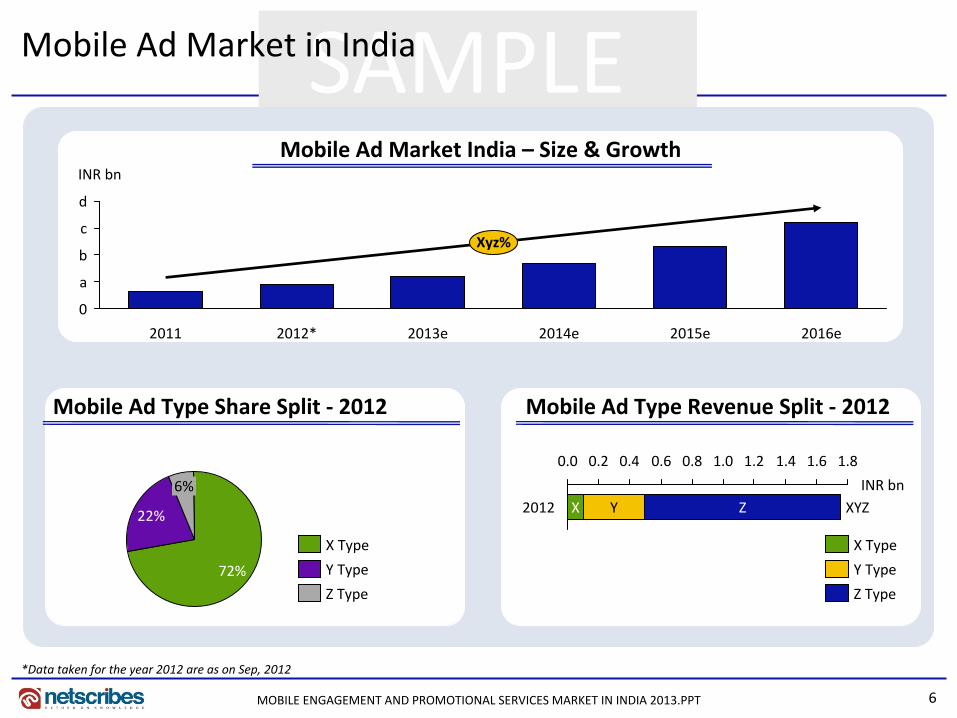
Mobile Ad Market in India
Mobile Ad Market India – Size & GrowthINR bn
d
c
b
a
0
Xyz%
2016e2015e2014e2013e2012*2011
Mobile Ad Type Revenue Split ‐ 2012
6%
22%
72%
Z Type
Y Type
X Type
Mobile Ad Type Share Split ‐ 2012
0.0 0.2 0.4 0.6 0.8 1.0 1.2 1.4 1.6 1.8
INR bn2012 XYZX Y Z
X Type
Y Type
Z Type
*Data taken for the year 2012 are as on Sep, 2012
7
SAMPLE
MOBILE ENGAGEMENT AND PROMOTIONAL SERVICES MARKET IN INDIA 2013.PPT
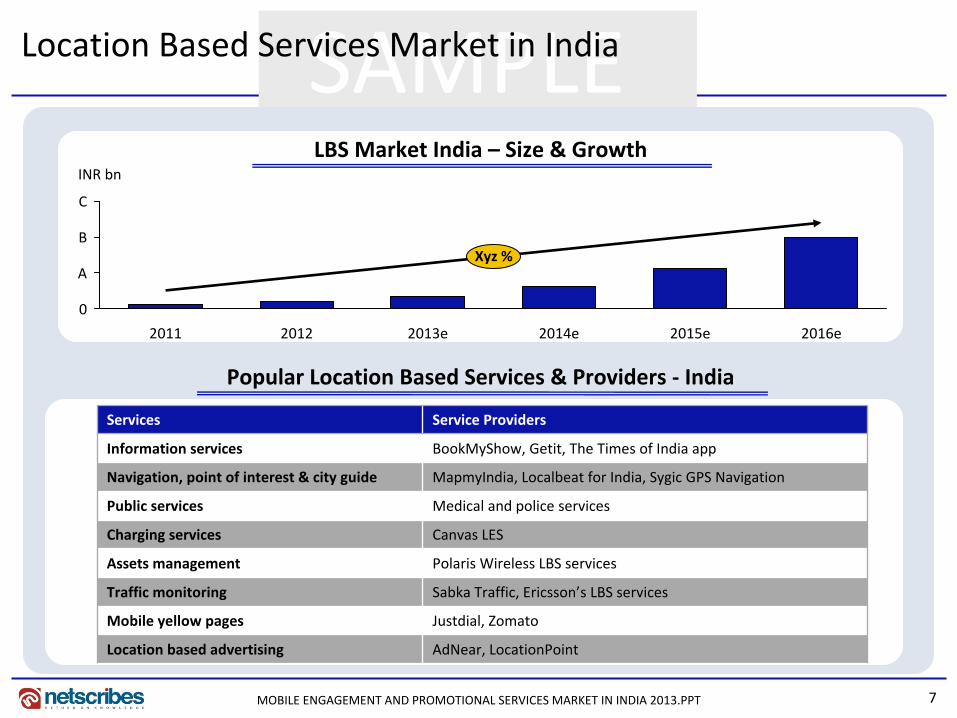
Location Based Services Market in India
INR bn
C
B
A
0
Xyz %
2016e2015e2014e2013e20122011
Popular Location Based Services & Providers ‐ India
LBS Market India – Size & Growth
Services Service Providers
Information services BookMyShow, Getit, The Times of India app
Navigation, point of interest & city guide MapmyIndia, Localbeat for India, Sygic GPS Navigation
Public services Medical and police services
Charging services Canvas LES
Assets management Polaris Wireless LBS services
Traffic monitoring Sabka Traffic, Ericsson’s LBS services
Mobile yellow pages Justdial, Zomato
Location based advertising AdNear, LocationPoint
8
SAMPLE
MOBILE ENGAGEMENT AND PROMOTIONAL SERVICES MARKET IN INDIA 2013.PPT
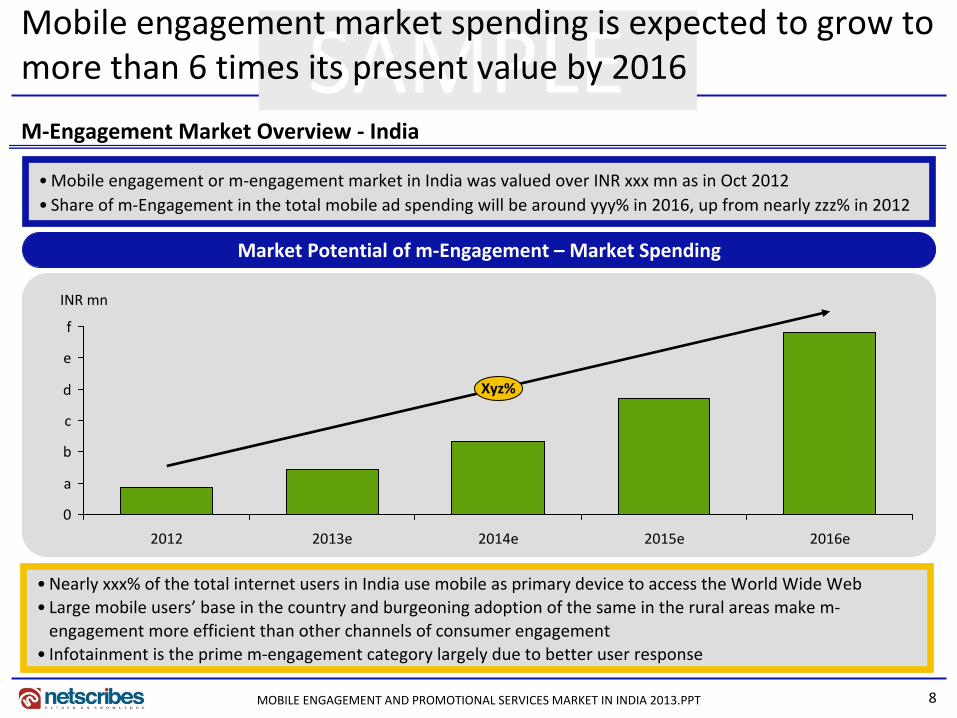
Mobile engagement market spending is expected to grow to more than 6 times its present value by 2016
M‐Engagement Market Overview ‐ India
INR mn
f
e
d
c
b
a
0
2012
Xyz%
2016e2015e2014e2013e
•Nearly xxx% of the total internet users in India use mobile as primary device to access the World Wide Web• Large mobile users’ base in the country and burgeoning adoption of the same in the rural areas make m‐engagement more efficient than other channels of consumer engagement
• Infotainment is the prime m‐engagement category largely due to better user response
Market Potential of m‐Engagement – Market Spending
•Mobile engagement or m‐engagement market in India was valued over INR xxx mn as in Oct 2012• Share of m‐Engagement in the total mobile ad spending will be around yyy% in 2016, up from nearly zzz% in 2012
9
SAMPLE
MOBILE ENGAGEMENT AND PROMOTIONAL SERVICES MARKET IN INDIA 2013.PPT
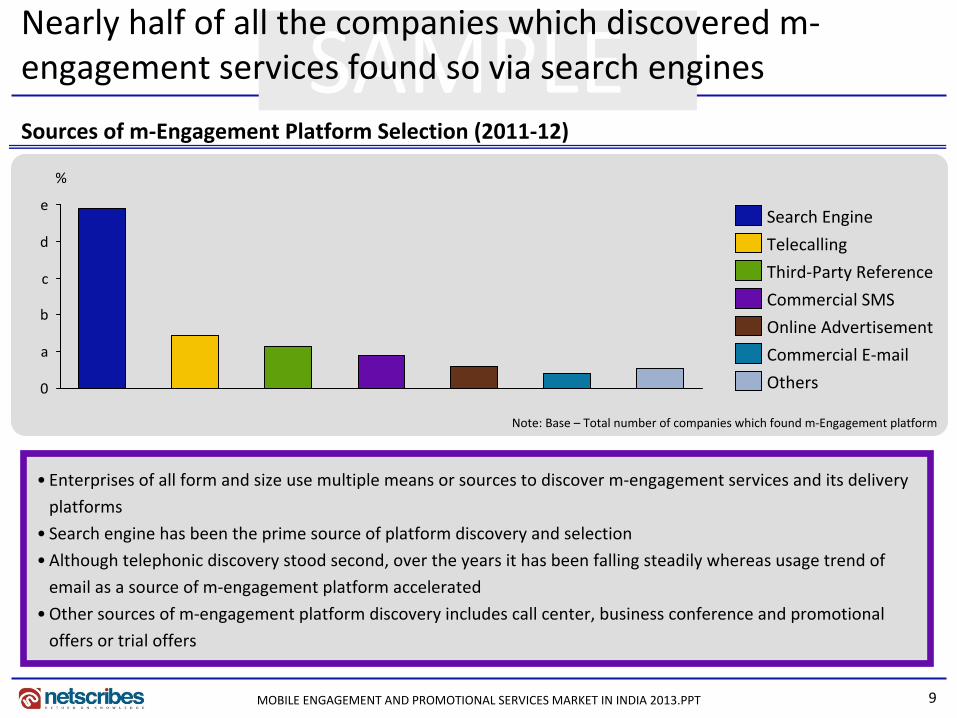
Nearly half of all the companies which discovered m‐engagement services found so via search engines
Sources of m‐Engagement Platform Selection (2011‐12)
• Enterprises of all form and size use multiple means or sources to discover m‐engagement services and its delivery
platforms
• Search engine has been the prime source of platform discovery and selection
• Although telephonic discovery stood second, over the years it has been falling steadily whereas usage trend of
email as a source of m‐engagement platform accelerated
•Other sources of m‐engagement platform discovery includes call center, business conference and promotional
offers or trial offers
%
e
d
c
b
a
0 Others
Commercial E‐mail
Online Advertisement
Commercial SMS
Third‐Party Reference
Telecalling
Search Engine
Note: Base – Total number of companies which found m‐Engagement platform
10
SAMPLE
MOBILE ENGAGEMENT AND PROMOTIONAL SERVICES MARKET IN INDIA 2013.PPT
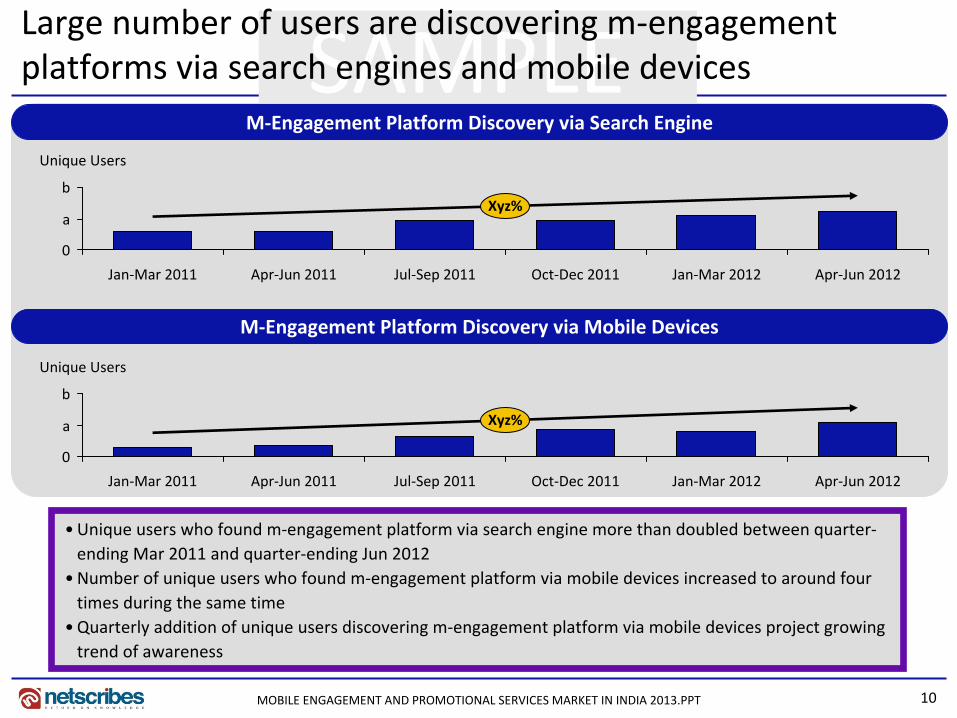
Large number of users are discovering m‐engagement platforms via search engines and mobile devices
•Unique users who found m‐engagement platform via search engine more than doubled between quarter‐ending Mar 2011 and quarter‐ending Jun 2012
•Number of unique users who found m‐engagement platform via mobile devices increased to around four times during the same time
•Quarterly addition of unique users discovering m‐engagement platform via mobile devices project growing trend of awareness
Apr‐Jun 2012Jan‐Mar 2012Oct‐Dec 2011Jul‐Sep 2011Apr‐Jun 2011Jan‐Mar 2011
Xyz%
Unique Users
b
a
0
M‐Engagement Platform Discovery via Search Engine
M‐Engagement Platform Discovery via Mobile Devices
Unique Users
b
a
0
Xyz%
Apr‐Jun 2012Jan‐Mar 2012Oct‐Dec 2011Jul‐Sep 2011Apr‐Jun 2011Jan‐Mar 2011
11
SAMPLE
MOBILE ENGAGEMENT AND PROMOTIONAL SERVICES MARKET IN INDIA 2013.PPT
Smartphone App – Highest Activity / Usage
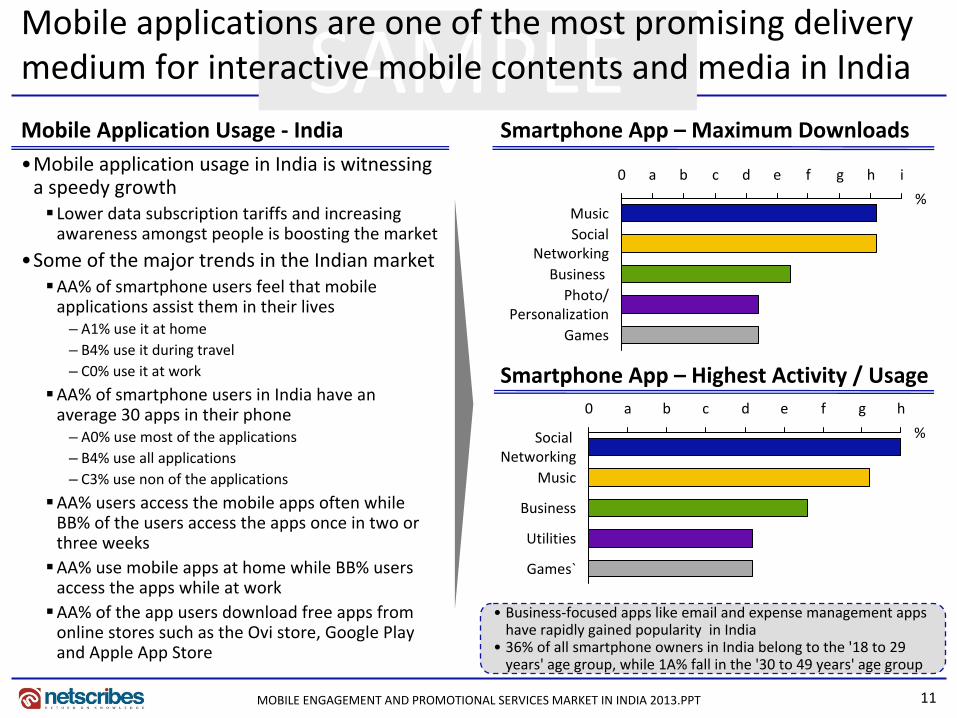
Mobile applications are one of the most promising delivery medium for interactive mobile contents and media in India
•Mobile application usage in India is witnessing a speedy growth Lower data subscription tariffs and increasing awareness amongst people is boosting the market
•Some of the major trends in the Indian marketAA% of smartphone users feel that mobile applications assist them in their lives
– A1% use it at home– B4% use it during travel– C0% use it at work
AA% of smartphone users in India have an average 30 apps in their phone
– A0% use most of the applications– B4% use all applications– C3% use non of the applications
AA% users access the mobile apps often while BB% of the users access the apps once in two or three weeksAA% use mobile apps at home while BB% users access the apps while at work AA% of the app users download free apps from online stores such as the Ovi store, Google Play and Apple App Store
Mobile Application Usage ‐ India
%
ihgfedcba0
Games
Photo/Personalization
Business
SocialNetworking
Music
Social Networking
h
%
gfedcba0
Games`
Utilities
Business
Music
• Business‐focused apps like email and expense management apps have rapidly gained popularity in India
• 36% of all smartphone owners in India belong to the '18 to 29 years' age group, while 1A% fall in the '30 to 49 years' age group
Smartphone App – Maximum Downloads
12
SAMPLE
MOBILE ENGAGEMENT AND PROMOTIONAL SERVICES MARKET IN INDIA 2013.PPT
Social Media Domain – Brimming with Opportunities (2/2)
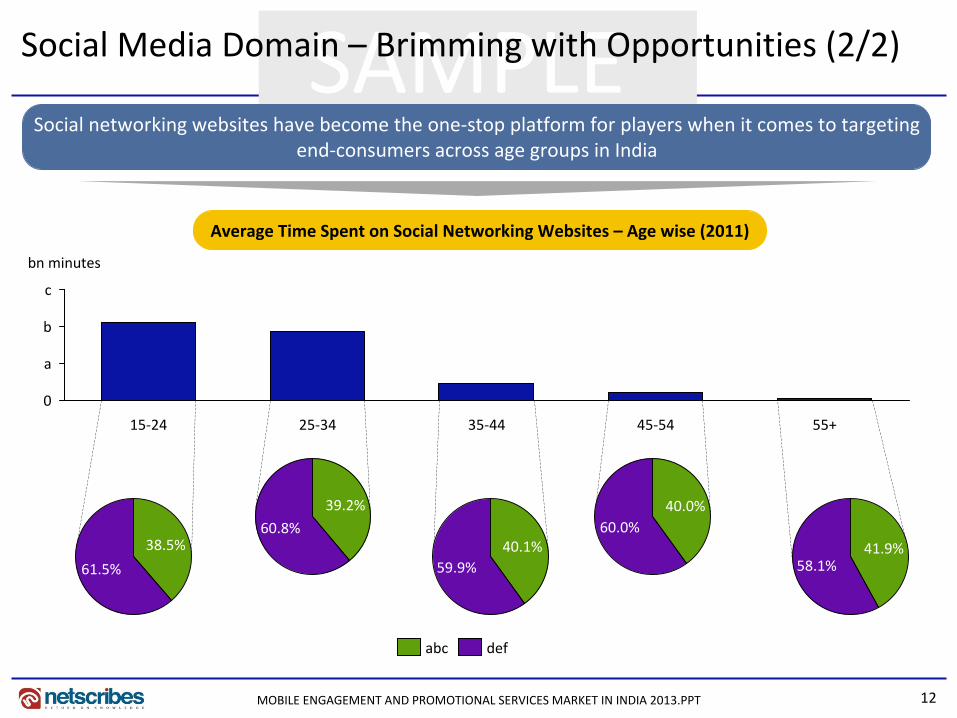
Social networking websites have become the one‐stop platform for players when it comes to targeting end‐consumers across age groups in India
Average Time Spent on Social Networking Websites – Age wise (2011)
bn minutes
c
b
a
0
55+45‐5435‐4425‐3415‐24
61.5%
38.5%
defabc
39.2%
60.8%
59.9%40.1%
60.0%40.0%
58.1%41.9%
13
SAMPLE
MOBILE ENGAGEMENT AND PROMOTIONAL SERVICES MARKET IN INDIA 2013.PPT
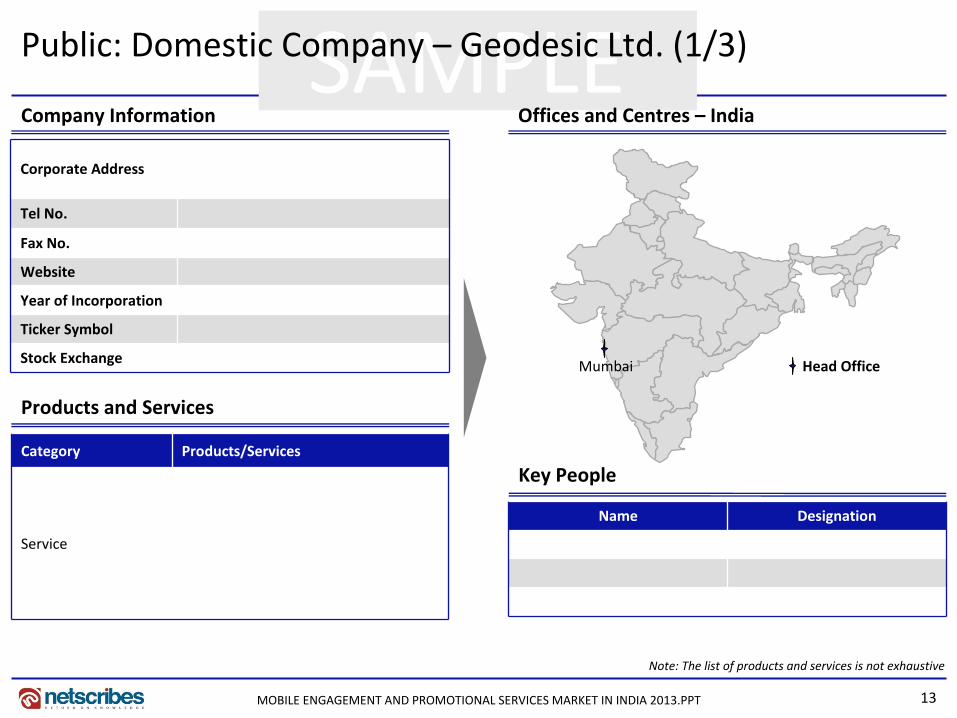
Public: Domestic Company – Geodesic Ltd. (1/3)
Key People
Products and Services
Company Information Offices and Centres – India
Corporate Address
Tel No.
Fax No.
Website
Year of Incorporation
Ticker Symbol
Stock Exchange
Category Products/Services
Service
Name Designation
Note: The list of products and services is not exhaustive
Head OfficeMumbai
14
SAMPLE
MOBILE ENGAGEMENT AND PROMOTIONAL SERVICES MARKET IN INDIA 2013.PPT
Public: Domestic Company – Geodesic Ltd. (2/3)
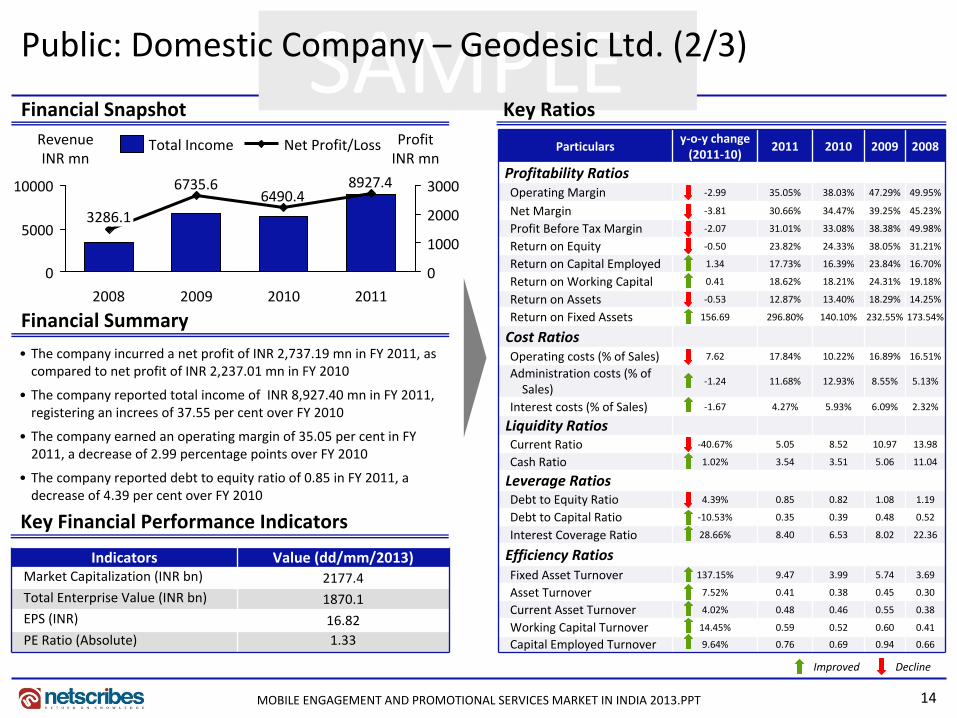
Financial Snapshot Key Ratios
Financial Summary
• The company incurred a net profit of INR 2,737.19 mn in FY 2011, as compared to net profit of INR 2,237.01 mn in FY 2010
• The company reported total income of INR 8,927.40 mn in FY 2011, registering an increes of 37.55 per cent over FY 2010
• The company earned an operating margin of 35.05 per cent in FY 2011, a decrease of 2.99 percentage points over FY 2010
• The company reported debt to equity ratio of 0.85 in FY 2011, a decrease of 4.39 per cent over FY 2010
Key Financial Performance Indicators
Indicators Value (dd/mm/2013)Market Capitalization (INR bn) 2177.4Total Enterprise Value (INR bn) 1870.1EPS (INR) 16.82PE Ratio (Absolute) 1.33
Improved Decline
Net Profit/LossTotal Income
8927.46490.4
6735.6
0
5000
10000
0
1000
2000
3000
RevenueINR mn
ProfitINR mn
201020092008
3286.1
2011
Particulars y‐o‐y change (2011‐10)
2011 2010 2009 2008
Profitability RatiosOperating Margin ‐2.99 35.05% 38.03% 47.29% 49.95%
Net Margin ‐3.81 30.66% 34.47% 39.25% 45.23%
Profit Before Tax Margin ‐2.07 31.01% 33.08% 38.38% 49.98%
Return on Equity ‐0.50 23.82% 24.33% 38.05% 31.21%
Return on Capital Employed 1.34 17.73% 16.39% 23.84% 16.70%
Return on Working Capital 0.41 18.62% 18.21% 24.31% 19.18%
Return on Assets ‐0.53 12.87% 13.40% 18.29% 14.25%
Return on Fixed Assets 156.69 296.80% 140.10% 232.55% 173.54%
Cost RatiosOperating costs (% of Sales) 7.62 17.84% 10.22% 16.89% 16.51%
Administration costs (% of Sales)
‐1.24 11.68% 12.93% 8.55% 5.13%
Interest costs (% of Sales) ‐1.67 4.27% 5.93% 6.09% 2.32%
Liquidity RatiosCurrent Ratio ‐40.67% 5.05 8.52 10.97 13.98
Cash Ratio 1.02% 3.54 3.51 5.06 11.04
Leverage RatiosDebt to Equity Ratio 4.39% 0.85 0.82 1.08 1.19
Debt to Capital Ratio ‐10.53% 0.35 0.39 0.48 0.52
Interest Coverage Ratio 28.66% 8.40 6.53 8.02 22.36
Efficiency RatiosFixed Asset Turnover 137.15% 9.47 3.99 5.74 3.69
Asset Turnover 7.52% 0.41 0.38 0.45 0.30
Current Asset Turnover 4.02% 0.48 0.46 0.55 0.38
Working Capital Turnover 14.45% 0.59 0.52 0.60 0.41
Capital Employed Turnover 9.64% 0.76 0.69 0.94 0.66
15
SAMPLE
MOBILE ENGAGEMENT AND PROMOTIONAL SERVICES MARKET IN INDIA 2013.PPT
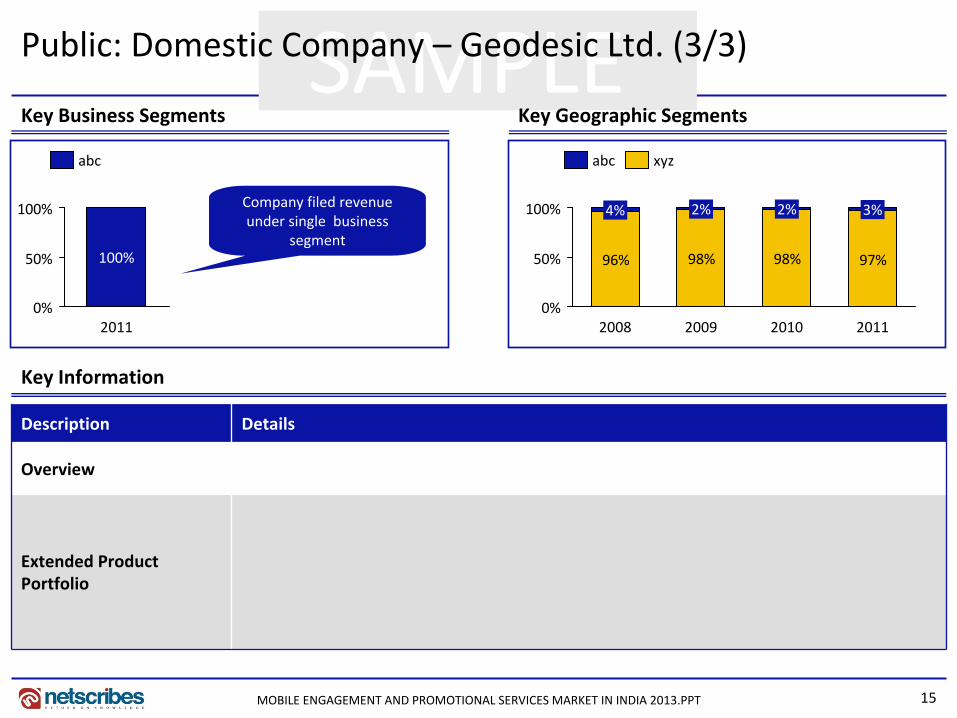
Public: Domestic Company – Geodesic Ltd. (3/3)
Key Business Segments Key Geographic Segments
Key Information
Description Details
Overview
Extended Product Portfolio
96% 98% 98% 97%
0%
50%
100% 2%
2008 2011
3%
2010
2%
2009
4%
xyzabc
0%
50%
100%
100%
2011
abc
Company filed revenue under single business
segment
16
SAMPLE
MOBILE ENGAGEMENT AND PROMOTIONAL SERVICES MARKET IN INDIA 2013.PPT
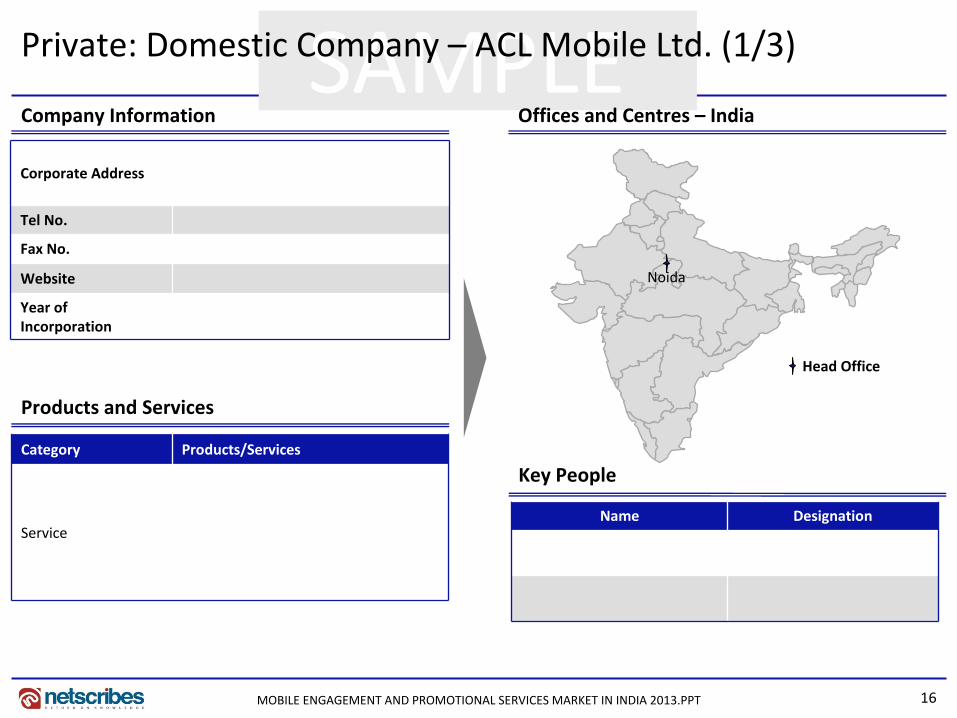
Key People
Products and Services
Company Information Offices and Centres – India
Corporate Address
Tel No.
Fax No.
Website
Year of Incorporation
Name Designation
Private: Domestic Company – ACL Mobile Ltd. (1/3)
Head Office
Category Products/Services
Service
Noida
17
SAMPLE
MOBILE ENGAGEMENT AND PROMOTIONAL SERVICES MARKET IN INDIA 2013.PPT
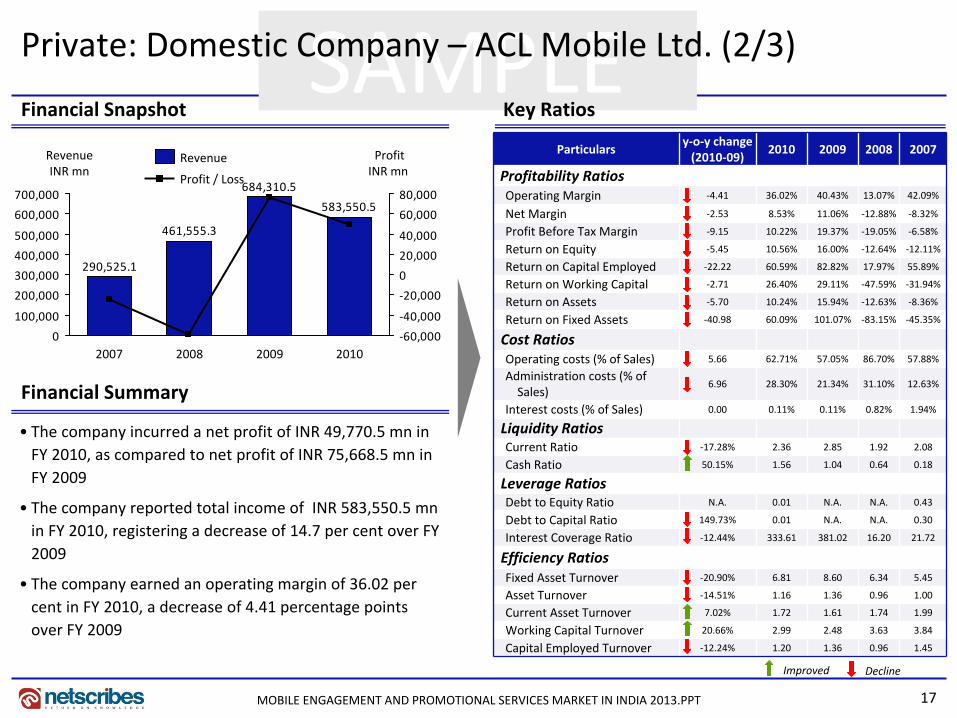
Financial Snapshot Key Ratios
Financial Summary
Private: Domestic Company – ACL Mobile Ltd. (2/3)
• The company incurred a net profit of INR 49,770.5 mn in FY 2010, as compared to net profit of INR 75,668.5 mn in FY 2009
• The company reported total income of INR 583,550.5 mn in FY 2010, registering a decrease of 14.7 per cent over FY 2009
• The company earned an operating margin of 36.02 per cent in FY 2010, a decrease of 4.41 percentage points over FY 2009
Particulars y‐o‐y change (2010‐09)
2010 2009 2008 2007
Profitability RatiosOperating Margin ‐4.41 36.02% 40.43% 13.07% 42.09%
Net Margin ‐2.53 8.53% 11.06% ‐12.88% ‐8.32%
Profit Before Tax Margin ‐9.15 10.22% 19.37% ‐19.05% ‐6.58%
Return on Equity ‐5.45 10.56% 16.00% ‐12.64% ‐12.11%
Return on Capital Employed ‐22.22 60.59% 82.82% 17.97% 55.89%
Return on Working Capital ‐2.71 26.40% 29.11% ‐47.59% ‐31.94%
Return on Assets ‐5.70 10.24% 15.94% ‐12.63% ‐8.36%
Return on Fixed Assets ‐40.98 60.09% 101.07% ‐83.15% ‐45.35%
Cost RatiosOperating costs (% of Sales) 5.66 62.71% 57.05% 86.70% 57.88%
Administration costs (% of Sales)
6.96 28.30% 21.34% 31.10% 12.63%
Interest costs (% of Sales) 0.00 0.11% 0.11% 0.82% 1.94%
Liquidity RatiosCurrent Ratio ‐17.28% 2.36 2.85 1.92 2.08
Cash Ratio 50.15% 1.56 1.04 0.64 0.18
Leverage RatiosDebt to Equity Ratio N.A. 0.01 N.A. N.A. 0.43
Debt to Capital Ratio 149.73% 0.01 N.A. N.A. 0.30
Interest Coverage Ratio ‐12.44% 333.61 381.02 16.20 21.72
Efficiency RatiosFixed Asset Turnover ‐20.90% 6.81 8.60 6.34 5.45
Asset Turnover ‐14.51% 1.16 1.36 0.96 1.00
Current Asset Turnover 7.02% 1.72 1.61 1.74 1.99
Working Capital Turnover 20.66% 2.99 2.48 3.63 3.84
Capital Employed Turnover ‐12.24% 1.20 1.36 0.96 1.45
Improved Decline
Profit / Loss
Revenue
583,550.5
684,310.5
461,555.3
290,525.1
0
100,000
200,000
300,000
400,000
500,000
600,000
700,000
‐60,000
‐40,000
‐20,000
0
20,000
40,000
60,000
80,000
ProfitINR mn
2010
RevenueINR mn
200920082007
18
SAMPLE
MOBILE ENGAGEMENT AND PROMOTIONAL SERVICES MARKET IN INDIA 2013.PPT
Private: Domestic Company – ACL Mobile Ltd. (3/3)
Key Information
Description Details
Overview
Extended Product Portfolio
19
SAMPLE
MOBILE ENGAGEMENT AND PROMOTIONAL SERVICES MARKET IN INDIA 2013.PPT
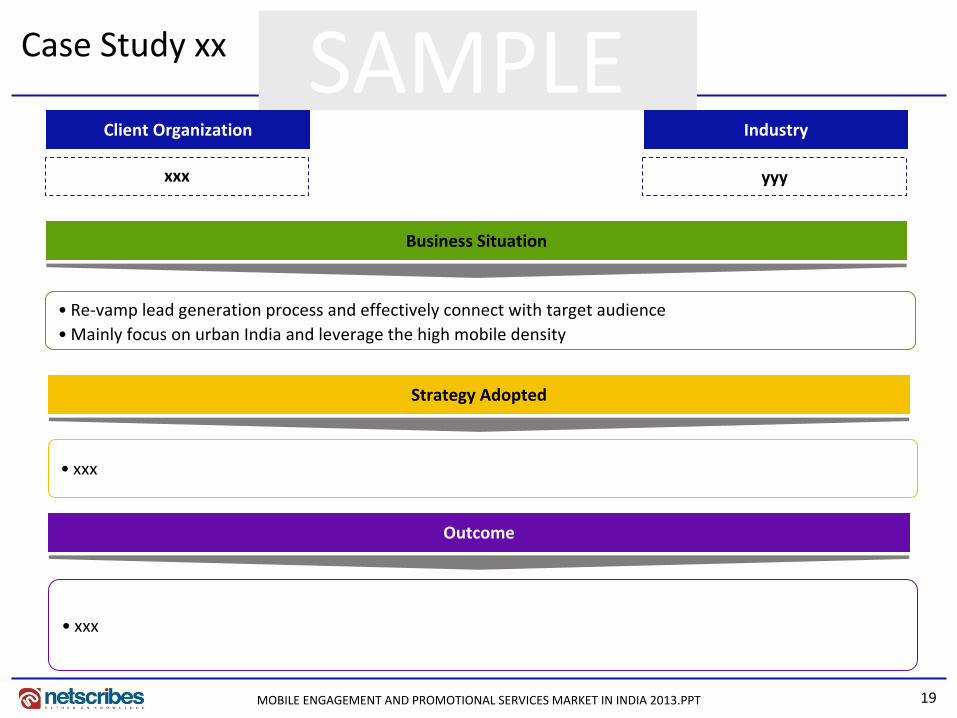
Case Study xx
Business Situation
• Re‐vamp lead generation process and effectively connect with target audience •Mainly focus on urban India and leverage the high mobile density
Client Organization Industry
xxx yyy
Outcome
• xxx
Strategy Adopted
• xxx
20MOBILE ENGAGEMENT AND PROMOTIONAL SERVICES MARKET IN INDIA 2013.PPT
Thank you for the attentionThe Mobile Engagement and Promotional Services – India 2013 report is a part of Netscribes’Telecom Series.For more detailed information or customized research requirements please contact:
About NetscribesNetscribes is a knowledge‐consulting and solutions firm with clientele across the globe. The company’s expertise spans areas of investment & business research, business & corporate intelligence, content‐management services, and knowledge‐software services. At its core lies a true value proposition that draws upon a vast knowledge base. Netscribes is a one‐stop shop designed to fulfil clients’ profitability and growth objectives.
Disclaimer: This report is published for general information only. Although high standards have been used in the preparation of this report,Netscribes is not responsible for any loss or damage arising from use of this document. This document is the sole property of Netscribes. and prior permission is required for guidelines on reproduction.
Phone: +91 33 4027 6214 / 6215E‐Mail: [email protected]
Follow us on: