Embed Size (px)
Citation preview
0.6
0.7
0.8
0.9
1
1.1
1.2
1.3
1.4
1.5
1.6
28-Jul-12
20-Sep-12
13-Nov-12
6-Jan-13
1-Mar-13
24-Apr-13
17-Jun-13
10-Aug-13
3-Oct-13
26-Nov-13
19-Jan-14
14-Mar-14
7-May-14
30-Jun-14
23-Aug-14
16-Oct-14
9-Dec-14
1-Feb-15
27-Mar-15
400450500550600650700750800850900950100010501100115012001250130013501400145015001550160016501700175018001850190019502000205021002150
SPX Daily
Put/Call Ratio Indicator
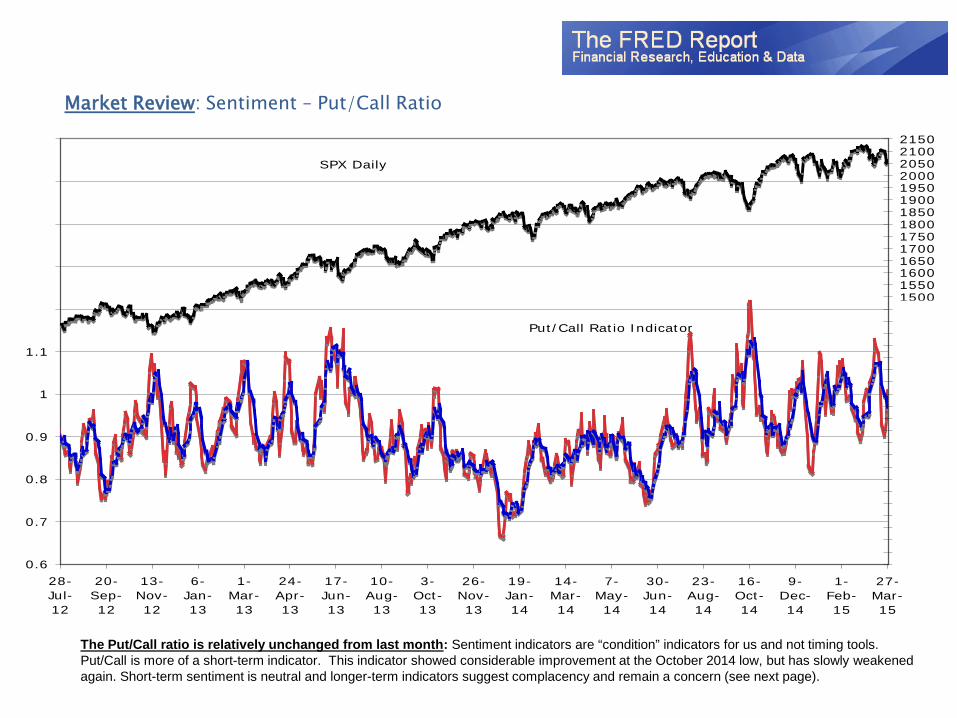
The Put/Call ratio is relatively unchanged from last month: Sentiment indicators are “condition” indicators for us and not timing tools. Put/Call is more of a short-term indicator. This indicator showed considerable improvement at the October 2014 low, but has slowly weakened again. Short-term sentiment is neutral and longer-term indicators suggest complacency and remain a concern (see next page).
Market Review: Sentiment – Put/Call Ratio
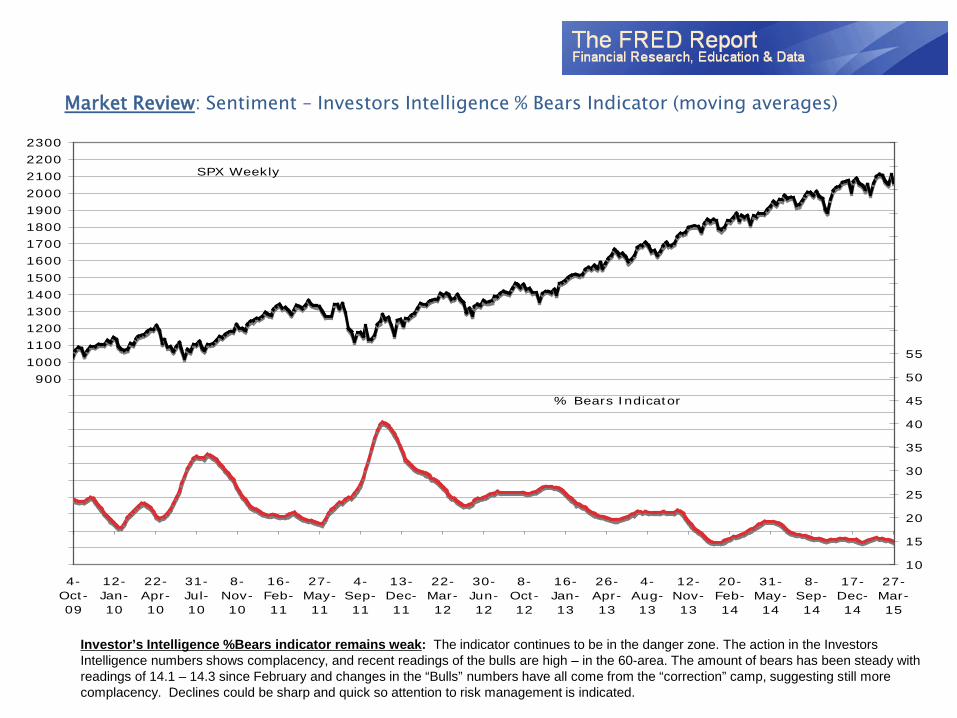
Investor’s Intelligence %Bears indicator remains weak: The indicator continues to be in the danger zone. The action in the Investors Intelligence numbers shows complacency, and recent readings of the bulls are high – in the 60-area. The amount of bears has been steady with readings of 14.1 – 14.3 since February and changes in the “Bulls” numbers have all come from the “correction” camp, suggesting still more complacency. Declines could be sharp and quick so attention to risk management is indicated.
Market Review: Sentiment – Investors Intelligence % Bears Indicator (moving averages)
-200-100
0100200300400500600700800900
10001100120013001400150016001700180019002000210022002300
4-Oct-09
12-Jan-10
22-Apr-10
31-Jul-10
8-Nov-10
16-Feb-11
27-May-11
4-Sep-11
13-Dec-11
22-Mar-12
30-Jun-12
8-Oct-12
16-Jan-13
26-Apr-13
4-Aug-13
12-Nov-13
20-Feb-14
31-May-14
8-Sep-14
17-Dec-14
27-Mar-15
10
15
20
25
30
35
40
45
50
55
60
65
70
75
80
85
90
95
100
SPX Weekly
% Bears Indicator
MTA Educational Foundation University Course – Technical Analysis of the Financial Markets ©2010
Lecture 10 - Sentiment & Supply/Demand
This lecture series is produced by the Market Technicians Association
Educational Foundation based on the detailed class notes
of Charles D. Kirkpatrick II, CMT Copyright © 2010.
All rights are reserved.
1
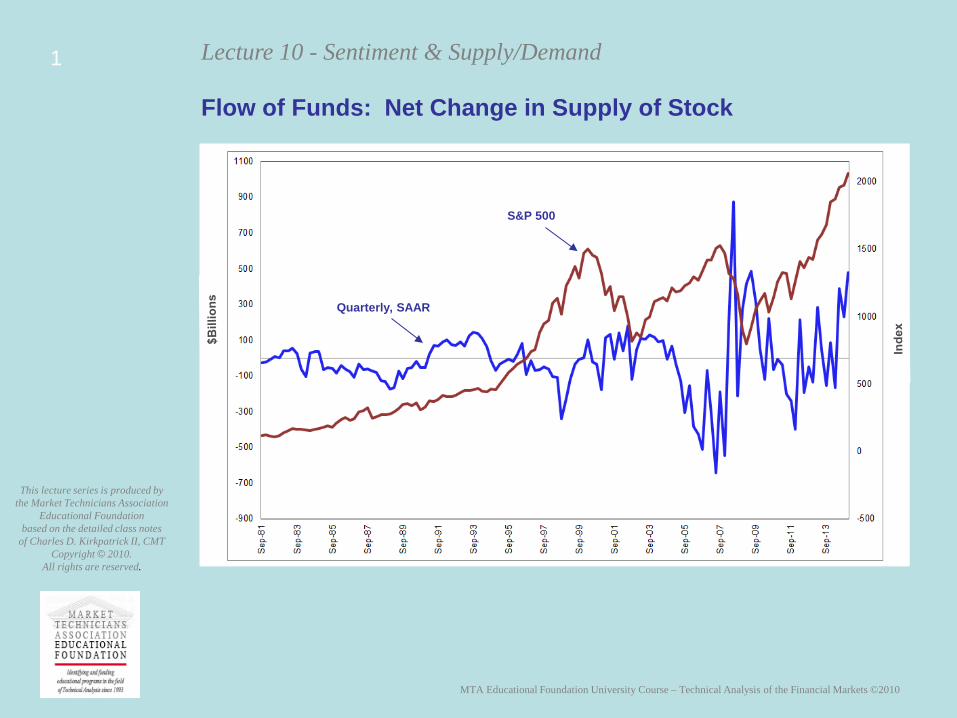
Flow of Funds: Net Change in Supply of Stock
Quarterly, SAAR
S&P 500
MTA Educational Foundation University Course – Technical Analysis of the Financial Markets ©2010
Lecture 10 - Sentiment & Supply/Demand
This lecture series is produced by the Market Technicians Association
Educational Foundation based on the detailed class notes
of Charles D. Kirkpatrick II, CMT Copyright © 2010.
All rights are reserved.
2
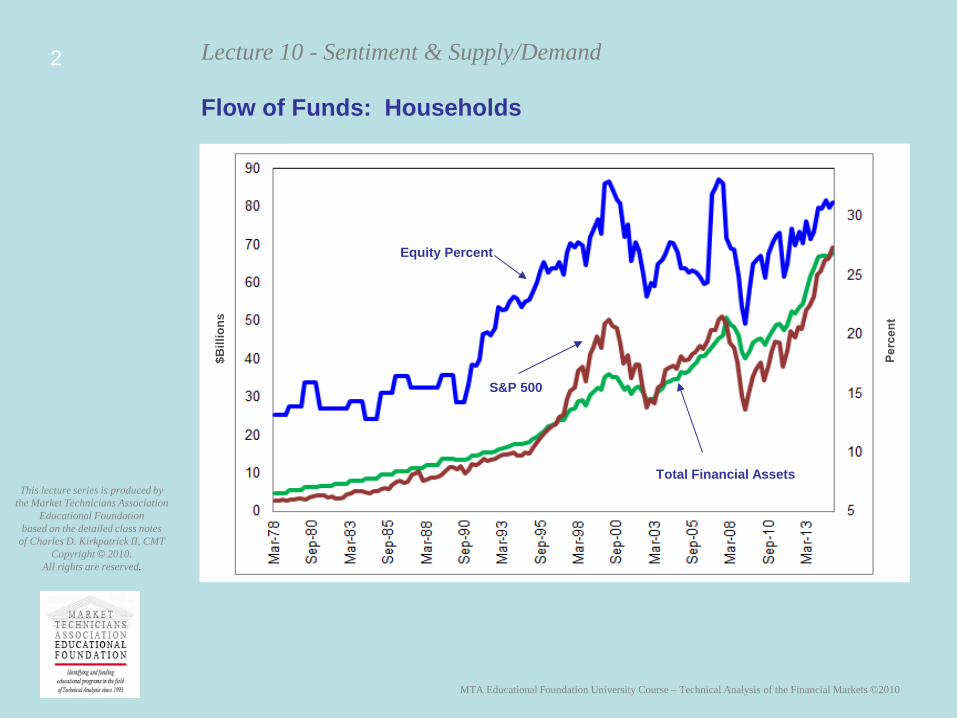
Flow of Funds: Households
Equity Percent
Total Financial Assets
S&P 500
$Bill
ions
MTA Educational Foundation University Course – Technical Analysis of the Financial Markets ©2010
Lecture 10 - Sentiment & Supply/Demand
This lecture series is produced by the Market Technicians Association
Educational Foundation based on the detailed class notes
of Charles D. Kirkpatrick II, CMT Copyright © 2010.
All rights are reserved.
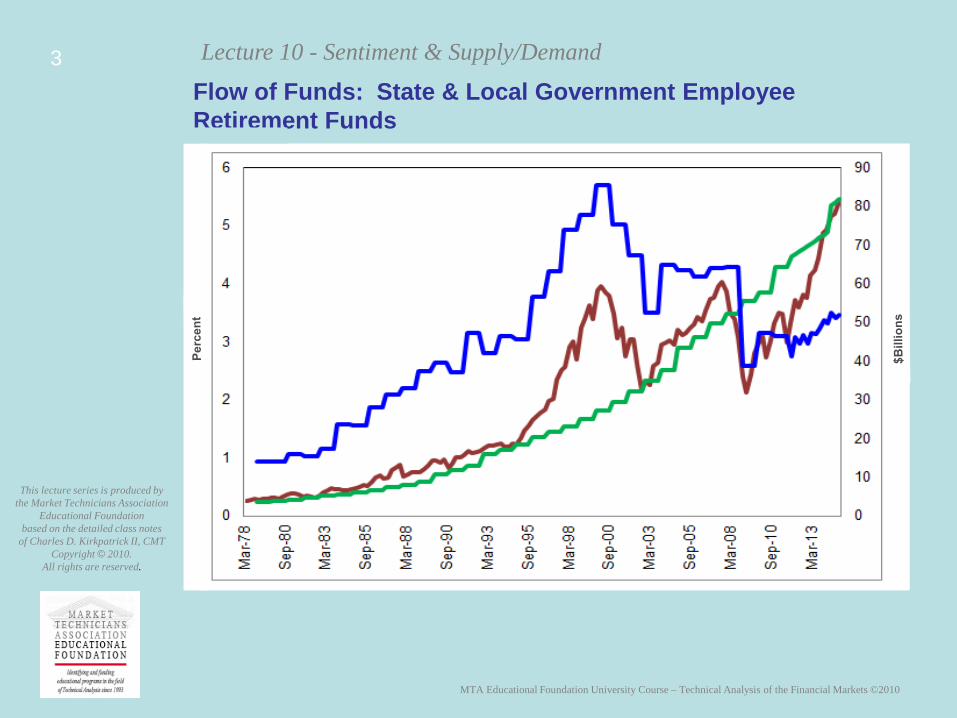
3 Flow of Funds: State & Local Government Employee Retirement Funds
S&P 500
Equity Percent
Total Financial Assets
MTA Educational Foundation University Course – Technical Analysis of the Financial Markets ©2010
Lecture 10 - Sentiment & Supply/Demand
This lecture series is produced by the Market Technicians Association
Educational Foundation based on the detailed class notes
of Charles D. Kirkpatrick II, CMT Copyright © 2010.
All rights are reserved.
4
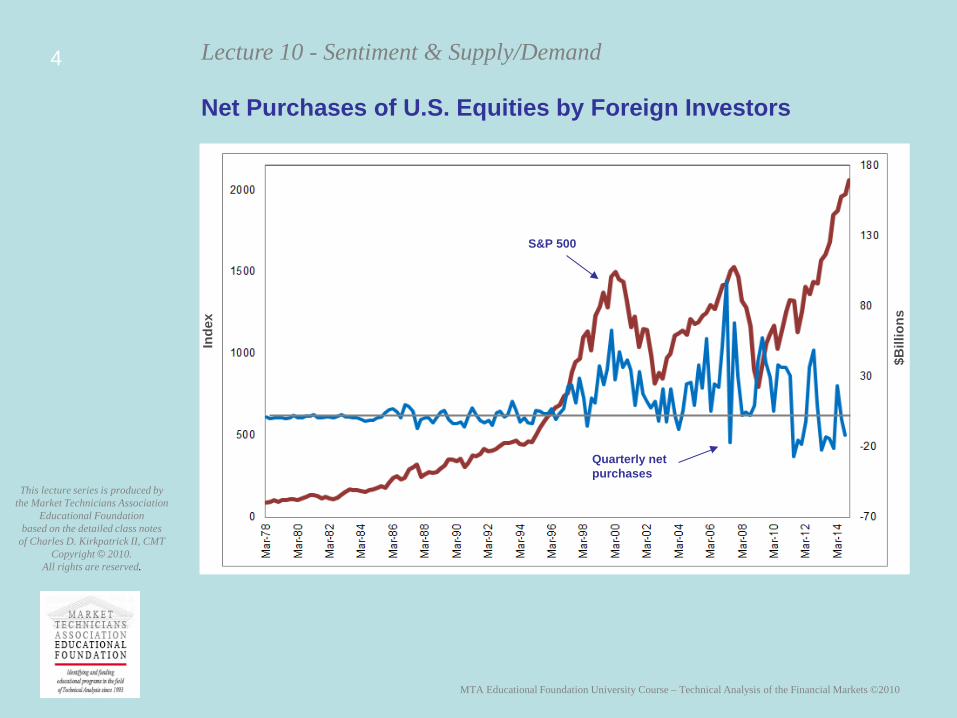
Net Purchases of U.S. Equities by Foreign Investors
$Bill
ions
Inde
x
S&P 500
Quarterly net purchases
MTA Educational Foundation University Course – Technical Analysis of the Financial Markets ©2010
Lecture 10 - Sentiment & Supply/Demand
This lecture series is produced by the Market Technicians Association
Educational Foundation based on the detailed class notes
of Charles D. Kirkpatrick II, CMT Copyright © 2010.
All rights are reserved.
5
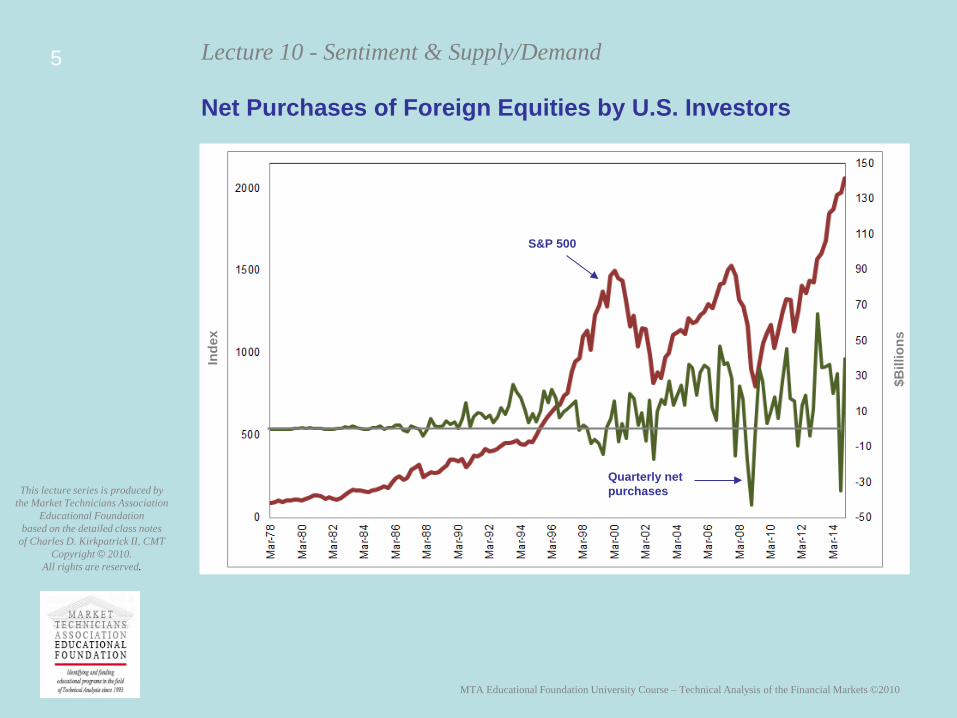
Net Purchases of Foreign Equities by U.S. Investors
$Bill
ions
Inde
x
S&P 500
Quarterly net purchases
MTA Educational Foundation University Course – Technical Analysis of the Financial Markets ©2010
Lecture 10 - Sentiment & Supply/Demand
This lecture series is produced by the Market Technicians Association
Educational Foundation based on the detailed class notes
of Charles D. Kirkpatrick II, CMT Copyright © 2010.
All rights are reserved.
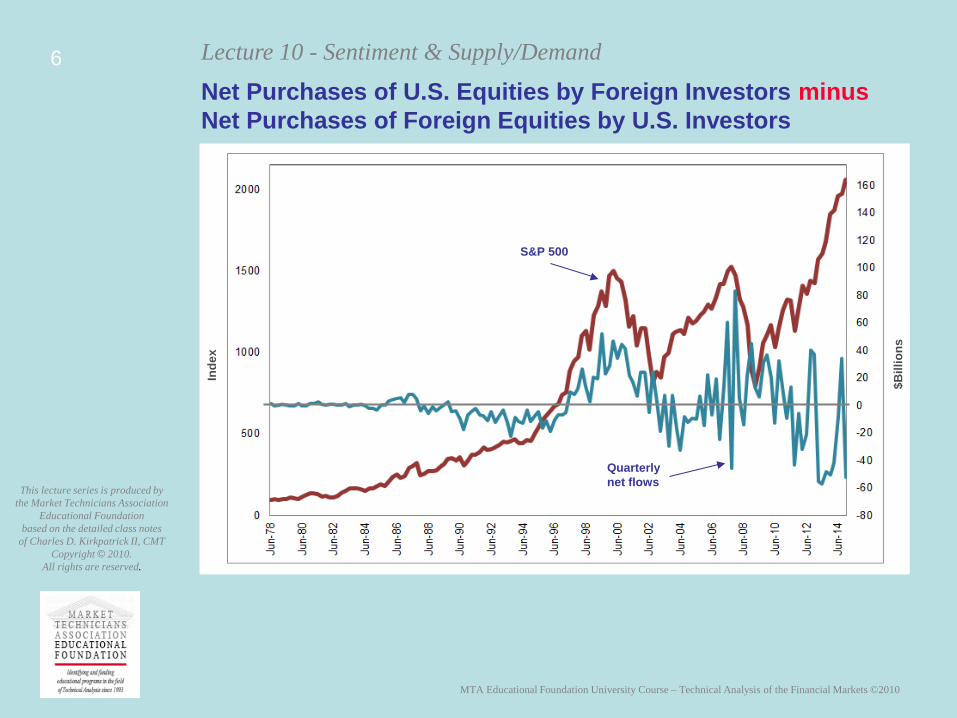
6 Net Purchases of U.S. Equities by Foreign Investors minus Net Purchases of Foreign Equities by U.S. Investors
$Bill
ions
Inde
x
S&P 500
Quarterly net flows
MTA Educational Foundation University Course – Technical Analysis of the Financial Markets ©2010
Lecture 10 - Sentiment & Supply/Demand
This lecture series is produced by the Market Technicians Association
Educational Foundation based on the detailed class notes
of Charles D. Kirkpatrick II, CMT Copyright © 2010.
All rights are reserved.
7
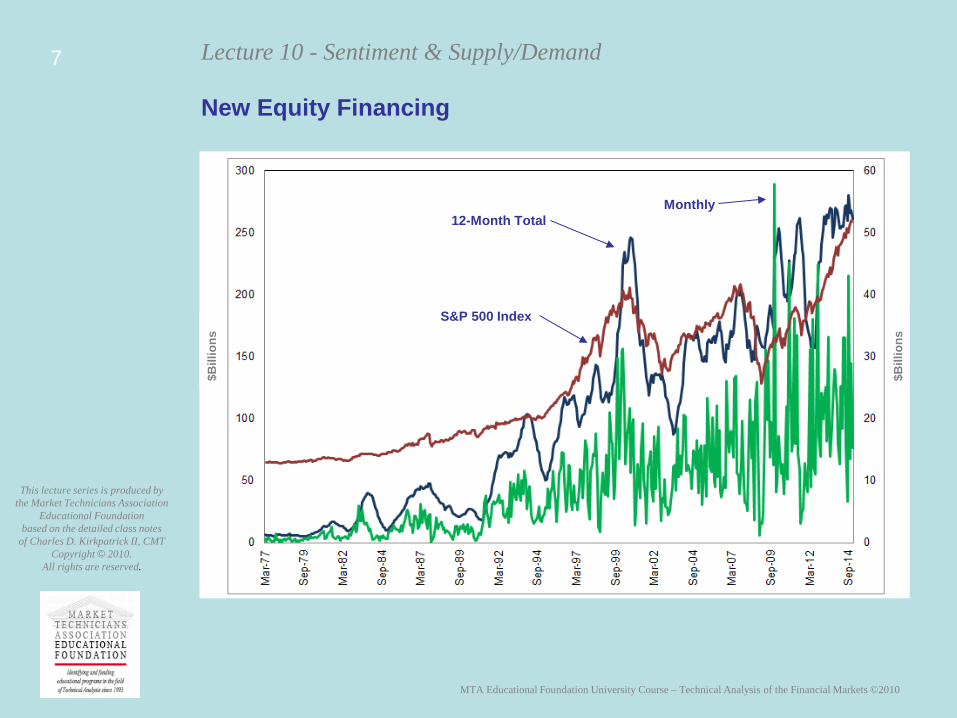
Monthly
$Bill
ions
New Equity Financing
12-Month Total $B
illio
ns
S&P 500 Index
MTA Educational Foundation University Course – Technical Analysis of the Financial Markets ©2010
Lecture 10 - Sentiment & Supply/Demand
This lecture series is produced by the Market Technicians Association
Educational Foundation based on the detailed class notes
of Charles D. Kirkpatrick II, CMT Copyright © 2010.
All rights are reserved.
8
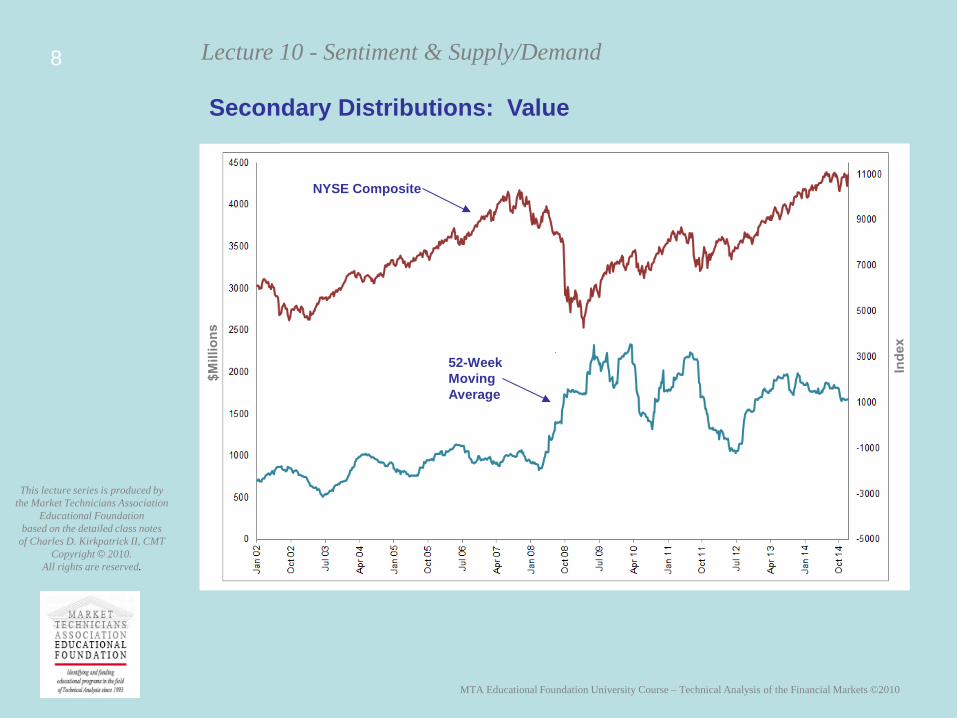
Secondary Distributions: Value
52-Week Moving Average
NYSE Composite
MTA Educational Foundation University Course – Technical Analysis of the Financial Markets ©2010
Lecture 10 - Sentiment & Supply/Demand
This lecture series is produced by the Market Technicians Association
Educational Foundation based on the detailed class notes
of Charles D. Kirkpatrick II, CMT Copyright © 2010.
All rights are reserved.
Perc
enta
ge
$Bill
ions
9
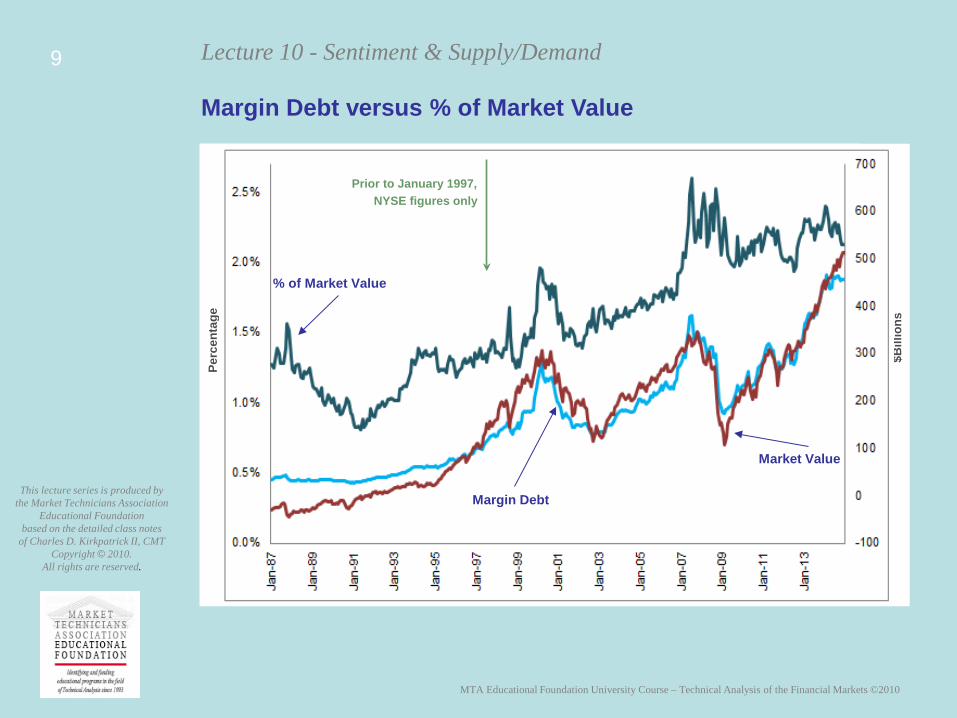
Margin Debt versus % of Market Value
% of Market Value
Margin Debt
Prior to January 1997, NYSE figures only
Market Value
MTA Educational Foundation University Course – Technical Analysis of the Financial Markets ©2010
Lecture 10 - Sentiment & Supply/Demand
This lecture series is produced by the Market Technicians Association
Educational Foundation based on the detailed class notes
of Charles D. Kirkpatrick II, CMT Copyright © 2010.
All rights are reserved.
10
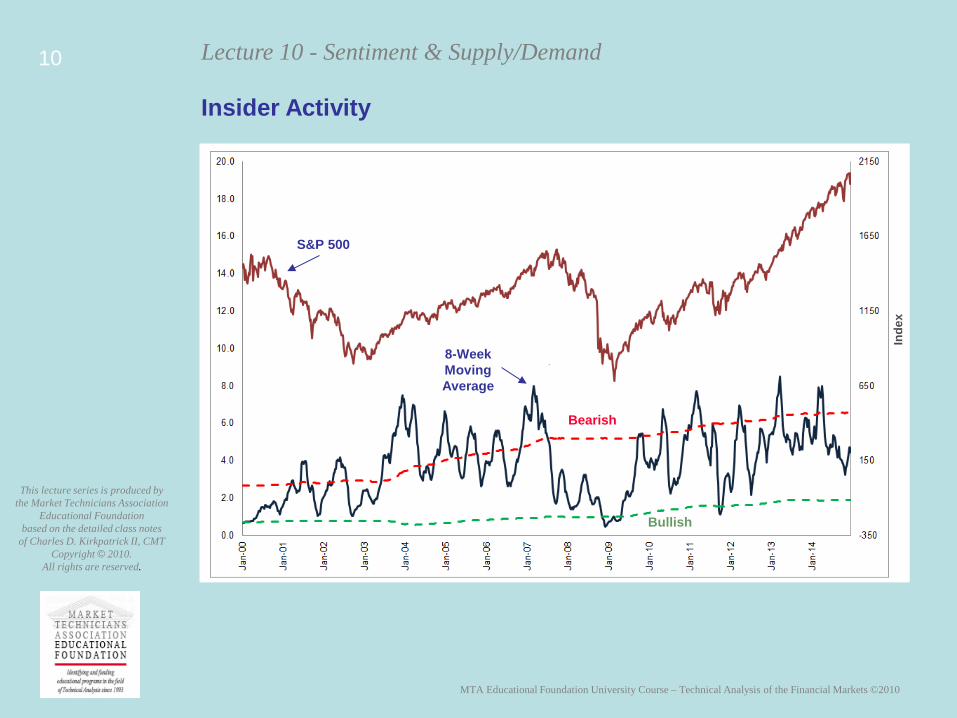
Insider Activity
Inde
x
S&P 500
Bearish
8-Week Moving Average
Bullish
MTA Educational Foundation University Course – Technical Analysis of the Financial Markets ©2010
Lecture 10 - Sentiment & Supply/Demand
This lecture series is produced by the Market Technicians Association
Educational Foundation based on the detailed class notes
of Charles D. Kirkpatrick II, CMT Copyright © 2010.
All rights are reserved.
11
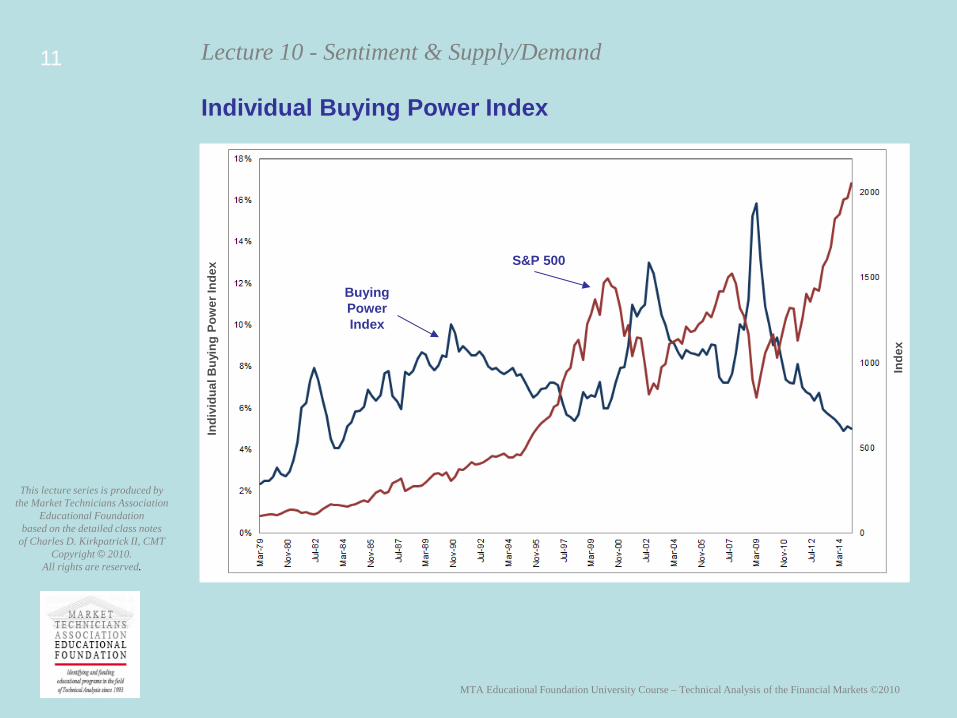
Individual Buying Power Index
Inde
x
S&P 500
Buying Power Index
Indi
vidu
al B
uyin
g Po
wer
Inde
x
MTA Educational Foundation University Course – Technical Analysis of the Financial Markets ©2010
Lecture 10 - Sentiment & Supply/Demand
This lecture series is produced by the Market Technicians Association
Educational Foundation based on the detailed class notes
of Charles D. Kirkpatrick II, CMT Copyright © 2010.
All rights are reserved.
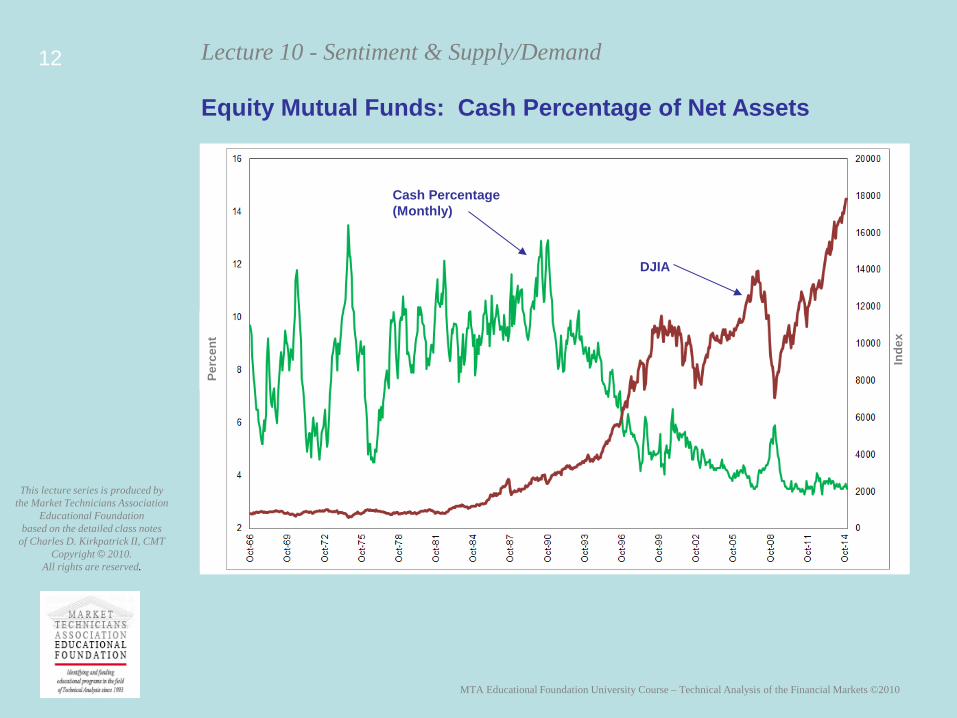
12
Equity Mutual Funds: Cash Percentage of Net Assets
Perc
ent
Inde
x
DJIA
Cash Percentage (Monthly)
MTA Educational Foundation University Course – Technical Analysis of the Financial Markets ©2010
Lecture 10 - Sentiment & Supply/Demand
This lecture series is produced by the Market Technicians Association
Educational Foundation based on the detailed class notes
of Charles D. Kirkpatrick II, CMT Copyright © 2010.
All rights are reserved.
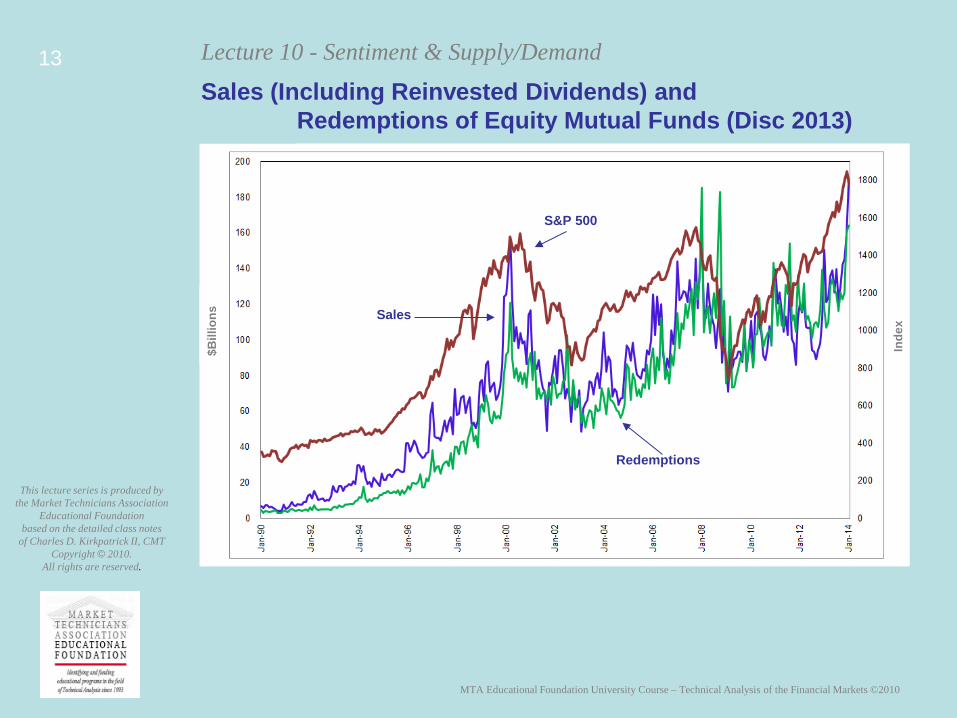
13 Sales (Including Reinvested Dividends) and Redemptions of Equity Mutual Funds (Disc 2013)
Sales
Redemptions
$Bill
ions
S&P 500
Inde
x
MTA Educational Foundation University Course – Technical Analysis of the Financial Markets ©2010
Lecture 10 - Sentiment & Supply/Demand
This lecture series is produced by the Market Technicians Association
Educational Foundation based on the detailed class notes
of Charles D. Kirkpatrick II, CMT Copyright © 2010.
All rights are reserved.
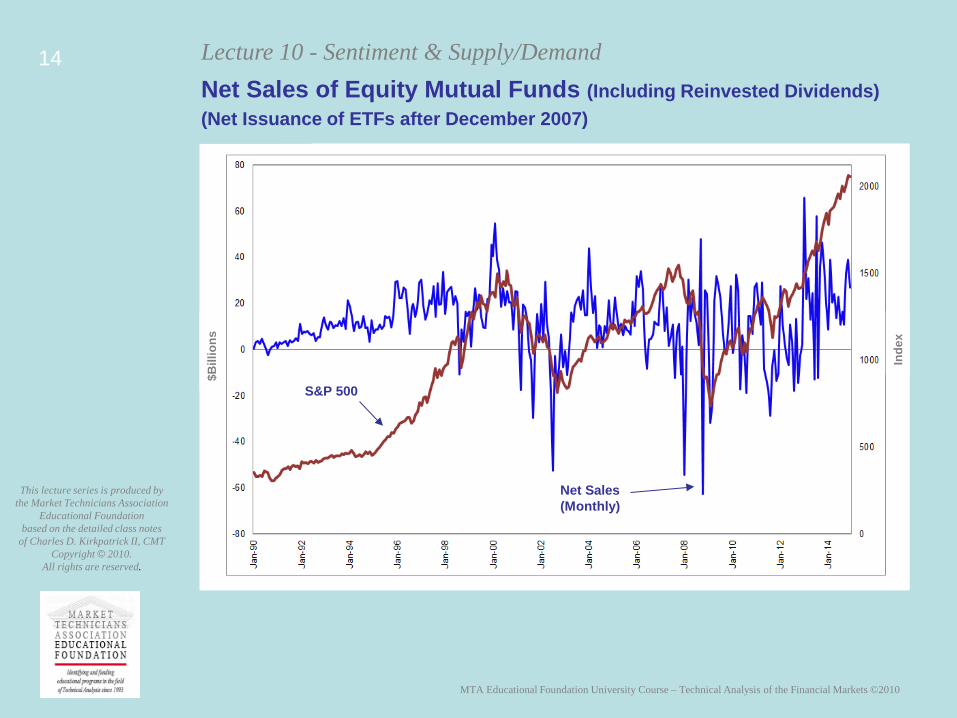
14
S&P 500
Net Sales (Monthly)
Net Sales of Equity Mutual Funds (Including Reinvested Dividends) (Net Issuance of ETFs after December 2007)
$Bill
ions
Inde
x
MTA Educational Foundation University Course – Technical Analysis of the Financial Markets ©2010
Lecture 10 - Sentiment & Supply/Demand
This lecture series is produced by the Market Technicians Association
Educational Foundation based on the detailed class notes
of Charles D. Kirkpatrick II, CMT Copyright © 2010.
All rights are reserved.
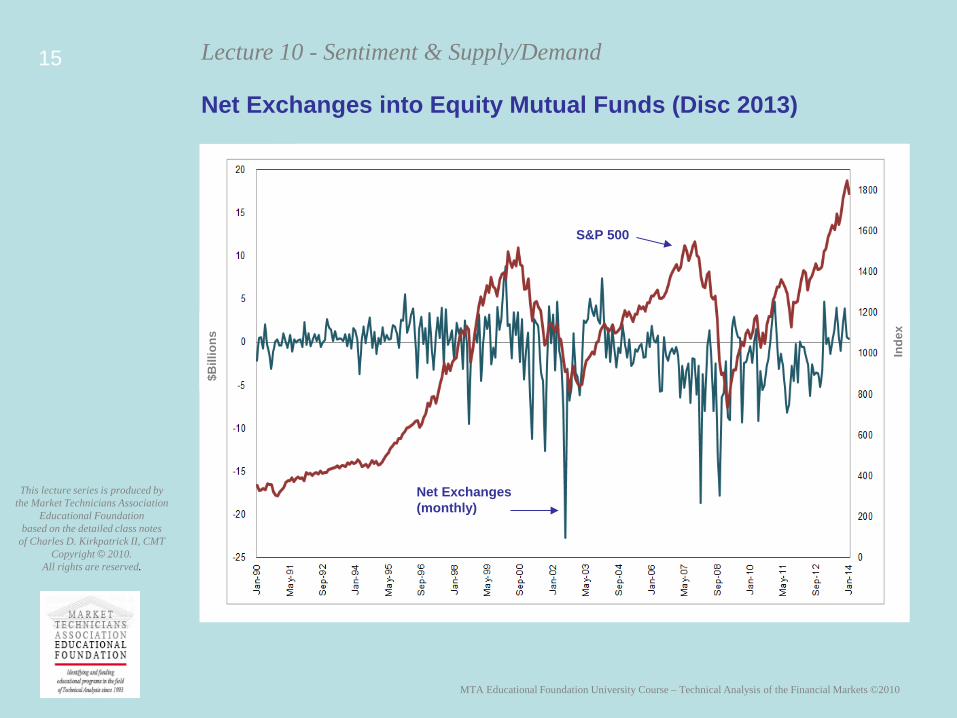
15
Net Exchanges into Equity Mutual Funds (Disc 2013)
$Bill
ions
Inde
x
Net Exchanges (monthly)
S&P 500
MTA Educational Foundation University Course – Technical Analysis of the Financial Markets ©2010
Lecture 10 - Sentiment & Supply/Demand
This lecture series is produced by the Market Technicians Association
Educational Foundation based on the detailed class notes
of Charles D. Kirkpatrick II, CMT Copyright © 2010.
All rights are reserved.
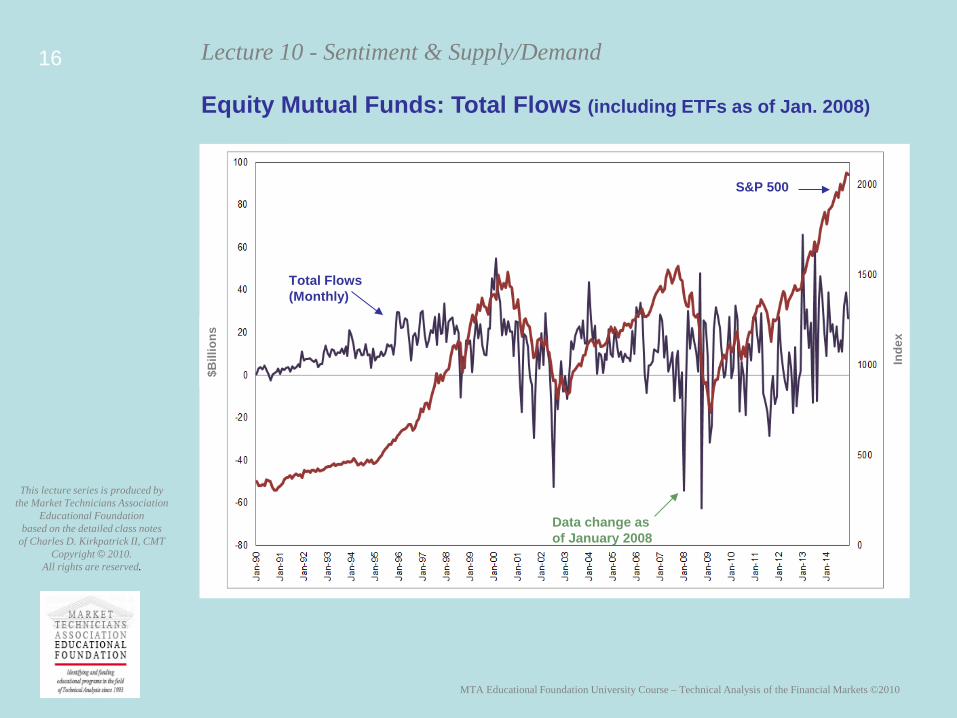
16
Equity Mutual Funds: Total Flows (including ETFs as of Jan. 2008)
$Bill
ions
Inde
x
Data change as of January 2008
Total Flows (Monthly)
S&P 500
MTA Educational Foundation University Course – Technical Analysis of the Financial Markets ©2010
Lecture 10 - Sentiment & Supply/Demand
This lecture series is produced by the Market Technicians Association
Educational Foundation based on the detailed class notes
of Charles D. Kirkpatrick II, CMT Copyright © 2010.
All rights are reserved.
Inde
x
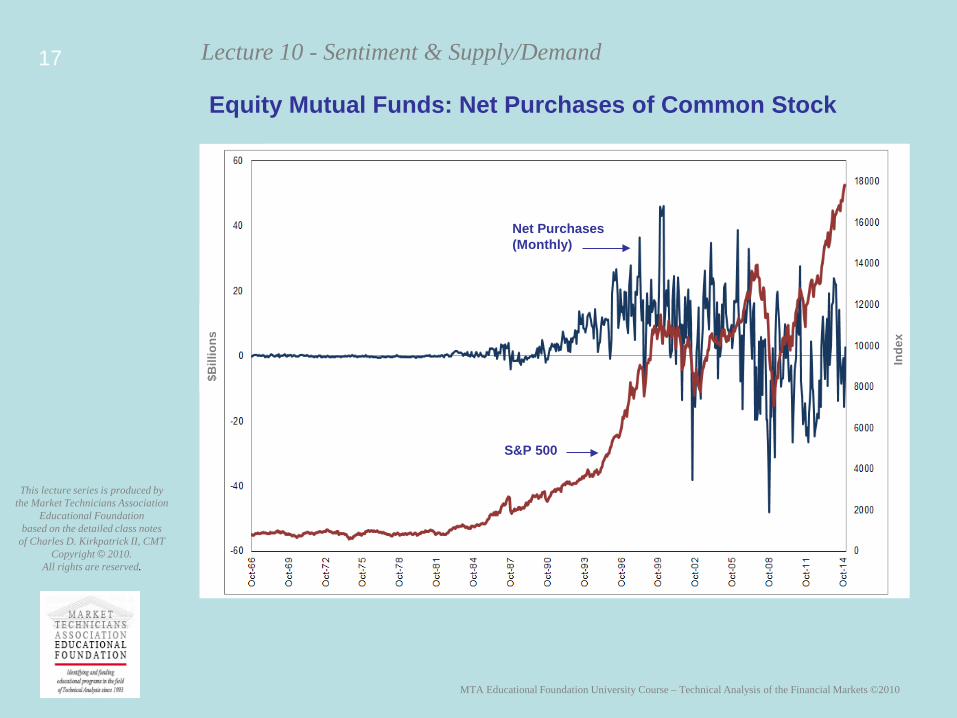
17
Equity Mutual Funds: Net Purchases of Common Stock
$Bill
ions
Net Purchases (Monthly)
S&P 500
MTA Educational Foundation University Course – Technical Analysis of the Financial Markets ©2010
Lecture 10 - Sentiment & Supply/Demand
This lecture series is produced by the Market Technicians Association
Educational Foundation based on the detailed class notes
of Charles D. Kirkpatrick II, CMT Copyright © 2010.
All rights are reserved.
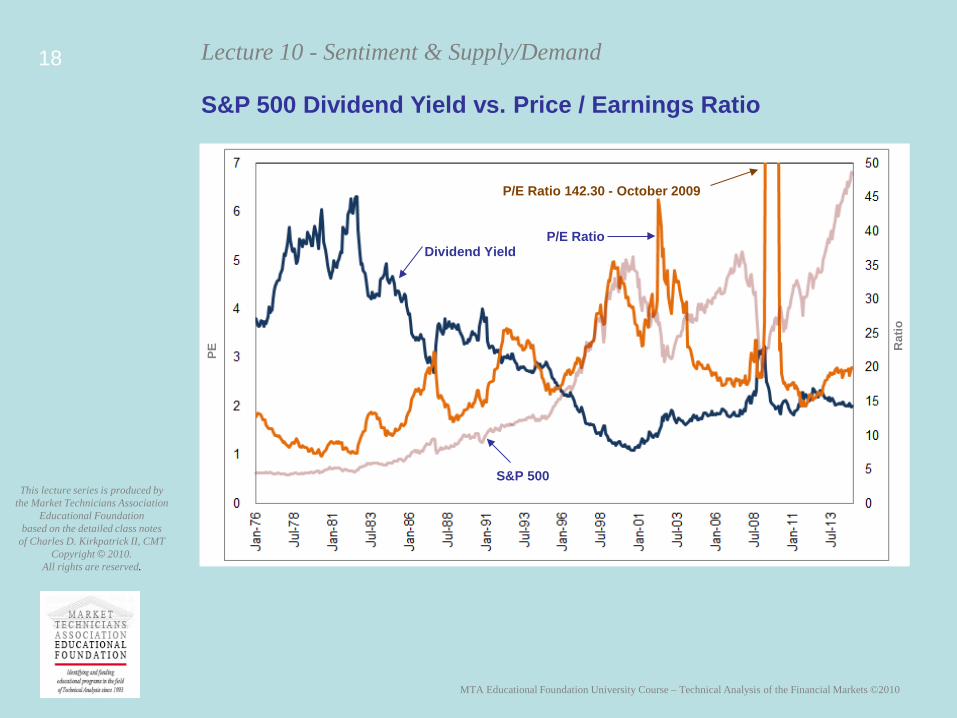
18
S&P 500 Dividend Yield vs. Price / Earnings Ratio
Dividend Yield P/E Ratio
Rat
io
PE
P/E Ratio 142.30 - October 2009
S&P 500
MTA Educational Foundation University Course – Technical Analysis of the Financial Markets ©2010
Lecture 10 - Sentiment & Supply/Demand
This lecture series is produced by the Market Technicians Association
Educational Foundation based on the detailed class notes
of Charles D. Kirkpatrick II, CMT Copyright © 2010.
All rights are reserved.
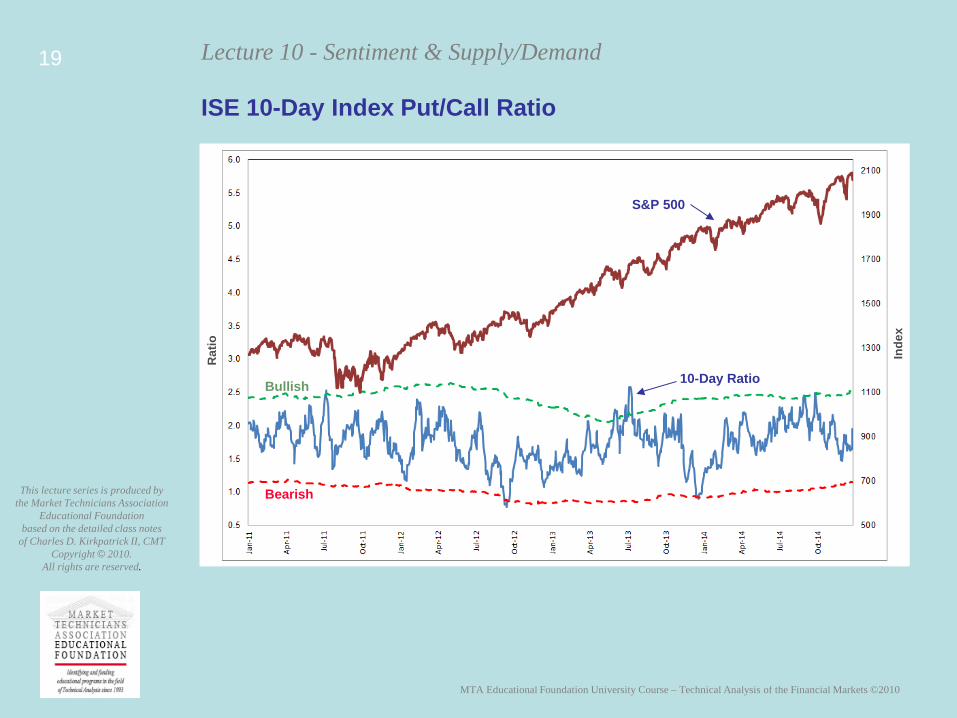
19
ISE 10-Day Index Put/Call Ratio
Inde
x
Rat
io
S&P 500
10-Day Ratio
Bearish
Bullish
MTA Educational Foundation University Course – Technical Analysis of the Financial Markets ©2010
Lecture 10 - Sentiment & Supply/Demand
This lecture series is produced by the Market Technicians Association
Educational Foundation based on the detailed class notes
of Charles D. Kirkpatrick II, CMT Copyright © 2010.
All rights are reserved.
20
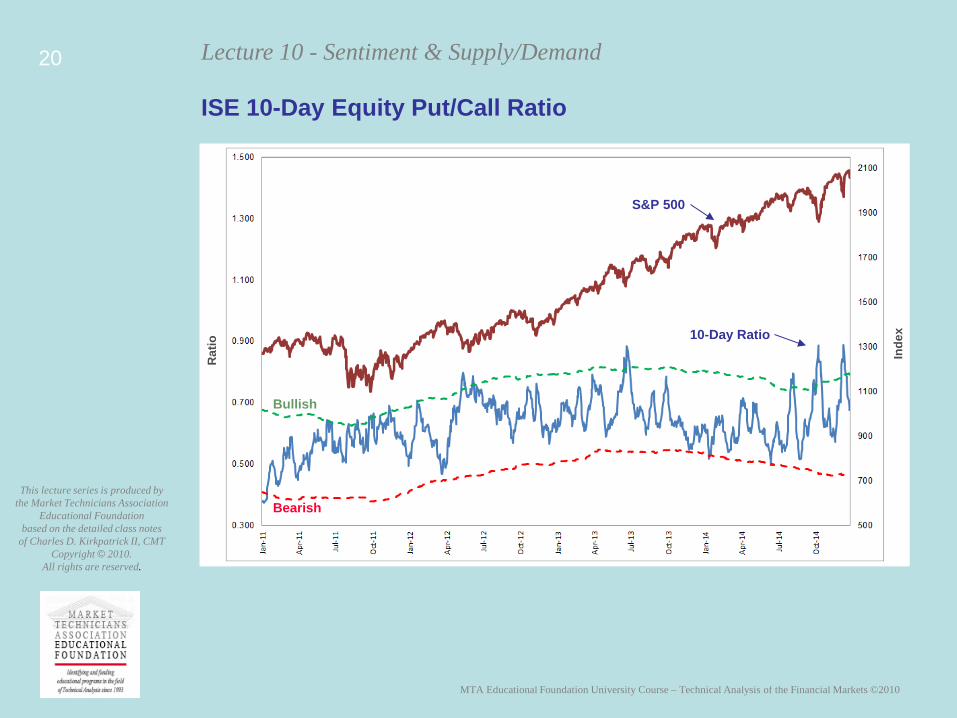
ISE 10-Day Equity Put/Call Ratio
Inde
x
Rat
io
S&P 500
10-Day Ratio
Bearish
Bullish
MTA Educational Foundation University Course – Technical Analysis of the Financial Markets ©2010
Lecture 10 - Sentiment & Supply/Demand
This lecture series is produced by the Market Technicians Association
Educational Foundation based on the detailed class notes
of Charles D. Kirkpatrick II, CMT Copyright © 2010.
All rights are reserved.
21
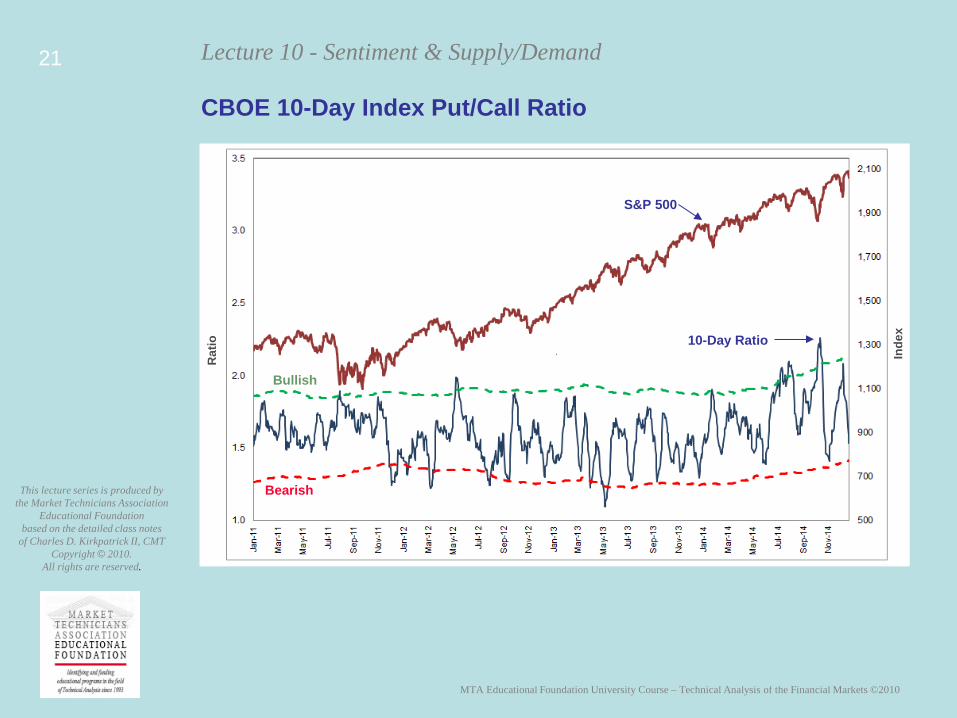
CBOE 10-Day Index Put/Call Ratio
Inde
x
Rat
io
S&P 500
10-Day Ratio
Bearish
Bullish
MTA Educational Foundation University Course – Technical Analysis of the Financial Markets ©2010
Lecture 10 - Sentiment & Supply/Demand
This lecture series is produced by the Market Technicians Association
Educational Foundation based on the detailed class notes
of Charles D. Kirkpatrick II, CMT Copyright © 2010.
All rights are reserved.
22
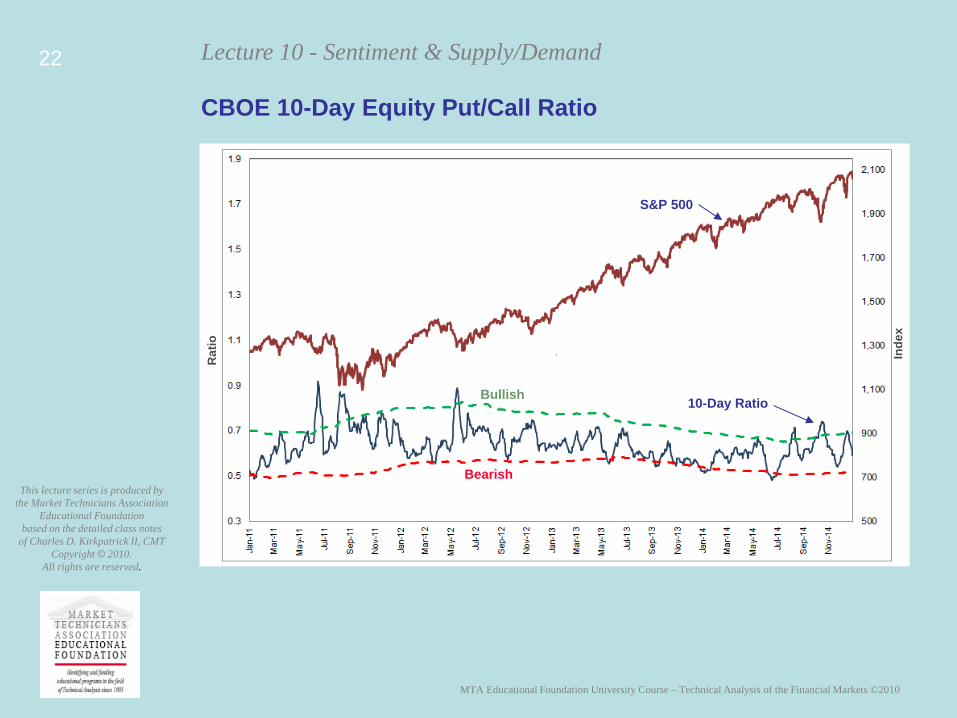
CBOE 10-Day Equity Put/Call Ratio
Inde
x
Rat
io
S&P 500
10-Day Ratio
Bearish
Bullish
MTA Educational Foundation University Course – Technical Analysis of the Financial Markets ©2010
Lecture 10 - Sentiment & Supply/Demand
This lecture series is produced by the Market Technicians Association
Educational Foundation based on the detailed class notes
of Charles D. Kirkpatrick II, CMT Copyright © 2010.
All rights are reserved.
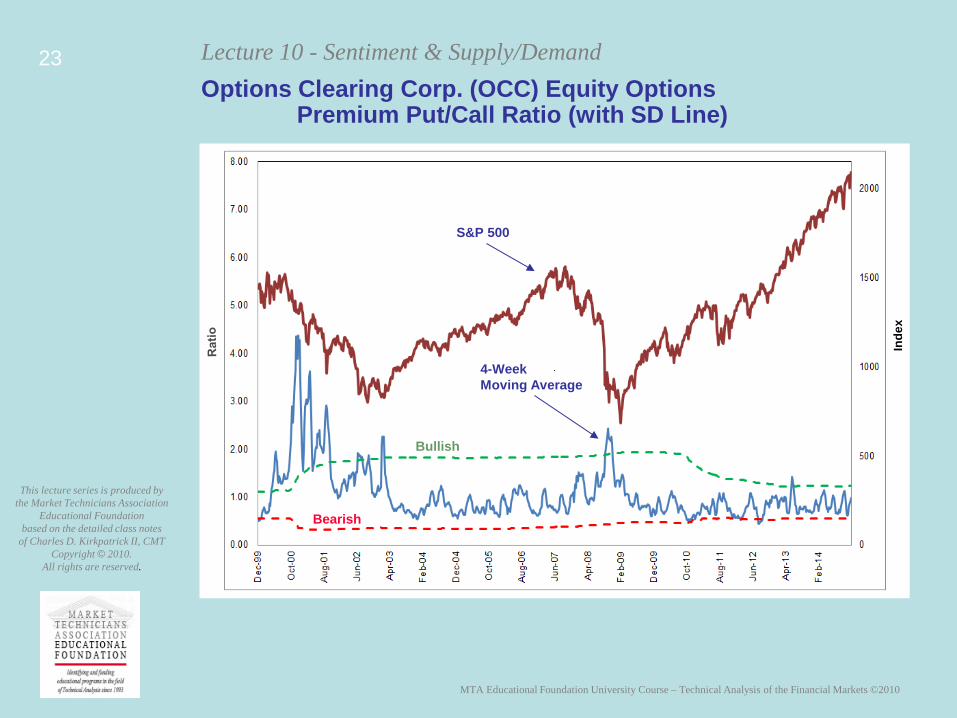
23 Options Clearing Corp. (OCC) Equity Options Premium Put/Call Ratio (with SD Line)
4-Week Moving Average
Bullish
S&P 500
Bearish
Inde
x
MTA Educational Foundation University Course – Technical Analysis of the Financial Markets ©2010
Lecture 10 - Sentiment & Supply/Demand
This lecture series is produced by the Market Technicians Association
Educational Foundation based on the detailed class notes
of Charles D. Kirkpatrick II, CMT Copyright © 2010.
All rights are reserved.
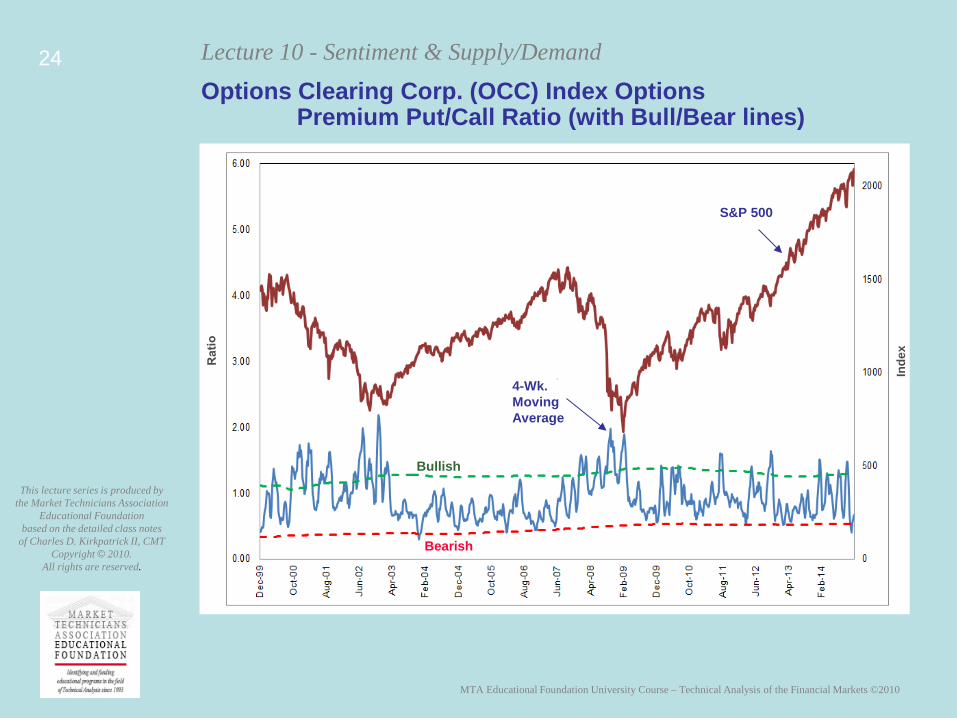
24 Options Clearing Corp. (OCC) Index Options Premium Put/Call Ratio (with Bull/Bear lines)
4-Wk. Moving Average
S&P 500
Bearish
Bullish
Inde
x
MTA Educational Foundation University Course – Technical Analysis of the Financial Markets ©2010
Lecture 10 - Sentiment & Supply/Demand
This lecture series is produced by the Market Technicians Association
Educational Foundation based on the detailed class notes
of Charles D. Kirkpatrick II, CMT Copyright © 2010.
All rights are reserved.
25
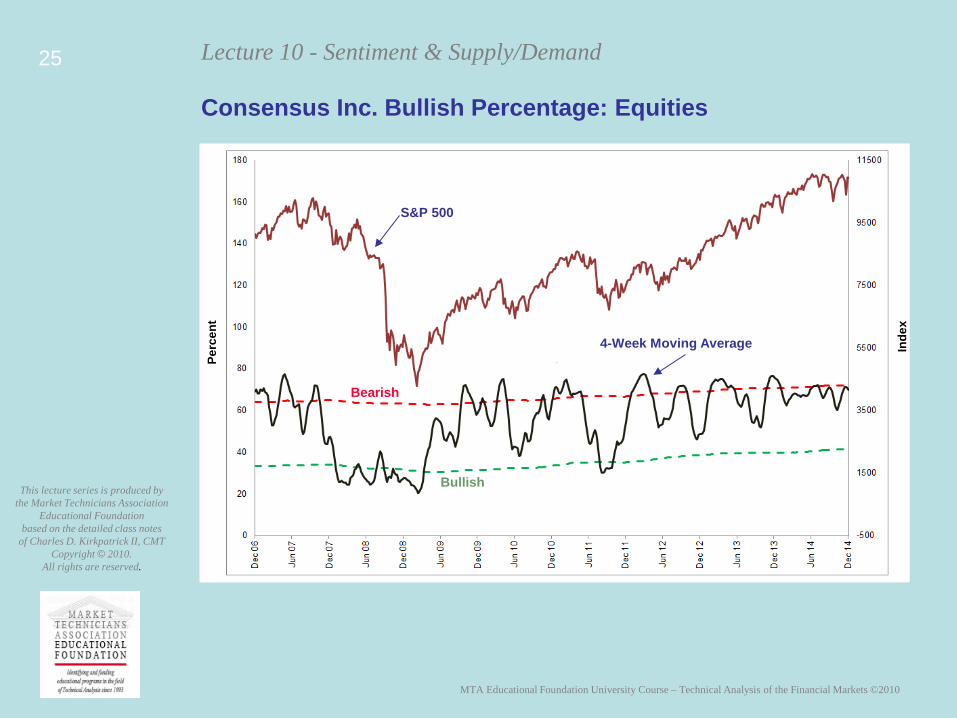
Consensus Inc. Bullish Percentage: Equities
Bearish
S&P 500
Bullish
4-Week Moving Average Inde
x
Perc
ent
MTA Educational Foundation University Course – Technical Analysis of the Financial Markets ©2010
Lecture 10 - Sentiment & Supply/Demand
This lecture series is produced by the Market Technicians Association
Educational Foundation based on the detailed class notes
of Charles D. Kirkpatrick II, CMT Copyright © 2010.
All rights are reserved.
26
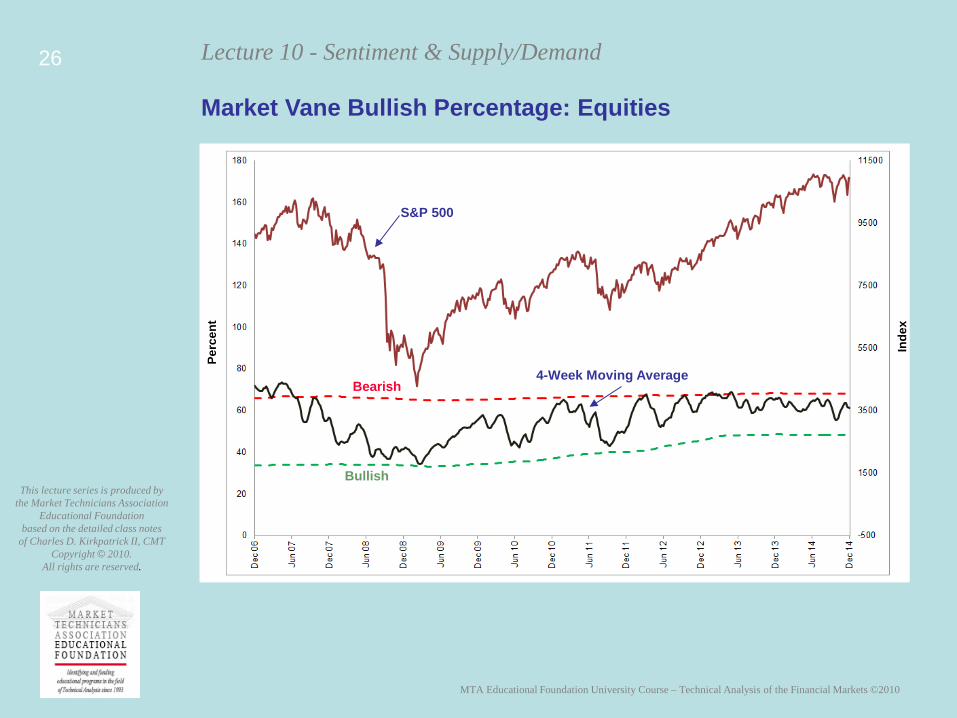
Market Vane Bullish Percentage: Equities
Bearish
S&P 500
Bullish
4-Week Moving Average
Inde
x
Perc
ent
MTA Educational Foundation University Course – Technical Analysis of the Financial Markets ©2010
Lecture 10 - Sentiment & Supply/Demand
This lecture series is produced by the Market Technicians Association
Educational Foundation based on the detailed class notes
of Charles D. Kirkpatrick II, CMT Copyright © 2010.
All rights are reserved.
27
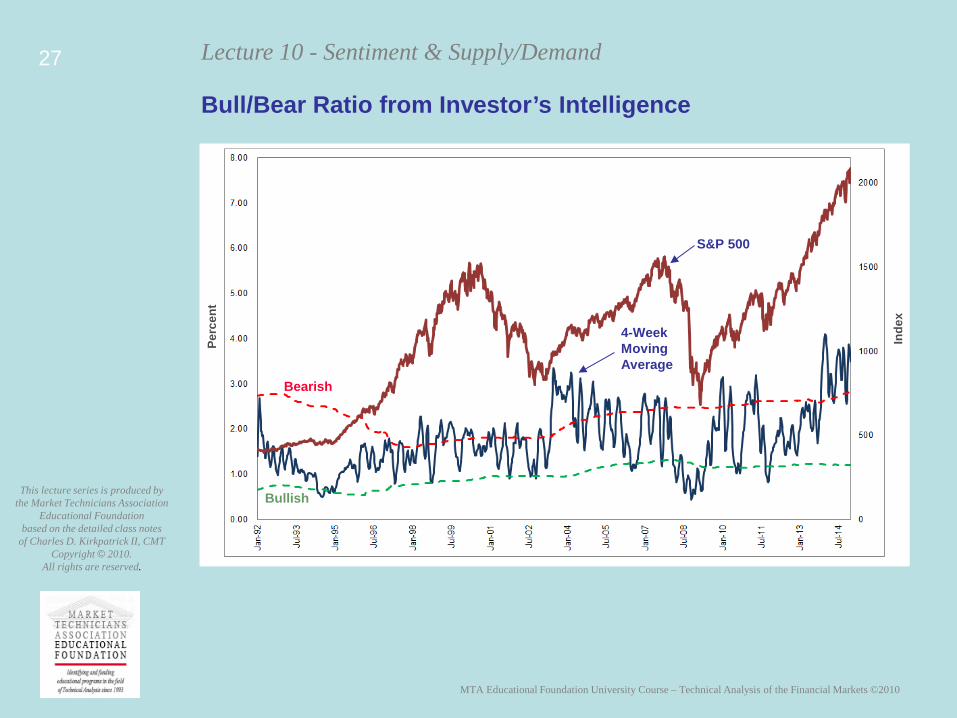
Bull/Bear Ratio from Investor’s Intelligence
Inde
x
Bearish
S&P 500
Bullish
4-Week Moving Average
Perc
ent
MTA Educational Foundation University Course – Technical Analysis of the Financial Markets ©2010
Lecture 10 - Sentiment & Supply/Demand
This lecture series is produced by the Market Technicians Association
Educational Foundation based on the detailed class notes
of Charles D. Kirkpatrick II, CMT Copyright © 2010.
All rights are reserved.
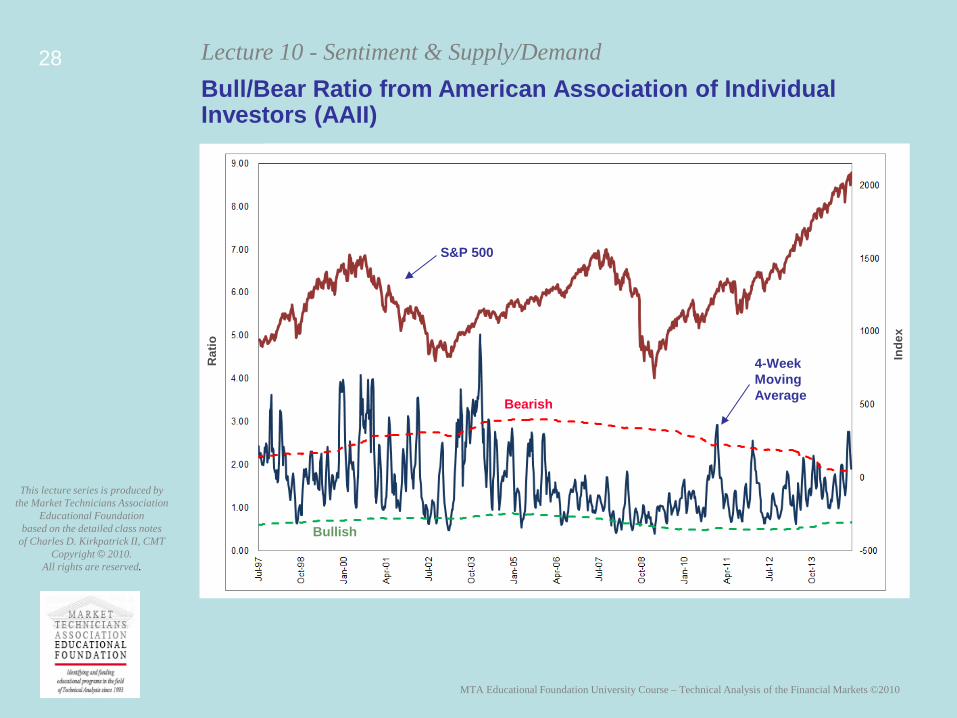
28 Bull/Bear Ratio from American Association of Individual Investors (AAII)
Inde
x
Bearish
4-Week Moving Average
Bullish
S&P 500
Rat
io
MTA Educational Foundation University Course – Technical Analysis of the Financial Markets ©2010
Lecture 10 - Sentiment & Supply/Demand
This lecture series is produced by the Market Technicians Association
Educational Foundation based on the detailed class notes
of Charles D. Kirkpatrick II, CMT Copyright © 2010.
All rights are reserved.
29
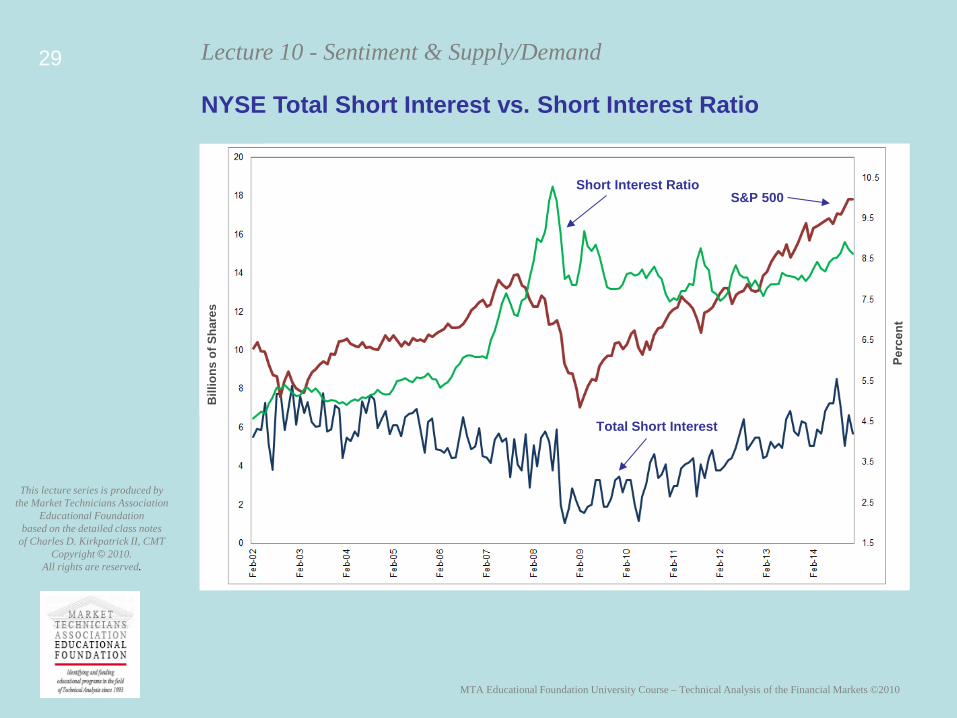
NYSE Total Short Interest vs. Short Interest Ratio
Bill
ions
of S
hare
s
Short Interest Ratio
Total Short Interest
S&P 500
MTA Educational Foundation University Course – Technical Analysis of the Financial Markets ©2010
Lecture 10 - Sentiment & Supply/Demand
This lecture series is produced by the Market Technicians Association
Educational Foundation based on the detailed class notes
of Charles D. Kirkpatrick II, CMT Copyright © 2010.
All rights are reserved.
30
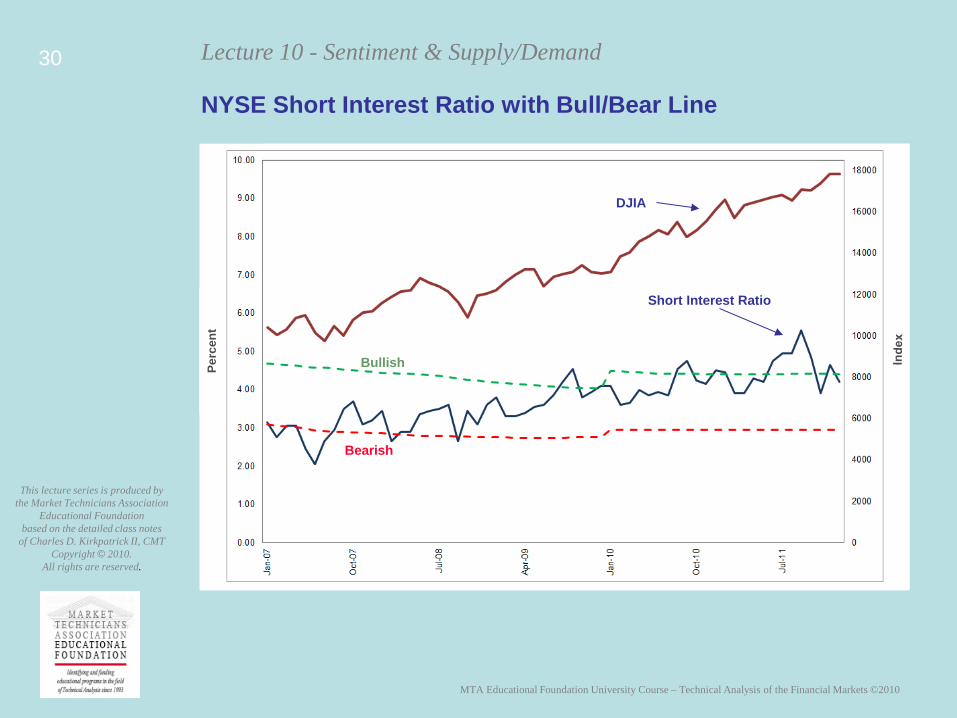
NYSE Short Interest Ratio with Bull/Bear Line
Perc
ent
Short Interest Ratio
DJIA
Bearish
Bullish