Embed Size (px)
Citation preview

Disclaimer: The information contained in this document is intended only for use during the presentation and should not be disseminated or distributed to parties outside the presentation. Phillip Securities accepts no liability whatsoever with respect to the use of this document or its contents.
Phillip Securities Pte Ltd (A member of PhillipCapital) Co. Reg. No. 197501035Z © PhillipCapital 2015. All Rights Reserved. For internal circulation only.
1
Market Strategists Kenneth Koh, Market & Equity Analyst
Soh Lin Sin, Macro | Equities Economist
SG & US Equity Analysts Richard Leow, Transport & Logistics
Dehong Tan, REITs
By Phillip Securities Research Mr. Chan Wai Chee, CEO
Mohamed Ghazali, Operations Exec
31st Aug 15, 8.15am/11.15am Morning Call/Webinar

Disclaimer: The information contained in this document is intended only for use during the presentation and should not be disseminated or distributed to parties outside the presentation. Phillip Securities accepts no liability whatsoever with respect to the use of this document or its contents.
Phillip Securities Pte Ltd (A member of PhillipCapital) Co. Reg. No. 197501035Z © PhillipCapital 2015. All Rights Reserved. For internal circulation only.
2
Disclaimer
The information contained in this presentation has been obtained from public sources which Phillip Securities Pte Ltd (“PSPL”) has no reason to
believe are unreliable and any analysis, forecasts, projections, expectations and opinions (collectively the “Research”) contained in this
presentation are based on such information and are expressions of belief only. PSPL has not verified this information and no representation or
warranty, express or implied, is made that such information or Research is accurate, complete or verified or should be relied upon as such. Any
such information or Research contained in this presentation is subject to change, and PSPL shall not have any responsibility to maintain the
information or Research made available or to supply any corrections, updates or releases in connection therewith. In no event will PSPL be
liable for any special, indirect, incidental or consequential damages which may be incurred from the use of the information or Research made
available, even if it has been advised of the possibility of such damages.
This presentation is intended for general circulation only and does not take into account the specific investment objectives, financial situation or
particular needs of any particular person.
You should seek advice from a financial adviser regarding the suitability of the investment product, taking into account your specific investment
objectives, financial situation or particular needs, before making a commitment to invest in such products.

Disclaimer: The information contained in this document is intended only for use during the presentation and should not be disseminated or distributed to parties outside the presentation. Phillip Securities accepts no liability whatsoever with respect to the use of this document or its contents.
Phillip Securities Pte Ltd (A member of PhillipCapital) Co. Reg. No. 197501035Z © PhillipCapital 2015. All Rights Reserved. For internal circulation only.
3
800 Super Holdings (BUY, TP:S$0.66, Last:S$0.47)
Trash delivers growth
2 Cents final dividend; 29.4% payout
4.3% yield, based on last close price
Sizeable contract by MHA is evidence of 800 Super's ability to deliver
quality service
South-West region Integrated Public Cleaning (IPC) contract and MHA
contract will propel revenue further in FY 2016
Biomass plant > better integration of the business and cost savings
Non-cyclical/defensive business model, resilient earnings and superior
ROE around low-twenties
Results at a glance
(SGD mn) FY15 FY14 y-y (%) Comments
Revenue 140.3 115.0 22.0 Award of new contracts and re-award of contracts at revised pricing
EBITDA 21.7 15.6 39.3
EBIT 14.6 11.1 31.6
PATMI 17.6 9.0 95.9
PATMI, adj. 12.2 9.0 35.6 Excluding S$5.4 million one-time gain from disposal of property
Source: Company, Phi l l ip Securi ties Research (Singapore)

Disclaimer: The information contained in this document is intended only for use during the presentation and should not be disseminated or distributed to parties outside the presentation. Phillip Securities accepts no liability whatsoever with respect to the use of this document or its contents.
Phillip Securities Pte Ltd (A member of PhillipCapital) Co. Reg. No. 197501035Z © PhillipCapital 2015. All Rights Reserved. For internal circulation only.
Hospitality Sector State of the Industry: STB data for 2Q15
Richard Leow
Investment Analyst
Phillip Securities Research
31 August 2015

Disclaimer: The information contained in this document is intended only for use during the presentation and should not be disseminated or distributed to parties outside the presentation. Phillip Securities accepts no liability whatsoever with respect to the use of this document or its contents.
Phillip Securities Pte Ltd (A member of PhillipCapital) Co. Reg. No. 197501035Z © PhillipCapital 2015. All Rights Reserved. For internal circulation only.
5
Snapshot for 2Q15
International visitor arrivals was flat
0.5% y-o-y decline to 3.62 million
Hotel key metrics of AOR, ARR and RevPAR were lower
Hoteliers lowered rates, due to flat visitor arrivals and over-supply of
new rooms
Strong rebound in Chinese tourist arrivals → 40% y-o-y
India has displaced Australia as the fourth largest market for 6M15
Singapore Tourism Statistics
Y/E Dec 2Q15 2Q14 y-y (%) Comments
International Vis i tor Arriva ls (mi l l ion) 3.62 3.64 (0.5)
Hotels
Average Occupancy Rate, AOR (%) 82.8 83.5 (0.7)ppt
Average Room Rate, ARR (S$) 240.80 255.30 (5.7) Hotel iers lowered rates , due to flat vis i tor
arriva ls and over-supply of new rooms
RevPAR (S$) 199.30 213.10 (6.5)
Source: Singapore Tourism Board, Phi l l ip Securi ties Research (Singapore) estimates

Disclaimer: The information contained in this document is intended only for use during the presentation and should not be disseminated or distributed to parties outside the presentation. Phillip Securities accepts no liability whatsoever with respect to the use of this document or its contents.
Phillip Securities Pte Ltd (A member of PhillipCapital) Co. Reg. No. 197501035Z © PhillipCapital 2015. All Rights Reserved. For internal circulation only.
6
Outlook
2015 international visitor arrivals likely to experience negative growth
STB forecast of 0% to 3% growth
6M15 arrivals still down 3.4% y-o-y
2H15 need to grow 3.4% y-o-y (even higher than STB's 3% forecast) in
order to have a flat year
Relatively strong SGD key impediment to visitor arrival growth
Indonesia, Malaysia and Australia negative growth; weaker domestic
currency
Hoteliers expect competitive operating environment due to weak visitor
arrivals, soft corporate demand and upcoming supply of hotel rooms
Room CAGR 5.9% to 6% next three years
c.57,000 rooms as of end 2014
c.4,300, c.3,600, c.2,400 additional in 2015, 2016, 2017 respectively

Disclaimer: The information contained in this document is intended only for use during the presentation and should not be disseminated or distributed to parties outside the presentation. Phillip Securities accepts no liability whatsoever with respect to the use of this document or its contents.
Phillip Securities Pte Ltd (A member of PhillipCapital) Co. Reg. No. 197501035Z © PhillipCapital 2015. All Rights Reserved. For internal circulation only.
7
Outlook
Hoteliers cited initiatives, attractions and events that should draw leisure
and corporate travellers
Marketing campaigns by STB
S$20 million joint campaign by SIA, STB, CAG; promote Singapore
as a leisure, business & MICE destination
Singapore Botanic Gardens → UNESCO World Heritage Site
Various sports events
OUE Singapore Open
WTA Finals
Formula 1 Grand Prix

Disclaimer: The information contained in this document is intended only for use during the presentation and should not be disseminated or distributed to parties outside the presentation. Phillip Securities accepts no liability whatsoever with respect to the use of this document or its contents.
Phillip Securities Pte Ltd (A member of PhillipCapital) Co. Reg. No. 197501035Z © PhillipCapital 2015. All Rights Reserved. For internal circulation only.
8
International Visitor Arrivals
Visitor arrivals remain subdued with seven consecutive quarters of
flat/negative y-o-y growth
Flat 0.5% decline to 3.62 million, compared to 3.64 million in 1Q15
6M15 3.4% decline to 7.26 million, compared to 7.52 million in 6M15
Top five markets remained unchanged
But India has displaced Australia as the fourth largest market
Indonesia, Malaysia and Australia continue to be bogged down by
depreciation of domestic currency
Figure 1. Singapore Visitor Arrivals: Total (million)
(10%)
(5%)
0%
5%
10%
15%
20%
0.0
1.0
2.0
3.0
4.0
5.0
2Q
12
3Q
12
4Q
12
1Q
13
2Q
13
3Q
13
4Q
13
1Q
14
2Q
14
3Q
14
4Q
14
1Q
15
2Q
15
Source: CEIC, STB, PSR %y-o-y, RHS
Top five visitor contribution by nationality (million)
Y/E Dec 2Q15 2Q14 y-y (%) 6M15 6M14 y-y (%) Comments
Indonesia 0.68 0.78 (11.8) 1.32 1.53 (13.7)
China 0.44 0.31 40.0 0.95 0.87 8.9 Strong rebound from Chinese tourists
Malaysia 0.29 0.30 (4.5) 0.56 0.59 (5.2)
Australia 0.24 0.26 (7.5) 0.49 0.53 (7.2)
India 0.32 0.29 7.9 0.52 0.49 5.7 Continued growth from India
*RoW 1.64 1.69 (2.6) 3.42 3.51 (2.4)
Total 3.62 3.64 (0.5) 7.26 7.52 (3.4)
Source: Singapore Tourism Board, Phi l l ip Securi ties Research (Singapore)
*RoW: Rest of World

Disclaimer: The information contained in this document is intended only for use during the presentation and should not be disseminated or distributed to parties outside the presentation. Phillip Securities accepts no liability whatsoever with respect to the use of this document or its contents.
Phillip Securities Pte Ltd (A member of PhillipCapital) Co. Reg. No. 197501035Z © PhillipCapital 2015. All Rights Reserved. For internal circulation only.
9
International Visitor Arrivals
Visitors from India have displaced visitors from Australia for 6M15
1Q15: Australia: 6.9%, India: 5.6% vs. 1Q14: Australia: 7.0%, India: 5.1%
2Q15: Australia: 6.6%, India: 8.7% vs. 2Q14: Australia: 7.1%, India: 8.1%
6M15: Australia: 6.8%, India: 7.2% vs. 6M14: Australia: 7.0%, India: 6.5%
Figure 2. Visitors by Nationality, 2Q15 Figure 3. Visitors by Nationality, 6M15
Indonesia18.9%
China12.2%
Malaysia8.0%
India8.7%
Australia6.6%
*RoW45.5%
Source: CEIC, STB, PSR*RoW: Rest of World
Indonesia18.1%
China13.1%
Malaysia7.7%
India7.2%
Australia6.8%
*RoW47.1%
Source: CEIC, STB, PSR*RoW: Rest of World
Figure 4. Visitor contribution by nationality, 2Q14 vs. 2Q15 Figure 5. Visitor contribution by nationality, 6M14 vs. 6M15
0% 10% 20% 30% 40% 50%
Indonesia
China
Malaysia
Australia
India
*RoW
Source: CEIC, STB, PSR*RoW: Rest of World
2Q14
2Q15
0% 10% 20% 30% 40% 50%
Indonesia
China
Malaysia
Australia
India
*RoW
Source: CEIC, STB, PSR*RoW: Rest of World
6M14
6M15

Disclaimer: The information contained in this document is intended only for use during the presentation and should not be disseminated or distributed to parties outside the presentation. Phillip Securities accepts no liability whatsoever with respect to the use of this document or its contents.
Phillip Securities Pte Ltd (A member of PhillipCapital) Co. Reg. No. 197501035Z © PhillipCapital 2015. All Rights Reserved. For internal circulation only.
10
International Visitor Arrivals
Strong rebound from Chinese tourists → 40% growth
Continued growth from Indian tourists → 7.9% growth Figure 6. Singapore Visitor Arrivals from Indonesia (million) Figure 7. Singapore Visitor Arrivals from China (million)
Figure 8. Singapore Visitor Arrivals from Malaysia (million) Figure 9. Singapore Visitor Arrivals from India (million)
Figure 10. Singapore Visitor Arrivals from Australia (million)
(20%)
(10%)
0%
10%
20%
0.0
0.2
0.4
0.6
0.8
1.0
2Q
12
3Q
12
4Q
12
1Q
13
2Q
13
3Q
13
4Q
13
1Q
14
2Q
14
3Q
14
4Q
14
1Q
15
2Q
15
Source: CEIC, STB, PSR %y-o-y, RHS
(60%)
(40%)
(20%)
0%
20%
40%
60%
0.0
0.2
0.4
0.6
0.8
2Q
12
3Q
12
4Q
12
1Q
13
2Q
13
3Q
13
4Q
13
1Q
14
2Q
14
3Q
14
4Q
14
1Q
15
2Q
15
Source: CEIC, STB, PSR %y-o-y, RHS
(10%)
(5%)
0%
5%
10%
15%
0.0
0.1
0.2
0.3
0.4
2Q
12
3Q
12
4Q
12
1Q
13
2Q
13
3Q
13
4Q
13
1Q
14
2Q
14
3Q
14
4Q
14
1Q
15
2Q
15
Source: CEIC, STB, PSR %y-o-y, RHS
(10%)
0%
10%
20%
30%
0.0
0.1
0.2
0.3
0.4
2Q
12
3Q
12
4Q
12
1Q
13
2Q
13
3Q
13
4Q
13
1Q
14
2Q
14
3Q
14
4Q
14
1Q
15
2Q
15
Source: CEIC, STB, PSR %y-o-y, RHS
(5%)
0%
5%
10%
15%
0.0
0.1
0.2
0.3
0.4
2Q
12
3Q
12
4Q
12
1Q
13
2Q
13
3Q
13
4Q
13
1Q
14
2Q
14
3Q
14
4Q
14
1Q
15
2Q
15
Source: CEIC, STB, PSR %y-o-y, RHS

Disclaimer: The information contained in this document is intended only for use during the presentation and should not be disseminated or distributed to parties outside the presentation. Phillip Securities accepts no liability whatsoever with respect to the use of this document or its contents.
Phillip Securities Pte Ltd (A member of PhillipCapital) Co. Reg. No. 197501035Z © PhillipCapital 2015. All Rights Reserved. For internal circulation only.
11
International Visitor Arrivals
Domestic currency headwinds for Indonesia, Malaysia and Australia Figure 11. Price of 1 SGD in IDR Figure 12. Price of 1 SGD in CNY
(SGD appreciated against IDR over 12 months) (SGD depreciated against CNY over 12 months)
Figure 13. Price of 1 SGD in MYR Figure 14. Price of 1 SGD in AUD
(SGD appreciated against MYR over 12 months) (SGD appreciated against AUD over 12 months)
Figure 15. Price of 1 SGD in INR
(SGD depreciated against INR over 12 months)
6,000
7,000
8,000
9,000
10,000
11,000
2012 2013 2014 2015
Source: Bloomberg, PSR
SGDIDR Curncy
SGD appreciated
4.00
4.20
4.40
4.60
4.80
5.00
5.20
5.40
2012 2013 2014 2015
Source: Bloomberg, PSR
SGDCNY Curncy
SGD depreciated
2.20
2.40
2.60
2.80
3.00
2012 2013 2014 2015
Source: Bloomberg, PSR
SGDMYR Curncy
SGD appreciated
0.60
0.70
0.80
0.90
1.00
1.10
2012 2013 2014 2015
Source: Bloomberg, PSR
SGDAUD Curncy
SGD appreciated
35
40
45
50
55
2012 2013 2014 2015
Source: Bloomberg, PSR
SGDINR Curncy
SGD depreciated

Disclaimer: The information contained in this document is intended only for use during the presentation and should not be disseminated or distributed to parties outside the presentation. Phillip Securities accepts no liability whatsoever with respect to the use of this document or its contents.
Phillip Securities Pte Ltd (A member of PhillipCapital) Co. Reg. No. 197501035Z © PhillipCapital 2015. All Rights Reserved. For internal circulation only.
12
Singapore Hotel Statistics
Average Occupancy Rate (AOR) for the quarter
was lower both y-o-y and q-o-q to 82.8%
0.7ppt lower than near-term low of 83.5%,
four quarters ago in 2Q14
Average Room Rate (ARR) sinks to lowest level
in four years
5.7% lower y-o-y to S$240.80: subdued
visitor arrivals exacerbated by over-supply
of new rooms
Revenue per Available Room (RevPAR)
6.5% lower y-o-y as a consequence of lower
AOR and ARR (contrast to flat visitor
arrivals), underlining the effect of over-
supply of rooms
Figure 16. Average Occupancy Rate (%)
Figure 17. Average Room Rate, ARR (S$)
Figure 18. Revenue Per Available Room, RevPAR (S$)
83.582.8
80
82
84
86
88
90
2Q
12
3Q
12
4Q
12
1Q
13
2Q
13
3Q
13
4Q
13
1Q
14
2Q
14
3Q
14
4Q
14
1Q
15
2Q
15
Source: CEIC, STB, PSR est.
(10%)
(5%)
0%
5%
10%
220
240
260
2802
Q1
2
3Q
12
4Q
12
1Q
13
2Q
13
3Q
13
4Q
13
1Q
14
2Q
14
3Q
14
4Q
14
1Q
15
2Q
15
Source: CEIC, STB, PSR est. %y-o-y, RHS
(10%)
(5%)
0%
5%
10%
180
200
220
240
2Q
12
3Q
12
4Q
12
1Q
13
2Q
13
3Q
13
4Q
13
1Q
14
2Q
14
3Q
14
4Q
14
1Q
15
2Q
15
Source: CEIC, STB, PSR est. %y-o-y, RHS

Disclaimer: The information contained in this document is intended only for use during the presentation and should not be disseminated or distributed to parties outside the presentation. Phillip Securities accepts no liability whatsoever with respect to the use of this document or its contents.
Phillip Securities Pte Ltd (A member of PhillipCapital) Co. Reg. No. 197501035Z © PhillipCapital 2015. All Rights Reserved. For internal circulation only.
13
Sector Outlook
Pure-play Singapore Hospitality S-REITs have under-performed within the
sub-sector
Prices have clustered in three groups, declining 0%-3%, 10%-15% or
>20%.
Ascott REIT and Saizen REIT have come out relatively unscathed despite
market-wide sell-down
OUE-HT is in the second cluster and had about 10% decline in price
Far East-HT has been the worst performer, with 21% decline in price
Figure 19. Price performance since previous quarterly update (rebased)
0.7
0.8
0.9
1.0
1.1
Jun 2015 Jul 2015 Aug 2015
Source: Bloomberg, PSR18 Jun 2015 = 1.0
Ascott REITSaizen REITOUE-HTFrasers-HTAscendas-HTCDL-HTFar East-HT
Hospitality REITs peer relative data (arranged by Mkt. Cap.)
Mkt. Cap. (S$mn) Price (S$) P/NAV (x) yield (%)
1 Ascott Residence Trust 1,883 1.220 0.89 6.3
2 CDL Hospitality Trusts 1,291 1.310 0.81 7.2
3 OUE Hospitality Trust 1,099 0.825 0.92 7.4
4 Far East Hospitality Trust 1,062 0.595 0.62 7.8
5 Frasers Hospitality Trust 998 0.735 0.87 8.3
6 Ascendas Hospitality Trust 687 0.615 0.87 8.37 Saizen REIT 231 0.815 0.71 7.2
Average 0.81 7.5
Source: Bloomberg (Updated: 27 August 2015)
Disclaimer: The information contained in this document is intended only for use during the presentation and should not be disseminated or distributed to parties outside the presentation. Phillip Securities accepts no liability whatsoever with respect to the use of this document or its contents.
Phillip Securities Pte Ltd (A member of PhillipCapital) Co. Reg. No. 197501035Z © PhillipCapital 2015. All Rights Reserved. For internal circulation only.
14
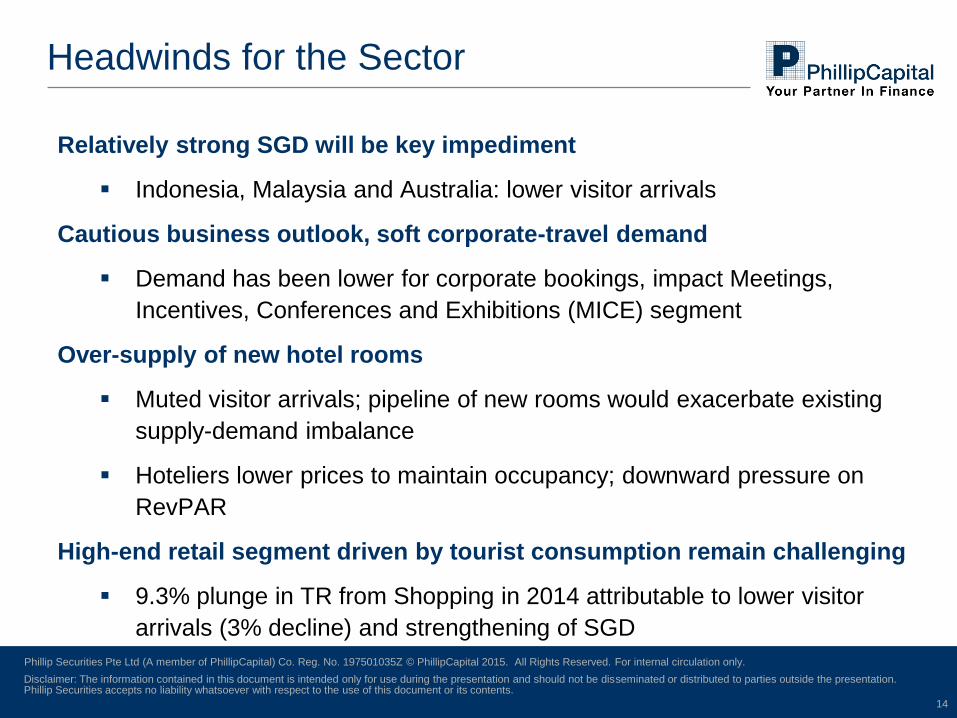
Headwinds for the Sector
Relatively strong SGD will be key impediment
Indonesia, Malaysia and Australia: lower visitor arrivals
Cautious business outlook, soft corporate-travel demand
Demand has been lower for corporate bookings, impact Meetings,
Incentives, Conferences and Exhibitions (MICE) segment
Over-supply of new hotel rooms
Muted visitor arrivals; pipeline of new rooms would exacerbate existing
supply-demand imbalance
Hoteliers lower prices to maintain occupancy; downward pressure on
RevPAR
High-end retail segment driven by tourist consumption remain challenging
9.3% plunge in TR from Shopping in 2014 attributable to lower visitor
arrivals (3% decline) and strengthening of SGD
Disclaimer: The information contained in this document is intended only for use during the presentation and should not be disseminated or distributed to parties outside the presentation. Phillip Securities accepts no liability whatsoever with respect to the use of this document or its contents.
Phillip Securities Pte Ltd (A member of PhillipCapital) Co. Reg. No. 197501035Z © PhillipCapital 2015. All Rights Reserved. For internal circulation only.
15
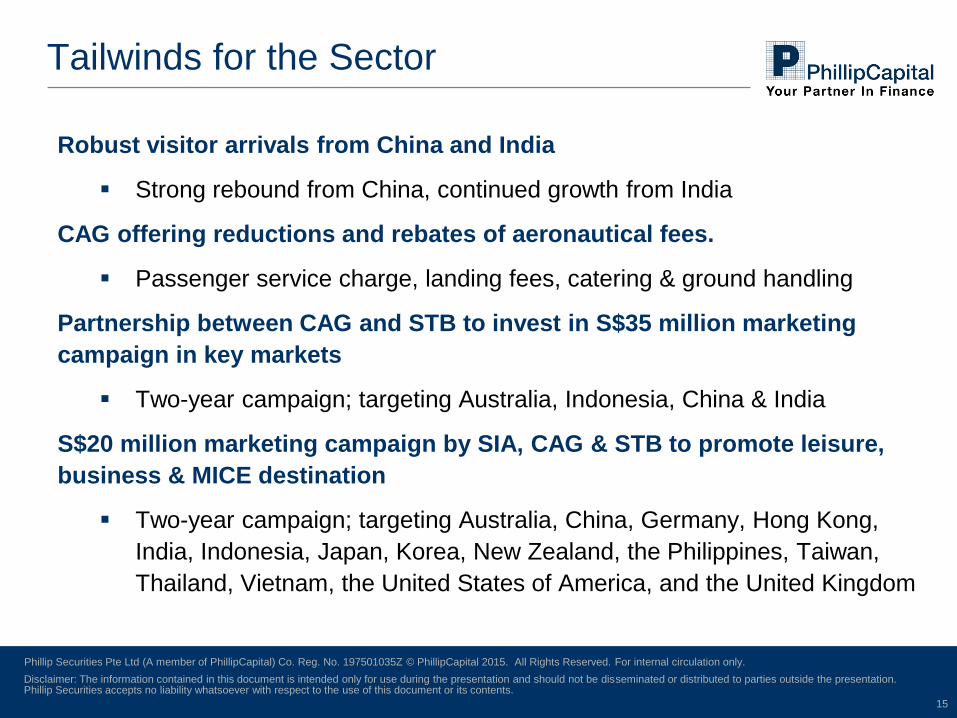
Tailwinds for the Sector
Robust visitor arrivals from China and India
Strong rebound from China, continued growth from India
CAG offering reductions and rebates of aeronautical fees.
Passenger service charge, landing fees, catering & ground handling
Partnership between CAG and STB to invest in S$35 million marketing
campaign in key markets
Two-year campaign; targeting Australia, Indonesia, China & India
S$20 million marketing campaign by SIA, CAG & STB to promote leisure,
business & MICE destination
Two-year campaign; targeting Australia, China, Germany, Hong Kong,
India, Indonesia, Japan, Korea, New Zealand, the Philippines, Taiwan,
Thailand, Vietnam, the United States of America, and the United Kingdom

Disclaimer: The information contained in this document is intended only for use during the presentation and should not be disseminated or distributed to parties outside the presentation. Phillip Securities accepts no liability whatsoever with respect to the use of this document or its contents.
Phillip Securities Pte Ltd (A member of PhillipCapital) Co. Reg. No. 197501035Z © PhillipCapital 2015. All Rights Reserved. For internal circulation only.
16
Investment Ideas
All other things being equal, expect pure-play Singapore Hospitality
REITs to under-perform peers with geographically diversified
portfolios
OUE Hospitality Trust, Far East Hospitality Trust
Favour Retail REITs with presence in heartland malls over those reliant
on Tourist Receipts from Shopping
Frasers Centrepoint Trust (Accumulate, Target Price: S$2.14, Last
close: S$1.975)
Exposure to growth in outbound Chinese tourists
Beijing Capital International Airport, HK: 694 (Accumulate, Target Price:
HK$9.23, Last close: HK$8.34)
Shanghai International Airport, SSE: 600009 (Accumulate, Target Price:
CNY29.00, Last close: CNY28.26)

Disclaimer: The information contained in this document is intended only for use during the presentation and should not be disseminated or distributed to parties outside the presentation. Phillip Securities accepts no liability whatsoever with respect to the use of this document or its contents.
Phillip Securities Pte Ltd (A member of PhillipCapital) Co. Reg. No. 197501035Z © PhillipCapital 2015. All Rights Reserved. For internal circulation only.
17
Disclaimer
The information contained in this presentation has been obtained from public sources which Phillip Securities Pte Ltd (“PSPL”) has no reason to
believe are unreliable and any analysis, forecasts, projections, expectations and opinions (collectively the “Research”) contained in this
presentation are based on such information and are expressions of belief only. PSPL has not verified this information and no representation or
warranty, express or implied, is made that such information or Research is accurate, complete or verified or should be relied upon as such. Any
such information or Research contained in this presentation is subject to change, and PSPL shall not have any responsibility to maintain the
information or Research made available or to supply any corrections, updates or releases in connection therewith. In no event will PSPL be
liable for any special, indirect, incidental or consequential damages which may be incurred from the use of the information or Research made
available, even if it has been advised of the possibility of such damages.
This presentation is intended for general circulation only and does not take into account the specific investment objectives, financial situation or
particular needs of any particular person.
You should seek advice from a financial adviser regarding the suitability of the investment product, taking into account your specific investment
objectives, financial situation or particular needs, before making a commitment to invest in such products.

Disclaimer: The information contained in this document is intended only for use during the presentation and should not be disseminated or distributed to parties outside the presentation. Phillip Securities accepts no liability whatsoever with respect to the use of this document or its contents.
Phillip Securities Pte Ltd (A member of PhillipCapital) Co. Reg. No. 197501035Z © PhillipCapital 2015. All Rights Reserved. For internal circulation only.
18
Market Strategists Kenneth Koh, Market & Equity Analyst
Soh Lin Sin, Macro | Equities Economist
SG Equity Analysts Richard Leow, Transport & Logistics
Dehong Tan, REITs
By Phillip Securities Research Mr. Chan Wai Chee, CEO
Mohamed Ghazali, Operations Exec
Ask Questions!
Archived Webinar videos can be accessed via
UniPhillip website - www.uniphillip.com
=> Education Programs
=> Phillip Securities Research Webinars