Embed Size (px)
Citation preview
RE.i-·ERENC~ ONLY
MARKETING CHANNELS OF S.MALL SCALE INDUSTRIES MANUFACTURING SELECTED FOOD PRODUCTS
IN ERNAKULAM DISTRICT
THESIS SUBMITTED TO THE UNIVERSITY OF COCHIN FOR THE AWARD OF THE DEGREE OF
DOCTOR OF PHILOSOPHY UNDER THE FACULTY OF SOCIAL SCIENCES
BY THOMAS T. THOMAS
Ui,lDER THE SUPERVISION OF
PROF. N. RANGANATHAN
SCHOOL OF MANAGEMENT STUDIES UNIVERSITY OF COCHIN
COCHIN 1994
QCertificate This is to certify that the Thesis "Marketing Channels oj Small Scale
Industries Manujacturing selected Food Products in Ernalrulam District",
submitted by Mr: Thomas T. Thomasjor the Degree ojDoctorojPhilosophy
in Social Science, is the record ojthe orginal work done by him under my
supervision and gUidance. This Thesis is worth submittingjor the Degree
oj Doctor oj Philosophy in Management.
Cochin:
Date:
4~, Prof. ~nganathan SuperVi~'"' Guide
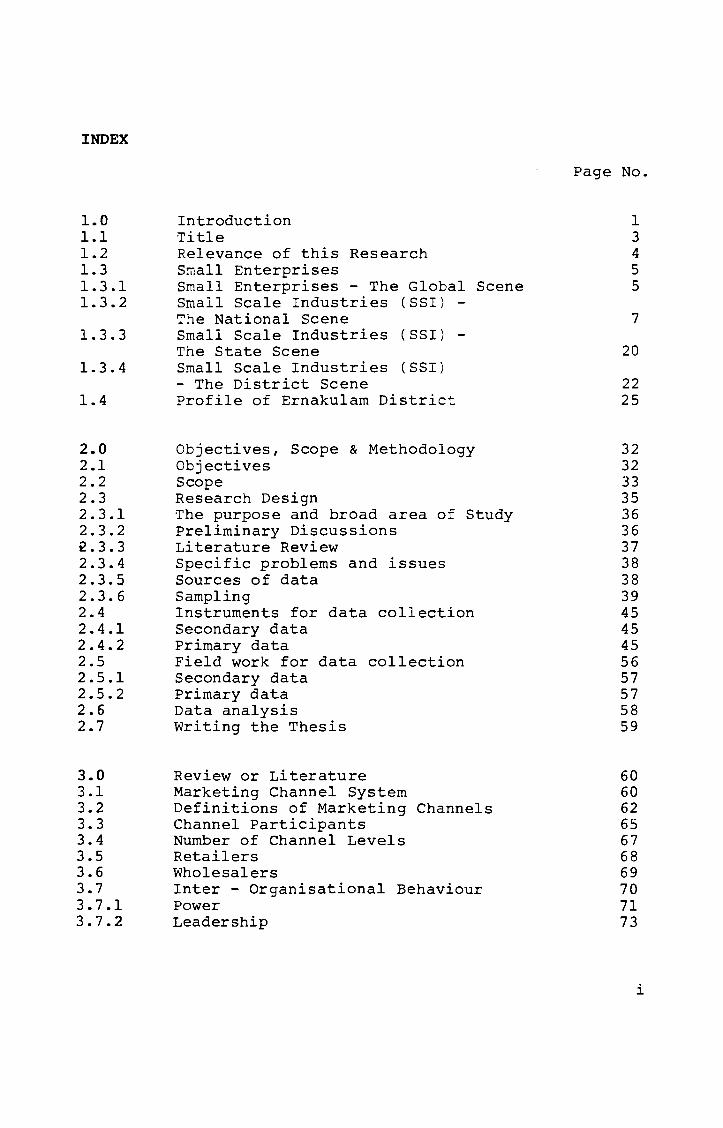
INDEX
1.0 1.1 1.2 1.3 1.3.1 1.3.2
1. 3.3
1.3.4
1.4
2.0 2.1 2.2 2.3 2.3.1 2.3.2 ~.3.3 2.3.4 2.3.5 2.3.6 2.4 2.4.1 2.4.2 2.5 2.5.1 2.5.2 2.6 2.7
3.0 3.1 3.2 3.3 3.4 3.5 3.6 3.7 3.7.1 3.7.2
Introduction Title Relevance of this Research Small Enterprises Small Enterprises - The Global Scene Small Scale Industries (SSI) -The National Scene Small Scale Industries (SSI) -The State Scene Small Scale Industries (SSI) - The District Scene Profile of Ernakulam District
Objectives, Scope & Methodology Objectives Scope Research Design The purpose and broad area of Study Preliminary Discussions Literature Review Specific problems and issues Sources of data Sampling Instruments for data collection Secondary data Primary data Field work for data collection Secondary data Primary data Data analysis Writing the Thesis
Review or Literature Marketing Channel System Definitions of Marketing Channels Channel Participants Number of Channel Levels Retailers Wholesalers Inter - Organisational Behaviour Power Leadership
Page No.
1 3 4 5 5
7
20
22 25
32 32 33 35 36 36 37 38 38 39 45 45 45 56 57 57 58 59
60 60 62 65 67 68 69 70 71 73
i
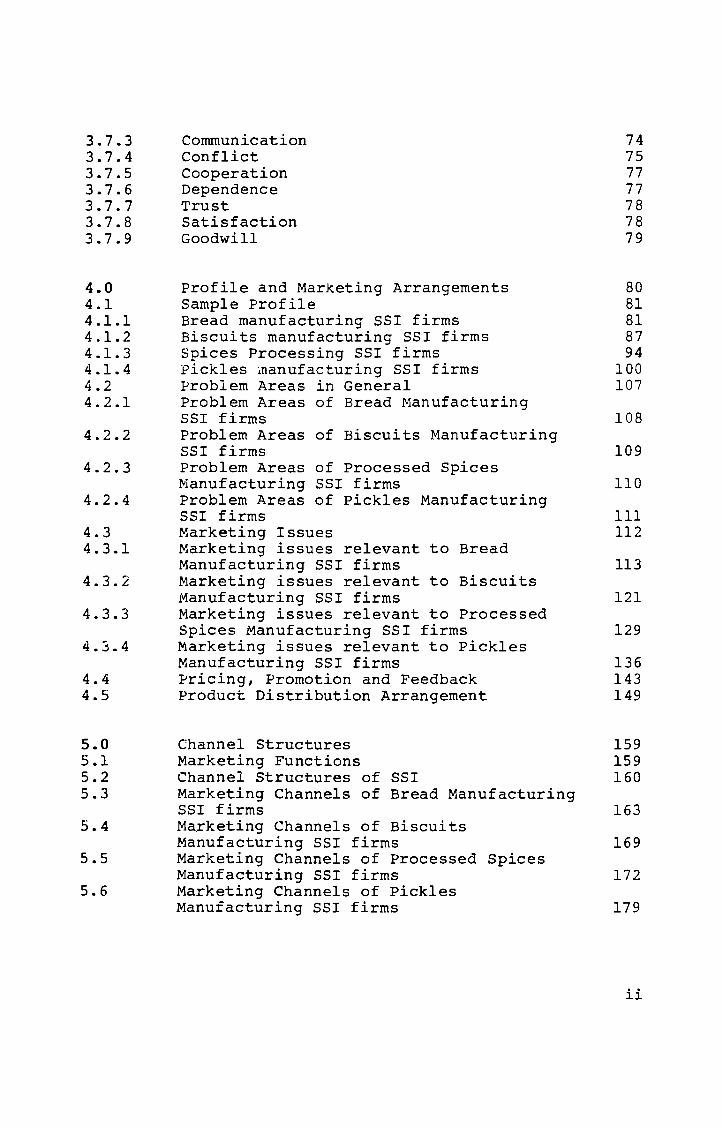
3.7.3 3.7.4 3.7.5 3.7.6 3.7.7 3.7.8 3.7.9
4.0 4.1 4.1.1 4.1.2 4.1.3 4.1.4 4.2 4.2.1
4.2.2
4.2.3
4.2.4
4.3 4.3.1
4.3.2
4.3.3
4.3.4
4.4 4.5
5.0 5.1 5.2 5.3
5.4
5.5
5.6
Communication Conflict Cooperation Dependence Trust Satisfaction Goodwill
Profile and Marketing Arrangements Sample Profile Bread manufacturing SSI firms Biscuits manufacturing SSI firms Spices Processing SSI firms Pickles manufacturing SSI firms Problem Areas in General Problem Areas of Bread Manufacturing SSI firms Problem Areas of Biscuits Manufacturing SSI firms Problem Areas of Processed Spices Manufacturing SSI firms Problem Areas of Pickles Manufacturing SSI firms Marketing Issues Marketing issues relevant to Bread Manufacturing SSI firms Marketing issues relevant to Biscuits Manufacturing SSI firms Marketing issues relevant to Processed Spices Manufacturing SSI firms Marketing issues relevant to Pickles Manufacturing SSI firms Pricing, Promotion and Feedback Product Distribution Arrangement
Channel Structures Marketing Functions Channel Structures of SSI Marketing Channels of Bread Manufacturing SSI firms Marketing Channels of Biscuits Manufacturing SSI firms Marketing Channels of Processed Spices Manufacturing SSI firms Marketing Channels of Pickles Manufacturing SSI firms
74 75 77 77 78 78 79
80 81 81 87 94
100 107
108
109
110
III 112
113
121
129
136 143 149
159 159 160
163
169
172
179
ii

6.0 6.1 6.2 6.2.1
6.2.2
6.2.3
6.2.4 6.3 6.3.1
6.3.L 6.4 6.~.1
6.5 6.6 6.6.1
6.6.2
6.6.3 6.6.4
6.6.5 6.6.6
6.6.7
6.7 6.7.1 6.7.2
7.0 7.1 7.2 7.3 7.4
Analysis and Findings Channel Relationship and Performance Power Approach l:To reward channel members for better performance Approach 2: To punish channel members for poor performance Approach 3:To guide and advice channel members on how to perform Perceived Power Bases of SSI firms Leadership Approach 4: To take the role of a leader for directing the operations of the channel members Perceived potential for leader role Communication Approach 5: To insist on regular and periodic communication about activities, problems and results Relationship Performance Approach 6: To fix sales targets for the channel members Approach 7: To limit expenses towards channel members. Approach 8: To use own distribution vehicle Approach 9:To distribute products only directly to consumers Approach 10: To use many channels together Approach 11: To select all channel members by themselves Approach 12: To assess periodically the performance of the channel members Perceived Impact of the Approaches Group One Approaches Group Two Approaches
Conclusions and Recommendations Profile Marketing Channels of Distribution Observations
ANNEXURES
185 185 187
191
194
197 199 201
202 204 205
206 208 210
210
213 215
217 219
222
225 228 229 239
248 248 251 254 259
iii

INDEX OF TABLES
1.3.A 1.3.B
1.3.C
1.3.D
1.3.E
1.3.F
1.3.G
1.3.H
1.3.I
1.3.J
2.3.A
2.3.B
4.l.A
4.l.B 4.l.C
4.l.D 4.l.E
4.l.F 4.l.G
4.l.H 4.l.I
4.l.J
4.l.K
4.l.L
Page No.
Definitions of Small Scale Industry 11 Number of Registered SSI units (All India) 15 Estimates of production of the SSI Sector as worked out by DC(SSI) with Census data (1972) as base 16 Share of Small Scale Industries in total Exports 16 Total number of units and employment of the small scale sector during seventh plan period 17 Outlays for the Central and State Plan for Small Scale Sector 17 Reservation of Items for exclusive production in Small Scale Sector 19 District wise details of SSI units registered in Kerala as on 1.3.1989 21 working Status of Small Scale units in Kerala 22 List of Product Groups (Food Products) 24
Regionwise Break-up of SSI units in Ernakulam District (Selected product groups included in this research) 43 Sample size providing for sample loss 44
Investments in Fixed Assets and Working Capital of Bread manufacturing SSI units 82 Employment in Bread manufacturing Units 83 Sales Turnover of Bread manufacturing SSI units during 1989-1991 84 Sales Area and Volume (Bread) 87 Investment in Fixed Assets and Working Capital of Biscuits manufacturing SSI units 88 Employment in Biscuits manufacturing units 89 Sales Turnover of Biscuits manufacturing units during 1989-1991 90 Sales Area and Volume (Biscuits) 93 Investment in Fixed Assets and working capital of processed Spices manufacturing units 95 Employment in processed spices manufacturing units 95 Sales Turnover of Spices processing firms during 1989-1991 96 Sales Area and Volume (processed Spices) 99
iv
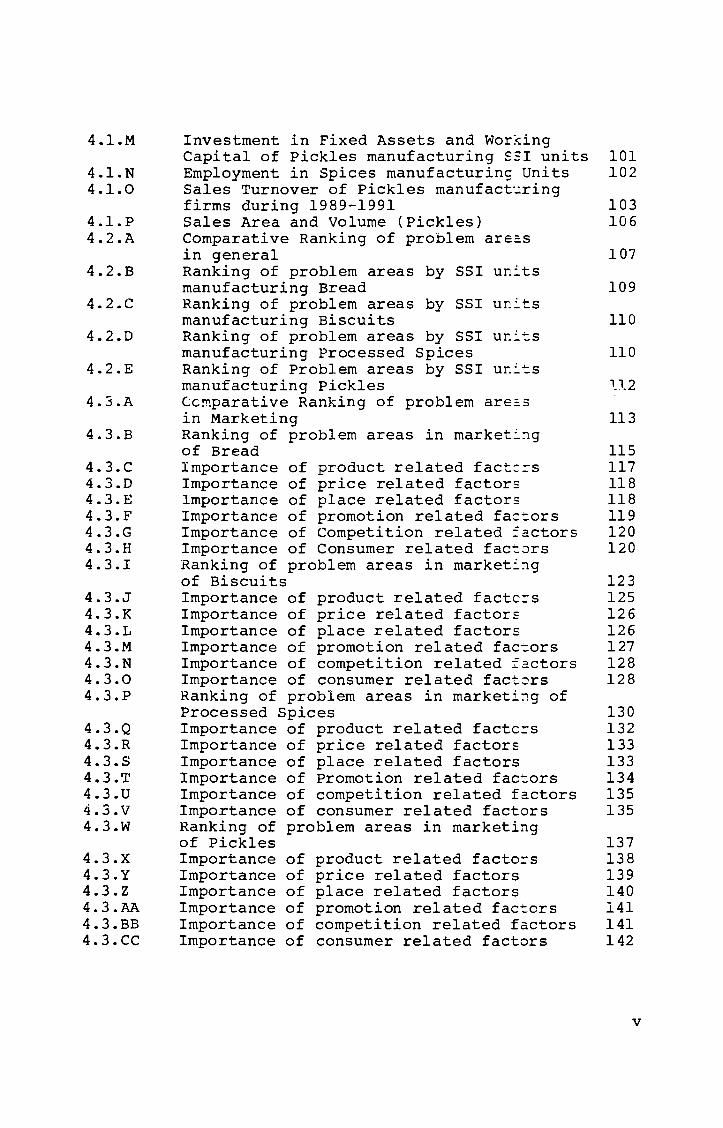
4.l.M
4.l.N 4.1.0
4.l.P 4.2.A
4.2.B
4.2.C
4.2.D
4.2.E
4.3.A
4.3.B
4.3.C 4.3.D 4.3.E 4.3.F 4.3.G 4.3.H 4.3.1
4.3.J 4.3.K 4.3.L 4.3.M 4.3.N 4.3.0 4.3.P
4.3.Q 4.3.R 4.3.5 4.3.'1' 4.3.U 4.3.V 4.3.W
4.3.X 4.3.Y 4.3.Z 4.3.AA 4.3.BB 4.3.CC
Investment in Fixed Assets and Wor~ing Capital of Pickles manufacturing S5I units Employment in Spices manufacturins Units Sales Turnover of Pickles manufact~ring firms during 1989-1991 Sales Area and Volume (Pickles) Comparative Ranking of problem ar€~s in general Ranking of problem areas by SSI un~ts manufacturing Bread Ranking of problem areas by SSI un~ts manufacturing Biscuits Ranking of problem areas by SSI ur-~~s manufacturing Processed Spices Ranking of Problem areas by SSI ur-~~s manufacturing Pickles ccmparative Ranking of problem are~5 in Marketing Ranking of problem areas in market~~g of Bread Importance of product related fact:=s Importance of price related factor: Importance of place related factor: Importance of promotion related fac~ors Importance of Competition related factors Importance of Consumer related fac~~rs Ranking of problem areas in market~~g of Biscuits Importance of product related factc=s Importance of price related factors Importance of place related factors Importance of promotion related fac~ors Importance of competition related factors Importance of consumer related fact~rs Ranking of problem areas in marketi~g of Processed Spices Importance of product related factc=s Importance of price related factors Importance of place related factors Importance of Promotion related fac~ors Importance of competition related factors Importance of consumer related factors Ranking of problem areas in marketing of Pickles Importance of product related facto=s Importance of price related factors Importance of place related factors Importance of promotion related fac~ors Importance of competition related factors Importance of consumer related factors
101 102
103 106
107
109
110
110
113
115 117 118 118 119 120 120
123 125 126 126 127 128 128
130 132 133 133 134 135 135
137 138 139 140 141 141 142
v
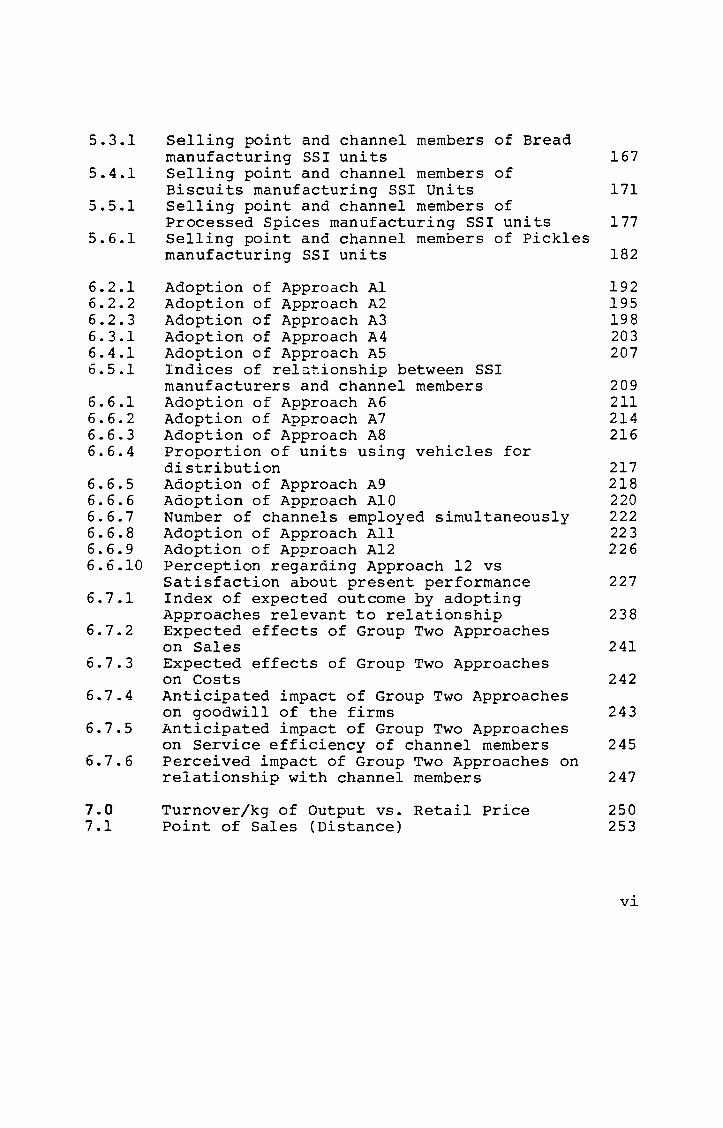
5.3.1
5.4.1
5.5.1
5.6.1
6.2.1 6.2.2 6.2.3 6.3.1 6.4.1 6.5.1
6.6.1 6.6.2 6.6.3 6.6.4
6.6.5 6.6.6 6.6.7 6.6.8 6.6.9 6.6.10
6.7.1
6.7.2
6.7.3
6.7.4
6.7.5
6.7.6
7.0 7.1
Selling point and channel members of Bread manufacturing SSI units Selling point and channel members of Biscuits manufacturing SSI Units Selling point and channel members of Processed Spices manufacturing SSI units Selling point and channel members of Pickles manufacturing SSI units
Adoption of Approach Al Adoption of Approach A2 Adoption of Approach A3 Adoption of Approach A4 Adoption of Approach A5 Indices of rel~tionship between SSI manufacturers and channel members Adoption of Approach A6 Adoption of Approach A7 Adoption of Approach A8 Proportion of units using vehicles for distribution Adoption of Approach A9 Adoption of Approach Ala Number of channels employed simultaneously Adoption of Approach All Adoption of Approach A12 Perception regarding Approach 12 vs Satisfaction about present performance Index of expected outcome by adopting Approaches relevant to relationship Expected effects of Group Two Approaches on Sales Expected effects of Group Two Approaches on Costs Anticipated impact of Group Two Approaches on goodwill of the firms Anticipated impact of Group Two Approaches on Service efficiency of channel members Perceived impact of Group Two Approaches on relationship with channel members
Turnover/kg of Output vs. Retail Price Point of Sales (Distance)
167
171
177
182
192 195 198 203 207
209 211 214 216
217 218 220 222 223 226
227
238
241
242
243
245
247
250 253
vi
INDEX OF FIGURES
Page No.
The performance of Marketing Functions Bread Biscuits
5.1.1 5.3.1 5.4.1 5.5.1 5.6.1 7.1
Channels of Distribution -Channels of Distribution Channels of Distribution Channels of Distribution
- Processed Spices
161 168 173 178 184 268
- Pickles A model of SSI Operations
vii

CHAPTER 1
1.0 INTRODUCTION
Predominantly an agrarian nation, India has over the years
taken major strides towards industrialisation. Indian
economic planning has been laying stress on the development
of the industrial sector, and the infrastructural
facilities required for the same. Post Independence period
has seen great enthusiasm and activity in the promotion of
large, medium and small scale sectors.
The experience gained over the years had caused drastic
shifts in policy pertaining to the definition, promotion,
implementation and monitoring of these sectors. The growth
of large and medium scale industries led to the development
of certain geographical pockets, which inhibited a balanced
regional growth. It was observed that some of the states of
the country lagged much behind some others in terms of
industrial growth and resultant prosperity.
1

It was at this juncture that the advantages of promoting
small scale industries on a wider perspective was realised.
The inherent benefits of lower capital outlay per
employment generated, lack of location specificity
especially an urban proximity and the potential to mobilise
resources and human skills from every part of the country,
enhanced the attractiveness and acceptability of this
sector.
India is not alone in it's efforts at promoting the small
scale industrial sector. A number of countries, both
developed as well as developing ones, have already taken
major strides towards promoting and maintaining the small
scale sector.
The problems and prospects of the modern small scale
industrial sector in India, has often been the theme of
discussions in many forums, Workshops and Seminars.
Elaborate schemes have been introduced for promoting,
impiementing,
These schemes
nurturing and supporting the small firms.
fall in the commercial, financial and
technical spheres of enterprise development. Today, India
operates the largest and oldest programme for the
development of small industry in any developing country.
2
These various measures cumulatively did make an impact on
the rapid growth of small industries in the country. From a
few thousand units at the time of Independence, their
numbers grew to a lakh by the end of the sixties and by
1990 their numbers had crossed 18 lakhs. More impressive is
the wide range of products being made by this sector, that
today number over 5000 and include mass consumptio~ items
as well as sophisticated electronic ite~s.
While the growth of this sector has been creditable, the
incumbent hazards of supporting and maintaining this sector
on a long term perspective has also multiplied. The twists
and turns in official policy regarding the small scale
sector while setting the field for this steady and
significant growth, have also been reason for criticism;
especially relating to specific programmes that were
introduced but which never really took off.
1.1 TITLE
Marketing channels of Small Scale Industries manufacturing
selected food products in Ernakulam District
3
1.2 RELEVANCE OF THIS RESEARCH
Much significant contributions have been made through
studies in the area of small industries development, both
by individuals and by institutions. These studies have
added to the body of knowledge relating to investments in
the SSI, employment generation, output, financial
assistance sought and received and comparative analysis of
these above factors, pertaining to specific product segment
as well as to the wide spectrum of all categories.
Very little research has gone into the marketing process,
prospects and constraints of the SSI units. This study aims
at contributing to the knowledge of how the SSI units
perceive the market and approach it. It tries to look at
the marketing decisions with reference to one major area -
the channels of distributions. As CAL McLanid Jr puts it -
'a company can have the best products in the world; yet
without a good distribution system sales will be mediocre
or non existent. More small businesses fail due to poor
distribution than any other factor'.
4
1.3 SMALL ENTERPRISES
1.3.1 SMALL ENTERPRISES - THE GLOBAL SCENE
The role of small enterprises is significant in many
countries as in India. Their contribution to creating new
job opportunities is part of their merit. A study made by
the uS Department of Commerce has identified t~at the bulk
of the inventions that have revolutionised human life in
the twentieth
firms. (Ram
century, have
k Vepa. Modern
come from independent
Small Industry in
small
India
-Problems and Prospects, Sage, 1988 pp 14-17). The
flexibility to adapt to the environment is markedly
pronounced in the
business. They draw
small business as compared to large
from as well as enable full play of
individual initiative and motivation. Norman Mcrae, Editor
of the ECONOMIST, after a visit to the USA in 1979, likened
the large corporations to the 'dinosaurs' which roamed the
earth but perished due to lack of flexibility in adapting
to the environment. He predicted that the future lie with
the small dynamic production groups that can respond
quickly to customer needs.
5

A Canadian Government document states 'Small owner managed
firms are a main stay
across the country.
essential to consumer
of employment in cities and towns
They supply goods and services
and other businesses and they
demonstrate the innovation and entrepreneurship from which
successful enterprises must spring ,
China has a predominant small industry sector contributing
to the national economy and is said to continue to rely on
Mao's aphorism of walking on two legs - 'one small and the
other large'.
Korea and Indonesia have of late started focusing more
attention on the growth of the small scale industries, by
reserving items for exclusive production by the sector.
Japan, known for its unique style in management, have
developed an integrated system of subcontracting, whereby
the small producers stand to benefit from large volumes of
market potential.
In Europe, Italy stands out with its efforts at providing
for free play of private initiative and motivation in the
medium to cottage industries.
6

The UK consider the small firms as crucial to the future of
the country. These firms are regarded as breeding ground
for new entrepreneurial talent and new ideas with in -built
flexibility to adapt to dynamic business environment.
It is sufficiently clear that the small industry is gaining
prominence in the global developmental efforts and is not
confined to one country or a continent.
1.3.2 SMALL SCALE INDUSTRIES - THE NATIONAL SCENE
1.3.2.1 The Small Scale Industries (SSI) have been given a
prominent position in the frame work of Indian economic
planning, both on ideological as well as economic
considerations.
A few of the major objectives attributed to their promotion
are:
a. generation of immediate employment opportunities for
relatively low investment,
b. promotion of more equitable distribution of national
income,
7

c. effective mobilisation of untapped capital and human
skills, and
d. dispersal of manufacturing activities all over the
country, leading to an equitable development of all
regions.
1.3.2.2 The small scale industries fjrst earned the
interest of policy makers as a fallout of the Swadesi
Movement, as well as the decision to boycott all British
goods before the Second World War, causing a major spurt in
growth in the large scale Indian industries especially in
the cotton mill sector. Mahatma Gandhi's stress on village
industries demanded active encouragement for the growth of
the cottage and village industries.
With increased attention being given to the sector, there
evolved a dichotomy in thinking regarding what constitutes
small scale sector. While early definitions related only to
the sector now falling within the ambit of the khadi and
village industries, others tried to
cottage and modern small scale
differentiate between
industries. Pandit
Jawaharlal Nehru submitted a note to the National Planning
Committee (NPC)
tier definition
in May 1940 wherein he suggested
of cottage, small scale and
a three
large
8
industries. He suggested, cottage industries as those which
have either no mechanical power and no hired labour, or
those having no mechanical power but used hired labour
under ten persons. The small scale industry, in contrast,
are those which have either no mechanical power but hire
labour above ten persons or use mechanical power under 10
HP but employ no hired labour.
'While the NPC definition reflected the Gandhian view, since
the formulation of the First five Year Plan, there has been
much debate over the precise role of the small scale
industries in the evolution of the Indian industry. There
rose a strong support for the concept of modern small scale
industry which was expected to achieve both decentralised
growth and more efficiency in production.
The Industrial Policy Resolution (IPR) of April 1948
crystallised the Government policy on this matter. In
essence, it integrated the traditional thinking emphasising
the need for cottage industries with the emerging view that
future growth of small industries should be on modern
lines. This 'dualistic' approach has informed government
policy on small scale industry ever since.
9
1.3.2.3 The definition of small scale industry has changed
over time. Initially, criteria of labour employed and usage
of power were used as determinants of classifying the SSI.
To this was added the criterion that the fixed capital
investment should not exceed Rs.5 1akhs. (Ram K Vepa, Small
Industry in the seventies, Vikas, Delhi, 1971, p.179 ). By
1960, the employment criterion was removed altogether and
an SSI unit was defined as one in which the fixed capjtal
investment was less than Rs. 5 lakhs. (National Small
Industries Corporation - Schemes and Progress 1960-61, New
Delhi: 1961, pp. 8-9). In addition, units with investment
up to Rs.10 lakhs if they were ancillary units were also
treated as SSI. These limits for SSI units and ancillary
SSI units have been revised five times subsequently.
In 1966 the limit of investment was raised to Rs.7.5 1akhs.
Since then, the investment in plant and machinery alone is
consldered. In 1975, the limits were hiked to Rs.10 1akhs
and Rs.15 1akhs for normal SSI and ancillary SSI units
respectively. The figures were Rs.20 lakhs and Rs.25 1akhs
from 1980, which were further increased to Rs.35 1akhs and
Rs.45 1akhs respectively, in 1985. The most recent upward
revision was in 1990 since when the limits are Rs 60 1akhs
and Rs 75 1akhs respectively (Table 1.3.A).
10
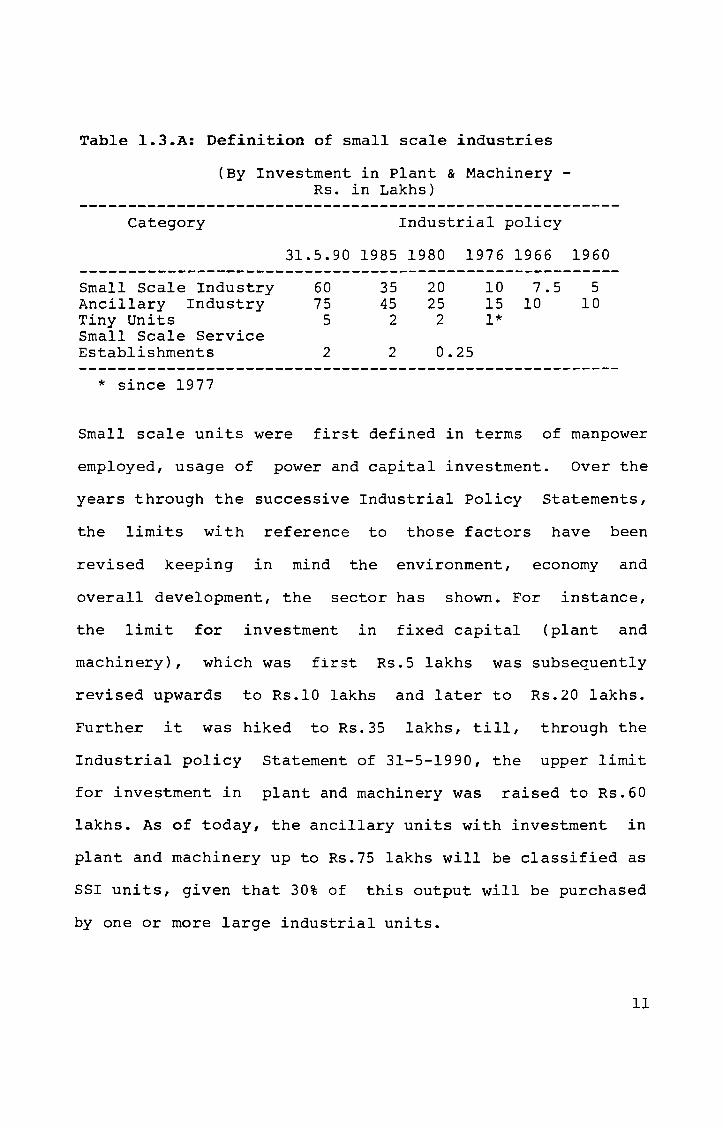
Table 1.3.A: Definition of small scale industries
Category
(By Investment in Plant & Machinery -Rs. in Lakhs)
Industrial policy
31.5.90 1985 1980 1976 1966 1960 --------------------------------------------------------Small Scale Industry 60 35 20 10 7.5 5 Ancillary Industry 75 45 25 15 10 10 Tiny Units 5 2 2 1* Small Scale Service Establishments 2 2 0.25
* since 1977
Small scale units were first defined in terms of manpower
employed, usage of power and capital investment. Over the
years through the successive Industrial Policy Statements,
the limits with reference to those factors have been
revised keeping in mind the environment, economy and
overall development, the sector has shown. For instance,
the limit for investment in fixed capital (plant and
machinery), which was first Rs.5lakhs was subsequently
revised upwards to Rs.lO lakhs and later to Rs.20 lakhs.
Further it was hiked to Rs.35 lakhs, till, through the
Industrial policy Statement of 31-5-1990, the upper limit
for investment in plant and machinery was raised to Rs.60
lakhs. As of today, the ancillary units with investment in
plant and machinery up to Rs.75 lakhs will be classified as
SSI units, given that 30% of this output will be purchased
by one or more large industrial units.
11

1.3.2.4 Definition
The new Industrial Policy announced by the Union Industry
Minister in Parliament on 31 st May 1990 provides the
current definition for small scale industries.
i. Small Scale Industries
Undertakings having investment ln fixed asse~s in plant and
machinery, whether held on ownership terms C~ by lease or
by hire purchase, not exceeding Rs.60 lakhs.
ii. Ancillary Industries
Undertakings having investment in fixed assets in plant and
machinery not exceeding Rs.75 lakhs, with the following
features:
a. The investment in fixed assets in plant and machinery
whether held on ownership terms or by lease or by hire
purchase, does not exceed Rs.75 lakhs; and
b. The undertaking is engaged or is proposed to be engaged
in the manufacture or production of parts, components,
subassemblies, tooling, or intermediates or the
rendering of services and undertaking supplies or
12

renders or proposes to supply or render at least 30% of
its production or services, as the case may be to one
or more other industrial undertakings.
Provided that no small scale or ancillary industrial
undertaking referred to above shall be subsidiary of or
owned or controlled by, any other industrial undertaking.
Small Scale units which undertake
30% of the annual production by
the export of at least
the third year will be
investment in plant and permitted to step up
machinery to Rs.75 lakhs.
iii. Tiny units
their
Undertakings having investment in fixed assets in plant and
machinery not exceeding Rs.5 lakhs and situated in rural
and backward areas having a population up to 50,000 as per
1981 Census.
iv. Small Scale Service Establishments
Establishments / Enterprises engaged in personal or
household services in rural areas and towns with population
of 5 lakhs or less and having investment in plant and
machinery not exceeding Rs.2 lakhs.
13
1.3.2.5 Among developing countries India has earned the
rare distinction of having extensively strived to support
the village and small scale industries throughout the post
- independence period.
1.3.2.6 The Government of India, through its Small
Industries Development Organisation has reaped more than
what it had sown. The contributions from the small scale
sector is visible in terms of employment generation, number
of units, set up, value of output and share in exports.
The progress of small scale sector covering only the SIDO
Industries, is reflected in the statistics available.
The term 'Small Scale Sector' is used in a limited sense to
indicate small scale industries under the purview of
Development Commissioner Small Scale Industries called SIDO
Industries. However, Directorates of Industries of
States/UTs use the term in a broader sense to include small
scale industries outside the purview of the DC(SSI) also.
The total number of registered small scale units in the
country as at the end of 1989 was 12.71 lakhs.(Tablel.3.B).
During 1989-90 the production was estimated at Rs.l,3l,400
14
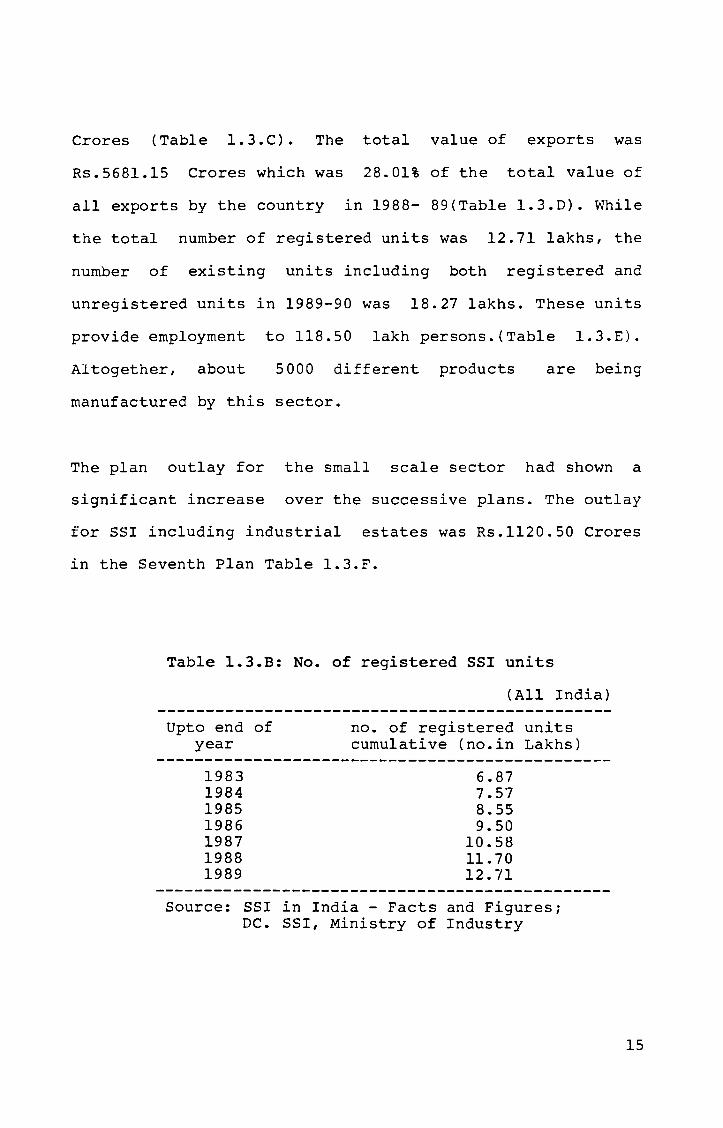
Crores (Table 1.3.C). The total value of exports was
Rs.S681.1S Crores which was 28.01% of the total value of
all exports by the country in 1988- 89(Table 1.3.D). While
the total number of registered units was 12.71 lakhs, the
number of existing units including both registered and
unregistered units in 1989-90 was 18.27 lakhs. These units
provide employment to 118.50 lakh persons. (Table 1.3.E).
Altogether, about 5000 different products are being
manufactured by this sector.
The plan outlay for the small scale sector had shown a
significant increase over the successive plans. The outlay
for SSI including industrial estates was Rs.1120.S0 Crores
in the Seventh Plan Table 1.3.F.
Table 1.3.B: No. of registered SSI units
Upto end of year
1983 1984 1985 1986 1987 1988 1989
(All India)
no. of registered units cumulative (no.in Lakhs)
6.87 7.57 8.55 9.50
10.58 11.70 12.71
Source: SSI in India - Facts and Figures; DC. SSI, Ministry of Industry
15
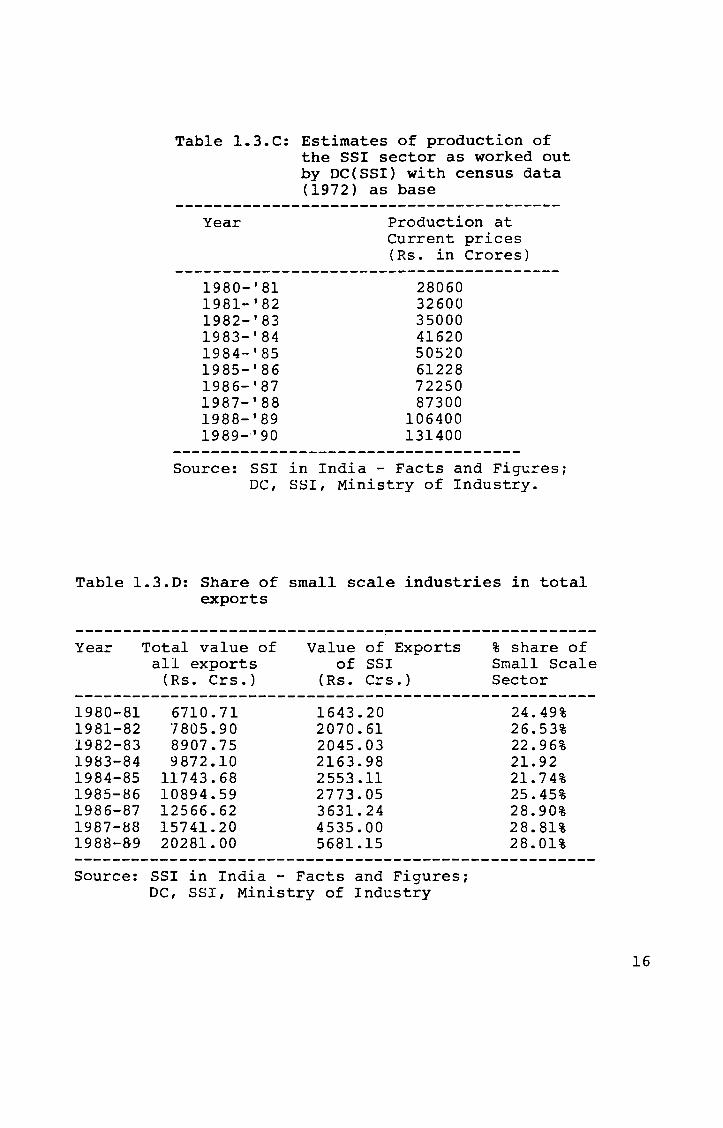
Table 1.3.C: Estimates of production of the SSI sector as worked out by DC(SSI} with census data (1972) as base
Year
1980-'81 1981-'82 1982-'83 1983-'84 1984-'85 1985-'86 1986-'87 1987-'88 1988-'89 1989-'90
Production at Current prices (Rs. in Crores)
28060 32600 35000 41620 50520 61228 72250 87300
106400 131400
Source: SSI in India - Facts and Figures; DC, SSI, Ministry of Industry.
Table 1.3.D: Share of small scale industries in total exports
Year
1980-81 1981-82 1982-83 1983-84 1984-85 1985-~6 1986-87 1987-~8 1988-&9
Total value of all exports
(Rs. Crs.)
6710.71 7805.90 8907.75 9872.10
11743.68 10894.59 12566.62 15741.20 20281.00
Value of Exports of SSI
(Rs. Crs.)
1643.20 2070.61 2045.03 2163.98 2553.11 2773.05 3631.24 4535.00 5681.15
Source: SSI in India - Facts and Figures; DC, SSI, Ministry of Industry
% share of Small Scale Sector
24.49% 26.53% 22.96% 21.92 21. 74% 25.45% 28.90% 28.81% 28.01%
16

Table 1.3.E : Total number of units and employment of the small scale sector during seventh plan period
year
1985-86 1986-87 1987-88 1988-89 1989-90
no.of units (Registered & Unregistered)
13.55 14.74 15.76 17.01 18.27
employment (Lakh Nos.)
96.00 101.40 107.00 113.00 118.50
Source: SSI in India - Facts and Figures; DC, SSI, Ministry of Industry
Table 1.3.F : Outlays for the central and state plans for small scale sector
Plan
First Plan Second Plan Third Plan Annual Plan Fourth Plan Fifth Plan Annual Plan Sixth Plan Seventh Plan
Plan period
1951-56 1956-61 1961-66 1966-69 1969-74 1974-79 1979-80 1980-85 1985-90
* Excluding Industrial Estates.
(Rs. in Crores)
Outlay for SSI including industrial
5.20 * 56.00 *
113.06 53.48 96.19
199.66 104.81 616.10
1120.51
Source: Table 4.3 of the Seventh Plan Document Vol. 11
17
1.3.2.7 Classification of SS!
In the year 1989-90, 836 products had been reserved for
exclusive manufacture in the Small Scale Sector. These
products were broadly classified into groups viz.
Fooe and allied industries
Tex~ile products and hosiery
Wooc and wood products
Pape= products
Lea~her and leather products
Rub::er products
Plastic products
Che=ical and chemical products
Mectanical and Engineering excluding transport
equ:'pment
Electrical and electronics appliances, apparatus and
.... maC~_lnes
Transport equipment
Spo=t goods
Stationery items and other items
Specific products were listed in each group with individual
serial numbers. The total number of reserved items had
varied over the years as new products were added and a few
dereserved (Table 1.3.G).
18
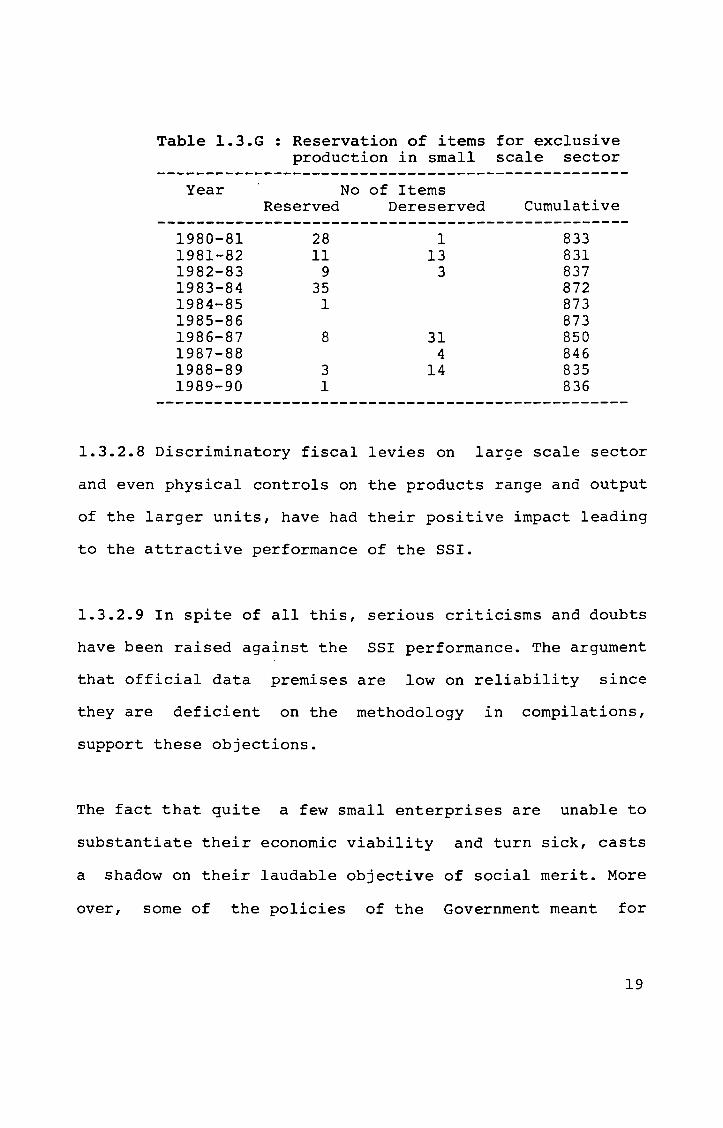
Table 1.3.G : Reservation of items for exclusive production in small scale sector
Year
1980-81 1981-82 1982-83 1983-84 1984-85 1985-86 1986-87 1987-88 1988-89 1989-90
Reserved
28 11
9 35
1
8
3 1
No of Items Dereserved
1 13
3
31 4
14
Cumulative
833 831 837 872 873 873 850 846 835 836
1.3.2.8 Discriminatory fiscal levies on large scale sector
and even physical controls on the products range and output
of the larger units, have had their positive impact leading
to the attractive performance of the SSI.
1.3.2.9 In spite of all this, serious criticisms and doubts
have been raised against the SSI performance. The argument
that official data premises are low on reliability since
they are deficient on the methodology in compilations,
support these objections.
The fact that quite a few small enterprises are unable to
substantiate their economic viability and turn sick, casts
a shadow on their laudable objective of social merit. More
over, some of the policies of the Government meant for
19
promotion of the SSI sector turn out to be counter
productive as they are found to be wanting in effective
pursuit of the expressed objectives.
1.3.3 SMALL SCALE INDUSTRIES - THE STATE SCENE
1.3.3.1 Though considerable attention to traditional and
small scale industrles was given by the State of Kerala in
the early period of post-independence era, meaningful
efforts were made only after 1956, when the present Kerala
State was formed, consequent to the reorganisation of
states.
In tune with the efforts of the Central Government to
augment the industrial infrastructure of the country, the
State Government too had given much significance to
building up an industrial base in Kerala. Institutional
support was made more attractive and special incentives
were offered to induce industrialists to invest within the
state.
1.3.3.2 The
31-3-1989.
state had 55,427 registered SSI units as on
The total investment was estimated at
Rs.65958.13 lakhs. These units employed 3,66,373 persons
and their production was put at Rs.172377.97 lakhs in the
same year. (Table 1.3.H).
20
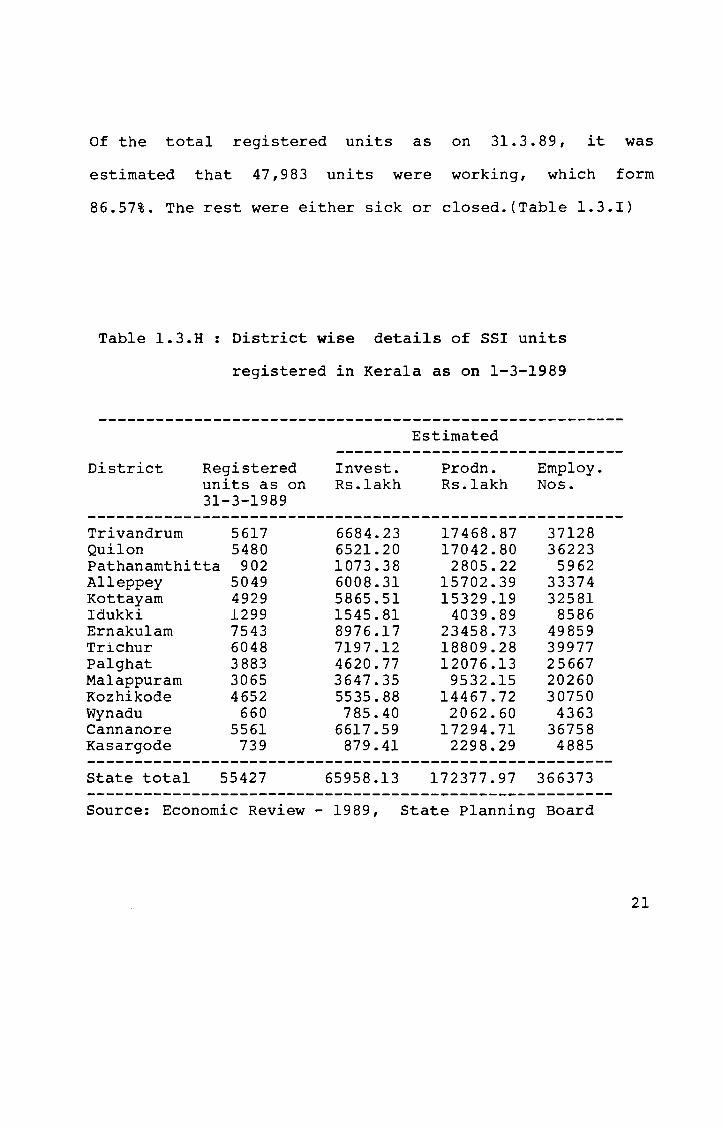
Of the total registered units as on 31.3.89, it was
estimated that 47,983 units were working, which form
86.57%. The rest were either sick or closed. (Table 1.3.I)
Table 1.3.H District wise details of SSI units
registered in Kera1a as on 1-3-1989
District Registered units as on 31-3-1989
Invest. Rs.1akh
Estimated
Prodn. Rs.1akh
Employ. Nos.
--------------------------------------------------------Trivandrum 5617 6684.23 17468.87 37128 Qui10n 5480 6521.20 17042.80 36223 Pathanamthitta 902 1073.38 2805.22 5962 A11eppey 5049 6008.31 15702.39 33374 Kottayam 4929 5865.51 15329.19 32581 Idukki 1299 1545.81 4039.89 8586 Ernaku1am 7543 8976.17 23458.73 49859 'rrichur 6048 7197.12 18809.28 39977 Pal ghat 3883 4620.77 12076.13 25667 Ma1appuram 3065 3647.35 9532.15 20260 Kozhikode 4652 5535.88 14467.72 30750 Wynadu 660 785.40 2062.60 4363 Cannanore 5561 6617.59 17294.71 36758 Kasargode 739 879.41 2298.29 4885 -------------------------------------------------------State total 55427 65958.13 172377.97 366373 -------------------------------------------------------Source: Economic Review - 1989, State Planning Board
21
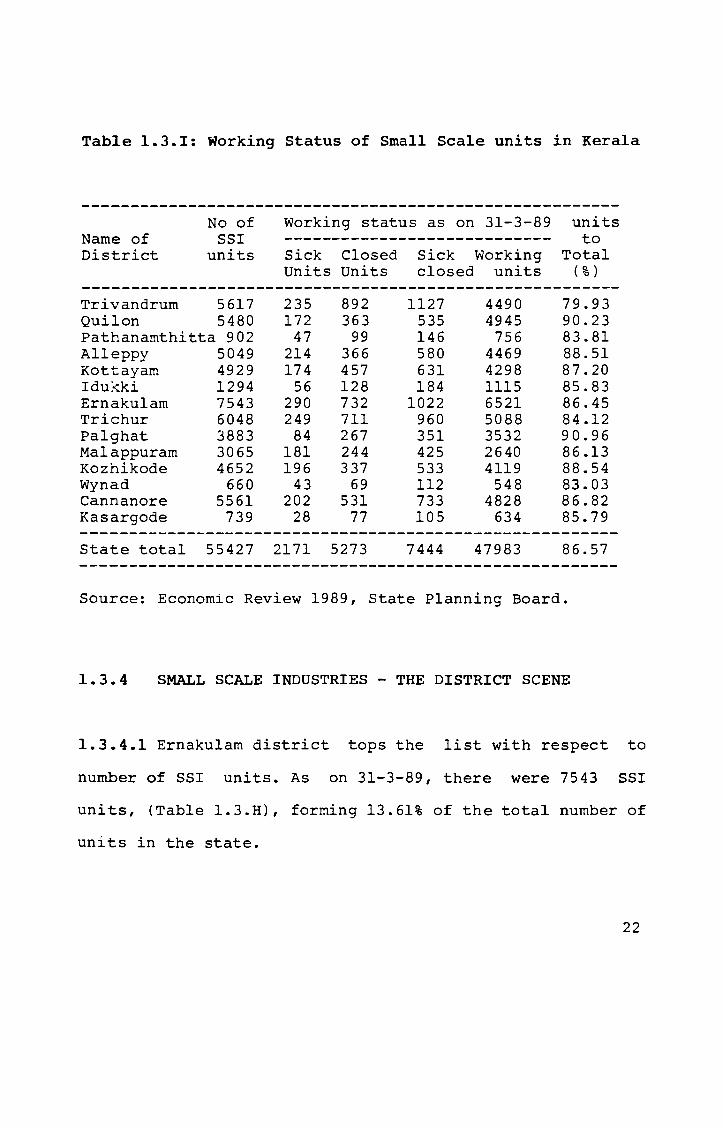
Table 1.3.1: Working Status of Small Scale units in Kera1a
Name of District
No of SSI
units
Trivandrum 5617 Quilon 5480 Pathanamthitta 902 Alleppy 5049 Kottayam 4929 Idukki 1294 Ernakulam 7543 Trichur 6048 palghat 3883 Malappuram 3065 Kozhikode 4652 Wynad 660 Cannanore 5561 Kasargode 739
Working status as on 31-3-89 units ---------------------------- to Sick Closed Sick Working Total Units Units closed units (%)
235 172
47 214 174
56 290 249
84 181 196
43 202
28
892 363
99 366 457 128 732 711 267 244 337
69 531
77
1127 535 146 580 631 184
1022 960 351 425 533 112 733 105
4490 4945
756 4469 4298 1115 6521 5088 3532 2640 4119
548 4828
634
79.93 90.23 83.81 88.51 87.20 85.83 86.45 84.12 90.96 86.13 88.54 83.03 86.82 85.79
State total 55427 2171 5273 7444 47983 86.57
Source: Economic Review 1989, State Planning Board.
1.3.4 SMALL SCALE INDUSTRIES - THE DISTRICT SCENE
1.3.4.1 Ernaku1am district tops the list with respect to
number of SSI units. As on 31-3-89, there were 7543 SSI
units, (Table 1.3.H), forming 13.61% of the total number of
units in the state.
22

The district with about 50 medium and large scale
industries provide an ideal environment for small scale
sector to flourish. The availability of resources,
infrastructure and skilled manpower, the major factors
required for industrial growth, is adequate in the district
and augers well for the small scale industries sector.
1.3.4.2 The District had 86.45% of the total number of
units working in 1988-89. 3.84% of the total are sick units
and 9./1 % are closed units (Table 1.3.1).
The District Industries Centre as part of the Ancillary
Exhlbition-cum-Seminar, "INDFEST - 89", held in June 1989,
has brought out a SMALL SCALE INDUSTRIES DIRECTORY. Being a
unique effort within the state, the Directory provides the
name, address and production lines of SSI units registered
with the Industries Department up to 30-09-1989. Details
are given in two formats; one, local body-wise format and
the other, industry-wise format.
In the Directory, the units have been classified into about
170 product groups. Of these, 14 groups list units
manufacturing food products. (Table 1.3.J)
23
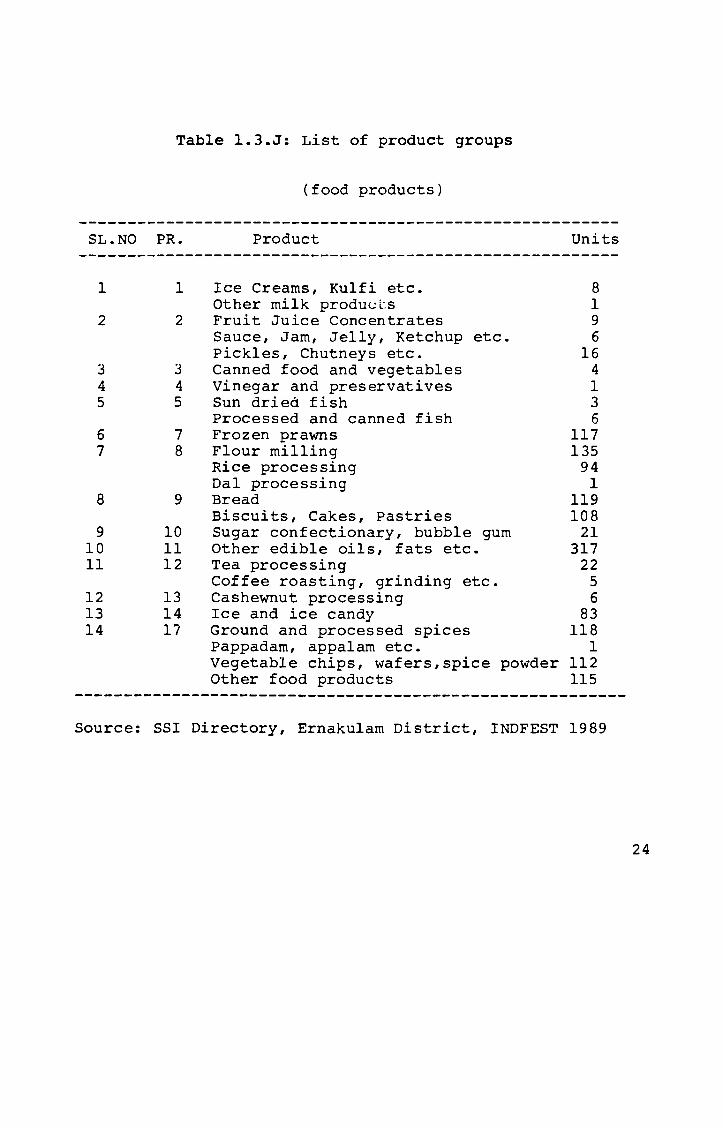
Table l.3.J: List of product groups
SL.NO PR.
1
2
3 4 5
6 7
8
9 10 11
12 13 14
1
2
3 4 5
7 8
9
10 11 12
13 14 17
(food products)
Product
Ice Creams, Ku1fi etc. Other milk products Fruit Juice Concentrates Sauce, Jam, Jelly, Ketchup etc. Pickles, Chutneys etc. Canned food and vegetables Vinegar and preservatives Sun dried. fish Processed and canned fish Frozen prawns Flour milling Rice processing Da1 processing Bread Biscuits, Cakes, Pastries Sugar confectionary, bubble gum Other edible oils, fats etc. Tea processing Coffee roasting, grinding etc. Cashewnut processing Ice and ice candy Ground and processed spices Pappadam, appa1am etc. Vegetable chips, wafers,spice powder Other food products
Units
8 1 9 6
16 4 1 3 6
117 135
94 1
119 108
21 317
22 5 6
83 118
1 112 115
Source: SSI Directory, Ernakulam District, INDFEST 1989
24

1.4 PROFILE OF ERNAKULAM DISTRICT
1.4.1 Ernakulam, known as the 'Queen of the Arabian Sea',
has had trade and cultural links with other countries from
very ancient times. The natural port had contributed to
this status. Today Ernakulam District is much ahead with
respect to all aspects of development compared to other
districts of Kerala.
1.4.2 LOCATION
The district is located almost centrally in the state of
Kerala. It is bounded by Trichur Dist in the North, Idukki
in the East, Kottayam and Alleppy in the south, and Arabian
sea in the west. With an area of 2377.70 sq.km, Ernakulam
is the seventh largest district in Kerala.
1.4.3 TOPOGRAPHY
The land has three natural divisions: the high land,
mid-land and low-land. Backwaters stretch along the Western
fringes of the midland and are separated from the sea by a
narrow section of sandy area, which is generally low and
swampy. Varapuzha kayal, Kodungallur kayal and Vembanad
lake are the backwaters of the district. The major rivers
are Periyar and Muvattupuzha.
25

1.4.4 CLIMATE
With a tropical humid climate, the temperature is uniform
throughout the year. It ranges o to 30.5 C.The
annual rainfall ranges from 250 cm to 360 cm.
1.4.5 FOREST AND MINERALS
Though low on mineral resources, the district has deposits
of rocks of geological importance, graphite, china clay,
illmenite, magnate and iron ore. The limited forest area
falls in the Malayattur high ranges and parts of
Kothamangalam Taluk.
1.4.6 POPULATION
As per 1991 Census the population of the district is
28,12,306 lakhs. This has shown an increase of 9.92 % as
compared to the population as per 1981 census which was
25.33 lakhs. The population as per 1971 Censes was 23.83
lakhs. The density of population is l168/sq km while it was
1052/sq.km as per 1981 census. The sex ratio is 1000
females to 998 males. By residence, 14.40 1akhs are rural
while 13.72 lakhs are Urban based.
26

1.4.7 EMPLOYMENT
As per 1981 census, of the total population of 25.33 lakhs,
1.07 lakhs were main workers and 0.92 lakhs marginal
workers. ~he unemployment situation is rather gric. The
number of educated job seekers is mounting, keeping pace
with the total employment figures.
1.4.8 INFRASTRUCTURE
The district has an extensive net work of roads viz. ~H 47,
NH 17 and MC road. The total length of PWD Roads, including
the National Highways of 78 km, is 2084 kms. The district
has a broad gauge railway network of 92 km. The inland
water ways have also contributed to the overall development
of the r~mote areas which are inaccessible by roa~s. The
Cochin Port and the Air Port add to the national and
lnternational linkages of the District. Telegraph and
telephone facilities are available throughout the district.
The district is well electrified.
27

1.4.9 LITERACY
Ernakulam District achieved cent percent literacy in 1990.
Facilities for primary secondary and professional education
are abundant in the district, as primary schools, high
schools and arts and science colleges exist in large
numbers. Other than the Cochin University of Science and
Technology there are the Engineering College, Law College,
Homeopathic College, Ayurveda College, Music College,
College of fisheries, Polytechnic and a number of technical
SChools.
1.4.10 ECONOMY
The district is predominantly agrarian. The land reforms,
density of population changes in family style and fast
urbanisation has caused a shift in economic activity from
agriculture to other sector viz. industry and service. The
1981 Census shows a decline in number of cultivators and an
increase in the number of workers in the secondary and
tertiary sectors.
28

1.4.11 AGRICULTURE
As on 1990 an area of 178822 ha is under various crops.
Coconut, Rubber and Paddy form the Inajor crops. Other crops
are tapioca, arecanut, pepper, ginger, banana, plantain
etc. Agriculture related sectors viz. poultry, dairy and
fishery also play a very important role in the economy of
the district.
1.4.12 BANKING
As on March 1990, the district had 397 branches of 39
commercial banks. In addition to these, three branches of
two foreign banks, the state offices of Industrial
Development bank of India and Small Industries Development
Bank of India and the Exchange Control Department of the
Reserve Bank of India were also functioning.
1.4.13 ADMINISTRATIVE SET UP
1.4.13.1 The District Head Quarters is Ernakulam with the
Collectorate ana Civil station located at Kakkanad. The
district is divided into two Revenue Divisions, with head
quarters at Muvattupuzha and Fort Cochin. There are seven
Taluks under these divisions.
29

Cochin Division
Muvattupuzha Division
Alwaye
Parur
Cochin
Kanayannur
Kunnathunadu
Muvattupuzha
Kothamangalam
1.4.13.2 Under these Taluks are 102 Revenue Villages. The
District has 84 Panchayats, 10 Muncipal Towns besides the
Cochin Corporation.
The Municipal towns are:
1.4.13.3
Cochin Corporation
Alwaye
Parur
Perumbavoor
Muvattupuzha
Angamali
For enhancing the
Thrippunithura
Kothamangalam
Eloor
Kalamassery
Piravam
effectiveness of the
developmental measures, the District is divided into 15
community development Blocks.
30
The community development blocks are:
Alengadu Block
Angamaly Block
Edappally Block
Koovappady Block
Kothamangalam Block
Mulamthuruthy Block
Moovattupuzha Block
Palluruthy Block
Pampakuda Block
Parakkadavu Block
Parur Block
Vadavucode Block
Vazhakkulam Block
Vypeen Block
Vyttila Block
31

CHAPTER 2
2.0 OBJECTIVES, SCOPE AND METHODOLOGY
2.1 OBJECTIVES
This work aims at studying the marketing approaches and
practices of the Small Scale industrial units. Specifically
this research covers:
a study of the existing marketing systems and the
operations of the SSI units manufacturing selected food
products in Ernakulam District.
analysis of the existing channels of distribution as
employed by these units in terms of patterns
employed, tasks undertaken and deficiencies.
a study' of the perceptions of the SSI units as regards
the Channels their importance with reference to
performance and relationship.
32
The focus is on:
Approaches to Channel Management and their perceived
importance.
Approaches to Channel Management and perceived strength
of outcomes.
2.2 SCOPE
This research pertalns to selected
Scale Industrial Units involved in
marketing specified food products. It
the processes and decisions related
categories of Small
mariufacturing and
tries to look into
to the channels of
distribution employed by these units for marketing their
produce. Channels of distribution, more referred to as the
;place I element in the marketing mix of a firm, is a
controllable variable. The type of product being marketed
is the major factor which could influence decisions in this
area.
Hence, the small enterprises to be studied had to be from
homogeneous groups.
33

Initially the small scale units in the Mini Industrial
Esta~es (MIE's) were identified. But a preliminary survey
of a few MIE's revealed that the incidence of sickness was
high among the units. More over these units were engaged in
manufacturing, processing and servicing and issues with
respect to marketing were not different from those of firms
outside the MIE,s. So this category of SSI firms was not
taken up for study exclusively.
The state Government in 1988-89 announced five thrust areas
in which new SSI projects would get special incentives and
concessions. These areas were food, electronics,
rubber/leather, pharmaceuticals and garments.
From these categories this research has been restricted to
one product group -Food products. Even in this group a
variety of products are being manufactured by the SSI.
A study about channels of distribution of all product
categories would have made the research cumbersome and
would have led to less focused attention to the intricacies
of the operations of this function.
So the target categories under study included just those
SSI units that manufacture and market Bread, Biscuits,
34
Spices ana Pickles. Only those units that had obtained
Permanent SSI Registration from the Industries Department
up to 1989 were included in the study. The source list for
these units was the Directory of Industries, Ernakulam
District published by the District Industries Centre in
1990. This is the only authentic and most recent document
available in the state which lists the registered SSI units
in the district of Ernakulam. The units have been
classified based on the region and products manufactured.
In 1990 a national census of SSI units was commenced by the
Development Commissioner (SSI), with the active involvement
of the SISI and DICs of the respective districts. According
to information obtained from the Directorate of Industries
and Commerce, Kerala, though field data collection is over
the details are being compiled and the report is yet to be
published. Hence, the details from this census could not be
used in this research.
2.3 RESEARCH DESIGN
The different phases of this research are discussed in this
section. It may not be said that these steps followed one
another in the given sequence. At times two or more of them
had run simultaneously.
35

2.3.1 THE PURPOSE AND BROAD AREA OF STUDY
The first step was to define the purpose of the research
and to identify the board area of study. Since the
researcher has been working in the field of
entrepreneurship and small enterprise development, for the
past many years (since 1983), he had noticed a number of
grey areas with reference to small enterprise development
and management, that need a closer study. Marketing the
produce of the SSI sector is one area which demands this
in-depth scrutiny. A cursory look reveals that though
things seem to work, the SSI promoter often face situations
where the commercial viability of his project is at stake
or even non- existent. While a variety of causative factors
can be listed, this study proposes to explore one of the
crucial elements of the marketing-mix, ie. channels of
distribution, of these Small Scale Units.
2.3.2 PRELIMINARY DISCUSSIONS
The area of research having been defined, the researcher
had a series of discussions with senior officials and
experts of organisations
promotion of the Small
persons included:
and agencies involved in the
Scale Industries Sector. These
36

- General Manager, District Industries Centre, Ernakulam
- Manager(Credit), District Industries Centre, Ernakulam
- Manager (Economic Investigation), DIC, Ernakulam
- Industries Extension Officers, Industries Department,
Kerala
- Consultants, Kerala State Industrial and Technical
Consultancy Organisation(KITCO), Ernakulam
- Small Industries Promotion Officer, SQall Industries
Service Institute(SISI), Trichur
- Assistant Director, SISI, Trichur
- Deputy Director, SISI, Trichur
- Faculty Members, Centre For Management Development,
Trivandrum
- Entrepreneurs and industrialists in the field
These discussions helped to gain clear perspective about
the sector and the dynamics involved.
2.3.3 LITERATURE REVIEW
Relevant literature was reviewed. The sources for this
included the libraries of:
Centre For Development Studies, Trivandrum
Centre For Management Development, Trivandrum
School of Management Studies,CUSAT, Cochin
37
2.3.4 SPECIFIC PROBLEMS AND ISSUES
The researcher having been exposed to the operations of the
small enterprises sector, could list a series of issues
that need deeper understanding. Specific problems and
issues were listed for the purpose of gathering relevant
data.
2.3.5 SOURCES OF DATA
Primary as well as Secondary data were required for this
research.
2.3.5.1 Secondary data
Secondary data pertaining to the subject under study was
collected from various sources. The source of secondary
data include organisations and agencies viz.
- Directorate of Industries & Commerce,Govt of Kerala
- District Industries Centre, Ernakulam
- Kerala Small Scale Industries Association, Ernakulam
Unit, Ernakulam
- State planning Board, Trivandrum
- District Information Office, Ernakulam
38
- Bureau of Economics & Statistics, Trivandrum
- National Informatics Centre, Trivandrum
- Small ~ndustries Service Institute, Trichur
- National Small Industries Corporation, Trichur
- Lead Bank Cell, Union Bank of India, Ernakulam
- Kerala State Industries Development Corporation,
Trivandrum
- The Spices Board, Ernakulam
- Lib~aries
2.3.5.2 Primary Data
Primary data had to be collected from the Small Scale
Industries themselves. A representative sample for each
product group was taken. A pretested questionnaire was
developed and used to collect responses from SSI promoters.
Along with the questionnaire, there were detailed
unstructured interviews with the promoters.
2.3.6 SAMPLING
2.3.6.1 Sampling unit
For this study only those units which manufacture the
selected items of food products viz. Bread, Biscuits,
Pickles and Spices are included.
39
2.3.6.2 The source list
The details regarding population of small scale industries
registered with the Directorate of Industries and Commerce
was taken from the District Industries Centre (DIC),
Ernakulam. The DIe, Ernakulam had brought out a Directory
of SSI, pertaining to the Ernakulam District in 1~90. The
directory provides the name and addresses of all registered
SSI units in the district of Ernakulam. Classification has
been made based on products and also the region, in the
Directory.
The food products manufacturing SSI
group in the total list. Of the 170
firms formed a major
product groups with
7543 firms listed in the Directory, 14 categories involved
food products (Table 1.3.J), with 1143 units. ie. this
category forms about one seventh of the total number of
units in the District.
Of these, it was noted that,
mainly of servicing/job work
mili, etc. Since such units
a few categories consisted
units ego oil mill, flour
already had a ready made
market, they were excluded from this research.
40
2.3.6.3 Sampling procedure
The sampling was done based on the following factors
Only units that are involved in manufacturing and
marketing were included
Products of varying shelf-life were included so as to
account for the perishability element of the items.
Exclusively export oriented units were excluded ego
frozen prawns etc.
Sample was to include firms from rural and urban areas.
Sample was to be drawn from each of the selected
product groups separately.
Stratified sampling was done to select samples for
collection of primary data. The strata in the first stage
was based on the products manufactured. Only those
homogeneous groups of SSI units with respect to the
products under study were selected ie.Bread, Biscuits,
Spices and Pickles. Within these product groups, the units
41

were further stratified based on the region in which each
unit is located. The regions as given in the directory are
Panchayats, Municipalities and Corporations. From the above
classification, sample units were picked out randomly·with
the help of a random number table generated by personal
computer (PC).
Table 2.3.A provides details of number of units in each
?roduct category falling in the different regions. It was
~oted that according to the registration details, there
Here units that manufactured either bread alone or biscuits
alone and also units that manufactured both bread and
~iscuits. Hence samples were drawn from all these three
;roups though only two products were involved. The pickles
and spices manufacturing units formed the other two groups.
~s Table 2.3.A shows, there were 119 units manufacturing
3read and 108 units manufacturing Biscuits, with 84 units
taIling in both categories. Thus the total number of units
illanufacturing these four products in actual add up to 305 • .
If the numbers are added up product wise, the total would
be 389 units.
42

Table 2.3.A : Region wise break up of SSI units* in Eranakulam district
CORP MUNC PAN SUB TOT TOTAL
Bread 12 6 17 35 -------------------------------------------- 119
Bread & Biscuits 32 19 33 84
-------------------------------------------- 108
*
Biscuit 15 5 4 24
Pickles 5 3 8 16 16
Spices 44 27 75 146 146
Total 108 60 137 305 389
Selected product groups included in this research Source: SSI Directory, Ernakulam District, INDFEST.
2.3.6.4 Sample size
The population of SSI units under study was 305 units. A
census survey was not undertaken due to two reasons:
a. The topic under study and the research methodology
employed was to visit the respective units
individually. The geographical spread together with the
time and financial constraints ruled the census survey
unacceptable.
43
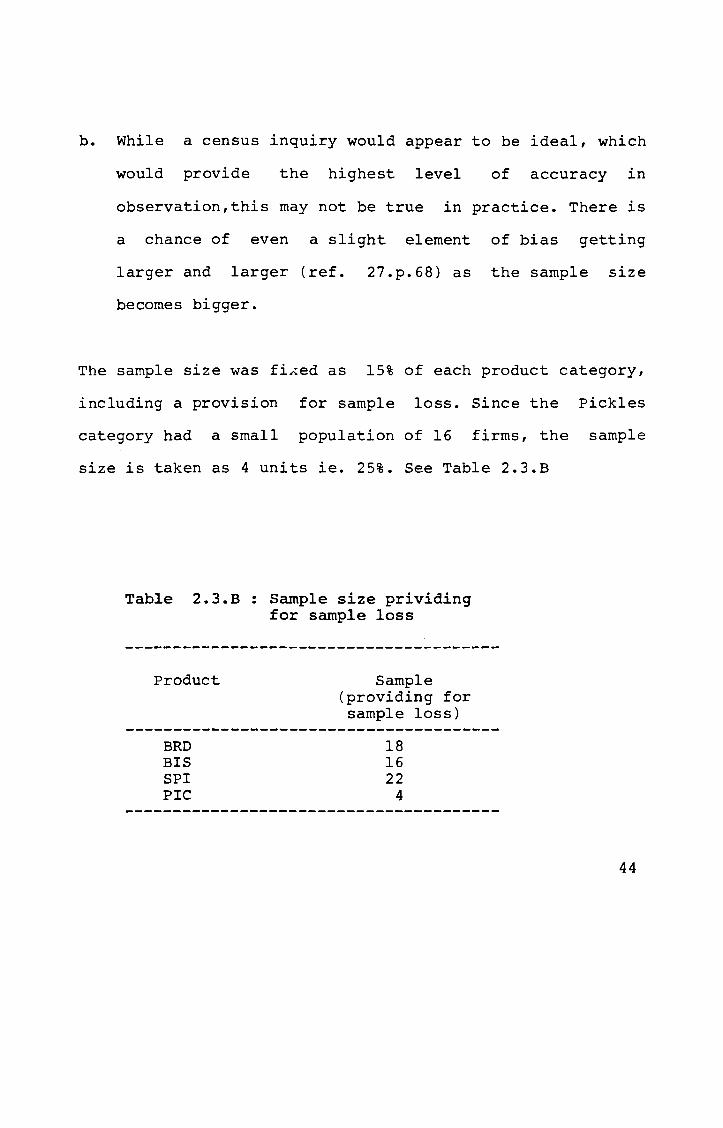
b. While a census inquiry would appear to be ideal, which
would provide the highest level of accuracy in
observation,this may not be true in practice. There is
a chance of even a slight element of bias getting
larger and larger (ref. 27.p.68) as the sample size
becomes bigger.
The sample size was fihed as 15% of each product category,
including a provision for sample loss. Since the Pickles
category had a small population of 16 firms, the sample
size is taken as 4 units ie. 25%. See Table 2.3.B
Table 2.3.B: Sample size prividing for sample loss
Product
BRD BIS SPI PlC
Sample (providing for sample loss)
18 16 22
4
44

2.4 INSTRUMENTS FOR DATA COLLECTION
2.4.1 SECONDARY DATA
A check-list was prepared for collecting information from
the different sources of secondary data.
"2.4.2 PRIMARY DATA
A questionnaire was developed as the basic tool for
collecting primary data. It was structured so that the
primary objectives of this research
The following factors were kept
instrument was being developed.
could be addressed to.
in mind while the
a. to obtain a profile of the SSI units in these product
categories.
b. to understand the extent to which scientific management
principleB are employed in their operations
c. to identify major problem areas related to their
performance
d. to study the importance they perceive in a scientific
approach to marketing
45

e. to identify the channels of distribution engaged by
these units
f. to study the internal arrangements they have for
carrying out the marketing operations
g. to assess the support they receive from the channel
mecbers
h. to gain a view regarding their approach to the function
of marketing
i. to understand their perceptions regarding a few
specific approaches they may make and the perceived
impact of these approaches on channel member
relationship and performance.
2.4.2.1 The following twelve approaches, that the SSI
managers can take with respect to marketing their
products, were taken up for detailed study:
1. To reward channel members for better performance
2. To ?UniSh channel members for poor performance
3. To guide and advice channel members on how to perform
4. To take the role of a leader for directing the
operations of the channel members
5. To insist on regular and periodic communication about
the activities, problems and results.
6. To fix sales targets for the channel members
46
7. To limit expenses towards channel members
8. To use own distribution vehicle
9. To distribute products only directly to consumers
10. To use many channels together
11. To select all channel members on their own
12. To assess periodically the performance of channel
members.
2.4.2.2 These twelve approaches were chosen from a set of
forty, which forms a subset of the innumerable possible
ones that any industrial enterprise will have to take in
the case of operations. First, forty possible approaches
were listed. Of the forty, twenty pertained to aspects of
relationship between the manufacturers and channel members.
The other twenty pertained to aspects of operations /
performance by the channel members. The two sets were then
assessed by a panel of experts. The objective was to
identify relevant and applicable ones for small
enterprises. The experts included consultants, industrial
promotion officers, bankers and trainers who have
interacted with small enterprises and their promoters for
many years.
47

Of these, five approaches were chosen considering their
relevance to relationship between channel members and
manufacturers, and seven, to channel performance. These two
sets were then included in the research tool to get first
hand assessment from the small industrial unit operators /
managers on how they view them.
The respondents were first asked to mark if they would take
each one of those approaches with reference to the
operations of their units. The response could be an 'yes',
a 'no' or 'not certain'. Those responding 'yes' were then
requested to mark how important that approach was in
relation to their unit: 'important' or 'extremely
important'. Those who would not take the approaches were to
record if it was 'unimportant' or 'extremely unimportant'.
2.4.2.3 It was anticipated that the respondents, could be
from anyone of the following groups; those using multiple
channels for the distribution of their products; those
using only a single channel; those using their own outlets
and no external organisations; those who are not
manufacturing and so are not distributing and finally those
from units that are either sick or closed. For recording
the response to the above set of approaches one of the
following methods had been taken:
48
a.' the respondent records his option based on present
experience(ie. if using single or multi channels)
b. the respondent records his option based on past
experience (ie. when he had earlier been using some
external channels of distribution)
c. the respondent records his choice based on what he
would do if in case he plans to use a external channel
of distribution in future (-where he uses only his own
outlet at present)
In the next stage, possible outcomes of the various
approaches were listed. The respondents were asked to
record their perceptions regarding the possibility of these
outcomes if each one of the above short-listed approaches
are taken by them. The possibility of each outcome for each
decision could be 'extremely positive', 'positive', 'no
effect', inegative' or 'extremely negative'.
The listed outcomes for the five decisions that could
affect relationships were different from those plotted
against decisions pertaining to operations and perfor~?nce.
(See Questionnaire)
49
2.4.2.4 Approaches that could affect relationship with
Channel Members
Five approaches were identified which could affect the
relationship between the SSI manufacturer and
members. While it is obvious that every
promoter takes would have a bearing on
the channel
approach the
the total
performance of
studied in
the channels, here, these decisions were
relation to their perceived effect on
relationship.
Considering inter organisational relationships with
reference to channels of distribution, power, leadership
and conflict are the three basic elements. The power
bases are identified as reward power, coercive power,
expert power, referent
(Bowersox. et al. 1980).
power and legitimate power.
Reward power, coercive power and expert power bases were
included for analysis. The perception of the SSI
manufacturers regarding approaches with respect to the
above three power bases were taken for analysis. (Dl, D2 &
03 respectively).
50
Leadership is the use of power to improve an existing
system and thus individual performance. To understand the
perception of the SSI manufacturers, a possible decision
(D4), to take up the role of a leader for directing the
operations of the channel members was included.
Communication forms the basis for free flow of information
between the channel members and the channel and
environment. Effective communication has a direct bearing
on the efficiency of the channel. One critical aspect of
communication ie. regular and periodic communication of
market information from the channel members to the small
scale industrialist, (D5), has been taken up for
understanding the perception of SSI manufacturers.
The above five decisions were first studied with reference
to how the SSI manufacturers perceived their importance in
relation to their operation in the market.
Subsequently seven possible outcomes were listed. The
respondents were required to state on a five point scale
against each decision, to what extent each outcome could be
expected ie. 'extremely negative' to 'extremely positive'.
The mid-point indicated 'no effect'.
51

The anticipated outcomes of the short listed approaches
were: Co- operation, dependence, satisfaction, trust,
conflict, good-will and sales. Of the above, the first five
relates to aspects of relationship between the SSI
manufacturer and the channel members. The sixth relates to
the manufacturer's acceptance in
seventh, to the units performance.
the market and the
The above are the specific behaviourial and relational
outcomes sought to be studied with reference to the
approaches referred to earlier.
Besides the possibility of these outcomes, the effect of
these decisions on sales also, as perceived by the small
scale industrialists, was taken up for analysis.
2.4.2.5 Approaches that could affect performance of the
unit
Seven approaches were included in this part. Accepting that
an industrialist would have to make decisions on a wide
spectrum of aspects relating to performance, only those
relevant to the area of channels of distribution have been
taken up. Even in this area, it was observed that every
possible approach could not be taken up for detailed study.
52
Hence only seven decisions pertaining to a few specific
dimensions of operations have been selected from a larger
list of twenty.
The first approach in this set (D6) deals with the SSI
manufacturers choice to fix sales targets for the channel
members in terms of quantity or value. The firm's continued
existence depends on steady demand for the product. Sales
is generated by different strategies. They would include,
catering to specific market segments, adding to time, place
or value utility of the product offered or by providing
incentives. So broadly, the approach would be based on the
market pull or the market push approach. Fixing sales
targets would fall in the later category where the channel
members, through pressure of punishment or reward are
forced to provide a certain level of sales. Considering
that the SSI manufacturer too has to ensure a specific
level of sales to be economically viable, this decision
appeared to be valid and so was included in the study.
Another approach (D7) relates to controlling the costs
incurred towards channel members by reducing expenses on
incentives, gifts and other promotional tools aimed at
channel members. By containing the total expenses, the
small industrialist would be able to increase his profit
53
margin. It was felt that the 551 manufacturers' perception
about this decision would be important so as to understand
how he viewed its effect on performance.
The third approach (08) studied was regarding the 551
manufacturers need for using own vehicle as against hired
vehicles for distribution of the products to the next level
in the channel. In cases where the manufacturer directly
sold to the consumers also, the choice of using own vehicle
was studied.
Another aspect that was probed into was about the
manufacturers' approach (09) to avoid all external
organ1sations in the channel and effect sales directly to
consumers. The manufacturer's assessment of how effectively
they could reach on their own, their consumers, would
provide insight into their dependence on the channels of
distribution.
Multiple channel approach (010) was taken up for study with
reference to the 551. Usage of many channels
simultaneously, while posing problems of complexity in
management and horizontal competition, would aid in
distributing the product to a wider area to a larger number
of consumers. To understand how the small industries
54
managers view this arrangement was the purpose in including
this decision.
The manufacturer's need for controlling the action of the
channel members so as to get the best results is taken as
the premise for posing a situation where all the channel
members involved in distribution of his products are
selected by the small i~dustrialist himself. will such a
decision be taken or not; or is it an irrelevant approach
decision. The SSI managers' views on this aspect was
sought. (Dll).
Yet another approach (D12) listed, was one to assess
periodically the performance of channel members. This
decision entails that the manufacturer critically evaluates
the performance and achievements of the channel members on
a regular basis. It also requires the SSI manager to have a
structured data/information gathering mechanism. This
decision also reflects the manufacturers' power over the
channel members in as much as demanding and recording
performance details.
The respondents initially stated if they would take these
approaches in relation to their units operations; and to
what extent they were important or unimportant.
55
Subsequently, the perceived effect of these approaches on
aspects viz. sales, distribution costs, good will, customer
service efficiency and relationship with channel members
were studied. The respondents stated if there would be a
positive or a negative impact on these measures if each one
of these decisions were taken by them.
Aspects viz. sales and goodwill and the possible effects on
them were studied in relation to all the twelve listed
approaches.The respondents were also asked to state the
existing level on a five point scale from 'EXTREMELY HIGH'
to 'EXTREMELY LOW' as regards various factors with
reference to thei= experience in the market. These factors
included cooperation, dependence, satisfaction, trust and
conflict all relevant to relationship between the
manufacturer and channel members. Factors relevant to
performance, including sales, costs, goodwill and
efficiency in cus~omer service were also rated on the above
five point scale.
2.5 FIELD WORK FOR DATA COLLECTION
The study required both secondary data and primary data.
56
2.5.1 SECONDARY DATA
The Senior Executives or the officers-in-charge of Small
Enterprise development activities of the bodies involved in
tnis were contacted in person. The researcher received much
insight into the process of planning, implementation and
practlcal issues influencing the achievement or
non-achievement of targets, through these discussions.
The registers and documents maintained by the above
departments or agencies and their publications if any were
used as source of secondary data.
2.5.2 PRIMARY DATA
Primary data was collected by the researcher himself from
the sample units. These units spread over the entire
distrlct were approached over a period of two months.
A questionnaire-cum-interview method was adopted to elicit
all required information from the units. The researcher
called at each unit and met the promoter, the manager or
the person ln charge of the operations to gather
information as per the questionnaire.
questionnaire was ~filled, a closed book approach
After the
was taken
57
during the unstructured interview. In many cases, it was
felt by the researcher, that the defensive tone taken by
tne respondents earlier was suddenly lost. This approach
helped gather much real issues and facts that the
respondent would not have otherwise revealed.
Some of the units had to be approached more than three
times before the proprietor could
had been two cases where the
co-operate.
be met in person. There
proprietors refused to
Generally, the response had been encouraging as most of
them were sincere and exhaustive in responding to the
various queries. There were quite a few units that
could not be traced as either the address was incomplete or
the unit had been shifted to new premises unknown to the
old neighbourhood. Some of the units that had been closed
also could not be studied as the responsible persons could
not be contacted; either because they had left the station
or because they did not want to co-operate.
2.6 DATA ANALYSIS
Once the data collection was over, the filled
questionnaires were checked and edited. Incomplete
58
questionnaires were removed. Contradictory responses were
crossed checked where ever possible.
The responses recorded in the acceptable questionnaire were
then fed into the computer. Data was entered using the
DBASE III PLUS software package. The entered data was
fu~her cross checked with a manually recorded
tra~scription sheet with the same data. The questionnaires
were coded with a unique key number and a category code:
Biscuits
Bread
Spices
Pickles
- BIS
- BRD
- SPI
- PIC
Interpretation of the data was based on contingency tables
pre~ared using EPI software package. The DBASE III PLUS
pac~age also was employed for interpretation purpose.
2.7 WRITING THE THESIS
The thesis was finally drafted based on the various phases
and findings of the research.
59
CHAPTER 3
3.0 REVIEW OF LITERATURE
3.1 MARKETING CHANNEL SYSTEM
A marketing channel system predominantly 'focuses on the
process of ownership and physical transfer of commodities,
products and services' [ref l3.p.l]. Typically, a number of
different enterprises other than the manufacturer of the
products or services, get involved in the marketing
function. The perception that they form part of an
inter-related system may not
participants (ref 13.p.2).
exist among most channel
Since the guiding principle
behind any channel member's staying within the system would
be their perceived needs, relative state or degree of risk
within the arrangement, channels invariably are dynamic.
In contrast to the above loose channel arrangements, highly
organised systems are also found to exist in some specific
60
cases. Such arrangements, while offering some degree of
stability to the channel members, tend to be dominated by
anyone or group of channel members. The perceived
stability too is relative, as compared to the loose
channel arrangements over extended time periods (ref
13.p.2).
Simultaneous membership in different channel arrangements
by many institution= make the understanding of marketing
channels ~ore complex. This participation in different
channels by the members nay be by strategic policy or by
accident. As perspectives shift from that of the consumer
to researcher to that of the manufacturer, the channels of
distribution take on different meanings. The state of the
economy, the socio-cultural settings and consumer needs and
desires are found to have a bearing on the nature and
functions of the marketing channels.
From the vantage point of the manufacturer, channels of
distribution hold equal status alongside the product,
pricing and promotion components, forming an integral part
of the marketing mix. For the manufacturer it represents
the means of transferring goods to the final buyers and
users. The success of any organisation is dependent on
the extent to which it can reach its customers, and
61
satisfy their shopping needs and cater to their habits. The
cost constraints of the seller works as the restraining
factor.
But 'without a good distribution system, sales will be
mediocre or non existent', even in the case of the best
product of a company. (ref 21.p.368). A channel of
distribution involves a manufacturer, wholesaler, retailer
and a variety of facilitating ins~ltutions, engaged in
buying and selling relationships among themselves and hence
can be viewed as a system.
The manufacturer thus has a specific concern in developing
an appropriate channel strategy for his products so that
his offering match the specific requirements of his target
market. The obJectives as expected to be fulfilled by the
channels has to be spelled out clearly. For the small
manufacturer the channel of distribution is a significant
factor.
3.2 DEFINITIONS OF MARKETING CHANNELS
Traditionally the channel of distribution is viewed as the
sequence of firms involved in moving a product from the
producer to the user (ref 14. J H Donelly Jr. 1976 ). It is
62
'an organ1sed network of agencies and institutions which,
in combination, perform all the activities required to link
producers with users and users witt producers in order to
accomplish the marketing task. (ref 9.R Cox and T T Schutte,
1975).
The American Marketing Associatic~ defines channels of
distribution as 'the structure of intra company
orga~isation units and extra comp~~y agents and ~ealers,
wholesalers and retailers,through which a commodity,
product or service is marketed. (re£ 9. A M A 1960). L P
Bucklin, (1966) says, 'A channel 0= distribution shall be
considered to comprise a set of institutions which perform
all of the activities (functions) utilised to move a
product and its title from prod~ction to consumption'.
(ref 24).
Bert Rosenbloom (1978) says, 'the ~arketing channel may be
defined as the external contractual organisation which
management operates to achie~e its distribution
obJectives'. (ref 15). The course taken in the transfer of
the title to a commodity constitutes its channel of
distribution. (Beckman T N iMaynarc H M & Division W Ri
Principles of marketing, 1957 p.7).
63
'Marketing channel is a path traced in the direct or
indirect transfer of ownership to a product, as it moves
from a producer to ultimate consumers or industrial users'.
(ref 23. Cundiff, Still & Govoni. 1980).
Another deflnition by Bowersox, et al (1980) says;
Marketing channel is defined as a system of relationships
that exists among institutions involved in the process of
buying and selling (ref 13).
There are a large
be seen, the
number of other definitions. But as can
definitions vary with the differing
perspectives. While some define the marketing channel as a
network of organisations engaged in the transfer of goods
and title to the same from producer to consumers, some
other definitions view it as a system of relationships that
eXlst among institutions engaged in the process of buying
and selling. Channels are also perceived as a path traced
by title to goods and services, as they move through
various agencies. Marketing channel is also described as a
loose coalition of business firms who have banded together
for the purpose of trade (ref 15).
'PLACE' is one of the controllable variables of the
marketing mix which looks into where, when and by whom the
64
product will be distributed, so that the target market
derives the best uti11ty in terms of time and value.
It thus evolves that, marketing channel is not a
predesigned structure of different organisations existing
to take up the distribution of any manufacturers' products.
Rather, a channel does not exist till the negotiatory
funct10ns have taken place between the series of
organisations. This in effect opens up
of goods and their titles to the
a path for the flow
consu~ers from the
producer. Obviously, a marketing channel is organisation
specific, or more precisely, product specific.
The sequence of organisations and their relationship evolve
through a negotiatory function which is predominantly
guided by the distribution objectives of the manufacturer.
The activities of the manufacturer have to be coordinated
with those of the middlemen used in the distribution of any
given product.
3.3 CHANNEL PARTICIPANTS
The structure of a marketing channel describes the
arrangement and linkage of its members. With the variety of
intermediaries available, and considering the varying
65
requirements of consumers, the number of distribution paths
open to the manufacturer is very large. The ideal path or a
combination of paths has to be chosen, which is possible
only w1th a clear perception of the type of intermediaries,
their interests and the roles each one can take up.
A marketing channel is cons1dered to be a group of
inter-related intermediaries involved in the flow of goods
and their titles to the consumers. Thou~n there are a wide
variety of participants 1n the channel, all are not
considered to be members. Going by the definition (ref 15)
of the channel by B Rosenbloom, the participants are
identifiable by the 'thread' of negotiation that links them
together. Thus membership in the channel is based on the
performance of negotiatory functions viz. buying, selling
and transfer of title to goods. Non-performers of the
negotiatory functions, though they are participants of the
channel, are not members.
The members of the marketing channel are the producer and
the consumer at either end, with the retailer and the
wholesaler in between, as intermediaries. (ref 17). The
intermediaries can either be merchants or agents. This
contactual organisation forms the traditional marketing
channel as described by most authors.
66
In the context of management perspective ...... it is more
appropriate to view final users as target markets which are
served by the commercial subsystem of the channel (ref 15).
The commercial channel by definition excludes users or
consumers. This view also preserves the lofty position the
consumers have as prime benefactor and final judges of the
desirability of a given marketing process.
Facilitating institutions, though they do not perform any
negotiatory functions are participants of the channel as
they contribute to the smooth functioning of the channel.
They include all agencies undertaking transportation,
banking, insurance and publicity other than negotiating
purchases or sales, so as to play a supportive role in the
effective performance of the channel. They tend to engage
in multiple channel relationships as they do not generally
accept the risk involvement necessary to qualify as a
prlmary participant.
3.4 NUMBER OF CHANNEL LEVELS
Marketing channels vary based on the number of levels in
each sequence. A channel level is comprised of an
institution which performs some function so as to bring the
product or service one step closer to consumption. The
67

number of levels in a channel represents the channel
length.
Zero level channel or direct marketing channel involves the
manufacturer selling his products directly to the consumer.
A one-stage channel involves a retailer who distributes to
the consumer after having purchased the items from the
producer. In a two stage channel, wholesalers
job of distributing to the retallers, who
take-up the
sell to
consumers. A three level channel structure includes a
Jobber who performs between the wholesaler and the
retai~er. Multi-stage channel structures are also observed,
but with less frequency. (ref 24.p.414).
Today, vast numbers of intermediaries or specialists exist
within distribution channels. Manufacturer has to rely on
some type of specialist for sale of their products to
customers. The function of exchange which was once
restricted to the central market place has now been taken
over by wholesalers and retailers.
3.5 RETAILERS
The US Bureau of Census defines retailers as "all
establishments engaged in selling merchandise for personal
68
or house hold consumption and rendering services incident
to the sale of such goods". (rei 13). A retailer is
characterised by its selling, directly to ultimate
consumers. Though generally sales are effected in small
lots by retailer, this is not an essential feature.
The retailer could either be a merchant or an agent.
Broadly, four categories of retailers are identifiable;
Mail Order Houses a recent development in India,
restricted to certain regions; Automatic merchandising
machines operators
to become popular in
a much employed
using vending machines which are yet
the country; Direct selling firms
door to door canvassing effort and
Reta11 establishments - dominating the scene in terms of
numbers.
3.6 WHOLESALERS
The US Bureau of Census defines wholesalers as" all
establishments or places of business primarily engaged in
selling merchandise to retailers; to industrial,
commercial, institutional or professional users; or to
other wholesalers; or acting as agents in buying
merchandise for or selling merchandise to such persons or
companies. (ref 13).
69
Wholesalers are characterised by that, as middlemen, they
do not generally sell to ultimate consumers. Though most
wholesalers deal in large lots, this is not an essential
feature of wholesalers. While they usually make sales for
purpose of resale, there are many who sell to industrial or
institutional users. There are also instances when
wholesalers make sales in small lots to house hold
con sur.: er s as well, but considering -:'heir total
transactlons, this is not very significant.
Broadly, three categories of wholesalers are identified:
Merchant Wholesalers including merchants and
distributors; Manufacturers Own Sales Branches and
Merchandise Agents and Brokers - who involve in the process
based on a variety of terms and conditions.
3.7 INTER-ORGANISATIONAL BEHAVIOUR
From a manufacturer's perspective, the performance of the
sequence of organisations within the channel he employs has
a direct bearing on his success. To ensure that every
member contributes to this objective, he has to appreciate
that the channel represents a coalition of dissimilar firms
that have banded together for mutual advantage (ref 24
70
p.429). Each member of the channel
set of objectives for being part
collective set of objectives of
synchronise so that the system would
and efficient manner.'
would have a specific
of the channel. The
all the members must
operate in a smooth
Thus the relationship between channel members is a
predominant factor which determines the success of the
system. Each firm has to define its relation with the
other me~bers in the channel. This definition of roles has
been distinguished into five types by McCammon (ref 24
p.428).
Power, leadership and conflict form three of the basic
elements of inter-organisational behaviour in the context
of marketing channels. (ref 13 p.99).
3.7.1 POWER
Power is generally defined (Dahli) as the ability to get
someone to do something that would not otherwise be
done. (ref 13 p.94). It is viewed by Etzione as the ability
to induce change in the face of resistance. (ref 15.p.84).
Miller and Butler say, power refers to a person's ability
to control the behaviour of others. For Price, the essence
71
of power is the capacity to influence the behaviour of
others. (ref 15.p.84).
In the context of marketing channels,the term 'Fower' is
used to refer to the capacity of channel member(s) to
control or influence the behaviour of other channel
member(s). The understanding of the use of power by any of
the channel member of the manufacturer,rests on the sources
or bases of power that the member is capable of drawing
from.
Reward power, coercive power, expert power, legitimate
power, and referent power are accepted as t~e major bases
of power that a channel member can draw from (Bowersox, pp
102-105).
While, Reward power refers to a channel member's ability to
give something of value to the other members so as to
facilitate their goal accomplishment, Coercive power refers
to the capacity to deprive something or give punishments,
unless the other members co-operate. Expert power is
derived from the superior knowledge and expertise of a
channel member, which the others will need for their own
goal accomplishments.
72
Referent power which emanates from a member's image in the
market is a psychological source of power (ref 13.p.I03).
The SSI manufacturer by virtue of his low- budget promotion
and resultant low profile, is unable to command a referent
power over the market and thereby the channels, which would
compel the channel members to desire identifying with the
unit.
Legitimate power, which Bowersox calls the most complex
source of power, is linked to the acceptance that one
channel member has the 'right' to define the behaviour of
others. It could be based on position, role or reputation.
It is more of an automatic attribution of power. Here again
the SSI manufacturer would have constraints. Preliminary
interviews with a few SSI manufacturers revealed that they
seldom enjoyed this positional power.
It is also accepted that power in the context of marketing
channel behaviour does not follow the above typology
absolutely. Often power positions result from a combination
of different bases.
3.7.2 LEADERSHIP
Leadership is derived from a channel member's possession of
power and the tolerance of other firms in accepting
73
direction. Leadership is the use of power to improve a
system as well as individual performance. The tolerance of
other members of these attempts at improvement, determines
the level of leadership a member can exert over them. The
power base from which a particular member would operate and
the balance level of the other members must both be
determined before the member decides to take on a
leadership role within the ~hannels.
3.7.3 COMMUNICATION
Another element of channel relationship is communication.
Communication sets the basis for free flow of information
between the channel members and also between the channel
and environment. Efficient performance of the channels is
determined by the perfect understanding between the channel
members. This is made possible by an effective flow of
information within the channel.
While communication assumes
performance, it is plagued by
(ref 15 P. 95-96). Wittreich
succinctly:
prominence in channel
two behaviourial problems
summarises them rather
74
"The people who manufacture the goods and the
?eople who move the goods into the hands of the
ultimate consumer do not share the same business
?hilosophy (goals) and do not talk essentially the
same language "
Effe=~ive communication, thus is hindered by differing
goals of the channel members and also the difference in
ter~~noiogy used by them. The perceptual difference on a
wide variety of issues coupled with the tendency of some
members to be secretive, affect the effectiveness of
cha~~el communication
omission, deletion
negatively. The
and distortion
possibility of
of information,
espe=ially in a competitive environment makes communication
a critical element of channel relationships.
3.7.4 CONFLICT
In all social systems the presence of conflict is
inevitable. As Stern and German points out, "A state of
conflict may exist when two or more components of any given
system of action .... become objects of each others
frus~rations". Frustration is caused in one member when he
is deprived of or inhibited from attaining some of his
goals. When another member of the system is perceived as
75

the cause of this frustration,
the two.
Another definition of channel
conflict arises between
conflict by Bowersox
et.al.(ref l3.p.73) states, 'it is a situation in which one
member of a distribution channel perceives another member
as ar. adversary engaging in behaviour designed to injure,
thwart or gain scarce resources at it's expense". Conflict
follows a cyclic pattern in that it originates, grows,
steacles and then is resolved.
Conflict originates from a variety of causes and often from
a co~ination of factors. Conflict at times is expressed
while it may also exist covered by routine behaviour of
channel members (ref 13 p.73). Stern and Heskett (ref 13
p.73) argues that though conflict may exist, in many cases
the frustrated members may not take any specific action to
change their behaviour or that of the other channel
members.
While conflict is known to be of horizontal inter type or
vertical nature, here in this study, we take only the
vertical conflict situation. Vertical conflict refers to
stress and frustrations between different levels within a
given channel.
76
3.7.5 CO-OPERATION
Co-operation between channel members is more basic than
what is obvious. On the one hand, the members are driven by
the force of 'monostasy', the desire to be independent;
each one wanting
accomp1ishlng the
rea11sation that
to define one's own goals and means of
same, while on the other, exists the
by working together, more can be
accomplished; stimulating a desire for standing together
'systasy'. When systasy predominates, co - operation will
result (ref 13 p.113).
3.7.6 DEPENDENCE
Dependence is a state in which channel members are put
into, when each one finds it difficult to perform all the
functions necessary for a successful existence in market.
It results from diverse functional requirements for
accomplishing the various goals of the members. Functional
specialisation of the members contribute to their
dependence on each other to the extent they wish to achieve
their goals.
77

3.7.7 TRUST
Trust is that element which ensures continued interaction
between channel members. While trust is at times referred
to as a fallout of co operation (James C Anderson & James
A Naruss Journal of marketing, JAN 1990.p.48), it may also
be that an environment of trust is a pre-requisite for
co-operation. A causal relationship between the two has not
yet been empirically established. But trust develops and
grows between two members only in an atmosphere of mutual
acceptance and adequate understanding of each others
strengths. An efficient communication link between the two
helps them to have a proper perception about each other.
3.7.8 SATISFACTION
Satisfaction is
accomplishment of
the positive feeling
desired objectives.
one derives on
The channel member
sets hlS own goals. Decisions and actions are taken towards
attaining these goals. The resultant reaction of his target
groups or that of other members provide the required feed
back on accions he had initiated. The extent to which the
actual outcomes match the expected, determines the level
of satisfaction a channel member derives. The cyclic
sequence of goal setting, action, feedback and
78
satisfaction is dynamic. Goals are redefined and new ones
set, as soon as earlier ones are attained and satisfaction
experienced.
3.7.9 GOODWILL
Goodwill is understood as the sum of all positive images
the organisation has been capable of evoking among the
public. It is the resultant of good decisions and deeds
supported by positive pUblic relations and customer,
satisfaction. While goodwill is not amenable to
quantification, it can be perceived in the attitude and
response of the public, including those of the consumers,
towards the organisation in general and its proposals in
particular.
79
CHAPTER 4
4.0 PROFILE AND MARKETING ARRANGEMENTS
In all cases, the promoter or chief executive had been
contacted for collecting the primary data. Where ever the
units are in-operational, care has been taken to elecit
lnformation as pertaining to the period when the unit was
involved in the activity under research. Since the area
being studled is related to channels of distribution as
employed by the projects, a .retrospective analysis was
found to be acceptable. It also helped to shed some light
on the causative factors that led to the unit becoming sick
or defunct.
One unit had changed its original name to a new one and the
proprietor refused to meet the researcher. In another case
the promoter had left for overseas employment and the unit
was purchased from him by landlord who is still running the
unit.
80

There was one case where the proprietrix has temporarily
lost interest because of a frandulant salesman who
absconded with the cash collected from the retailers. There
were a few cases where the promoters have completely
stopped activities in the original product lines and have
switched to new product lines or services.
4.1 SAMPLE PROFILE
4.1.1 BREAD MANUFACTURING SSI FIRMS
4.1.1.1 Types of organisation
Proprietory concerns form the majority 87.5%, while 12.5%
are partnership firms.
4.1.1.2 Location
Less than (31.2%) of the units were located within 10
kilometre from the district head quaters; 50.0% between 10
and 30 kms and 18.8% beyond 30 km.
81
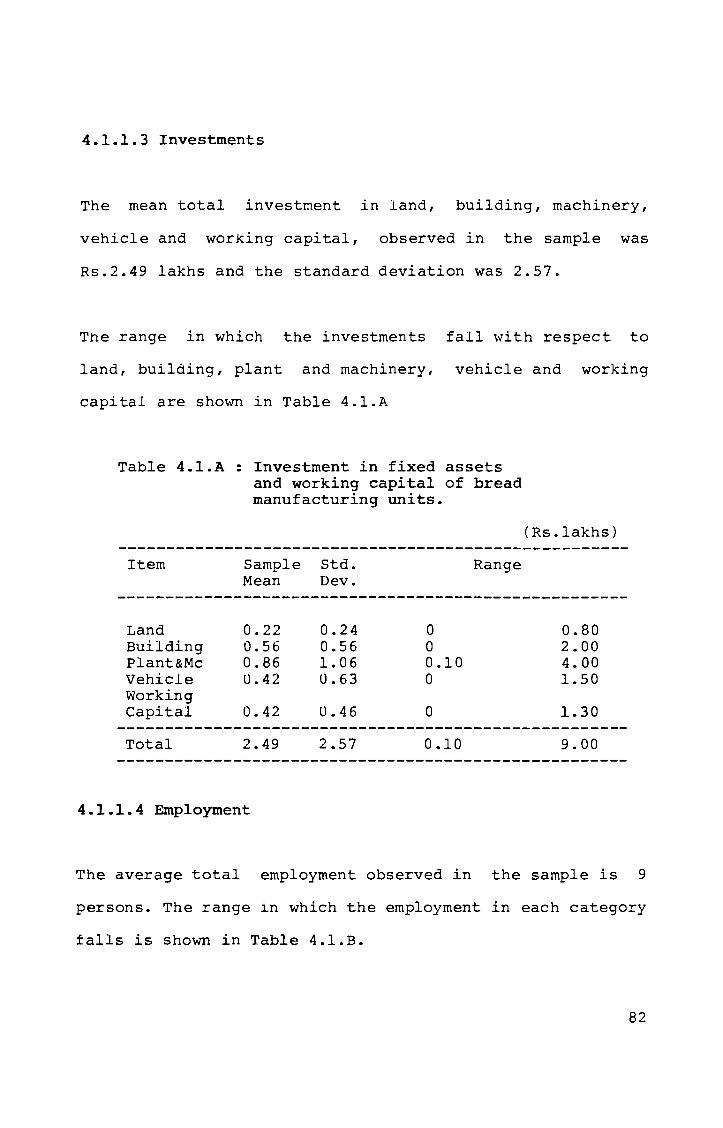
4.1.1.3 Investments
The mean total investment in land, building, machinery,
vehicle and working capital, observed in the sample was
Rs.2.49 lakhs and the standard deviation was 2.57.
The range in which the investments fall with respect to
land, building, plant and machinery, vehicle and working
capital are shown in Table 4.1.A
Table 4.l.A : Investment in fixed assets and working capital of bread manufacturing units.
Item
Land Building Plant&Mc Vehicle Working Capital
Sample Std. Mean Dev.
0.22 0.24 0.56 0.56 0.86 1.06 U.42 U.63
0.42 U.46
Range
0 0 0.10 0
0
(Rs.lakhs)
0.80 2.00 4.00 1.50
1.30 -----------------------------------------------------Total 2.49 2.57 0.10 9.00
4.1.1.4 Employment
The average total employment observed in the sample is 9
persons. The range in which the employment in each category
falls is shown in Table 4.1.B.
82

Table 4.l.B : Employment in Bread manufacturing SSI firms
Category Sample Std. Mean Dev.
(No. of persons)
Range
---------------------------------------------Skilled workers 1.50 0.89 1 4
Semiskilled workers 1.81. 2.76 0 8
Unskilled workers 2.31 3.82 0 15
Sales persons 1.50 1.46 0 6
Others 1.75 4.36 0 15
Total 8.81 7.69 1 26
4.1.1.5 Sales turnover
The total sales turnover of bread manufacturing units in
the sample, for three years, ie. 1989, 1990 and 1991 were
recorded. These figures were computed from details of
quantity sold and prices of the products as reported by the
different units. The average turnover in 1991 was Rs 3.81
lakhs while it was Rs 3.32 lakhs in 1990 and Rs 2.63 lakhs
in 1989.See Table 4.1.C. The turnover in 1991, observed in
the sample ranged from Rs 0 to Rs 34 lakhs. The observed
range in 1990 was 0.10 to 30 lakhs and that for 1989 was 0
to Rs 25 lakhs.
83
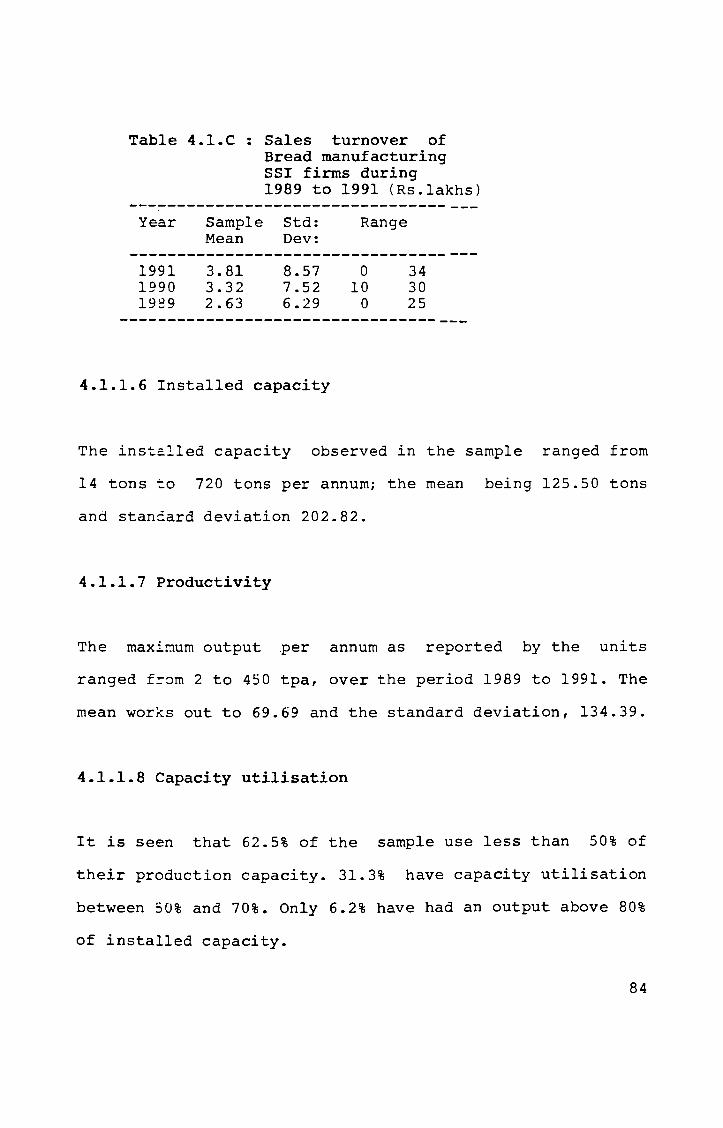
Table 4.1.C : Sales turnover of Bread manufacturing SS! firms during 1989 to 1991 (Rs.lakhs)
------------------------------------Year
1991 1990 1939
Sample Std: Mean Dev:
3.81 3.32 2.63
8.57 7.52 6.29
Range
o 10 o
34 30 25
------------------------------------
4.1.1.6 Installed capacity
The inst~~led capacity observed in the sample ranged from
14 tons ~o 720 tons per annum; the mean being 125.50 tons
and stanGard deviation 202.82.
4.1.1.7 Productivity
The maximum output .per annum as reported by the units
ranged f=om 2 to 450 tpa, over the period 1989 to 1991. The
mean works out to 69.69 and the standard deviation, 134.39.
4.1.1.8 Capacity utilisation
It is seen that 62.5% of the sample use less than 50% of
their production capacity. 31.3% have capacity utilisation
between 50% and 70%. Only 6.2% have had an output above 80%
of installed capacity.
84
4.1.1.9 Credit avai1ed
Of the sample, 87.5% have avai1ed of some form of credit.
Of these, 64% claimed they are regular in repaying the
loan. The others are defaulters.
4.1.1.9.1 Term loan
The Term loan availed by the sample units varied from nil
to Rs 7 lakhs. 50% of the units had taken less than Rs.l
lakh as loan. 25% have not taken term loan and had funded
their project through own sources.Only the others have loan
above Rs 1 1akh.
4.1.1.9.2 Working capital loan
Of the units sampled, 75% had not avai1ed of any working
capital loan. Considering those units that have taken
working capital loan, the average is Rs 0.48 lakhs.
4.1.1.9.3 Other loans
One fourth of the sample had taken other loans, the average
being Rs.10000/-.
85
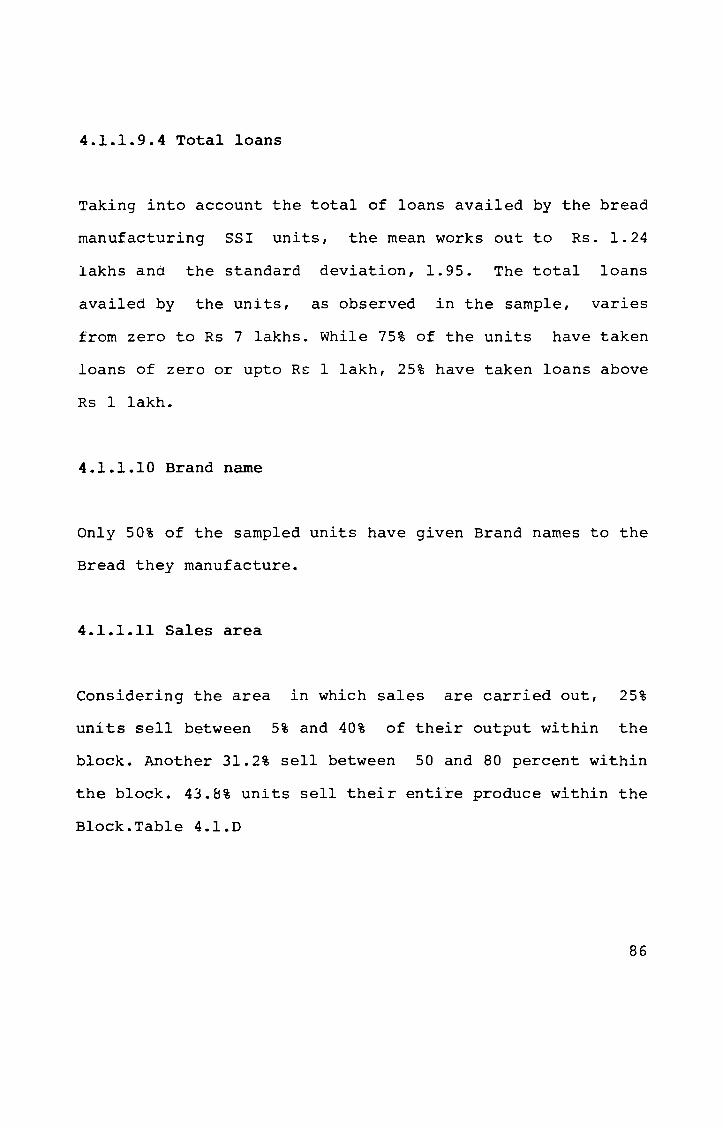
4.1.1.9.4 Total loans
Taking into account the total of loans availed by the bread
manufacturing SSI units, the mean works out to Rs. 1.24
lakhs and the standard deviation, 1.95. The total loans
availed by the units, as observed in the sample, varies
from zero to Rs 7 lakhs. While 75% of the units have taken
loans of zero or upto RE 1 lakh, 25% have taken loans above
Rs 1 lakh.
4.1.1.10 Brand name
Only 50% of the sampled units have given Brand names to the
Bread they manufacture.
4.1.1.11 Sales area
Considering the area in which sales are carried out, 25%
units sell between 5% and 40% of their output within the
block. Another 31.2% sell between 50 and 80 percent within
the block. 43.8% units sell their enti~e produce within the
Block.Table 4.l.D
86
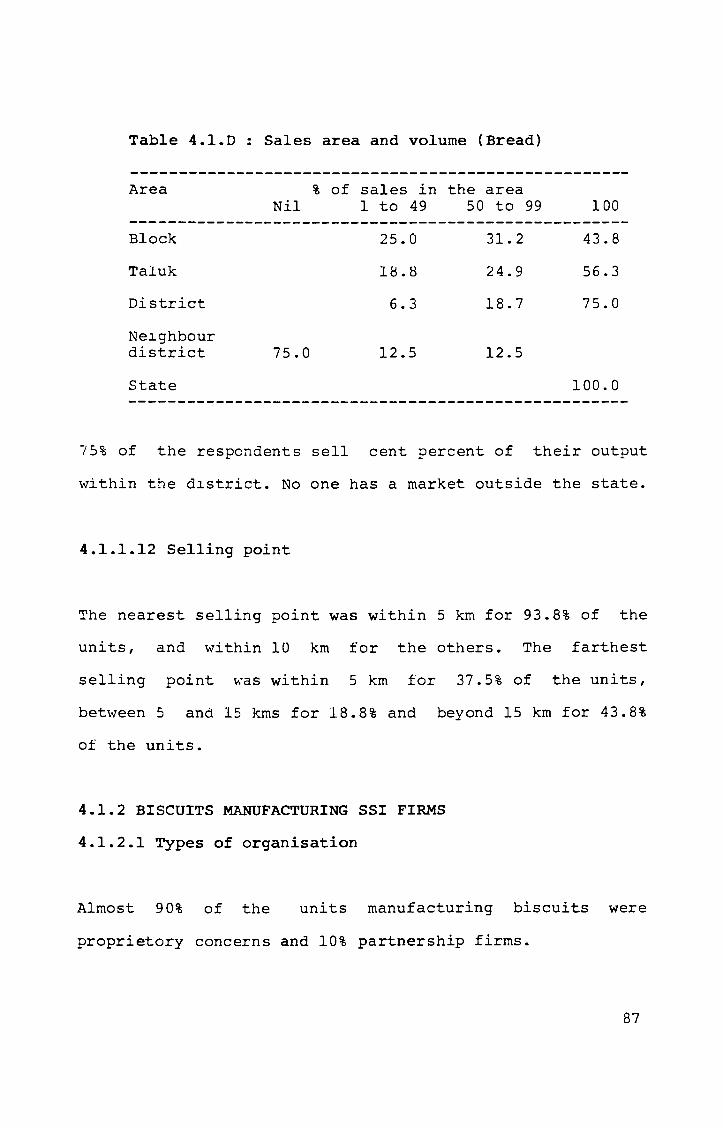
Table 4.1.0 : Sales area and volume (Bread)
Area % of sales in the area Nil 1 to 49 50 to 99 100
Block 25.0 31.2 43.8
Taluk le.B 24.9 56.3
District 6.3 18.7 75.0
Nelghbour district 75.0 12.5 12.5
State 100.0
7~% of the respondents sell cent percent of their output
within the dlstrict. No one has a market outside the state.
4.1.1.12 Selling point
The nearest selling point was within 5 km for 93.8% of the
units, and within 10 km for the others. The farthest
selling point was within 5 km for 37.5% of the units,
between ~ and 15 kms for 18.8% and beyond 15 km for 43.8%
of the units.
4.1.2 BISCUITS MANUFACTURING SSI FIRMS
4.1.2.1 Types of organisation
Almost 90% of the units manufacturing biscuits were
proprietory concerns and 10% partnership firms.
87
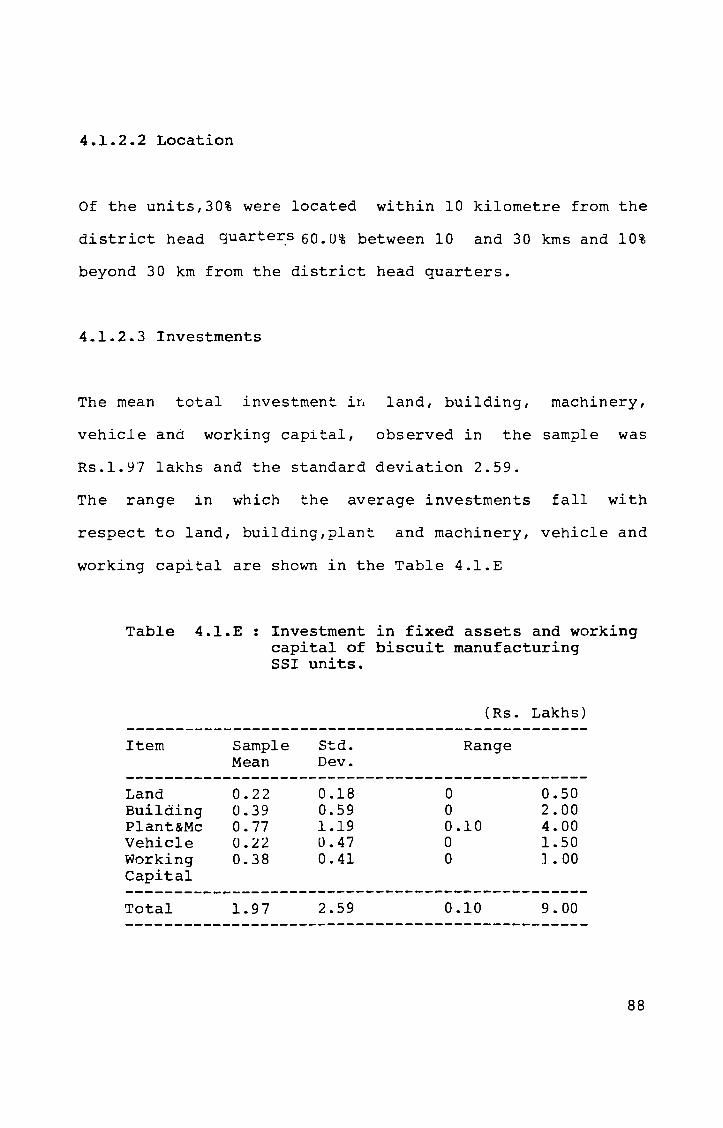
4.1.2.2 Location
Of the units,30% were located within 10 kilometre from the
district head quarter.s 60.0% between 10 and 30 kms and 10%
beyond 30 km from the district head quarters.
4.1.2.3 Investments
The mean total investment iL land, building, machinery,
vehicle and working capital, observed in the sample was
Rs.l.Y7 lakhs and the standard deviation 2.59.
The range in which the average investments fall with
respect to land, building,plant and machinery, vehicle and
working capital are shown in the Table 4.1.E
Table 4.l.E: Investment in fixed assets and working capital of biscuit manufacturing
Item
Land Building Plant&Mc Vehicle Working Capital
Total
SSI units.
Sample Mean
0.22 0.39 0.77 0.22 0.38
1.97
Std. Dev.
0.18 0.59 1.19 0.47 0.41
2.59
(Rs. Lakhs)
Range
0 0.50 0 2.00 0.10 4.00 0 1.50 0 ] .00
0.10 9.00
88
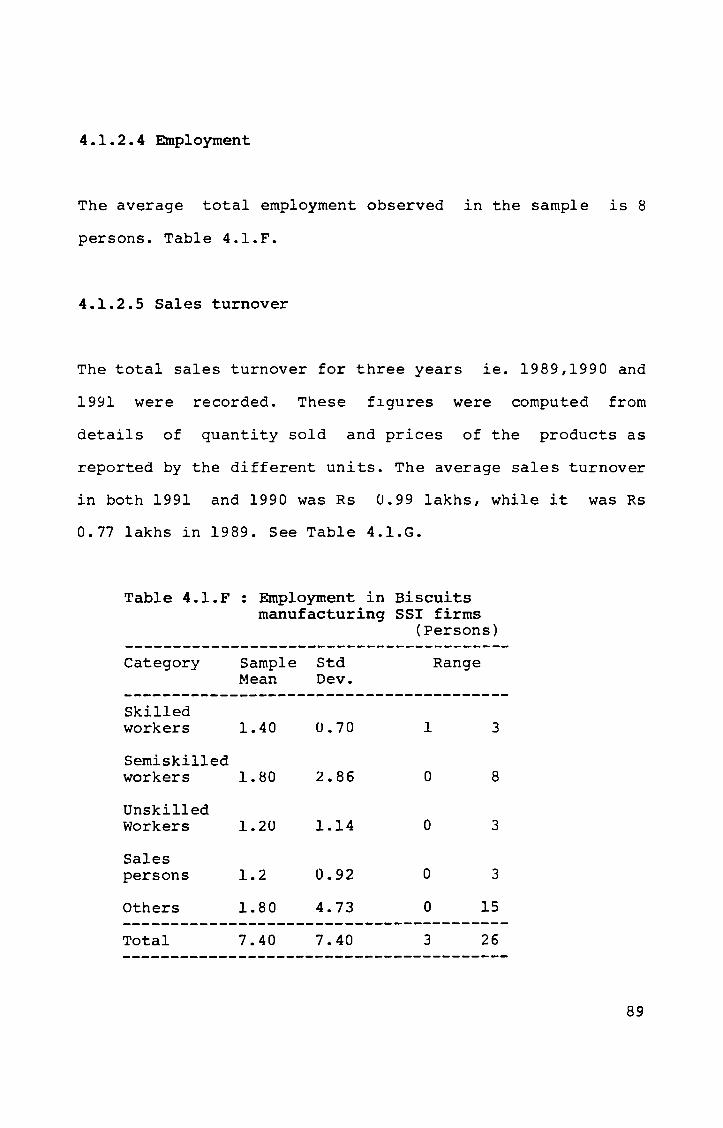
4.1.2.4 Employment
The average total employment observed in the sample is 8
persons. Table 4.l.F.
4.1.2.5 Sales turnover
The total sales turnover for three years ie. 1989,1990 and
1991 were recorded. These flgures were computed from
details of quantity sold and prices of the products as
reported by the different units. The average sales turnover
in both 1991 and 1990 was Rs 0.99 lakhs, while it was Rs
0.77 lakhs in 1989. See Table 4.l.G.
Table 4.l.F : Employment in Biscuits manufacturing SS! firms
(Persons)
Category Sample Std Range Mean Dev.
----------------------------------------Skilled workers 1.40 U.70 1 3
Semiskilled workers 1.80 2.86 0 8
Unskilled Workers 1.2U 1.14 0 3
Sales persons 1.2 0.92 0 3
Others 1.80 4.73 0 15 ----------------------------------------Total 7.40 7.40 3 26
89
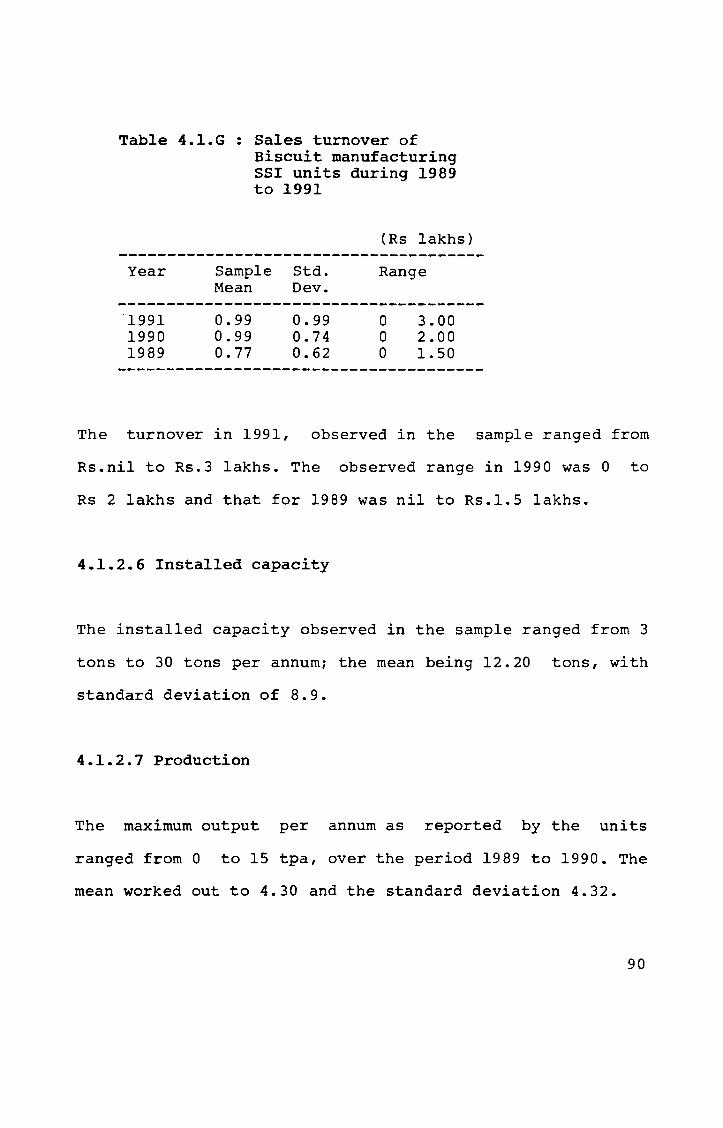
Table 4.1.G : Sales turnover of Biscuit manufacturing SSI units during 1989 to 1991
Year
1991 1990 1989
Sample Std. Mean Dev.
0.99 0.99 0.77
0.99 0.74 0.62
(Rs 1akhs)
Range
o o o
3.00 2.00 1.50
The turnover in 1991, observed in the sample ranged from
Rs.ni1 to Rs.3 1akhs. The observed range in 1990 was 0 to
Rs 2 1akhs and that for 1989 was nil to Rs.1.5 1akhs.
4.1.2.6 Installed capacity
The installed capacity observed in the sample ranged from 3
tons to 30 tons per annum; the mean being 12.20 tons, with
standard deviation of 8.9.
4.1.2.7 Production
The maximum output per annum as reported by the units
ranged from 0 to 15 tpa, over the period 1989 to 1990. The
mean worked out to 4.30 and the standard deviation 4.32.
90
4.1.2.8 Capacity utilisation
It is seen that 70% of the sample use less than 50% of
their production capacity. 20% have capacity utilisation of
50% and 10% of the firms use cent percent of installed
capacity.
4.1.2.9 Credit avai1ed
Of the sample 70% have avai1ed of some form of credit. Out
of these 60% claimed they are regular is repaying the loan.
The others are defaulters.
4.1.2.9.1 Term loan
The Term loan avai1ed by the sample units varied
to Rs 7 1akhs. 60% of the units had taken less
from Nil
than Rs.1
1akh as loan, 30% have not taken term loan and had funded
their project through own sources. The mean loan Rs.0.91
Lakhs.
91

4.1.2.9.2 Working capital loan
Of the units sampled, 80% had not availed of any working
capital loan. Considering those units that have taken
working capital loan, the average is Rs 0.30 lakhs.
4.1.2.9.3 Other loans
20% of the sample had availed of other forms of loan, the
average being Rs 10000/-.
4.1.2.9.4 Total loans
Taking into account the total loans availed, the mean works
out to Rs 1.02 lakhs, with standard deviation 2.13. The
total loans availed by the units, as observed in the sample
varies from zero to Rs 7 lakhs. 90% of the units have loans
of zero or upto Rs.l lakh. Only 10% have taken loans above
Rs.l lakh.
4.1.2.10 Brand name
Only 10% units have given brand names for their products.
90% do not have any brand names and prefer to market them
as 'bakery biscuits'.
92

4.1.2.11 Sales area of Biscuits
Upto 99% of the output of biscuits is sold within the block
by 30% of the units. 70% of the units sell their entire
produce within the block.
Of the respondents, 80% sell cent percent of their output
within the district. No one has a market outside the state.
Table 4.l.H: Sales area and volurne(Biscuits)
Area
Block
District
Neighbour District
State
% of sales in the area Nil 1 to 49 50 to 99 100
la 20 70
20 80
80 la la
100
4.1.2.12 Selling point
The nearest selling point was within 5 kms for all units.
The farthest selling point was within 5 kms for 60% of the
units, between 5 and la kms for 20% and beyond 15 km for
20% of the units.
93
4.1.3 SPICES PROCESSING SSI FIRMS
4.1.3.1 Types of organisation
Of the units sampled, 73.3% were proprietory concerns, 20%
partnership firms and 6.7% Co-operative societies.
4.1.3.2 Location
About 20% of the units were located within 10 kilometre
from the district head quatersi 73.3% between 10 and 30 kms
and 6.7% beyond 30 km.
4.1.3.3 Investments
The mean total investment in land, building, machinery,
vehicle and working capital, observed in the sample was
Rs.l.82 lakhs and the standard deviation 3.07. The range in
which the average investments fall with respect to land,
building, plant and machinery, vehicle and working capital
are shown in the Table 4.1.1
94

Table 4.1.1 : Investment in fixed
Item
Land Building Plant&Mc Vehicle working Capital
Total
assets and working capital of processed spices manufacturing units
Sample Mean
0.24 0.46 0.54 0.17 0.41
1.82
Std. Dev.
0.40 0.86 0.66 0.40 1.01
3.09
(Rs.lakhs)
Range
0.00 0.00 0.10 0.00 0.00
1.50 3.00 2.00 1.50 4.00
0.30 12.00
4.1.3.4 Employment
Table 4.l.J : Employment in processed Spices manufacturing firms
Category Sample Std. Mean Dev.
(Persons
Range
-------------------------------------Skilled workers 1.13 0.64 0 2
Semiskilled workers 2.60 6.66 0 19
Unskilled workers 2.47 3.78 0 11
Sales persons 0.73 0.80 0 2
Others 2.00 7.75 0 30
Total 8.93 10.18 1 36
95
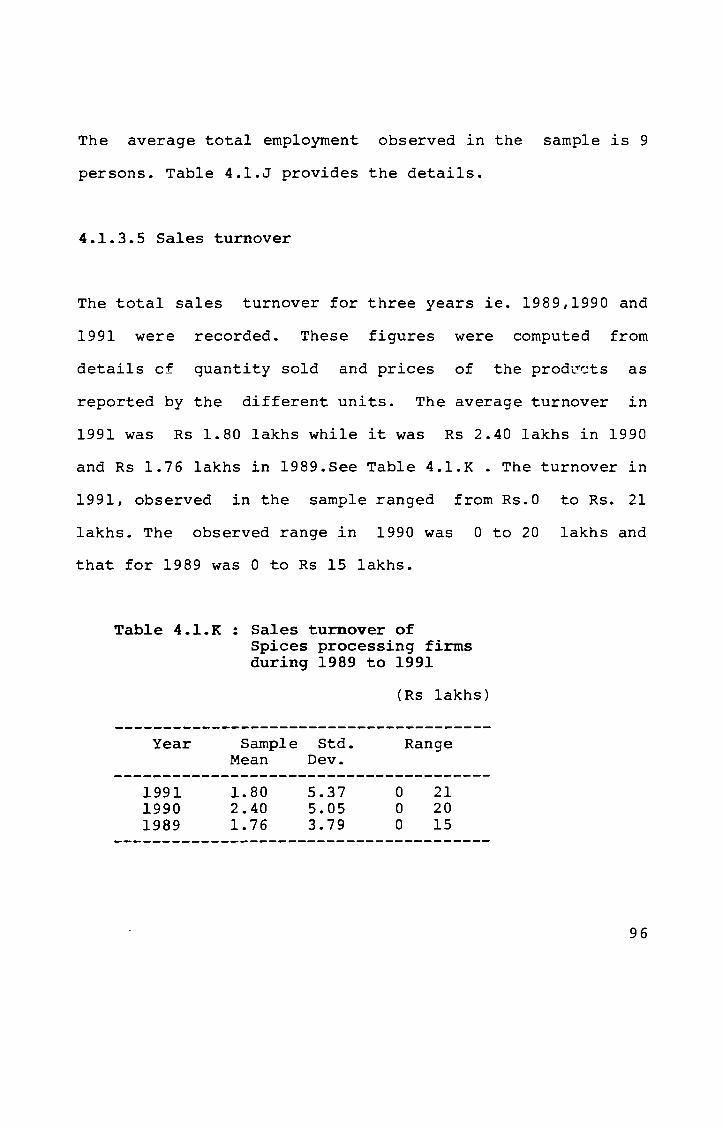
The average total employment observed in the sample is 9
persons. Table 4.1.J provides the details.
4.1.3.5 Sales turnover
The total sales turnover for three years ie. 1989,1990 and
1991 were recorded. These figures were computed from
details cf quantity sold and prices of the prod~~ts as
reported by the different units. The average turnover in
1991 was Rs 1.80 1akhs while it was Rs 2.40 1akhs in 1990
and Rs 1.76 1akhs in 1989.See Table 4.1.K . The turnover in
1991, observed in the sample ranged from Rs.O to Rs. 21
1akhs. The observed range in 1990 was 0 to 20 1akhs and
that for 1989 was 0 to Rs 15 1akhs.
Table 4.1.K : Sales turnover of Spices processing firms during 1989 to 1991
Year
1991 1990 1989
Sample Std. Mean Dev.
1.80 2.40 1.76
5.37 5.05 3.79
(Rs 1akhs)
o o o
Range
21 20 15
96
4.1.3.6 Installed capacity
The installed capacity observed in the sample ranged from 3
tons to 450 tons per annum; the mean being 80.93 tons, with
standard deviation of 134.
4.1.3.7 Production
The maximum output per annum as reported by the units
ranged from 1 to 270 tpa, over the period 1989 to 1990. The
mean worked out to 33.60 and the standard deviation 72.77.
4.1.3.8 Capacity utilisation
It is seen that 80% of the sample use less than 50% of
their production capacity. The others had output between 50
and 60% of installed capacity. None of the units had
utilised their capacity above 60%.
4.1.3.9 Credit availed
Of the sample 73.3% have avai1ed of some form of credit.
Out of these 45.45% claimed they are regular is repaying
the loan. The others are defaulters.
97
4.1.3.9.1 Term loan
The Term loan availed by the sample units varied from Nil 1
to Rs.l lakh. 93.3% of the units had taken less than Rs.l
lakhs as loan, 46.7% have not taken term loan and had
funded their project through own sources. The average loan
taken is Rs.0.35 lakhs.
4.1.3.9.2 Working capital loan
Of the units sampled, 86% had not availed of any working
capital loan. Considering those units that have taken
working capital loan, the average is Rs 0.40 lakhs.
4.1.3.9.3 Other loans
It is seen that 12.5% of the sample had taken other loans,
the average being Rs.25000/-.
4.1.3.9.4 Total loans
Taking into account the total loans availed, the mean works
out to Rs 0.28 lakhs, with standard deviation of
0.37. The total loans availed by the units, as observed in
the sample, varies from zero to Rs 1.2 lakhs.93.3% of the
98
units have loans of zero or upto Rs 1 1akhs. Only 6.7% have
taken loans above Rs 1 1akh.
4.1.3.10 Brand name
Of the sampled units, 60% have given Brand names to their
products.
4.1.3.11 Sales area
Considering the area in which sales are carried out 20%
units sell between 33.3% and 46.7% of their output within
the block. Another 13.3% sell a portion of their output
outside the district of Eranaku1am.Whi1e 93.3% sell within
the state only, 6.7% units have export market.
Table 4.1.L : Sales area and volume (processed Spices)
Area % of sales in the area Nil 1 to 49 50 to 99 100
---------------------------------------------Block 00.0 20.0 33.3 46.7
Ta1uk 00.0 6.7 33.3 60.0
District 00.0 00.0 20.0 80.0
Neighbour district 86.7 13.3 00.0 00.0
state 00.0 00.0 6.7 93.3
export 93.3 6.7 00.0 00.0 ---------------------------------------------
99
80% of the firms sell cent percent of their output within
the district. About 13.3% of the firms have made entries
into neighbouring districts. About 7% of the firms are
exporting their products.
4.1.3.12 Selling point
The nearest selling point was within 5 km for 93.3% of the
units, and within 10 km for the others. The farthest
selling point was within 5 km for 26.7% of the units,
between 5 and 15 kms for 40% and beyond 15 km for 33.3% of
the units.This last category also include the firms that
are exporting.
4.1.4 PICKLES MANUFACTURING SSI FIRMS
4.1.4.1 Types of organisation
From the sample, 75% were proprietory concerns and 25%
partnership firms.
4.1.4.2 Location
With reference to location, 50% of the units were located
within 10 kilometre from the district head quarters; 25%
between 10 and 30 kms and 25% beyond 30 km.
100
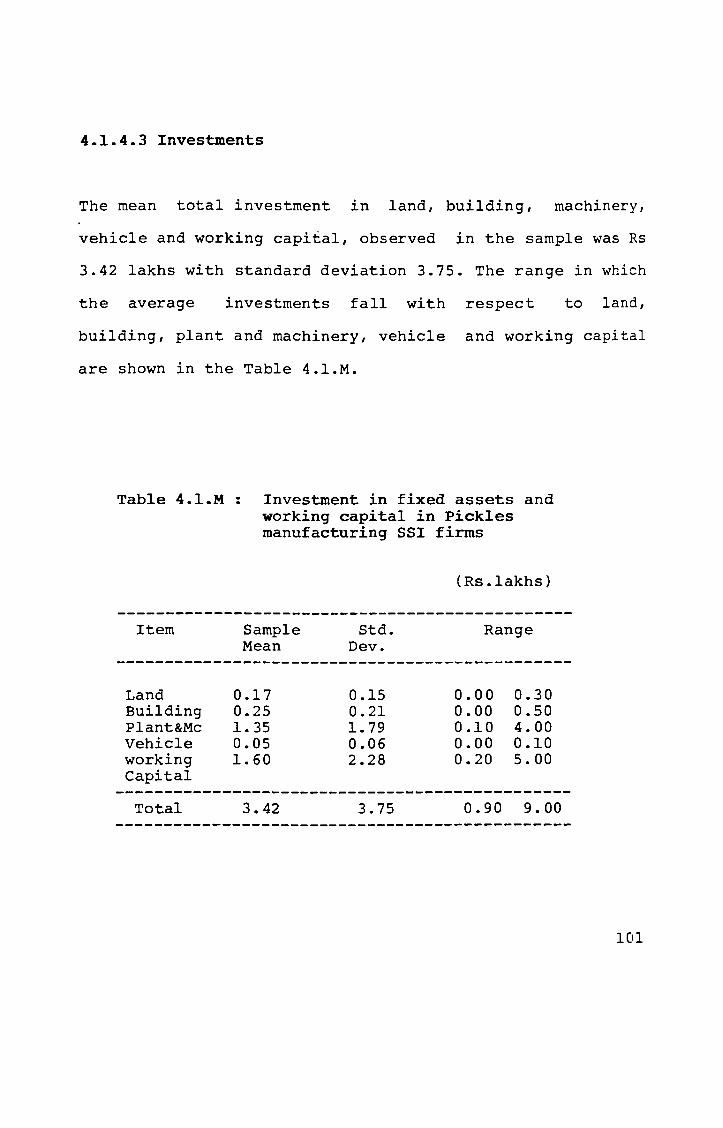
4.1.4.3 Investments
The mean total investment in land, building, machinery,
vehicle and working capital, observed in the sample was Rs
3.42 lakhs with standard deviation 3.75. The range in which
the average investments fall with respect to land,
building, plant and machinery, vehicle and working capital
are shown in the Table 4.1.M.
Table 4.l.M: Investment in fixed assets and working capital in Pickles manufacturing SSI firms
Item
Land Building Plant&Mc Vehicle working Capital
Total
Sample Mean
0.17 0.25 1.35 0.05 1.60
3.42
Std. Dev.
0.15 0.21 1.79 0.06 2.28
3.75
(Rs.lakhs)
Range
0.00 0.00 0.10 0.00 0.20
0.30 0.50 4.00 0.10 5.00
0.90 9.00
101

4.1.4.4 Employment
Table 4.1.N : Employment in Spices manufacturing firms
Category Sample Std. Mean Dev.
(in Persons
Range
-----------------------------------------Skilled workers 5.25 6.13 1 14
Semiskilled workers
Unskilled workers 2.50 2.38 0 5
Sales persons 3.25 2.87 1 7
others 18.75 31.19 0 65
Total 29.75 38.63 3 86
The average total employment observed in the sample is 30
persons. The 'others' include persons employed on casual
basis especially during season, when raw material is
available in plenty and bulk procurement and production is
effected. If this group is not included the mean employment
would be 11 with standard deviation of 8.12
102

4.1.4.5 Sales turnover
The total sales turnover for three years ie. 1989,1990 and
1991 were recorded. These figures were computed from
details of quantity sold and prices of the products as
reported by the different units. The average turnover in
1991 was Rs.6 lakhs, while it was Rs 5.80 lakhs in 1989.See
Table 4.1.0. The turnover in 1991, observed in the sample
ranged from Rs 0 to Rs 23 lakhs. The observed range in 1990
was 0.60 to 22 lakhs and that for 1989 was 0.60 to Rs 18.0
lakhs.
Table 4.1.0: Sales turnover of
Year
1991 1990 1989
Pickles manufacturing firms during 1989 to 1991
Sample Std mean dev
6.00 6.95 5.80
11.34 10.17
8.26
(Rs lakhs)
Range
o 0.60 0.60
23 22 18
4.1.4.6 Installed capacity
The installed capacity observed in the sample ranged from 6
tons to 250 tons per annum; the mean being 75.50 tons, with
standard deviation of 116.95.
103
4.1.4.7 Productivity
The maximum output per annum as reported by the units
ranged from 1 to 150 tpa, over the period 1989 to 1990. The
mean worked out to 43.0 and the standard deviation 71.57.
4.1.4.8 Capacity utilisation
It is seen that 50% of the sample use less than 50% of
their production capacity. 50% have capacity utilisation
above 50% of which 25% of the firms use cent percent of
installed capacity.
4.1.4.9 Credit avai1ed
All the units have availed of loans of which 75% claim they
are regular in repaying the same. The others are
defaulters.
4.1.4.9.1 Term loan
The Term loan availed by the sample units varied from Nil
to RsO.80 lakhs. 50% of the units had taken less than Rs.l
lakhs as loan, 50% have not taken term loan and had funded
104
their project through own sources. The mean loan is Rs 0.40
lakhs.
4.1.4.9.2 Working capital loan
Of the units sampled, 50% had not availed of any
capital loan. Considering those units that have
working capital loan, the average is Rs 0.35 lakhs.
4.1.4.9.3 Other loans
working
taken
Of the sample, 25% had taken other loans, including support
for export.
4.1.4.9.4 Total loans
The mean of total loan availed is Rs 1.52 lakhs. 50% of the
units have availed less than Rs 1 lakhs loan.
4.-1.4.10 Brand name
Of the sampled units, 75% have given brand names to their
products.
105
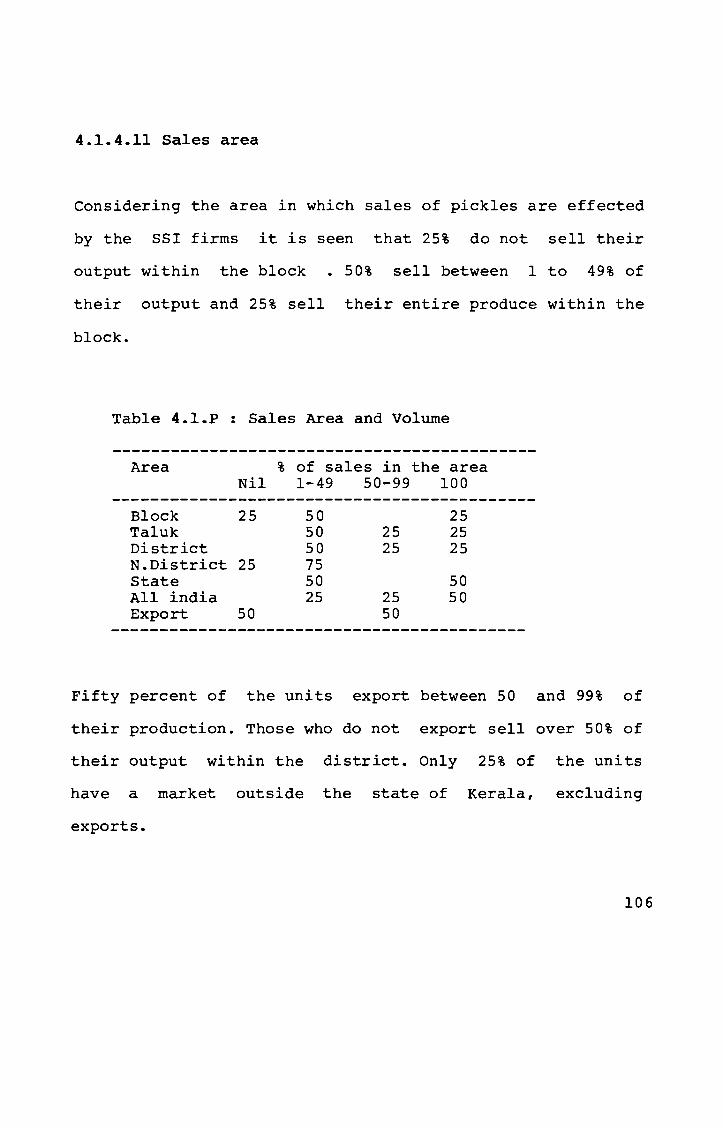
4.1.4.11 Sales area
Considering the area in which sales of pickles are effected
by the SSI firms it is seen that 25% do not sell their
output within the block • 50% sell between 1 to 49% of
their output and 25% sell their entire produce within the
block.
Table 4.l.P : Sales Area and Volume
Area
Block Taluk District N.District State All india Export
% of sales in the area Nil 1-49 50-99 100
25 50 25 50 25 25 50 25 25
25 75 50 50 25 25 50
50 50 -------------------------------------------
Fifty percent of the units export between 50 and 99% of
their production. Those who do not export sell over 50% of
their output within the district. Only 25% of the units
have a market outside the state of Kerala, excluding
exports.
106
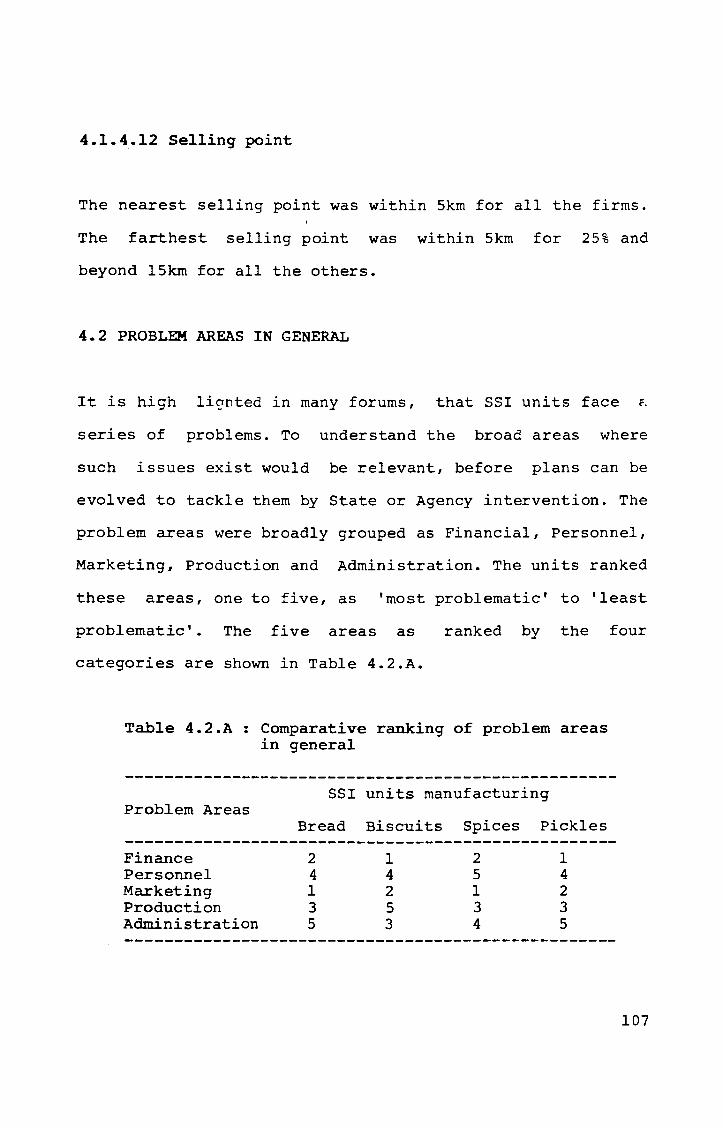
4.1.4.12 Selling point
The nearest selling point was within 5km for all the firms.
The farthest selling point was within 5km for 25% and
beyond l5km for all the others.
4.2 PROBLEM AREAS IN GENERAL
It is high li~nted in many forums, that SSI units face f.
series of problems. To understand the broad areas where
such issues exist would be relevant, before plans can be
evolved to tackle them by State or Agency intervention. The
problem areas were broadly grouped as Financial, Personnel,
Marketing, Production and Administration. The units ranked
these areas, one to five, as 'most problematic' to 'least
problematic'. The five areas as ranked by the four
categories are shown in Table 4.2.A.
Table 4.2.A
Problem Areas
Finance Personnel Marketing Production Administration
Comparative ranking of problem areas in general
SSI units manufacturing
Bread Biscuits Spices Pickles
2 1 2 1 4 4 5 4 1 2 1 2 3 5 3 3 5 3 4 5
107
Finance and Marketing are stated to be the areas where SSI
units face most problems. Marketing is the most problematic
area for Bread and Spices while Finance is ranked first for
Biscuits and Pickles units. See Table 4.2.A. Production is
the third most problematic area for all the products except
biscuits, where it is the least problematic area.
Interestingly Personnel is reported as offering low levels
of issues by all product groups. Obviously for these
categories, labour is not the major problem area.
Even Administration is stated as less problematic. The fact
that promoters look after their own units provides
little room for concern, as when compared to a wider
administrative structure involving more number of persons
as in the case of larger firms.
4.2.1 PROBLEM AREAS OF BREAD MANUFACTURING SSI UNITS
Table 4.2.B shows the ranking of these areas by the bread
manufacturing SSI units.
108

Table 4.2.B : Ranking of Problem areas by SSI units manufacturing Bread
Problem Areas
Finance Personnel Marketing Production Administration
Total
Ranks (showing % response) 12345
18.8 18.8 43.7
6.2 12.5
37.5 6.2
37.5 18.8
25.0 6.2
12.5 43.8 12.5
12.5 31.3
12.5 43.7
6.2 37.5 6.2
18.8 31.3
100.0 100.0 100.0 100.0 100.0
Score
350.2 237.5 412.2 281.4 218.7
Assuming a weightage of 5,4,3,2 and 1 for ranks 1 to 5
respectively, the five areas can be listed in the order
most problematic to least problematic as shown below:
1. Marketing
2. Finance
3. Production
4. Personnel
5. Admini stration
4.2.2 PROBLEM AREAS OF BISCUIT MANUFACTURING SSI UNITS
Assuming a weightage of 5,4,3,2 and 1 for ranks 1 to 5
respectively, the five areas can be listed in the order
most problematic to least problematic as shown below:
109
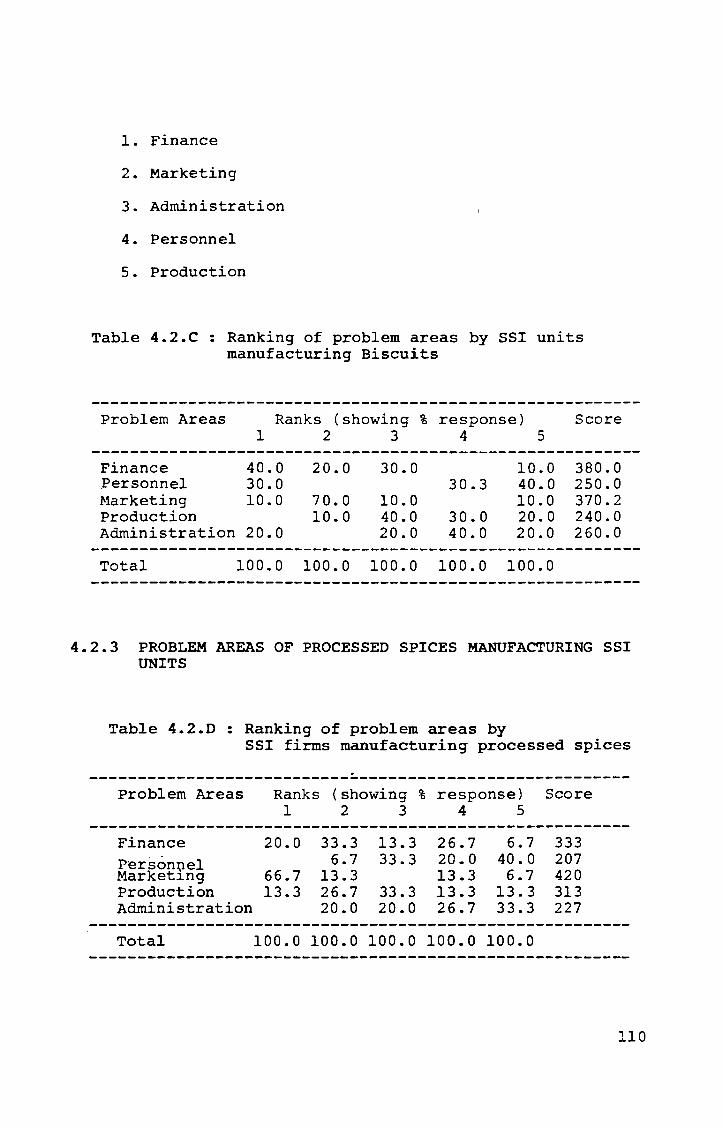
1. Finance
2. Marketing
3. Administration
4. Personnel
5. Production
Table 4.2.C : Ranking of problem areas by SSI units manufacturing Biscuits
Problem Areas Ranks (showing % response) Score 1 2 3 4 5
---------------------------------------------------------Finance 40.0 20.0 30.0 10.0 380.0 Personnel 30.0 30.3 40.0 250.0 r.1arketing 10.0 70.0 10.0 10.0 370.2 Production 10.0 40.0 30.0 20.0 240.0 Administration 20.0 20.0 40.0 20.0 260.0
Total 100.0 100.0 100.0 100.0 100.0
4.2.3 PROBLEM AREAS OF PROCESSED SPICES MANUFACTURING SSI UNITS
Table 4.2.0 : Ranking of problem areas by SSI firms manufacturing processed spices
Problem Areas Ranks (showing % response) Score 1 2 3 4 5
--------------------------------------------------------Finance 20.0 33.3 13.3 26.7 6.7 333 Persont:le1 6.7 33.3 20.0 40.0 207 Marketlng 66.7 13.3 13.3 6.7 420 Production 13.3 26.7 33.3 13.3 13.3 313 Administration 20.0 20.0 26.7 33.3 227
Total 100.0 100.0 100.0 100.0 100.0
110
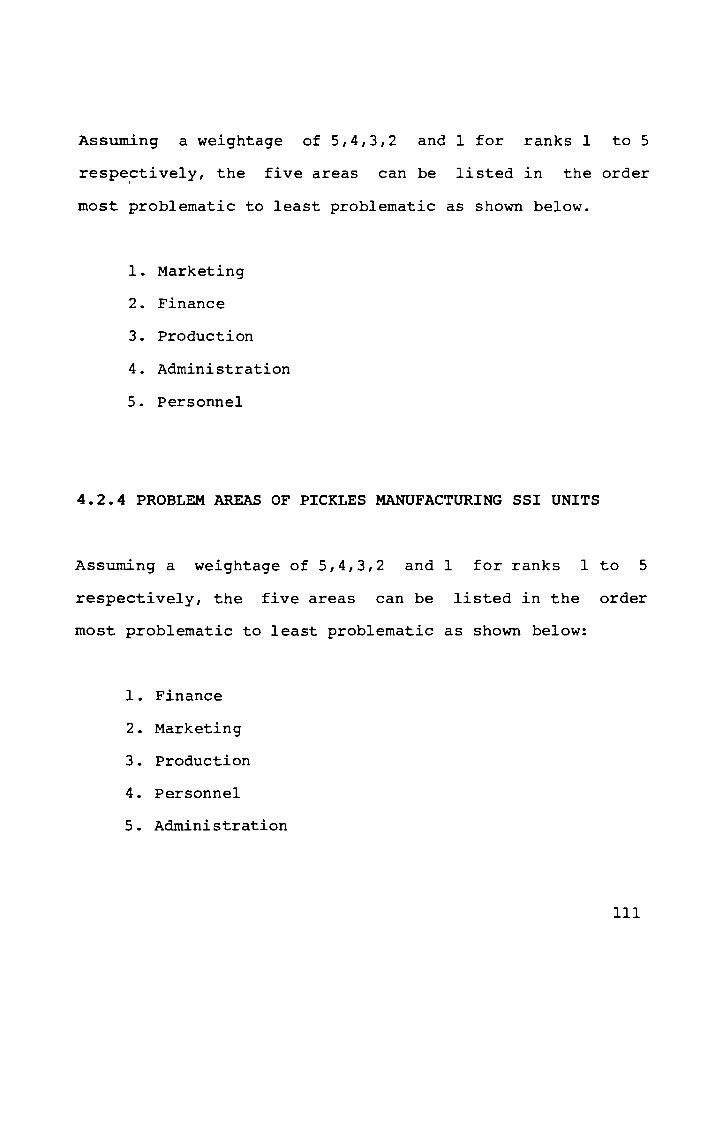
Assuming a weightage of 5,4,3,2 and 1 for ranks 1 to 5
respe~tively, the five areas can be listed in the order
most problematic to least problematic as shown below.
1. Marketing
2. Finance
3. Production
4. Administration
5. Personnel
4.2.4 PROBLEM AREAS OF PICKLES MANUFACTURING SSI UNITS
Assuming a weightage of 5,4,3,2 and 1 for ranks 1 to 5
respectively, the five areas can be listed in the order
most problematic to least problematic as shown below:
1. Finance
2. Marketing
3. Production
4. Personnel
5. Administration
III
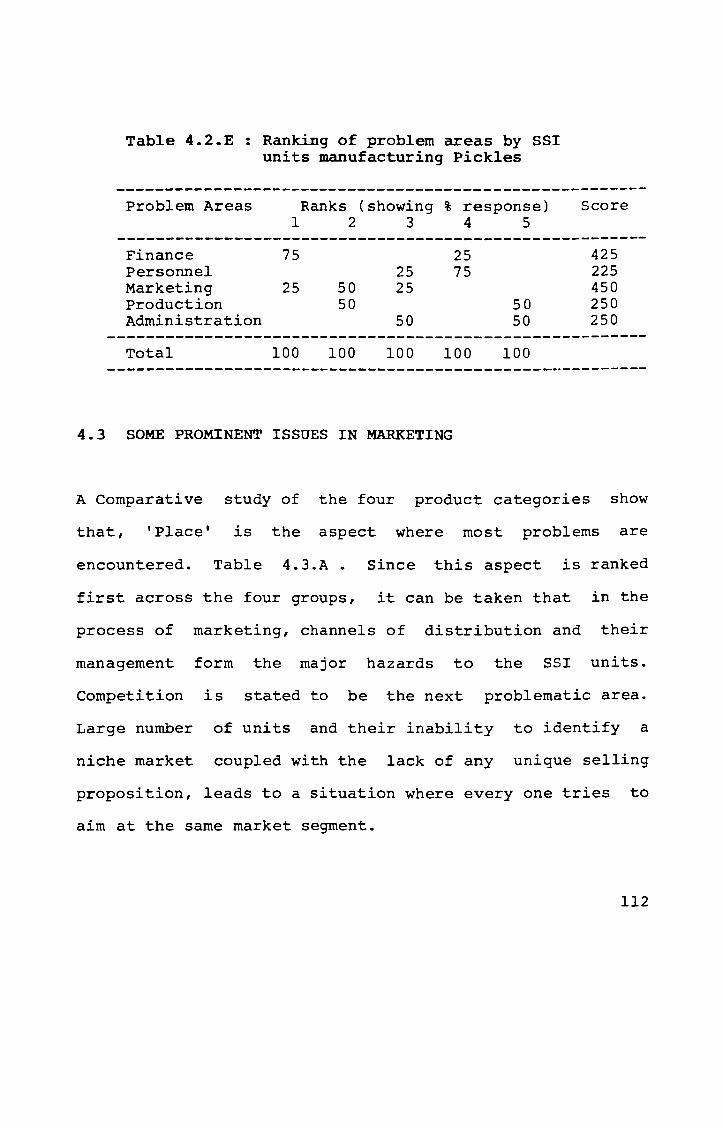
Table 4.2.E : Ranking of problem areas by SSI units manufacturing Pickles
-------------------------------------------------------Problem Areas Ranks (showing % response) Score
1 2 345 -------------------------------------------------------Finance 75 25 Personnel 25 75 Marketing 25 50 25 Production 50 Administration 50
Total 100 100 100 100
4.3 SOME PROMINENT ISSUES IN MARKETING
50 50
100
425 225 450 250 250
A Comparative study of the four product categories show
that, 'Place' is the aspect where most problems are
encountered. Table 4.3.A. Since this aspect is ranked
first across the four groups, it can be taken that in the
process of marketing, channels of distribution and their
management form the major hazards to the SSI units.
Competition is stated to be the next problematic area.
Large number of units and their inability to identify a
niche market coupled with the lack of any unique selling
proposition, leads to a situation where everyone tries to
aim at the same market segment.
112

Deciding on the price appears to be the third difficult
area, except in the case of pickles where it comes as
fourth. In the case of pickles, promotion is the third
major problematic area. In the case of biscu1ts, the
'product' is also rated as a problem aspect along with
pricing, at the third slot.
Table 4.3.A Comparative ranking of problem areas in Marketing
----------------------------------------BRD BIS SPI PlC
----------------------------------------Product 5 3 5 6 Price 3 3 3 4 Place 1 1 1 1 Promotion 7 6 6 3 Competition 2 2 2 2 Consumers 4 7 4 7 Government 6 5 7 5
4.3.1 MARKETING ISSUES RELEVANT TO BREAD MANUFACTURING SSI FIRMS
4.3.1.0 Shelf-life of Bread
According to the respondents, bread manufactured by them
has a mean shelf-life of 3.88 days. The range was reported
as 2 to 7 days with standard deviation of 1.63.
113
4.3.1.1 Problem areas in marketing Bread
Seven areas with references to marketing were listed and
the promotors of the units ranked them according to their
experience; 'most problematic' to 'least problematic'.
Assuming a weightage of 7,6,5,4,3,2 and 1 for ranks, one to
seven respectively, these seven areas can be listed in the
order - most problematic to least problematic.
1. Place
2. Competition
3. Price
4. Consumers
5. Product
6. Government
7. Promotion
It is observed that the bread manufacturing SSI firms face
most difficulty in the area of distribution. Competition,
due to the existence of a number of similar units, is seen
to be the next most problematic area. This is followed by
problems related to pricing. The fluctuations in prices of
raw materials, has affected the SSI units, since they are
unable to refix the prices of their products frequently.
114
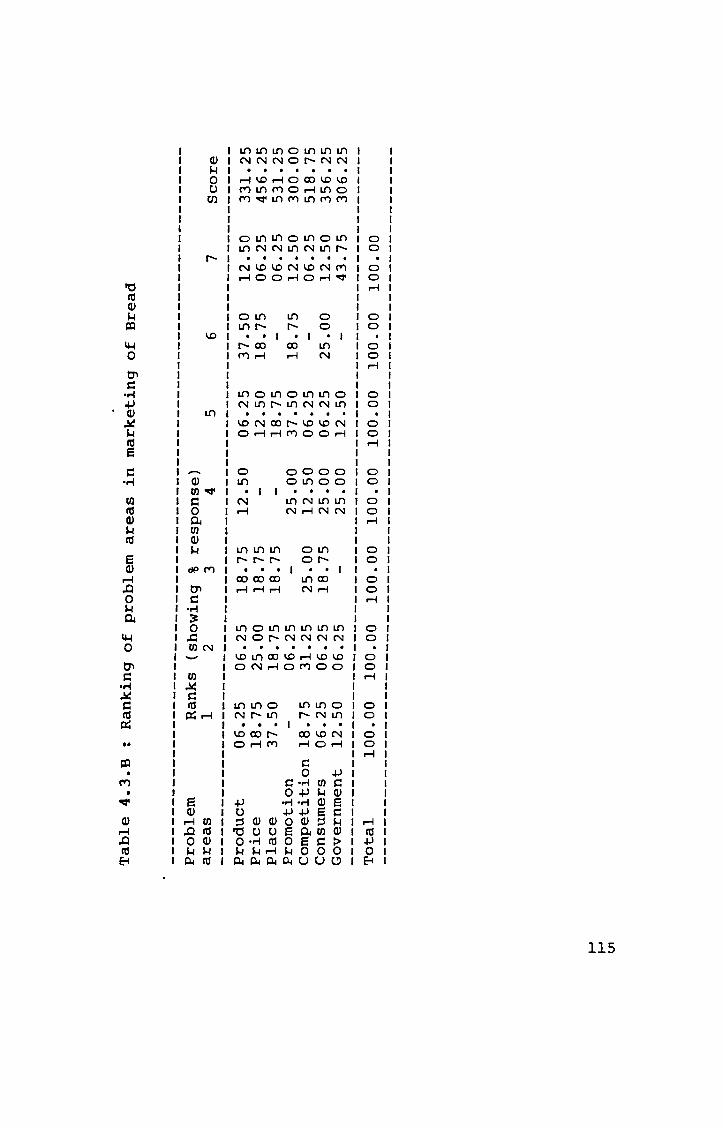
I-'
I-'
Ut
Tab
le 4
.3.B
:
Ran
kin
g o
f p
rob
lem
are
as in
m
ark
eti
ng
o
f B
read
----
----
----
----
----
----
----
----
----
----
----
----
----
----
----
----
----
----
--P
rob
lem
R
ank
s (s
ho
win
g
% r
esp
on
se)
are
as
1 2
3 4
5 6
7 S
co
re
----
----
----
----
----
----
----
----
----
----
----
----
----
----
----
----
----
----
--P
rod
uct
06
.25
0
6.2
5
18
.75
1
2.5
0
06
.25
3
7.5
0
12
.50
3
31
.25
P
rice
18
.75
2
5.0
0
18
.75
1
2.5
0
18
.75
0
6.2
5
45
6.2
5
Pla
ce
37
.50
1
8.7
5
18
.75
1
8.7
5
06
.25
5
31
.25
P
rom
oti
on
0
6.2
5
25
.00
3
7.5
0
18
.75
1
2.5
0
30
0.0
0
Co
mp
eti
tio
n 1
8.7
5
31
.25
2
5.0
0
12
.50
0
6.2
5
06
.25
5
18
.75
C
on
sum
ers
06
.25
0
6.2
5
18
.75
2
5.0
0
06
.25
2
5.0
0
12
.50
3
56
.25
G
ov
ern
men
t 1
2.5
0
06
.25
2
5.0
0
12
.50
4
3.7
5
30
6.2
5
----
----
----
----
----
----
----
----
----
----
----
----
----
----
----
----
----
----
--T
ota
l 1
00
.00
1
00
.00
1
00
.00
1
00
.00
1
00
.00
1
00
.00
1
00
.00
--
----
----
----
----
----
----
----
----
----
----
----
----
----
----
----
----
----
----
Promotion appears to be the least problematic area,
possibly because these small units do not spare much effort
in this direction. In the sample only 37.5%'units use some
method of promotion. Even these are restricted to efforts
when the products were first launched. A few slides in
local theaters, notices distributed
newspapers and a few banners form
promotional efforts.
along with
almost all of
the
the
4.3.1.2 Significant factors in marketing of Bread
The marketing experiences of the SSI units would have
caused them to identify some critical factors that can
influence their performance. Some of these factors were
rated by the respondents. The importance of each factor was
marked as 'Extremely High',
Low'or 'Not Relevant'.
'High' ,
4.3.1.2.1 Product related factors
'Low' , 'Extremely
Quality of the product is stated by all the sampled units
as having high or extremely high significance. Though
quality may have varied dimensions, here the product being
a food product, quality is taken as refering to taste and
edibility, by the units.
116 .
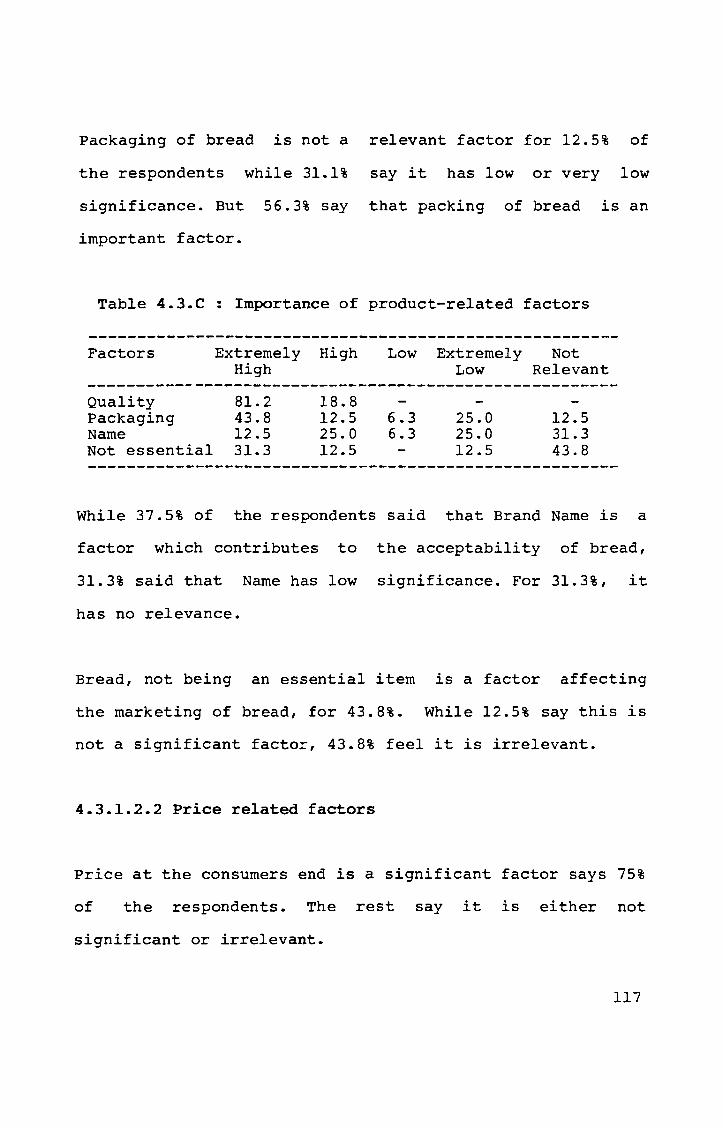
Packaging of bread is not a relevant factor for 12.5% of
the respondents while 31.1% say it has low or very low
significance. But 56.3% say that packing of bread is an
important factor.
Table 4.3.C : Importance of product-related factors
Factors
Quality Packaging Name Not essential
Extremely High High
81.2 43.8 12.5 31.3
18.8 12.5 25.0 12.5
Low Extremely Not
6.3 6.3
Low Relevant
25.0 25.0 12.5
12.5 31.3 43.8
While 37.5% of the respondents said that Brand Name is a
factor which contributes to the acceptability of bread,
31.3% said that Name has low significance. For 31.3%, it
has no relevance.
Bread, not being an essential item is a factor affecting
the marketing of bread, for 43.8%. While 12.5% say this is
not a significant factor, 43.8% feel it is irrelevant.
4.3.1.2.2 Price related factors
Price at the consumers end is a significant factor says 75%
of the respondents. The rest say it is either not
significant or irrelevant.
117
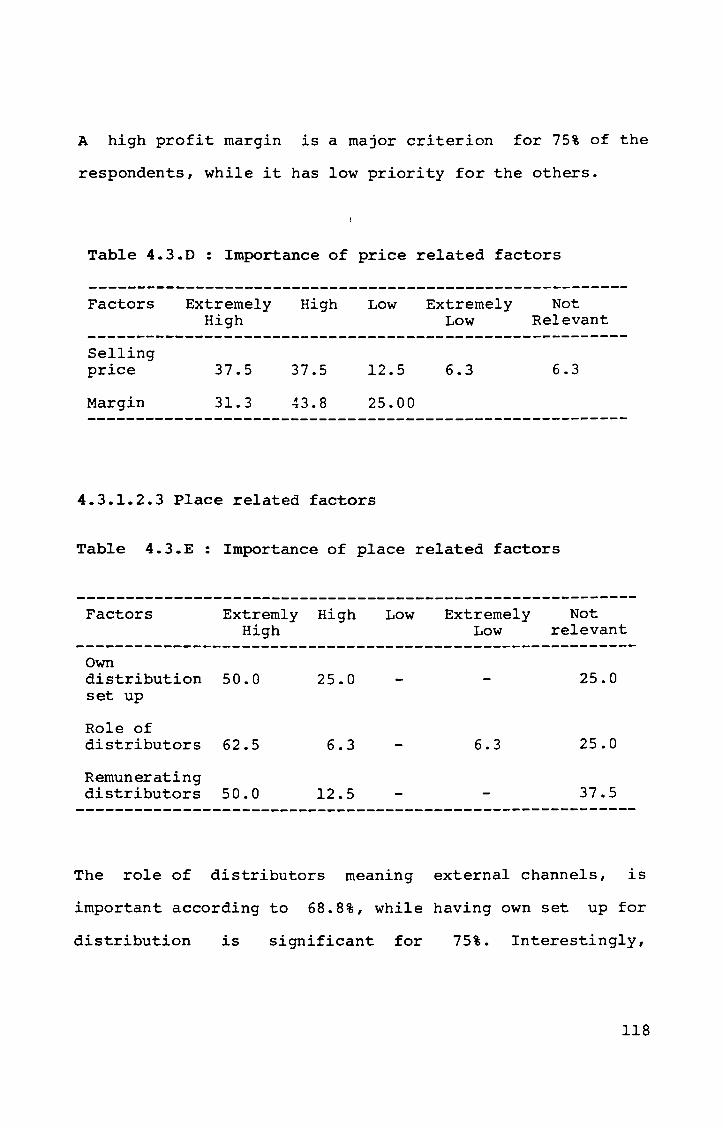
A high profit margin is a major criterion for 75% of the
respondents, while it has low priority for the others.
Table 4.3.D : Importance of price related factors
Factors
Selling price
Margin
Extremely High
37.5
31.3
High Low
37.5 12.5
43.8 25.00
4.3.1.2.3 Place related factors
Extremely Not Low Relevant
6.3 6.3
Table 4.3.E: Importance of place related factors
Factors Low Extremely Not Extremly High High Low relevant
Own distribution 50.0 set up
Role of distributors 62.5
Remunerating distributors 50.0
25.0 25.0
6.3 6.3 25.0
12.5 37.5 ----------------------------------------------------------
The role of distributors meaning external channels, is
important according to 68.8%, while having own set up for
distribution is significant for 75%. Interestingly,
118
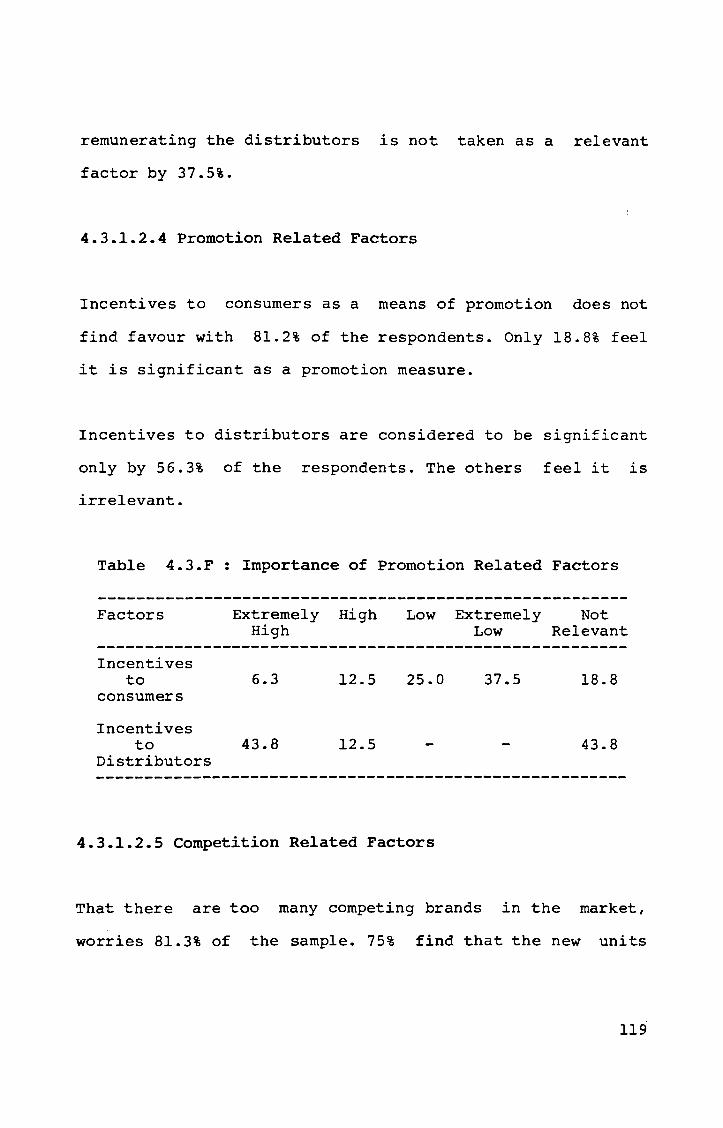
remunerating the distributors is not taken as a relevant
factor by 37.5%.
4.3.1.2.4 Promotion Related Factors
Incentives to consumers as a means of promotion does not
find favour with 81.2% of the respondents. Only 18.8% feel
it is significant as a promotion measure.
Incentives to distributors are considered to be significant
only by 56.3% of the respondents. The others feel it is
irrelevant.
Table 4.3.F: Importance of Promotion Related Factors
Factors Low Extremely Not Extremely High High Low Relevant
Incentives to
consumers
Incentives to
Distributors
6.3
43.8
12.5 25.0
12.5
4.3.1.2.5 Competition Related Factors
37.5 18.8
43.8
That there are too many competing brands in the market,
worries 81.3% of the sample. 75% find that the new units
119
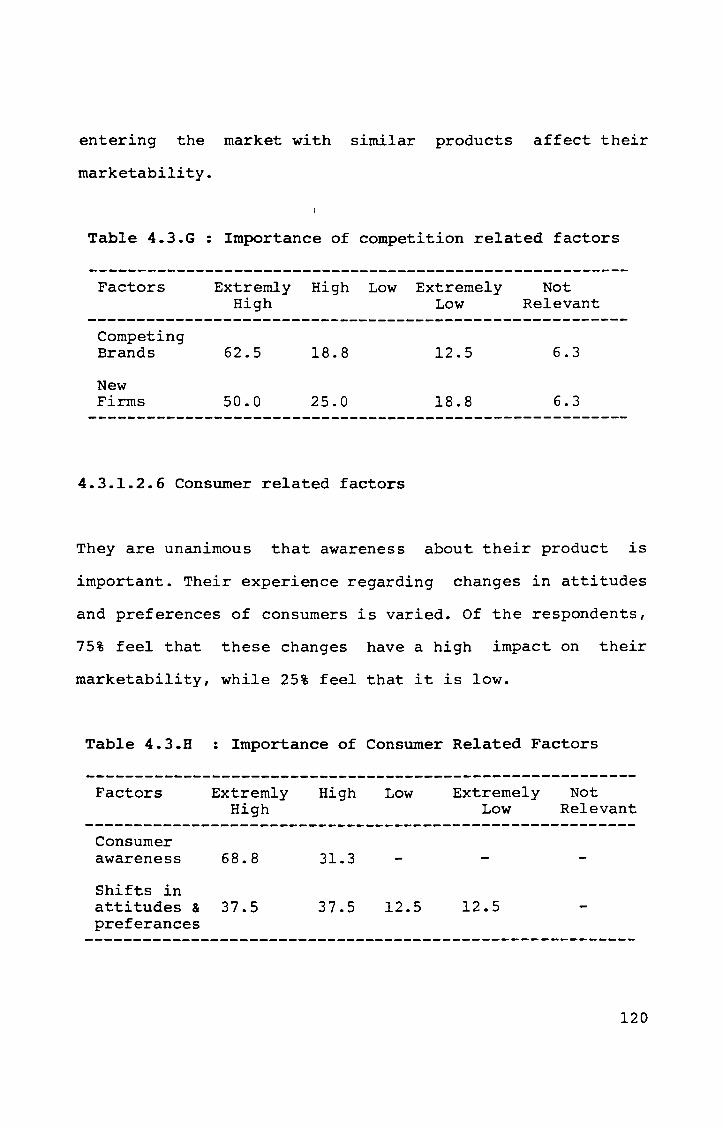
entering the market with similar products affect their
marketability.
Table 4.3.G : Importance of competition related factors
Factors
Competing Brands
New Firms
Extremly High
62.5
50.0
High Low Extremely Not Low Relevant
18.8 12.5 6.3
25.0 18.8 6.3
4.3.1.2.6 Consumer related factors
They are unanimous that awareness about their product is
important. Their experience regarding changes in attitudes
and preferences of consumers is varied. Of the respondents,
75% feel that these changes have a high impact on their
marketability, while 25% feel that it is low.
Table 4.3.H : Importance of Consumer Related Factors
Factors
Consumer awareness
Extremly High
68.8
Shifts in attitudes & 37.5 preferances
High
31.3
37.5
Low
12.5
Extremely Low
12.5
Not Relevant
120
4.3.1.2.7 Government related factors
with reference to the significance of support from the
Government in marketing operations, 37.5% feel it is
important. 25% feel it is not so significant. But 37.5%
feel it is not relevent. Every respondent said that there
has not been any concentrated effort from the Government to
help them in marketing.
A few mentioned some elements of the regulatory mechanisms
which in effect cause serious hazards to the marketability
of the product.
4.3.2 MARKETING ISSUES RELEVANT TO BISCUITS MANUFACTURING
SSI UNITS
4.3.2.0 Shelf-life of Biscuits
According to the
manufactured by them
respondents, biscuits
have a mean shelf-life
which are
of 30.9 days.
The range was 14 to 60 days and standard deviation 11.42.
12i
4.3.2.1 Problem areas in marketing of Biscuits
Seven areas with references to marketing were listed and
the units ranked them according to their experience; most
problematic to least problematic.
Assuming a weightage of 7,6,5,4,3,2 and 1 for ranks 1 to 7
respectiveiY, these seven areas can be listed in the order
"most problematic" to "least problematic".
1. Place
2. Competition
3. Product
4. Price
5. Government
6. Promotion
7. Consumers
It is observed that the SSI firms manufacturing biscuits
face most difficulty in the area of distribution.
Competion, due to large number of similar units, is seen to
be the next most problematic area. This is followed by
problems related to the product and pricing.
122
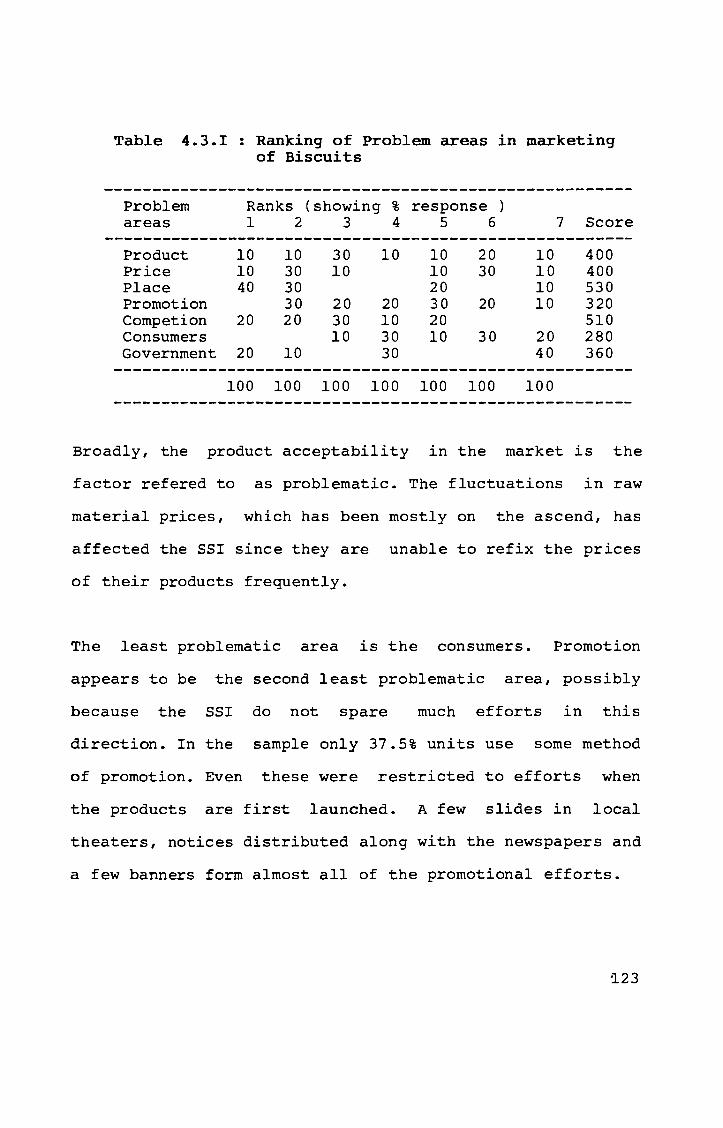
Table 4.3.1 Ranking of Problem areas in marketing of Biscuits
-------------------------------------------------------Problem Ranks (showing % response )
areas 1 2 3 4 5 6 7 Score -------------------------------------------------------
Product 10 10 30 10 10 20 10 400 Price 10 30 10 10 30 10 400 Place 40 30 20 10 530 Promotion 30 20 20 30 20 10 320 Competion 20 20 30 10 20 510 Consumers 10 30 10 30 20 280 Government 20 10 30 40 360
100 100 100 100 100 100 100
Broadly, the product acceptability in the market is the
factor refered to as problematic. The fluctuations in raw
material prices, which has been mostly on the ascend, has
affected the SSI since they are unable to re fix the prices
of their products frequently.
The least problematic area is the consumers. Promotion
appears to be the second least problematic area, possibly
because the SSI do not spare much efforts in this
direction. In the sample only 37.5% units use some method
of promotion. Even these were restricted to efforts when
the products are first launched. A few slides in local
theaters, notices distributed along with the newspapers and
a few banners form almost all of the promotional efforts.
:123
4.3.2.2 Significant factors in marketing of Biscuits
The marketing experiences of the SSI units would have
caused them to identify some critical factors that can
influence their performance. Some of these factors were
rated by the respondents. The importance of each factor was
marked as 'Extremely High', 'High' ,'Low',
or 'Not Relevant'.
4.3.2.2.1 Product related factors
'Extremelv Low'
Quality of the biscuits is stated by all the sampled units
as having high or extremely high significance in its
marketing. Though quality may have varied dimensions, here
the product being a food product, quality is taken as
refering to taste and edibility.
Packaging of biscuits is not a relevant factor for 10% of
the respondents while 40% say it has low or very low
significance. But 50% say packing of the product is
important.
124
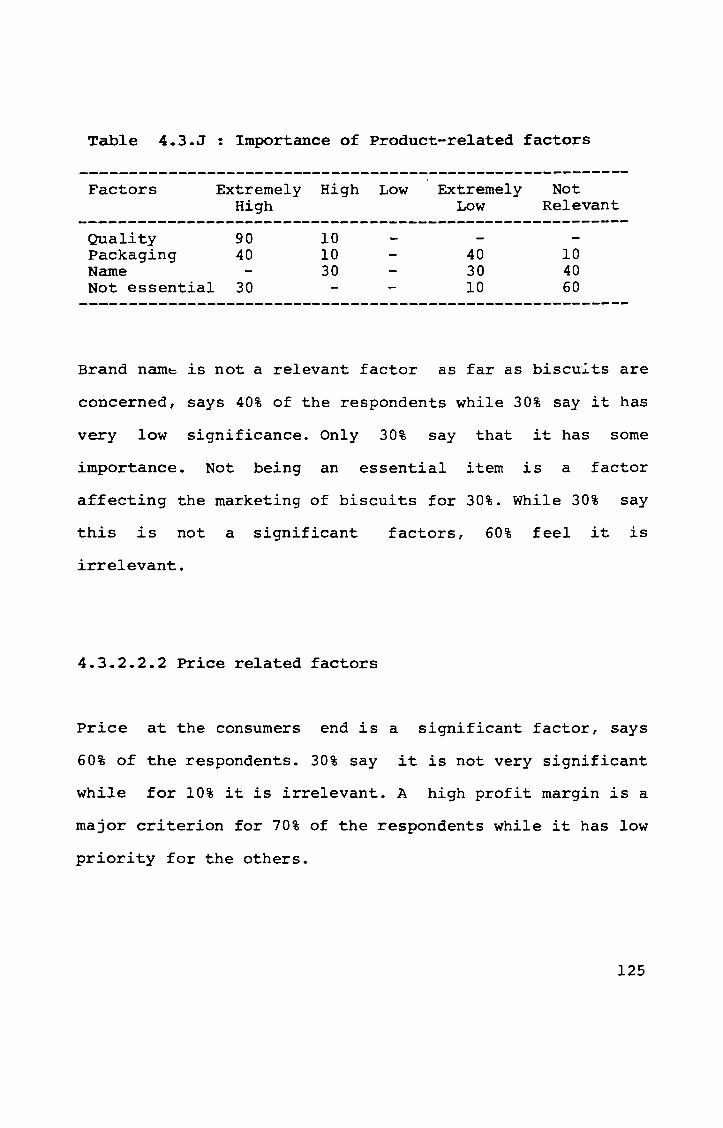
Table 4.3.J: Importance of Product-related factors
Factors Extremely High Low High
Quality 90 Packaging 40 Name Not essential 30
10 10 30
Extremely Low
40 30 10
Not Relevant
10 40 60
Brand name is not a relevant factor as far as biscu";'ts are
concerned, says 40% of the respondents while 30% say it has
very low significance. Only 30% say that it has some
importance. Not being an essential item is a factor
affecting the marketing of biscuits for 30%. While 30% say
this is not a significant factors, 60% feel it is
irrelevant.
4.3.2.2.2 Price related factors
Price at the consumers end is a significant factor, says
60% of the respondents. 30% say it is not very significant
while for 10% it is irrelevant. A high profit margin is a
major criterion for 70% of the respondents while it has low
priority for the others.
125
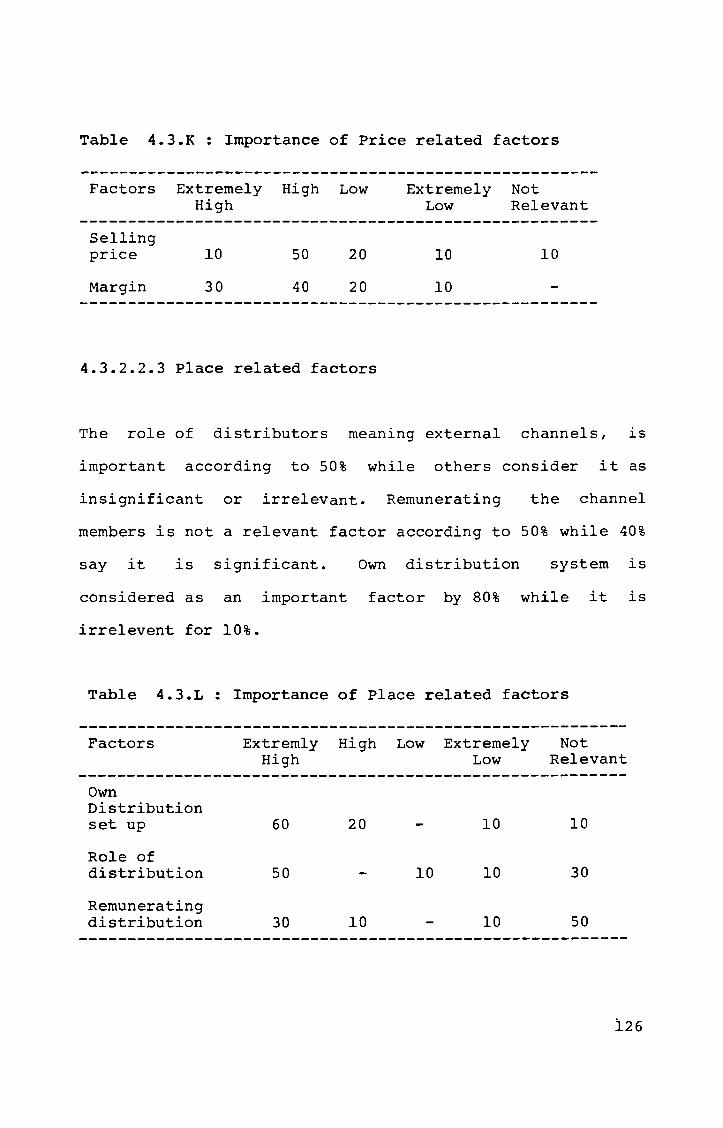
Table 4.3.K: Importance of Price related factors
Factors Extremely High Low High
Extremely Not Low Relevant
Selling price
Margin
10
30
50 20
40 20
4.3.2.2.3 Place related factors
10 10
10
The role of distributors meaning external channels, is
important according to 50% while others consider it as
insignificant or irrelevant. Remunerating the channel
members is not a relevant factor according to 50% while 40%
say it is significant. Own distribution system is
considered as an important factor by 80% while it is
irrelevent for 10%.
Table 4.3.L: Importance of Place related factors
Factors
Own Distribution set up
Role of distribution
Remunerating distribution
Extremly High
60
50
30
High Low Extremely Low
20 10
10 10
10 10
Not Relevant
10
30
50
126

4.3.2.2.4 Promotion related factors
Incentives to consumers as a means of promotion does not
find favour with 60% of the respondents. Only 40% feel it
is significant as a promotion measure. Incentives to
distributors are considered to be significant only by 40%
of the respondents. While 10% feel it has extremely low
significance the other 50% feel it is irrelevant.
Table 4.3.M: Importance of Promotion related factors
Factors High Low Extremely Not Extremly High Low Relevant
Incentives to consumers
Incentives to Distributors
20.0
30.0
20.0 30.0
10.0
4.3.2.2.5 Competition related factors
30.0
10.0 50.0
That there are too many competing brands in the market
worries 80% of the sample. 70% find that the new units
entering the market with similar products affect their
marketability.
127
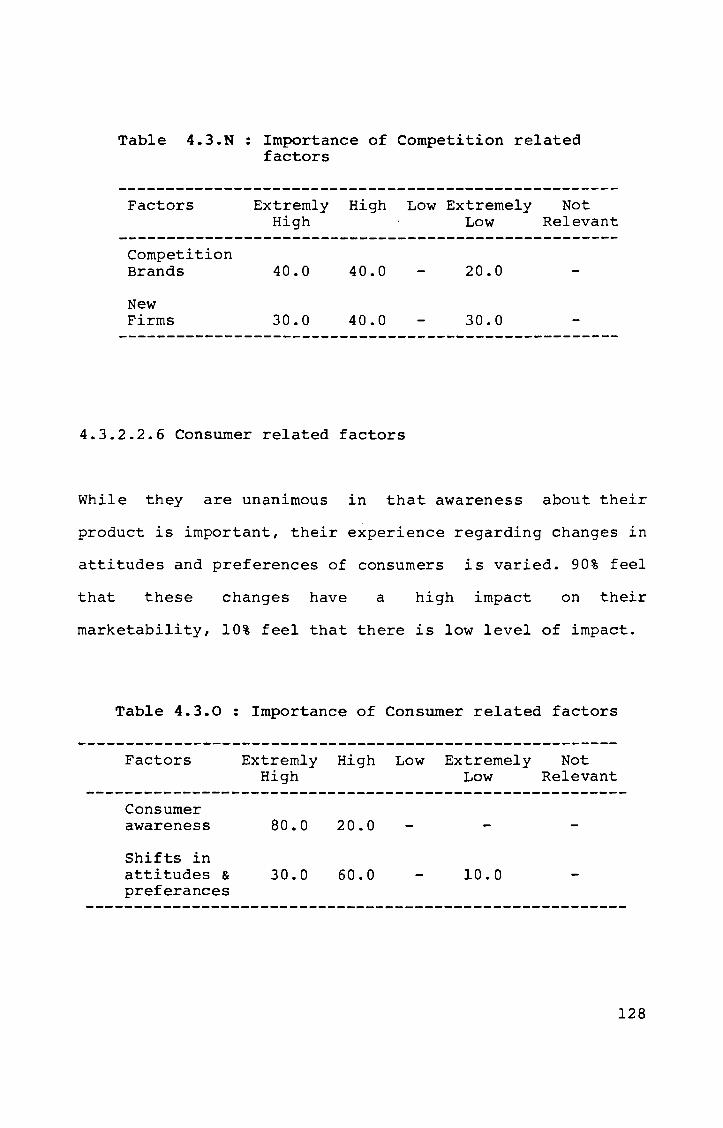
Table 4.3.N
Factors
Competition Brands
New Firms
Importance of Competition related factors
Extremly High High
40.0 40.0
30.0 40.0
Low Extremely Not Low Relevant
20.0
30.0
4.3.2.2.6 Consumer related factors
While they are unanimous in that awareness about their
product is important, their experience regarding changes in
attitudes and preferences of consumers is varied. 90% feel
that these changes have a high impact on their
marketability, 10% feel that there is low level of impact.
Table 4.3.0 : Importance of Consumer related factors
Factors
Consumer awareness
Shifts in attitudes &
preferances
Extremly High Low High
80.0 20.0
30.0 60.0
Extremely Not Low Relevant
10.0
128
4.3.2.2.7 Government related factors
With reference to the significance of support from the
Government in the marketing operations, 60% feel it is
important. 30% feel it is not so significant. 10% feel it
is not relevant. Every respondent said that there has not
been any concentrated effort from the government to help
them in marketing their products.
Some of the firms mentioned a few elements of the
regulatory mechanisms which in effect cause serious hazards
to the marketability of their product.
4.3.3 MARKETING ISSUES RELEVANT TO PROCESSED SPICES MANUFACTURING SSI FIRMS
4.3.3.0 Shelf-life of processed Spices
According to the respondents,processed spices which are
manufactured by them has a mean shelf-life of 67 days. The
range was 15 to 360 days with standard deviation 85.77.
4.3.3.1 Problem areas in marketing processed spices
Seven areas with reference to marketing were listed and the
units ranked them according to their experience; most
problematic to least problematic.
129-
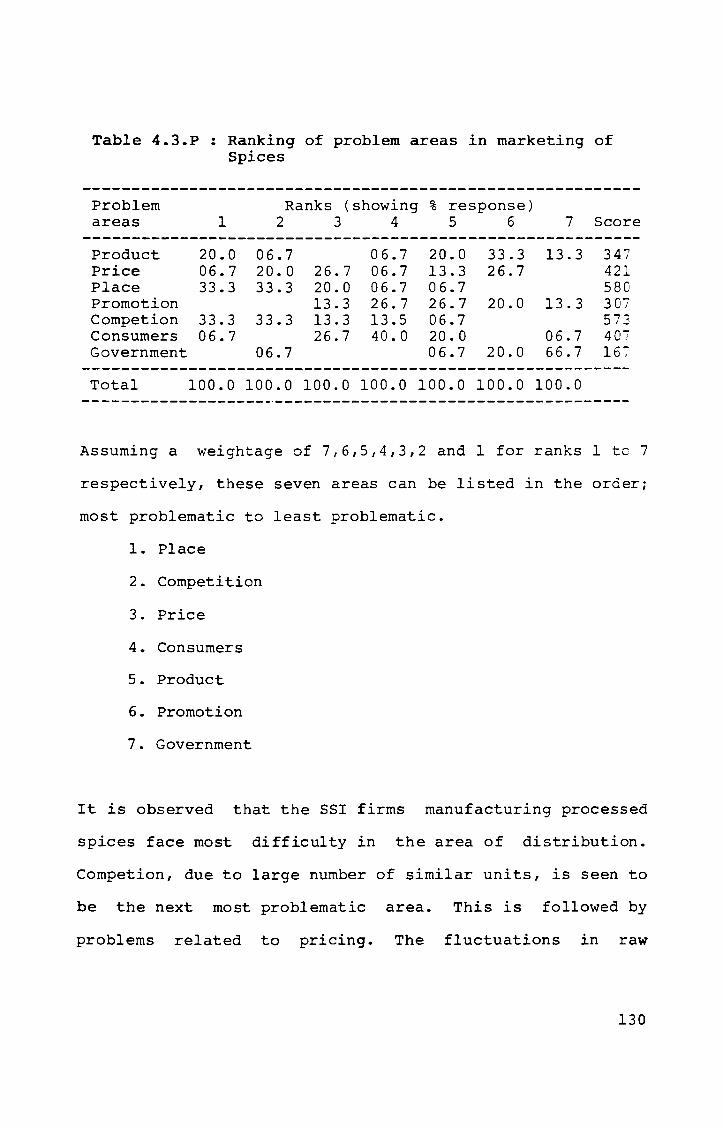
Table 4.3.P : Ranking of problem areas in marketing of Spices
Problem areas' 1
Ranks (showing % response) 23456 7 Score
----------------------------------------------------------Product 20.0 06.7 06.7 20.0 33.3 13.3 347 Price 06.7 20.0 26.7 06.7 13.3 26.7 421 Place 33.3 33.3 20.0 06.7 06.7 580 Promotion 13.3 26.7 26.7 20.0 13.3 307 Competion 33.3 33.3 13.3 13.5 06.7 573 Consumers 06.7 26.7 40.0 20.0 06.7 407 Government 06.7 06.7 20.0 66.7 167
---------------------------------------------------------Total 100.0 100.0 100.0 100.0 100.0 100.0 100.0
Assuming a weightage of 7,6,5,4,3,2 and 1 for ranks 1 to 7
respectively, these seven areas can be listed in the order;
most problematic to least problematic.
1. Place
2. Competition
3. Price
4. Consumers
5. Product
6. Promotion
7. Government
It is observed that the SSI firms manufacturing processed
spices face most difficulty in the area of distribution.
Competion, due to large number of similar units, is seen to
be the next most problematic area. This is followed by
problems related to pricing. The fluctuations in raw
130
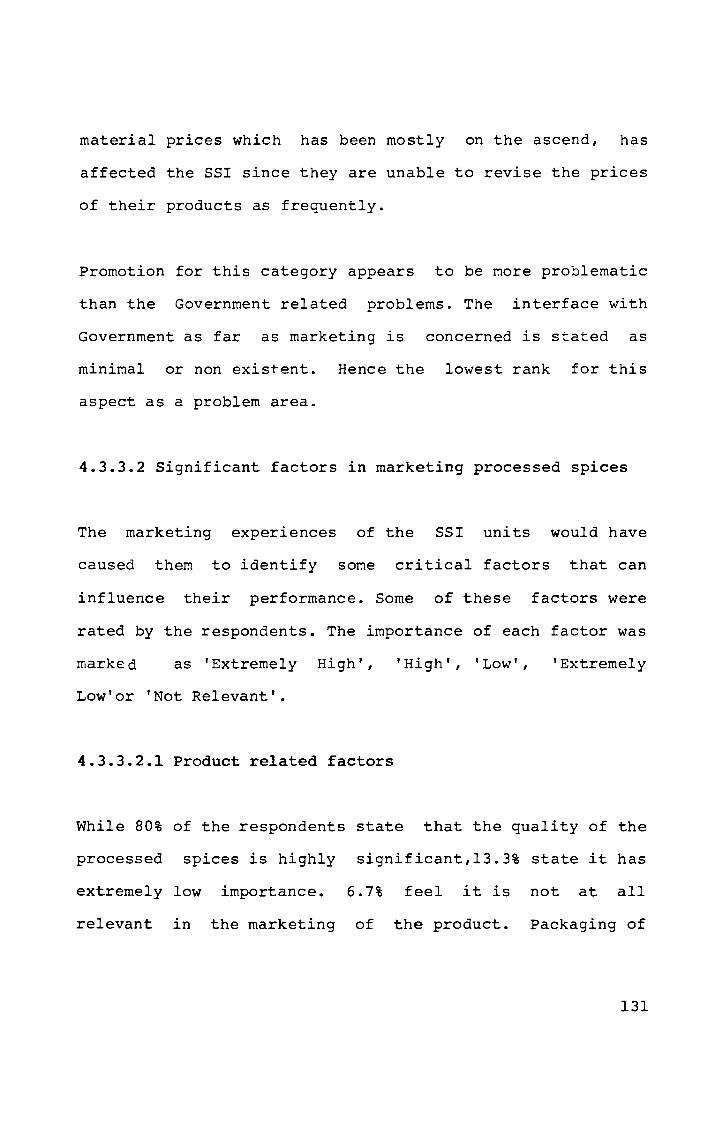
material prices which has been mostly on the ascend, has
affected the SSI since they are unable to revise the prices
of their products as frequently.
Promotion for this category appears to be more problematic
than the Government related problems. The interface with
Government as far as marketing is concerned is stated as
minimal or non exisrent. Hence the lowest rank for this
aspect as a problem area.
4.3.3.2 Significant factors in marketing processed spices
The marketing experiences of the SSI units would have
caused them to identify some critical factors that can
influence their performance. Some of these factors were
rated by the respondents. The importance of each factor was
markEd as 'Extremely High', 'High', 'Low', 'Extremely
Low'or 'Not Relevant'.
4.3.3.2.1 Product related factors
While 80% of the respondents state that the quality of the
processed spices is highly
extremely low importance.
relevant in the marketing
significant,13.3% state it has
6.7% feel it is not at all
of the product. Packaging of
131

spices is not a relevant factor for 20% of the respondents
while 33.3% say it has low or very low significance. But
40% say packing of spices is important.
While 40% of the respondent said that Brand Name is a
factor which contributes to the acceptability of processed
spices, 33.3% said that Name has low significance. 26.7%
feel it has no relevance.
Table 4.3.Q : Importance of Product-related factors
Factors
Quality Packaging Name Not essential
Extremely High High
66.7 26.7 20.0 13.3
13.3 20.0 20.0 20.0
Low Extremely Not
33.3 06.7 06.7
Low Relevant
13.3
26.7
06.7 20.0 26.7 60.0
Spices, not being an essential item is a factor affecting
its marketing for 60% of the firms. While 6.7% say this is
not at all a significant factors, 60% feel it is
irrelevant.
4.3.3.2.2 Price related factors
Price at the consumers end is a significant factor says 60%
of the respondents.For 33.3% it is not significant and for
6.7 % it is irrelevant. A high profit margin is a major
132
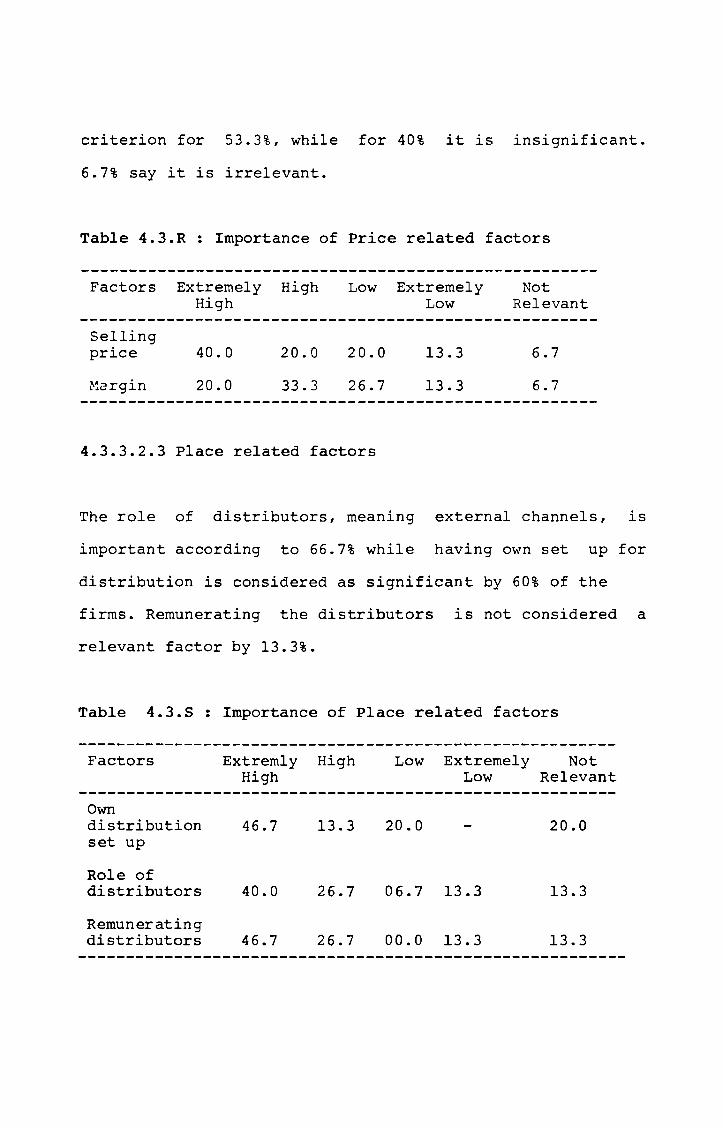
criterion for 53.3%, while for 40% it is insignificant.
6.7% say it is irrelevant.
Table 4.3.R : Importance of Price related factors
Factors Extremely High High
Low Extremely Low
Not Relevant
Selling price
r-~argin
40.0
20.0
20.0 20.0
33.3 26.7
4.3.3.2.3 Place related factors
13.3 6.7
13.3 6.7
The role of distributors, meaning external channels, is
important according to 66.7% while having own set up for
distribution is considered as significant by 60% of the
firms. Remunerating the distributors is not considered a
relevant factor by 13.3%.
Table 4.3.S: Importance of Place related factors
Factors
Own distribution set up
Role of distributors
Remunerating distributors
Extrem1y High High
46.7 13.3
40.0 26.7
46.7 26.7
Low Extremely Not Low Relevant
20.0 20.0
06.7 13.3 13.3
00.0 13.3 13.3
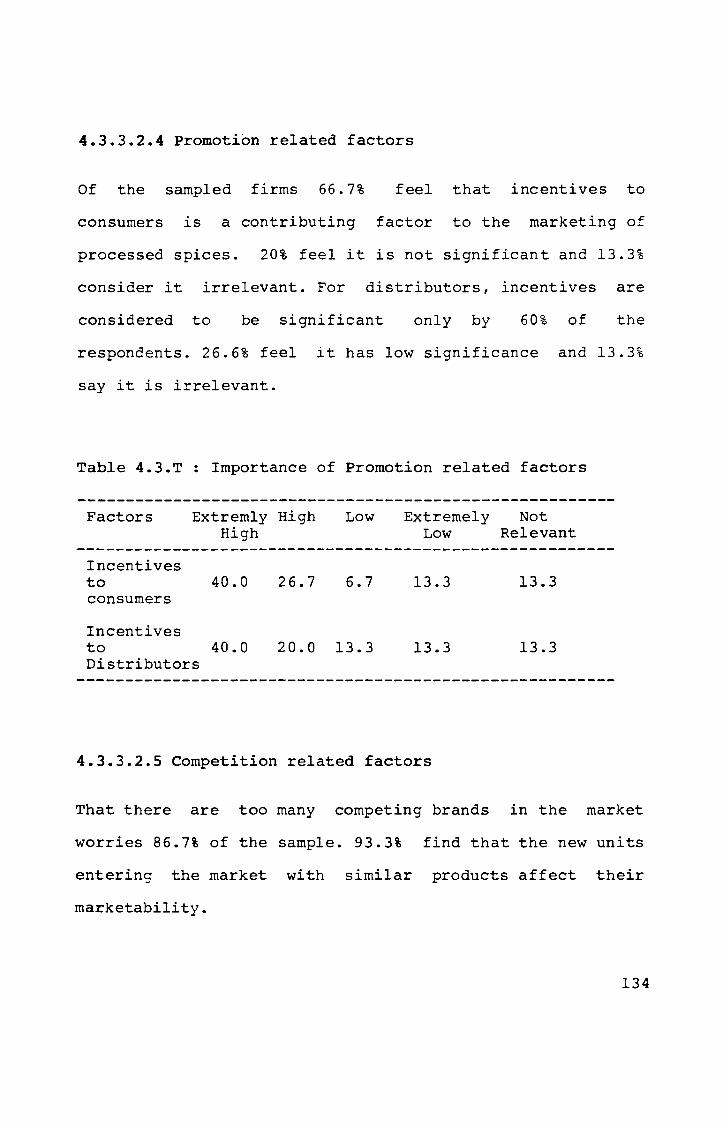
4.3.3.2.4 Promotion related factors
Of the sampled firms 66.7% feel that incentives to
consumers is a contributing factor to the marketing of
processed spices. 20% feel it is not significant and 13.3%
consider it irrelevant. For distributors, incentives are
considered to be significant only by 60% of the
respondents. 26.6% feel it has low significance and 13.3%
say it is irrelevant.
Table 4.3.T : Importance of Promotion related factors
Factors
Incentives to consumers
Incentives
Extremly High High
40.0 26.7
Low
6.7
to 40.0 20.0 13.3 Distributors
Extremely Not Low Relevant
13.3 13.3
13.3 13.3
4.3.3.2.5 Competition related factors
That there are too many competing brands in the market
worries 86.7% of the sample. 93.3% find that the new units
entering the market with similar products affect their
marketability.
134
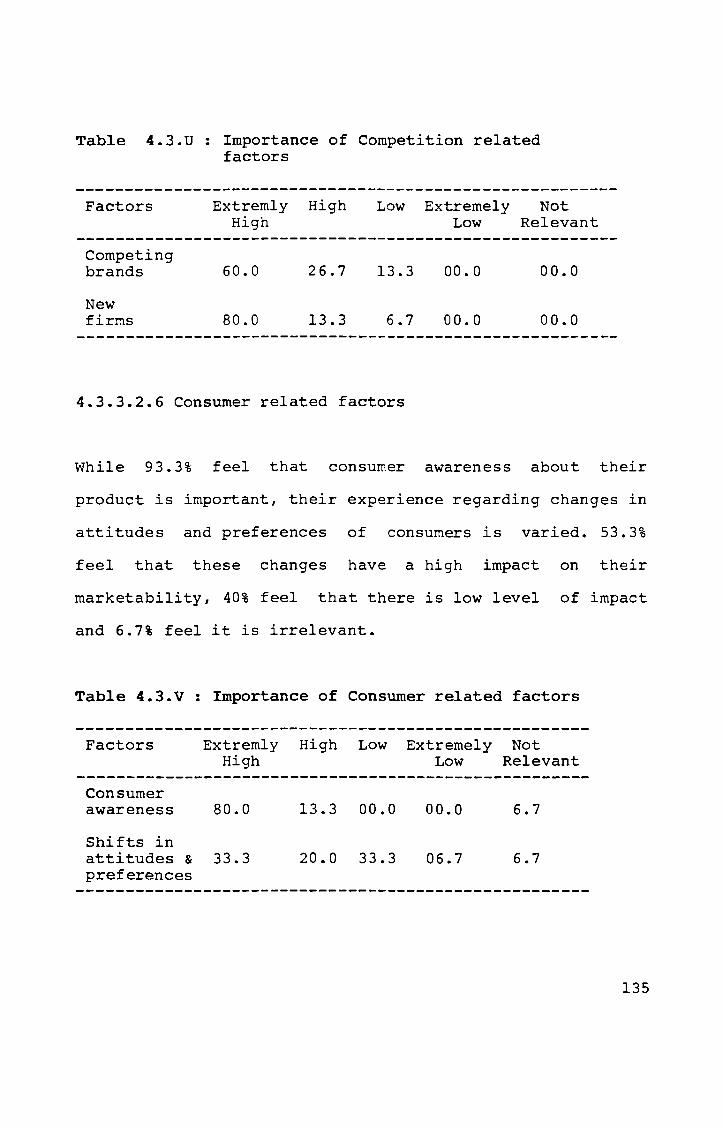
Table 4.3.U: Importance of Competition related factors
Factors Extremly High High
Low Extremely Not
Competing brands
New firms
60.0
80.0
26.7 13.3
13.3 6.7
4.3.3.2.6 Consumer related factors
Low Relevant
00.0 00.0
00.0 00.0
While 93.3% feel that consumer awareness about their
product is important, their experience regarding changes in
attitudes and preferences of consumers is varied. 53.3%
feel that these changes have a high impact on their
marketability, 40% feel that there is low level of impact
and 6.7% feel it is irrelevant.
Table 4.3.V : Importance of Consumer related factors
Factors
Consumer
Extremly High
awareness 80.0
Shifts in attitudes & 33.3 preferences
High Low Extremely Not Low Relevant
13.3 00.0 00.0 6.7
20.0 33.3 06.7 6.7
135
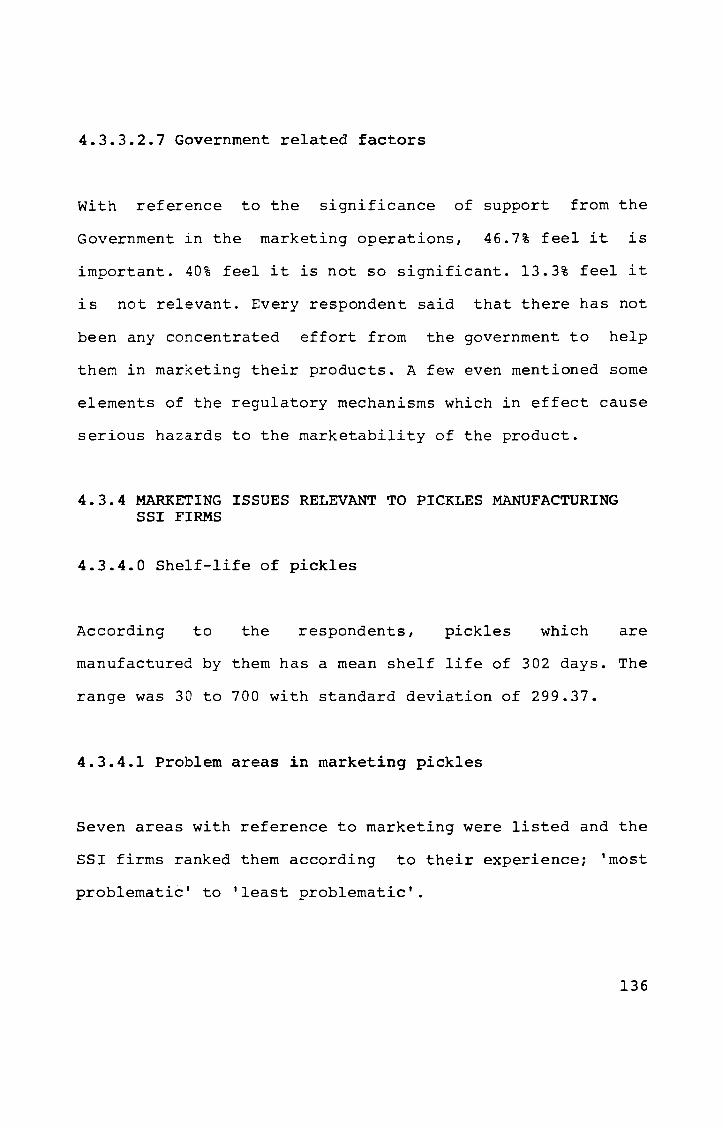
4.3.3.2.7 Government related factors
with reference to the significance of support from the
Government in the marketing operations, 46.7% feel it is
important. 40% feel it is not so significant. 13.3% feel it
is not relevant. Every respondent said that there has not
been any concentrated effort from the government to help
them in marketing their products. A few even mentioned some
elements of the regulatory mechanisms which in effect cause
serious hazards to the marketability of the product.
4.3.4 MARKETING ISSUES RELEVANT TO PICKLES MANUFACTURING SSI FIRMS
4.3.4.0 Shelf-life of pickles
According to the respondents, pickles which are
manufactured by them has a mean shelf life of 302 days. The
range was 30 to 700 with standard deviation of 299.37.
4.3.4.1 Problem areas in marketing pickles
Seven areas with reference to marketing were listed and the
SSI firms ranked them according to their experience; 'most
problematic' to 'least problematic'.
136
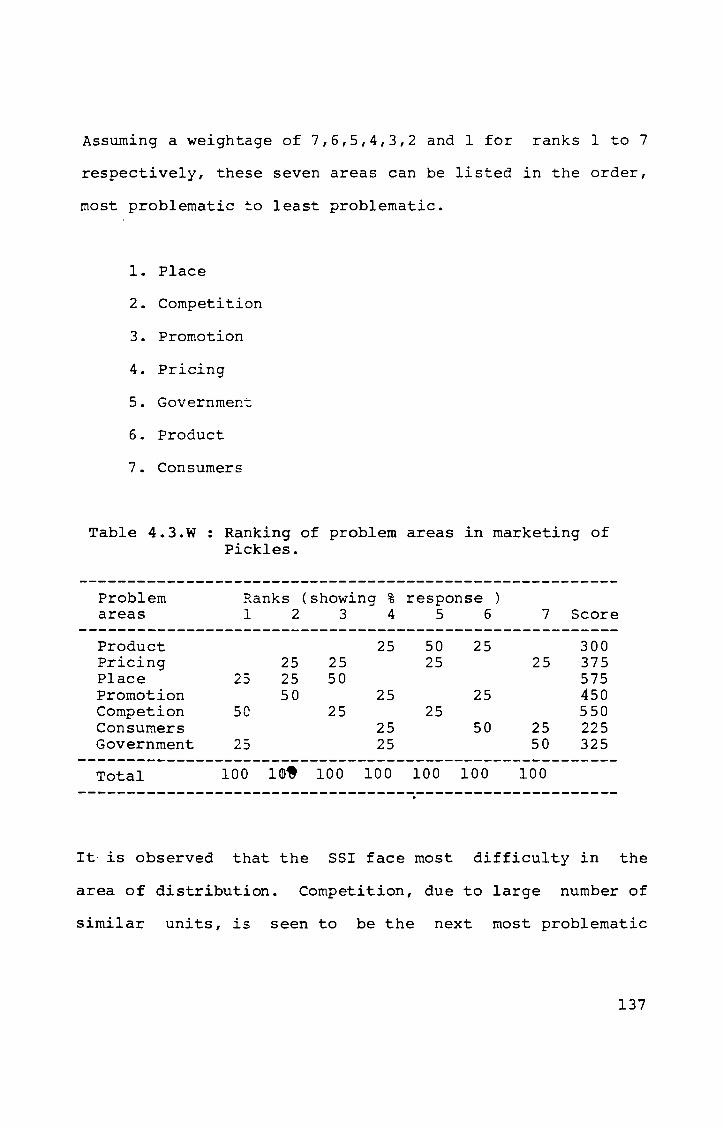
Assuming a weightage of 7,6,5,4,3,2 and 1 for ranks 1 to 7
respectively, these seven areas can be listed in the order,
most problematic ~o least problematic.
1. Place
2. Competition
3. Promotion
4. Pricing
5. Governmen~
6. Product
7. Consumers
Table 4.3.W : Ranking of problem areas in marketing of Pickles.
Problem areas
Ranks (showing % response) 123 4 5 6 7 Score
--------------------------------------------------------Product 25 50 25 300 Pricing 25 25 25 25 375 Place 23 25 50 575 Promotion 50 25 25 450 Competion 50 25 25 550 Consumers 25 50 25 225 Government 23 25 50 325
--------------------------------------------------------Total 100 Im~ 100 100 100 100 100
It is observed that the SSI face most difficulty in the
area of distribution. Competition, due to large number of
similar units, is seen to be the next most problematic
137
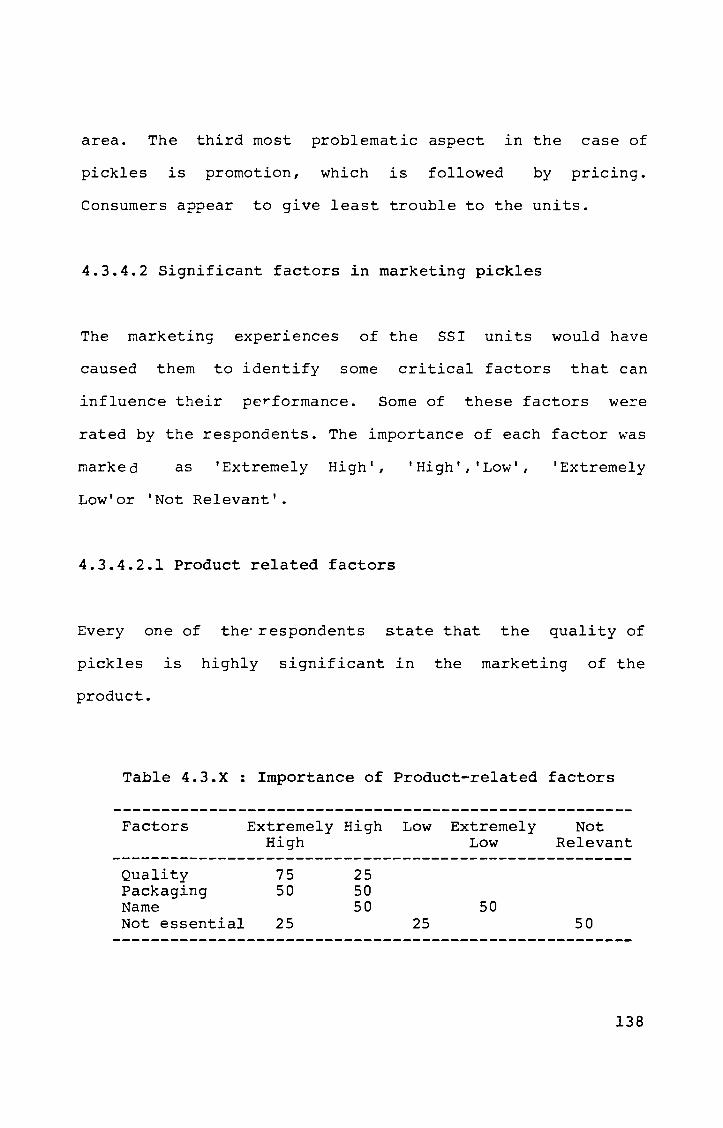
area. The third most problematic aspect in the case of
pickles is promotion, which is followed by pricing.
Consumers appear to give least trouble to the units.
4.3.4.2 Significant factors in marketing pickles
The marketing experiences of the SSI units would have
caused them to identify some critical factors that can
influence their performance. Some of these factors were
rated by the respondents. The importance of each factor was
marked as 'Extremely High', , Hi gh ' , 'Low' , 'Extremely
Low'or 'Not Relevant'.
4.3.4.2.1 Product related factors
Everyone of the'respondents state that the quality of
pickles is highly significant in the marketing of the
product.
Table 4.3.X : Importance of Product-related factors
Factors
Quality Packaging Name Not essential
Extremely High High
75 50
25
25 50 50
Low Extremely Low
50 25
Not Relevant
50
138
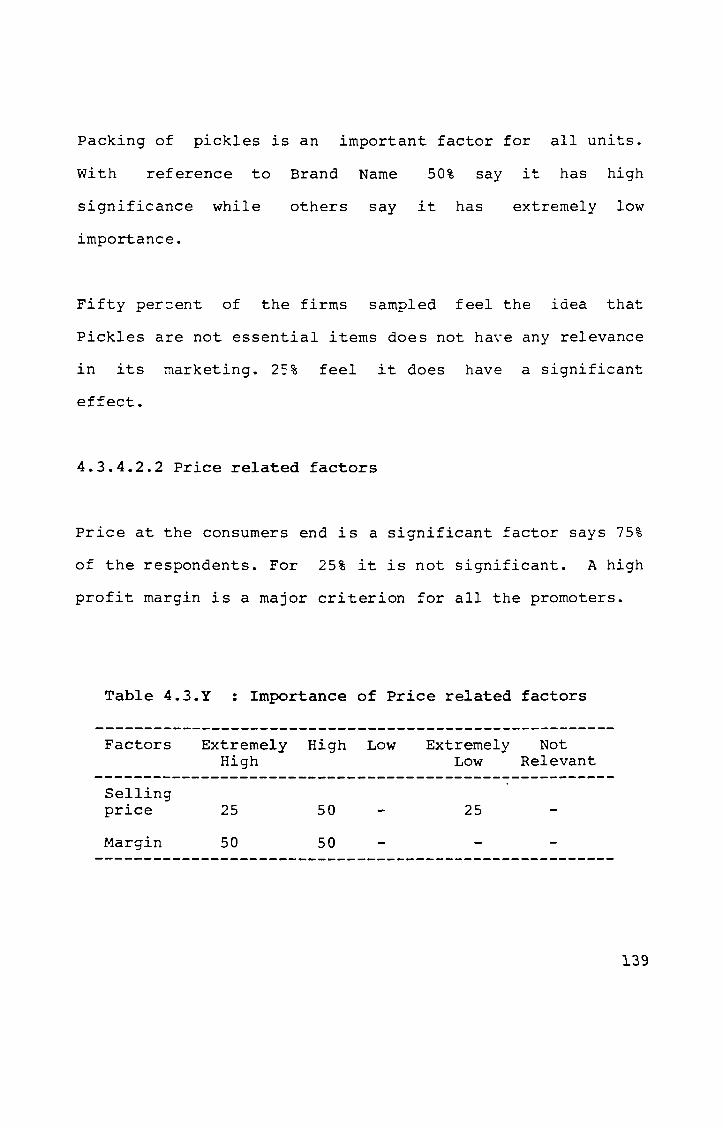
Packing of pickles is an important factor for all units.
with reference to Brand Name 50% say it has high
significance while others say it has extremely low
importance.
Fifty percent of the firms sampled feel the idea that
Pickles are not essential items does not have any relevance
in its marketing. 25% feel it does have a significant
effect.
4.3.4.2.2 Price related factors
Price at the consumers end is a significant factor says 75%
of the respondents. For 25% it is not significant. A high
profit margin is a major criterion for all the promoters.
Table 4.3.Y : Importance of Price related factors
Factors
Selling price
Margin
Extremely High Low High
25 50
50 50
Extremely Not Low Relevant
25
139

4.3.4.2.3 Place related factors
The role 0: distributors meaning external channels, is
important ac=ording to 75% of the firms, while having own
set up for distribution is significant for 50%.
Remuneratin~ the channel members is taken as a significant
factor by al:.
Table 4.3.Z: Importance of Place related factors
Factors Extremely Not Extremly High Low High Low Relevant
Own distributi:m set up
Role of distribution
Remunerating distributo:-s
25
75
75
25 25
25
25
4.3.4.2.4 Promotion related factors
25
Incentives to consumers is stated by all as a significant
aspect of marketing pickles; 25% stating it is extremely
significant. For distributors too, incentives are stated as
important. Here, 75% say it is extremely important.
140
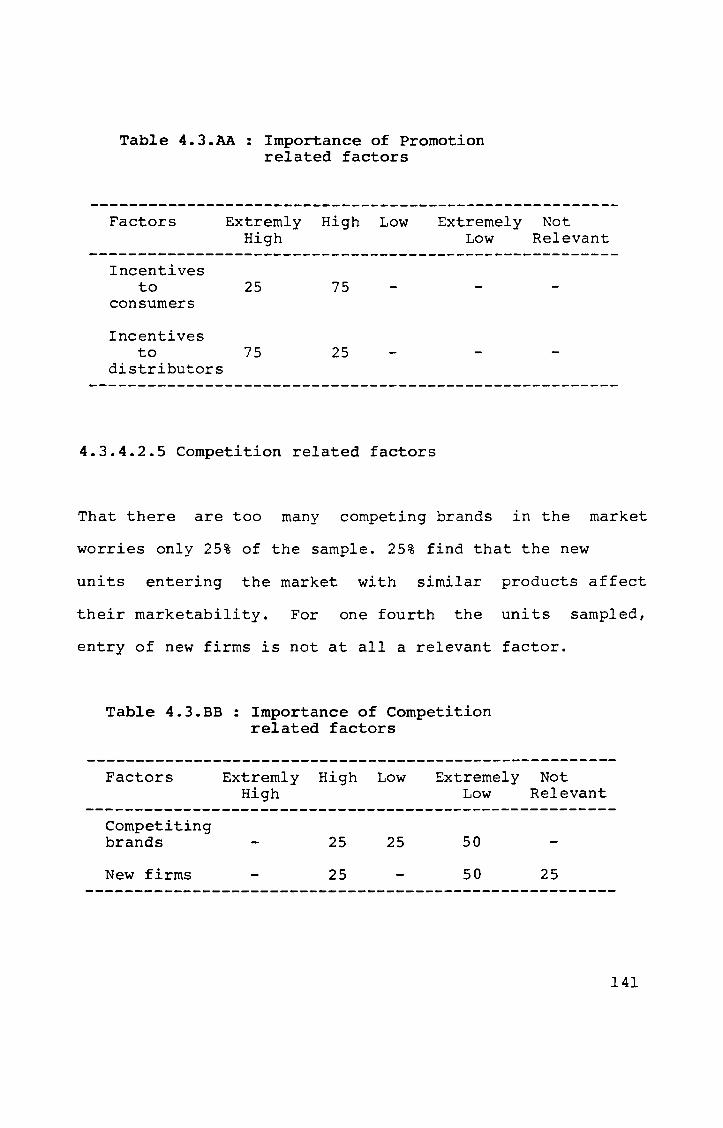
Table 4.3.AA Importance of Promotion related factors
Factors
Incentives to
consumers
Incentives
Extremly High Low High
25 75
to 75 25 distributors
4.3.4.2.5 Competition related factors
Extremely Not Low Relevant
That there are too many competing brands in the market
worries only 25% of the sample. 25% find that the new
units entering the market with similar products affect
their marketability. For one fourth the units sampled,
entry of new firms is not at all a relevant factor.
Table 4.3.BB : Importance of Competition related factors
Factors
Competiting brands
New firms
Extremly High Low High
25 25
25
Extremely Not Low Relevant
50
50 25
141
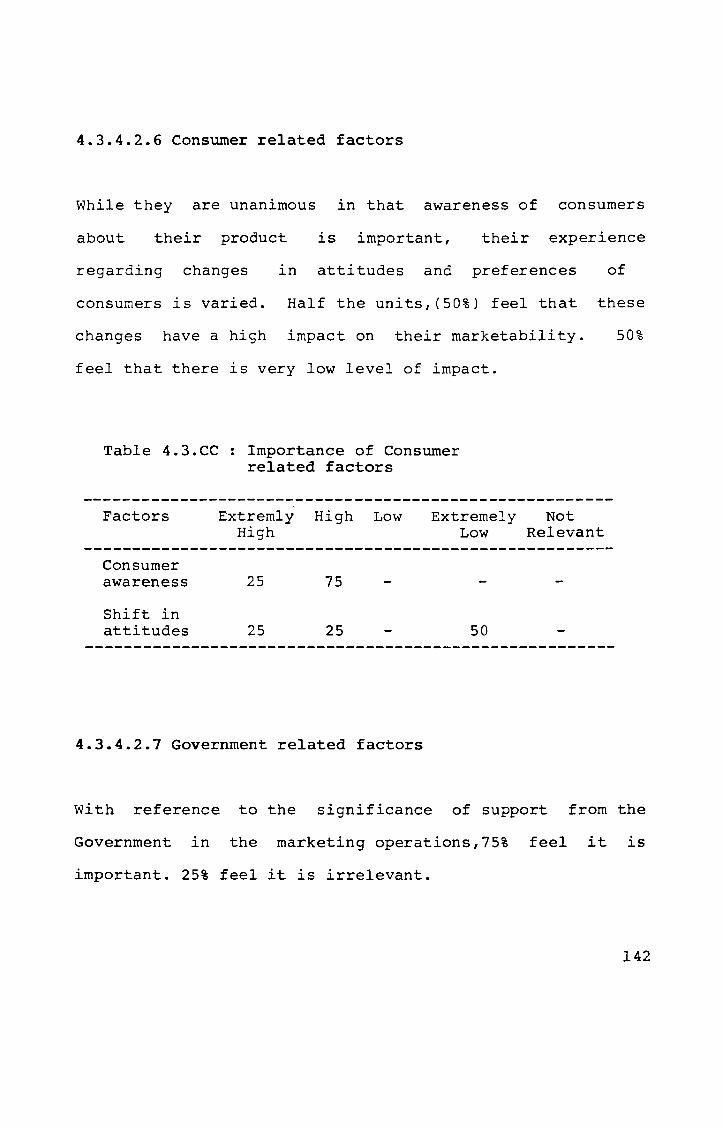
4.3.4.2.6 Consumer related factors
While they are unanimous in that awareness of consumers
about their product is important, their experience
regarding changes in attitudes and preferences of
consumers is varied. Half the units,(50%) feel that these
changes have a high impact on their marketability. 50%
feel that there is very low level of impact.
Table 4.3.CC
Factors
Consumer awareness
Shift in attitudes
Importance of Consumer related factors
Extremly High Low High
Extremely Not Low Relevant
25 75
25 25 50
4.3.4.2.7 Government related factors
With reference to the significance of support from the
Government in the marketing operations,75% feel it is
important. 25% feel it is irrelevant.
142
4.4 PRICING, PROMOTION AND FEEDBACK
4.4.1 Bread
4.4.1.1 Assessing market potential of Bread
About 18.8% units have some arrangements for assessing the
market potential. Though scientific market research is not
used they try to assess demand based on product movement.
The o~hers mentioned that this is not a serious issue
thouS~ general 'market' is taken as the indicator.
4.4.1.2 It is noted that the decision on how much to
produce is taken more by hunch rather than by a proper
analysis of the market.
4.4.1.3 pricing
While 62.5% take cost as the basis for pricing ,50%
consider demand. For 37.5% the competition is a factor.
There are cases where two or more of these aspects are
taken together while pricing the bread.
4.4.1.4 Promotion
Only 37.5% make any effort at promoting their bread,
through promotional campaigns.
143
4.4.1.5 Credit sales
In the case of half the total units, sales of bread is on
cash down basis. Credit of one to four days is allowed by
43.7% cases. In 6.3% the credit allowed is upto one month.
4.4.1.6 None of the bread manufacturing units give sales
targets to salesmen.
4.4.1.7 Feed back
Only in 12.5% cases there is a regular arrangement for
gathering information about consumers. But 68.8% say they
get feedback about their product directly from the
consumers. For 37.5%, the channel members provide the feed
back.
4.4.2 Biscuits
4.4.2.1 Assessing market potential of Biscuits
None of the units had an effective mechanism for
the market potential. But 20% maintained
assessing
that they
periodically made
potential.
some effort to assess the market
144
4.4.2.2 The decision regarding how much to produce each day
was in all cases an adhoc decision and was made with
reference to movement of product that had taken place
during the past few days.
4.4.2.3 Pricing
The price was decided based on cost in all the cases. While
20% also considered the competition, 40% considered the
demand for fixing the price.
4.4.2.4 Promotion
Forty percent of the units have advertised their products
through some media.
4.4.2.5 Credit sales
In 60% cases no credit was allowed. One fifth the firms
allowed upto seven days credit and in 10% cases the credit
period was upto one month.
4.4.2.6 Salesmen are not given any sales targets in any of
the cases.
145
4.4.2.7 Feed back
In 90% of the cases there is no regular mechanism for
collecting information regarding their consumers. 70% of
the units get feedback directly from the consumers and 30%
from the channel members. Very few had any regular
arrangement for gathering information about customers. Just
10% claimed they had some mechanism for this.
4.4.3 Processed spices
4.4.3.1 Assessing market potential of processed spices
None of the spices processing firms have any regular
mechanism for assessing the market potential
4.4.3.2 The decision of what quantity of spices to process
during a specific period is in all cases a 'guesstimate'.
4.4.3.3 Pricing
Cost is the basis for pricing in 60% cases while one third
of the firms take demand as the norm. 26.7% consider
competitors pricing as the basis for their decisions.
146
4.4.3.4 Promotion
Only 26.7% of the firms advertise their products.
4.4.3.5 Credit sales
In 26.7% of the cases, sales were effected on cash down
basis. 40% of the units had to give one week credit,
13.3% up to two weeks and 20% units had to wait upto three
weeks for cash to flow back.
4.4.3.6 Just about 7% of the units said that sales targets
are given to their sales men.
4.4.3.7 Feed back
Forty percent of the firms receive feed back regarding
their products directly from the consumers and an equal
number from the channels. None of the units had any regular
mechanism for gathering information regarding their
consumers.
147
4.4.4 Pickles
4.4.4.1 Assessing market potential of Pickles
Half the firms studied mentioned that they have a regular
arrangement to collect information for assessing the market
potential.
4.4.4.2 The decision on how much to produce is mostly
dependent on availability of raw materials. The items to be
pickled being seasonal is a major influencing factor for
deciding on the quantity to produce.
4.4.4.3 Pricing
The pricing of pickles is based on cost, competition and
demand in 25% of the cases. In the other 75% only costs and
demand are considered.
4.4.4.4 Promotion
Almost three fourth of the units advertise their products.
Only in one case extensive efforts have been taken. In
another instance promotional efforts had been exhaustive
when the product was launched.
148
4.4.4.5 Credit sales
Sales are on cash down basis in 25% cases.In 25%, one weeks
credit is allowed and in the remaining, upto one month is
allowed.
4.4.4.6 Sales target
Only in 25% cases are the sales men being given allY sales
targets.
4.4.4.7 Feed back
In 50% cases the units get feed back directly from the
consumers and in 50% cases from the dealers. There is no
regular arrangement for gathering information regarding
consumers in 75% of the cases.
4.5 PRODUCT DISTRIBUTION ARRANGEMENTS
4.5.1 Bread
4.5.1.1 Distribution arrangement - Bread
For distribution of bread, almost 43.8% of the units
studied have their own arrangements. While 31.3% depend on
149
external organisations, the others ie. one fourth the firms
engage both internal systems and external organisations for
distribution of their products.
All the firms that use own distribution arrangements sell
their products through their own outlets. Of these about
two thirds of the units sell their entire output through
their own outlets.
The channels of distribution engaged by the bread
manufacturing units include the retailers, wholesalers and
also occasionally, distributors. (Chapter 5)
4.5.1.2 For distribution of bread, 31.3% units have their
own van. 12.6% have own autorikshaws and an equal number
have their own cycles. 18.8% use hired vans and a similar
number use hired autorikshaws.
4.5.1.3 Number of outlets
A minority of 6.3% of units stock their bread in no other
outlet. They supply their entire output to institutional
buyers. 50% of the units have less than 10 retailers.
Another 25% have upto 50 retailers. The remaining firms
have 100 or more retailers dealing in their products.
150
4.5.1.4 Identification of channels of distribution
4.5.1.4.+ Who
The proprietor decides on the channels to be employed in
87.5% of the cases. In 6.3% of the units studied, a partner
was the decider and in an equal proportion of the cases the
marketing executives took the decision.
4.5.1.4.2 When
Only in 50% of the cases was the choice of channels made
before the project was commissioned. In 31.3% cases the
choice was made as soon as production commenced. In about
12.5% cases the decision was made after six months from
commencement of production while in the rest of the cases
it just evolved over time.
4.5.1.4.3 How
One third the firms studied finalised on the channels of
distribution based on trial and error. The competitor's
channels were employed by 12.5% of the firms while for one
fourth the units it was not a deliberate decision point.
151

4.5.2 Biscuits
4.5.2.1 Distribution arrangements - Biscuits
For distribution of the biscuits to the consumers, 60% of
the units have their own system. 20% use external
organisations and 20% employ both these mechanisms. Of
those having own distribution arrangements, all the units
~se their own outlets. While 60% of the units market their
entire production of biscuits through their own shops, 20%
sell only partly through this mode.
Twenty percent of the units depend entirely on external
bodies to market their
involved by the units are
products. The external agencies
retailers - in the case of 40%
and wholesalers and retailers in the case of 10% of the
respondents.
In the marketing of biscuits by the Small Scale Industries,
the system of distribution appears to be less complex.
Other than retailers and wholesalers no other group is
found to be a member of their channel. Interestingly,
almost 90% of the units are not satisfied with the
performance of their existing channels of distribution.
152
4.5.2.2 In 10% cases, the units used own van for
distribution, 10% had autorikshaws and 20% used cycles.
Hired van or autorikshaws were employed by 10% of the units
contacted.
4.5.2.3 Number of outlets
The firms manufacturing biscuits and using their own
outlets, do not stock their product in any other outlets.
30% of the units have upto 50 retail outlets stocking their
products. 10% have over 100 retail units dealing in their
products.
4.5.2.4 Identification of channels of distribution for
Biscuits
4.5.2.4.1 Who
The identification of channels was done by the Proprietor
in 90% of the cases and by the marketing executive in the
other cases.
4.5.2 4.2 When
The channels employed by these units were selected before
the projects were commissioned in 30% of the cases. In 40%
of the cases it was done as soon as production started
153
while in 20% of the cases it was done six months after
commercial production started.
structure had gradually evolved.
4.5.2.4.3 How
For 10%, the existing
The identification of channels was through trial and error
in 20% of the units. 20% just adopted what the competitors
did. In 50% of the cases it was not a deliberate effort and
in 10% cases the respondent was not sure how it had been
selected.
4.5.3 Processed spices
4.5.3.1 Distribution arrangement - Processed Spices
For distribution of the processed spices to the consumers,
13.3% of the units use their own system.26.7% use external
organisations and 60% employ both these mechanisms.
Twenty percent of these units use their own outlets for
marketing their processed spices.In a sizeable number, 40%,
the promoters themselves make door-to-door sales, while in
13.2% cases sales representatives are employed
for door-to-door sales.
154
Eighty percent of the units distribute above 75% of their
output through external agencies.
The channel members for spices include retailers and
wholesalers. 26.7% employ whole-salers. 66.7% have
retailers in the channel.
It appears that almost 95% of the u~~ts are happy with the
existing channels and feel they are getting the best
results.
4.5.3.2 While 6.7% used own van for distribution of the
spices, 20% used O\ID autorikshaws, 13.3% used two-wheelers
and 33%, cycles. Hired autorikshaws were employed by 13.3%
of the units.
4.5.3.3 Number of outlets
One fifth of the firms studied stocked their product only
in one outlet. 60% have upto 50 outlets and 20% have more .
that 100 outlets stocking their products.
155

4.5.3.4 Identification of channels for spices
4.5.3.4.1 Who
It was the ~=omoter who decided on what channel to use in
80% cases. In 6.7% cases it was the consultant and in an
equal numbe= it was the marketing executive.
4.5.3.4.2 Wr.en
The selectic~ of channels was done before the project was
commissionec in 26.7% cases. In 33.3% it was done as soon
as commerc~~l production started. In an equal number,
33.3%, it w~s decided only after six months of commencing
commercial ~=oduction.
4.5.3.4.3 How
In almost 4£.7% cases, the decisions on what channels to
use was based on trial and error. In 20% cases there was no
deliberate effort.In 13.3% cases competitor's channels were
faithfully adopted while in an equal number the channel
members approached the units for taking up the distribution
of the prod~cts.
156
4.S.4 Pickles
4.S.4.1 Distribution arrangement - Pickles
For distribution of pickles to consumers, 2S% of the units
have their own arrangements. While 2S% use only external
agencies for distribution, SO% use both the means. The
units with own arrangements, use their own outlets for
marketing the entire output. Those using external agencies,
market almost 90 to 100 perce~t of their output through
them. In SO% cases sales rep~esentatives are used for
door-to-door sales.
The channels of distribution for pickles include retailers
in all cases, wholesalers in SO% cases and distributors in
2S% cases.
4.S.4.2 Own van is used by 2S% units for distributing the
products. SO% use own autorikshaws, 2S% own two wheelers
and 2S% own cycles. Some of the unit have more than one of
these means. Only 2S% of the units sampled used hired vans
for distribution
4.S.4.3 Number of outlets
Units using their own outlets do not stock their product in
any other retail stores. 2S% units have less than SO retail
IS7
outlets while 50% units have more than 100 retail outlets
selling their products.
4.5.4.4 Identification of channels of distribution of
Pickles
4.5.4.4.1 Who
The identification of the channels is done by the promoter
in all the cases.
4.5.4.4.2 When
The channels were selected even before the projects were
selected in 50% cases and in other cases it was done as
soon as commercial production started.
4.5.4.4.3 How
In 25% cases the channel selection was a trial and error
effort. In 50% units the competitors channels formed the
basis, and in other cases it just evolved.
158
CHAPTER 5
5.0 CHANNEL STRUCTURES
5.1 MARKETING FUNCTIONS
The marketing channel structure incorporates the operations
and interactions of various marketing institutions. These
institutions, in the process of interacting provide time,
place, possession and form utilities. It is in the frame
work of these institutions that the import of the different
marketing functions are to be viewed.
Marketing functions are categorised into three:
a. Functions of exchange -buying selling
b. Functions of physical supply-transportations storage
c. Facilitating functions -financing risk taking marketing information standardisation and grading
159
5.1.1 A model of the marketing functions originally
proposed by R.F Breyer (The marketing institution;New York:
Mc Graw Hill;1937 & Quantitative Systematic Analysis; New
York :Mc Graw Hill;1949) and reproduced by J.Taylor Sims et
al (Marketing Channels;Systems and strategies; Harper &
Row, New York 1977) is given in Figure 5.1.1
5.1.2 These marketing functions cannot be avoided or
elicinated. The manufacturer, the consumer and the
midc:emen in the distribution process together make up the
total network of marketing systems. The structure evolves
from the functions that are to be performed. The
eli~ination of a middleman, thus does not eliminate a
function. It follows that, if a middle man is to be
eliminated such functions will have to be performed by the
manufacturer or by other middlemen. So the structure of
channel systems would refer to the organisation of
functional activities within each component of the channel
systems and subsystems.
5.2 CHANNEL STRUCTURES OF SSI
The channel structures adopted by the Small Scale
Industrial units follow the typical marketing channels for
consumer goods, to some extent. Generally, channels
160
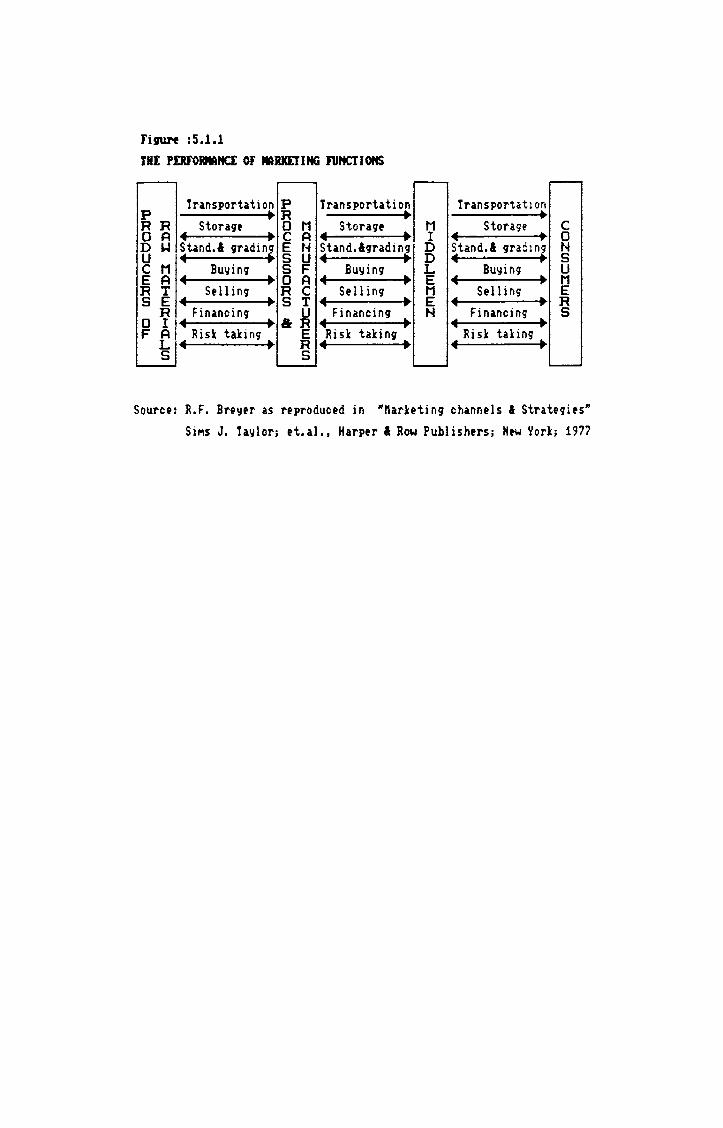
fifUN :5.1.1
THE PIRrORMHCI Of MRmIHG I1IHCTIOItS ,...-- ...--
Transportation P Transportation Transporhtlon p .. R .. .. RR Storage 0 M Storage M Storag~ C 0 A .. .. C A .. .. I .. .. 0 D 1-1 ~und.1 gradin: E N Stand.lgrading D Stand.1 gracIng N U S U .. .. D .. .. S C M Buying S F Buying L Buying U E A .. .. 0 A .. .. E ,. .. M R T Selling R C Selling M Selling E S E .. .. S T ,. .. E .. .. R
R Financing U Financing H Financing S 0 I .. .. &R ,. .. ,. .. F A Risk taking E Risk taking Risk taking
L .. .. R ,. .. ,. .. S S - '---
Source: R.F. Breyer as reproduced in -narketing channels" Strategies
SiMs J. Taylor; et.al., Harper I Row Publishers; Htw York; 1911
selected by the manufacturer depends on
consumer p~rchasing habits and the over
structure of the firm.*
the product,
all economic
Depending on whether the product is an industrial product
or a cons~~er product, the channel structure has to be
defi~ed. Wt~le direct sale to users is common in industrial
prod~cts, c broad spectrum of middlemen become prominent in
the case ~~- consumer goods. The most common channel in the
dist=ibutio~ of consumer goods is the manufacturer
wholesaler - retailer - consumer channel *
(* ~arketi~g Channels, systems and strategies;J Taylor
Sims; J ~obert Foster; Arch G Woodside; New York; Harper &
Row Publishers; 1977)
This is only an attempt at generalisation, for field
experience shows that a variety of channels are employed by
many produc~s. There is no single best channel suitable for
all products.
The small scale industries, manufacturing
Ernakulam District have evolved their own
From the field survey, it is seen that
food products in
channel systems.
the choice of
channel structures has not been in all cases, a deliberate
162
effort. Interestingly, most of the units studied, have not
defined their consumers in any definite manner. Since the
market segments that are to be catered to have a direct
bearing on the channels selected, it may be stated that the
SSI units tend to have a casual approach towards channel
selection.
The channels of distribution employed by the SSI units fall
into two broad classes:
a. Those channels that include external contactual
organisations.
b. Those channels that do not include external
organisations.
5.3 MARKETING CHANNELS OF BREAD MANUFACTURING SSI UNITS
5.3.1 Bread has a shelf life of 3-4 days. This product
which has an increasing demand in the state is available in
an assorted range; quality, flavour, weight and packing
being the distinguishing features. The addition of
preservatives, it is reported, helps to increase the shelf
life of bread upto one week. But this is done at the
expense of taste and freshness.
163

In general, bread is distributed such that, the output of
one day reaches the outlets by noon of the second day. This
is to ensure that the bread is sold off from the outlets
latest by the third day and consumed soon after.
5.3.2 Consumers
All the units studied had initially targeted their products
at the end~se consumers. At the time of this study, it was
found that 6% of the units se:l their product exclusively
to institutional buyers who use it for non-commercial
purposes. An equal proportion sell a part of their output
to institutional buyers, inc:uding caterers who use the
bread for commercial purposes. The others con~inue to
target their products to the end users.
5.3.3 Channels
Both institutional buyers and end-use consumers are being
catered to by these units.
The channels used by these manufacturers are :-
a. With external organisations
1. Manufacturers Distributors Wholesalers Retailers - Consumers.
164
2.
3.
Manufacturers Consumers.
Manufacturers Consumers.
Distributors Retailers
wholesalers Retailers
4. Manufacturers - Retailers - Consumers.
b. without external organisations
1. Manufacturers (Direct sales from production cer.tre) - Consumers.
2. Manufacturers (Door-to-Door sales by sales representatives) - Consumers (Institutional).
3. Manufacturers -Own outlets -Consumers.
The 'manufacturer - retailer - consumer' channel is the
predominant one with 56% of the units using the same. Half
the total units use their own outlets for marketing bread.
While 38% of the units sell their entire output through own
outlets, 25% use external retailers alone.
Units that utilise the services of distributors and
wholesalers are those that distribute their products to
centres beyond 30 km from the production site. These units
have high production capacities and have capacity
utilisation of over 60%. For physical distribution of their
products, these units use own or hired vans or
165
autorikshaws. There are cases where the units initially had
franchise arrangements with large marketing organisations.
But as they grew, they have set out on their own with their
own brandname.
Those units that use only the retailers are also observed
to reach centres beyond 30 km from their respective
production sites. Hence the geographical spread viz-a-viz
the type of channels employed, does not seem to be
following any definite pattern.
The firms that market their bread through own outlets have
a geographical reach of upto 5 kms. Table 5.3.1 provides
the details of SS! units manufacturing bread, that were
studied. The nearest selling point, the farthest selling
point, installed capacity (annual-in Tons), capacity
utilisation (maximum achieved - %) and channels employed
are shown in the Table 5.3.1.
The flow of the product from manufacturers to consumers
through various channels, as reported by the SS! units is
depicted in Figure 5.3.1
166
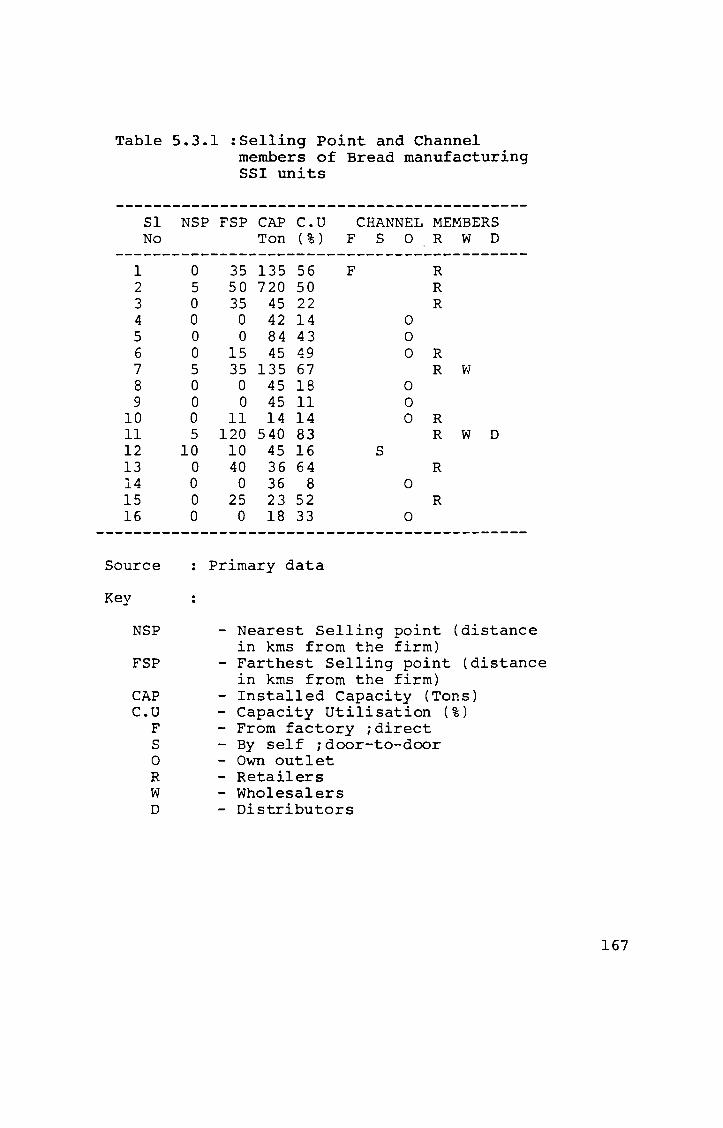
Table 5.3.1 :Selling Point and Channel members of Bread manufacturing SSI units
-------------------------------------------SI NSP FSP CAP C.U CHANNEL MEMBERS No Ton ( % ) F S 0 R W D
-------------------------------------------1 0 35 135 56 F R 2 5 50 720 50 R 3 0 35 45 22 R 4 0 0 42 14 0 5 0 0 84 43 0 6 0 15 45 49 0 R 7 5 35 135 67 R vJ 8 0 0 45 18 0 9 0 0 45 11 0
10 0 11 14 14 0 R 11 5 120 540 83 R W D 12 10 10 45 16 S 13 0 40 36 64 R 14 0 0 36 8 0 15 0 25 23 52 R 16 0 0 18 33 0
---------------------------------------------
Source Primary data
Key
NSP - Nearest Selling point (distance in kms from the firm)
FSP - Farthest Selling point (distance in kms from the firm)
CAP - Installed Capacity (Tons) C.U - Capacity Utilisation (%)
F - From factory ;direct S - By self jdoor-to-door o - Own outlet R - Retailers W - Wholesalers D - Distributors
167
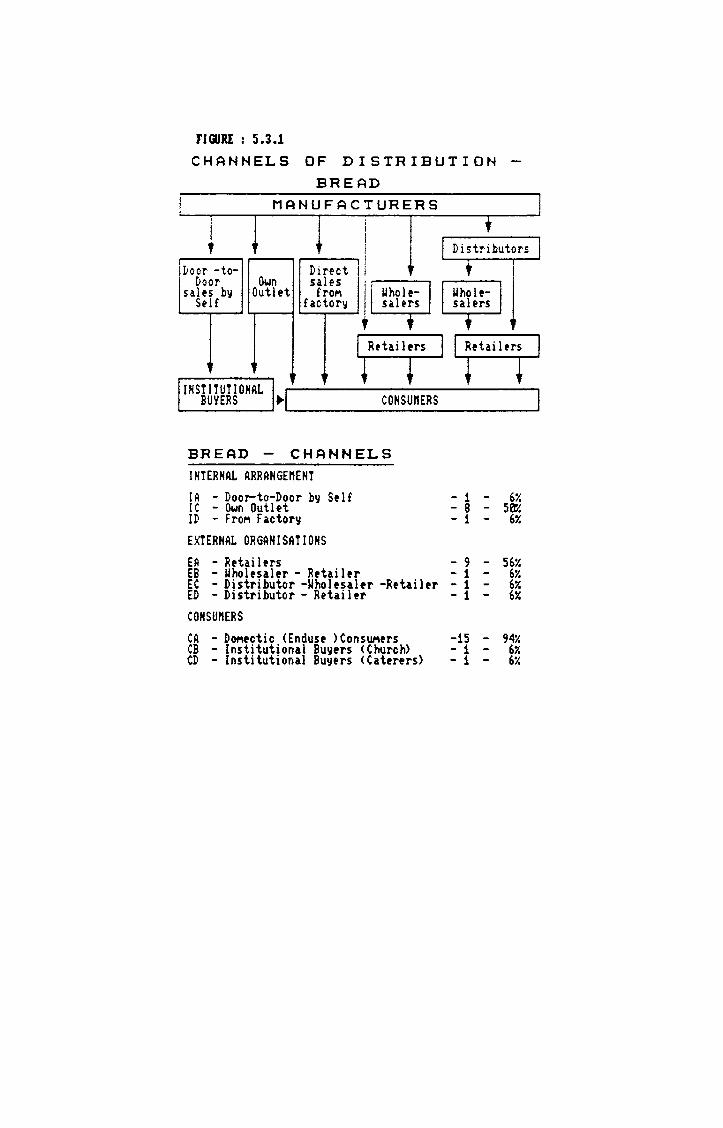
FIOORI : 5.3.1
CHANNELS OF DISTRIBUTION BREAD
MANUFACTURERS
voor -to-Door Own
salts by Outlet Self
BUYERS ...
Direct sales
froM factory
CONSUMERS INSTITUTIONAL ~I
~--------------------------~
BREAD - CHANNELS INTERNAL ARRANGEMENT lA - Door-to-Door by Self le - Own Outlet ID - FroM Factory
EXTERNAL ORGANISATIONS
- 1 - 6~ - 8 - 5~ - 1 - 6r.
EA - Retai lers - 9 - 56~ EB - Uholesaler - Retailer - 1 - 6~ EC - Distributor -Uholesaler -Retailer - 1 - 6r. ED - Distributor - Retailer - 1 - 6X
COHSUMERS CA - DOMectic <Enduse )ConsUl'lers CB - Institutional Buyers (Church) CD - Institutional Buyers (Caterers)
-15 - 94~ - 1 - 6r. - 1 - 6~
5.4 MARKETING CHANNELS OF BISCUITS MANUFACTURING SSI UNITS
5.4.1 The Biscuits manufactured by the SSI units are stated
to have mean shelf life of about one month. The changing
life style of the people of Kerala have influenced the
market for biscuits and a wide variety of the items,
branded and otherwise, are consumed extensively both in
urban and rural sectors.
Being less perishable than bread, the time lag from
production to the final sale is longer as compared to that
of bread. The mean as stated by the SSI units is 29 days.
This could be one reason for fewer number of channels,
being engaged in the distribution of biscuits.
Very few manufacturers have branded their biscuits. The
others,though they give a name to each variety of biscuits,
do not have a general brandname to identify the items in
the open market. Most of these items are sold under the
general nomenclature, 'Bakery
have to compete with the
established manufacturers, from
Biscuits'. Since these items
branded items from larger
outside the district they
tend to depend more on the retailers. These retailers
provide the shelf space, display and required promotion to
generate sales.
169
5.4.2 CONSUMERS
The SSI units manufacturing biscuits are observed to cater
to both institutional buyers and end-use consumers. The
products are mostly aimed at end-use consumers, and all the
units employ channels so as to reach these consumers. A few
units sell their products to institutional buyers which
include caterers.
5.4.3 CHANNELS
The marketing channels used by these SSI manufacturers
are:-
a. With external organisations :
1. Manufacturers - Wholesalers - Retailers - Consumers
2. Manufacturers - Retailers - Consumers
b.Without external organisations :
1. Manufacturers - Own outlets - Consumers (End use)
2. Manufacturers - Own outlets - Consumers (Institutional)
In the marketing of biscuits by the small scale units, the
manufacturers - own outlets - consumers channel appears to
be the most prominent one. 80% of the units use this
channel. The manufacturer retailer -consumer channel
comes next with 40% of the manufacturers using the same.
170
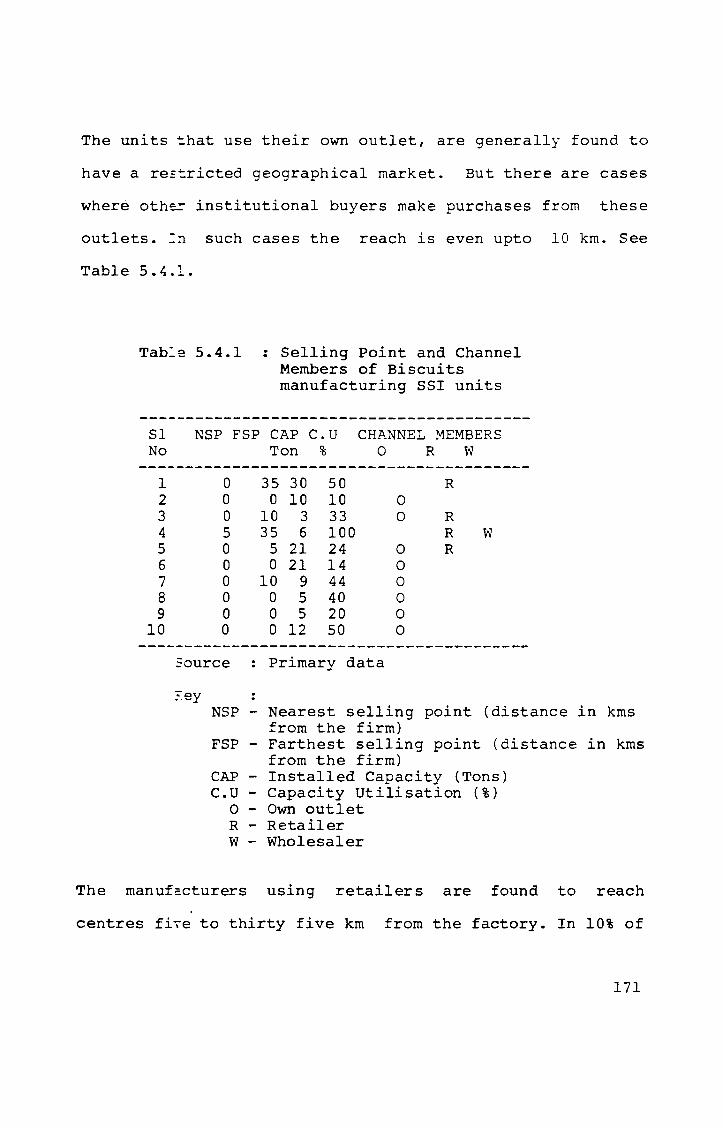
The units ~hat use their own outlet, are generally found to
have a re5~ricted geographical market. But there are cases
where othe= institutional buyers make purchases from these
outlets. :n such cases the reach is even upto 10 km. See
Table 5.4.1.
Tab:e 5.4.1 : Selling Point and Channel Members of Biscuits manufacturing SSI units
SI NSP FSP CAP C.U CHANNEL MEMBERS No Ton % 0 R W
1 0 35 30 50 R 2 0 0 10 10 0 3 0 10 3 33 0 R 4 5 35 6 100 R W 5 0 5 21 24 0 R 6 0 0 21 14 0 7 0 10 9 44 0 8 0 0 5 40 0 9 0 0 5 20 0
10 0 0 12 50 0
30urce Primary data
~ey
NSP - Nearest selling point (distance in kms from the firm)
FSP - Farthest selling point (distance in kms from the firm)
CAP - Installed Capacity (Tons) C.U - Capacity Utilisation (%)
o - Own outlet R - Retailer W - Wholesaler
The manufacturers using retailers are found to reach
centres fi,e to thirty five km from the factory. In 10% of
171
the sample, wholesalers, are used to distribute the product
at distant places. Such units are observed to deal with
other products as well, where wholesalers are being used.
The units that reach distant markets use their o~~ vehicles
to transport the items to the middlemen. The flow of
biscuits from the manufacturers to consumers
various ctannels is shown in Figure 5.4.1
through
5.~ MARKETING CHANNELS OF PROCESSED SPICES ~~~FACTURING
UNITS
5.5.1 The Processed spices are reported to have a mean
shelf life of slightly ov~r two months (67 days). This
makes it possible for man~£acturer to take 3 to 4 days to
move the product to the consumers. There are cases where
the packed item reach the retail outlets after seven days
from date of manufacture.
The processed spices from the SSI sector is marketed within
the state and also in the neighbouring states. A few units
are exporting their products.
The increasing demand for convenience food products and the
large number of units'in the spices processing sector makes
the market dynamic. The sprouting up of a series of SSI
172
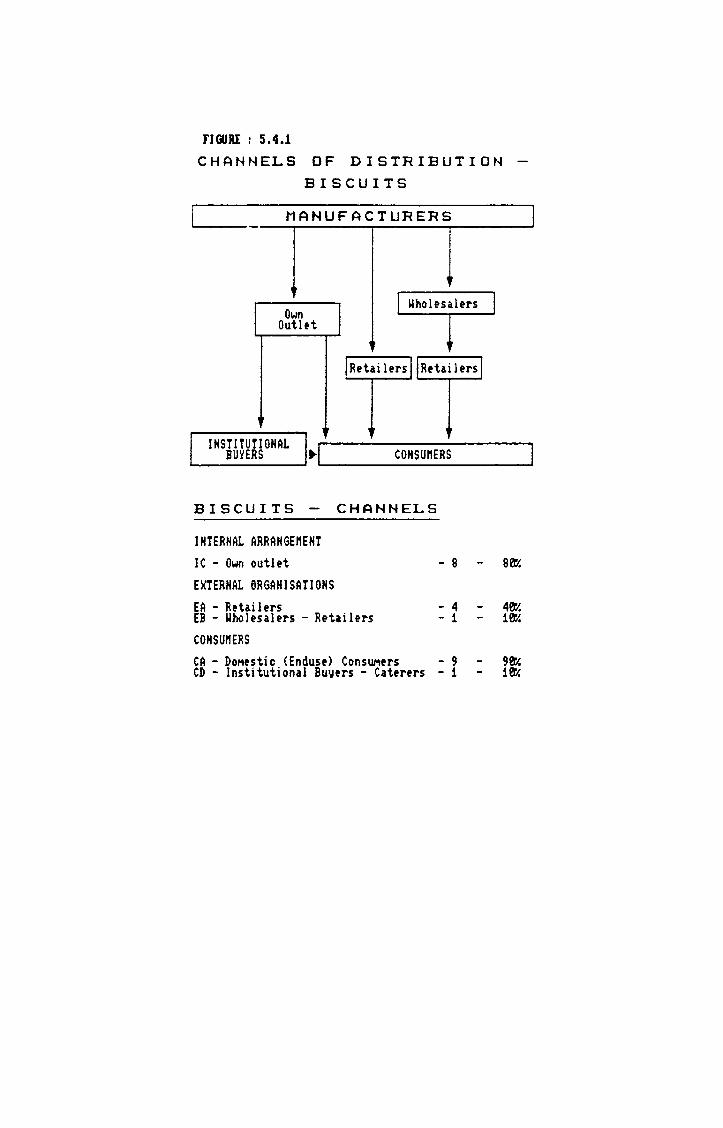
flOOR! : 5.4.1
CHANNELS OF DISTRIBUTION BISCUITS
MANUFACTURERS
Own Outlet
BUHRS ...
1 IIholesalers
CONSUI1ERS INSTITUTIONAL ~I
~--------------------~
BISCUITS - CHANNELS
INTERNAL ARRANGEI1ENT IC - Own outlet E~TERNAL ORGANISATIONS EA - Retai I ers EB - Uholesalers - Retailers
CONSUI1ERS
- 8
- 4 - 1
CA - DOMestic <Enduse> ConsUMers - 9 98Y. CD - Institutional Buyers - Caterers - 1 18Y.
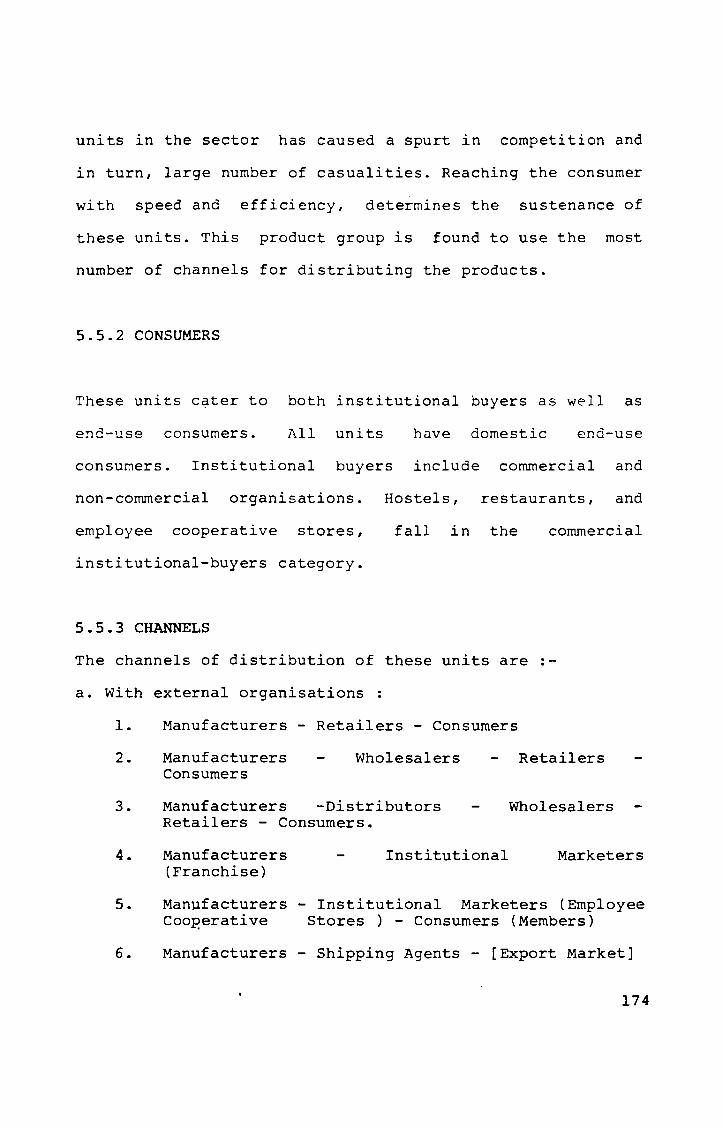
units in the sector has caused a spurt in competition and
in turn, large number of casualities. Reaching the consumer
with speed and efficiency, determines the sustenance of
these units. This product group is found to use the most
number of channels for distributing the products.
5.5.2 CONSUMERS
These units c~ter to both institutional buyers as well as
end-use consumers. All units have domestic end-use
consumers. Institutional buyers include commercial and
non-commercial organisations. Hostels, restaurants, and
employee cooperative stores, fall in the commercial
institutional-buyers category.
5.5.3 CHANNELS
The channels of distribution of these units are :-
a. With external organisations :
1. Manufacturers - Retailers - Consumers
2.
3.
Manufacturers Consumers
Wholesalers
Manufacturers -Distributors Retailers - Consumers.
Retailers
Wholesalers
4. Manufacturers (Franchise)
Institutional Marketers
5. Manufacturers - Institutional Marketers (Employee Coop,erative Stores) - Consumers (Members)
6. Manufacturers - Shipping Agents - [Export Market]
174
b. Without external organisations
1. Manufacturers -(Door-to-Door sales by self) Consumers
2.
3.
Manufacturers -(Door-to-Door sales by Consumers (Institutional Buyers)
Manufacturers- (Door-to-Door representatives) - Consumers.
sales
self)-
by sales
4. Manufacturers representatives) Buyers)
(Door-to-Door sales by sales Consumers (Institutional
5. Manufacturers - Own outlets - Consumers
The Manufacturer - Retailer - Consumer channel is the most
prominent one, used by 80% of the manufacturers. The
manufacturer-wholesaler-retailer-consumer marketing channel
comes second with 33% of the manufacturers using the same.
Door-to-door sales by the promoters themselves is a means
used to augment the distribution efforts by these SS!
units. 27% of the units use this channel along with the
channels involving retailers. Sales representatives are
also used to effect door-to-door sales. The units using
retailers do not use them in exclusion of other channel
members. Though very few units use their own outlets for
marketing their processed spices, a minority among them use
this channel alone.
175

This sector also witnesses a different channel in that a
few SSI units work as franchisees of larger marketing
organisations. This channel for reaching the market, saves
these manufacturers some of the problems related to
marketing, and hence they have time to concentrate more on
the production related aspects. Moreover such units are
found to be reaching limited areas geographically on their
own. Of these, except for a minority, most of the units
also use other channels to market their products directly
to the consumers. Units that do not have channels other
than the franchiser are found to be uninterested in the
other channel options available. Interestingly, it was
mentioned by such units that they had earlier used some of
the other channels, before tying up with the larger
marketing firms.
About 13% of the units are exporting their products. Their
awareness regarding
to the extent of
the channels for exporting, is limited
the shipping agents. They also have
regional markets, and reach up to 35 km from the location of
the units.
Table 5.5.1 provides the details of the processed spices
manufacturing SSI units.
176
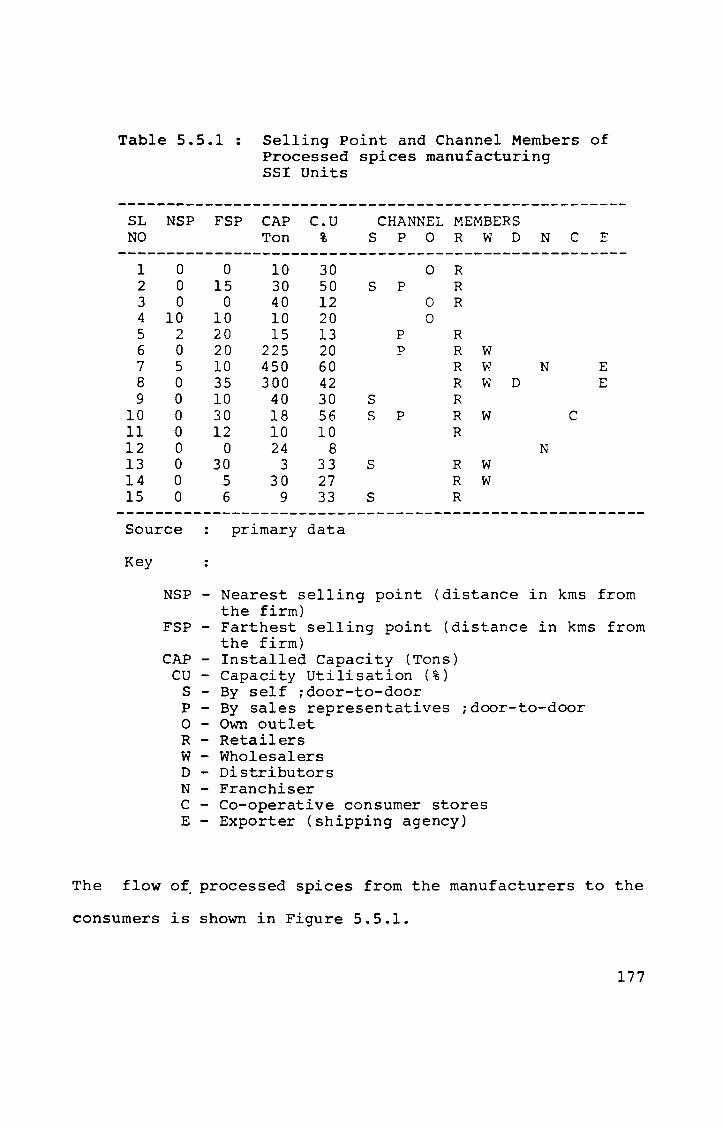
Table 5.5.1: Selling Point and Channel Members of Processed spices manufacturing SSI Units
SL NSP FSP CAP C.U CHANNEL MEMBERS NO Ton % S P 0 R W D N C E
-----------------------------------------------------1 0 0 10 30 0 R 2 0 15 30 50 S P R 3 0 0 40 12 0 R 4 10 10 10 20 0 5 2 20 15 13 P R 6 0 20 225 20 P R W 7 5 10 450 60 R W N E 8 0 35 300 42 R W D E 9 0 10 40 30 S R
10 0 30 18 56 s P R W C 11 0 12 10 10 R 12 0 0 24 8 N 13 0 30 3 33 S R W 14 0 5 30 27 R W 15 0 6 9 33 S R
Source primary data
Key
NSP - Nearest selling point (distance in kms from the firm)
FSP - Farthest selling point (distance in kms from the firm)
CAP - Installed Capacity (Tons) CU - Capacity Utilisation (%)
S - By self ;door-to-door P - By sales representatives ;door-to-door o - Own outlet R - Retailers W - Wholesalers D - Distributors N - Franchiser C - Co-operative consumer stores E - Exporter (shipping agency)
The flow of processed spices from the manufacturers to the
consumers is shown in Figure 5.5.1.
177

I
I
fIWRI· : 5.S.1
CHANNELS OF DISTRIBUTION - SPICES
MANUFACTURERS J
+ ~ "I Exporters I Door-to-Door I Distributors I sal ~s by
S~lf
1 Door-to Institutional Door Own
IUhol~sal~rsl l~hOI~sal~rsl .. narhters sales by Ol!tl ~t Sal~sMen i
FranchiH I
! I nsti tutl onal narhters ..
IR~tail~rsl IR~tail~rsl IR~tail~rsJ Cons. Co-op. Soci.tits
t
CONSUnERS I ·IINSTITUTIONAL +- BUYERS
SPICES - CHANNELS
INTERNAL ARRANGEMENT
lA - Door-to-Door sales by Self IB - Door-to-Door sales by Sal~sMan IC - Own Outl~t
EXTERNAL ORGANISATIONS
EA - htai lers EB - Uholesalers - Retail~rs
+ 1
EC - Distributors - Uholesalers - Retailers EF - Institutional nark~ters (Franchise> EG - Institutional nark.ters (Co-op~rative Societies>
EXPORT
XA - Export.rs (Shipping Ag.nts)
CONSUnERS
CA - DoMtstic (Endus.) ConsUM~rs CB - Institutional Buy.rs CC - Institutional Buyers (Hotel, R.staurant)
CONSUnERS I
- 5 - 33r. - 4 - 27r. - 3 - 2~
-12 - 8~ - 5 - 33r. - 1 7r. - 2 - 13r. - 1 7r.
- 2 - 13r.
-11 - 73j( - 3 - 2~ - 1 7j(

5.6 MARKETING CHANNELS OF PICKLES MANUFACTURING SSI UNITS
5.6.1 The pickles have a mean shelf life of 302 days as
reported by the SSI manufacturers of these products. While
tastes of consumers differ, there is a general feeling that
pickles are more palatable, the more mature they are.
Since the fruits that are mostly pickled are seasonal in
availability, the manufacturers rrocure the same in bulk
and pickle them for distribution during off-seasons. Hence
speed in distribution is not a major factor for marketing
these products.
Three-fourth the manufacturers have branded their products.
This is a pre-requisite for a product like pickle, which is
observed to be preferred generally based on the brand-name.
5.6.2 CONSUMERS
Pickles manuf~ctured by the SSI units are found to be
entirely aimed at the end-use consumers. Institutional
buyers have not been reported by the sampled units. This
could be realistic, considering the fact that preparation
of pickles is not a technically complex process. Commercial
establishments, including hotels,restaurants, caterers, and
179
hostels which need pickles, have their own arrangements for
preparing the same. In- house preparation of pickles would
be cost- effective for such institutions. This stresses the
need for the SSI pickle manufacturing units to target the
end-use consumers rather than the institutions.
5.6.3 CHANNELS
The marketIng channels used by these SSI units are typical
ones employed by the consumer goods manufacturers.
a. With external organisations .-
1. Manufacturers - Distributors - Retailers - Consumers
2. Manufacturers - Wholesalers - Retailers - Consumers
3. Manufacturers - Retailers -Consumers
4. Manufacturers - Shipping Agents - [Export Market]
b. Without external organisations .-
1. Manufacturers
2. Manufacturers Consumers
Own outlets - Consumers(end-use)
(Door-to-Door-sales by self)-
3. Manufacturers - (Door-to-Door sales by sales -representatives) - Consumers.
180
The door-to-door sales efforts serve more as a promotional
function than as a distribution system. But for these SSI
units, the distinction between the two functions is not
readily noticeable. For marketing pickles, the channels
more frequently used are the manufacturer - wholesaler
retailer - consumer channel and the manufacturer - retailer
consumer channel. These c~annels are used by half the
sample units.
Some of the units are found to rely on their own outlet for
distributing their entire output of pickles. These units
effect sales only from their own outlets.
Some
the
of the units which also export their
distribution of pickles within
products entrust
the state with
jistributors. The distributors use their own systems for
~ransferring the products to the retailers directly.
Half the units sampled have export markets for their
products. These units transfer the product to their
shipping agent, who in fact, looks after the requirements
beyond that lev'el. The manufacturing units could not
provide much information regarding the subsequent stages of
the marketing process or channel structures.
181
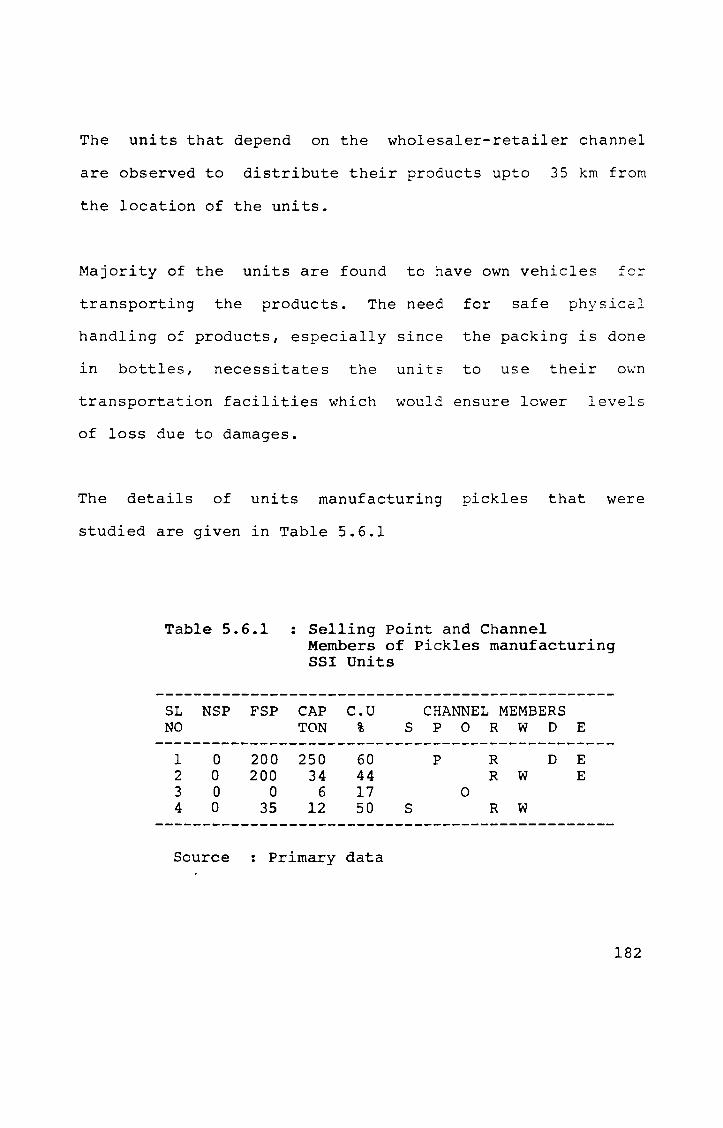
The units that depend on the wholesaler-retailer channel
are observed to distribute their products upto 35 km from
the location of the units.
Majority of the units are found to have own vehicles
transporting the products. The need for safe physical
handling of products, especially since the packing is done
in bottles, necessitates the units to use their own
transportation facilities which would ensure lower levels
of loss due to damages.
The details of units manufacturing pickles that were
studied are given in Table 5.6.1
Table 5.6.1 : Selling Point and Channel Members of Pickles manufacturing SSI Units
SL NSP FSP CAP C.U CHANNEL MEMBERS NO TON % S P 0 R W D E
------------------------------------------------1 0 200 250 60 P R D E 2 0 200 34 44 R w E 3 0 0 6 17 0 4 0 35 12 50 S R W
Source : Primary data
182

Key
NSP Nearest selling point (distance in kms froIT. the firm)
FSP - Farthest selling point CAP - Installed Capacity (Tons) C.U - Capacity Utilisation (%)
S - Door-to-door sales by self P - Door-to-door sales by sales
representatives o - Own outlet R - retailers W - wholesalers D - Distributors E - Exporters (Shipping Agent)
The Figure 5.6.1 depicts the flow of pickles from the
nanufacturers to the consumers through the various
channels.
183

FIOORI : 5.6.1
CHANNELS OF DISTRIBUTION - PICXLES
I MANUFACTURERS I
I !Distr-ibutorsl
IDOOr-to-dOO~IIDOOr-to-Doorl I ! ! ;a.I~s by 11 saj~s by I I S~lf Sal~sM~n I • , I
ShIppIng +- A9~nts
IOwn Outl.ts 111 UhOl"f m I
1 IR.tailm HR.ta; i"" IIR.ta; Im I
CONSUMERS
PICXLES CHANNELS
INTERNAL ARRANGEMENT lA - Door-to-Door sal~s by Self IB - Door-to-Door sales by SaleSMen IC - Own Outlet
EXTERNAL ORGANISATIONS
EA - Retai 1 el'S EB - Uholesalers - Retailers ED - Distributors - Retailers
EXPORT MARKET XB - Shipping Agents
CONSUMERS CA - DOMestic
- 1 - 1 - 1
- 2 - 2 - 1
- 2
- 4
2Sr. 25r. 25r.
S~ 5~ 25r.
10~
CHAPTER 6
6.0 ANALYSIS AND FINDINGS
6.1 CHANNEL RELATIONSHIP AND ~ERFORMANCE
The small scale industrialists operate within a series of
constraints. Noticeable among them are:
a paucity of financial resources, which restrict them
in generating adequate awareness about themselves.
an inability to build-up a creditable image among the
consumers, which would have otherwise lead to high
levels of loyalty to their products/brands.
a lack of scientific approach to marketing, resulting
in improper deployment of resources and less effective
processes.
a tendency to imitate rather than evolve plans or
strategies to make full use of strengths to exploit
potential market.
ill defined channel objectives, so much so that an
evaluation of channel performance does not provide an
185
adequate measure of expectation and realisation of the
SSI units.
An attempt has been made in this study to examine the
extent to which the SSI manufacturers can influence the
behatiour of the external channel members. In this
analysis, only the perceptions of these SSI units with
reference to their capability, to influence the channel
members in performing according to their expectations, is
considered. The inter-organisational behaviour down the
line in each different channel employed by the SSI
manufacturers, determines the longivity and effectiveness
of the relationship. This relationship has a direct impact
on the effectiveness in accomplishment of objectives.
For this study, the relationships and perceptions are
examined from the manufacturers perspective. The perception
of the manufacturers regarding the power and leadership
that they can exert over the channels were recorded. Since
communication is the linking element in development and
maintenance of relationships, the manufacturers also
recorded their perception about the extent to which they
can control communication
channel members.
between themselves and the
186
Other than relationship, the performance of the channels,
in terms of operations, was also studied. The extent to
which the manufacturers can influence the channel
operations is reflected by their willingness to take some
specific approaches. Hence, the two sets of approaches were
taken up for detailed study.
The first stage in this study involved the recording of
two sets of manufacturers orientation towards the
Approaches as listed earlier in section 2.4.2. In the next
stage,
regarding
the manufacturers
different outcomes
recorded
that
adopting the listed Approaches.
6.2 POWER
their perceptions
could emanate from
The ability of one channel member to influence or alter the
decisions of other channel members indicates the power the
member can exert in channel relationship. The marketing
manager must understand the sources of and the points at
which the power exists. The small industrialist who
generally looks after all the managerial functions, rarely
with any support from professionals, are observed to move
by 'hunches'. It is yet to be proved whether these hunches
are intuitive or based on a systematic study of the
environment.
187

A hypothesis that is sought to be tested is that the small
scale industrialist is deficient in the power that he can
exert in managing the marketing channels he employs.
Power is not always discernible in all interactions among
channel members. It is present as a potential force to be
engaged, at the required place and time by the one who
possesses it. The effectiveness of this potential power
depends on how it is perceived by others. The member who is
perceived to be powerful can influence the behaviour of the
others.
The perception of relative power advantage between the
different channel members refers to the degree of power
held by
others.
any
This
single channel member
variation determines
in relation to the
the evolution of
subjugation, dependence or conflict in channel
relationships.
The extent of power that any channel member can exert on
any other channel member is dependent on the strength of
the force the former can induce on the other, less the
strength of the resisting force the other can activate in
the opposite direction. The power relationships that exist
188

in the marketing channels are identified as originating
from a few power bases.
These power bases are Reward power, Coersive power,
Referent power, Expert power and Legitimate power.
Reward power - This is based on a firm's capability to
compensate another for its loyalty or support. The
magnitude of the reward and the probability that the reward
will be forthcoming are two aspects that deter~ine the
existence of this power. It is manifested as the ability of
one firm to bestow positive benefits and to remove or
reduce negative outcomes.
Coercive Power - This is based on a firm's capability to
impose penalty for not performing according to expectation.
The coercive power is existent on the magnitude of the
punishment and the probability that the punishment is
forthcoming. The ability to inflict negative penalties and
to remove or reduce positive outcomes are manifestations of
this power.
Attraction Power - Also termed 'referent power', this is
the basis for channel members to identify with one another.
This helps close association between two members as it
189
instills a feeling of closeness or oneness. The sense of
identification, prompts the members to seek avenues for
working together towards mutually complementary objectives.
This in effect also helps each member to realise its own
individual goals by being supportive to the others.
It is noticed that the reward power and coercive power
leads to or deters from the development of attraction
power. The existence of this power among the s~all scale
industrialists is a factor that needs deeper analysis as
the SSI can perform much better with higher levels of this
power.
Expert Power - This is based on the premise that a channel
member has superior resources of knowledge and information
on specific aspects. The relatively higher information base
perceived in a channel member instigates others to seek
advice or guidance from him, in matters of managing
operations. This power is limited in range to very specific
areas of competence.
Legitimate Power - This is based on the acceptance by a
channel member that another has the right to dictate terms
and to prescribe its behaviour. This power exists at high
levels of credibility. Social values and structures that
190
have evolved culturally, play a prominent role in the
perception of this power. These values and structu=es could
be internalised ones or those authenticated by an outside
'legitimising agent'.
The small scale industries that operate in the food sector
were studied with
power base
marketing
they
respect to their perception about which
could activate for influencing the
channels. The rewa=j power, coercive ?ower and
expert power bases were taken ~p.
Three approaches that the s~all scale firms could take,
based on the above three powe= bases were examined. These
approaches, if adopted by the =irm, would indicate that the
respective power base is being activated and that the firm
being aware of its advantage with respect to that power
base, would exert the same to influence the channel members
so as to get its decisions imp:emented.
6.2.1 APPROACH Al :- To reward channel members for better
performance
This approach indicates the use of a firm's reward power
base. For this study, reward is taken as monetary or other
benefits that the manufacturer offers the channel members
191
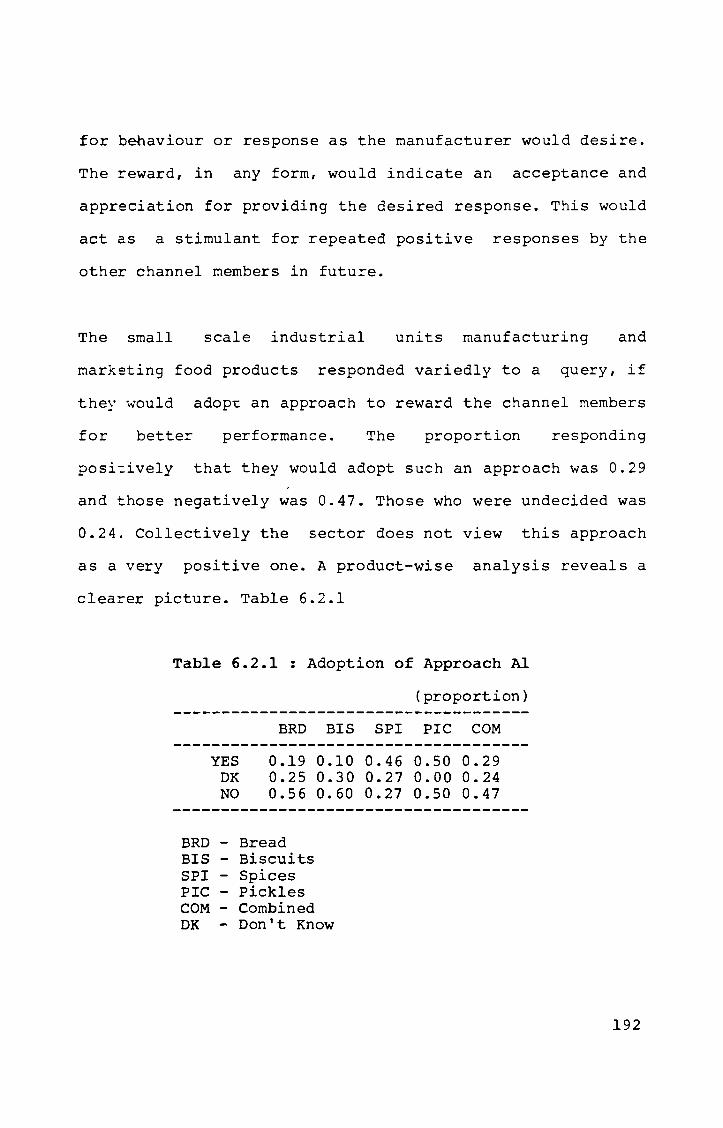
for behaviour or response as the manufacturer would desire.
The reward, in any form, would indicate an acceptance and
appreciation for providing the desired response. This would
act as a stimulant for repeated positive responses by the
other channel members in future.
The small scale industrial units manufacturing and
marketing food products responded variedly to a query, if
they would adop~ an approach to reward the channel members
for better performance. The proportion responding
posi~ively that they would adopt such an approach was 0.29
and those negatively was 0.47. Those who were undecided was
0.24. Collectively the sector does not view this approach
as a very positive one. A product-wise analysis reveals a
clearer picture. Table 6.2.1
Table 6.2.1 : Adoption of Approach AI
(proportion)
BRD BIS SPI PlC COM
YES 0.19 0.10 0.46 0.50 0.29 DK 0.25 0.30 0.27 0.00 0.24 NO 0.56 0.60 0.27 0.50 0.47
BRD - Bread BIS - Biscuits SPI - Spices PlC - Pickles COM - Combined DK - Don't Know
192
The SSI units in the bread and biscuits lines are more
inclined not to take· this approach. About one-fourth in
both groups are
segment of these
this approach, it
not sure of their preference. As a major
groups are apprehensive about adopting
can be taken that these groups are not
high as far as the perceived reward power base is
concerned. This indicates that these firms realise that
their offers of reward will not influence the behaviour of
the channel members.
The processed spices manufacturing units have a higher
level of perceived reward power base. Nearly half the units
would go for this approach. Over one-fourth of the units
are not sure,while an equal proportion will not adopt such
an approach.
Similar to the spices units, the pickles manufacturing
firms too have a higher level of perceived reward-power
base. But in this group, as different from the spices
group, half the units would not take such an approach. On
further analysis of available primary data, it is seen that
these units have reached a stage where they have realised
that rewards do not stimulate the channel members to
perform as they would prefer.
193
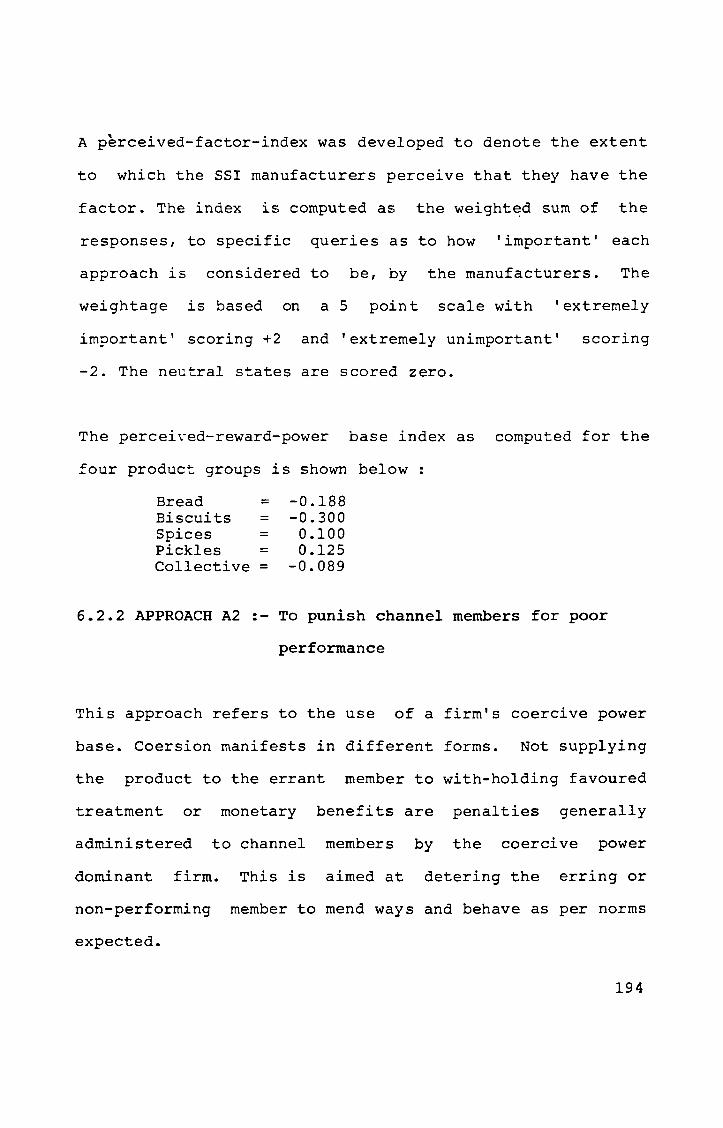
A perceived-factor-index was developed to denote the extent
to which the SS! manufacturers perceive that they have the
factor. The index is computed as the weighted sum of the
responses, to specific queries as to how 'important' each
approach is considered to be, by the manufacturers. The
weightage is based on a 5 point scale with 'extremely
important' scoring +2 and 'extremely unimportant' scoring
-2. The neutral states are scored zero.
The perceived-reward-power base index as computed for the
four product groups is shown below :
Bread = Biscuits = Spices = Pickles = Collective =
-0.188 -0.300
0.100 0.125
-0.089
6.2.2 APPROACH A2 :- To punish channel members for poor
performance
This approach refers to the use of a firm's coercive power
base. Coersion manifests in different forms. Not supplying
the product to the errant member to with-holding favoured
treatment or monetary benefits are penalties generally
administered to channel members by the coercive power
dominant firm. This is aimed at detering the erring or
non-performing member to mend ways and behave as per norms
expected.
194
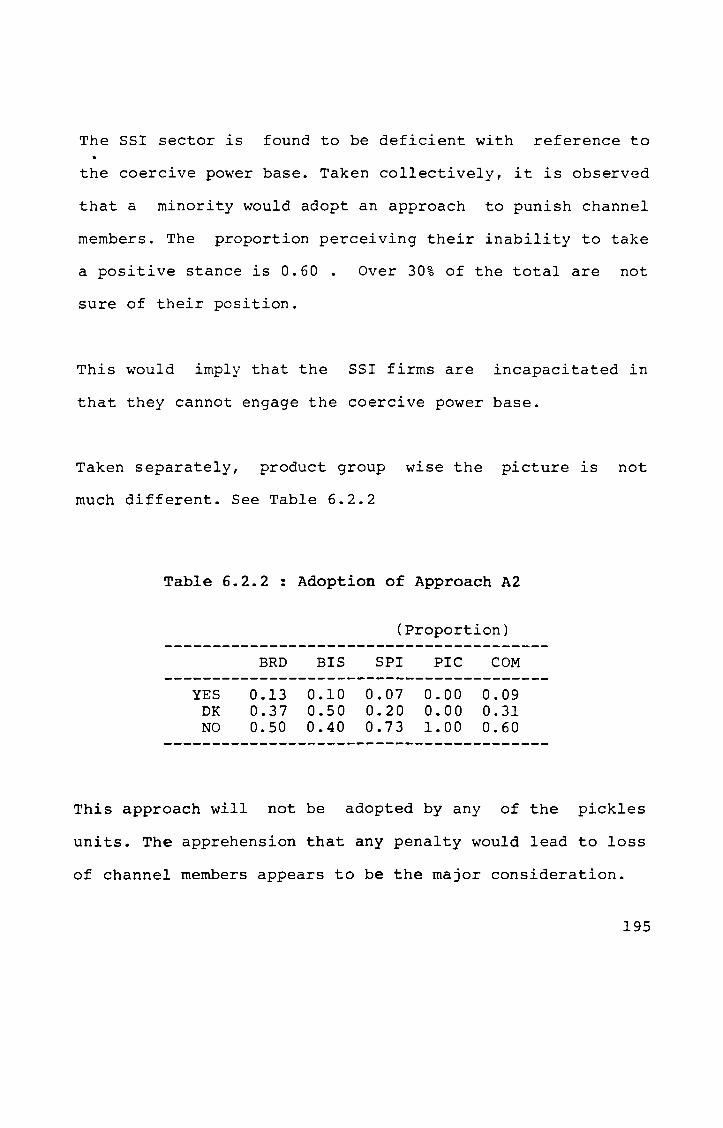
The SSI sector is found to be deficient with reference to
the coercive power base. Taken collectively, it is observed
that a minority would adopt an approach to punish channel
members. The proportion perceiving their inability to take
a positive stance is 0.60. Over 30% of the total are not
sure of their position.
This would imply that the SSI firms are incapacitated in
that they cannot engage the coercive power base.
Taken separately, product group wise the picture is not
much different. See Table 6.2.2
Table 6.2.2 : Adoption of Approach A2
YES DK NO
BRD
0.13 0.37 0.50
BIS
0.10 0.50 0.40
(Proportion)
SPI
0.07 0.20 0.73
PlC
0.00 0.00 1.00
COM
0.09 0.31 0.60
This approach will not be adopted by any of the pickles
units. The apprehension that any penalty would lead to loss
of channel members appears to be the major consideration.
195
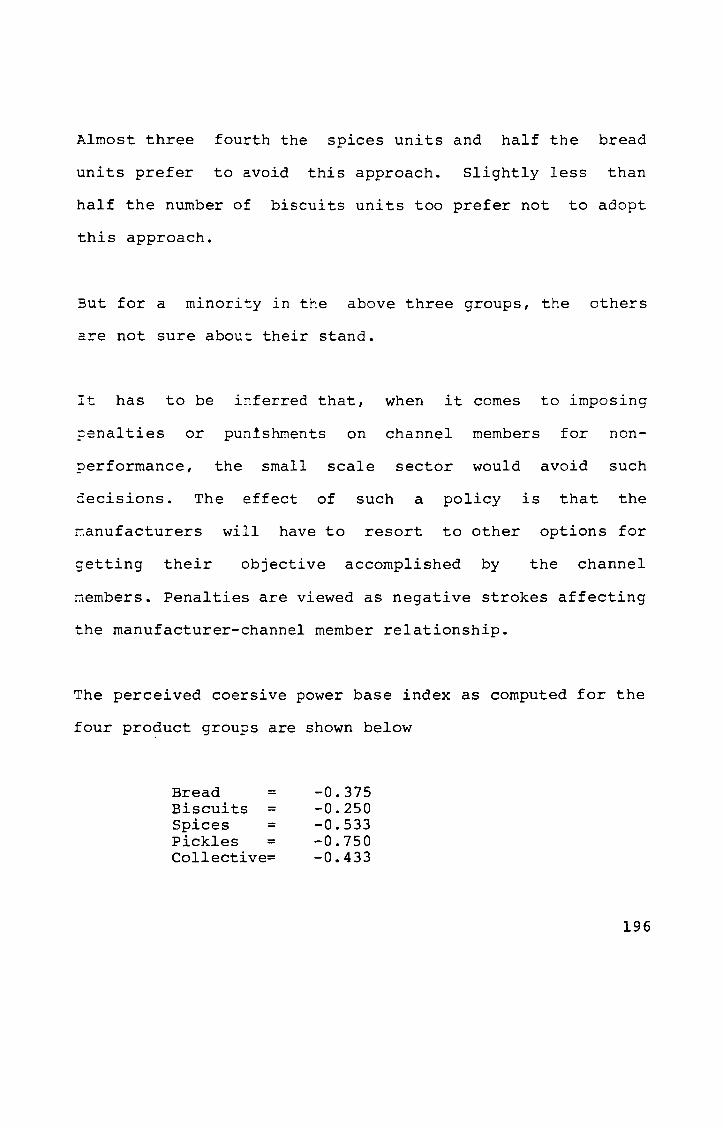
Almost three fourth the spices units and half the bread
units prefer to avoid this approach. Slightly less than
half the number of biscuits units too prefer not to adopt
this approach.
3ut for a minori~y in the above three groups, the others
are not sure abou~ their stand.
It has to be i~ferred that, when it comes to imposing
~enalties or punishments on channel members for non-
performance, the small scale sector would avoid such
Gecisions. The effect of such a policy is that the
nanufacturers will have to resort to other options for
getting their objective accomplished by the channel
nembers. Penalties are viewed as negative strokes affecting
the manufacturer-channel member relationship.
The perceived coersive power base index as computed for the
four product groups are shown below
Bread = Biscuits = Spices = Pickles = Collective=
-0.375 -0.250 -0.533 -0.750 -0.433
196

6.2.3 APPROACH A3:- To guide and advice channel
members on how to perform
This approach refers to the use of a firm's expert power
base. The knowledge or expertise of the dominant member
acts as an inducement for the other channel members to seek
guidance. The expertise being restricted to specific
aspects, the exertion of power over other members would be
limited in range.
The small scale industries collectively seem to perceive
themselves as having a higher expert power base. The fact
that these products are prepared more by the skill of the
entrepreneur than by technological sophistication, the
manufacturer would have a definite advantage with respect
to knowledge of the product. Control over modifications in
product attributes also is a prominent factor.
Collectively, the proportion of units that would adopt a
positive approach to guide and advice channel members is
0.51. Table 6.2.3. These manufacturers perceive themselves
as capable of providing expert opinion to the channel
members. From the discussions with the SSI manufacturers,
it emerged that the guidance offered related to aspects of
display, proper physical handling, preservation of quality
till sales of the items and handling customer reactions.
197
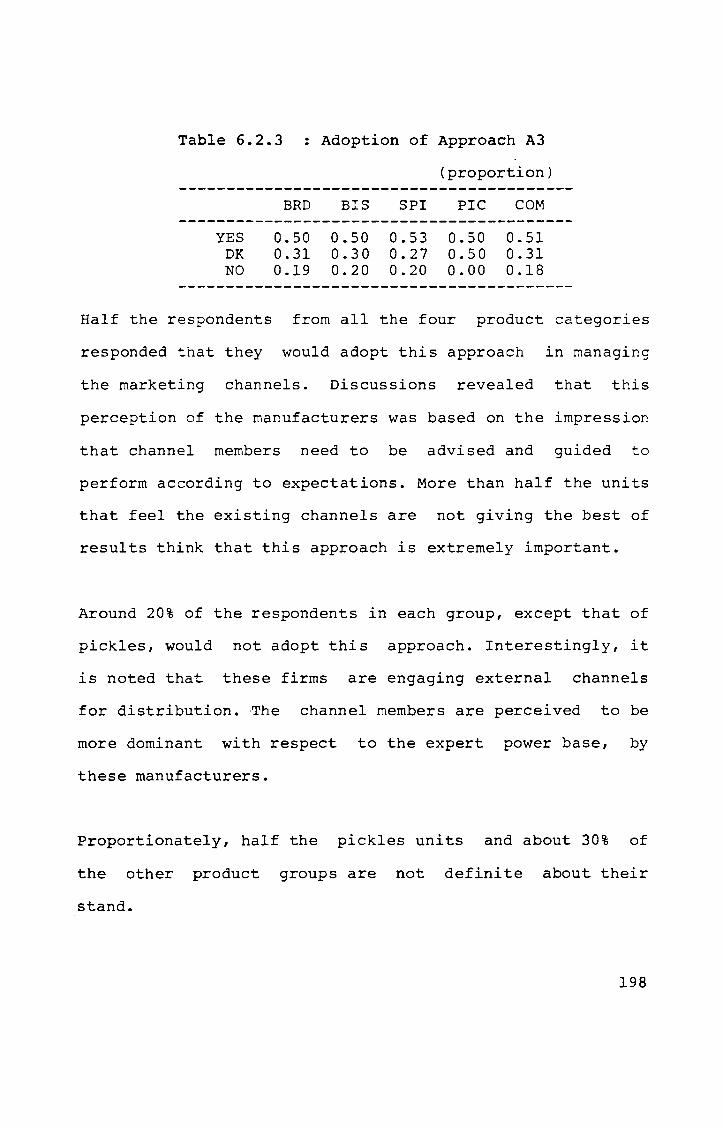
Table 6.2.3
YES DK NO
BRD
0.50 0.31 0.19
Adoption of Approach A3
BIS
0.50 0.30 0.20
SPI
0.53 0.27 0.20
(proportion)
PlC
0.50 0.50 0.00
COM
0.51 0.31 0.18
Half the respondents from all the four product categories
responded that they would adopt this approach in managing
the marketing channels. Discussions revealed that this
perception of the manufacturers was based on the impression
that channel members need to be advised and guided to
perform according to expectations. More than half the units
that feel the existing channels are not giving the best of
results think that this approach is extremely important.
Around 20% of the respondents in each group, except that of
pickles, would not adopt this approach. Interestingly, it
is noted that these firms are engaging external channels
for distribution. ~he channel members are perceived to be
more dominant with respect to the expert power base, by
these manufacturers.
Proportionately, half the pickles units and about 30% of
the other product groups are not definite about their
stand.
198

The perceived expert-power base index computed for the four
product categories are
Bread = 0.188 Biscuits = 0.200 Spices = 0.233 Pickles = 0.500 Collective= 0.233
6.2.4 Perceived power bases of SS! firms
The different sources of power are discussed in detail in
marketing literature and presents a typology. But rarely
does a particular power base become the exclusive source
for a firm to attempt influencing others. It would be more
correct to state that a power position results from a
combination of power bases.
The three power bases - reward, coersive and expert, were
taken together to obtain a combined measure of the
perceived power bases, viz-a-viz the marketing channels.
This index was
individually.
Bread = Biscuits = Spices = Pickles = Collective=
computed for each product group
-0.125 -0.117 -0.067 -0.042 -0.096
The indexes are all negative values which implies that the
SSI firms operate with negative perceived power base.
199
Though individual units may be capable of influencing the
marketing channels, collectively, the sector views itself
as powerless compared to the channel members.
This in effect
marketing system
comply with the
initiative rests
manufacturers.
affects the smooth operation of the
unless the manufacturers are willing to
dictates of the channel members. The
with the channel rather than with the
The collective index for perceived power base for all
categories together is -0.096. The score could have ranged
from +1 to -1; indicating extremely high power state to
extremely low power state respectively.
The SSI will have to analyse the reasons for this negative
situation. The factors which contribute to their perceiving
themselves as less powerful than the channel members must
be identified. Adequate in-house systems will have to be
evolved or necessary modifications in the existing support
systems will have to be made so as to off set this
disadvantage.
It may be inferred that with a low level of perceived
power, the SSI units prefer to maintain existing
200
relationship by not resorting to activating the power
bases. By taking specific care not to upset relationship
with the channels, and by not jUdiciously engaging the
potential power, the SSI manufacturers operate within the
extent of support offered by the channel members. In effect
these small firms are observed to be influenced in their
operations by the preferences of their channel members
rather than vice versa.
6.3 LEADERSHIP
The different members of the marketing channel operate on
varying policies and with diverse objectives. unless the
activities of these channel members are coordinated to
achieve synchronisation, higher costs, wastage and other
unfavourable outcomes may result. On the other hand very
tight coordination would restrict the channel members to
one single option which may not always be advisable. The
harmony in operations of the different members at different
levels should lead to increased efficiency and reduced
risks and costs.
Coordination can be achieved by the leadership that a
member can exercise in a channel. The leader role helps to
influence the behaviour of other channel members leading to
201
better relationship and resultant efficiency in
performance.
Leadership is derived from the channel members possession
of power and from the tolerance of other firms in accepting
direction. The fundamental purpose of leadership is to use
power in improving not only the system, but also individual
performance as well. Hence, the capability of a channel
member to elevate i~self to a leadership status is relevant
to the relationship between ~he members. It also reflects
the relative power differential existing or perceived in
the system.
6.3.1 APPROACH A4:- To take the role of a leader
for directing the operations of
the channel members
The SSI manufacturers perceived themselves as incapable of
exercising a leadership role in the channel. Collectively
these firms perceive a negative status for themselves in
their capacity to take up leadership. The firms included in
the study responded to a query whether they would adopt an
approach to take the role of a leader for directing the
operations of the channel members.
202
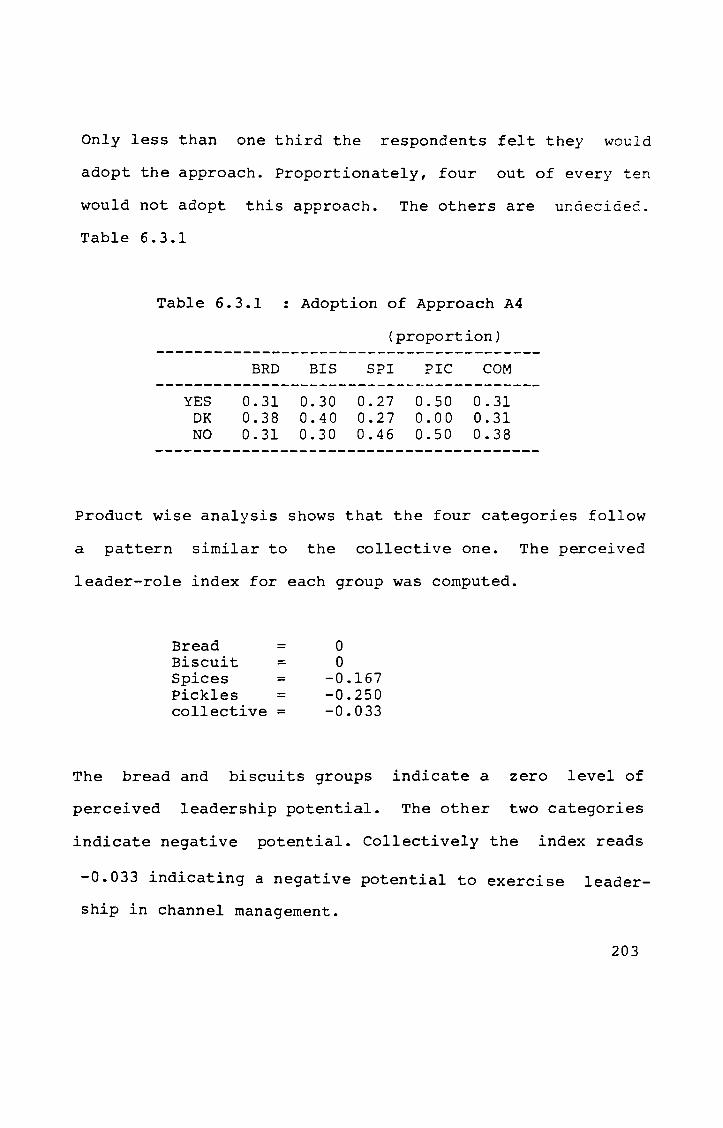
Only less than one third the respondents felt they would
adopt the approach. Proportionately, four out of every ten
would not adopt this approach. The others are undecided.
Table 6.3.1
Table 6.3.1 : Adoption of Approach A4
YES DK NO
BRD
0.31 0.38 0.31
BIS
0.30 0.40 0.30
(proportion)
SPI
0.27 0.27 0.46
PlC
0.50 0.00 0.50
COM
0.31 0.31 0.38
Product wise analysis shows that the four categories follow
a pattern similar to the collective one. The perceived
leader-role index for each group was computed.
Bread = 0 Biscuit = 0 Spices = -0.167 Pickles = -0.250 collective = -0.033
The bread and biscuits groups indicate a zero level of
perceived leadership potential. The other two categories
indicate negative potential. Collectively the index reads
-0.033 indicating a negative potential to exercise leader
ship in channel management.
203

6.3.2 Perceived potential for leader role
Marketing literature highlight the existence of mutual
dependence in channel relationships. The degree of mutual
dependence determines the extent of power that exists,
which helps influence behaviour. The concept of dependence
and relative power helps define channel interaction better.
Channel leadership evolves where a power advantage is
perceiveu. Though not general, the power related to
specific issues in any channel member promotes it to assume
a leadership role.
The small scale industries in the food sector are found to
perceive a negative leadership potential in their
interactions with the other channel members. This is
further authenticated by the fact that the collective
perceived power index also is negative.
This signifies a very critical status of the SSI sector.
The lack of perceived power and leadership potential puts
the sector at the receiving end. The image projected may
not be supportive to better performance, since the link
between themselves and the consumers - the channel, is not
perceived to be amenable to their control.
204
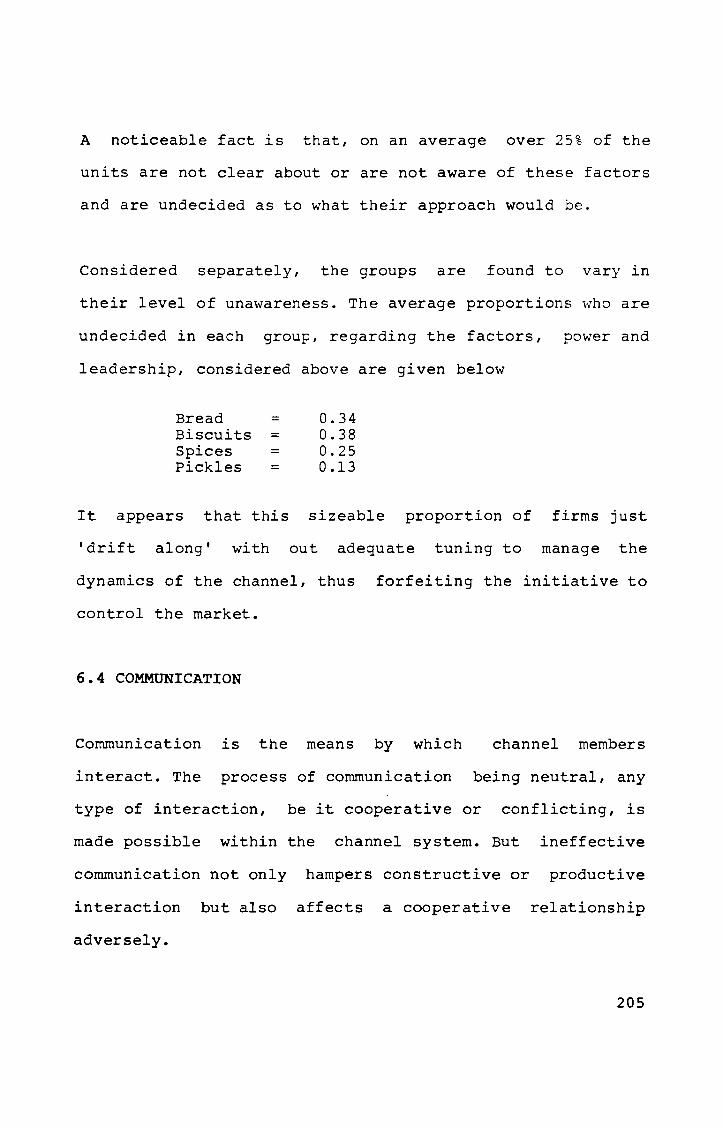
A noticeable fact is that, on an average over 25% of the
units are not clear about or are not aware of these factors
and are undecided as to what their approach would be.
Considered separately, the groups are found to vary in
their level of unawareness. The average proportions who are
undecided in each group, regarding the factors, power and
leadership, considered above are given below
Bread Biscuits Spices Pickles
= = = =
0.34 0.38 0.25 0.13
It appears that this sizeable proportion of firms just
'drift along' with out adequate tuning to manage the
dynamics of the channel, thus forfeiting the initiative to
control the market.
6.4 COMMUNICATION
Communication is the means by which channel members
interact. The process of communication being neutral, any
type of interaction, be it cooperative or conflicting, is
made possible within the channel system. But ineffective
communication not only hampers constructive or productive
interaction but also affects a cooperative relationship
adversely.
205

Effective communication acts as a deterrent to conflicts.
With development of common objectives, communication also
help eliminate or diffuse conflict situations.
An attempt was made to assess the extent to which SSI firms
appreciate the relevance of communication in effective
channel management.
6.4.1 APPROACH AS :- To insist on regular and periodic
communication about the activities,
problems, and results
The SSI firms were querried on whether they would adopt an
approach to build up a systematic communication arrangement
with the channel members. The aspects communicated could
embrace all matters connected with operations, including
problems and frustrations. A streamlined communication
would aid better acceptance of each other and boost
cooperative interaction.
This approach is considered as positive by about half the
respondents. A product wise analysis shows the pickles and
biscuits groups are relatively more favourable to adopting
this approach as compared to the other two groups. Table
6.4.1
206
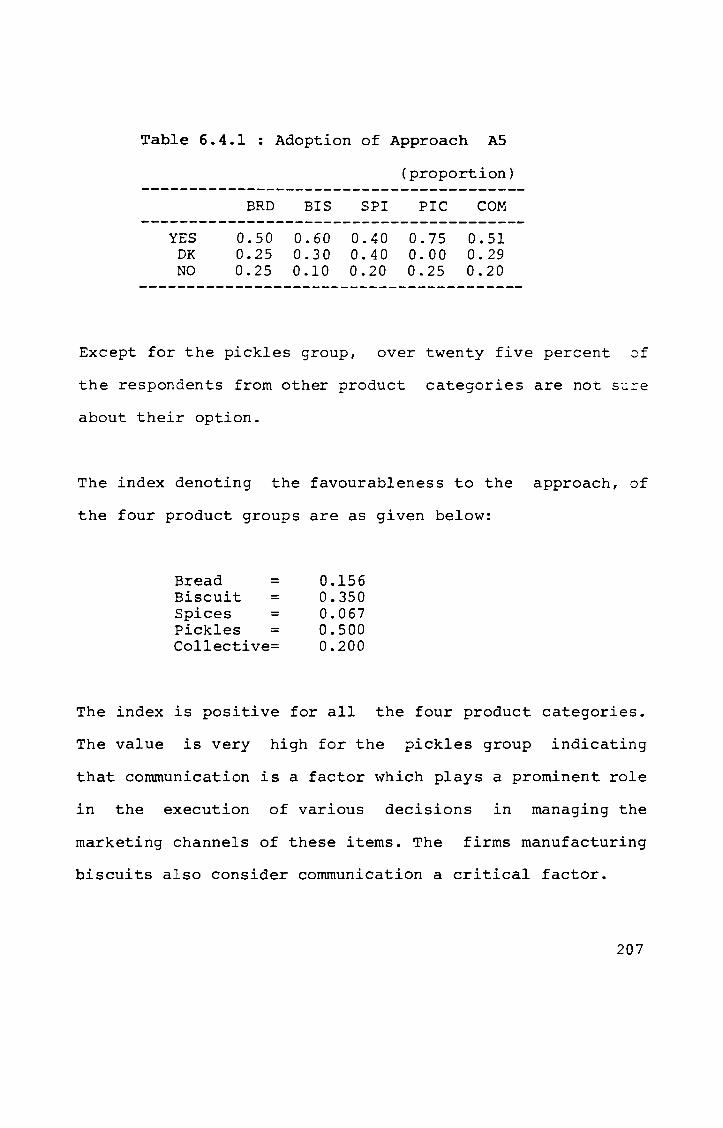
Table 6.4.1
YES DK NO
BRD
0.50 0.25 0.25
Adoption of Approach AS
BIS
0.60 0.30 0.10
SPI
0.40 0.40 0.20
(proportion)
PlC
0.75 0.00 0.25
COM
0.51 0.29 0.20
Except for the pickles group, over twenty five percent ~f
the respondents from other product categories are not s~=e
about their option.
The index denoting the favourableness to the approach, of
the four product groups are as given below:
Bread = 0.156 Biscuit = 0.350 Spices = 0.067 Pickles = 0.500 Collective= 0.200
The index is positive for all the four product categories.
The value is very high for the pickles group indicating
that communication is a factor \vhich plays a prominent role
in the execution of various decisions in managing the
marketing channels of these items. The firms manufacturing
biscuits also consider communication a critical factor.
207
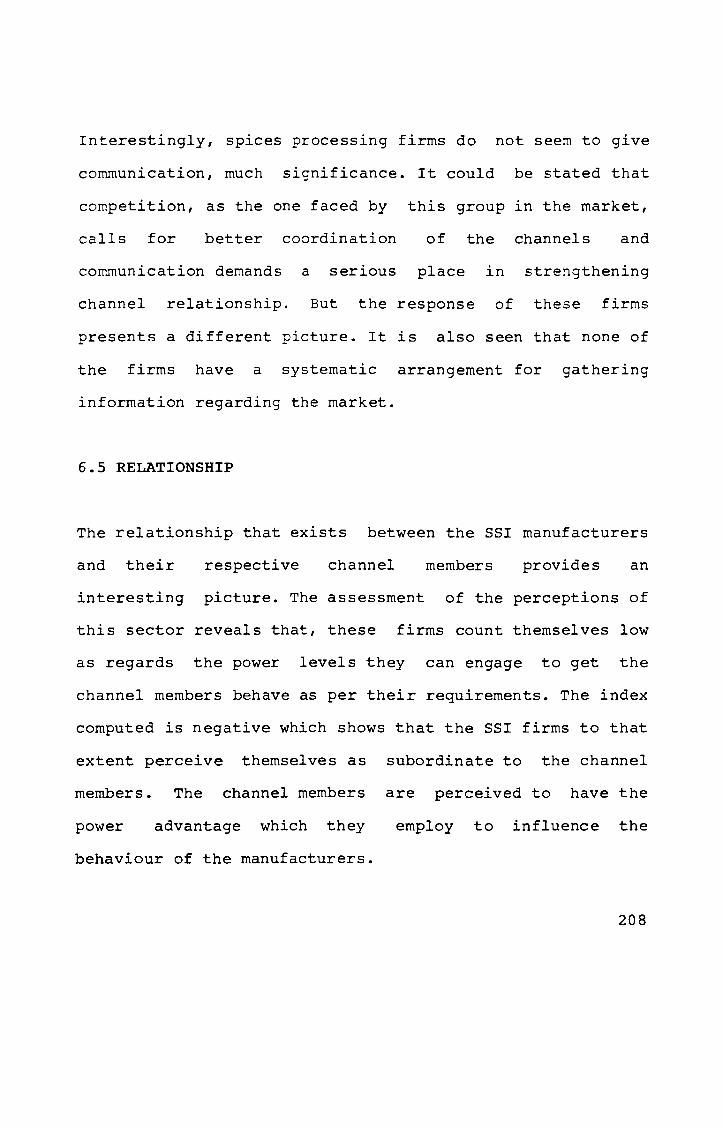
Interestingly; spices processing firms do not seem to give
communication, much significance. It could be stated that
competition, as the one faced by
calls for better coordination
this group in the market,
of the channels and
communication demands a serious place in strengthening
channel relationship. But the response of these firms
presents a different picture. It is also seen that none of
the firms have a systematic arrangement for gathering
information regarding the market.
6.5 RELATIONSHIP
The relationship that exists between the SSI manufacturers
and their respective channel members provides an
interesting picture. The assessment of the perceptions of
this sector reveals that, these firms count themselves low
as regards the power levels they can engage to get the
channel members behave as per their requirements. The index
computed is negative which shows that the SSI firms to that
extent perceive themselves as subordinate to the channel
members. The channel members are perceived to have the
power advantage which they employ to influence the
behaviour of the manufacturers.
208
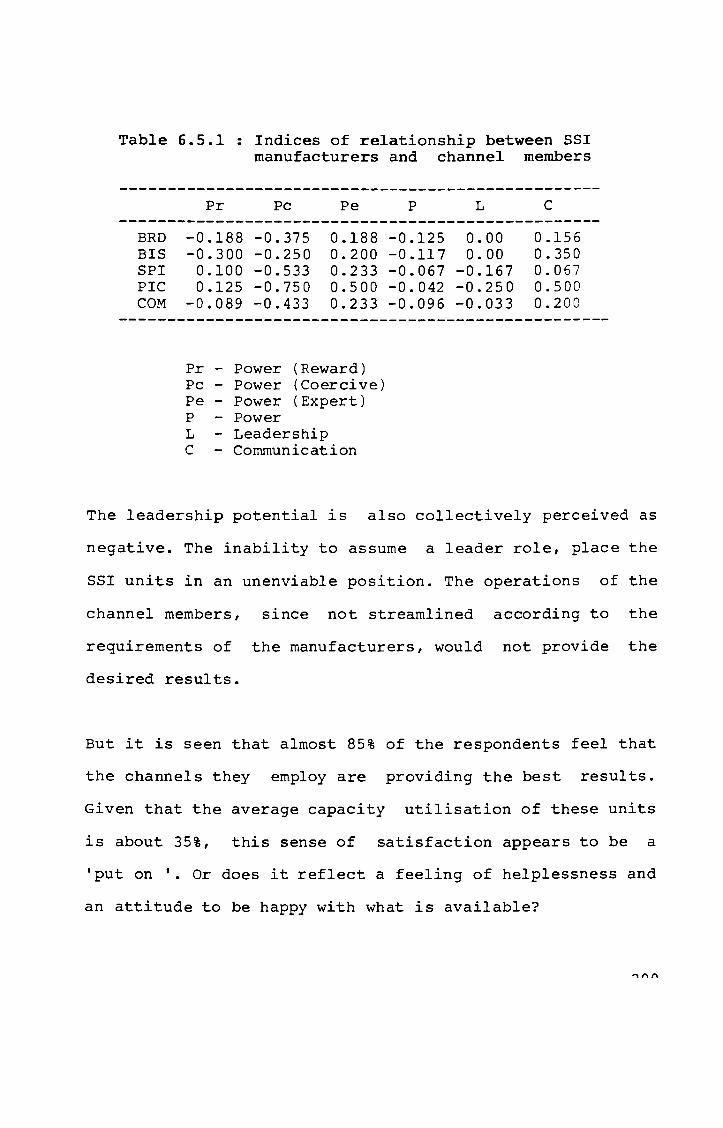
Table 6.5.1 : Indices of relationship between SSI manufacturers and channel members
--------------------------------------------------Pr Pc Pe P L C
--------------------------------------------------BRD BIS SPI PlC COM
-0.188 -0.375 0.188 -0.300 -0.250 0.200
0.100 -0.533 0.233 0.125 -0.750 0.500
-0.089 -0.433 0.233
Pr - Power (Reward) Pc - Power (Coercive) Pe - Power (Expert) P - Power L - Leadership C - Communication
-0.125 0.00 0.156 -0.117 0.00 0.350 -0.067 -0.167 0.067 -0.042 -0.250 0.500 -0.096 -0.033 0.200
The leadership potential is also collectively perceived as
negative. The inability to assume a leader role, place the
SSI units in an unenviable position. The operations of the
channel members, since not streamlined according to the
requirements of the manufacturers, would not provide the
desired results.
But it is seen that almost 85% of the respondents feel that
the channels they employ are providing the best results.
Given that the average capacity utilisation of these units
is about 35%, this sense of satisfaction appears to be a
'put on '. Or does it reflect a feeling of helplessness and
an attitude to be happy with what is available?
These units take specific care to maintain whatever
relationship they have with the channel members. They
prefer to avoid any move, which though good for the firm,
may antagonise the channel members.
6.6 PERFORMANCE
A few approaches that are relevant to the operations of the
SSI ~irms were examined with reference to the perception of
these firms.
6.6.1 APPROACH A6 :- To fix sales targets for the
channel members.
A sales target denotes the expectation of a marketing firm
regarding its performance. It indicates that the firm has
developed a marketing plan and the target is an expression
of the same. A defined sales target provides the marketing
channel a reference point to measure its own productivity
in relation to expectation of the manufacturers.
Being an approach which reflect concern for better
performance, the SSI firms were asked to respond whether
they would adopt an approach to give sales targets to the
channel members.
210
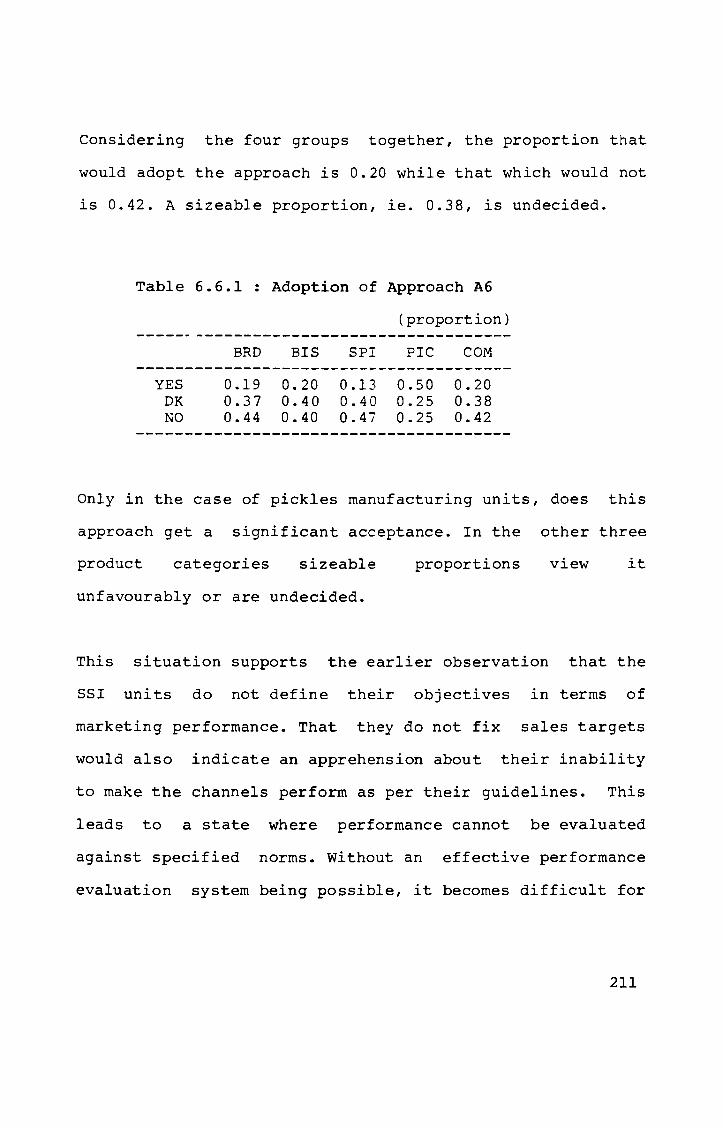
Considering the four groups together, the proportion that
would adopt the approach is 0.20 while that which would not
is 0.42. A sizeable proportion, ie. 0.38, is undecided.
Table 6.6.1 Adoption of Approach A6
(proportion)
BRD BIS SPI PlC COM ---------------------------------------
YES 0.19 0.20 0.13 0.50 0.20 DK 0.37 0.40 0.40 0.25 0.38 NO 0.44 0.40 0.4i 0.25 0.42
Only in the case of pickles manufacturing units, does this
approach get a significant acceptance. In the other three
product categories sizeable proportions view it
unfavourably or are undecided.
This situation supports the earlier observation that the
SSI units do not define their objectives in terms of
marketing performance. That they do not fix sales targets
would also indicate an apprehension about their inability
to make the channels perform as per their guidelines. This
leads to a state where performance cannot be evaluated
against specified norms. Without an effective performance
evaluation system being possible, it becomes difficult for
211

the SSI to spot inefficiency and deficiencies on the part
of the channel members.
Sales targets are not given to even the salesmen by the SSI
firms. Very few of them, with larger number of salesmen
report that they have some incentive scheme for salesmen
who generate sales above stipulated targets.
It is also observed that almost all the units decide on the
quantity of the item to produce each time, based or.
experience.
Past sales though is mentioned as a parameter forming a
basis for this decision, these units do not have any formal
system to assess the actual sales generated. The figures
are based on the off-take from the production stage.
An index depicting the extent to which the SSI firms would
favour adopting an approach to fix sales targets for the
channels is given below :
Bread = -0.250 Biscuits = -0.250 Spices = -0.333 Pickles = 0.250 Collective = -0.230
212
6.6.2 APPROACH A7 :- To limit expenses towards the
channel members
This approach is stated for this study, as an effort at
controlling costs related to operating marketing channels.
It would include limiting those expenses towards
incentives, compliments, and gifts by way of promotion
only. The other costs related to transportation,
communication, and opportunity costs of time and efforts
have not been considered.
Collectively, about half the respondents were not sure of
their stand. This in-decision is the manifestation of their
lack of awareness regarding the different options. During
the interview, it was expressed by many of these units
that, other than the sales commission offered to the
channel for every unit of the item sold, no other
promotional schemes are operated. More over after further
explanations by the researcher, it was mentioned that the
working capital availability, restricts implementing such
schemes, even though the results may be better than what is
being achieved at present.
Except for the spices processing firms, the other three
categories are divided as to their adopting this approach.
213
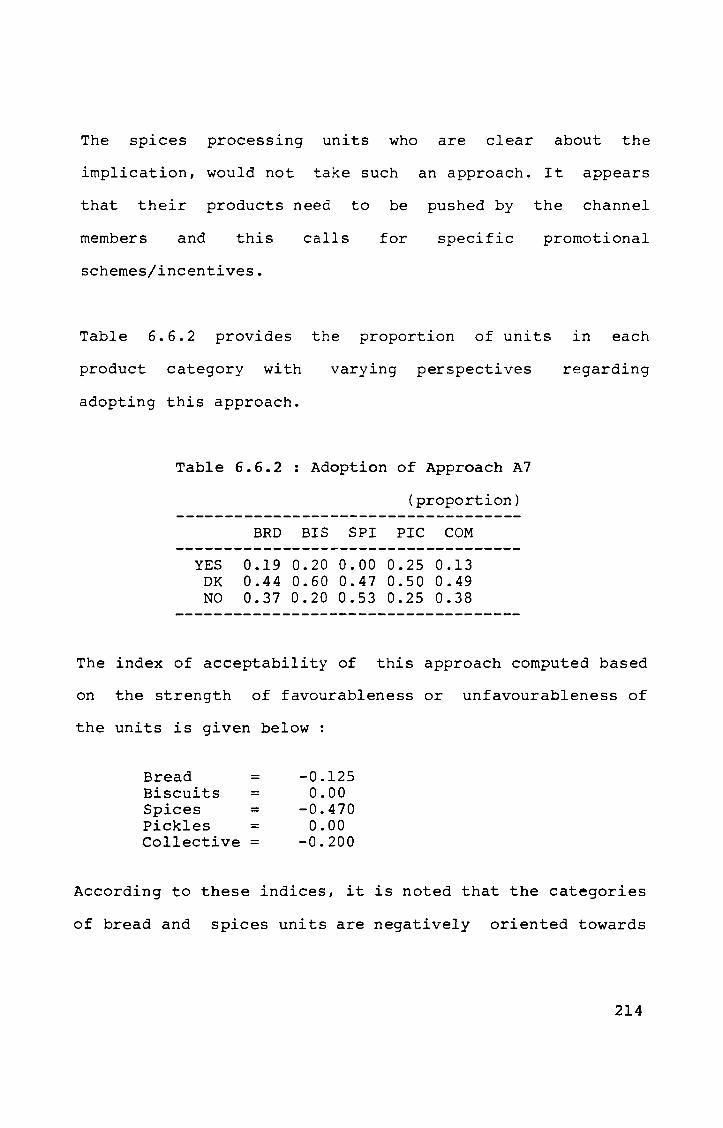
The spices processing units who are clear about the
implication, would not take such an approach. It appears
that their products need to be pushed by the channel
members and this calls for specific promotional
schemes/incentives.
Table 6.6.2 provides the proportion of units in each
product category with varying perspectives
adopting this approach.
Table 6.6.2 Adoption of Approach A7
(proportion)
BRD BIS SPI PIC COM
YES 0.19 0.20 0.00 0.25 0.13 DK 0.44 0.60 0.47 0.50 0.49 NO 0.37 0.20 0.53 0.25 0.38
regarding
The index of acceptability of this approach computed based
on the strength of favourableness or unfavourableness of
the units is given below:
Bread = -0.125 Biscuits = 0.00 Spices = -0.470 Pickles = 0.00 Collective = -0.200
According to these indices, it is noted that the categories
of bread and spices units are negatively oriented towards
214
adopting an approach to reduce costs towards channels.
Bread because of its short shelf-life and spices because of
stiff competition appear to need the channel to promote
them in the market. These manufacturers, more so the spices
manufacturers prefer to offer incentives to the channel
members. The biscuits and pickles units collectively are
neutral as far as this aspect in concerned.
6.6.3 APPROACH A8 - TO USE OWN DISTRIBUTION VEHICLE
Referring to the physical transfer of goods from the firm's
production centre to the next member in a channel, the
method utilised is a relevant factor. There is a general
observation that SSI units ~o for unnecessary initial
investments including vehicles. But to what extent do the
SSI units consider own vehicles for distribution as
important, is a pertinent question.
Depending on the individual, a vehicle with an SSI firm may
have different connotations. For the banker it may be a non
essential investment. The promotional agency may view it as
a part of the project while the consultant would prefer to
include the vehicle in the project. But from the distri
bution point of view, the SSI units would have their own
perception. This has been captured as shown in Table 6.6.3.
~]5

Table 6.6.3: Adoption of Approach AS (proportions)
BRD BIS SPI PlC COM
YES 0.75 0.60 0.67 1.00 0.71 DK 0.13 0.20 0.26 0.00 O.lS NO 0.12 0.20 0.07 0.00 0.11
Collectively, nearly three fourth the units say that their
~nits shou~d have own distribution vehicles. Only minority
reel that o~~ vehicles is not an essentiali~y.
~ll the pi=kles manufacturers feel that the need for own
distribution vehicles. The possibility of damages, since
pickles are mostly packed in bottles, is the factor which
holds them from depending fully on the channel members for
transporting. Majority of the bread manufacturers too,
considering the bulk of the product and possibility for
spoilage, prefer to use own vehicles for distribution.
As per the primary data available, about 50% of the units
use their own vehicles for distribution of the products.
These include vans, autorikshaws, motorised two wheelers
and cycles. It is seen that even those who do not own
vehickles feel that for distribution of products they
should use own vehicles. The proportions that at present
use own vehicles, hired ones or both are given in Table
6.6.4.
216
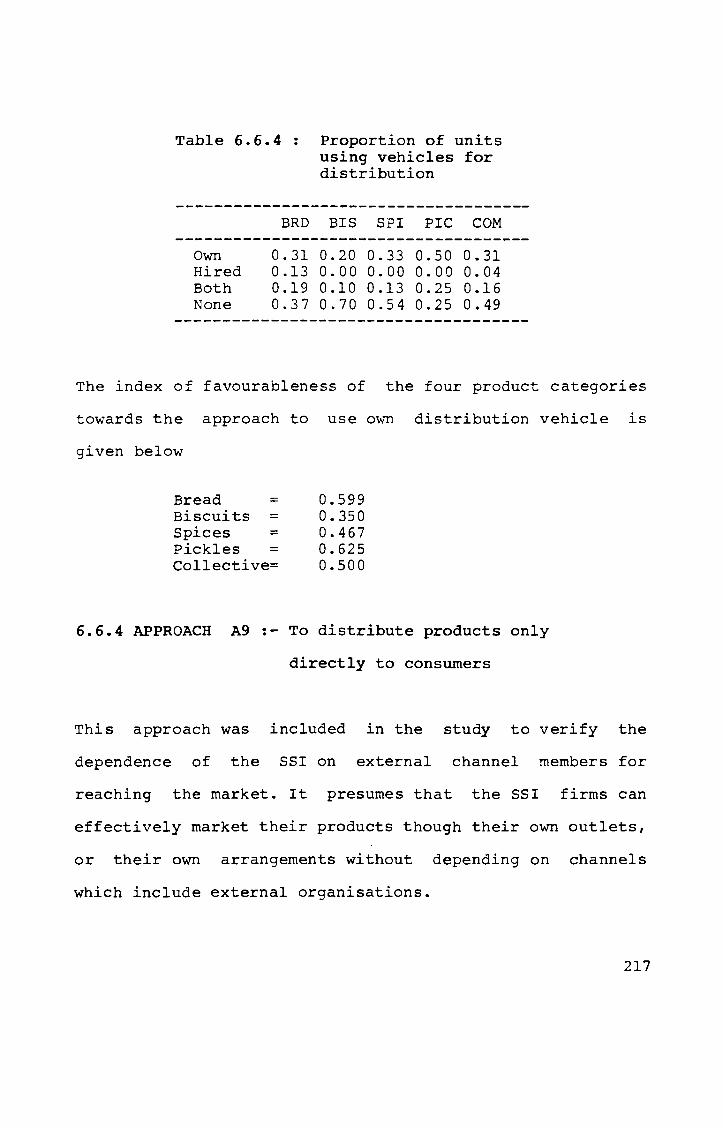
Table 6.6.4
BRD
Proportion of units using vehicles for distribution
BIS SPI PlC COM -------------------------------------
Own 0.31 0.20 0.33 0.50 0.31 Hired 0.13 0.00 0.00 0.00 0.04 Both 0.19 0.10 0.13 0.25 0.16 None 0.37 0.70 0.54 0.25 0.49
-------------------------------------
The index of favourableness of the four product categories
towards the approach to use own distribution vehicle is
given below
Bread ::: 0.599 Biscuits ::: 0.350 Spices = 0.467 Pickles = 0.625 Collective= 0.500
6.6.4 APPROACH A9:- To distribute products only
directly to consumers
This approach was included in the study to verify the
dependence of the SSI on external channel members for
reaching the market. It presumes that the SSI firms can
effectively market their products though their own outlets,
or their own arrangements without depending on channels
which include external organisations.
217
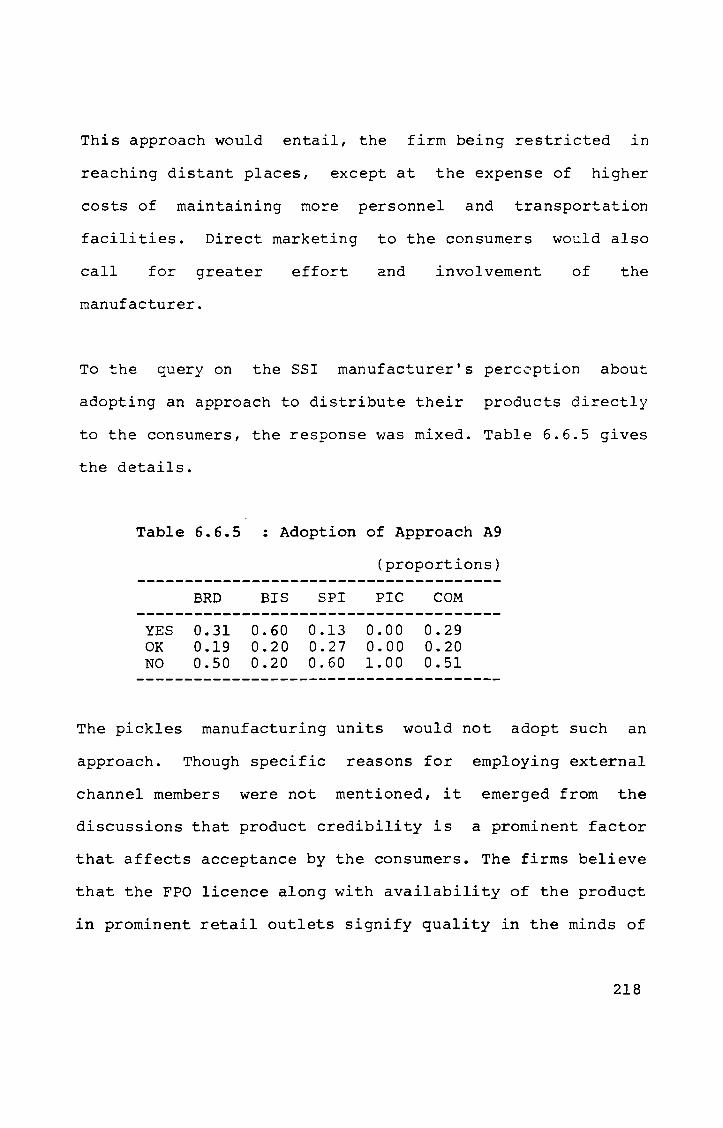
This approach would entail, the firm being restricted in
reaching distant places, except at the expense of higher
costs of maintaining more personnel and transportation
facilities. Direct marketing to the consumers would also
call for greater effort and involvement of the
manufacturer.
To ~he query on the SSI manufacturer's perc0ption about
adopting an approach to distribute their products directly
to the consumers, the response was mixed. Table 6.6.5 gives
the details.
Table 6.6.5 : Adoption of Approach A9
YES OK NO
BRD
0.31 0.19 0.50
BIS
0.60 0.20 0.20
SPI
0.13 0.27 0.60
(proportions)
PlC
0.00 0.00 1.00
COM
0.29 0.20 0.51
The pickles manufacturing units would not adopt such an
approach. Though specific reasons for employing external
channel members were not mentioned, it emerged from the
discussions that product credibility is a prominent factor
that affects acceptance by the consumers. The firms believe
that the FPO licence along with availability of the product
in prominent retail outlets signify quality in the minds of
218
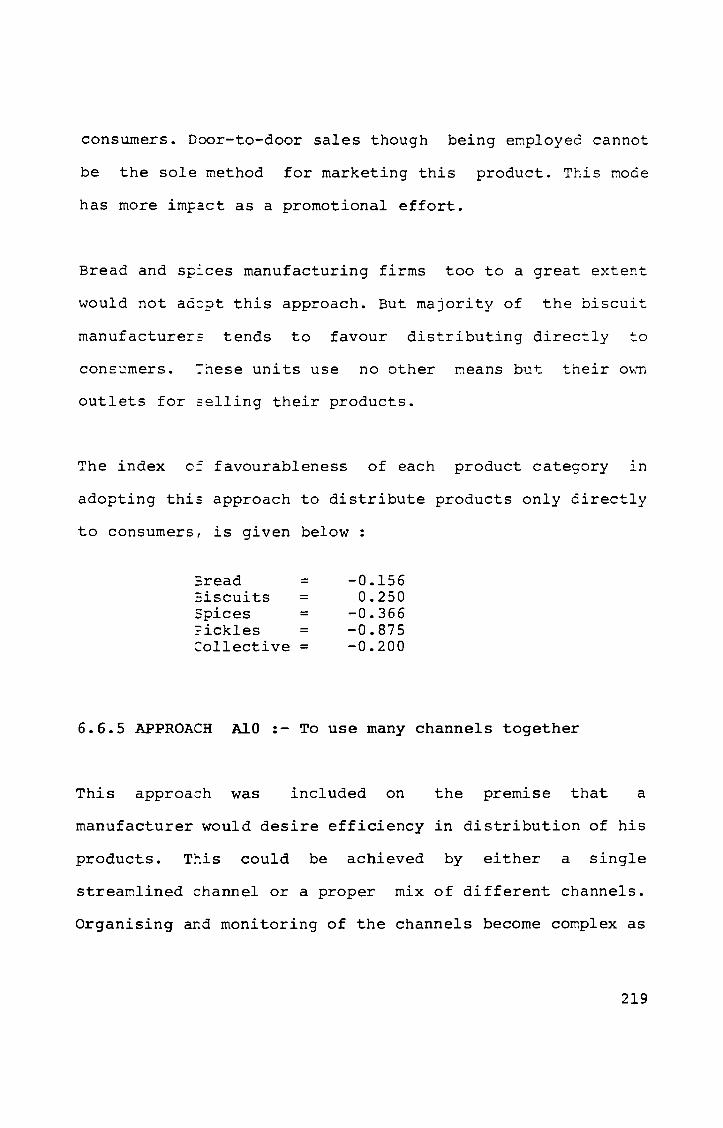
consumers. Door-to-door sales though being employee cannot
be the sole method for marketing this product. This mode
has more impact as a promotional effort.
Bread and sp~ces manufacturing firms too to a great extent
would not aC2pt this approach. But majority of the biscuit
manufacturer: tends to favour distributing directly to
cons~mers. :hese units use no other means bu~ their o~~
outlets for :elling their products.
The index 0: favourableness of each product category in
adopting thi: approach to distribute products only directly
to consumers, is given below:
3read = -0.156 3iscuits = 0.250 Spices = -0.366 ?ickles = -0.875 Collective = -0.200
6.6.5 APPROACH AlO :- To use many channels together
This approach was included on the premise that a
manufacturer would desire efficiency in distribution of his
products. T~is could be achieved by either a single
streamlined channel or a proper mix of different channels.
Organising and monitoring of the channels become complex as
219
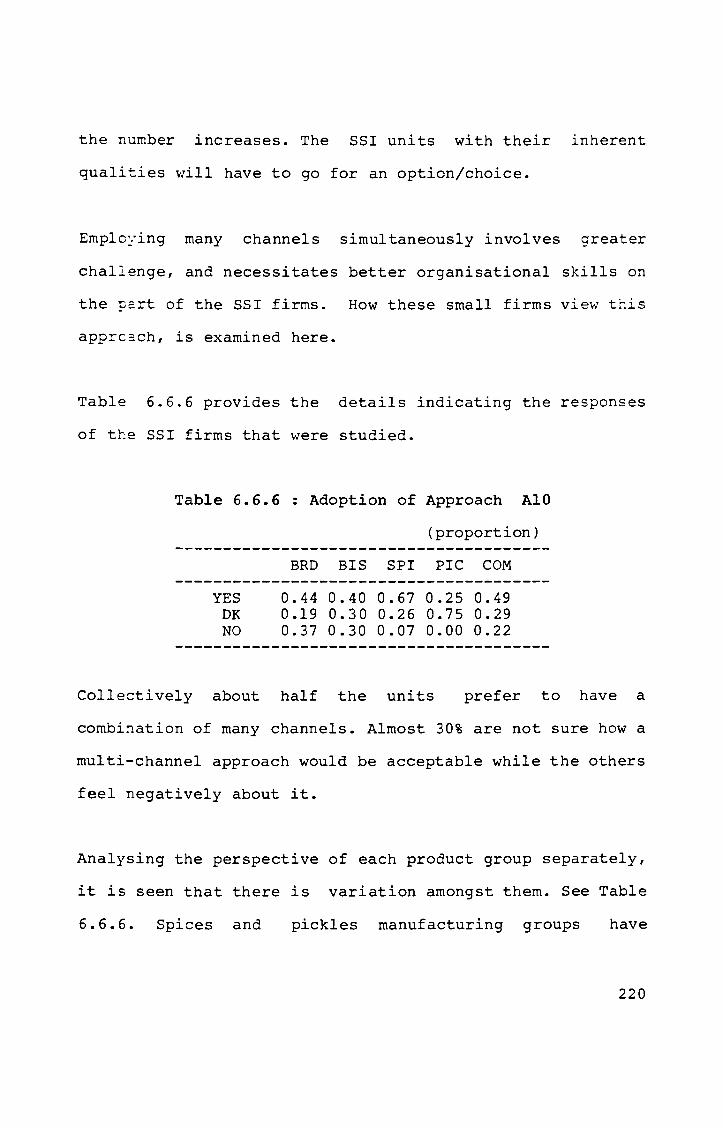
the number increases. The SSI units with their inherent
quali~ies will have to go for an option/choice.
Employing many channels simultaneously involves greater
challenge, and necessitates better organisational skills on
the p~rt of the SSI firms. How these small firms view this
apprc~ch, is examined here.
Table 6.6.6 provides the details indicating the responses
of the SSI firms that were studied.
Table 6.6.6 : Adoption of Approach AIO
(proportion)
BRD BIS SPI PlC COM
YES 0.44 0.40 0.67 0.25 0.49 DK 0.19 0.30 0.26 0.75 0.29 NO 0.37 0.30 0.07 0.00 0.22
Collectively about half the units prefer to have a
combi~ation of many channels. Almost 30% are not sure how a
multi-channel approach would be acceptable while the others
feel negatively about it.
Analysing the perspective of each product group separately,
it is seen that there is variation amongst them. See Table
6.6.6. Spices and pickles manufacturing groups have
220

negligible negative orientation towards this approach. But
majority of pickles units are not sure of their stand while
majority of the spices units prefer to have many channels.
In the ~ase of both
units ?refer to
single-~hannel one.
over o~e fourth
bread and biscuits, more manufacturing
have a multi-channel approach than a
But the negatively oriented group is
the sample, indicating that a single
channel approach is found to be acceptable by them.
6.6.5.1 A look at the number of channels that are at
present being used by the SSI firms, it appears that though
they wo~ld like a multi-channel approach, a majority of the
firms ~n the above two categories use only a single
channel.
The sp~ces manufacturing units have a high index of
O.SOO,showing that they are more favourable to have a
multi-cr.annel approach. This is reflected in their actual
usage of more than one channel. See Table 6.6.7. Though
majority of pickles manufacturers also use more than one
channel, it is seen that their perception regarding the
benefits or otherwise is not defined~ as revealed by a low
index.
221
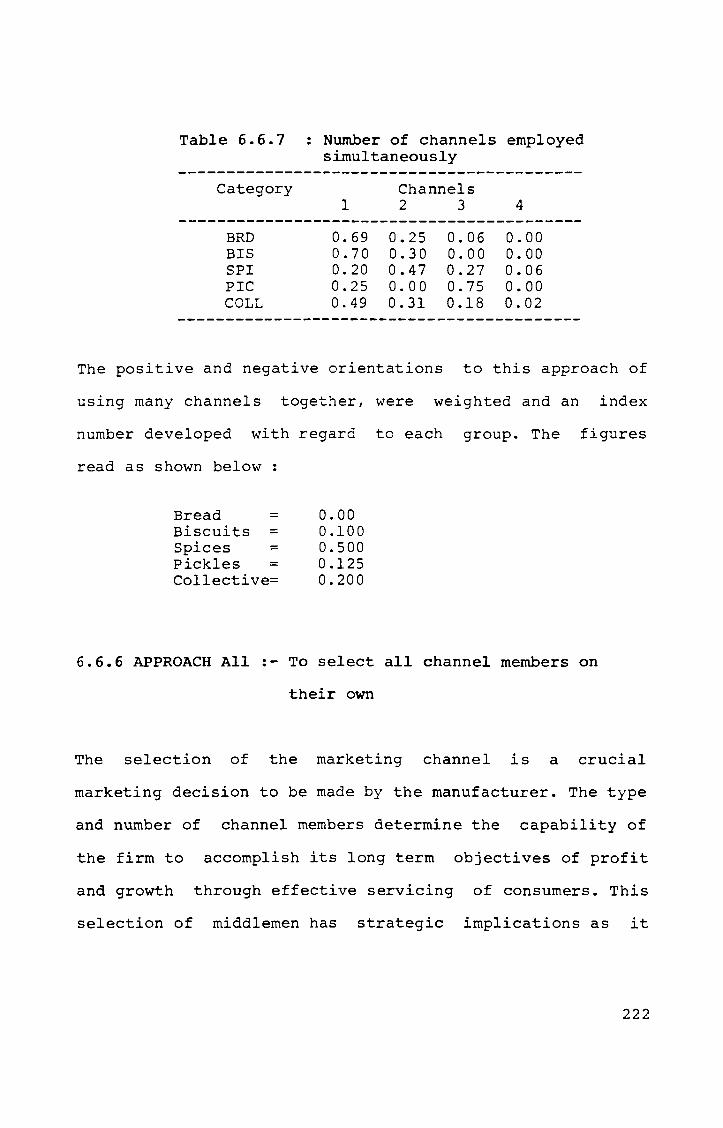
Table 6.6.7 : Number of channels employed simultaneously
Category
BRD BIS SPI PlC COLL
1
0.69 0.70 0.20 0.25 0.49
Channels 2 3
0.25 0.30 0.47 0.00 0.31
0.06 0.00 0.27 0.75 0.18
4
0.00 0.00 0.06 0.00 0.02
The positive and negative orientations to this approach of
using many channels together, were weighted and an index
number developed with regard to each group. The figures
read as shown below :
Bread = 0.00 Biscuits = 0.100 Spices = 0.500 Pickles = 0.125 Collective= 0.200
6.6.6 APPROACH All :- To select all channel members on
their own
The selection of the marketing channel is a crucial
marketing decision to be made by the manufacturer. The type
and number of channel members determine the capability of
the firm to accomplish its long term objectives of profit
and growth through effective servicing of consumers. This
selection of middlemen has strategic implications as it
222
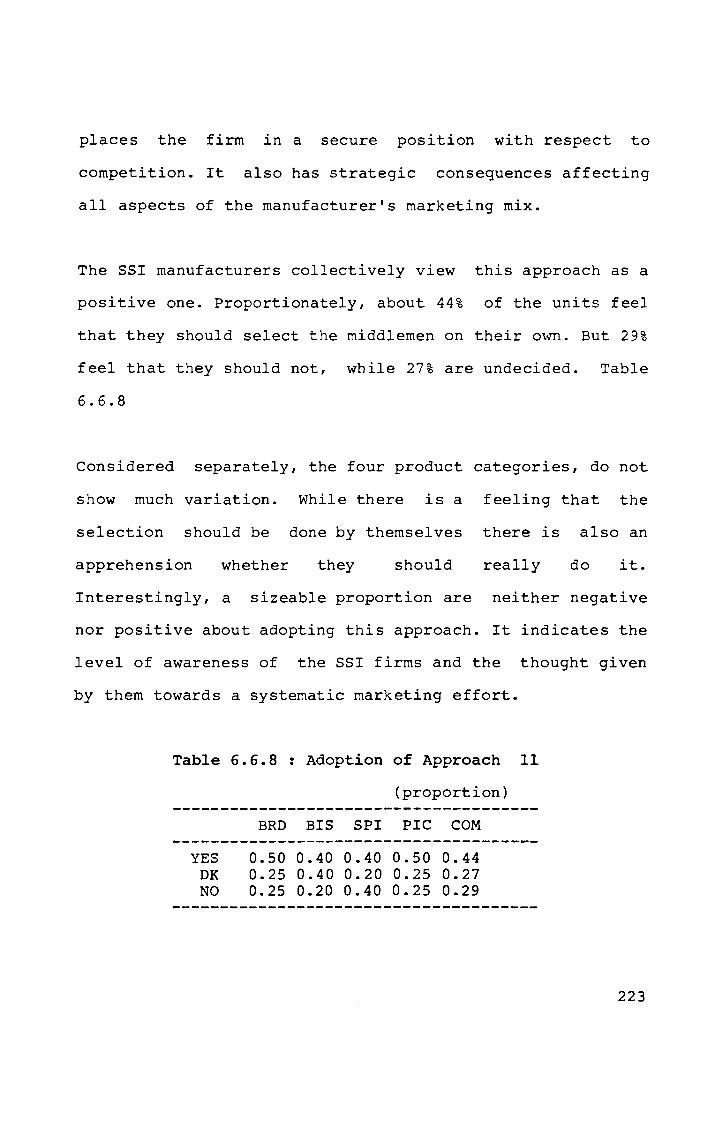
places the firm in a secure position with respect to
competition. It also has strategic consequences affecting
all aspects of the manufacturer's marketing mix.
The SSI manufacturers collectively view this approach as a
positive one. Proportionately, about 44% of the units feel
that they should select the middlemen on their O\ffi. But 29%
feel that they should not, while 27% are undecided. Table
6.6.8
Considered separately, the four product categories, do not
show much variation. While there is a feeling that the
selection should be done by themselves there is also an
apprehension whether they should really do it.
Interestingly, a sizeable proportion are neither negative
nor positive about adopting this approach. It indicates the
level of awareness of the SSI firms and the thought given
by them towards a systematic marketing effort.
Table 6.6.8 : Adoption of Approach 11
(proportion)
BRO BIS SPI PIC COM
YES 0.50 0.40 0.40 0.50 0.44 OK 0.25 0.40 0.20 0.25 0.27 NO 0.25 0.20 0.40 0.25 0.29
223
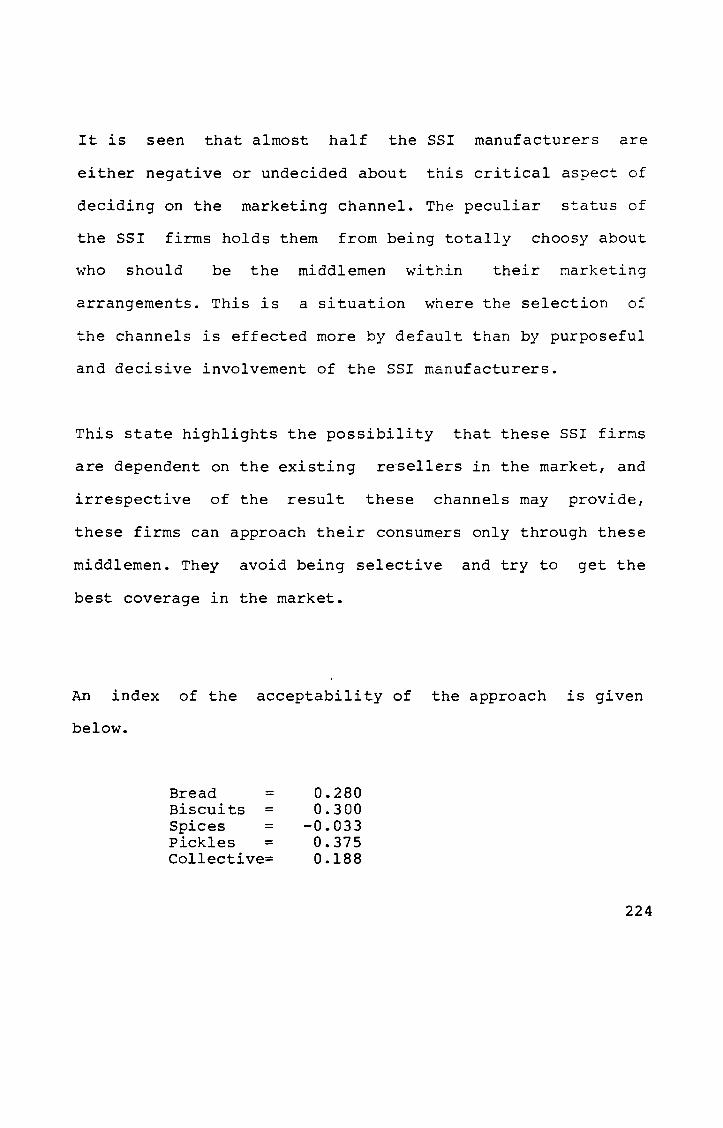
It is seen that almost half the SSI manufacturers are
either negative or undecided about this critical aspect of
deciding on the marketing channel. The peculiar status of
the SSI firms holds them from being totally choosy about
who should be the middlemen within their marketing
arrangements. This is a situation where the selection of
the channels is effected more by default than by purposeful
and decisive involvement of the SSI manufacturers.
This state highlights the possibility that these SSI firms
are dependent on the existing re"sellers in the market, and
irrespective of the result these channels may provide,
these firms can approach their consumers only through these
middlemen. They avoid being selective and try to get the
best coverage in the market.
An index of the acceptability of the approach is given
below.
Bread = Biscuits = Spices = Pickles = Collective=
0.280 0.300
-0.033 0.375 0.188
224
6.6.7 APPROACH Al2 :- To assess periodically the
performance of channel members
The management
monitoring of
channels. The
of channel systems call for constant
the activities and performance of the
objectives to be accomplished are specified
initially. Ideally the channel structures are designed and
channel members identified so that these objectives are
best satisfied. The targets are then compared \vith actual
performance so that deviations are determined in the
specific aspects for corrective measures subsequently.
For assessment of performance, the manufacturers should
have a structured mechanism for collection of information,
its compilation and analysis. This regular monitoring would
help check deficiencies in the structure, and also identify
poorly performing channel members.
The perception of SSI firms regarding an approach to
periodically evaluated the performance of channel members
was studied. Their response to whether they would adopt
such an approach is shown in Table 6.6.9
225
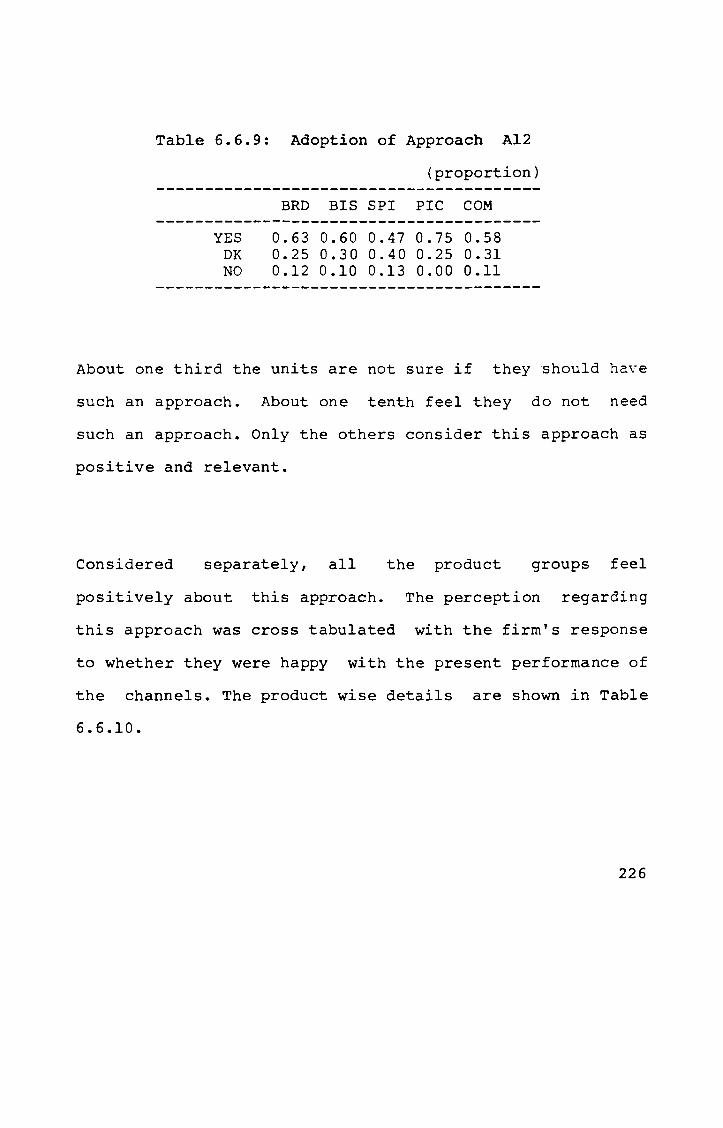
Table 6.6.9: Adoption of Approach Al2
(proportion)
BRD BIS SPI PlC COM
YES 0.63 0.60 0.47 0.75 0.58 DK 0.25 0.30 0.40 0.25 0.31 NO 0.12 0.10 0.13 0.00 0.11
About one third the units are not sure if they should have
such an approach. About one tenth feel they do not need
such an approach. Only the others consider this approach as
positive and relevant.
Considered separately, all the product groups feel
positively about this approach. The perception regarding
this approach was cross tabulated with the firm's response
to whether they were happy with the present performance of
the channels. The product wise details are shown in Table
6.6.10.
226
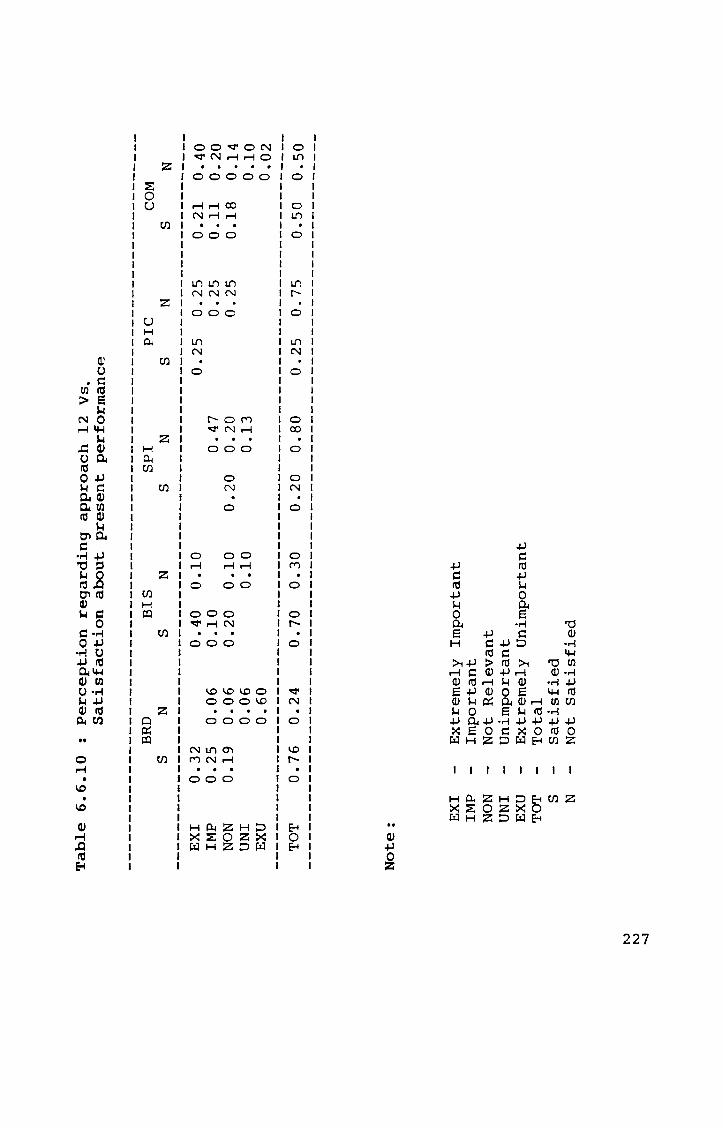
~ ~
~
Tab
le 6
.6.1
0
: P
erc
ep
tio
n re
gard
ing
ap
pro
ach
1
2
Vs.
S
ati
sfa
cti
on
ab
ou
t p
resen
t p
erf
orm
an
ce
----
----
----
----
----
----
----
----
----
----
----
----
----
----
----
----
----
----
----
BRD
B
IS
SP
I P
lC
COM
S
N
S N
S
N
S N
S
N
EX
I 0
.32
0
.40
0
.10
0
.25
0
.25
0
.21
0
.40
IM
P 0
.25
0
.06
0
.10
0
.47
0
.25
0
.11
0
.20
N
ON
0
.19
0
.06
0
.20
0
.10
0
.20
0
.20
0
.25
0
.18
0
.14
U
NI
0.0
6
0.1
0
0.1
3
0.1
0
EXU
0
.60
0
.02
--
----
----
----
----
----
----
----
----
----
----
----
----
----
----
----
----
----
----
--TO
T 0
.76
0
.24
0
.70
0
.30
0
.20
0
.80
0
.25
0
.75
0
.50
0
.50
No
te: E
XI
Ex
trem
ely
Im
po
rtan
t IM
P Im
po
rtan
t N
ON
N
ot
Rele
van
t U
NI
Un
imp
ort
an
t EX
U
Ex
trem
ely
U
nim
po
rtan
t TO
T T
ota
l S
Sati
sfi
ed
N
N
ot
Sati
sfi
ed
It is seen that majority of the bread and biscuits
manufacturing units are happy with the performance of their
existing channels.
Predominantly, these units feel that performance appraisal
of the channel members is essential. A minority in the
biscuits manufacturers who are happy about the performances
sf the channel feel there should be periodi~al appraisal.
The spices and pickles manufacturers are mostly
dissatisfied with the performance of their channels. While
the pickles manufacturers feel there should be periodic
assessment of performance of channels, the spices
manufacturers have a mixed reaction.
The index of favourableness for adopting an approach to
periodically assess the performance of the channels by the
different product categories is as shown below:
Bread = 0.375 Biscuits = 0.500 Spices = 0.166 Pickles = 0.625 Collective= 0.356
6.7 PERCEIVED IMPACT OF THE APPROACHES
The different approaches listed earlier towards managing
the marketing channels, were studied in relation to the
expected outcomes.
228
These approaches were grouped into two:one, referring to
relationship and the other to operations and performance.
The two groups were considered separately with respect to
the outcomes anticipated by the SSI firms. The firms rated
the possibility of each outcome, on a five point scale,
Extremely positive (+2) to Extremely negative (-2) with No
effect (zero) as the median, for each approach that they
may adopt.
6.7.1 Group one Approaches
The first group of approaches included
Al. to reward channel members for better performance
A2. to punish channel members for poor performance
A3. to guide and advice channel members on how to perform
A4. to take the role of a leader for directing the operations of the channel members
AS. to insist on regular and periodic communication about activities and problems
The anticipated outcomes plotted against each of these
approaches were
Co operation Dependence Satisfaction Trust Conflict Goodwill Sales
229
The respondents were grouped into three with respect to
their orientation towards the different approaches, ie.
those who would adopt the approach, those who would no~
and those who are undecided.
the effect they anticipated
adopted by them.
6.7.1.1 Co-operation
Each of these groups recorced
if the approach is actuallv
In a marketing channel, the members have entered into a
relationship because they are unable to perform efficiently
all the functions which must be completed to accomplish
their objectives. Co-operation, which arises from a need
for achieving goals, is considered the most common
behaviour in channel relationships.
Co-operation, while a prerequisite for channel members to
work collectively, is influenced by shifts in attitudes or
approaches of the members. The existence of extensive or
limited co-operation is dependent on the goal expectations.
So it could exist on a voluntary basis or as a result of
conflict resolution by the channel leader.
230
The SSI manufacturers report experiencing varying degree 0:
cooperation from the channel members. One third the fir~s
studied feel co-operatio~ is not a relevant factor for the~
as they are not using external channel members for
distribution of their products. While half of the others
feel they are receiving high level of co-operation the
remaining firms feel that the co-operation they receive is
low or just satisfactory.
Given their varying experiences, these units were requeste6
to record the extent of co-operation they anticipate for
the different approaches they may adopt as listed earlier.
The approaches Al to AS were considered for this. The
respondents initially recorded one of the three options
with reference to adopting an Approach - 'yes' 'no' or
'don't know'. Subsequently the expected outcomes in
adopting the approach was marked on the S point scale
'Extremely positive', 'positive',
and 'Extremely negative' .
'No effect', 'Negative'
Firms that would adopt the approaches consider there would
be co-operation. The index read 0.4286, indicating that
absolute co-operation is still not expected. The firms that
are unsure if they would adopt the five approaches
collectively feel that there would be a negative impact
231
though marginal~ index being • 0.0076 Those firms that
would not adopt the approaches expect a negative effect;
index -0.2317 . See Table 6.7.1
6.7.1.2 Dependence
Mutual dependence exists in all channel systems. Each
channel member exerL~ some degree of power over the other
me~bers. This power - dependence interface helps understand
the channel members motivation in interacting with each
other so that each one can accomplish its own goals.
The SSI units, though a large number of them are dependent
on the external channel members, also include a sizeable
group that does the distribution of the products on their
own. From this study it is noted that one third of the
units distribute their entire products without assistance
from external agencies. These units state that their
dependence on the external channel and vice versa are for
them, irrelevant.
with respect to the other units, one third feel their
channel members are dependent on them to a high level.
While 23% feel it is neither low nor high, 40% find that
dependence of channel members on the SSI units is of low
232
level. With these given experiences the units recorded the
expected outcome with reference to dependence if they
adopted the five approaches Al - AS.
The units that would adopt the approaches collectively feel
that there would be de?endence. The index computed is
0.2662. The units that would not adopt the approaches
anticipated very negative outcome. This indicates that the
firms fear that the channel members would prefer to stay
away from them as negative dependence is expected. The
index of this group is -0.4390.
The firms that are not sure if they would adopt the
approaches also show a negative index of -0.0530. Table
6.7.1.
6.7.1.3 Satisfaction
The satisfaction a firm derives is based on the realisation
of its objectives. The decisions and approaches of one
channel member could affect the realisation of objectives
of other channel members positively or negatively. The SSI
firms also have a similar influence on the satisfaction
levels of the external channel members that link them up
with the consumers.
233
Since one third of the sampled firms do not use external
channels, satisfaction 0: the channel members is stated as
irrelevant by these fires. That high levels of satisfaction
is experienced by channel members, is reported by 40% of
the firms that engage external channels. About 36% feel
that the level of satis=action is normal while the others
feel it is low.
with reference to the fi~e Approaches, the firms that would
adopt them show an in=ex of 0.2662 regarding level of
satisfaction of the cha~nel members. The firms that are
undecided provide an index of -0.0682 and those that would
not adopt the approaches have an index of -0.2561. Table
6.7.1
6.7.1.4 Trust
Trust emanates from the perceived credibility of the firms
entering into the relationship. It evolves from the mutual
acceptance that both can contribute positively to the goal
accomplishment of each other.
The SS! firms engaging external channels generally feel
that they hold the trust of their channel members. Almost
57% feel that they enjoy high trust of the channel members.
234
While 30% feel that the trust level is normal the othe=
minority of 13% feel that the trust they enjoy is low. The
above points to a fact that majority of the SSI firms stay
in business because they could earn the trust of thei=
channel members.
The firms that \,ould adopt the five Approaches Al - AS,
show an index of O.389h with re=erence to the trust level.
This shows that higher levels of trust are expected by
these firms while adopting these approaches. The firms that
would not adopt these approaches show an index of -0.2317.
Even the firms that are undec~ded show negative index of
-0.0682. Table 6.7.1
6.7.1.5 Conflict
A basic tenet of conflict theory is that if no
interdependence exists in a social system there is no basis
for conflict. This leads one to argue that mutual
dependence is the cause for conflict. This argument
overlooks the fact that conflict does not always result
from a state of dependence and that co-operative behaviour
is more likely to prevail.
235

Some of the primary causes of conflict within the ambit of
marketing channels are grouped as: Goal incompatibility, ,
domain - position - role incongruence, communications break
down, varying perceptions of reality and ideological
differences.
It should be stated that the reasons for conflict or
disagreement does not exist in isolation and often, a
combination of reasons may cause hostile behaviour.
The SS! firms engaging external channels report
experiencing conflict in varying dimensions. Half these
units feel that conflict between them and their channel
members is high. One-fourth others find the conflict levels
manageable. The others experience low conflict levels.
Analysis of the perceived effect of adopting the five
approaches Al -AS is revealing. Those who would adopt the
approaches feel that there would be a decrease in conflict.
The index is -0.1623. Those units that would not adopt the
five approaches collectively have an index of 0.2622,
indicating positive levels of conflict or a negative
relationship. Those firms undecided on the issue of
adopting those approaches too, anticipate a positive level
of conflict ie. negative relationship. Table 6.7.1.
236
6.7.1.6 Goodwill
A positive image leading to fa\·ourable attitude and mutual
acceptance is a prominent factor in channel relationship.
The SS! firms are observed to bank heavily on this element.
Since often the SS! firm does not command a predominant
status in channel relationships, it is the promoter who is
the reason for development of goodwill.
Almost two third the SS! firms studied feel that they enjoy
high levels of goodwill, within the existing marketing
arrangements. Except for a minority among the others, most
of them find the goodwill they hold is satisfactory.
The firms that would adopt the five approaches feel that
there would be a very positive increment in goodwill; the
index being 0.4286. Those firms that would not adopt the
approaches anticipate negative effect if they do adopt
them; -0.2195. Even the undecided group expect negative
impact; with an index of -0.0379. Table 6.7.1.
6.7.1.7 Sales
The generation of sales being the most crucial factor in
channel management, every manufacturer effect variation in
237
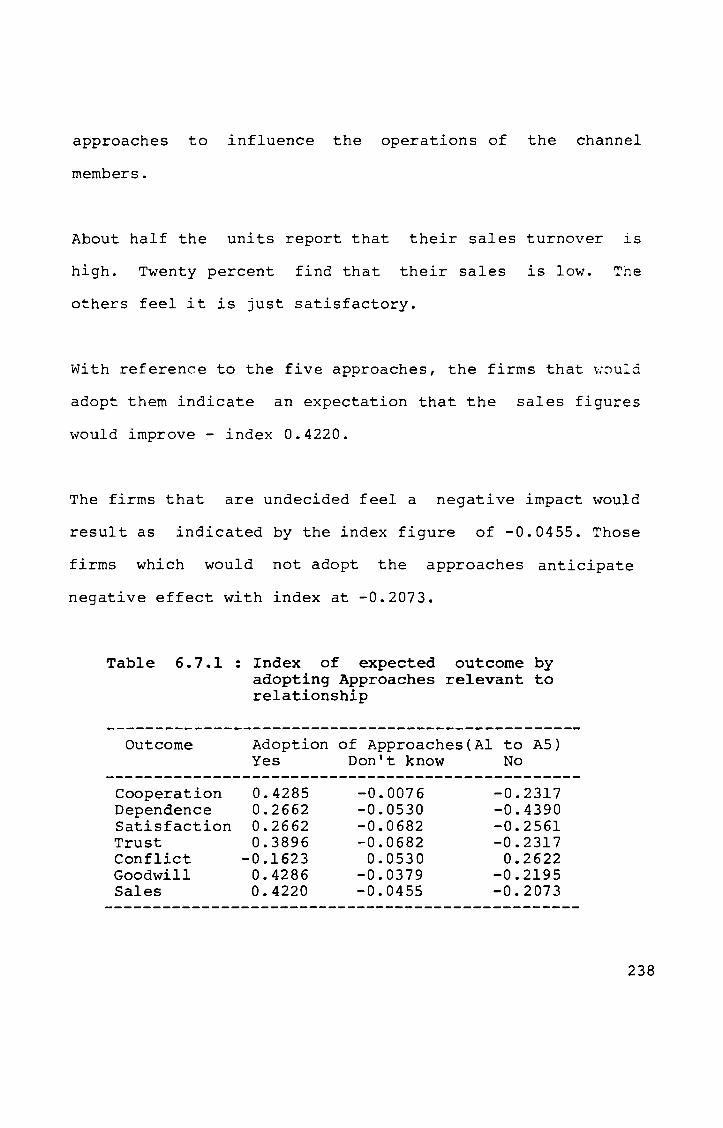
approaches to influence the operations of the channel
members.
About half the units report that their sales turnover is
high. Twenty percent find that their sales is low. The
others feel it is just satisfactory.
With reference to the five approaches, the firms that ~8uld
adopt them indicate an expectation that the sales figures
would improve - index 0.4220.
The firms that are undecided feel a negative impact would
result as indicated by the index figure of -0.0455. Those
firms which would not adopt the approaches anticipate
negative effect with index at -0.2073.
Table 6.7.1: Index of expected outcome by adopting Approaches relevant to relationship
Outcome
Cooperation Dependence Satisfaction Trust Conflict Goodwill Sales
Adoption of Approaches(Al to A5) Yes Don't know No
0.4285 0.2662 0.2662 0.3896
-0.1623 0.4286 0.4220
-0.0076 -0.0530 -0.0682 -0.0682
0.0530 -0.0379 -0.0455
-0.2317 -0.4390 -0.2561 -0.2317
0.2622 -0.2195 -0.2073
238
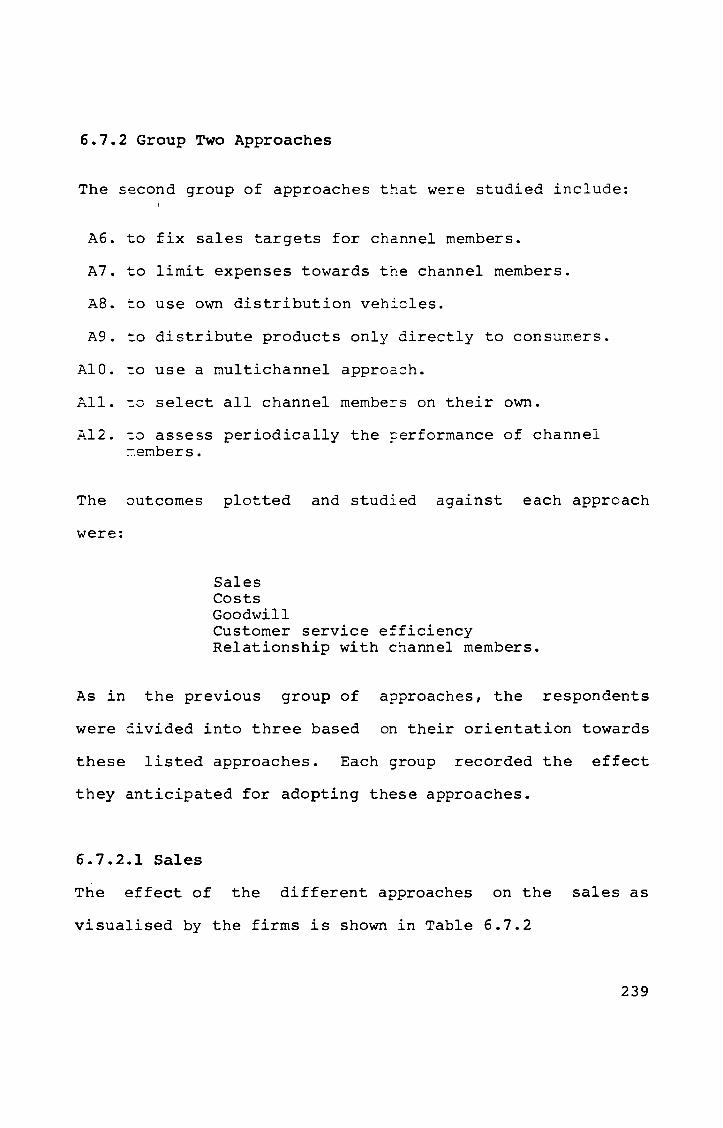
6.7.2 Group Two Approaches
The second group of approaches that were studied include:
A6. to fix sales targets for channel members.
A7. to limit expenses towards the channel members.
AS. to use own distribution veh~cles.
A9. to distribute products only directly to consumers.
AIC. ~o use a multichannel approach.
All. ~o select all channel membe~s on their own.
A12. ~o assess periodically the ~erformance of channel ~embers.
The outcomes plotted and studied against each approach
were:
Sales Costs Goodwill Customer service efficiency Relationship with channel members.
As in the previous group of approaches, the respondents
were civided into three based on their orientation towards
these listed approaches. Each group recorded the effect
they anticipated for adopting these approaches.
6.7.2.1 Sales
The effect of the different approaches on the sales as
visualised by the firms is shown in Table 6.7.2
239

In tr.e case of adopting an approach to limit the expenses
towar~s channel members (A7),' even the firms who would
adopt the same
all ~he other
expect a negative effect on the sales. In
approaches the firms who are positively
orier.~ed towards the same expect positive outcome wit~
respe=t to sales though in varying degree.
Thoug~ using own distribution vehicle is seen as a positive
contr~~utor to sales (A8), there are firms who would not
adopt the approach and there are others who are not decided
on their stand. Collectively, this approach is stated as
having most positive effect on sales.
Even ~n the case of selecting channel members on their own
(All) and also periodical assessment of performance (AI2),
the firms who would not adopt the approaches visualise
positive effect or sales in case they do adopt them.
Collectively, the approaches to fix sales targets for
channel members, to limit expenses towards channel members
and to distribute products only directly to consumers are
perceived as having negative impact on the sales.
240
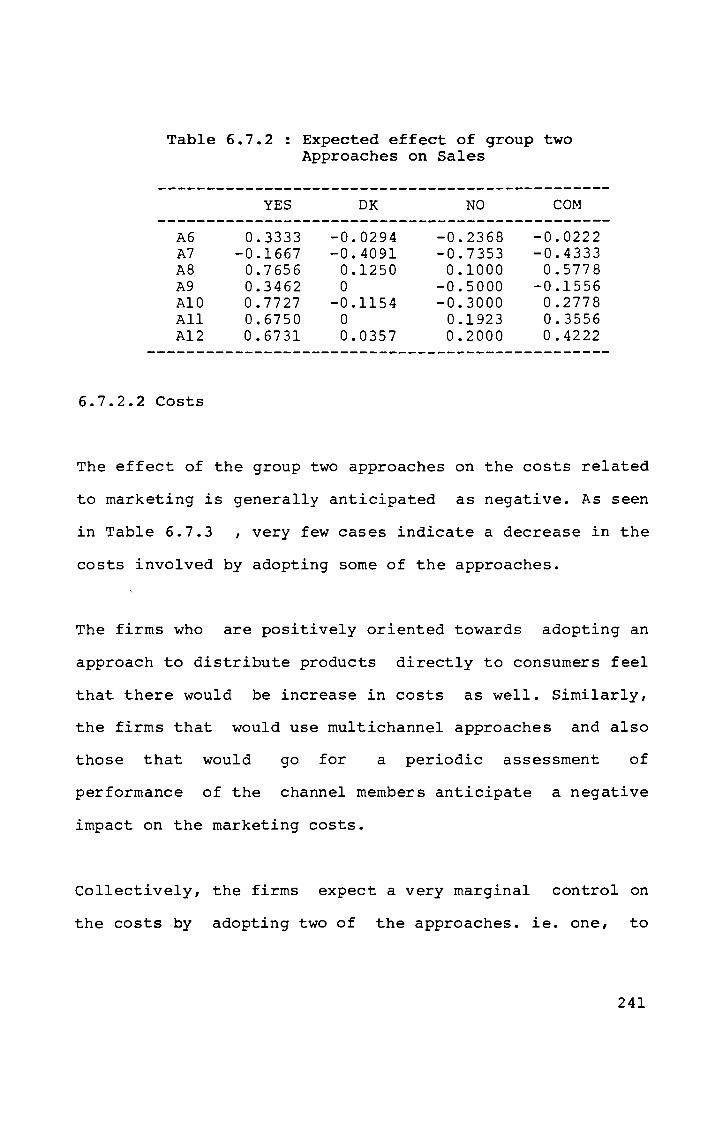
Table 6.7.2
A6 A7 A8 A9 AlO All A12
6.7.2.2 Costs
YES
0.3333 -0.1667
O. 7 65 6 0.3462 0.7727 0.6750 0.6731
Expected effect of group two Approaches on Sales
DK
-0.0294 -0.4091
0.1250 o
-0.1154 o 0.0357
NO
-0.2368 -0.7353
0.1000 -0.5000 -0.3000
0.1923 0.2000
COM
-0.0222 -0.4333
0.5778 -0.1556
0.2778 0.3556 0.4222
The effect of the group two approaches on the costs related
to marketing is generally anticipated as negative. As seen
in Table 6.7.3 , very few cases indicate a decrease in the
costs involved by adopting some of the approaches.
The firms who are positively oriented towards adopting an
approach to distribute products directly to consumers feel
that there would be increase in costs as well. Similarly,
the firms that would use multichannel approaches and also
those that would go for a periodic assessment of
performance of the channel members anticipate a negative
impact on the marketing costs.
Collectively, the firms expect a very marginal control on
the costs by adopting two of the approaches. ie. one, to
241
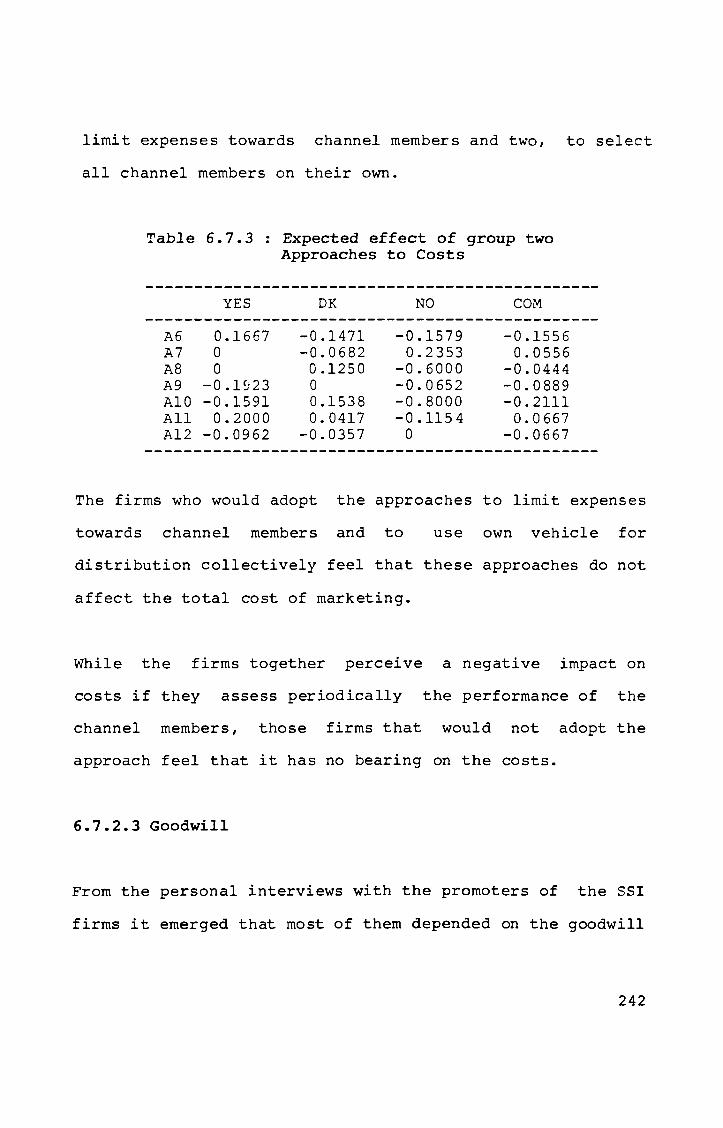
limit expenses towards channel members and two, to select
all channel members on their own.
Table 6.7.3
A6 A7 A8 A9 AIO All A12
YES
0.1667 o o
-0.1923 -0.1591
0.2000 -0.0962
Expected effect of group two Approaches to Costs
DK
-0.1471 -0.0682
0.1250 o 0.1538 0.0417
-0.0357
NO
-0.1579 0.2353
-0.6000 -0.0652 -0.8000 -0.1154 o
COM
-0.1556 0.0556
-0.0444 -0.0889 -0.2111
0.0667 -0.0667
The firms who would adopt the approaches to limit expenses
towards channel members and to use own vehicle for
distribution collectively feel that these approaches do not
affect the total cost of marketing.
While the firms together perceive a negative impact on
costs if they assess periodically the performance of the
channel members, those firms that would not adopt the
approach feel that it has no bearing on the costs.
6.7.2.3 Goodwill
From the personal interviews with the promoters of the SS!
firms it emerged that most of them depended on the goodwill
242
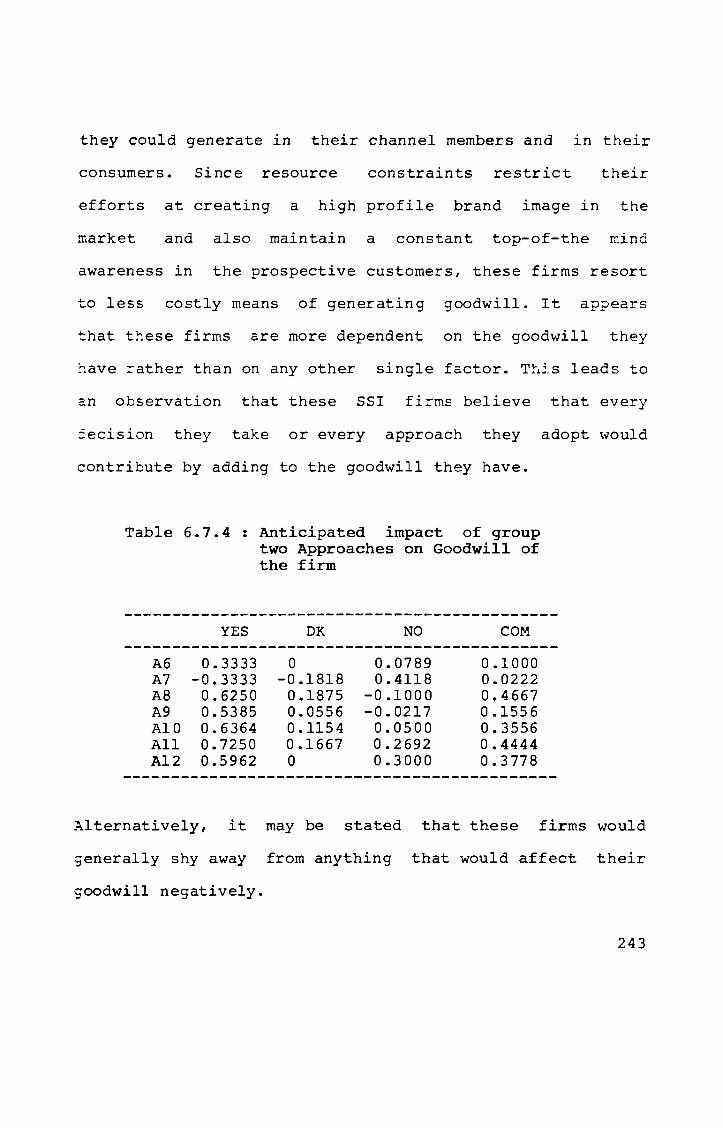
they could generate in their channel members and in their
consumers. Since resource constraints restrict their
efforts at creating a high profile brand image in the
market and also maintain a constant top-of-the mind
awareness in the prospective customers, these firms resort
to less costly means of generating goodwill. It appears
that these firms are more dependent on the goodwill they
~ave rather than on any other single factor. This leads to
an observation that these SSI firms believe that every
~ecision they take or every approach they adopt would
contribute by adding to the goodwill they have.
Table 6.7.4 : Anticipated impact of group two Approaches on Goodwill of the firm
YES DK NO COM ---------------------------------------------
A6 0.3333 0 0.0789 0.1000 A7 -0.3333 -0.1818 0.4118 0.0222 A8 0.6250 0.1875 -0.1000 0.4667 A9 0.5385 0.0556 -0.0217 0.1556 AlO 0.6364 0.1154 0.0500 0.3556 All 0.7250 0.1667 0.2692 0.4444 A12 0.5962 0 0.3000 0.3778
---------------------------------------------
Alternatively, it may be stated that these firms would
generally shy away from anything that would affect their
goodwill negatively.
243
From the Table 6.7.4, it may be noted that collectively
all the approaches studied are perceived by the firms as
having some positive effect on the firm's goodwill. But the
approach to limit expenses towards channel members is
perceived to have a negative influence on goodwill
according to even firms that would adopt the same.
\·;h5.le the approaches to use own vehicle for distribution
and that to distribute products directly to consumers are
perceived by those firms who would not adopt them, as
having negative effect on goodwill, all the other
approaches are believed to have a positive influence.
6.7.2.4 Customer Service efficiency
Service efficiency denotes the promptness and care with
which the channel members operate in terms of dealing with
the SS! firm's products so that the end users or consumers
are offered a high level of satisfaction. Maintaining this
positive orientation is one of the basic requirements for
the survival of the SS! firms.
On a collective basis, the SS! firms believe that the
listed approaches would have a positive effect on the
service efficiency of the channel members except for the
244

approaches to limit expenses to channel members and that to
distribute products directly to consumers. Limiting
expenses towards channel members is perceived as a negative
influence on service efficiency even by those who would
adopt that approach.
~sing own distribution vehicle is perceived as having a
very high positive impact on service efficiency of the
~arketing channel as a whole. So is the case with using a
~ultichannel approach in distribution, selecting all
channel members on their O\ffl and also periodical assessment
of performance of the channel members. Considering the last
two approaches ie. selecting all channel members on their
own and periodic assessment of the performance, the units
that would not adopt them feel that there would be positive
effect if they do adopt them.
Table 6.7.5 : Anticipated impact of group two Approaches on Service Efficiency of Channel Members
---------------------------------------------YES DK NO COM
---------------------------------------------A6 0.2222 0 0 0.0444 A7 -0.3333 -0.2045 -0.5588 -0.3556 A8 0.7344 0.1250 -0.1000 0.533 A9 0.3077 -0.5000 -0.0556 AIO 0.6122 -0.0385 -0.0500 0.3111 All 0.7750 0.0833 0.3846 0.4778 A12 0.6731 0.0714 0.4000 0.4556
245
6.7.2.5 Relationship with channel members
The relationship of the channel members in the perspective
of their better performance was examined from the small
scale firms view point. They collectively feel that fixing
sales targets, limiting expenses towards the channels and
also distributing products directly to the consumers all
have a negative influence on the relationship.
Even in the other cases, the anticipated positive effect on
the relationship with channels is not indicated as very
high.
Interestingly, those firms that would adopt approach to
limit channel expenses feel that there would be very high
negative impact.
Selecting all channel members on their own is perceived as
a positive contributor to relationship.
A multichannel approach also is generally seen as a
positive influence on relationship with channel members.
246
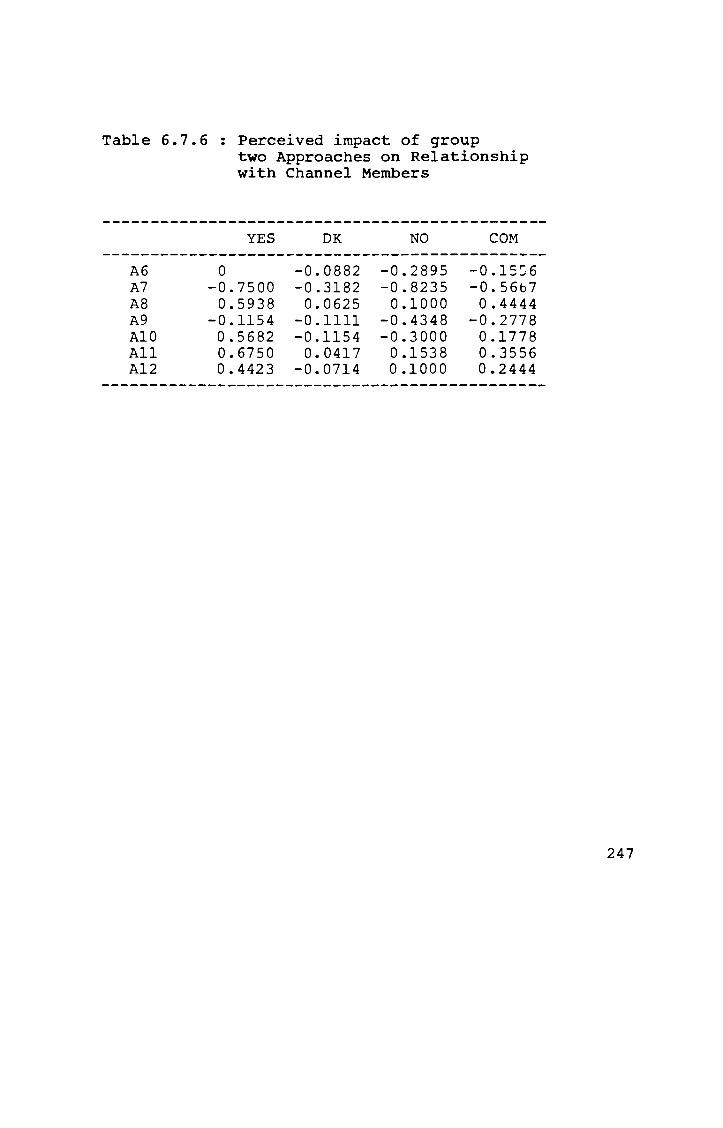
Table 6.7.6
A6 A7 A8 A9 A10 All A12
Perceived impact of group two Approaches on Relationship with Channel Members
YES
o -0.7500
0.5938 -0.1154
0.5682 0.6750 0.4423
DK
-0.0882 -0.3182
0.0625 -0.1111 -0.1154
0.0417 -0.0714
NO
-0.2895 -0.8235
0.1000 -0.4348 -0.3000
0.1538 0.1000
COM
-0.15:6 -0.56b7
0.4444 -0.2778
0.1778 0.3556 0.2444
247
CHAPTER 7
7.0 CONCLUSIONS AND RECO~~ENDATIONS
7.1 PROFILE
The conclusions in general, regarding the SSI units
manufacturing food products in Ernakulam District as
included in this research are recorded in this Section. The
data and detailed analysis which form the basis for these
are given in section 4.1
7.1.1 A major segment of SSI units in the food products
manufacturing category are proprietory concerns. The others
are partnership firms. Other forms of organisation viz.
co-operative societies, though present are negligible in
number.
7.1.2 Location wise, the SSI firms are spread all over the
district. They are not restricted to the District head-
248
quarters. These projects are found to be established in
rural settings as well as in the urban surroundings.
7.1.3 By investments in the projects, each product group
has a different mean. It ranges between Rs.l.82 lakhs and
Rs.3.42 lakhs
Bread Biscuits Spices Pickles
Rs 2.49 lakhs Rs 1.97 lakhs Rs 1.82 lakhs Rs 3.42 la:'-:hs
7.1.4 The mean of working capital employed by the four
product groups range between Rs.0.38 lakhs and Rs.l.60
lakhs •
Bread Biscuits Spices Pickles
Rs 0.42 lakhs Rs 0.38 lakhs Rs 0.41 lakhs Rs 1.60 lakhs
7.1.5 with the mean employment ranging between 7 and 30,
the investment per employment generated is found to be very
low.
Bread Biscuits Spices Pickles
Rs 0.28 lakhs Rs 0.28 lakhs Rs 0.20 lakhs Rs 0.11 lakhs
249
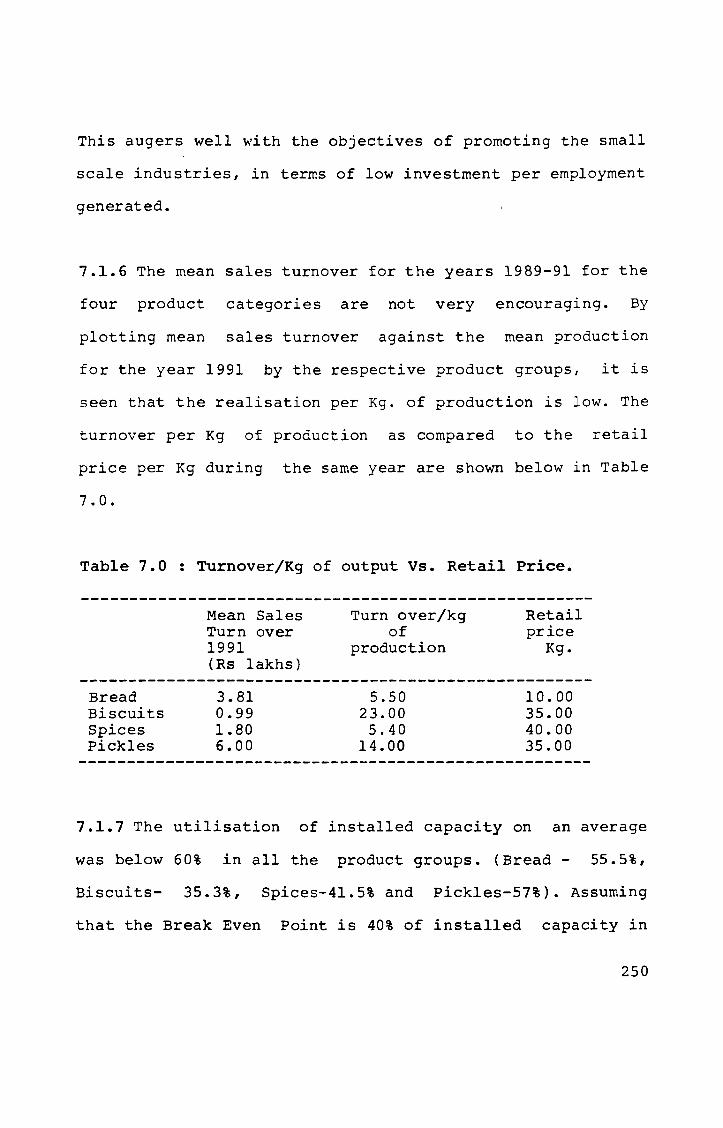
This augers well with the objectives of promoting the small
scale industries, in terms of low investment per employment
generated.
7.1.6 The mean sales turnover for the years 1989-91 for the
four product categories are not very encouraging. By
plotting mean sales turnover against the mean production
for the year 1991 by the respective product groups, it is
seen that the realisation per Kg. of production is low. The
turnover per Kg of production as compared to the retail
price per Kg during the same year are shown below in Table
7.0.
Table 7.0 : Turnover/Kg of output Vs. Retail Price.
Bread Biscuits Spices Pickles
Mean Sales Turn over 1991 (Rs lakhs)
3.81 0.99 1.80 6.00
Turn over/kg of
production
5.50 23.00 5.40
14.00
Retail price
Kg.
10.00 35.00 40.00 35.00
7.1.7 The utilisation of installed capacity on an average
was below 60% in all the product groups. (Bread - 55.5%,
Biscuits- 35.3%, Spices-4l.5% and Pickles-57%). Assuming
that the Break Even Point is 40% of installed capacity in
250
all the product categories, the performance is not very
encouraging. This low productivity has implications on
profitability of these units and resultant viability.
7.1.8 An advantage of low productivity is that there would
be lesser quantity to sell. But the viscious circle of lo~
production, low sales, low cash flow and imminent sickness
would have already set in.
7.1.9 The SSI Firms
Marketing and Finance
the most problematic
face much hazards with
(See section 4.2). While
area for Biscuits and
respect to
Finance is
Pickles
manufacturing units, Marketing is most problematic for the
other two groups.
7.2 MARKETING
7.2.1 With reference to marketing, brand names are not used
by some firms. As discussed in section 4.1, sizeable
proportion of Pickles (75%), Spices (60%) and bread(50%)
manufacturing units have branded their products. But
Biscuits are marketed mostly as unbranded ones.
251

7.2.2 With reference to marketing issues, the Place element
ie. Distribution, is rated as the most problematic area by
all the categories of SSI firms (see section 4.3). This is
followed by Competition.
The high pitched promotional efforts by the State has
stimulated the coming up of a number of SSI units within
the same categories. More over they are spread all over,
geographically. Hence these units are bereft of exclusivity
and they compete with each other, so much so that each unit
is constrained to operate within specific geographic
pockets.
7.2.3 The Nearest point of sales
every case in all the categories.
is within 5 Km in almost
The farthest point
sales is also within 5 Km in sizeable proportion of
of
the
cases as seen in the Table .7.1
As can be seen from the Table, there are many firms that
sell their produce beyond 15 km from their production
centre. Hence the distribution of products is an important
element in the marketing of these items.
252
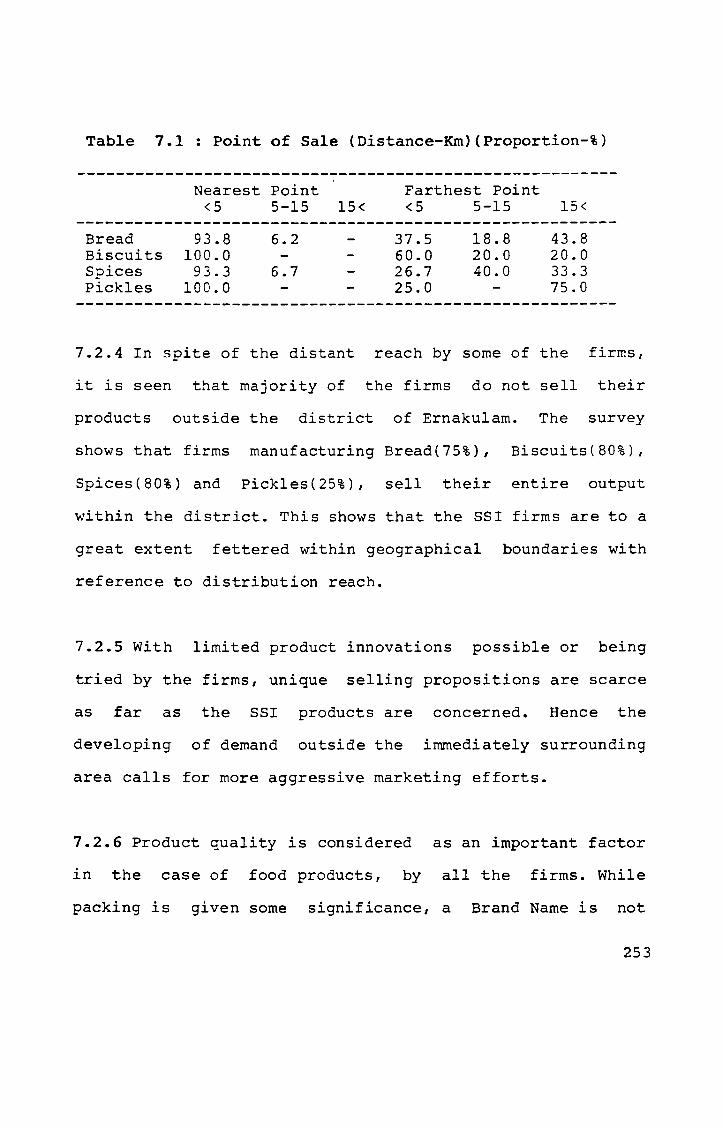
Table 7.1: Point of Sale (Distance-Km){Proportion-%)
Bread Biscuits Spices Pickles
Nearest Point <5 5-15 15<
93.8 100.0
93.3 100.0
6.2
6.7
Farthest Point <5 5-15 15<
37.5 60.0 26.7 25.0
18.8 20.0 40.0
43.8 20.0 33.3 75.0
7.2.4 In spite of the distant reach by some of the firms,
it is seen that majority of the firms do not sell their
products outside the district of Ernakulam. The survey
shows that firms manufacturing Bread(75%), Biscuits(80%),
Spices(80%) and Pickles(25%), sell their entire output
within the district. This shows that the SSI firms are to a
great extent fettered within geographical boundaries with
reference to distribution reach.
7.2.5 With limited product innovations possible or being
tried by the &" ~1rms, unique selling propositions are scarce
as far as the SSI products are concerned. Hence the
developing of demand outside the immediately surrounding
area calls for more aggressive marketing efforts.
7.2.6 Product quality is considered as an important factor
in the case of food products, by all the firms. While
packing is given some significance, a Brand Name is not
253
considered a very serious issue in marketing, (section 4.3)
though majority of them have branded their products.
7.2.7 Price is treated as a sensitive issue as the demand
is considered to be influenced by the same.
7.2.8 But compared to price, competition is stated as a
more problematic area, and is ranked second by all the fnur
product groups (section 4.3)
7.3 CHANNELS OF DISTRIBUTION
7.3.1 Though target market segments are not precisely
defined. The four product groups studied have over the
years been catering to both institutional buyers and
end-use consumers.
7.3.2 In spite of lack of any planned approach to
identifying and structuring channels of distribution, these
SSI firms have increasingly grown to use an assorted
variety of channel structures for reaching their customers.
These channels and their deployment are discussed in
Chapter 5.
254
7.3.3 It is seen that the SS! firms manufacturing food
products are more dependent on the channel members than
vice versa. They view themselves as less powerful than the
channel members. They believe that they cannot exert power
over or demand a specific behaviour from the channel
members. Their control over the actions of these external
organisations is perceived as negligible or non existent.
7.3.4 These small enterprises have over time developed a
form of relationship with the channel members which they
prefer to protect. This could either be because they
generate the 'best' performance from them or because the
service received is the best they can realise and any
change of approach towards the channel members may produce
adverse outcome. Considering the low productivity and
quantum of sales, the later can be taken as true.
Three dimensions of relationship - power, leadership and
communication were examined in this context.
7.3.5 with reference to power, the SSI firms perceive
themselves as subjugant to the channel members. (Sec. 6.2)
The units indicate a negative capability to exert reward
power or coercive power over the channel members. This
means that neither the 'carrot' nor the 'stick' can prompt
255
the channel members to behave the way the SSI units want
them to. Where expert power is concerned, the SSI firms
feel that they have an edge over the channel members; the
expertise being confined to product storage and handling.
7.3.6 Collectively, the SSI firms perceive themselves as
ineffective in taking up a leader role in the operations of
the channel. Initiating and driving the channel members to
perform according to the requirements of the manufacturing
SSI fir8s is not perceived as their own strength by these
firms. (Sec. 6.3.2)
7.3.7 With reference to communication these firms believe
that they can effectively communicate to the channel
members and consider it an important factor. (Sec. 6.4)
Still in practice the methods of communication are not
systematically employed for effectiveness or better
performance by these firms.
7.3.8 The perception that they have limitations in
influencing the channel members, guides the general
attitude and behaviour of the SSI firms. They tend to rely
on the goodwill they have been able to generate and take
extra care to safeguard this relationship with the channel
members and the public. They prefer to avoid decisions and
256
situations that could undo the favourable liason they have
developed with the public. This status is at times at the
cost of foregoing advantages that could have been
capitalised by taking a tougher stand on various issues.
7.3.9 with reference to employing external contactual
agencies in distribution of the products, it is observed
that the geosraphical reach and the choice of channels do
not follow any specific pattern. The SSI firms follow a
trial and error approach for deciding on the channels.
(Chapter 5). They consolidate on those channels that
ultimately provide them relatively better results.
7.3.10 The fact that about one fourth the units studied use
their shops/ outlets for selling their products reveals a
preparedness on their part to reach the market on their own
and not fully depend on external bodies to help distribute
their products. But in such cases, the output levels are
low, the capacity utilisation ranging between 8% to 50%.
The geographical reach is also restricted, expect in a few
cases where the product quality bring in consumers from far
away places.
7.3.11 The SSI firms do not define their objectives in
terms of performance viz. sales targets (Sec. 6.6.1) to the
field force or even themselves.
257
7.3.12 The lack of potential to control the channels on the
part of the SSI firms indirectly affects control on costs;
especially the costs related to promoting the channels.
(Sec. 6.6.2)
7.3.13 The need for having own vehicle for distributing the
products is prominently felt by the firms (Sec. 6.6.3).
7.3.14 But it is also found that these SSI units would not
totally adopt an approach to directly distribute the
product to consumers thus eliminating external
organisations. (Sec. 6.6.4) In fact there is a positive
attitude towards a multi-channel approach. (Sec. 6.6.5)
With personal selection of channel members to some extent
and periodic assessment of their performances, the SSI
firms hope to get a fair support from the channels of
distribution so as to successfully market their products
and justify their existence in the field. (Sec. 6.6.)
7.3.15 The SSI firms are seen to be operating on very 'thin
ice' with respect to relationship they have with channel
members. Their expectation about various outcomes viz-a-viz
the adoption of different approaches is analysed in Sec.
6.7.1. As can be seen, these SSI firms tend to adopt a very
safe role. While giving lee way to the channel members on
258
most issues, they express themselves sparingly on issues
where they are sure that the relationship will not be
adversely affected.
7.3.16 The SSI firms are also observed to be very diffident
as to their attitude towards adopting approaches that could
have implication on the performance of the channels. At
times, de~isions are taken while the outcome is knowli to be
not very encouraging. In many cases decisions are avoided
even while the outcome of such decisions are expected to be
positive. The analysis of this diverse orientation is
detailed in section 6.7.2.
7.4 OBSERVATIONS
7.4.1 The small scale industrial sector appears to exist
and perform in an environment which simultaneously nurtures
and places impediments. The attractive promotional support
offered is often a great stimulant for prospective
entrepreneurs to walk into the field.
7.4.2 The enthusiasm to expand the small scale industrial
base on the part of the State, often leads to presenting an
over simplified preliminary phase which helps draw in the
prospects faster. Once the prospect makes his initial
259

moves, the reality in
delays dawns on him.
the form of procedural wrangles and
Many a time, these promoters would
have committed themselves to such an extent that
withdrawing from the project would entail heavy financial
losses. At the same time, going ahead with the project may
call for increasing financial outlay and cost overruns.
7.4.3 Thp system is not the only culprit. The pr~moters
themselves are not always equipped. They may not be
adequately informed or may take many things for granted.
Many a time they expect to be spoon fed. To compound the
issue, each support mechanism has a pace of its own so much
so that integrating all the required elements, demands
tremendous effort and deftness on the part of the
promoters.
7.4.4 The planning of a small scale industry ideally
follows a sequence of activities which includes identifying
opportunities, assessing resources and
obtaining licences and clearances,
their sources,
documentation,
preparation of project feasibility report, tying up with
promotional and supporting agencies and finally the process
of project implementation. Obviously some of these steps
can be taken up simultaneously.
260

7.4.5 A thorough understanding of the requirements of each
stage is essential for an industrialist to be effective and
be cost efficient. This is not always the case, as quite a
number of prospective industrialists, in quest for speed,
end up assigning the organisation of some or all of these
stages to free-lancing consultants or agencies. This, while
easing rhem out of the responsibility of runni~g after
mundane procedural activities, also leaves them unaware of
the significance or relevance of many such formalities and
st ipul at ions.
7.4.6 One such major aspect that has lost serious fore
thought is Marketing. It is observed that many a project is
conceived on the basis of :
a. the technical expertise of the promoters
b. the access to personal sources of funds
c. the availability' of skilled but economic labour
d. the fact that an existing project is performing well in
the area.
These and many such reasons guide the selection of a
project. A detailed assessment of the market potential is
seldom if ever taken up, either by the promoters or by the
261
promotional agencies. The promoter gets away by stating
"Good Demand" against the query -"Market potential for the
project", in the application form for Provisional SSI
Registration. Even if a studied presentation is made by the
promoter, the Industries Department does not have the
mechanism to verify or examine the same and confirm its
authenticity.
Thus the onus of identifying the market and devising
methods for tapping it rests exclusively on the promoters.
But the promoters, it is observed, rarely do a thorough
study of the market or its potential before the project is
implemented.
7.4.7 More over, it appears that the marketing dimension
which is fundamental to the development and survival of the
SSI sector is not given the required fore thought by the
State while planning development of this sector. Project
proposals are more academic exercises rather than based on
hard realities of the environment and market .
7.4.8 It must be stated that elementary support is being
provided to supplement the marketing efforts of a few
categories of SSI units and their products. The stores
purchase scheme, wherein a series of products are reserved
262
by the Government of India for purchase exclusively from
~he SSI is one instance. The National Small Industries
Corporation (NSIC), acts as a coordinator for SSI to
=egister under this scheme and also channelise information
and products. Interestingly, it is understood that not much
8f activity has taken place in this count from within the
s~ate of Kerala.
7.4.9 The District Industries Centres, conceptually, were
~esigned to also provide marketing support to the small
enterprises. By structure, each DIC has on section headed
by a Manager, to look after the marketing requirements of
~he SSI. This again is found to be an in-adequately
employed support facility. Given the limited man-power
available with the Department and considering the need for
a case-by-case handling of marketing issues of the SSI,
~his facility is not found to be effective nor is any
assistance being sought for by the Small enterprises.
7.4.10 A recently emerging method for supporting the
carketing efforts of the SSI is by organising exhibitions
cum-sales for their products. The regional associations of
the SSI firms along with the Industries Department take the
initiative for such activities, which to a great extent
provide the firms a visibility that otherwise would have
263
cost them much higher. The effectiveness of promoting SSI
products through exhibitions and fairs is enhanced by
~rganising 'them for specific product groups, so that
specific market segments may be targeted at. A variety of
product groups including electronic products, engineering
~oods, building materials and textiles have been promoted
~hrough such exhibitions. But exclusive exhibitions for
?ood Products from the SSI secto= have not been reported so
7.4.11 Even with all these, it must be stated that the
support and guidance for marketing the SSI products is
scanty, irregular and unorganised.
7.4.12 Market information is inadequate. There is no
effective system by which relevant information is
=ollected, compiled and efficiently disseminated. It must
~e said that some of the promotional agencies do maintain
libraries where quite a substantial volume of information
is available. The catch here is in the retrieval of
=elevant information. Easy and quick access to precise and
=elevant information is seldom possible in these places.
7.4.13 It must thus be inferred that the adhoc approach to
promoting the SSI with scanty appraisal of the
264

marketability is a bane on this sector. Unscientific
promotion of the SSI units without adequate consideration
of their co~~ercial viability leads to colossal investment
in assets that are neither productive nor are reemployable.
7.4.14 While small enterprises are known to be inhibited by
hazarcs of varying dimensions in all the managerial
functional a=eas, it is found from rhis study that Finance
anc Marketing are the two areas where the SSI units face
most problems. The issues related to finance include, as
listed by these firms:
Paucity of working capital
Under-financing by financial institutions
Inordinate delay in financing
Inadequate cash-flow
7.4.15 The issues related to marketing are multifarious.
These include :
product image and acceptability - Building up an image
and resultant acceptability proves to be a difficult
job for most SSI units. Generally, these SSI units do
not have a standard pattern of product which stands out
with some uniqueness. With many units manufacturing
265

similar range of products, the scope for specific
recognition of a product viz-a-viz any specific unit is
difficult. As a result a large number of these units
reach the market with "ME TOO" products.
Market intelligence - The absence of an effective
market information system, either within the
organisation or outside, puts the SSI units in a
precarious position.
Marketing decisions tend to be adhoc - with even basic
information being inadequate, many of the decisions
tend to be adhoc or intuitive. The urgency of each
situation force the industrialists to take decisions
that may even have long term implications. This
tendency to work by hunches inevitably inhibits a
careful cost-benefit analysis of any particular
decision.
Management education is limited - It is also seen that
with the high literacy level of the state, all the SSI
promoters have had elementary education. But any form
of formal management education among them is scarce.
Less than ten percent of these individuals have had
some exposure to scientific management principles,by
attending short duration Management/Entrepreneur
development programmes. The others are understood to be
guided by hunch, heuristics or wisdom.
266
In-effective production planning - It can be seen from
this study that a majority of the units have not
resorted to proper production planning which is in line
with the actual demand in the market. The fact that a
majority of units in each category (between 50% and
80%) use less than half their installed capacity is
revealing. This would mean th~~ a sizeable number of
units barely break-even.
Low productivity can be attributed to two basic factors -
a. Insufficient working capital
b. Difficulty in marketing the products
Though not mutually exclusive, these factors have a cyclic
cause - effect relationship. This has a resultant impact on
the survival of the SSI enterprises. See Figure 7.1
7.4.16 It is jocularly said that banks are happy to finance
a project whose promoters are financially sound and do not
essentially need financial support. Whereas these financial
institutions shy away from projects that do not have
adequate resources of their own but genuinely require
support.
267

flOO
R!
7.1
MO
DE
L
OF
S
SI
OP
ER
AT
ION
S
Su
ocu
sfu
ll
SSI
t t
1
r---
----
----
-,
1 1
Pro
fi ts
1
__
__
J L
__
__
__
__
__
__
J
r---
----
----
-,
1 L
oss
1----
' L
__
__
__
__
__
__
J 1
t t
Sic
k SS
I
.---
-..
r---
----
----
---,
O
ptiM
al
1<4-
--1
Ade
quat
e 1
44
---------------
.....
~orking
Cap
ital
1
Cas
h Fl
ow
1 L
__
__
__
__
__
__
__
J
Cas
h
+ V
t
[OUTP
UT I
.III1
ARKE
Tl N
G C
ash
-V
t U
nsol
d ~,
GOOd
S re
turn
'---
--+
'IG
oo
ds
spo
iltl
"
I nsu
ff i
c i e
t:\t
----
----
----
--, 4
-_
__
__
__
__
__
__
_ _
L---
---,
I~or
king
CaP
ltalj
4
~ In
adeg
uate
14
I
Cas
h Fl
ow
1
I-~cl
~.os
ed
SSI
I
4 •
SSI
SIAI
US
4 •
PROD
UCT I
ott
I PR
OCIS
SIHG
. I 4
L
_ -
--
--
--
--
--
-_
J N
il . t
I
~orking
Cap
l a
4 •
MAR
mIH
G
7.4.17 with reference to marketing, i~ is observed, across
the product groups, that the channels of distribution and
their management pose the maximum cifficulties for the
s~all enterprises. A variety of factors can be identified
~ith respect to 'place', which are d~scussed in detail in
cha?~er 6.
7.4.18 Competition is a factor that ~he SS! firms find
dif=iculty in managing. The mushroo~~ng of small units
~anufacturing similar range of products, catalysed by the
promotional schemes, has created a su~?ly situation far in
excess of the demand. Incidentally, the demand is something
which has not been estimated as a prerequisite for
promoting these projects.
Hence there is a proliferation of SS! =irms engaged in or
equipped for manufacturing similar pro~ucts, and they end
up nibbling at each others market. The age old concept of
survival of the fittest prevails, and we are left with a
series of sick or closed SSI units.
7.4.19 The pricing is listed as the ~hird most critical
area where the SSI face problems. For ~~ite a number of SSI
units the low turnover and inadequate cash-flow calls for a
269

higher price structure, which due to obvious market forces
is not an easy proposition for the SSI firms. Any variation
in price affects the market adversely.
Moreover, the small enterprise promoters say that the
frequent fluctuations in prices of rawmaterials too have
had a retarding effect on their growth, as managing finance
with reference tu escalating raw material prices against
stagnant finished goods prices often takes its toll.
These firms cannot go in for periodic increases in their
product prices as that would affect their credibility and
erode even the existing sensitive demand.
7.4.20 The channels of distribution being the prime concern
of this research, an in depth analysis of the operations in
this area was taken up.
A primary observation is that a majority of units have not
defined their customers precisely, so much so that they
tend to initially adopt the typical marketing channel
structure ie. manufacturer wholesaler retailer
consumer. The target market segment not being defined in
most cases, the distribution strategies too are
lacadaisical.
270
7.4.21 The fact remains that the SSI are dependent on the
channels of distribution to reach their products to the
consumers. Hence the major function of the channel members
as far as SSI are concerned is identification of consumers.
The visibility of any SSI firms is dependent on the channel
members. This is more so since the small enterprises have
limitation in going in for extensive prc~otiona1 measures.
7.4.22 The channel of distribution is a critical element in
the marketing of SSI products. The exposure and reach of
the SSI firms is in effect enhanced by the channel members.
Especially with limited resources left with the SSI firms
for extensive promotional efforts, the channel members have
a prominent role in influencing the sale of SSI products.
7.4.23 This research reveals that the SSI firms by and
large do not have a clear perception about the functions
that channels can effectively take up. The functions of
risk bearing, economising effort, extending credit,
financing, providing market information and constant
monitoring of market and trends are not being fully
utilised by the SSI. There appears to be a lack of
awareness regarding these aspects. As observed elsewhere in
this report there is a need for extensive education of
271
~hese SSI promoters in general management and specifically
~n the fundamentals of marketing management. So far,
~arring a minority, the SSI owners operate based on trial
~~d error and in the process end up wasting precious time,
e=fort and money.
7.4.24 There is a general air of resignation and an
~~titude to accept just what comes their way. A lack of
~~areness about their real potential keeps them complacent
~=~ut and at times even satisfied with the extremely low
~=oductivity levels and market penetration that they are
~le to achieve.
~~is is a manifestation of
systematically assessing the
:acadaisical approach towards
their low concern for
market potential, and a
gathering feedback from
5~bscribers as well as the channel members. While a few
=irrns do claim to have some arrangement for obtaining
=eedback from the subscribers, they seldom take up a proper
evaluation of their customers and their preferences. The
~aucity of information regarding their customers profile
~~d their attitudes and preferences inhibit the SSI units
in evolving better marketing strategies so as to gain a
conpetitive edge over other firms. Lack of a strong will to
co better lead these units to mediocracy.
272

The absence of a fighting spirit culminates in the
promoters of these units trying to maintain them just as a
source of employment and income and not as an avenue to
project their skills or achieve excellence. Hence we have a
collection of SSI firms trying to just survive and not be
vibrant and growing.
7.4.25 It is also observed that these SSI firms do not have
a clear definition about their customers. Market
segmentation is rarely done, as most of the firms have a
product orientation. The customer orientation that is yet
to set in would have given them a precise direction while
planning the channels of distribution.
7.4.26 As such, since the targets are not precise, the SSI
end up with hazy approach strategy and hence channels, that
incorporate channel members who need not necessarily
deliver the goods. The viscious circle of a wrong channel,
low sales and low profitability leading to sickness is the
order that is mostly observed. This again is a pointer to
the need for providing adequate managerial education to the
promoters of the small enterprises.
273

7.4.27 The SSI firms need to be helped to realise and
identify their own strengths. This would help them in
boosting the confidence which they 'presently lack.
The SSI firms have to develop a market orientation so that
they have a clear perception about their target market
segments. This is of utmost concern as the SSI firms have
to have properly defined ~arketing ~~rategy and prior
distribution plans so that t~e limited resources at their
cisposal can be optimally uti~ised. Marketing plans must be
drawn up even while the project feasibility report is being
prepared prior to project implementation. The present
practice of being hazy about the market and presenting
sweeping observations about ~he market prospects must be
purposefully avoided.
7.4.28 Adequate attention should be given to evolving a
systematic information dissemination mechanism. The SSI
firms operating in similar fields should get together so
that information of common interest could be shared.
Alternatively, these units could, with the help of existing
Government machinery, streamline the data compilation and
retrieval system so that decisions may be based on more
accurate and relevant premises.
274
REFERENCES
1. Suri,K.B., Ed., Small Scale Enterprises in Industrial Development - The Indian Experience., Sage Publications India Pvt.Ltd, N.Delhi., 1988.
2. Tyabji, Nasir., The Small Industries Policy in India., Oxford University Press, Delhi., 1989.
3. Risley, George., Modern Industrial Decision Making Approach., McGraw Hill 1972.
Marketing A Book Company.,
4. WaIters, C.Glenn., Marketing Channels., Goodyear Publishing Co. Inc, California., 1977.
5. Pillai, Sivathanu., Economics and Business Statistics., Progressive Corporation Pvt. Ltd, Bombay., 1981.
6. Kumar, S.Krishna., Strategy for a Massive Effort for Small Industries Development in Kerala State., 1975.
7. III Five Year Plan - Draft Outline - 1960.
8. Mamoria C.B and Joshi R.L., Principles and Practice of Marketing in India., Kitab Mahal, Allahabad., 1984.
9. Brennen, William H., Successful Harketing - for Your Small Business., Prentice Hall Inc, New Jersey., 1978.
10. Mason, Ralph E., Patricia Mink Rath L. Ross., Marketing and Distribution., Inc., 1974.
and Herbert Mc Graw Hill
11. Vepa, Ram K., Small Industry - The Challenge of the Eighties., Vikas Publishing House Pvt. Ltd., 1983.
12. Vepa, Ram K., Modern Small Industry in India - Problems and Prospects., Sage Publications India Pvt. Ltd, New Delhi., 1988.
13. Bowersox, Donald J., M.Dixby Cooper., Douglas M. Lambert and Donald A.Taylor., Management in Marketing Channels., Mc Graw Hill Inc., 1980.
14. Johnson, Eugene M., Ray S. House., Jr., Ed., Reading in Contemporary Dryden Press Illinois., 1977.
Carl D. McDaniel Marketing., The

15. Rosenbloom,Bert., Marketing Channels - A Management View., The Dryden Press (A Division of Holt Rinehart & Winston Publishers), Illinois., 1978.
16. Van Voorhis, Kenneth Business Management., Massac~usetts., 1980.
R., Entrepreneurship and Small Allyn and Bacon Inc, Boston,
17. Mamoria, C.B. and Joshi, R.L., P=inciples and Practice of Mar~eting in India., Kitab Mahal, Allahabad., 1990.
18. Srivastava, P.K. and Agrawal, J.K., Marketing Manage~ent., National Publishing House, N.Delhi., 1980.
19. Stapleton, John., Ed .• Marketing Handbook., Grower Press ~td. Epping, Essex., 1974.
20. Rachman, David J., Marketing Strategy and Structure., Prentlce Hall Inc., 1974.
21. Mc Daniel, Carlo Jr., Marketing., Harper & Row Publishers, N.Delhi., 1982.
22. Guiltinan Manager:-Lent Inc., 1982.
Joseph P and Gordan W. Paul., - Strategies and Progress., Mc
Marketing Graw Hill
23. Cundiff, Edward W., Richard R. Still., and Norman A.P.Govoni., Fundamentals of Modern Marketing., Prentice Hall of India Pvt. Ltd, N.Delhi., 1980.
24. Kotler, Philip., Marketing Management Analysis Planning & Control., Prentice Hall of India Pvt Ltd, N.Delhi., 1982.
25. Young, Pauline V., Scientific Social Surveys and Research., Prentice Hall Inc., New Jersey., 1966.
26. Wilkinson,T.S., and Technique of Social House., 1977.
P.L.Bhandarkar., Methodology and Research., Himalaya Publishing
27. Kothari,C.R., Research Methodology- Methods and 'l'echniques., Wiley Eastern Limited, N.Delhi.,1990.
28. Gerrn, Paul E. and Donald S. Tul1., Research for Marketing Decisions., Prentice Hall of India Pvt. Ltd., N. Delhi., 1986.

29. Lehman, Donald R., Marketing Research and Analysis., Richard D Irwin Inc, Homewood Illinois., 1979.
30. Sims, J.Taylor., J.Robert Foster and Arch G.Woodside., Marketing Channels - Systems and Strategies., Harper and Row Publishers lnc, New York., 1977
31. Proctor, Tony and Marilyn A. Stone., Marketing Research., Macdonald and Evans Ltd, Estover, Plymouth., 1978.
32. Dodd,T.F., Sales Forecasting., Epping, Essex., 1974.
Gower Press Ltd. ,
33. Vatsyayan, Dr. , Gene:'-c:l Psycholoc;y., Kedar Nath Ram Nath, Meerut., 1983.
34. Koontz, Harold., Cyril O'Donnel Essentials of Management., 4th Company, New York, 1986.
and Heinz Ec.., McGraw
Weihrich., Hill Book
35. Peters, Thomas J. and Robert H. Waterman Jr., In Search of Excellence., Harper & Row, Publishers, New York., 1982.
36. Munn, Norman L, L. Dodge Fernald. Jr. and Peter S. Fernald., Introduction to Psychology., Oxford and IBH Publshing Co., New Delhi., 1967.
37. Paters on , William., Industrial Publicity Management., Business Books Limited, London., 1968.
38. Jefkins, Frank., Advertising., Rupa & Co., 1973.
39. Gopalakrishnan, P and M. Sundaresan., Materials Management - an Integrated Approach., Prentice Hall of India Private Limited, New Delhi., 1977.
40. Hersey, Paul and Kenneth H. Organisational Behaviour., Private Limited., 1974.
Blanchard., Management of Prentice Hall of India