Embed Size (px)
Citation preview
Marketing Mix Modeling Application & Implementation In Data Deficient Countries
Introduction: The Problem of Applying Analytics in Newly Advancing Economies
Global markets are shifting. Demand is rising in “new economy” countries, such as Brazil,
Russia, India, and China. Established and domestic markets, on the other hand, are facing a
rapidly-approaching saturation point. Both manufacturers and marketers are angling for a bigger
share of that “Fresh Markets” pie, though with a relatively small investment. This means that
businesses involved in this must perform on a high volume/high ROI matrix. And that requires a
careful analysis of the facts.
Doing deep dive analysis to identify opportunities is relatively simple in developed countries, but
it is not always easy in these newer markets. Often, this is due to the markets being “data
deficient” – faced with a lack of complete information. The biggest challenge in this situation is
the availability of the data in an analyzable form. A secondary challenge is that the complicated
concept of data analysis is fairly new in these countries. This can lead to application and
implementation that is quite different.
For marketers, this combination of new concept and different process raises the following issues:
• If the data is not very granular – or if it is incomplete – is analysis possible? Will the
results be correct?
• What is the cost of building and implementing analysis procedures? Will the return from
this cost justify it? Will it give us new insight, or will it be wasted money?
• How can results, once gained, be applied?
Like other marketing analytics techniques, market mix modeling and portfolio optimization is a
mixture of art, science, and judgment. This paper shows the value of using marketing mix
modeling in a data-deficient environment.
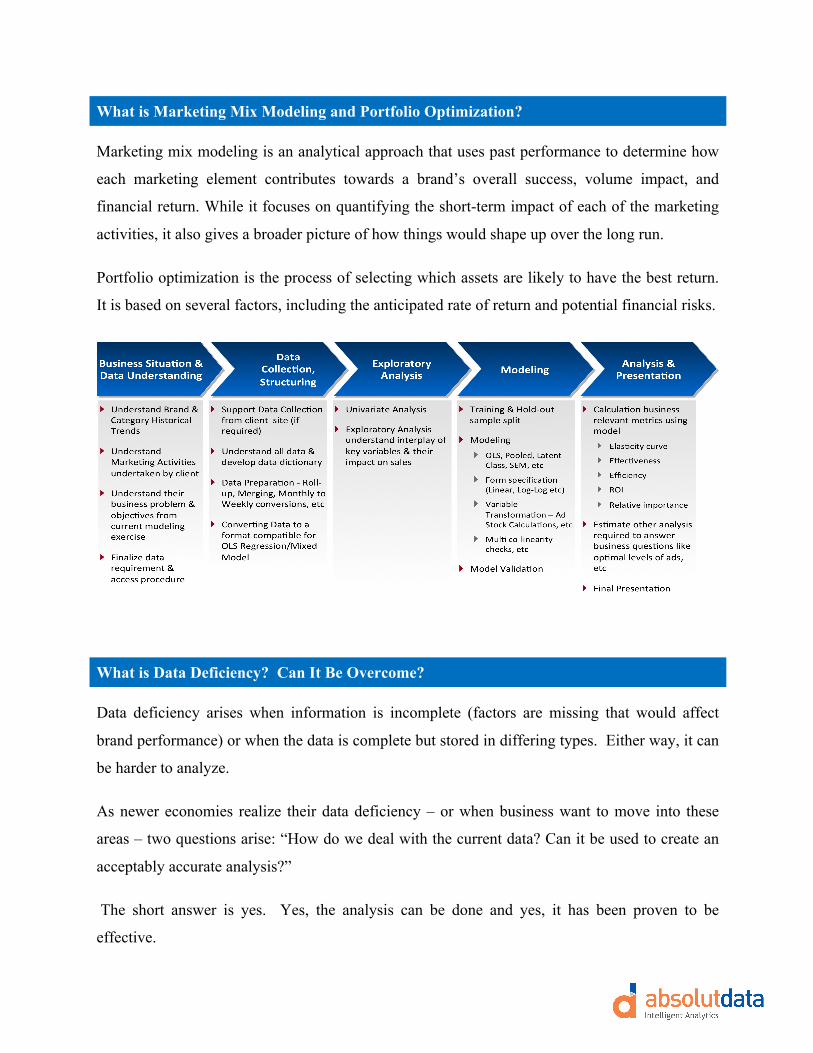
What is Marketing Mix Modeling and Portfolio Optimization?
Marketing mix modeling is an analytical approach that uses past performance to determine how
each marketing element contributes towards a brand’s overall success, volume impact, and
financial return. While it focuses on quantifying the short-term impact of each of the marketing
activities, it also gives a broader picture of how things would shape up over the long run.
Portfolio optimization is the process of selecting which assets are likely to have the best return.
It is based on several factors, including the anticipated rate of return and potential financial risks.
What is Data Deficiency? Can It Be Overcome?
Data deficiency arises when information is incomplete (factors are missing that would affect
brand performance) or when the data is complete but stored in differing types. Either way, it can
be harder to analyze.
As newer economies realize their data deficiency – or when business want to move into these
areas – two questions arise: “How do we deal with the current data? Can it be used to create an
acceptably accurate analysis?”
The short answer is yes. Yes, the analysis can be done and yes, it has been proven to be
effective.
The question of how to manage data still remains. At AbsolutData, we have been able to solve
this by:
• Identifying different sources that can be used to collect data
• Merging data from different sources, and transferring them to a standard format
• Applying statistical techniques to convert monthly or bi-monthly data into a weekly
format, thus ensuring there are enough data points available for accurate modeling
• Building a simple-yet-effective data validating tool, allowing users to review the data and
identify possible anomalies
Most importantly, our approach relies on good communication and a strong partnership with the
business teams. We try to ensure that whatever data is used represents the correct trends. In
other words, we take into account special events or other occurrences which may have
influenced the data we’ve collected. Partnering with the business team really helps in identifying
such instances, which can lead to incorrect results if they are not rectified.
The above methods have helped our firm manage and drive business insights. One of our key
clients has been deploying these across its international regions and across different categories,
as have other AbsolutData clients. In fact, you can read an account of one of these clients’
experiences in the case study at the end of this white paper.
Starting the Process: Understanding Business Performance and Data Collection
Understanding the environment in which the product is placed is key to a successful marketing
mix model. This includes its category and segment, the product itself, various external factors,
the historical performance of these factors, and any changes over time. Our team has developed
a detailed questionnaire to record all of these items. This introduction phase also aids in
identifying what data feeds will be required for the analysis.
Though it seems simple on paper, this introductory process is very critical to the success of the
entire project. Our experience (of over 100 models) has proved that any project where this step is
not done properly will inevitably have issues during modeling and final presentation.

The Next Step: Collecting and Converting Available Data
Collecting data for the same time period and on the same form is one of the most important parts
of building an accurate model. The challenge in some data-deficient environments is when the
data is measured – some elements are based on monthly collections, while others are measured
every week. Uniform granularity is a must, and this is what our approach provides. It correlates
all the data at a weekly level, applying weights to each week of a particular quarter and thus
ensuring that the numbers tally at the quarter level. (This approach tends to give a better
representation than the general approach of 4-4-5 or 4-4-4 week conversion.)
This approach is uniformly applied; even when variables are already measured at a weekly
interval, they are added together for the month and recalculated according to the same weighted
system. This step ensures that all the data is processed the same way.
Other data issues, such as outliers, are relatively less weighty and can be imputed by using
simple mean / median application. Should a lot of information be missing, we use two basic
approaches to complete the model:
1. Application of the variable from a continuous form into a discrete form. This helps
the marketing team understand if an event has an impact on sales, though it doesn’t
address the magnitude of its impact.
2. Elimination of data points based on insufficient hypotheses. When a variable doesn’t
have a tenable hypothesis, it is best to eliminate it from the analysis.
As we already mentioned, data collection must necessarily rely on information from different
sources. These could be internal, ranging from the marketing team to the finance team. Or they
could be external, such as other agencies that have access to media and retail audit data. Where
possible, preference is given to the volume and sales data from the retail audit, rather than the
shipping information; the retail audit data maintains uniformity with category growth,
distribution variables, and even competition variables.
Moving On: The Exploratory Analysis
Exploratory analysis is a way of analyzing data and isolating certain characteristics for a deeper
study. It is a core part of any modeling project; in a data-deficient environment, it is an essential
practice. This is because people tend to be unaware of the trends across different variables. The
exploratory analysis helps set up a basis before launching the actual modeling process. Other
reasons for the importance of this step include:
• Missing variables. After using exploratory analysis, the modeler will be able to examine
the variable trends and the volume trend. He or she can use this information to detect if
all the variables are capturing the peaks and dips – if not, it is possible that a variable is
missing.
• Mistakes in Data Collection. At times, wrong data pulls occur, and an exploratory
analysis makes it easier to spot this mistake.
• Preparation for the Initial Hypothesis. An exploratory analysis helps build an initial
hypothesis in which all variables could be highly significant.
Our process for data-deficient environment includes a tool that allows both the modeler and the
brand manager (or marketing manager) to view and understand the exploratory analysis. It
depicts all the collected information in graphical form, along with bi-variate regression,
correlations, and other advanced additional information which the brand team can toggle on or
off as needed.
The key is that by simply observing graphical trends for each variable against the volume
(dependent variable), one can identify anomalies or missing information. For example, a spike in
volume without a similar spike in corresponding variables usually indicates some missing data
along the route.
Another product of exploratory analysis is basing your rationale on hard data and not on
hypotheses. To illustrate: A brand team believes that the catchy new ad campaign had a huge
positive impact on volume. However, looking at a graphic representation of the data from that
time period shows that the competition’s distribution was down. So it becomes clear that the
impact on volume was due to both factors: the brand team’s efforts and to the problems of their
competitor.
The Heart of the Process: Developing the Marketing Mix Model
Now that there’s a uniform set of data and a baseline for the important factors, the marketing mix
model can begin. There are many sophisticated approaches that can be applied here. Given the
current (deficient) data environment, AbsolutData uses two primary approaches:
1. OLS Regression: This relatively simple method is based on time series regression. This
process helps in isolating the impact due to individual causal factors. AbsolutData uses a
unique in-house tool to apply OLS regression. Because the tool promotes transparency in
the modeling approach, it is less intimidating for business teams. It is based around a user
interface that can switch any variable on or off. Every time this action happens, an OLS
regression runs on the selected variables and thereby gives out the required matrices. The
tool saves any prior steps, so the user is able to relate the graphical trends and then switch
the variable on or off.
2. Another approach we use is Constraint Regression. Constraint regression limits the
coefficient (a variable that may not align with other data) within defined estimates and
then runs the regression. After a basic OLS model is developed, the brand and marketing
teams are invited to contribute estimates for ideal range parameters. These range
estimates can be determined by looking at other marketing mix models built for a similar
product or category within a similar region. The modeler then builds a model using these
parameters to modify the effect of the questionable variable.
Constraint regression is especially useful in data-deficient environments, as a particular variable
might have a higher value that cannot be reduced because no other variable would fit into the
model. However, applying a constraint onto that particular variable can limit its contribution
without needing an additional variable.
As an example of constraint regression at work, imagine that price elasticity (PE) for a certain
product is -4. Ideally, this should not be the case, as a similar product has -2 PE in the same
region. It then becomes important to apply a constraint of -2 onto the PE variable and then
observe how other variables change.
Estimation of adstocks within the model: Different adstock values (changes in consumer response
to advertisement) are tested in the model with the goal of obtaining a true fit with the existing
data. The estimation of adstocks is done both by statistical validation and by hypothesis. These
hypotheses are based on reviewing advertisement scores, link scores, advertisement awareness,
and other methods, then determining where the adstock can be high or low. Practically speaking,
in cases where there is a high awareness along with a good score, the impact of advertisement
would have a long-term decay. Therefore, even though there are no gross rating points (GRPs),
the decay from the past period would drive some volume, due to decayed GRP in the current
month. Estimation of adstock is basically the estimation of the decay in weeks.1
With the completion of each step, a meeting with the key stakeholders is required. The goal is
not just to review progress, but to educate them on how the modeling process works. Often
additional business nuances, which might not have been mentioned before, are also revealed
during these meetings. Each of the models are summarized and discussed with the brand team.
As these are not purely statistical models, it is important that each variable has a business
validation, even if it is with a slightly low statistical fit.
1 There are other advanced methods of estimating adstock, but it is not within the scope of this paper to define them.
Please feel free to get in touch with the author for more information.
Using Marketing Mix Models In Business Analysis
Answering business questions such as the ones mentioned below is of primary importance when
using marketing mix models. Be sure to consider:
• Is there an opportunity to increase the current price?
• What are the key volume drivers, in terms of their quantifiable contribution?
• How critical is it to drive distribution, and across which channels?
• Is it beneficial to invest in outdoor media?

• Should there be an increase in GRP level, or is maintaining the current level good
enough?
• Does the current brand perform well with only Above the Line (ATL) or Below the Line
(BTL) support strategy? Or does it require both ATL and BTL support strategy?
• What elements of the competition are affecting us the most? GRPs? Distribution?
Promotion? Where should marketing focus to counter the competitor’s actions?
Application analysis can help you formulate and answer key questions. Consider questions
raised in regards to volume due to (factor), marketing elasticity, return on investment, and
portfolio optimization:
1. Volume Due To (factor): One of the most important and basic application of marketing
mix is the clarification of “Volume due to (factor x)”. For example, you could use a
waterfall chart representing different drivers and their impact on the volume. This type of
chart will help in understanding what change in volume is due to change in the driver
itself.” (i.e. Price was increased by 10 percent, hence volume dropped by 15 percent.)
The key questions answered are:
a. What are the volume drivers and what was their contribution?
b. Who is our main competition? And what elements of their products are impacting us?
c. Where should the marketer focus to counter the competitor’s actions?
2. Marketing Elasticity: A summary of elasticity information from the marketing mix
models helps the marketer determine what lever to pull and the impact it would have. To
illustrate: A price elasticity of -1.2 means that when price is increased by 10 percent, the
expected volume drop is approximately 12 percent, all other factors being equal.
Similarly, you can do some basic estimations by looking at other elasticity measures such
as distribution, advertisement, and promotion. You can even measure comparisons
across elasticities.
3. Return on Investment: The ultimate goal of any marketing mix is to be able to
understand what the Return on Investment (ROI) is for the main drivers of volume. It is
important to understand what drives volume and the extent of each driver’s impact; it is
also important to know how much is earned back from the investment in each driver.
ROI plays a critical role especially in understanding TV and promotion investments. And
as both of them are fairly expensive, knowing the mix of investment towards them is key
to being able to increase their ROI. Further, these metrics help in prioritizing investments
across brands and across different marketing channels.
4. Portfolio Optimization: Portfolio optimization is the next step in the application of
marketing mix. It provides the inputs to give marketing managers the ability to move
investments across different brands and marketing levers, to drive maximum volume and
improve ROI across their brand portfolios. The analysis provides marketing managers a
toolkit to make changes in the investment plan based on the portfolio objective (i.e.
driving volume vs. driving profits).
Over the past few years, AbsolutData has been instrumental in deploying the above approach in
such data-deficient countries as China, Philippines, Indonesia, Malaysia, Ukraine, Turkey, and
Romania. Our approach has been well received, especially in the international and domestic of
businesses our clients (two of which are the world’s second largest food company [Client 1]
and one of India’s leading fast-moving consumer goods (FMCG) companies [Client 2]).
Both of the organizations have felt the impact of marketing mix modeling, and the tools that are
part and parcel of our process have helped equip their marketing managers to optimize their
spending plans.
Analysis has helped the marketing, finance, and other key stakeholders of the business with
many of the above-mentioned questions.
For Example:
• [Client 1] used the analysis to understand its key levers. This knowledge enabled the
business to realign their investments towards achieving their targets, which otherwise
may have been missed.
• The analysis helped [Client 1] to identify low ROI elements across different investments.
A dialogue was started regarding how these points could be improved. NOTE The
following round of analysis demonstrated to the brand team how certain changes did
improve ROI.
• [Client 1] has already witnessed an improvement of over USD 40mn in just one of its
categories. The team is now using the analysis to identify opportunities to accelerate
growth beyond its current target.
• [Client 1] used the analysis to outline its business case for additional funds and how
these funds would be used to achieve the target.
• The analysis helped some of the other regions to discontinue certain underperforming
promotions.
• After reviewing their analysis, [Client 2] has been able to focus on refining certain
marketing elements like promotions.
Now let’s examine a case study in detail: How a leading food and beverage multinational has
used this approach in international markets to maximize volume and revenue.
Case Study: Marketing Mix Modeling Analysis in a New Market
The Client
• The client is a leading packaged food company, with its sights set on expanding its
market in a newer economy.
Desired Results
• The company wanted to understand the market dynamics for one of its cookie brands.
• Based on the ROI for the key business drivers, the company sought recommendations to
optimally allocate funds to various business drivers and achieve growth targets.
Market Overview
• The brand is the key pillar of the client’s Chinese-market cookie portfolio.
• The brand, priced as a premium product, achieved its highest market share in 2008 and
wanted to continue building momentum during 2009. A growth of 60% was targeted.
• Based on the previous brand studies, it was concluded that brand behavior differs from
Tier 1 cities to Tier 2 cities and again from cities to the rest of the country.
• Competition was identified in the brand’s main segment and also in other market
segments, such as cookies of other flavors.
Primary Objectives in the Analysis Process
• Understand the business needs of client teams through discussion and meeting
• Identify key business questions
• Develop marketing mix models to answer the identified business questions
• Present recommendations and findings to the business leaders
• Pinpoint high-ROI business drivers and allocate funds to achieve desired growth
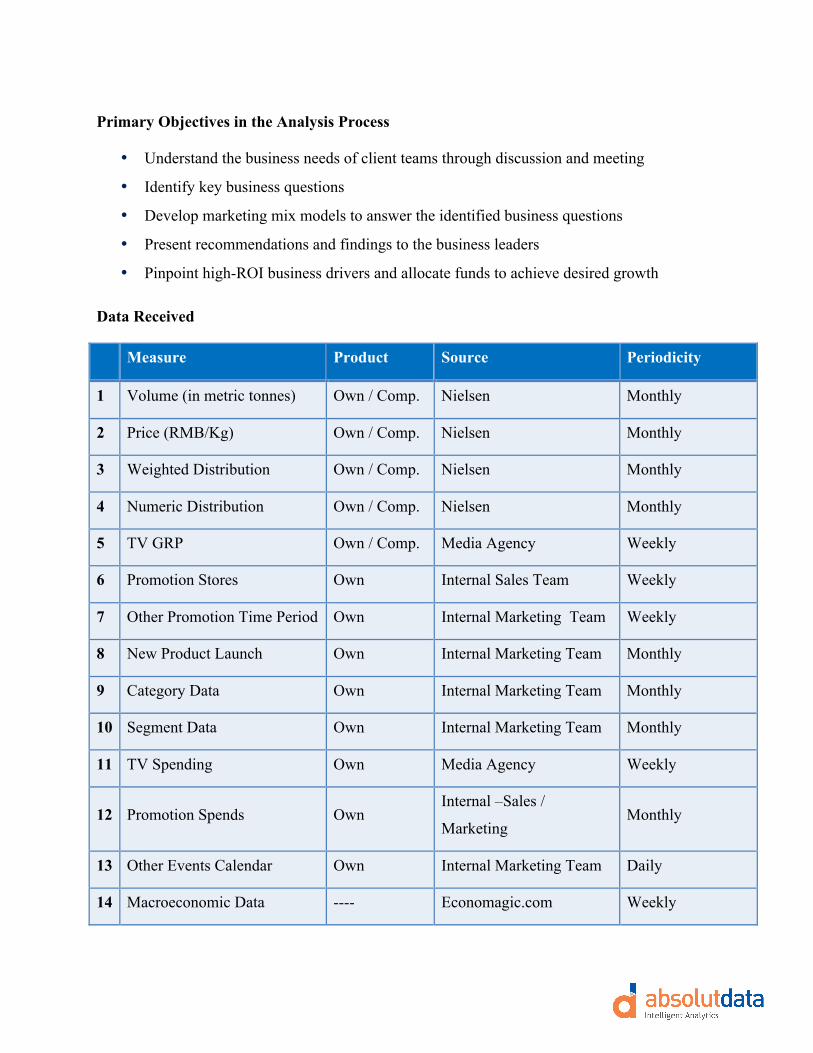
Data Received
Measure Product Source Periodicity
1 Volume (in metric tonnes) Own / Comp. Nielsen Monthly
2 Price (RMB/Kg) Own / Comp. Nielsen Monthly
3 Weighted Distribution Own / Comp. Nielsen Monthly
4 Numeric Distribution Own / Comp. Nielsen Monthly
5 TV GRP Own / Comp. Media Agency Weekly
6 Promotion Stores Own Internal Sales Team Weekly
7 Other Promotion Time Period Own Internal Marketing Team Weekly
8 New Product Launch Own Internal Marketing Team Monthly
9 Category Data Own Internal Marketing Team Monthly
10 Segment Data Own Internal Marketing Team Monthly
11 TV Spending Own Media Agency Weekly
12 Promotion Spends Own Internal –Sales /
Marketing Monthly
13 Other Events Calendar Own Internal Marketing Team Daily
14 Macroeconomic Data ---- Economagic.com Weekly
Step-by-Step Approach
• Meet with brand managers to complete an extensive questionnaire and understand market
scenarios. Develop business questions to be answered and elucidate various marketing
efforts that had gone in the brand during the modeling period.
• Building of various marketing mix models based on different regions across China, using
both OLS regression and constrained regression as described in this white paper.
• Calculation of various key metrics for key business drivers.
• Identification of multiple scenarios based on funds to be spent in 2009.
Outcome – Application and Implementation of the Results
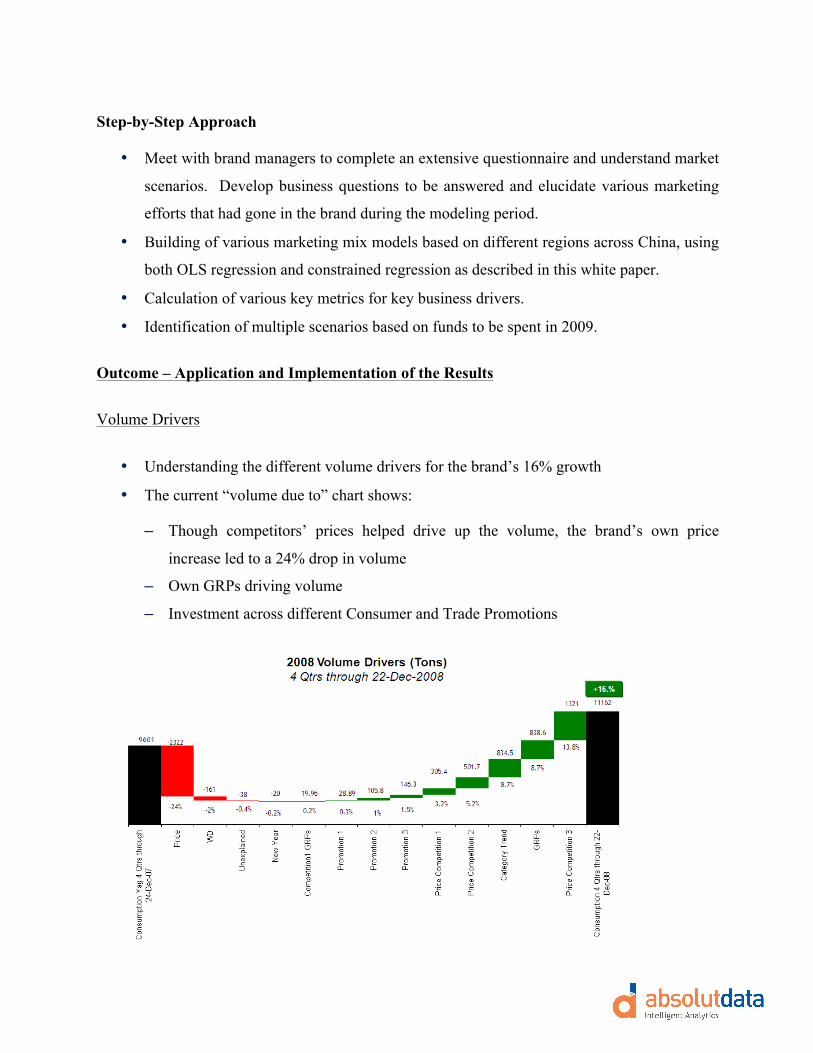
Volume Drivers
• Understanding the different volume drivers for the brand’s 16% growth
• The current “volume due to” chart shows:
– Though competitors’ prices helped drive up the volume, the brand’s own price
increase led to a 24% drop in volume
– Own GRPs driving volume
– Investment across different Consumer and Trade Promotions
Return on Investment
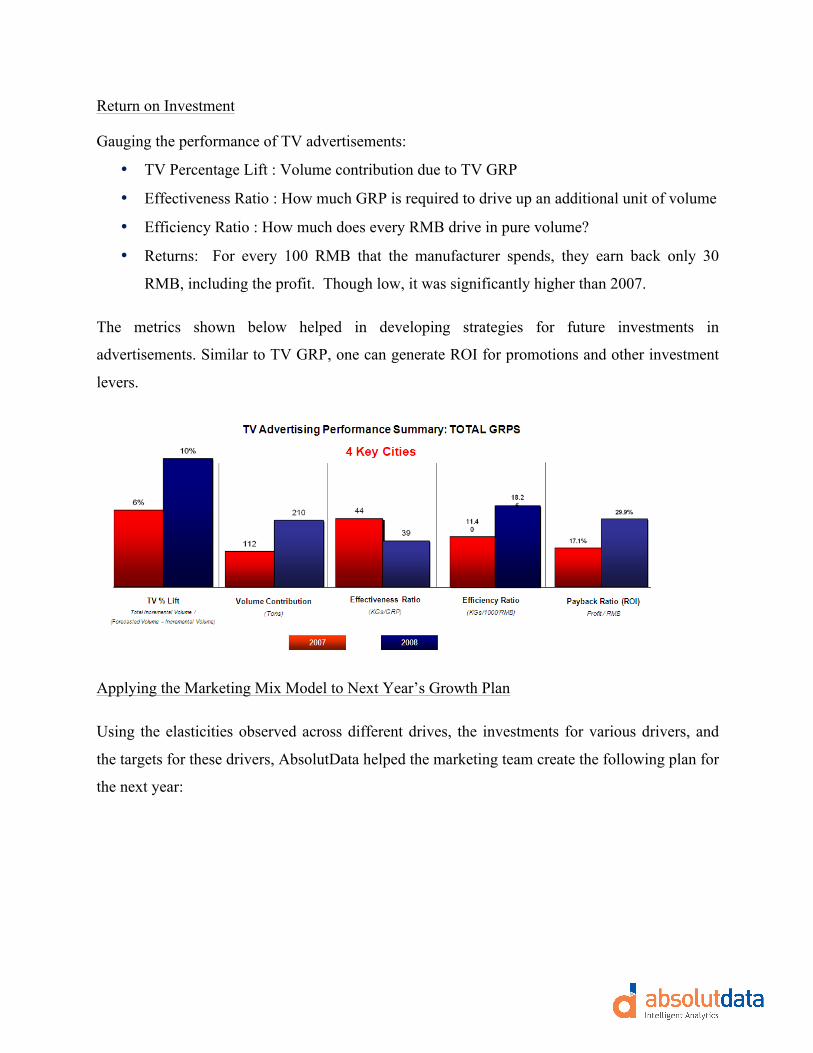
Gauging the performance of TV advertisements:
• TV Percentage Lift : Volume contribution due to TV GRP
• Effectiveness Ratio : How much GRP is required to drive up an additional unit of volume
• Efficiency Ratio : How much does every RMB drive in pure volume?
• Returns: For every 100 RMB that the manufacturer spends, they earn back only 30
RMB, including the profit. Though low, it was significantly higher than 2007.
The metrics shown below helped in developing strategies for future investments in
advertisements. Similar to TV GRP, one can generate ROI for promotions and other investment
levers.
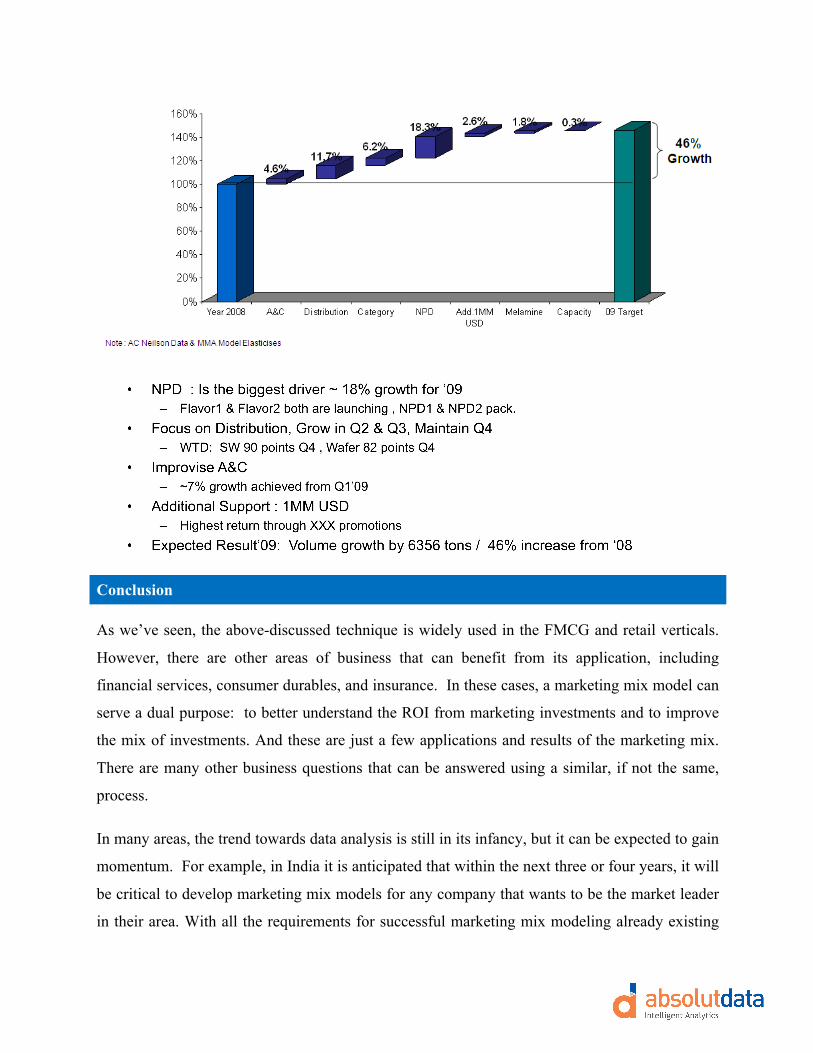
Applying the Marketing Mix Model to Next Year’s Growth Plan
Using the elasticities observed across different drives, the investments for various drivers, and
the targets for these drivers, AbsolutData helped the marketing team create the following plan for
the next year:
Conclusion
As we’ve seen, the above-discussed technique is widely used in the FMCG and retail verticals.
However, there are other areas of business that can benefit from its application, including
financial services, consumer durables, and insurance. In these cases, a marketing mix model can
serve a dual purpose: to better understand the ROI from marketing investments and to improve
the mix of investments. And these are just a few applications and results of the marketing mix.
There are many other business questions that can be answered using a similar, if not the same,
process.
In many areas, the trend towards data analysis is still in its infancy, but it can be expected to gain
momentum. For example, in India it is anticipated that within the next three or four years, it will
be critical to develop marketing mix models for any company that wants to be the market leader
in their area. With all the requirements for successful marketing mix modeling already existing

in India (data, skilled resources and technological capacity), the stage is set for Indian companies
to take advantage of this technique to build more impactful marketing strategies.
Finally, it should be underscored that marketing mix modeling and other analytical approaches
can be applied in data-deficient environments, especially when the interpretation is directional
rather than precise. In most of the countries where AbsolutData has provided similar analytical
and consulting solutions, the emphasis is on clearly understanding the direction, with analysis
and precision following after. Precise results are possible, yet these results can have little impact
if they are founded on an incorrect direction.
For additional details, please feel free to contact us at [email protected] or
San Francisco | Chicago | New York | London | Dubai | New Delhi | Bangalore | Singapore