Embed Size (px)
Citation preview

Marmara Üniversitesi
İngilizce İktisat Bölümü
Marmara University
Department of Economics
What Do We Know about Marmara University
Mehmet Ali SOYTAŞ
January, 2005
Working Paper No: 2005/1 Suggested Citation: Özerkek, Y., 2005, “The Link between Trade Balance and Growth: Panel Data Evidence for the Emerging Market Countries,” Marmara University, Department of Economics, Göztepe Campus, Istanbul, Independent Research Paper No: IRP200503 © Yasemin ÖZERKEK, 2005
The Link between Trade Balance and Growth: Panel
Data Evidence for the Emerging Market Countries
Yasemin ÖZERKEK
June 2005
Independent Research Paper No: IRP200503

1
The Link between Trade Balance and Growth: Panel Data Evidence for the Emerging Market Countries
Yasemin ÖZERKEK*
June 2005
Working Paper No: 200503
ABSTRACT An issue having a recent surge of interest in economics is the link between trade deficit and growth performance. A few studies have attempted to investigate the influence of growth performance on trade balance. However, to our knowledge, there is no such an empirical analysis exploring the issue the other way around. To this end, this paper aims to investigate the linkage between trade deficit and growth performance of emerging market countries providing empirical evidence of the estimated impact of trade balance on growth rates. The empirical results show that controlling for one period lag of GDP growth rate, a deteriorating trade balance is associated with an increasing rate of economic growth in the emerging market economies for the period 1970-2002. JEL Code: C23, F43, O57 Keywords: Trade balance, economic growth. *) Marmara University, Department of Economics.

1. Introduction
An issue having particular concern in economics is the sustainability of trade deficits.
Trade deficits are basically the result of more imports than exports for an economy in a
certain period. Underlying reasons can be very complex varying country by country and
period by period. Hong (2001) suggests that it is usually difficult to identify the causes from
the effects because many factors interact simultaneously. Views have also diverged regarding
the effects of the trade deficits on economies (Hong, 2001).
Zhang and Wan (2004) point out that the factors responsible for movements in the
trade balance fall into two groups. “Some alter the trade balance permanently and thus
determine the level of ‘structural’ trade balance. Others have their effects last only for a
limited period of time. Accordingly, part of the trade balance movements can be seen as
transitional dynamics between different levels of ‘structural trade balance’ and the rest are
cyclical fluctuations that will be corrected over time.” (p.14) They suggest that interpreting
trade balance movements within such a framework is important for macroeconomic policy
formulation since these two types of movements require policy responses of distinct nature.
A variety of studies have addressed the issues as to whether higher trade openness
helps to improve economic growth (Lee et al., 2004), income effects on the trade balance
(Kim, 1996), and the impact of trade liberalization on trade deficits and current accounts of
developing countries (Paulino and Thirlwall, 2002). While these questions have received a
great deal of attention in the literature, the link between trade deficit and growth performance
has not been dwelled on much. A few studies have attempted to investigate the influence of
growth performance on trade balance, but to our knowledge, there is no such an empirical
analysis exploring the issue the other way around. To this end, this paper aims to investigate
the linkage between trade deficit and growth performance of emerging market countries,
providing empirical evidence of the estimated impact of trade balance on growth rates.

3
The rest of the paper is organized as follows. Section 2 briefly reviews literature on
the empirical investigation of the trade balance and growth performance, i.e. the relation from
growth to trade balance. Section 3 describes the data, delineates the conceptual framework of
the model, and presents the empirical results assessing the role of trade balance on growth
performance of emerging market countries over the period 1970-2002. Some concluding
remarks are offered in Section 4.
2. Literature Review
A variety of studies has addressed the issue of economic growth, generally using
either cross-country or panel data approach. Among these, some studies have attempted to
explain the impact of economic growth on trade balance.
UNCTAD (1999) presents the results of some econometric exercises designed to
estimate the relation between economic growth and the trade balance in developing countries
and the effect thereon of trade liberalization. The model is specified by the ratio of trade
balance (TB) to GDP as the dependent variable, and the explanatory variables, growth rate
(GROWTH), the purchasing power of exports (PPX) of developing countries and the growth
rate of industrial countries (GRIND). Liberalization (LIB) is used as a dummy variable being
expected to capture the joint effects of currency appreciations and instability resulting from
capital account liberalization as well as the impact of import liberalization. The countries in
the study are Argentina, Brazil, Chile, Colombia, Mexico, Indonesia, Malaysia, Philippines,
Thailand, Venezuela, Republic of Korea, Ghana, Kenya, Morocco, Tunisia, and Uganda. The
regression equations are obtained on the basis of panel data estimation techniques using the
information for the 16 countries over 26 years i.e. from 1970 to 1995.

4
The equations are estimated alternatively as a random-effects and a fixed-effects
model. The Hausman test supports the random-effects model, implying that the intercepts are
uncorrelated with the explanatory variables. UNCTAD (1999) notes that all the structural
parameters have the expected signs and pass the significance test at the 1 per cent level. The
results specify a significant negative relation between GROWTH and TB/GDP, suggesting
that speeding up of growth in developing countries adds to trade deficits. The results imply
that better terms of trade and faster growth in industrial countries improve the trade balance,
while liberalization worsens it significantly. A striking result is the strong impact of growth in
industrial countries on trade balances (UNCTAD, 1999).
Based on the same data, incorporating the variables denoting the interaction of
liberalization with the variable for growth and terms of trade in developing countries, and for
growth in industrial countries, show that the overall impact of liberalization on the trade
balance varies with the values of GROWTH, PPX and GRIND, and may be positive or
negative depending on the particular configuration of these variables. UNCTAD (1999) notes
that growth in a liberalized developing economy is associated with greater trade deficits than
in a non-liberalized economy. On the other hand, increases in the purchasing power of
exports continue to improve the trade balance in a liberalized economy, but less than
before liberalization. The results in UNCTAD (1999) show that faster growth in industrial
countries improves the trade balance in a liberalized developing economy more than in a non-
liberalized economy.
Parikh and Stirbu (2004) analyze the impact of growth on trade balance and current
account to examine whether higher economic growth due to liberalization leads to adverse
effects on balance of trade in 42 developing countries of Asia, Africa, and Latin America over
the period 1970-1999. In their analysis, trade balance is normalized by GDP to take into

5
consideration different sizes of countries, and allowed control variables such as terms of
trade, advanced countries’ growth rates, liberalization, and debt related variables.
Parikh and Stirbu (2004) use both panel data and country-by-country data to measure
the impact of liberalization on domestic economic growth measured in PPP terms from the
data available in Heston, Summers and Aten (2001) study. Regional panel for three regions
and country by country analysis suggest that liberalization promotes growth but growth itself
has negative effect on trade balance for a large majority of countries. Trade deficits tend to
rise with economic growth in Asian economies while there is no such evidence for either
Latin American or African economies (Parikh and Stirbu, 2004).
They provide some tentative conclusion on the evidence that balance of trade and
economic growth are negatively related for a large number of developing countries and the
evidence supports the hypothesis that faster growth with liberalization could create balance of
trade problems. They do not find a great deal of evidence on current account balances being
affected by economic growth. Parikh and Stirbu (2004) point out that liberalization worsens
trade deficits while growth, current account, and investment rate are all encouraged by
liberalization. They conclude that trade balance obviously deteriorates with liberalization and
economic growth and hence countries would have difficulty in reaching potential or planned
growth in the subsequent periods after liberalization. They argue that deterioration in trade
balance could have impact on economic growth in subsequent periods (Parikh and Stirbu,
2004).
Parikh (2004) uses panel data of 42 countries (both time-series and cross-section
dimension) to estimate the effect of trade liberalization and growth on trade balance while
controlling for other factors such as income terms of trade. He estimates a dynamic model
using Generalized Method of Moments, with trade balance or current account to GDP in
percentages as the dependent variable, and liberalization, growth in real GDP, terms of trade,

6
and interactions of liberalization with purchasing and of liberalization with the growth rate in
real GDP in developing countries and developed countries. Equations The major findings of
his study are that trade liberalization promotes growth in most cases, the growth itself has a
negative impact on trade balance, and this in turn could have negative impacts on growth
through deterioration in trade balance and adverse terms of trade. Parikh (2004) argues that
trade liberalization could constrain growth through adverse impact on balance of payments.
3. Trade Balance and Growth
Contrary to the studies analyzing the influence of growth on trade balance, this
section approaches the question in a slightly novel fashion asking whether trade balances of
emerging market economies have any impact on their observed rates of economic growth. To
cast a light on the issue, this paper develops an empirical model using a dynamic panel data
approach.
3.1 Data
This study uses the latest available data from World Development Indicators (2004)
on annual GDP growth rates (%) and trade balances (% of GDP) of 20 emerging market
countries to examine the relationship between trade balance and growth for the period 1970-
2002. The list of countries in the study is provided in Appendix 1.1
Figure 1 and 2 illustrate the relationship between average growth rates and the average
trade balance (% of GDP) for two sub-periods, i.e. 1970-1989 and 1990-2002.2 In Appendix 2
1 Singapore, Czech Republic, Russia, Poland, and Taiwan are excluded because of data unavailability. 2 Trade balance (% of GDP) is calculated by subtracting imports of goods and services (% of GDP) from exports of goods and services (% of GDP). Different sizes of countries are taken into account by using trade balance to GDP (TB/GDP) ratios in percentage terms.

7
-20 -10 0
1
2
3
4
5
6
7
8
9
average TB/GDP
ave
rag
e G
GD
P
ARG
BRA
CHL
CHN
COL
EGY
HKG
HUN
IND
IDN
ISR
PRK
MYS
MEX
PER
PHL
ZAF
THA
TUR
VEN
1970-89
Figure 1 Average GDP Growth Rate v. Average TB/GDP
-10 0 10
0
1
2
3
4
5
6
7
8
9
10
average TB/GDP
ave
rag
e G
GD
P
ARGBRA
CHL
CHN
COL
EGYHKG
HUN
INDIDNISR
PRK MYS
MEXPERPHL
ZAF
THA
TUR
VEN
1990-2002
Figure 2 Average GDP Growth Rate v. Average TB/GDP

8
are reported the complete list of the data for averages. While Figure 1 does not configure a
significant relationship between average growth rates and average trade balance (% of GDP),
Figure 2 suggests a negative relationship between the two, with Israel and Egypt being
outliers particularly in the period 1970-1989. The reason underlying these far values from
most others in the set of data can be attributed to these countries’ taking advantage of foreign
aid in financing their trade deficit. Excluding Israel and Egypt from the regressions does not
change the significance of estimates, implying that even easy financing cannot change the
negative relationship between trade balance and growth.
The data from World Development Indicator (2004) reveal that while trade accounts
of many emerging market countries worsens during the 1970s, there is a notable recovery
during the 1980s. One of the most striking stylized facts emerging from the data is the relative
deterioration in trade balances in most of the emerging market countries in the 1990s
compared to the 1980s. UNCTAD (1999) argues that declines in the terms of trade, losses of
purchasing power of exports, and liberalization of trade and of capital accounts have all
contributed to the worsening of trade balances of developing countries during this period.
3.2 Empirical Methodology
For a country, having a trade deficit implies that this country is not producing as much
as it consumes. Accordingly, one might expect that faster growth in imports in relation to
exports could have serious implications for balance of trade and this in itself could constrain
economic growth in some of the developing economies. On this respect, Parikh and Stirbu
(2004) argue that it appears that trade contributes to improvement in real income and per
capita growth, however, if trade is not combined with adequate policies to balance imports
against exports, it could generate the balance of trade and balance of payments deficits
leading to deterioration in the growth of real incomes.

9
To fathom the relation between trade balance and growth performance of the emerging
market economies, a model is specified by annual GDP growth (in %), GGDP, as the
dependent variable, and the trade balance (% of GDP) (TB/GDP) and one period lag of GDP
growth (annual %)( GGDP_1) of emerging market countries as explanatory variables.
Employing a dynamic panel data approach, this analysis aims at looking for any
change in the pattern of relationship between trade balance (% of GDP) and GDP growth
rates of 18 emerging market countries over 33 years, i.e. 1970 to 2002.3 By including one
period lag of GDP growth rate as a control variable, it is intended to capture its trend effect on
GDP growth in order to see the impact of trade balance on GDP growth in a macroeconomic
framework.
The panel data sets used in this paper have several observations, collected over time
for a number of countries. They share properties with both time series data and cross-sectional
data sets. Both cross-country and time variation specifics are used in an attempt to explain the
link between trade balances on economic growth in emerging market countries. In other
words, the equation is estimated alternatively as a random-effects and fixed-effects model.
The estimators in the random effects model are the generalized least squares estimators,
combining the within and between country estimators using the corresponding residual
variance as weights (Parikh, 2004). These two techniques have been developed to handle
systematic tendency of individual specific components to be higher for some units than for
others. The random effect estimator is used if the individual specific component is assumed to
be random with respect to the explanatory variables, while the fixed effects estimator is used
if the individual specific component is not independent with respect to the explanatory
variables (Dewan and Hussein, 2001). 4
3 Israel and Egypt are excluded from the analysis for the reason given before. 4 While fixed effects regression is used to control for omitted variables that differ between cases but are constant over time, allowing using the changes in the variables over time to estimate the effects of the independent variables on the dependent variable, and is the main technique used for analysis of panel data, random effects

10
The following equation is estimated using the panel data encompassing two sub-
periods, i.e. 1970-1989 and 1990-2000, and 18 emerging market countries.
1 2 3( ) ( / ) ( _1) (1)
i 1,2,...18 and t 1,2,..33
it it it itGGDP TB GDP GGDP
3.3 Regression Results
For the whole period, empirical results indicate a significant negative relationship
between trade balance (TB/GDP) and economic growth (GGDP) (Table 1). As is seen in
Table 1, fixed effects model gives highly significant estimates for TB/GDP and GGDP for the
period 1970-2002.
When the overall 1970-2002 time period is split into the sub-periods 1970-1989, and
1990-2002, these periods yield different results. The main findings of fixed-effect model
suggest that trade deficit has a positive effect on economic growth in the period 1990-2002
while there is no such evidence in the earlier period 1970-1989. However, one lag of GDP
growth rate turns out to be insignificant in this case. On the other hand, whereas random-
effects model gives positive and insignificant estimates for TB/GDP for the earlier period, the
relationship between TB/GDP and GGDP turns into negative and significant at 5% level, with
the estimate for GGDP_1 also being strongly significant, in the period 1990-2002. This result
may suggest that these emerging market countries were more homogenous in the earlier
period.
regression is used when some omitted variables may be constant over time but vary between cases, and others may be fixed between cases but vary over time (Princeton University Library, 2004).

11
These empirical results may also imply that the significant negative relationship
between TB/GDP and GGDP over the period 1990-2002 dominates, and thereby generates a
significant negative linkage among these variables for the whole period as well.
The negative relationship between trade balance and growth exposed by empirical
results may be an unexpected result given the reasons before. However, “the trade balance, or
the related concept of the current account, can be seen in two ways: either as equal to the
difference between exports and imports of goods and services; or, as approximately equal to
the difference between national savings and national investment. While a worsening of the
trade balance is traditionally considered as a sign of competitiveness loss for the country, it
may actually signal a strong economy where national investment is growing faster than
national savings. In this sense, a worsening of the trade balance may be good new about the
economy.”5
As is well known, existence of trade deficit implies an insufficient production level in
relation to the overall consumption in a country. Having addressed the negative link between
the trade balance (% of GDP) and GDP growth, the objective of the second part of the
empirical exercise is to investigate the same link by using the 3-year moving average of trade
balance (% of GDP) values instead of annual rates to see whether the significant negative
relationship is still applicable. Empirical results show that the estimated coefficient for
TB/GDP turns out to be positive but insignificant for both random and fixed effect models,
5 http://pages.stern.nyu.edu/~nroubini/bci/InternationalTrade.html

Table 1 The Relation between Trade Balance and Growth: Summary of Regression Results
Independent variable
1970-1989 1990-2002
1970-2002
Fixed effect Random effect Fixed effect Random effect Fixed effect Random effect
TB/GDP
***.0275365 (-0.48)
***.0098136 (0.20)
*.3857345(-5.81)
**.1250705 (-2.38)
*.1381858 (-3.32)
***.0521834 (-1.45)
GGDP_1
*.2260532 (4.03)
*.4187867 (8.28)
***.034486(0.50)
*.3357892(5.55)
*.2253101 (5.34)
*.3929433 (10.17)
Constant
-
2.75654 (7.94) -
2.699329(7.14)
-
2.717504 (10.61)
R-square 0.0515 0.1643 0.1838 0.0687 0.0898 0.1658
Number of
observations
360
360 234
234
594 594
Number of
countries
18
18 18 18
18 18
* : significant at 1%; ** at 5%; *** insignificant Note: Bracketed terms under the coefficients are t-statistics and z-statistics for fixed effect and random effect models, respectively.

while between effects model provides a negative and significant estimate for avTB/GDP
(Table 2).6
Also reported in this section are country-by-country regressions. The estimated
coefficient on the trade balance is negative for 13 out of 18 countries. Five of these 13 cases
yield significant results, suggesting that GDP growth rates tend to decline as the trade balance
surplus gets larger while controlling for one period lag of GDP growth rate (Table 3). Table 4
summarizes the empirical results and demonstrates the direction of the relation between trade
balance and growth for the emerging market economies. One of the most striking stylized
facts consistent with the empirical results reported in Table 1 is that there is no country that
has a positive significant relationship between its trade balance (%of GDP) and growth rates
(Table 4).
6 Regression with between effects is the model used to control for omitted variables that change over time but are constant between cases. It allows using the variation between cases to estimate the effect of the omitted independent variables on dependent variable. Running between effects regression is equivalent to taking the mean of each variable for each case across time and running a regression on the collapsed dataset of means. As this results in loss of information, between effects are not used much in practice (Princeton University Library, 2004).

14
Table 2 The Relation between Three-year Moving Average of Trade Balance and Growth: Summary of Regression Results for the Period 1970-2002
Independent Variable
Fixed effect
Between effects
Random effect
avTB/GDP
***.0537246 (1.03)
**-.0294699 (-2.36 )
***.0620684 (1.45)
GGDP_1
*.2713646 (6.38)
*1.033234 (62.90)
***.4046758 (10.21)
Constant
-
*-.2431364 (-3.02)
*2.553335 (9.84)
R-square 0.0703 0.9963 0.1586
Number of observations
558
558
558
Number of countries
18
18
18
* : significant at 1%; ** at 5%; *** insignificant
Note: Bracketed terms under the coefficients are t-statistics and z-statistics for fixed effect and between effects, and random effect models, respectively.

1
Table 3. The Relation between Trade Balance and Growth: Results of Country Level Regressions
Country Number of observations
Constant TB/GDP GGDP_1 R-square
Argentina
33
3.509396
(3.21)
*-1.165165
(-3.93)
****-.1853333
(-1.02)
0.3630
Brazil
33
1.99872
(1.97)
****-.1113373
(-0.39 )
*.4991369
(2.99)
0.2893
Chile
33
2.549661
(2.13)
****.356764
(1.29)
**.3991637
(2.28 )
0.1587
China
33
-.0294699
(3.08)
**** -.035692
(-0.10)
**-.0294699
(2.14)
0.1530
Colombia
33
2.064221
(2.78)
**** .1215289
(1.17)
* .446339
(2.82)
0.2423
Hong Kong,China
33
4.040727
(2.35)
**** .2308961
(1.18)
*** .2151732
(1.24)
0.0854
Hungary
33
1.205482
(1.53)
**** -.0264421
(-0.14)
* .4470233
(2.78)
0.2067
India
33
4.635277
(3.35)
**** - .3664336
(-0.56)
**** -.564201
(-0.31)
0.0151
Indonesia
33
5.239114
(3.45)
**** -.271704
(-1.49)
*** .2919327
(1.71)
0.1834
Republic of Korea
33
7.084353
(4.77)
**** -.0629896
(-0.50)
**** .0220846
(0.12)
0.0101
Malaysia
33
7.827919
(4.40)
*** -.1882722
(-1.96)
**** -.0256118
(-0.13)
0.1411
Mexico
33
3.537817
(3.84)
** -.5207999
(-2.67)
*** .0794193
(0.44)
0.2733
Peru
33
1.750792
(1.63)
**** .0867694
(0.33)
*** .3758991
(1.98)
0.1245

2
Country
Number of observations
Constant TB/GDP GGDP_1 R-
square
Philippines
33
1.950738
(2.39)
**** .1305874
(0.87)
* .5684052
(3.50)
0.2914
S. Africa
33
2.987098
(2.53)
**** -.2534713
(-1.21)
**** .0821573
(0.41)
0.0898
Thailand
33
5.060623
(3.75)
** -.3931452
(-2.46)
**** .1174282
(0.55)
0.3734
Turkey
33
1.495634
(1.00)
* -.873128
(-2.87)
**** -.1056291
(-0.65)
0.2428
Venezuela
33
2.895778
(2.40)
**** -.1846143
(-1.50)
**** -.0731164
(-0.35)
0.0715
* : significant at 1%; ** at 5%; ***at 10 %; **** insignificant
Table 4 Classification of Emerging Market Countries According to the Movements
of the Trade Balance and GDP Growth Rates in the Period 1970-2002
significant insignificant
negative
positive * significant at 1%, ** significant at 5%, *** significant at 10%
*Argentina
*Turkey
**Mexico **Thailand ***Malaysia
Brazil China Hungary India Indonesia Rep. of Korea S.Africa Venezuela
Chile Colombia Hong Kong Peru Philippines
3
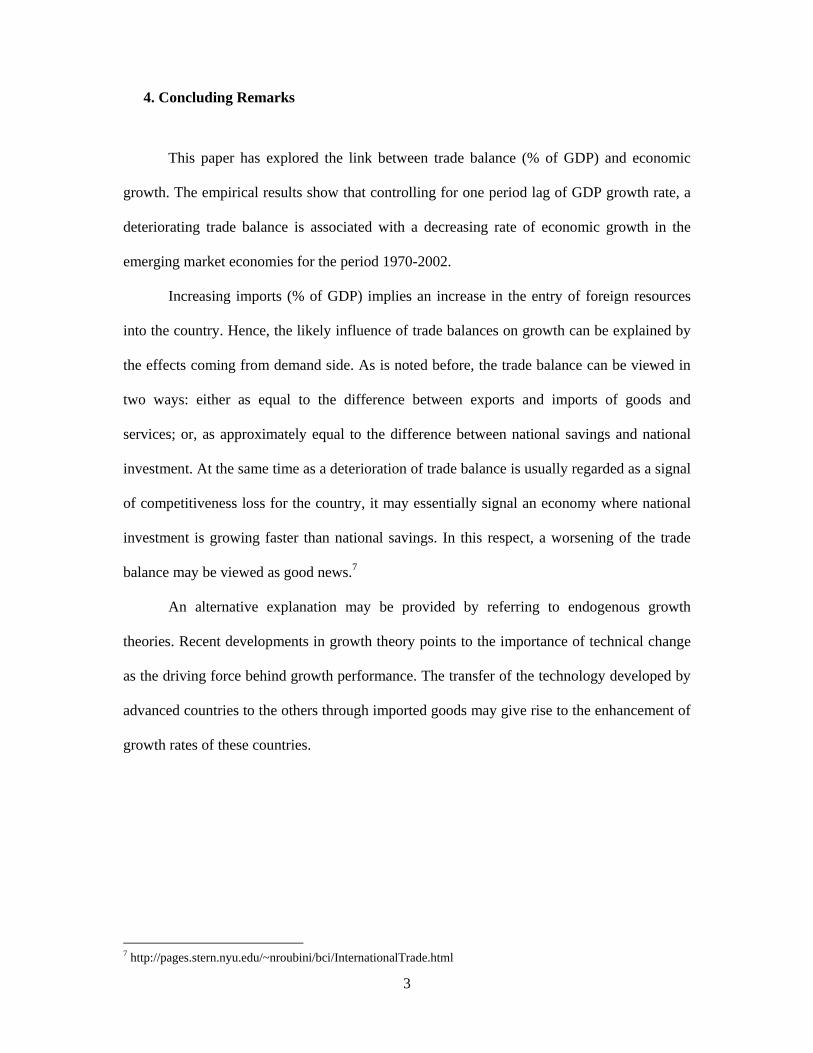
4. Concluding Remarks
This paper has explored the link between trade balance (% of GDP) and economic
growth. The empirical results show that controlling for one period lag of GDP growth rate, a
deteriorating trade balance is associated with a decreasing rate of economic growth in the
emerging market economies for the period 1970-2002.
Increasing imports (% of GDP) implies an increase in the entry of foreign resources
into the country. Hence, the likely influence of trade balances on growth can be explained by
the effects coming from demand side. As is noted before, the trade balance can be viewed in
two ways: either as equal to the difference between exports and imports of goods and
services; or, as approximately equal to the difference between national savings and national
investment. At the same time as a deterioration of trade balance is usually regarded as a signal
of competitiveness loss for the country, it may essentially signal an economy where national
investment is growing faster than national savings. In this respect, a worsening of the trade
balance may be viewed as good news.7
An alternative explanation may be provided by referring to endogenous growth
theories. Recent developments in growth theory points to the importance of technical change
as the driving force behind growth performance. The transfer of the technology developed by
advanced countries to the others through imported goods may give rise to the enhancement of
growth rates of these countries.
7 http://pages.stern.nyu.edu/~nroubini/bci/InternationalTrade.html

4
Appendix 1 List of Countries Country Code
Argentina ARG
Brazil BRA
Chile CHL
China CHN
Colombia COL
Egypt EGY
Hong Kong, China HGK
Hungary HUN
India
IND
Indonesia IDN
Israel ISR
Republic of Korea PRK
Malaysia MYS
Mexico MEX
Peru PER
Philippines PHL
S.Africa ZAF
Thailand THA
Turkey TUR
Venezuela VEN

5
Appendix 2 1970-1989 Country average GGDP average TB/GDP ARG 1.100991 1.792354 BRA 5.730511 0.14545 CHL 3.434555 -0.2708 CHN 8.595 -0.35406 COL 4.60677 0.769832 EGY 6.08447 -12.3188 HKG 8.308056 5.421115 HUN 3.196654 -1.33864 IND 4.409932 -1.46391 IDN 7.097659 3.175663 ISR 4.733529 -20.4081 PRK 8.043368 -2.76345 MYS 6.801162 3.32532 MEX 4.363508 1.062492 PER 2.140787 -1.28753 PHL 3.901379 -1.8203 ZAF 2.837165 3.159396 THA 7.402037 -3.26482 TUR 4.3885 -3.49333VEN 1.900352 3.867438 Average 4.953819 -1.30324 Source: Calculated by the author from the data of World Development Indicators (2004). 1990-2002 Country average GGDP average TB/GDP ARG 2.239967011 0.634577 BRA 1.976923077 -0.36725 CHL 5.704130923 0.662439 CHN 9.276923077 2.568874 COL 2.659043204 -1.27484 EGY 4.280998978 -6.52877 HKG 3.884747035 3.190061 HUN 0.975280719 -1.80077 IND 5.434138568 -0.88621 IDN 4.642968672 3.821843 ISR 4.592491974 -11.2283 PRK 6.234301129 1.057005 MYS 6.567687713 7.642825 MEX 3.140353292 -1.77844 PER 3.098726229 -2.91007 PHL 3.167911469 -4.88763 ZAF 1.780909945 2.894475 THA 5.004052602 0.926609 TUR 3.57765397 -3.34559 VEN 1.6580918 6.942966 Average 3.994865069 -0.23331Source: Calculated by the author from the data of World Development Indicators (2004).
6
References
Dewan, E. and S. Hussein, 2001, “Determinants of Economic Growth (Panel Data Approach,” Reserve Bank of Fiji, Working Paper No.01/04.
Hong, Pingfan, 2001, “Global Implications of the United States Trade Deficit Adjustment,” DESA Discussion Paper No. 17, February.
Kim, Y., 1996, “Income Effects on the Trade Balance,” The Review of Economics and Statistics, Vol. 78, Issue 3, pp. 464-69.
Lee, H.Y., Ricci, L.A.,and R. Rigobon, 2004, “Once Again, Is Openness Good for Growth?” NBER Working Paper No. 10749, September.
Parikh, A., 2004, “Relationship between Trade Liberalization, Growth and Balance of
Payments in Developing Countries: An Econometric Study,” HWWA Discussion Paper No. 282, Hamburg Institute of International Economics, Hamburg, July.
Parikh, A. and C. Stirbu, 2004, “Relationship between Trade Liberalisation, Economic
Growth and Trade Balance: An Econometric Investigation,” HWWA Discussion Paper No. 282, Hamburg Institute of International Economics, Hamburg, June.
Paulino, A.S. and A.P. Thirlwall, 2002, “The Impact of Trade Liberalisation on Export
Growth, Import Growth, the Balance of Trade and the Balance of Payments of Developing Countries,” University of Kent.
Princeton University Library, available from
<http://dss.princeton.edu/online_help/analysis/panel.htm> Summers, R., Heston, A. and Aten, B., 2001, Penn World Table Version 6.0, Center
forInternational Comparisons at the University of Pennsylvania (CICUP). UNCTAD, Trade and Development Report 1999, United Nations, New York and Geneva.
Zhang, Y. and G. Wan, 2004, “What Accounts for China’s Trade Balance Dynamics,” WIDER Research Paper No. 2004/55
http://pages.stern.nyu.edu/~nroubini/bci/InternationalTrade.html