Embed Size (px)
Citation preview
Submitted by: Maryland Longitudinal Data System Center
Ross Goldstein, Executive Director Angela K. Henneberger, Ph.D., Director of Research
Authored by: Brennan Register, MA1
Christian Meyer, BS1
Tracy Sweet, Ph.D.1
Angela K. Henneberger, Ph.D.2
1 University of Maryland, College Park 2 University of Maryland, Baltimore
December 2020
Maryland Public School Teachers Working Secondary Jobs: Predicting Wages and Attrition from the Teaching Profession
ii
Maryland Longitudinal Data System Center 550 West Baltimore Street
Baltimore, MD 21201 410-706-2085
[email protected] http://mldscenter.maryland.gov/
Ross Goldstein
Executive Director
James D. Fielder, Jr., Ph.D. Secretary of Higher Education, Chair, MLDS Governing Board
Larry Hogan
Governor
© Maryland Longitudinal Data System Center 2020
Suggested Citation
Register, B., Meyer, C., Sweet, T.M., & Henneberger, A.K. (2020). Maryland Public School Teachers
Working Secondary Jobs: Predicting Wages and Attrition from the Teaching Profession. Baltimore, MD:
Maryland Longitudinal Data System Center.
Acknowledgement
This report was prepared by the Research Branch of the Maryland Longitudinal Data System Center
(MLDSC). The Research Branch would like to thank the entire staff of the MLDSC for their assistance with
this report. We thank Dr. Laura Stapleton and Yating Zheng for their early work on this report.
Additionally, we thank Alison Preston for help with literature reviews on this topic.
If you have questions regarding this publication, please contact [email protected].
iii
Table of Contents
Executive Summary v
Introduction 1
Background 1
The Current Study 4
Methods 5
Data and Cohort 5
Measures 6
Analyses 7
Findings 8
Characteristics of Teachers with Out-of-School Employment 8
Percentage of Maryland Public College Graduates Working Multiple Jobs 8
Common Out-of-School Employment Industries 9
Wages Earned from Out-Of-School Employment 10
Teacher and School of Employment Characteristics 12
Examining the Relationships among Wages, Out-of-School Employment, and Attrition in Maryland
13
Predicting Out-of-School Employment from Teaching Wages 14
Predicting Teacher Attrition from Out-of-School Employment 16
Teachers Attriting to the Industry of their Out-of-School Employment 18
Summary of Findings 18
Discussion 19
Future Research 21
Policy Implications 22
Conclusion 23
References 24
Appendix 26

iv
This page intentionally left blank
v
Executive Summary
States invest significant financial resources in postsecondary institutions and student funding to
prepare students to enter in to and remain in the teaching profession. However, teacher attrition from
the teaching profession remains a threat to State investments. The current study used data from the
Maryland Longitudinal Data System (MLDS) to better understand the characteristics of teachers
prepared for the teaching profession in Maryland, their employment patterns, and the relationship
between their employment patterns and attrition from teaching.
Maryland public college graduates who graduated between the years of 2007-2008 and 2016-
2017 and were Maryland public school teachers for the academic year 2017-2018 were identified. Out-
of-school employment (OOSE) was measured using The North American Industry Classification System
(NAICS), which identifies the sector for employees working for Maryland employers subject to
Unemployment Insurance. OOSE for Maryland public school teachers was defined as earning any wages
from an industry with a NAICS Code other than 611110: Elementary and Secondary Education. Teacher
attrition was defined as teachers who did not have wages earned from teaching (having NAICS code
611110) in Academic Year 2018-2019 and had wages from another employment industry. Descriptive
statistics and logistic regression were used to examine relationships between teacher characteristics,
employment characteristics, and attrition.
Overall, nearly a quarter (23%) of all full-time public school teachers in 2017-18 who had also
graduated from a Maryland public college within the prior 10 years were also employed outside of
school. Out-of-school employment (OOSE) was more extensive in the summer months but still reached
nearly 10% in January-March. While some OOSE was in academic-related areas such as colleges or
tutoring, the most common area was the restaurant industry. Median quarterly wages earned ranged
from just over $1,000 in the January-March period to nearly twice that in the summer (July-September)
period. Males, black teachers, and untenured teachers had disproportionately high rates of OOSE, but
OOSE was evidenced across all demographic groups.
In examining the factors that were associated with OOSE, the probability of OOSE for females
remained relatively low as wages increased, whereas for males, the probability of OOSE was relatively
high for teachers with lower wages but decreased as wages increased. After controlling for
demographics and teaching wages and experience, OOSE was not significantly related to teacher
attrition, but teaching wages were significantly negatively related to teacher attrition. For teachers with
less experience, teachers earning lower wages were more likely to attrite than teachers earning higher
wages. As teaching experience increased, the difference in rates of attrition between low wage and high
wage teachers decreased. Of the teachers who attrited, 40% continued to earn wages in the same
industry as their OOSE industry in the following year.
This report offers a first step in identifying the types of teachers and the employment
characteristics associated with attrition from teaching, so that initial levers for policy, prevention, and
intervention can be identified to ultimately retain teachers in the profession and mitigate attrition.

vi
This page intentionally left blank
1
Introduction
States invest significant financial resources in postsecondary institutions and student funding to prepare students to enter in to and remain in the teaching profession. However, teacher attrition from the teaching profession remains a threat to State investments, with national estimates indicating that approximately 44% of new teachers leave the profession within five years (Ingersoll et al., 2018) and 8% of U.S. teachers leave the profession each year (Carver-Thomas & Darling-Hammond, 2017). Teacher attrition disrupts the student learning environment (Carver-Thomas & Darling-Hammond, 2019; Espel, Meyer, & Weston-Sementelli 2019; Keigher, 2010; Sorenson & Ladd, 2020) and leads to significant costs to local school systems and states (Boe et al., 2008; Carver-Thomas & Darling-Hammond, 2019).
Teacher attrition is a key policy interest in Maryland, where data indicate that 7% of teachers left the teaching profession in 2015-2016 (Janulis, 2017). Forty percent of the teachers who left in 2015-2016 were early career teachers (0-5 years of experience; Janulis, 2017), highlighting the need for additional research and policy initiatives that can help to retain early career teachers in Maryland. A key policy initiative included in the Blueprint for Maryland’s Future (House Bill 1300, 2020 Maryland General Assembly) focused on high-quality and diverse teachers and leaders, with recommendations including enhancing Maryland’s teacher training programs, updating Maryland’s teaching career ladder, and increasing Maryland teachers’ salaries. The current study used data from the Maryland Longitudinal Data System (MLDS) to better understand the characteristics of public school teachers prepared for the teaching profession in Maryland, their employment patterns, and the relationship between their employment patterns and attrition from teaching. This analysis offers a first step in identifying the types of teachers and the employment characteristics associated with attrition from teaching, so that initial levers for policy, prevention, and intervention can be identified to ultimately retain teachers in the profession and mitigate attrition.
Background
Defining Teacher Attrition
The current study focuses on novice teachers who leave the teaching profession. However, researchers have defined attrition in past research in several ways. Some researchers define teacher attrition as a dichotomous variable: teachers leave the profession (attrite), or teachers continue to teach (Borman & Dowling, 2008). Other research recognizes that there are other options for teachers, namely transfers within or between districts, which don’t neatly fall into a binary variable. Researchers who utilize more than two categories generally define teacher retention as the proportion of teachers who remain in the same position at the same school (Espel et al., 2019; Meyer, et al., 2019). These teachers can also be referred to as “stayers” in the literature (Espel et al., 2019; Meyer et al., 2019). On the other hand, teacher attrition refers to the proportion of teachers who are “leavers” or “exiters”, referring to teachers who left the school, district, or state, or took a different non-teaching position (Espel
2
et al., 2019; Imazeki, 2005; Meyer et al., 2019). Some researchers include a third group called “movers” or “transfers”, who transfer to a teaching position at a different school or district, and the associated aggregate statistic is referred to as teacher mobility (Espel et al., 2019; Imazeki, 2005; Meyer et al., 2019).
Teacher attrition can take different forms, such as resignation, retirement, transfer, or
promotion to a non-teaching position (Carver-Thomas & Darling-Hammond, 2019; Espel et al., 2019; Meyer et al., 2019). Teacher shortages occur when the supply of teachers does not meet the demand of open teaching positions, which result from excessive teacher attrition (Carver-Thomas & Darling-Hammond, 2019; Ingersoll 2001). Late career teachers are more likely to retire than novice teachers, but retirement is accounted for in terms of anticipated teacher turnover because it is expected in the natural cycle of employment (Barnes et al., 2007). The current study focused on novice teachers, who may be more likely to attrite due to burnout or a career change. High rates of attrition from novice teachers may be unexpected and increase a teacher shortage beyond what is anticipated and budgeted for by the district (Barnes et al., 2007; Carver-Thomas & Darling-Hammond, 2019).
Effects of Teacher Attrition
National estimates of teacher attrition indicate that approximately 44% of new teachers leave the profession within five years (Ingersoll et al., 2018). In terms of the total teacher population, about 8% of U.S. teachers leave the profession each year (Thomas & Hammond, 2017). Data from Maryland indicate that the overall attrition rate for the 2015-2016 academic year was 7% (Janulis, 2017). Forty percent of the teachers who left in 2015-2016 were early career teachers (0-5 years of experience), while only 12-13% were leaving late in their career or retiring with 21 or more years of experience (Janulis, 2017).
High rates of teacher attrition have far-reaching effects across schools and districts. Schools with high turnover rates are commonly in economically disadvantaged areas with low-performing schools, and continual replacement of teachers leads to a less-experienced teacher workforce (Hanushek, Rivkin, & Schiman; 2016), which in turn negatively impacts student achievement for all students, not just those with the new teacher (Atteberry, Loeb, & Wyckoff, 2017; Carver-Thomas & Darling-Hammond, 2019; Espel et al., 2019; Ronfeldt et al., 2013; Sorenson & Ladd, 2020). Schools or districts may also respond to teacher turnover by increasing class sizes or eliminating courses, which again negatively impacts all students (Carver-Thomas & Darling-Hammond, 2019). The cyclical impact on school climate is also an important consideration. High rates of turnover can lead to a lack of rapport and common support between teachers and from administrators to teachers, contributing to a negative work environment, creating yet more turnover (Carver-Thomas & Darling-Hammond, 2019; Dillon & Malick, 2020; Wynn et al., 2007).
Teacher attrition is costly to schools and districts in terms of both time and money. Schools and districts that deal with high levels of mobility and attrition spend considerable resources for teacher recruitment and professional development (Atteberry et al., 2016;
3
Borman & Dowling, 2008; Podgursky et al., 2016). It is estimated that each teacher who leaves an urban district may cost an estimated $6,800 to $33,400 depending on the district and the type of new teacher training necessary, and lost productivity experienced (Barnes, Crowe, & Schaefer, 2007; Milanowski & Odden, 2007).
Characteristics of Teachers who Leave the Teaching Profession
Research shows that early career and late career teachers make up the majority of teachers who leave the teaching profession. In a recent study conducted by Espel, Meyer, and Weston-Sementelli (2019), the findings indicated that in the states of Colorado, Missouri, and South Dakota from academic year 2015 to academic year 2016, 10% of teachers left teaching and 8% moved to a different teaching position. In the same academic years, 27% of leavers were under age 32, 23% of leavers were ages 32-39, 15% of leavers were ages 40-48, and 36% of leavers were 49 or older (Espel et al., 2019). Borman and Dowling (2008) conducted a meta-analysis of studies relating to teacher attrition and found that age is often found to be a moderator of teacher attrition, but the relationship is varied. Some studies found that older teachers were less likely to leave teaching, while others found the opposite, perhaps dependent on the age divisions used in the studies (Borman and Dowling, 2008). One particular study found the threshold to be age 51; past that point, teachers were 2.5 times more likely to leave compared to teachers 50 and younger (Borman and Dowling, 2008). One study also considered age at entry into teaching and found that teachers who began their careers after age 30 were less likely to leave compared to teachers who began at 30 or younger (Borman and Dowling, 2008).
In addition to career level, a number of teacher and school characteristics are associated with attrition. Older teachers are more likely to attrite than younger teachers (perhaps due to retiring), part-time teachers are more likely to attrite than full-time teachers, teachers who had been in the district for fewer years are more likely to attrite than those who had been in the district for a longer period of time, teachers with lower salaries were more likely to attrite than teachers with higher salaries, and special education teachers were more likely to attrite compared to other teachers (Espel et al., 2019). Elementary school teachers were less likely to leave compared to teachers in non-elementary grades (Espel et al., 2019). School characteristics also have an impact on teacher attrition, with teachers in schools identified for improvement, schools with lower average salaries, and schools with higher proportions of racial/ethnic minority students being more likely to attrite compared to teachers in schools without those characteristics (Espel et al., 2019).
Attrition has been linked to lower salaries in a number of prior research studies (Borman & Dowling, 2008; Carver-Thomas & Darling-Hammond, 2019; Espel et al., 2019; Harrell et al, 2004, Imazeki, 2005; Ondrich et al., 2008). Harrell et al. (2004) found income to be the most significant predictor of teacher attrition, while Imazeki (2005) found that an increase in salaries for beginning teachers can reduce attrition rates. Teachers with lower salaries as well as teachers working at schools with lower average salaries are more likely to leave teaching compared to those with higher salaries or at schools with higher average salaries (Espel et al.,
4
2019). However, salary is rarely the sole determinant, according to studies that examined the motivation for teachers exiting their positions. Other teacher and school characteristics such as experience, education level, subject, raising a family, and school population and discipline problems also impact the decision to leave teaching (Espel et al., 2019; Harrell et al., 2004; Ondrich et al., 2008).
The Current Study
Prior research indicates the importance of non-teaching wages in comparison to teaching wages in relation to attrition (Gilpin, 2011). A question of key policy interest is whether teachers leave the profession for higher-paying jobs in other industries. A precursor of leaving the profession may be working a secondary job while teaching, which may lure the teacher away from the teaching profession. Alternatively, other factors such as teacher characteristics, school characteristics, or teaching experience may help to better explain attrition.
The current study leverages linked administrative data from the Maryland Longitudinal Data System (MLDS), providing the ability to examine teacher employment and attrition over time for teachers who were educated in Maryland public colleges. Specifically, this study addressed the following research questions:
1. What percentage of Maryland public college graduates employed as Maryland public school teachers hold additional employment in Maryland?
2. What are the common out-of-school employment industries for Maryland public college graduates employed as Maryland public school teachers?
3. What is the average wage earned in out-of-school employment industries for Maryland public graduates employed as Maryland public school teachers?
4. What are the individual teacher characteristics and the school employment characteristics of Maryland public college graduates employed as Maryland public school teachers who also are employed out of school?
5. For teachers who have been teaching 3-5 years, to what extent does their teaching wages predict the likelihood of working out of school?
6. Are teachers who work out of school more likely to attrite from the teaching profession? 7. What percentage of teachers who attrite do so to the employment industry of their out-
of-school employment?
This report is responsive to the MLDS Center research agenda question: Are exiters of Maryland colleges successful in the workforce?
5
Methods
Data and Cohort
The data used for this report are from the Maryland Longitudinal Data System (MLDS), which contains linked longitudinal administrative data. Here, data were used from three State agencies: the Maryland State Department of Education (MSDE) provided data for public PreK-12 students, teachers, and schools; the Maryland Higher Education Commission (MHEC) provided data for Maryland 2-year and 4-year public students and colleges; and the Maryland Department of Labor provided data for Maryland employees who work for employers who are subject to Maryland’s Unemployment Insurance (UI)1.
The current study identified Maryland public college graduates2 who graduated
between the years of 2007-2008 and 2016-2017 and were Maryland public school teachers for the academic year 2017-2018. There were 438,023 graduates of Maryland 2-year and 4-year public colleges between the years 2007-2008 and 2016-2017. Of these graduates, 13,818 were
1 The MLDS workforce data include quarterly Unemployment Insurance (UI) wages from 2008 through the most recent reporting quarter for Marylanders with a Maryland educational record (see the MLDS Data Inventory Student Data section for the definition of educational record). UI filings are only available for Maryland employees who work for an in-state employer required to file UI and have a Maryland education record. Examples of employers that are not required to file UI include the federal government (including the military), certain non-profits, and self-employed and independent contractors. Individuals working in temporary employment, including federal postsecondary work-study programs, are also not subject to UI filings. These omissions mean it is incorrect to assume that individuals not counted as “employed” in this report are unemployed. The wages reported reflect the compensation paid during the quarter, not when the compensation was earned. UI wages reflect the sum of all compensation, including bonuses, commissions, tips and other forms of compensation. The UI wage data do not distinguish between part-time and full-time employment, hourly and salaried wages, regular wages and commissions, bonuses and other incentive pay. The UI wage data provided do not indicate the number of days or the number of hours a person worked in a particular fiscal quarter. UI filings for a fiscal quarter may be incomplete. Employers may have filed UI wages after the data have been transmitted to the MLDS Center or have omitted individuals from their file. Missing wage data and/or corrections to previously reported wages may be provided in subsequent fiscal quarters. While there is no time limit on correcting UI filings, most changes (additions or corrections) are completed within one fiscal quarter. This research uses UI wage data only for quarters that have had at least one fiscal quarter of subsequent UI data; therefore, data gaps resulting from late or incomplete filings have been minimized. 2 Prior to 2021, records on degrees from the MHEC DIS were only loaded if a corresponding enrollment record (EIS) was available to establish an identity. Therefore, the count in the current study may be underrepresenting the number of postsecondary graduates. From the 2008-09 to 2012-13 academic years the MHEC only collected enrollment data on students that were enrolled in a Fall term. MHEC enrollment data is supplemented with Clearinghouse data when students attended 12th grade in Maryland to identify initial enrollments in Winter, Spring or Summer terms.
6
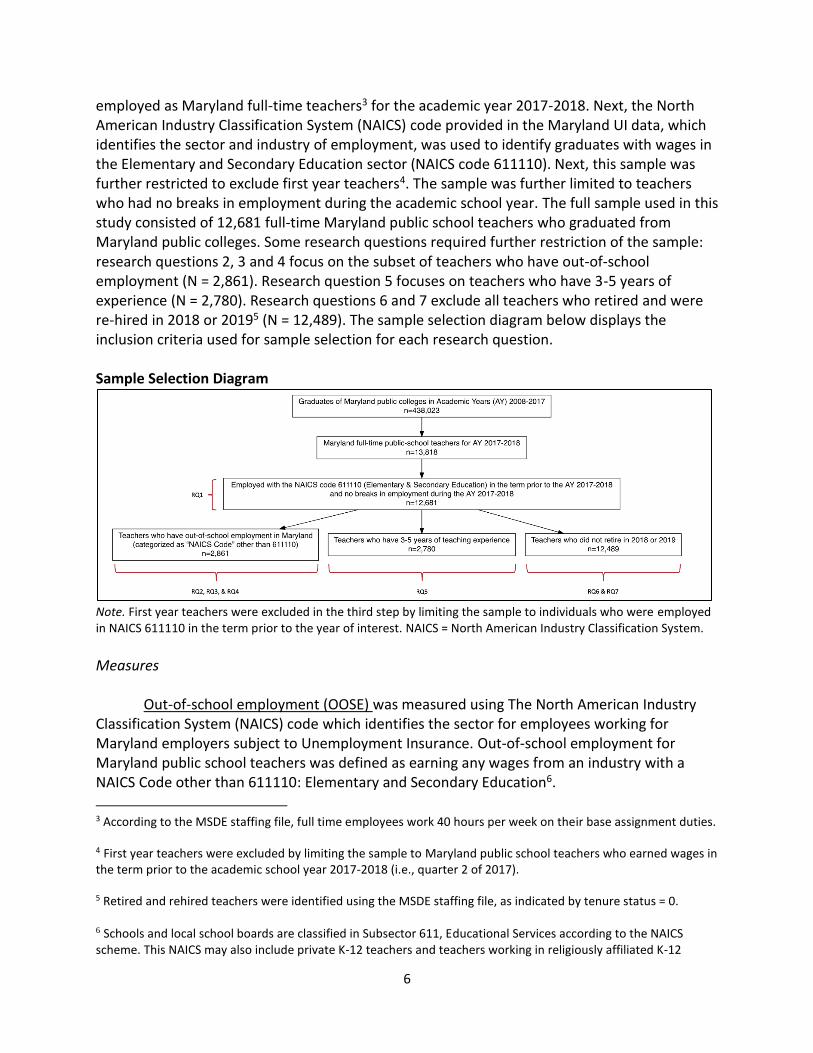
employed as Maryland full-time teachers3 for the academic year 2017-2018. Next, the North American Industry Classification System (NAICS) code provided in the Maryland UI data, which identifies the sector and industry of employment, was used to identify graduates with wages in the Elementary and Secondary Education sector (NAICS code 611110). Next, this sample was further restricted to exclude first year teachers4. The sample was further limited to teachers who had no breaks in employment during the academic school year. The full sample used in this study consisted of 12,681 full-time Maryland public school teachers who graduated from Maryland public colleges. Some research questions required further restriction of the sample: research questions 2, 3 and 4 focus on the subset of teachers who have out-of-school employment (N = 2,861). Research question 5 focuses on teachers who have 3-5 years of experience (N = 2,780). Research questions 6 and 7 exclude all teachers who retired and were re-hired in 2018 or 20195 (N = 12,489). The sample selection diagram below displays the inclusion criteria used for sample selection for each research question. Sample Selection Diagram
Note. First year teachers were excluded in the third step by limiting the sample to individuals who were employed in NAICS 611110 in the term prior to the year of interest. NAICS = North American Industry Classification System. Measures
Out-of-school employment (OOSE) was measured using The North American Industry Classification System (NAICS) code which identifies the sector for employees working for Maryland employers subject to Unemployment Insurance. Out-of-school employment for Maryland public school teachers was defined as earning any wages from an industry with a NAICS Code other than 611110: Elementary and Secondary Education6.
3 According to the MSDE staffing file, full time employees work 40 hours per week on their base assignment duties. 4 First year teachers were excluded by limiting the sample to Maryland public school teachers who earned wages in the term prior to the academic school year 2017-2018 (i.e., quarter 2 of 2017). 5 Retired and rehired teachers were identified using the MSDE staffing file, as indicated by tenure status = 0. 6 Schools and local school boards are classified in Subsector 611, Educational Services according to the NAICS scheme. This NAICS may also include private K-12 teachers and teachers working in religiously affiliated K-12
7
Industry of employment was measured using the NAICS and is provided for Maryland employers subject to Unemployment Insurance in Maryland.
Wages from out-of-school employment were measured using quarterly wages from the UI data. Quarters were defined as July-September 2017, October-December 2017, January-March 2018 and April-June 2018. Wages were summed over each quarter.
Teaching wages were measured using quarterly wages from the UI data. Quarters were
defined as July-September 2017, October-December 2017, January-March 2018 and April-June 2018. Wages were summed over each quarter.
Teacher characteristics included gender (male/female), race (white/black/other), ethnicity (not Hispanic or Latino/Hispanic or Latino), tenure status, age, and years of teaching experience. Other-race included Asian, Native Hawaiian or other Pacific Islander, American Indian or Alaska Native, two or more races, and unknown or undeclared.
School characteristics included school type, which was coded in five categories, namely elementary, high, middle, combined school, and other.
Teacher attrition was measured by identifying teachers who did not have wages earned from teaching (having NAICS code 611110) in Academic Year 2018-2019 and who also had not retired, which was defined by the tenure status variable provided by the MSDE staffing file. Analyses
Research questions 1-4 and 7 used descriptive statistics to determine the number and percentage of Maryland public college graduates who were employed as Maryland public school teachers and held additional employment in Maryland by key teacher, workforce, and school characteristics.
Research questions 5 and 6 used multiple logistic regression. Using the Bayesian Information Criteria (BIC), it was determined that a multi-level model accounting for the nesting of teachers within counties did not significantly improve the model fit, therefore a single-level multiple logistic regression was used. A logistic regression was fit to determine the association between out-of-school employment and wages from the teaching profession when controlling for teacher race, gender, and years of teaching experience. White was chosen as the reference category for the Race variable. Additionally, a Teaching Wages-by-Gender interaction term was included to test if the effect of teaching wages on out-of-school employment differed between
schools. Some public teaching jobs are classified in a NAICS for Administration of Public Programs (NAICS Sector 92). However, we included this NAICS as OOSE because not all positions classified as NAICS 92 are within public school systems, which means we may be over-counting the proportion of Maryland public school teachers who are working in OOSE. Additionally, it is possible that a teacher with a NAICS classification of 611 also had a sector classification of 92 that indicates the same public school employment. In this instance, we would be over-counting out-of-school employment.

8
male and female teachers. Teaching Wages was scaled to units of $10,000 for easier interpretation.
Findings
Characteristics of Teachers with Out-of-School Employment The findings presented in this section address the following research questions:
1. What percentage of Maryland public college graduates employed as Maryland public school teachers hold additional employment in Maryland?
2. What are the common out-of-school employment industries for Maryland public college graduates employed as Maryland public school teachers?
3. What is the average wage earned in out-of-school employment industries for Maryland public graduates employed as Maryland public school teachers?
4. What are the individual teacher characteristics and the school employment characteristics of Maryland public college graduates employed as Maryland public school teachers who also are employed out of school?
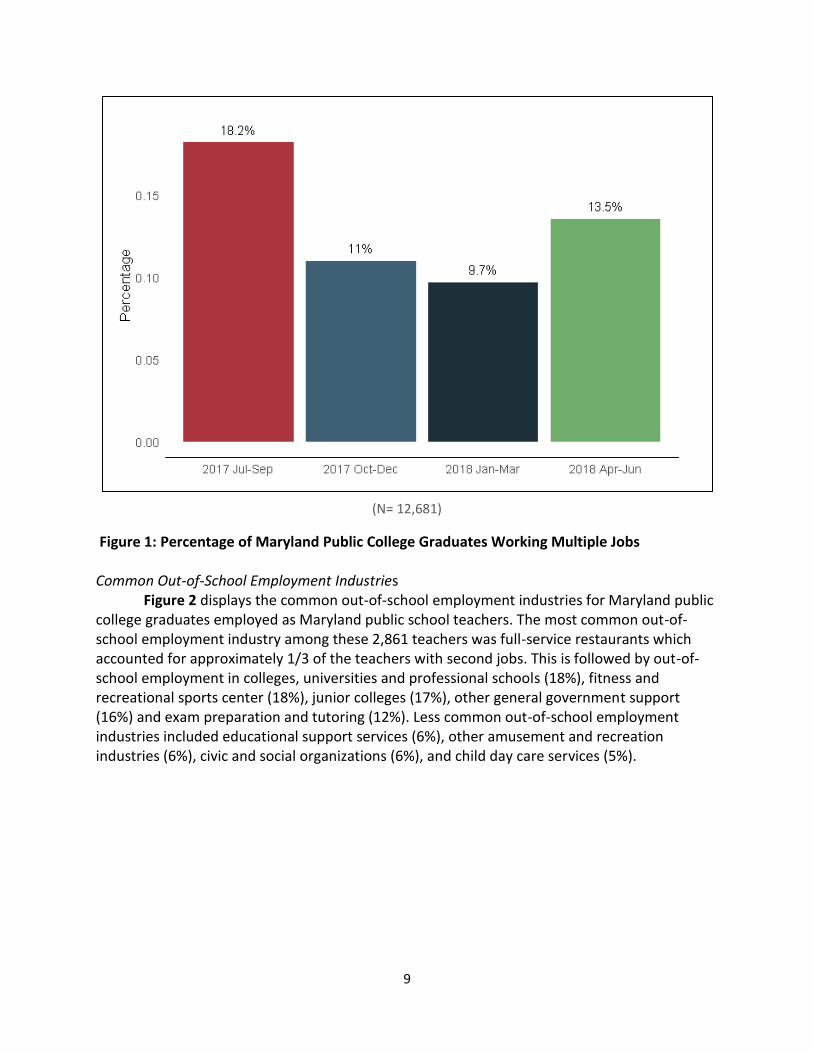
Percentage of Maryland Public College Graduates Working Multiple Jobs
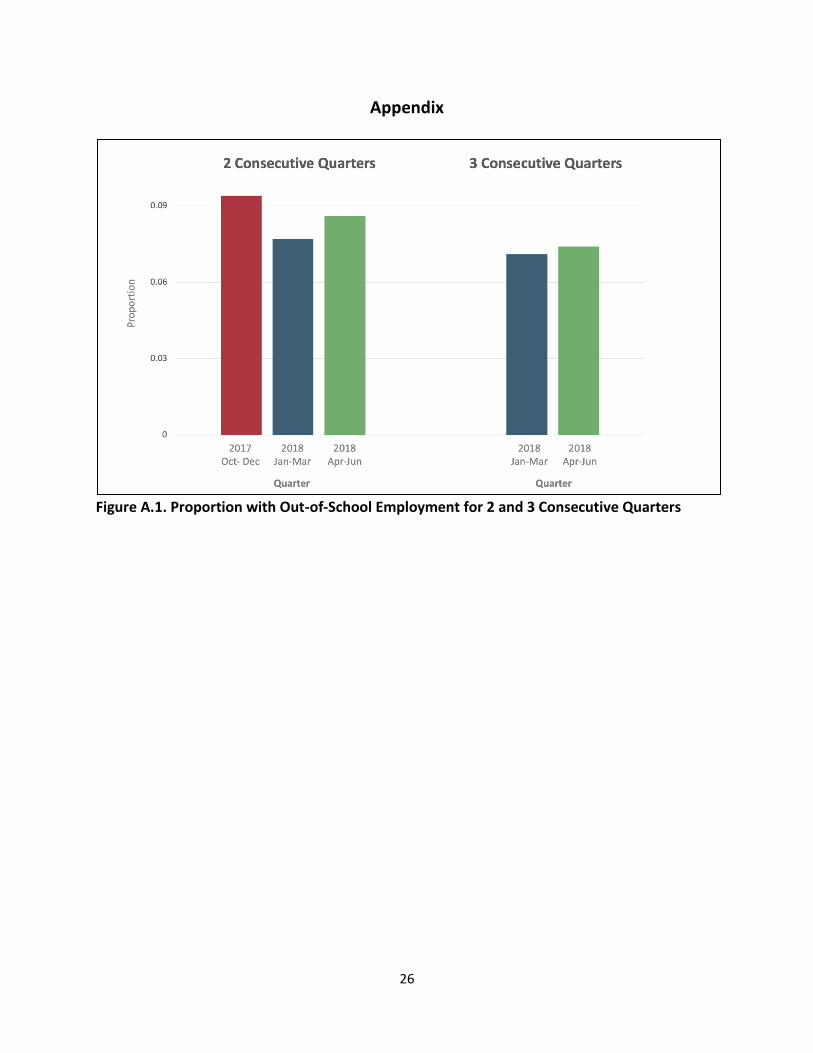
To determine the percentage of Maryland public college graduates employed as Maryland public school teachers who held additional employment in Maryland, out-of-school employment was defined as earning wages from an industry not identified as the North American Industry Classification System (NAICS) code 611110 (Elementary and Secondary Education). Of the 12,681 full-time public school teachers, nearly a quarter (22.6%) earned additional wages from out-of-school employment (n = 2,861). Eighteen percent earned additional wages from out-of-school employment between the months of July-September 20177, 11.0% earned additional wages from out-of-school employment between the months of October-December 2017, 9.7% earned additional wages from out-of-school employment between the months of January-March 2018, and 13.5% earned additional wages from out-of-school employment between the months of April-June 2018 (Figure 1). Appendix figure A.1 shows the proportion of individuals earning additional wages from out-of-school employment for at least 2 consecutive quarters (left-hand panel) and 3 consecutive quarters (right-hand panel).
7 Out-of-school employment in the July-September represents employment in the Summer following graduation from a Maryland college. It is possible that this employment was Summer employment prior to starting a teaching position that did not continue once employment in the teaching position commenced. The data in the MLDS do not allow us to examine the hours worked or the exact timeframe of employment during the July-September fiscal quarter.
9
Figure 1: Percentage of Maryland Public College Graduates Working Multiple Jobs Common Out-of-School Employment Industries
Figure 2 displays the common out-of-school employment industries for Maryland public college graduates employed as Maryland public school teachers. The most common out-of-school employment industry among these 2,861 teachers was full-service restaurants which accounted for approximately 1/3 of the teachers with second jobs. This is followed by out-of-school employment in colleges, universities and professional schools (18%), fitness and recreational sports center (18%), junior colleges (17%), other general government support (16%) and exam preparation and tutoring (12%). Less common out-of-school employment industries included educational support services (6%), other amusement and recreation industries (6%), civic and social organizations (6%), and child day care services (5%).
(N= 12,681)
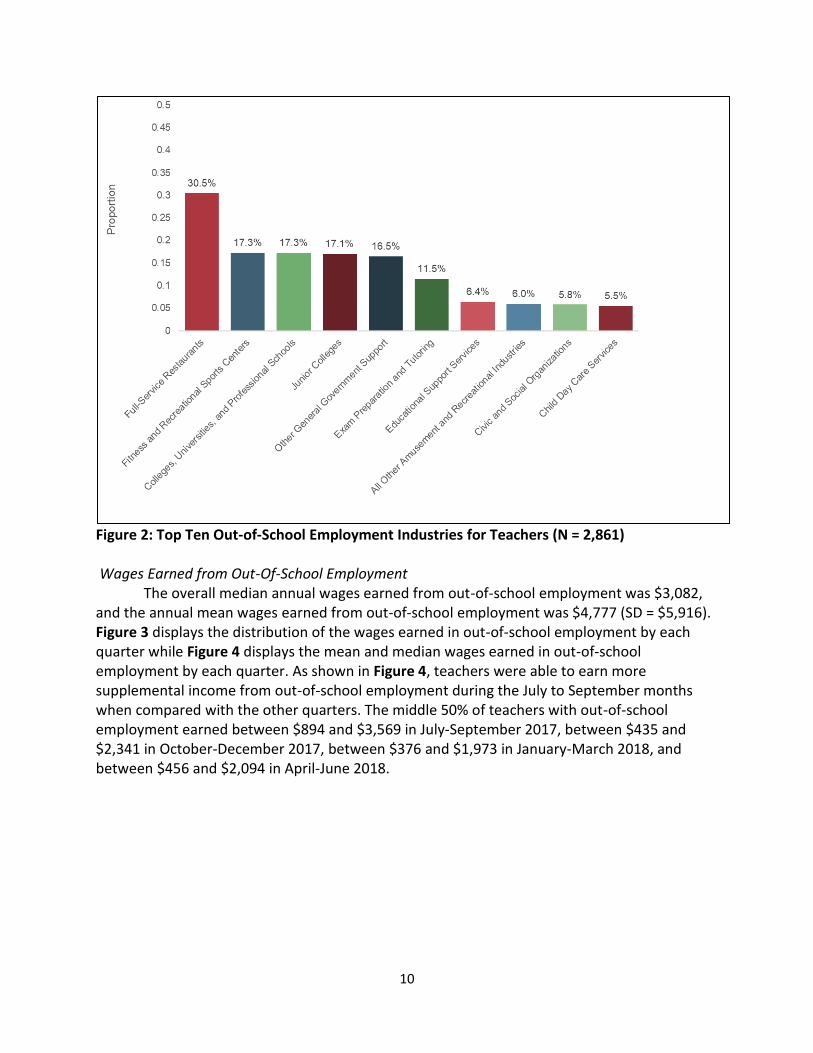
10
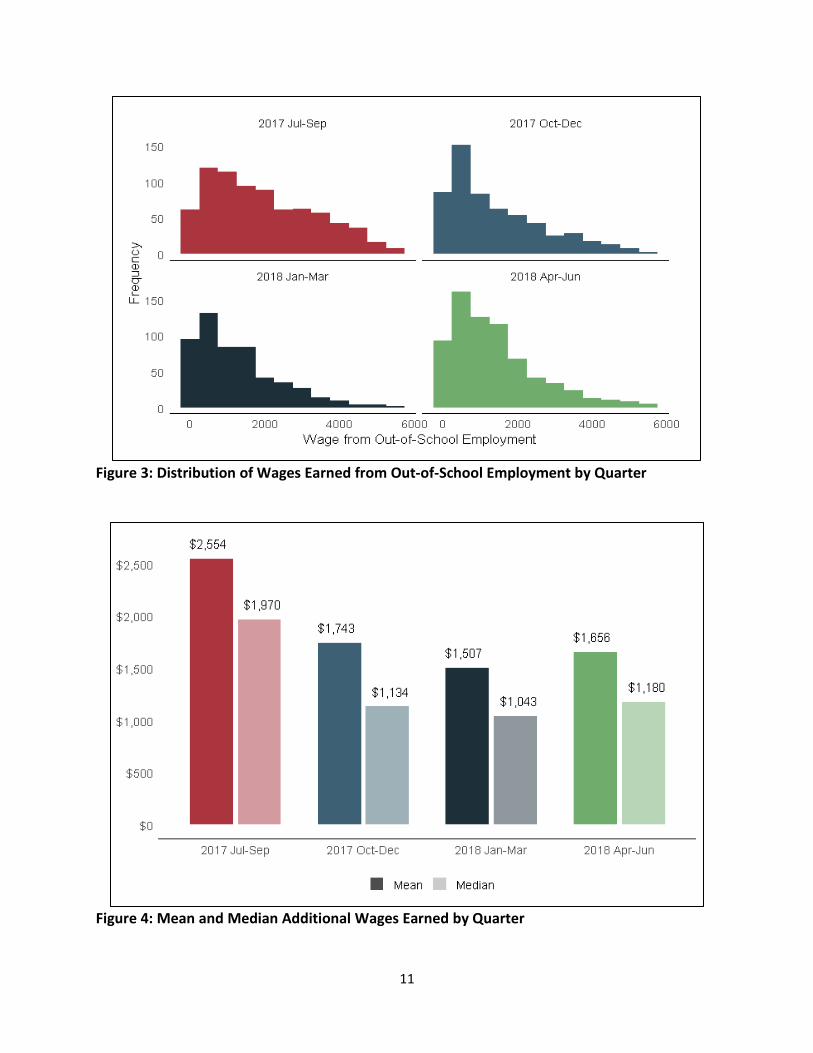
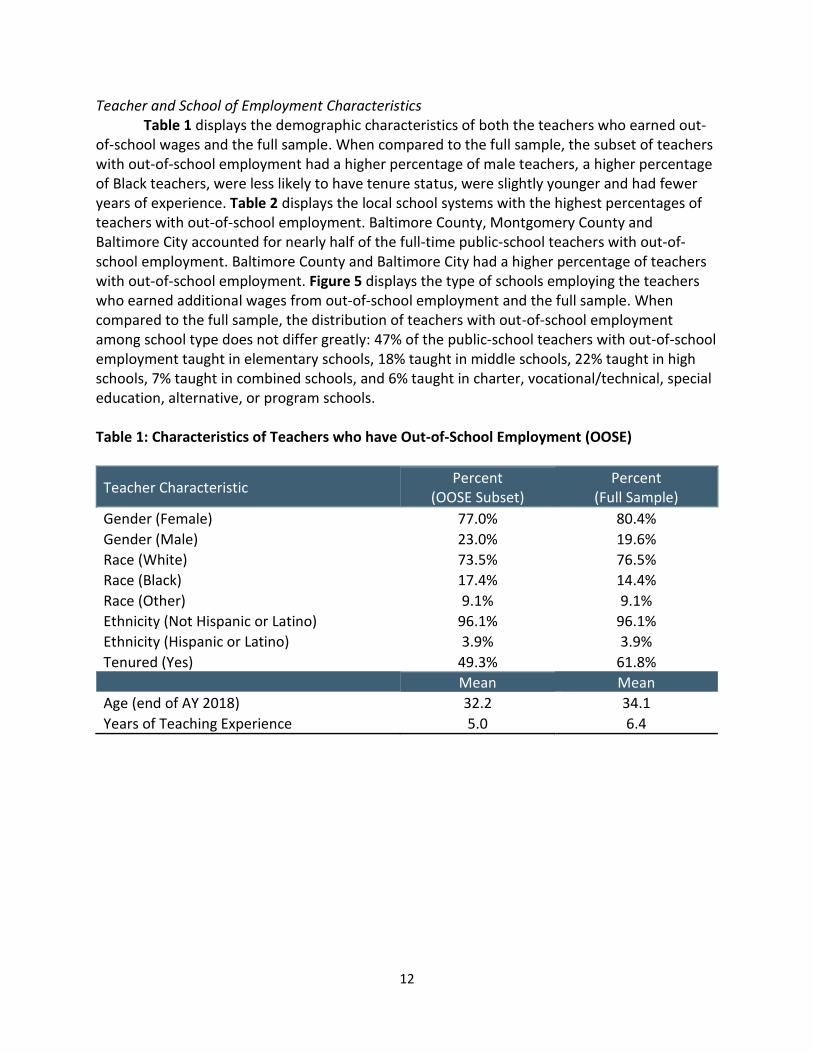
Figure 2: Top Ten Out-of-School Employment Industries for Teachers (N = 2,861) Wages Earned from Out-Of-School Employment The overall median annual wages earned from out-of-school employment was $3,082, and the annual mean wages earned from out-of-school employment was $4,777 (SD = $5,916). Figure 3 displays the distribution of the wages earned in out-of-school employment by each quarter while Figure 4 displays the mean and median wages earned in out-of-school employment by each quarter. As shown in Figure 4, teachers were able to earn more supplemental income from out-of-school employment during the July to September months when compared with the other quarters. The middle 50% of teachers with out-of-school employment earned between $894 and $3,569 in July-September 2017, between $435 and $2,341 in October-December 2017, between $376 and $1,973 in January-March 2018, and between $456 and $2,094 in April-June 2018.
11
Figure 3: Distribution of Wages Earned from Out-of-School Employment by Quarter
Figure 4: Mean and Median Additional Wages Earned by Quarter
12
Teacher and School of Employment Characteristics Table 1 displays the demographic characteristics of both the teachers who earned out-
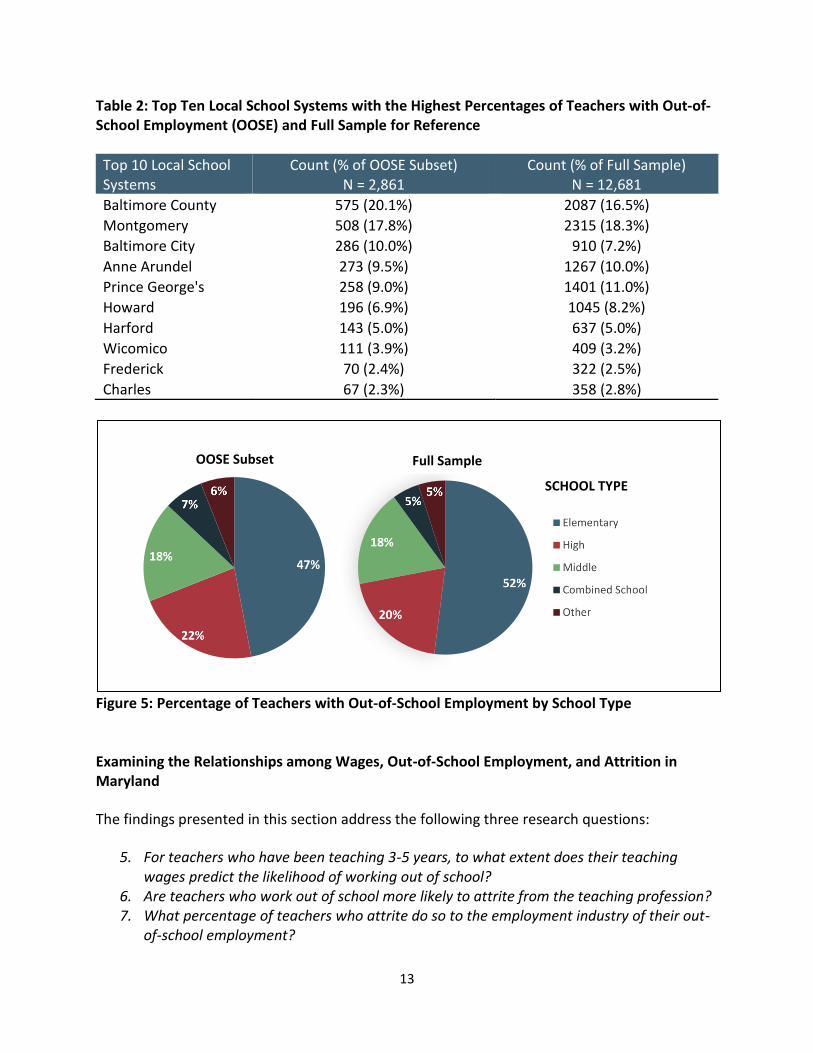
of-school wages and the full sample. When compared to the full sample, the subset of teachers with out-of-school employment had a higher percentage of male teachers, a higher percentage of Black teachers, were less likely to have tenure status, were slightly younger and had fewer years of experience. Table 2 displays the local school systems with the highest percentages of teachers with out-of-school employment. Baltimore County, Montgomery County and Baltimore City accounted for nearly half of the full-time public-school teachers with out-of-school employment. Baltimore County and Baltimore City had a higher percentage of teachers with out-of-school employment. Figure 5 displays the type of schools employing the teachers who earned additional wages from out-of-school employment and the full sample. When compared to the full sample, the distribution of teachers with out-of-school employment among school type does not differ greatly: 47% of the public-school teachers with out-of-school employment taught in elementary schools, 18% taught in middle schools, 22% taught in high schools, 7% taught in combined schools, and 6% taught in charter, vocational/technical, special education, alternative, or program schools.
Table 1: Characteristics of Teachers who have Out-of-School Employment (OOSE)
Teacher Characteristic Percent
(OOSE Subset) Percent
(Full Sample)
Gender (Female) 77.0% 80.4%
Gender (Male) 23.0% 19.6%
Race (White) 73.5% 76.5%
Race (Black) 17.4% 14.4%
Race (Other) 9.1% 9.1%
Ethnicity (Not Hispanic or Latino) 96.1% 96.1%
Ethnicity (Hispanic or Latino) 3.9% 3.9%
Tenured (Yes) 49.3% 61.8% Mean Mean
Age (end of AY 2018) 32.2 34.1
Years of Teaching Experience 5.0 6.4
13
Table 2: Top Ten Local School Systems with the Highest Percentages of Teachers with Out-of-School Employment (OOSE) and Full Sample for Reference
Top 10 Local School Systems
Count (% of OOSE Subset) N = 2,861
Count (% of Full Sample) N = 12,681
Baltimore County 575 (20.1%) 2087 (16.5%)
Montgomery 508 (17.8%) 2315 (18.3%)
Baltimore City 286 (10.0%) 910 (7.2%)
Anne Arundel 273 (9.5%) 1267 (10.0%)
Prince George's 258 (9.0%) 1401 (11.0%)
Howard 196 (6.9%) 1045 (8.2%)
Harford 143 (5.0%) 637 (5.0%)
Wicomico 111 (3.9%) 409 (3.2%)
Frederick 70 (2.4%) 322 (2.5%)
Charles 67 (2.3%) 358 (2.8%)
Figure 5: Percentage of Teachers with Out-of-School Employment by School Type Examining the Relationships among Wages, Out-of-School Employment, and Attrition in Maryland
The findings presented in this section address the following three research questions:
5. For teachers who have been teaching 3-5 years, to what extent does their teaching wages predict the likelihood of working out of school?
6. Are teachers who work out of school more likely to attrite from the teaching profession? 7. What percentage of teachers who attrite do so to the employment industry of their out-
of-school employment?
SCHOOL TYPE
OOSE Subset Full Sample
14
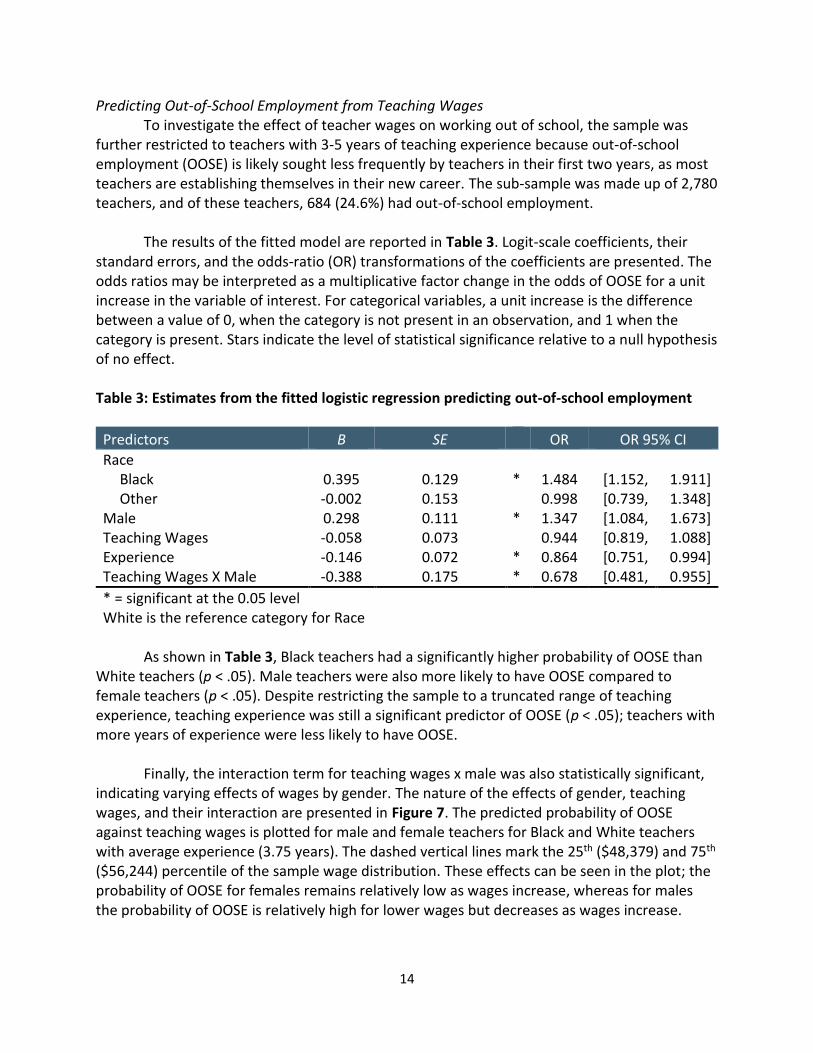
Predicting Out-of-School Employment from Teaching Wages To investigate the effect of teacher wages on working out of school, the sample was further restricted to teachers with 3-5 years of teaching experience because out-of-school employment (OOSE) is likely sought less frequently by teachers in their first two years, as most teachers are establishing themselves in their new career. The sub-sample was made up of 2,780 teachers, and of these teachers, 684 (24.6%) had out-of-school employment.
The results of the fitted model are reported in Table 3. Logit-scale coefficients, their
standard errors, and the odds-ratio (OR) transformations of the coefficients are presented. The odds ratios may be interpreted as a multiplicative factor change in the odds of OOSE for a unit increase in the variable of interest. For categorical variables, a unit increase is the difference between a value of 0, when the category is not present in an observation, and 1 when the category is present. Stars indicate the level of statistical significance relative to a null hypothesis of no effect.
Table 3: Estimates from the fitted logistic regression predicting out-of-school employment
Predictors B SE OR OR 95% CI
Race
Black 0.395 0.129 * 1.484 [1.152, 1.911]
Other -0.002 0.153
0.998 [0.739, 1.348] Male 0.298 0.111 * 1.347 [1.084, 1.673] Teaching Wages -0.058 0.073
0.944 [0.819, 1.088]
Experience -0.146 0.072 * 0.864 [0.751, 0.994] Teaching Wages X Male -0.388 0.175 * 0.678 [0.481, 0.955]
* = significant at the 0.05 level White is the reference category for Race
As shown in Table 3, Black teachers had a significantly higher probability of OOSE than White teachers (p < .05). Male teachers were also more likely to have OOSE compared to female teachers (p < .05). Despite restricting the sample to a truncated range of teaching experience, teaching experience was still a significant predictor of OOSE (p < .05); teachers with more years of experience were less likely to have OOSE.
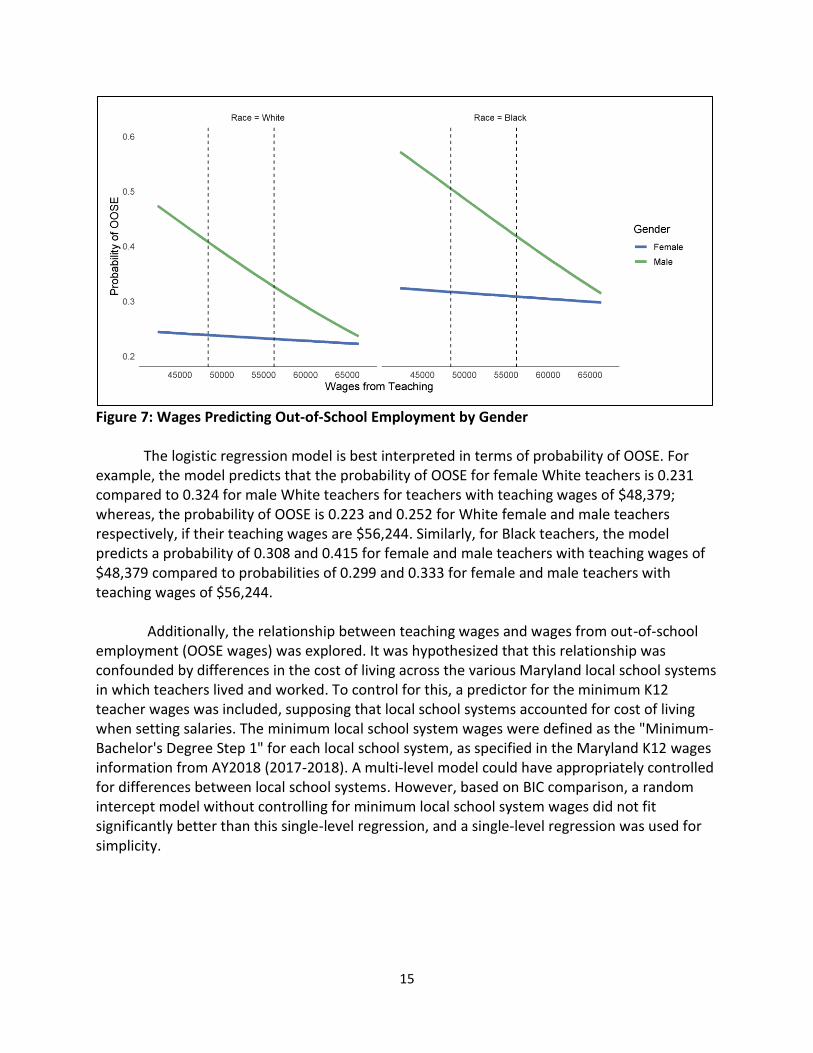
Finally, the interaction term for teaching wages x male was also statistically significant, indicating varying effects of wages by gender. The nature of the effects of gender, teaching wages, and their interaction are presented in Figure 7. The predicted probability of OOSE against teaching wages is plotted for male and female teachers for Black and White teachers with average experience (3.75 years). The dashed vertical lines mark the 25th ($48,379) and 75th ($56,244) percentile of the sample wage distribution. These effects can be seen in the plot; the probability of OOSE for females remains relatively low as wages increase, whereas for males the probability of OOSE is relatively high for lower wages but decreases as wages increase.
15
Figure 7: Wages Predicting Out-of-School Employment by Gender
The logistic regression model is best interpreted in terms of probability of OOSE. For example, the model predicts that the probability of OOSE for female White teachers is 0.231 compared to 0.324 for male White teachers for teachers with teaching wages of $48,379; whereas, the probability of OOSE is 0.223 and 0.252 for White female and male teachers respectively, if their teaching wages are $56,244. Similarly, for Black teachers, the model predicts a probability of 0.308 and 0.415 for female and male teachers with teaching wages of $48,379 compared to probabilities of 0.299 and 0.333 for female and male teachers with teaching wages of $56,244.
Additionally, the relationship between teaching wages and wages from out-of-school
employment (OOSE wages) was explored. It was hypothesized that this relationship was confounded by differences in the cost of living across the various Maryland local school systems in which teachers lived and worked. To control for this, a predictor for the minimum K12 teacher wages was included, supposing that local school systems accounted for cost of living when setting salaries. The minimum local school system wages were defined as the "Minimum-Bachelor's Degree Step 1" for each local school system, as specified in the Maryland K12 wages information from AY2018 (2017-2018). A multi-level model could have appropriately controlled for differences between local school systems. However, based on BIC comparison, a random intercept model without controlling for minimum local school system wages did not fit significantly better than this single-level regression, and a single-level regression was used for simplicity.
16
Table 4: Estimates from the fitted regression predicting log out-of-school wages
Predictors B SE 95% CI
Teaching Wages 0.075 0.022 * 0.031 0.118 Minimum Wages -0.000 0.000
-0.000 0.000
Teaching Wages X Minimum -0.000 0.000
-0.000 0.000
* = significant at the 0.05 level
A log transform was applied to OOSE wages to account for the positively skewed residual distribution, and teaching wages were scaled to units of $10,000 for ease of interpretation. The results are shown in Table 4. The coefficient for teaching wages was significantly positive (p < 0.001), indicating a small positive relationship between OOSE wages and teaching wages. For a $10,000 increase in teaching wages, OOSE wages were expected to increase by 7.5%. Neither the main effect nor interaction term for minimum wage were significant (p > 0.05). Predicting Teacher Attrition from Out-of-School Employment
Teacher attrition was defined in the sample as teachers who did not have records of wages earned from teaching (having NAICS code 611110) in Academic Year 2018-2019, had wages from other industries, and who also had not retired, which was defined by the tenure status variable. Removing the teachers who had retired, the sample consisted of 12,489 teachers. Of these teachers, 648 (5%) had attrited. A logistic regression was used to determine if out-of-school employment (OOSE) predicted attrition. A comparison of model fit again indicated that accounting for the nesting of teachers within local school systems did not meaningfully improve model fit. As such, a single-level multiple logistic regression was used.
The model building process included interaction terms for gender-by-race and wages-by
experience. The models were compared using the BIC, which indicated the best fitting model included the wages-by-experience interaction term, but not the gender-by-race interaction term. The results of the final model are reported in Table 5. The values are odds-ratio (OR) transformations of the logit-scale coefficients; stars indicate the level of statistical significance relative to a null hypothesis of no effect. For categorical variables, a unit increase is the difference between a value of 0, when the category is not present in an observation, and 1 when the category is present.
OOSE was not a significant predictor of attrition (p = 0.297)8. In addition to this result,
the model implied notable relationships between teacher covariates and attrition. Attrition significantly differed by race. Specifically, teachers who reported a race in the “Other” category (i.e. Asian, Native Hawaiian or other Pacific Islander, American Indian or Alaska Native, two or more races, and unknown or undeclared) were more likely to attrite than White teachers. The interaction between teaching wages and experience was also significantly related to teacher
8 The bivariate relation between OOSE and attrition was also not significant (B = 0.023, p > .10).
17
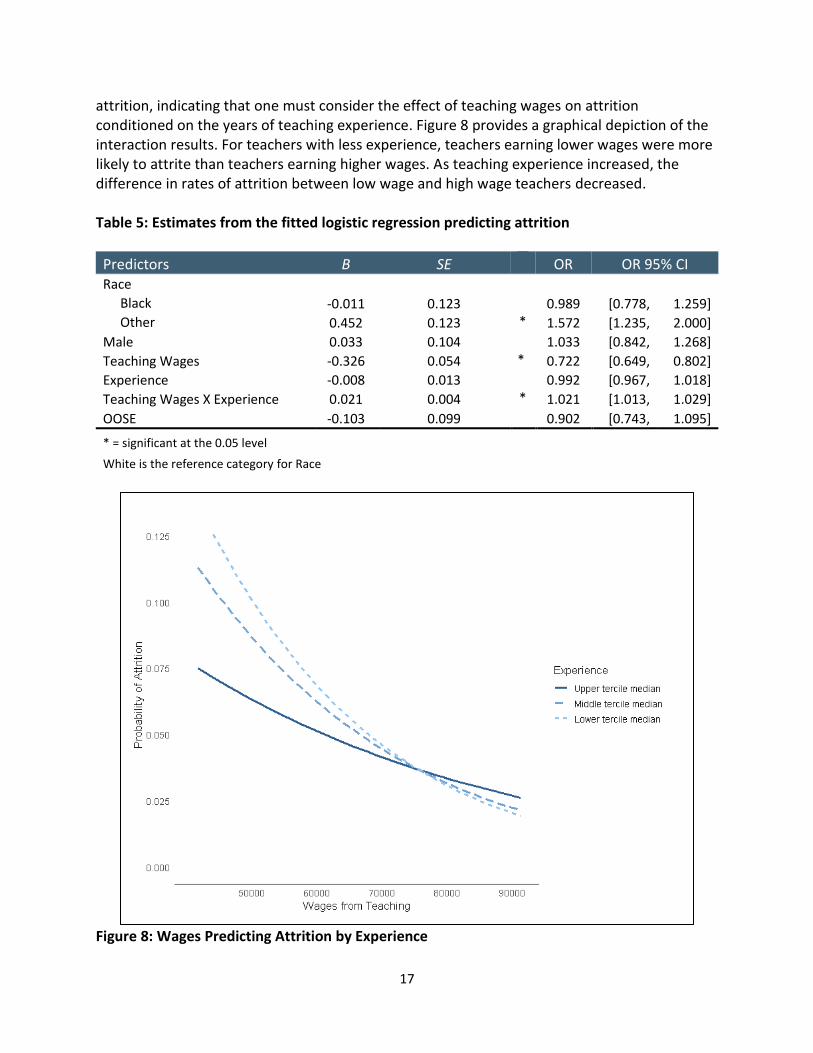
attrition, indicating that one must consider the effect of teaching wages on attrition conditioned on the years of teaching experience. Figure 8 provides a graphical depiction of the interaction results. For teachers with less experience, teachers earning lower wages were more likely to attrite than teachers earning higher wages. As teaching experience increased, the difference in rates of attrition between low wage and high wage teachers decreased.
Table 5: Estimates from the fitted logistic regression predicting attrition
Predictors B SE OR OR 95% CI Race
Black -0.011 0.123
0.989 [0.778, 1.259]
Other 0.452 0.123 * 1.572 [1.235, 2.000]
Male 0.033 0.104
1.033 [0.842, 1.268]
Teaching Wages -0.326 0.054 * 0.722 [0.649, 0.802]
Experience -0.008 0.013
0.992 [0.967, 1.018]
Teaching Wages X Experience 0.021 0.004 * 1.021 [1.013, 1.029]
OOSE -0.103 0.099 0.902 [0.743, 1.095]
* = significant at the 0.05 level
White is the reference category for Race
Figure 8: Wages Predicting Attrition by Experience
18
Teachers Attriting to the Industry of their Out-of-School Employment
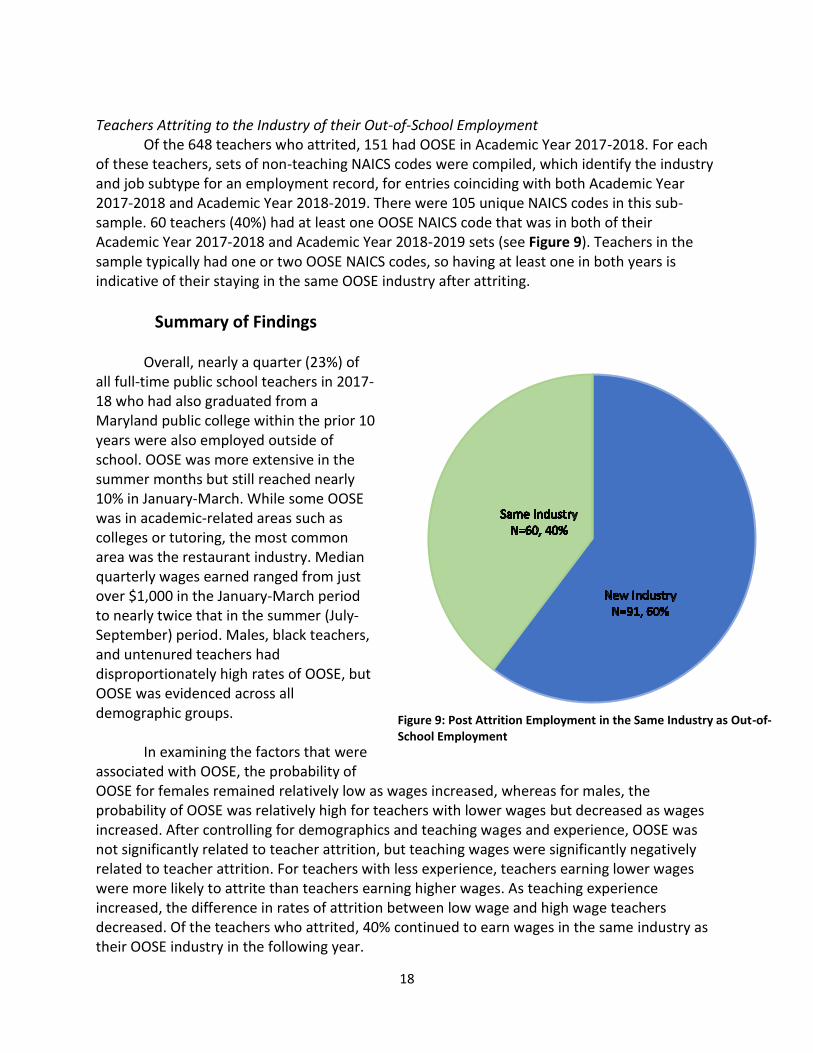
Of the 648 teachers who attrited, 151 had OOSE in Academic Year 2017-2018. For each of these teachers, sets of non-teaching NAICS codes were compiled, which identify the industry and job subtype for an employment record, for entries coinciding with both Academic Year 2017-2018 and Academic Year 2018-2019. There were 105 unique NAICS codes in this sub-sample. 60 teachers (40%) had at least one OOSE NAICS code that was in both of their Academic Year 2017-2018 and Academic Year 2018-2019 sets (see Figure 9). Teachers in the sample typically had one or two OOSE NAICS codes, so having at least one in both years is indicative of their staying in the same OOSE industry after attriting.
Summary of Findings
Overall, nearly a quarter (23%) of all full-time public school teachers in 2017-18 who had also graduated from a Maryland public college within the prior 10 years were also employed outside of school. OOSE was more extensive in the summer months but still reached nearly 10% in January-March. While some OOSE was in academic-related areas such as colleges or tutoring, the most common area was the restaurant industry. Median quarterly wages earned ranged from just over $1,000 in the January-March period to nearly twice that in the summer (July-September) period. Males, black teachers, and untenured teachers had disproportionately high rates of OOSE, but OOSE was evidenced across all demographic groups.
In examining the factors that were
associated with OOSE, the probability of OOSE for females remained relatively low as wages increased, whereas for males, the probability of OOSE was relatively high for teachers with lower wages but decreased as wages increased. After controlling for demographics and teaching wages and experience, OOSE was not significantly related to teacher attrition, but teaching wages were significantly negatively related to teacher attrition. For teachers with less experience, teachers earning lower wages were more likely to attrite than teachers earning higher wages. As teaching experience increased, the difference in rates of attrition between low wage and high wage teachers decreased. Of the teachers who attrited, 40% continued to earn wages in the same industry as their OOSE industry in the following year.
Figure 9: Post Attrition Employment in the Same Industry as Out-of-School Employment
19
Discussion
The current study used data from the Maryland Longitudinal Data System (MLDS) to better understand the characteristics of teachers prepared for the teaching profession in Maryland, their employment patterns, and the relationship between their employment patterns and attrition from teaching. Teacher attrition represents a significant threat to states’ investments, as states invest significant financial resources in postsecondary institutions and student funding to prepare students to enter in to and remain in the teaching profession. Additionally, prior research indicates that teacher attrition disrupts the student learning environment (Atteberry et al., 2017; Carver-Thomas & Darling-Hammond, 2019; Espel et al., 2019; Ronfeldt et al., 2013; Sorenson & Ladd, 2020) and leads to significant costs to local school systems and states (Boe et al., 2008; Carver-Thomas & Darling-Hammond, 2019; Hanushek et al., 2016). Identifying the types of teachers and the employment characteristics associated with attrition can provide areas for prevention and intervention to ultimately retain teachers in the profession and mitigate attrition.
This study reported several teacher employment characteristics that were related to attriting from the teaching profession. First, consistent with prior research (Borman & Dowling, 2008; Carver-Thomas & Darling-Hammond, 2019; Espel et al., 2019; Harrell et al, 2004; Imazeki, 2005; Ondrich et al., 2008), teaching wages were significantly negatively related to attrition. That is, teachers who earned lower wages were more likely to attrite from the teaching profession. Second, and somewhat surprisingly, teachers’ out-of-school employment was not significantly related to attrition after controlling for other factors, including wages earned in teaching. These findings suggest that wages themselves, and not the act of holding secondary employment, may be more important for attrition. Third, also consistent with prior research (Espel et al., 2019; Harrell et al., 2004; Ondrich et al., 2008), this study reported that teaching wages alone were not the only factor related to attrition. Teaching experience also played a significant role. In the current study, as teaching experience increased, the difference in rates of attrition between low wage and high wage teachers decreased. Put another way, among teachers with relatively lower wages, those with less experience were more likely to attrite than teachers with more experience. This relationship was not as important for teachers earning higher wages. These results suggest that teaching wages may be a more important factor in attrition for less experienced teachers, when compared to more experienced teachers. More experienced teachers may be more bonded to the teaching profession, may have stronger relationships with students, teachers, and the school community, and could have other accrued benefits, such as pension benefits, which may make salary less of a consideration for more experienced teachers, when compared to less experienced teachers.
Prior to examining attrition, this study also examined teachers’ out-of-school employment to better understand the factors that might be related to seeking additional wages. Wages earned in teaching were directly related to out-of-school employment wages. The median annual wages earned in out-of-school employment was $3,082, indicating that teachers earn a relatively small amount in out-of-school employment when compared to their
20
average starting teaching wages9 (Range = $40,500 in Caroline to $51,000 in Montgomery). In Maryland, teaching contracts are for a maximum of 190 days. The teachers in this study most often worked secondary jobs during the Summer months, the time when they are not under contract and have the flexibility to hold additional employment. However, anecdotally, we know that many teachers report engaging in teaching-related activities (e.g., developing and revising lesson plans; participating in professional development; meeting with parents) over the Summer months.
Males, black teachers, and untenured teachers had disproportionately high rates of
OOSE, but OOSE was evidenced across all demographic groups. It is particularly noteworthy that low-wage male teachers were predicted to have OOSE more often than low-wage female teachers, highlighting a gender differential in the relationship between wages earned from teaching and the probability of OOSE. Traditional sociological gender roles (see Lindsey, 2015) may help to explain this finding. For example, female teachers may have more obligations at home (e.g., childcare; household responsibilities) when compared to male teachers, which may limit female teachers’ ability to seek OOSE. Traditional gender roles placed on males may also create an environment in which male teachers are expected by their families to contribute more income to the household and therefore seek supplemental income from OOSE, as compared to the expected financial contribution of females to household income. Results such as these underscore the importance of taking teacher characteristics such as gender into account when considering policy changes aimed at addressing the correlates of out-of-school employment and teacher attrition.
Several limitations of the current study should be noted. Out-of-school employment was
defined as the presence of wages earned in industries outside of elementary and secondary education. The employment records are from the Unemployment Insurance files from the Maryland Department of Labor. There are several categories of jobs that are not included in these data, including employment for the federal government, self-employment (e.g., tutoring, which may relate to teaching), independent contracting, gig economy employment (e.g., Uber/Lyft, Instacart), as well as any private fee for hire work. It is unknown the degree to which teachers in our sample were employed in these industries/sectors. Furthermore, many teachers work secondary jobs for their local school system within the education sector (e.g., coaching, Saturday school, summer school). These jobs were not classified as OOSE in the current study. Additionally, the sample was limited to teachers who earned wages in the term prior to the Academic Year 2017-2018 and therefore, this study cannot provide inferences for first year teachers. Future research should examine the relations between first year employment in the teaching profession, wages, and attrition from teaching. For research questions 6 and 7, the definition of attrition only considers the year following the collection of the sample. The inferences are based only on teachers who left the teaching profession after the academic year 2017-2018. Attrition may result from a dissatisfaction with the profession that accumulates
9 Average starting teaching wages by local school system in Maryland were computed using teaching wages reported in the Maryland UI data for first year teachers. Teaching wages were averaged over the year.
21
over time. It is likely that some teachers who were classified as non-attriters would be considered attriters had a three-year window been considered.
An additional limitation is the potential presence of unmeasured confounders, which
may be impacting the relations between teaching wages, OOSE, and attrition. For example, prior research indicates the importance of teacher satisfaction, school climate, school leadership, positive student-teacher relationships, and burnout in relation to attrition from the teaching profession (Borman & Dowling, 2008; Johnson, Kraft, & Papay, 2012; Kraft, Marinell, & Yee, 2016; Nguyen et al., 2020). Since these variables are unmeasured in the current study, it is unclear the degree to which they may be impacting the results.
Future Research
Future research can expand upon the current study in a number of important ways. First, due to data limitations, this study was limited to teachers who graduated from Maryland public colleges. Examining relations between teacher characteristics, employment characteristics, and attrition in the larger population of Maryland public school teachers would provide population-level policy implications. Second, expanding the timeframe examined for attrition beyond 3 years would provide longer-term policy applications for preventing attrition later in teachers’ careers. Third, a critical missing component in the current examination of teacher attrition is the inclusion of certifications in industries such as Microsoft and CompTIA. For example, anecdotal evidence suggests that, after earning an industry credential, computer science teachers may be more likely to attrite to computer science industries, where salaries may be higher than in the teaching profession. Future research could help to sort the relation between teaching, earning an industry certification, and attriting from the teaching profession. Additionally, future research can more closely examine the links between secondary employment while teaching and the subsequent industry of employment and wages earned after leaving the teaching profession. For example, Hoxby and Leigh (2003) showed that female teachers were sensitive to opportunities in alternative occupations. Intersectionality in terms of race and gender may also be an important direction for future research to sort the roles of demographics on secondary employment, wages, and subsequent industry of employment after attriting from teaching. A better understanding of whether specific subgroups of teachers are leaving the profession for higher paid positions would help to better inform policy decisions related to retaining teachers in the workforce.
Finally, future research may benefit from a more in-depth analysis of teaching salaries and employment characteristics in comparison to jobs in other industries with similar educational requirements and salaries. Taylor (2008) laid out a simple model of labor supply, describing three basic factors that determine wages for both teaching and non-teaching workers: (1) differences in characteristics of the workers; (2) differences in characteristics of the jobs; and (3) locational characteristics. In Maryland, teachers work on a 190-day (38 working weeks; 9-month) contract, making the characteristics of the job somewhat unique when compared to other jobs. However, we know anecdotally that many teachers work on teaching duties throughout the Summer months. Additionally, many teachers work more than 40 hours
22
per week during the school year to prepare lesson plans, grade papers, meet with parents, attend school events, advise clubs, or coach sports or teams. A better understanding of the teaching requirements in relation to salary and a comparison to other industries with similar educational requirements and salaries would help to inform the best ways to mitigate teacher attrition.
Policy Implications
The Blueprint for Maryland’s Future (House Bill 1300, 2020 Maryland General Assembly) included key policy initiatives focused on high-quality and diverse teachers and leaders, including enhancing Maryland’s teacher training programs, updating Maryland’s teaching career ladder, and increasing Maryland teachers’ salaries. The findings of the current study indicate a significant relation between teaching wages and attrition, indicating that policy initiatives that provide raises in teaching salaries may help to prevent attrition from the profession. Further, OOSE was not significantly related to attrition, but teaching wages were significantly related to attrition, indicating that it is not the act of working a secondary job that is important, but the salary itself, for retaining teachers in the workforce. This finding further highlights the policy advantages of investing in increasing teachers’ salaries as opposed to investing in preventing secondary employment to ultimately mitigate attrition.
Additionally, the findings of this study showed that teachers most often worked secondary jobs during the Summer months and in the restaurant industry, earning only about $3,000 annually in additional wages, on average. Furthermore, less than half of teachers who attrited did so to the industry of their secondary employment. These findings indicate that early career teachers are not being “drawn away” from teaching by their industry of secondary employment, but instead are switching industries if they leave the teaching profession. This finding highlights the potential for policy initiatives that improve or accelerate bonding to the teaching profession, which may be incorporated into teacher induction and training programs. Additionally, bonding may be improved at the local level by improving school climate and/or teacher relationships within schools.
Among teachers with relatively lower wages, those with less experience were more likely to attrite than teachers with more experience, highlighting the importance of targeting policy toward teachers with less experience to ultimately retain them in the profession. Providing teachers with a variety of possible career pathways within the profession (e.g., providing career ladders) could help early teachers better understand the relation between experience and salaries in teaching. Additionally, it may be that teachers with less experience are less bonded to the teaching profession, whereas teachers with more experience see additional gains, above and beyond salary gains. For example, teachers with more experience may be deriving stronger connections with students or stronger school community benefits. These findings highlight the potential importance of policies that would accelerate the bonding, connection, and school community processes early in teacher’s careers (e.g., incorporated in early career professional development).
23
Conclusion
States invest significant financial resources in postsecondary institutions and student funding to prepare students to enter in to and remain in the teaching profession. However, teacher attrition from the teaching profession remains a threat to State investments. Recent Maryland policy initiatives have focused on enhancing Maryland’s teacher training programs, updating Maryland’s teaching career ladder, and increasing Maryland teachers’ salaries as a way to support and retain teachers in the profession. This report offered a first look into the teacher characteristics and employment characteristics that may relate to teacher attrition in Maryland public schools. Notably, teachers’ out-of-school employment was not significantly related to attrition after controlling for other factors, including wages earned in teaching. However, teaching wages were significantly negatively related to attrition, and teaching experience also played a significant role. Among teachers with relatively lower wages, those with less experience were more likely to attrite than teachers with more experience, suggesting that teaching wages may be a more important factor in attrition for less experienced teachers, when compared to more experienced teachers. Additionally, wages earned in teaching were directly related to wages earned in OOSE. It is particularly noteworthy that low-wage male teachers were predicted to have OOSE more often than low-wage female teachers, highlighting a gender differential in the relationship between wages earned from teaching and the probability of OOSE. The findings from this study highlight the important role of wages and teaching experience in retaining teachers in the profession. Additionally, this study highlights the specific role of gender in developing and implementing policy for teachers.
24
References
Atteberry, A., Loeb, S., & Wyckoff, J. (2016). High rates of within-school teacher reassignments and implications for student achievement. (Working Paper 151). National Center for Analysis of Longitudinal Data in Education Research.
Atteberry, A., Loeb, S., & Wyckoff, J. (2017). Teacher churning: Reassignment rates and implications for student achievement. Educational Evaluation and Policy Analysis, 39(1), 3-30.
Barnes, G., Crowe, E., & Schaefer, B. (2007). The cost of teacher turnover in five school districts: A pilot study. Washington, DC: National Commission on Teaching and America’s Future.
Boe, E., Cook, L. H., & Sunderland, R. J. (2008). Teacher turnover: Examining exit attrition, teaching area transfer, and school migration. Exceptional Child, 75(1), 7-38.
Borman, G. D., & Dowling, N. M. (2008). Teacher attrition and retention: A meta-analytic and narrative review of the research. Review of Educational Research, 78(3), 367-409.
Carver-Thomas, D. & Darling-Hammond, L. (2017). Teacher turnover: Why it matters and what we can do about it. Palo Alto, CA: Learning Policy Institute.
Carver-Thomas, D., & Darling-Hammond, L. (2019). The trouble with teacher turnover: How teacher attrition affects students and schools. Education Policy Analysis Archives, 27(36).
Dillon, E., & Malik, S. (2020). Teacher turnover and access to effective teachers in the School District of Philadelphia. (REL 2020-037). Washington, DC: US Department of Education, Institute of Education Sciences, National Center for Education Evaluation and Regional Assistance, Regional Education Laboratory. Retrieved from http://ies.ed.gov/ncee/edlabs.
Espel, E. V., Meyer, S. J., Weston-Sementelli, J. L. (2019). Factors related to teacher mobility and attrition in Colorado, Missouri, and South Dakota. (REL 2019-008). Washington, DC: US Department of Education, Institute of Education Sciences, National Center for Education Evaluation and Regional Assistance, Regional Education Laboratory. Retrieved from http://ies.ed.gov/ncee/edlabs.
Gilpin, G. A. (2011). Reevaluating the effect of non-teaching wages on teacher attrition. Economics of Education Review, 30(4), 598-616.
Janulis, E. (2017). Is there a teacher shortage in Maryland? Examining trends in supply and demand. (Policy Brief). College Park, MD: Maryland Equity Project, College of Education, University of Maryland.
Hanushek, E. A., Rivkin, S. G., & Schiman, J. C. (2016). Dynamic effects of teacher turnover on the quality of instruction. Economics of Education Review, 55, 132-148
Harrell, P., Leavell, A., van Tassel, F., & McKee, K. (2004). No teacher left behind: Results of a five-year study of teacher attrition. Action in Teacher Education, 26(2), 47-59. https://doi.org/10.1080/01626620.2004.10463323
Hoxby, C. M., & Leigh, A. (2004). Pulled away or pushed out? Explaining the decline of teacher aptitude in the United States. American Economic Review, 94(2), 236-240.
Imazeki, Jennifer, 2005. "Teacher salaries and teacher attrition," Economics of Education Review, Elsevier, vol. 24(4), pages 431-449, August.
Ingersoll, R. (2001). Teacher turnover and teacher shortages: An organizational analysis. American Educational Research Journal, 38(3), 499-534.
25
Ingersoll, Richard M.; Merrill, Elizabeth; Stuckey, Daniel; and Collins, Gregory. (2018). Seven Trends: The Transformation of the Teaching Force – Updated October 2018. CPRE Research Reports.
Johnson, S. M., Kraft, M. A., & Papay, J. P. (2012). How context matters in high-need schools: The effects of teachers’ working conditions on their professional satisfaction and their students’ achievement. Teachers College Record, 114(10), 1-39.
Keigher, A. (2010). Teacher attrition and mobility: Results from the 2008-09 Teacher Follow Up Survey. Washington, DC: National Center for Education Statistics.
Kraft, M. A., Marinell, W. H., & Shen-Wei Yee, D. (2016). School organizational contexts, teacher turnover, and student achievement: Evidence from panel data. American Educational Research Journal, 53(5), 1411-1449
Lindsey, L. L. (2015). Gender roles: A sociological perspective. Routledge. Meyer, S. J., Espel, E. V., Weston-Sementelli, J. L., & Serdiouk, M. (2019). Teacher Retention,
mobility, and attrition in Colorado, Missouri, Nebraska, and South Dakota. (REL 2019-001). Washington, DC: US Department of Education, Institute of Education Sciences, National Center for Education Evaluation and Regional Assistance, Regional Education Laboratory. Retrieved from http://ies.ed.gov/ncee/edlabs.
Milanowski, A. T., & Odden, A. R. (2008). A new approach to the cost of teacher turnover. (SFRP Working Paper 13). Seattle, WA: Center on reinventing Public Education.
Nguyen, T. D., Pham, L. D., Crouch, M., & Springer, M. G. (2020). The correlates of teacher turnover: An updated and expanded meta-analysis of the literature. Educational Research Review, 31, 100355.
Ondrich, J., Pas, E., & Yinger, J. (2008). The determinants of teacher attrition in upstate New York. Public Finance Review, 36(1), 112-144.
Podgursky, M., Ehlert, M., Lindsay, J., & Wan, Y. (2016). An examination of the movement of educators within and across three Midwest Region states. (REL 2017-185). Washington, DC: US Department of Education, Institute of Education Sciences, National Center for Education Evaluation and Regional Assistance, Regional Education Laboratory. Retrieved from http://ies.ed.gov/ncee/edlabs.
Ronfeldt, M., Loeb, S., & Wyckoff, J. (2013). How teacher turnover harms student achievement. American Educational Research Journal, 50(1), 4-36.
Sorenson, L. C., & Ladd, H. F. (2020). The hidden costs of teacher turnover. AERA Open, 6(1), 1-24.
Taylor, L. L. (2008). Comparing teacher salaries: Insights from the US census. Economics of Education Review, 27(1), 48-57.
Wynn, S. R., Carboni, L. W., & Patall, E. A. (2007). Beginning teachers’ perceptions of mentoring, climate, and leadership: Promoting retention through a learning communities perspective. Leadership and Policy in Schools, 6(3) 209-229.
26
Appendix
Figure A.1. Proportion with Out-of-School Employment for 2 and 3 Consecutive Quarters