Embed Size (px)
Citation preview
Marylebone has matured as a prime central London residential address in the last decade.
It follows major investment from the Howard de Walden and Portman Estates, which jointly control nearly 200 acres of Marylebone and the surrounding areas.
Higher quality shops, hotels, restaurants, offices and public spaces mean Marylebone is no longer an overlooked prime residential neighbourhood and has joined the ranks of Mayfair to the south and St John’s Wood to the north.
However, this regeneration process means price growth patterns have been out of step with longer-established prime central London neighbourhoods in recent years.
Marylebone was still an evolving market as the financial crisis hit and didn’t see the same magnitude of price growth as other areas, a trend driven by London’s safe-haven status. While annual growth exceeded 20% in markets like Knightsbridge and Kensington in 2010, it peaked at 12.6% in Marylebone.
Stronger performance came two years later as Marylebone began to provide comparatively better value. Annual growth of 16.4% in June 2012 was the highest in prime central London.
“There has been a great regeneration story in Marylebone in recent years, including the attention received by the Chiltern Firehouse,” said Christian Lock-Necrews, Knight Frank’s Marylebone office head.
A high-quality new-build residential pipeline also emerged, which cemented the area’s reputation and tapped into a trend for
Marylebone’s evolution continues but realistic pricing remains fundamental, as Christian Lock-Necrews tells Tom Bill
MARYLEBONE MARKET INSIGHT 2016
Source: Knight Frank Research
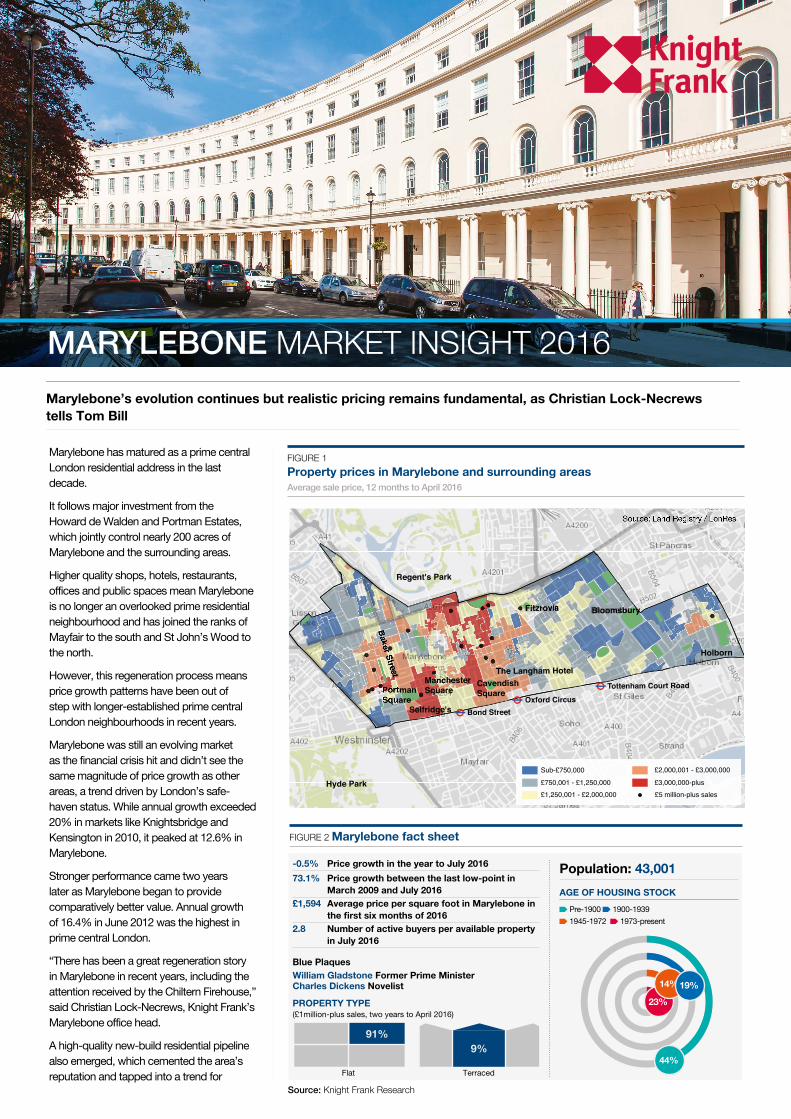
Sub-£750,000
£750,001 - £1,250,000£1,250,001 - £2,000,000
£2,000,001 - £3,000,000
£3,000,000-plus£5 million-plus sales
Tottenham Court Road
Oxford CircusBond Street
Hyde Park
Regent's Park
Fitzrovia
The Langham HotelCavendish Square
Selfridge's
Manchester Square
Baker Street
Portman Square
Bloomsbury
Holborn
FIGURE 1 Property prices in Marylebone and surrounding areas Average sale price, 12 months to April 2016
-0.5% Price growth in the year to July 2016
73.1% Price growth between the last low-point in March 2009 and July 2016£1,594 Average price per square foot in Marylebone in the first six months of 20162.8 Number of active buyers per available property in July 2016
Blue PlaquesWilliam Gladstone Former Prime Minister Charles Dickens Novelist
PROPERTY TYPE
(£1million-plus sales, two years to April 2016)
Flat Terraced
Population: 43,001AGE OF HOUSING STOCK
Pre-1900 1900-1939 1945-1972 1973-present
FIGURE 2 Marylebone fact sheet
44%
23%
14%19%
91%9%
Source: Land Registry / LonRes
Strength of price growth
Higher
Lower
Tottenham Court Road
Oxford CircusBond Street
Regent's Park
Fitzrovia
The Langham HotelCavendish Square
Selfridge's
Manchester Square
Baker Street
Portman Square
Bloomsbury
W1HW1U W1G
W1WW1T
W1HW1U W1G
W1W
W1BW1B
W1T Holborn
LONDON RESIDENTIAL
Christian Lock-Necrews Marylebone office head+44 20 3435 [email protected]
Important Notice © Knight Frank LLP 2016 - This report is published for general information only and not to be relied upon in any way. Although high standards have been used in the preparation of the information, analysis, views and projections presented in this report, no responsibility or liability whatsoever can be accepted by Knight Frank LLP for any loss or damage resultant from any use of, reliance on or reference to the contents of this document. As a general report, this material does not necessarily represent the view of Knight Frank LLP in relation to particular properties or projects. Reproduction of this report in whole or in part is not allowed without prior written approval of Knight Frank LLP to the form and content within which it appears. Knight Frank LLP is a limited liability partnership registered in England with registered number OC305934. Our registered office is 55 Baker Street, London, W1U 8AN, where you may look at a list of members’ names.
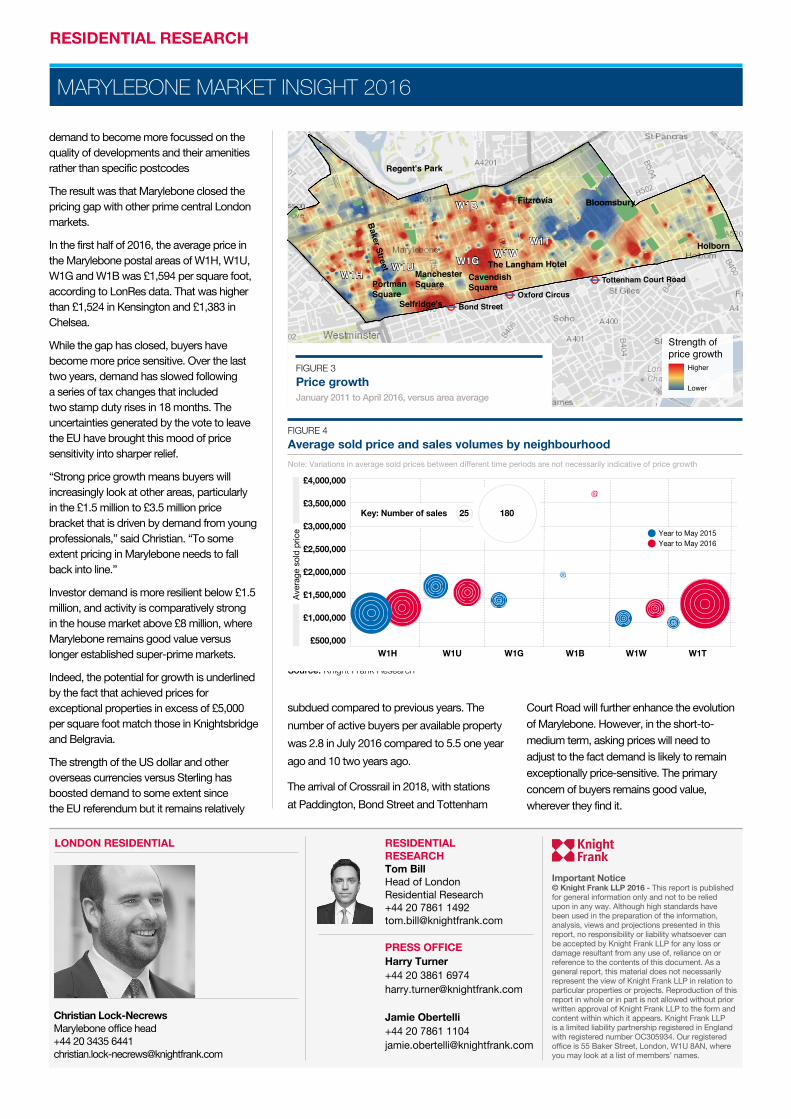
FIGURE 4 Average sold price and sales volumes by neighbourhood
MARYLEBONE MARKET INSIGHT 2016
RESIDENTIAL RESEARCH
demand to become more focussed on the quality of developments and their amenities rather than specific postcodes
The result was that Marylebone closed the pricing gap with other prime central London markets.
In the first half of 2016, the average price in the Marylebone postal areas of W1H, W1U, W1G and W1B was £1,594 per square foot, according to LonRes data. That was higher than £1,524 in Kensington and £1,383 in Chelsea.
While the gap has closed, buyers have become more price sensitive. Over the last two years, demand has slowed following a series of tax changes that included two stamp duty rises in 18 months. The uncertainties generated by the vote to leave the EU have brought this mood of price sensitivity into sharper relief.
“Strong price growth means buyers will increasingly look at other areas, particularly in the £1.5 million to £3.5 million price bracket that is driven by demand from young professionals,” said Christian. “To some extent pricing in Marylebone needs to fall back into line.”
Investor demand is more resilient below £1.5 million, and activity is comparatively strong in the house market above £8 million, where Marylebone remains good value versus longer established super-prime markets.
Indeed, the potential for growth is underlined by the fact that achieved prices for exceptional properties in excess of £5,000 per square foot match those in Knightsbridge and Belgravia.
The strength of the US dollar and other overseas currencies versus Sterling has boosted demand to some extent since the EU referendum but it remains relatively
subdued compared to previous years. The number of active buyers per available property was 2.8 in July 2016 compared to 5.5 one year ago and 10 two years ago.
The arrival of Crossrail in 2018, with stations at Paddington, Bond Street and Tottenham
Court Road will further enhance the evolution of Marylebone. However, in the short-to-medium term, asking prices will need to adjust to the fact demand is likely to remain exceptionally price-sensitive. The primary concern of buyers remains good value, wherever they find it.
Source: Knight Frank Research
FIGURE 3 Price growth January 2011 to April 2016, versus area average
£4,000,000
£3,500,000
£3,000,000
£2,500,000
£2,000,000
£1,500,000
£1,000,000
£500,000 W1H W1G W1T W1U W1W W1B
Year to May 2015Year to May 2016
Ave
rage
sol
d pr
ice
25Key: Number of sales 180
RESIDENTIAL RESEARCH Tom Bill Head of London Residential Research +44 20 7861 1492 [email protected] PRESS OFFICE Harry Turner +44 20 3861 6974 [email protected] Jamie Obertelli +44 20 7861 1104 [email protected]
Note: Variations in average sold prices between different time periods are not necessarily indicative of price growth