Embed Size (px)
Citation preview

© 2007 MIT Center for Digital Business. All rights Reserved.
Trend of SCM with auto-identification for medical field in Japan ~ from factory to bedside ~
Proprietary & Confidential
Masanori Akiyama MD, PhDSloan School of Management, Massachusetts Institute of Technology, Cambridge, MA, USAInternational Medical Center of Japan , Tokyo, Japan
GS1 Healthcare Conference London, UK, 29-31 October 2007

2 Proprietary & Confidential © 2007 MIT Center for Digital Business. All rights Reserved.
The concept of the Hospital IT system in Japan isnot only a management material but also integrated management resource, prevent
medication errors, application to EBM by the data mining of medical records.
As for this system, it has become to grasp medical practice and medical material, which did not understand on current electronic receipt, billing slips processing system accurately.
In POAS (Point of Act System), it is saved the management information, so-called, “man, money, material, and information.”
We concluded that this system has remarkable investment effect, over four million dollars per year, since it is a hospital management system including logistics management. In addition, the quality of care has been improved dramatically while error rates have been reduced – nearly to zero in some case.

3 Proprietary & Confidential © 2007 MIT Center for Digital Business. All rights Reserved.
What is POAS?
Real-time Consumption Data Capturing System•Collects, manages, and uses consumption data at the point of consumption (e.g. Hospital bedside)–In the form of When, Where, Who, to Whom, Why,
What, How (6W’s, 1H)•The first application is hospital
–International Medical Center of Japan (since 2002)•Current technology is PDA/bar code, but RFID technologies are now in processing

4 Proprietary & Confidential © 2007 MIT Center for Digital Business. All rights Reserved.
What can POAS do?
By collecting data from wireless PDAs, examination room terminals, and laboratory equipment, POAS can:
•Record medical actions in detail, everywhere•Assist practicing medical treatment to patients•Monitor patient symptoms continuously•Comprehend logistical data by the “minimum unit”→ In real-time.
Useful for automatic single size item identification
UDI

5 Proprietary & Confidential © 2007 MIT Center for Digital Business. All rights Reserved.
Ward / Outpatient (HIS)
750 orders/day2,329 drugs/day
IV drip bottleIV drip bottle
Neither cancellations Nor changes
570 orders/day
No change to route speed454 orders/day(802 Rp/day)
Nurse station(HIS)
570 orders/day(1006 Rp/day)
1,770 drugs/day
Bedside(Mobile terminal)
1006 Rp/day
Issue injection prescription
Perform mixed injection
Action entry
Canceled or changCanceled or changed ordersed orders
180 orders/day180 orders/day(318Rp/day)(318Rp/day)
Canceled or changCanceled or changed ordersed orders
180 orders/day180 orders/day(318Rp/day)(318Rp/day)
About 37 thousand/monthAbout 37 thousand/monthAbout 37 thousand/monthAbout 37 thousand/month
The effects of making injection action entries (calculated from performance data)The effects of making injection action entries (calculated from performance data)
Changes made to Changes made to route speedroute speed
116 orders/day116 orders/day(204 Rp/day)(204 Rp/day)
Changes made to Changes made to route speedroute speed
116 orders/day116 orders/day(204 Rp/day)(204 Rp/day)
There is a possibility of misadministration of There is a possibility of misadministration of about 40%about 40% if if the change of order is not communicated in realthe change of order is not communicated in real--time.time.
24%24%24%24%
15%15%15%15%

6 Proprietary & Confidential © 2007 MIT Center for Digital Business. All rights Reserved.
Comparison of the number of times mixed injections were checked and error rate (%) (between each 30 minutes segments)
0.0
1.0
2.0
3.0
4.0
5.0
6.0
7.0
8.0
0 5,000 10,000 15,000 20,000 25,000 30,000
混注確認実施件数
エラー発生率(%)
Hand-over time(0:30-1:00)
Hand-over time(16:30-17:00)
Hand-over time(8:30-9:00)
Coefficient of correlation=-0.6
The number of check actions and the error rate have a slightly negative correlation.The smaller the number of
injections a nurse performs that day, the higher the alarm rate.
Alarms between each 30 minutes segmentsAlarms between each 30 minutes segments
Erro
r rat
e (%
)
Number of times mixed injection was checked

7 Proprietary & Confidential © 2007 MIT Center for Digital Business. All rights Reserved.
Alarm status according to different time segmentsTime segments with higher alarm rates become even clearer when seen in 30-minute increments.
368
124
8862
4633 33
47
125
649
691
420
229
173 181
120
260
537
737
543
442
238
297
222
305
556
458
373 360 354329
357
323
445463
415
462
571
365 363343
500
301 292 294
40
438
990
6.66.66.7
6.5
4.0
4.5
4.0
2.8
2.0
2.32.4
2.6
3.5
3.8
5.0
6.3
4.5
5.0
3.7
3.3
3.2
3.0
3.53.4
3.6
4.1 4.1
3.9
4.5
5.5
6.6
6.2
6.4
4.7
4.3
3.5
3.7
3.4
3.1
3.33.4
4.2
3.94.0
4.7
4.9
6.0
4.7
0.0
1.0
2.0
3.0
4.0
5.0
6.0
7.0
8.0
0:000:30
1:001:30
2:00
2:30
3:00
3:30
4:00
4:30
5:00
5:30
6:00
6:307:00
7:308:00
8:30
9:00
9:30
10:00
10:30
11:00
11:30
12:00
12:30
13:00
13:30
14:00
14:30
15:00
15:30
16:00
16:30
17:00
17:30
18:00
18:30
19:00
19:30
20:00
20:30
21:00
21:30
22:00
22:30
23:00
23:30
エラー発生率(%)
0
200
400
600
800
1,000
1,200
エラー件数
Number of errors for different time segments (30-minute increments) and error rates.
Hand-over time(0:30-1:00)
Hand-over time(8:30-9:00)
Hand-over time(16:30-17:00)
=Before hand-over time
=After hand-over time=Hand-over time
Num
ber o
f erro
rs(%
)
Erro
r rat
e (%
)

8 Proprietary & Confidential © 2007 MIT Center for Digital Business. All rights Reserved.
Error rates for time elapsed on nurse duty (before and after hand-over time)
Work status of nurses who trigger alarms around the hand-over time.
2 36
3
1114
18
39
20
0
5
10
15
20
25
30
35
40
45
0 1 2 3 4 5 6 7 8
6
01
78
7
10
17
12
0
2
4
6
8
10
12
14
16
18
0 1 2 3 4 5 6 7 8
24
34
20
8 79 9
36
16
0
5
10
15
20
25
30
35
40
0 1 2 3 4 5 6 7 8 9
1 03
0 1 2
22
89
77
11
0
10
20
30
40
50
60
70
80
90
100
0 1 2 3 4 5 6 7 8 9
1 03 1 1 2
22
82 83
10
0
10
20
30
40
50
60
70
80
90
0 1 2 3 4 5 6 7 8 9
8 10
1 3 2 3 3
34
54
71
10
0
10
20
30
40
50
60
70
80
0 1 2 3 4 5 6 7 8 9 10
1 0 0 1 14
23
79
56
17
0
10
20
30
40
50
60
70
80
90
0 1 2 3 4 5 6 7 8 9
10 0 0 0 0
8
22
11
2
0
5
10
15
20
25
0 1 2 3 4 5 6 7 8 9
6
4
0 0 0 01
7
14
9
1
0
2
4
6
8
10
12
14
16
0 1 2 3 4 5 6 7 8 9 10
HandHand--over time over time segmentsegment8:30-9:00
16:30-17:00
0:30-1:00
Before handBefore hand--over over timetime8:00-8:30
16:00-16:30
0:00-0:30
After handAfter hand--over over timetime9:00-9:30
17:00-17:30
1:00-1:30
<Time elapsed on nurse duty that day (hr)><Time elapsed on nurse duty that day (hr)>Nurses right before the end of their shift
Day shift
Day shift
Semi
Semi--night shift
night shift
Error rate6.3%
Error rate6.2%
Error rate6.6%
Error rate6.4%
Error rate6.6%
Error rate4.5%
Error rate5.0%
Error rate6.7%
<Num
ber o
f err
ors>
<Num
ber o
f err
ors>
Nurses right at the beginning
of their shift
Error rate4.7%
Late night shiftLate night shift
9 Proprietary & Confidential © 2007 MIT Center for Digital Business. All rights Reserved.
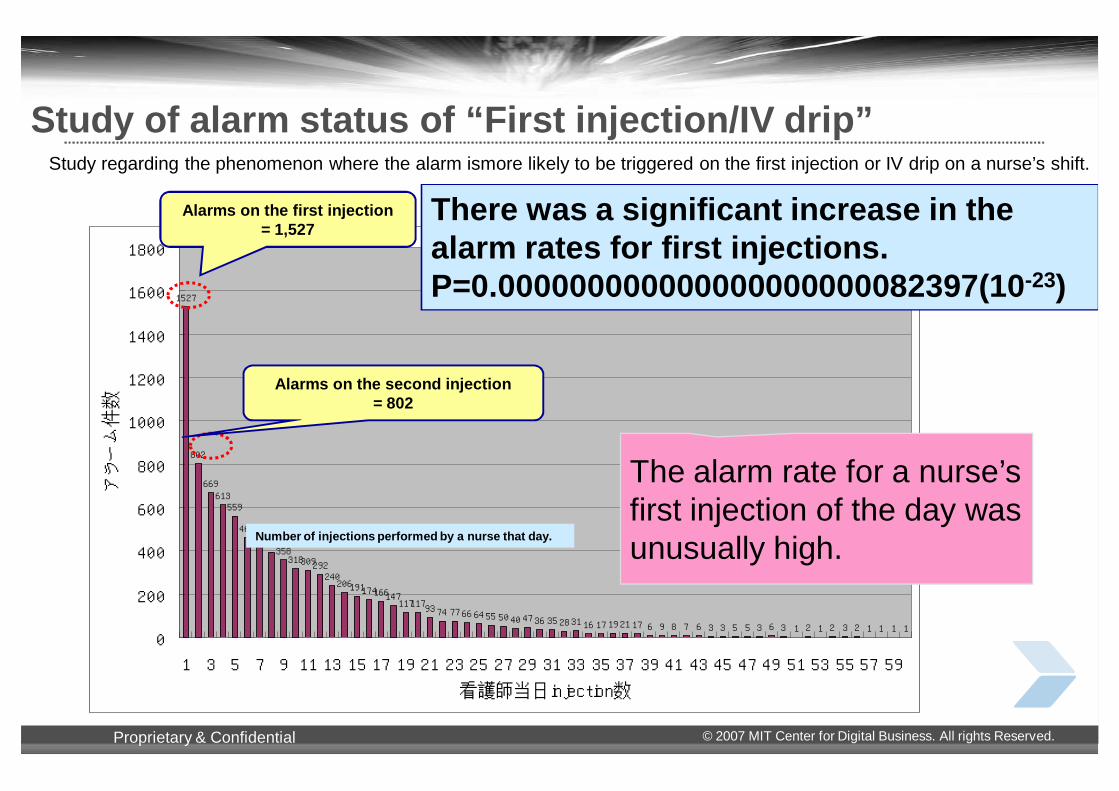
Study of alarm status of “First injection/IV drip” Study regarding the phenomenon where the alarm ismore likely to be triggered on the first injection or IV drip on a nurse’s shift.
1527
802
669613559
460454395358318309292
240206191174166147
11711793 74 77 66 64 55 50 40 47 36 35 28 31 16 17 19 21 17 6 9 8 7 6 3 3 5 5 3 6 3 1 2 1 2 3 2 1 1 1 1
0
200
400
600
800
1000
1200
1400
1600
1800
1 3 5 7 9 11 13 15 17 19 21 23 25 27 29 31 33 35 37 39 41 43 45 47 49 51 53 55 57 59
看護師当日injection数
アラーム件数
Alarms on the first injection= 1,527
Alarms on the second injection= 802
The alarm rate for a nurse’s first injection of the day was unusually high.
There was a significant increase in the alarm rates for first injections.P=0.000000000000000000000082397(10-23)
Number of injections performed by a nurse that day.

10 Proprietary & Confidential © 2007 MIT Center for Digital Business. All rights Reserved.
Time that injection and IV drips were started and order frequency
平均
0
10
20
30
40
50
60
0:00 1:00 2:00 3:00 4:00 5:00 6:00 7:00 8:00 9:00 10:00 11:00 12:00 13:00 14:00 15:00 16:00 17:00 18:00 19:00 20:00 21:00 22:00 23:00
0
20
40
60
80
100
120
140点滴開始
注射
中止オーダー
新規・変更オーダー
AverageBegin inspection
New order / order change
Cancellation order
Injection

11 Proprietary & Confidential © 2007 MIT Center for Digital Business. All rights Reserved.
Injection operations from the perspective of medical safety
Physician Pharmacy
Ward
Enter prescription
Mixing
Administer drugsCancel - change
Change the prescription if you
see these exam results!
The speed and accuracy at which the changes are reflected
is important.
●●An interAn inter--divisional safety system is neededdivisional safety system is needed..●●A system is needed that reflects changes and cancellations A system is needed that reflects changes and cancellations in the information given to medical staff within a timeframe of 2 in the information given to medical staff within a timeframe of 2 seconds.seconds.
Digitalization of this section was
achieved with the use of POAS.

12 Proprietary & Confidential © 2007 MIT Center for Digital Business. All rights Reserved.
Injection prescription11/1 to 11/3Rp1) 5% glucose 500 ml
Vitamedin 1A morningRp2) Saline500 ml
K2 1A eveningRp3) Saline100 ml
Pansporin 1 gMorning and evening
Injection prescription11/1 Rp1) 5% glucose 500 ml
Vitamedin 1A morningRp2) Saline500 ml
K2 1A eveningRp3) Saline100 ml
Pansporin 1 gMorning and evening
Injection prescription11/2Rp1) 5% glucose 500 ml
Vitamedin 1A morningRp2) Saline500 ml
K2 1A eveningRp3) Saline100 ml
Pansporin 1 gMorning and evening
Data granularity
Order
Act1Task:5W1H
Act2Task:5W1H
Act3Task:5W1H
Data unit = Invoice (payment) unit
Injection prescription11/3Rp1) 5% glucose 500 ml
Vitamedin 1A morningRp2) Saline500 ml
K2 1A eveningRp3) Saline100 ml
Pansporin 1 gMorning and evening
Data unit = People’s actions (changes) single item based
Management of the number of items
Individual (ID) management
Conventional system ID: Drug codePOAS system ID: Drug code + serial code
X

13 Proprietary & Confidential © 2007 MIT Center for Digital Business. All rights Reserved.
Unusually high alarm rates among certain nurses or physicians
Distribution of alarm rates for number of actions taken by each nurse.There were certain nurses with relatively higher alarm rates..
看護師別アラーム率
0.0
2.0
4.0
6.0
8.0
10.0
12.0
14.0
0 200 400 600 800 1000 1200 1400 1600 1800 2000 2200 2400
実施件数
アラーム率
主治医別アラーム率
0.0
1.0
2.0
3.0
4.0
5.0
6.0
7.0
0 1000 2000 3000 4000 5000 6000 7000 8000
実施件数
アラーム率
Nurses with relatively highalarm rates
Physician in charge with relatively high alarm rates
Nurses mainlyserving Ward A
(年間100件以上実施者のみ)
同じく主治医毎の実施件数に対してのアラーム率の散布図です。
Number of actions taken
Number of actions taken
Alarm rates by nurse
Alar
m ra
te
Alarm rates by physician in charge
Alar
m ra
te

14 Proprietary & Confidential © 2007 MIT Center for Digital Business. All rights Reserved.
Cancel data 4/01/2004 – 3/31/2005
10.689.9410.029.75 Cancel rate(%)
35,95955,289102,127108,535,086Cancel336,682556,2831,019,2291,113,386,619Normality
The number of injection and shotRp numbersNumberCostType
About the unit priceNormal: I calculate by an actual unit price by the inventory. Cancel: Because drawing is released and it is drawn by other patients after returned goods unsold, a real unit price is uncertain. Therefore, the agreement unit price of a period concerned and the trial.
About the divisionNormality: After the medicine is mixed, discontinuance ( for the abandonment ) is contained. Discontinuance: Medicine that was discontinued before medicine is mixed, and returned.
It was uselessly abandoned this amount if there was no confirmation before mixing the medicine.
10.689.9410.02Cancel rate(%)
35,95955,289102,127108,535,086 Cancel Type2 336,682556,2831,019,2291,113,386,619Normality
The number of injection and shotRp numbersNumberCost (Yen)Type
About the unit priceNormal: I calculate by an actual unit price by the inventory. Cancel: Because drawing is released and it is drawn by other patients after returned goods unsold, a real unit price is uncertain. Therefore, the agreement unit price of a period concerned and the trial.
About the divisionNormality: After the medicine is mixed, discontinuance ( for the abandonment ) is contained. Discontinuance: Medicine that was discontinued before medicine is mixed, and returned.
It was uselessly abandoned this amount if there was no confirmation before mixing the medicine.
cost saved : $1M / year

15 Proprietary & Confidential © 2007 MIT Center for Digital Business. All rights Reserved.
POAS can improve inventory management.
Stock All
600
H w/o POAS
D w/o POAS
E w/o POAS
F w/o POAS
G w/o POAS
Hospital
A w/o POAS
B w/o POAS
C w/o POAS
IMCJ with POAS
500
2,500
7
300
300
4008,000
10,000
2,000
10
7
10
7
4
6
2
7,000700
Staff N
155
108
32 1
200
65
1,150
800
741
720
8,000
3,500
7,700
20,000 300
Area ofwarehouse(㎡)
Item number
300
1,900
6,800
500
1,000
1,320
Beds
925
1,205
1,203
1,178
1,154
Inventory was cut to a tenth. A cost reduction of 225.5 million yen was achieved forpharmaceuticals and 241.62 million yen for medical supplies.

16 Proprietary & Confidential © 2007 MIT Center for Digital Business. All rights Reserved.
POAS can be improved hospital management.
Prevent medical accidents.
Thorough inventory management
Keywords are “realreal--timetime entry” and “serializationserialization for single item management.”
The accurate acquisition of information on bedside actions is crucial.
Acquire cancellation and change data. • Only about 60% can be acquired in conventional systems. • POAS gives an overall picture. • POAS can save 4 million dollar per yearsave 4 million dollar per year.
This improves medical safetysafety and management efficiencymanagement efficiency.

17 Proprietary & Confidential © 2007 MIT Center for Digital Business. All rights Reserved.
Item data , sales catalog, ship notice, invoice
request for quotation, planning schedule, POSElectronic Commerce Information Flow
RSS / RFID GS1-128 RSS / RFIDGS1-128 GS1-128
GS1: Product Identification through the Supply ChainGS1: Product Identification through the Supply ChainPHYSICAL ITEMS & DATA FLOWPHYSICAL ITEMS & DATA FLOW
Mfg Item Case Pallets Trucks Distributor Trucks Pallets Case Item Store UserMfg Item Case Pallets Trucks Distributor Trucks Pallets Case Item Store User
End User
212345 6789072 212345 6789072
Supplier
21234567890722123456789072
GTIN / Serial ID GTIN SSCC GTIN GTIN / Serial ID
Granularity of shipping Granularity of single item
Granularity of single item
Automatic granularity exchange

18 Proprietary & Confidential © 2007 MIT Center for Digital Business. All rights Reserved.
Un-digitized space
Bedside, ER (emergency), (OP) operating room and ICU*verbal communication *high risk, and high cost
4G: Ubiquitous medical information systems for most dangerous / high costs areas
3G: EPR : paperless electronic medical charts
Digitized spaceEHR
Department systems
The evolution of hospital information systems 1G: Billing and Lab test : medical affairs and specimen exams
2G: CPOE : ordering
Outpatient / nurse station POES
Billing
Medical affairs section / Exam section
We need standardized UDI !

Whole saller
病院
truck Hospital
ダミートラック
Supplier
Track/trace(EPCIS)
HIS
Feasibility study on medical field in Japan
Dr Ns Patient
order prepare
Ph/Ns
Audit Injection
Ph
pharmacy
Factory to supplier
In-Hospital
RFIDtag UHF
SCM
製薬企業
製薬
factory
RFIDtag HF
運送
トラックOut of study
Lot No Pdoduct ID Drug code ・・・
100000 A1111 76532S
100000 A1112 76532S
100000 A1113 76532S
100000 A1114 76532S
Drug ID Status Date/time ・・・・
A1111 患者A 200708172210
A1112 病棟A 200708172210
A1113 薬剤部 200708172210
A1114 薬剤部 200708172210
Product ID Status Date/time ・・・・
A1111 入庫In 200708170900
A1111 倉庫 200708171000
A1111 出庫 200708171500
A1112 入庫 200708170900
Internet

20 Proprietary & Confidential © 2007 MIT Center for Digital Business. All rights Reserved.
Thank you for your attention.Any Questions?
Think !
What kind of system do you want, if your son or daughter were a patient?
EE--mail: [email protected]: [email protected]


![SCIS MWS session akiyama 20170127.pptx[読み取 …Title Microsoft PowerPoint - SCIS_MWS_session_akiyama_20170127.pptx[読み取り専用] Author akiyama Created Date 1/30/2017 1:58:26](https://img.pdfslide.net/doc/110x75/5fa5131f1e044b7944644e76/scis-mws-session-akiyama-e-title-microsoft-powerpoint-scismwssessionakiyama.jpg)


![Baritone (5tü) OJI] Piano Masanori Kato Naoto …Baritone (5tü) OJI] Piano Masanori Kato Naoto Sakiya, Violin Satoru Sakurada, Violin Kyoko Takano, Viola Hiroki Kadowaki, Cello ,9/22](https://img.pdfslide.net/doc/110x75/5e697f7be7d31d7e267b19e4/baritone-5t-oji-piano-masanori-kato-naoto-baritone-5t-oji-piano-masanori.jpg)

![[E-Book] - Pentagonal Domain Exchange - Shigeki Akiyama and Edmind Harriss](https://img.pdfslide.net/doc/110x75/55cf9324550346f57b9c1ae4/e-book-pentagonal-domain-exchange-shigeki-akiyama-and-edmind-harriss.jpg)