Embed Size (px)
Citation preview
nature biotechnology VOLUME 31 NUMBER 1 JANUARY 2013 63
A rt i c l e s
Biomarker discovery is motivated by the desire to identify reliable indicators of disease for risk assessment, early detection, predicting patient responses to therapies and surveillance of recurrent disease1,2. So far, a broad range of distinct biological species such as metabolites3, peptides4, proteins2,5, cell-free nucleic acids6, exosomes7 and circu-lating tumor cells8 have been developed into biomarkers of varying performance. However, the use of naturally occurring biomarkers to indicate disease is limited by fundamental technical and biological challenges because biomarkers are frequently found in low concentra-tions in the circulation8,9, are difficult to resolve in complex biological fluids5 and can be degraded rapidly both in vivo and ex vivo10.
An alternative to endogenous biomarkers is the systemic admin-istration of exogenous agents to interrogate biological states. These approaches offer the potential to tailor agents to exploit host physiol-ogy or interface with disease-specific molecular processes as alterna-tive indicators of disease. Examples include polysaccharide inulin to assess glomerular filtration rates, fluorodeoxyglucose positron emis-sion tomography (PET) to unveil regions of increased glucose meta-bolism and a suite of molecular and activity-based probes for imaging biological activities in vivo11–13. Because these agents can be designed and tested in vitro and in preclinical models, they can be iteratively optimized and administered at concentrations substantially above biological background. The limitations of these approaches include the inability to monitor a large family of probes simultaneously
because of limited multiplexing capabilities and the substantial infra-structure of in vivo analyses, which require patients to be on site (e.g., PET and magnetic resonance imaging) and preclude remote data or sample collection.
Here we describe a class of engineered nanoscale agents that passively accumulate in diseased tissues from the host circulation through organ- or disease-specific vascular fenestrations (e.g., liver sinusoid endothelium or angiogenic tumor vessels, respectively)14,15. After arrival in the diseased microenvironment, they are cleaved by aberrantly active proteases, releasing surface-conjugated, mass-encoded peptide substrates into the host urine for detection by mass spectrometry as synthetic biomarkers of disease (Fig. 1). Because dysregulated protease activities are implicated in a wide range of human diseases, including cancer, fibrosis, atherosclerosis, inflam-mation, Alzheimer’s disease and many others16, highly multiplexed monitoring of aberrant protease activities has the potential to dis-tinguish diverse disease states. Here we describe the application of this technology to noninvasively monitor liver fibrosis17 and detect early stage cancers18.
RESULTSProtease-sensitive nanoparticles for urinary monitoringTo develop a protease-sensing platform, we first identified pep-tide substrates of proteases implicated in liver fibrosis and cancer.
Mass-encoded synthetic biomarkers for multiplexed urinary monitoring of diseaseGabriel A Kwong1,2, Geoffrey von Maltzahn1,2,10, Gayathree Murugappan1,3, Omar Abudayyeh1, Steven Mo1, Ioannis A Papayannopoulos2,4, Deanna Y Sverdlov5, Susan B Liu5, Andrew D Warren1,2, Yury Popov5, Detlef Schuppan5,6 & Sangeeta N Bhatia1,2,7–9
Biomarkers are becoming increasingly important in the clinical management of complex diseases, yet our ability to discover new biomarkers remains limited by our dependence on endogenous molecules. Here we describe the development of exogenously administered ‘synthetic biomarkers’ composed of mass-encoded peptides conjugated to nanoparticles that leverage intrinsic features of human disease and physiology for noninvasive urinary monitoring. These protease-sensitive agents perform three functions in vivo: they target sites of disease, sample dysregulated protease activities and emit mass-encoded reporters into host urine for multiplexed detection by mass spectrometry. Using mouse models of liver fibrosis and cancer, we show that these agents can noninvasively monitor liver fibrosis and resolution without the need for invasive core biopsies and substantially improve early detection of cancer compared with current clinically used blood biomarkers. This approach of engineering synthetic biomarkers for multiplexed urinary monitoring should be broadly amenable to additional pathophysiological processes and point-of-care diagnostics.
1Harvard-MIT Health Sciences and Technology, Institute for Medical Engineering and Science, Massachusetts Institute of Technology, Cambridge, Massachusetts, USA. 2David H. Koch Institute for Integrative Cancer Research, Massachusetts Institute of Technology, Cambridge, Massachusetts, USA. 3Harvard Medical School, Boston, Massachusetts, USA. 4Swanson Biotechnology Center, Massachusetts Institute of Technology, Massachusetts, USA. 5Division of Gastroenterology and Hepatology, Beth Israel Deaconess Medical Center and Harvard Medical School, Boston, Massachusetts, USA. 6Department of Medicine I, Division of Molecular and Translational Medicine, University of Mainz Medical School, Mainz, Germany. 7Electrical Engineering and Computer Science, Massachusetts Institute of Technology, Cambridge, Massachusetts, USA. 8Department of Medicine, Brigham and Women’s Hospital and Harvard Medical School, Boston, Massachusetts, USA. 9Howard Hughes Medical Institute, Chevy Chase, Maryland, USA. 10Present address: VentureLabs, The Flagship Innovation Factory, Cambridge, Massachusetts, USA. Correspondence should be addressed to S.N.B. ([email protected]).
Received 20 December 2011; accepted 21 November 2012; published online 16 December 2012; doi:10.1038/nbt.2464
npg
© 2
013
Nat
ure
Am
eric
a, In
c. A
ll rig
hts
rese
rved
.

64 VOLUME 31 NUMBER 1 JANUARY 2013 nature biotechnology
A rt i c l e s
We conjugated fluorescein-labeled derivatives of ~50 candidate peptide substrates19–23 to polyethylene glycol–coated, long-circulating iron oxide nanoworm nanoparticles24 (Supplementary Fig. 1a–c) and incubated them with recombinant proteases commonly overexpressed in disease (e.g., matrixmetallo-proteases (MMPs) and cathepsins) as well as blood-borne proteases to assess crossreactiv-ity (e.g., FXa, tissue factor and thrombin). We determined the relative substrate activities for each protease-substrate combination by monitoring increases in sample fluorescence resulting from peptidolysis that allowed pre-viously homoquenched fluorophores to emit freely in solution (Fig. 2a). We compiled the initial reaction veloci-ties for comparative analysis in a heat map (Fig. 2b), from which we selected ten peptide substrates (S1–S10; Table 1) with broad protease susceptibility as our peptide-nanoworm library.
To establish the potential to probe disease microenvironments remotely from urine, we next investigated the in vivo behavior of each system component (i.e., peptide and nanoworm). We selected a xenobi-otic mouse model of liver fibrosis in which FVB/NJ mice fed with 3,5-diethoxycarbonyl-1,4-dihydrocollidine (DDC) develop progressive liver disease as a result of chronic bile duct injury25, leading to liver fibro-sis and upregulation of local MMPs. First, to determine the efficiency of peptide clearance into urine, we selected the peptide glutamate–fibrinopeptide B (Glu-fib, EGVNDNEEGFFSAR) as a prototypic urinary marker because its endogenous derivative (fibrinopeptide B) is biologically inert and filters freely into urine when released during coagulation26. Fluorophore-labeled Glu-fib administered intravenously (i.v.) cleared rapidly into urine in both fibrotic and healthy mice with no evidence of hepatic uptake at the site of disease (Fig. 2c). By contrast, peptide-free nanoworms localized predominantly to the liver (Fig. 2d) but were unable to filter into urine, consistent with the renal clearance threshold of ~5 nm for inorganic nanoparticles27 (nanoworms are ~40 nm in diameter; Supplementary Fig. 1a) as well as our previous pharmacokinetic studies with nanoworms28. Infusion of peptide-nanoworms con-jugated with fluorescent derivatives of substrates S1–S10 (Table 1) resulted in strong liver uptake and elicited a marked urinary response in fibrotic mice from renal filtration of cleaved peptide fragments (Fig. 2e). Collectively, these studies demonstrated the ability of nanoworms to redirect peptides to sites of disease to facilitate the production of urinary biomarkers.
Profiling protease activities by mass spectrometryDespite the multiplexing advantages of mass encoding, one challenge of detecting protease activity by mass spectrometry is that peptide
substrates in complex proteolytic environments can be cleaved at multiple sites by promiscuous proteases and truncated by exopro-teases29,30 to produce diverse pools of poorly defined fragments that confound mass analysis. Here we created well-defined mass reporters to encode our substrate library. In light of the favorable renal clear-ance properties of Glu-fib, we appended d isomer–rich derivatives of Glu-fib to the N terminus of each protease substrate to serve as protease-resistant mass reporters and promote renal filtration after substrate cleavage and release from nanoworms. We further modified these tandem peptides with internal photolabile residues31 to enable the recovery of Glu-fib peptides by photolysis from complex urinary cleavage fragments after in vivo proteolysis. To test this construct, we synthesized a model photocaged tandem peptide (compound I; Fig. 3a). Consistent with previously published reports on nitro-phenyl groups, exposure of compound I (triply charged, 881.7 mass- to-charge ratio (m/z); Fig. 3b) to UV light triggered peptide cleavage, resulting in the appearance of doubly charged, acetamide-terminated Glu-fib (785.4 m/z; Fig. 3b).
To design an extensible encoding strategy for our library of protease substrates, we adapted principles of isobaric mass encoding32,33 to produce a family of mass reporters from Glu-fib. The distinguishing feature of an isobaric encoding strategy is that individual members within a family of reporters share a parent mass to facilitate efficient peptide collection by mass spectrometry but can be subsequently identified by unique tandem mass spectrometry (MS/MS) ions after fragmentation. Because Glu-fib fragments into C-terminal y-type ions (Supplementary Fig. 2a), we constructed ten mass codes centered on the y6 ion (GFFSAR) by enriching the hexamer with heavy amino acids to produce variants differentiated by 1 Da each (Supplementary Fig. 2b). We then balanced this introduced mass shift by isotope enrichment within the remaining residues (EGVNDNEE) to pro-duce peptides with identical parent masses but distinct y6 fragment ions. We call this encoding method isobar coded reporters (iCORE). To validate this approach, we analyzed an equimolar 10-plex iCORE
a
Delivery todisease sites
Biomarkerclearance to urine
hν
Inte
nsity
(%
)
m/z
LC-MS/MS quantificationof urinary biomarkers
Urine collection
Proteolytic release of biomarkers
Synthetic biomarker library
Proteasesubstrate
Massreporter
Peptidelibrary
Nanoworm
b
c
Figure 1 Schematic of the approach. (a) Synthetic biomarker library composed of mass-encoded tandem peptides conjugated onto nanoworm nanoparticles. (b) Nanoworm accumulation in disease tissues after intravenous administration into living mice. Dysregulated proteases cleave peptides from nanoworms, allowing fragments to filter into the urine. (c) Recovery of photocaged mass reporters from urinary cleavage fragments by UV irradiation and their quantification by LC-MS/MS.
npg
© 2
013
Nat
ure
Am
eric
a, In
c. A
ll rig
hts
rese
rved
.

nature biotechnology VOLUME 31 NUMBER 1 JANUARY 2013 65
A rt i c l e s
library (R1–R10; Table 1) by liquid chromatography MS/MS (LC-MS/MS) and found the entire peptide library to be present initially as a single, unresolved peak (extracted ion chromatogram (XIC), 789.85 m/z; Fig. 3c,d) but then resolve after fragmentation as predicted into a ten-peak spectrum with no fragmentation bias (683.4–692.4 m/z; Fig. 3e and Supplementary Fig. 3). We removed confounding peak overlap from naturally occurring isotopes (e.g., 13C) by collecting iCORE peptides with a 1-m/z window centered on the precursor ion (Supplementary Fig. 4a), which minimized the signal from naturally occurring isotopes to ~5% of the parent peak (Supplementary Fig. 4b). Consequently, in samples spiked with reporters at defined ratios (1:2:3:5:10:10:5:3:2:1), we found a linear correlation between peak intensity and stoichiometry in both unmodified and peak-subtracted analyses (n = 3 spiked samples, R2 = 0.99 and R2 = 0.99, respectively; Supplementary Fig. 5a–c). We peak adjusted all subsequent samples to reflect contributions from naturally occurring isotopes.
To test the ability of iCORE reporters for monitoring peptide cleavage, we extended protease substrates S1–S10 with iCORE mass tags R1–R10 using photosensitive amino acids and coupled them to nanoworms to produce synthetic biomarkers G1–G10 (Table 1). After treatment of an equimolar cocktail of G1–G10 with recom-binant MMP9, we isolated cleavage products by size filtration
and exposed them to UV light to release reporters R1–R10 for MS/MS quantification. Collective substrate activities had distinct iCORE landscapes with individual y6 peak intensities correspond-ing to the substrate preference for MMP9 (Fig. 3f). We applied this library to several additional proteases (Supplementary Fig. 6a) and found that their iCORE profiles were unique, as determined from Pearson’s correlation analysis (i.e., MMP2, MMP9, MMP12 and thrombin; Supplementary Fig. 6b), illustrating the ability of iCORE-encoded nanoworms to monitor many protease-substrate combinations simultaneously.
Monitoring hepatic fibrogenesis and resolutionLiver fibrosis is a wound-healing response to chronic liver injury and results in the deposition of scar tissue that can lead to cirrhosis, liver failure and cancer17. The dynamics of extracellular matrix (e.g., collagen) accumulation are driven largely by activated hepatic stellate cells and matrix remodeling proteases such as MMPs and their inhibitors. The current gold standard for monitoring this pro-cess is a needle biopsy followed by histological analysis; however, this technique is invasive, confounded by high sampling heterogene-ity, carries a finite risk of complications and cannot be performed as frequently as needed (e.g., for assessing antifibrotic therapies)34. Noninvasive assays, including ultrasound imaging, elastography and
Table 1 10-plex synthetic biomarker librarySynthetic biomarker librarya,b (G1–G10) Substrate (S1–S10) Isobaric mass codec,d (R1–R10) y6 reporter [y6+H+]
e+3G+6VndneeGFfsAr-X-K(FAM)GGPQGIWGQC-NW PQGIWGQ e+3G+6VndneeGFfsAr GFfsAr 683.4e+2G+6Vndnee+1GFfsAr-X-K(FAM)GGLVPRGSGC-NW LVPRGSG e+2G+6Vndnee+1GFfsAr +1GFfsAr 684.4e+1G+6Vndnee+2GFfsAr-X-K(FAM)GGPVGLIGC-NW PVGLIG e+1G+6Vndnee+2GFfsAr +2GFfsAr 685.4eG+6Vndnee+2GFfs+1Ar-X-K(FAM)GGPWGIWGQGC-NW PWGIWGQG eG+6Vndnee+2GFfs+1Ar +2GFfs+1Ar 686.4eG+5VndneeGFfs+4Ar-X-K(FAM)GGPVPLSLVMC-NW PVPLSLVM eG+5VndneeGFfs+4Ar GFfs+4Ar 687.4e+3G+1Vndnee+1GFfs+4Ar-X-K(FAM)GGPLGLRSWC-NW PLGLRSW e+3G+1Vndnee+1GFfs+4Ar +1GFfs+4Ar 688.4e+3GVndneeG+6FfsAr-X-K(FAM)GGPLGVRGKC-NW PLGVRGK e+3GVndneeG+6FfsAr G+6FfsAr 689.4e+2GVndneeG+6Ffs+1Ar-X-K(FAM)GGf(Pip)RSGGGC-NW f(Pip)RSGGG e+2GVndneeG+6Ffs+1Ar G+6Ffs+1Ar 690.4e+1GVndnee+2G+6FfsAr-X-K(FAM)GGfPRSGGGC-NW fPRSGGG e+1GVndnee+2G+6FfsAr +2G+6FfsAr 691.4eGVndnee+3G+6FfsAr-X-K(FAM)GGf(Pip)KSGGGC-NW f(Pip)KSGGG eGVndnee+3G+6FfsAr +3G+6FfsAr 692.4
List of synthetic biomarkers (G1–G10), protease substrates (S1–S10) and isobaric mass reporters (R1–R10) used in study.aX, 3-amino-3-(2-nitrophenyl)propionic acid; FAM, carboxyfluorescein; Pip, pipecolic acid; NW, nanoworm. bLowercase indicates the d isomer amino acid. cPhotocleaved C terminus, CONH2. dMass = 1,589.8 Da.
d
Disease
RESclearance
Control
c
Renalclearance
Disease Control
b
MMP14MMP9MMP8MMP7MMP2
Cathepsin BFXa
Tissue factorThrombin
10% serum
Max
*-P
LGLW
ArC
-NW
*-P
LAY
WA
RC
-NW
*-G
VV
PLS
LRS
C-N
W*-
DV
PA
ELT
AC
-NW
*-P
VP
LSLV
MC
-NW
*-G
PLP
LRS
WC
-NW
*-S
GG
PLG
LRS
WC
-NW
*-P
LA(N
va)(
Dpa
)AR
GC
-NW
*-P
LGL(
Dpa
)AR
C-N
W*-
PLG
C(m
e)H
ArC
-NW
*-P
LALW
AR
C-N
W*-
P(C
ha)G
(Nva
)HA
C-N
W*-
GP
WG
IWG
QG
C-N
W*-
PQ
GIW
GQ
C-N
W*-
RP
KA
LWR
C-N
W*-
RP
KP
FW
C-N
W*-
DIP
VS
LRS
C-N
W*-
VV
VLS
MT
AC
-NW
* -F
llAG
LVG
C-N
W*-
FlP
ES
LRM
C-N
W*-
RS
LSR
LTA
C-N
W*-
AN
ISD
LTA
C-N
W*-
PK
PLA
(Nva
)WC
-NW
*-P
LGV
RG
KC
-NW
*-P
VG
LIG
C-N
W*-
LVP
RG
SG
C-N
W*-
IEG
RG
C-N
W*-
PIC
(Et)
FF
RLG
C-N
W*-
GA
VS
WLL
TC
-NW
*-IIV
ME
LVM
C-N
W*-
NR
YS
SLT
AC
-NW
*-E
SLA
YY
TA
C-N
W*-
PK
PY
A(N
va)W
MC
-NW
*-N
KP
FS
MM
MC
-NW
*-LR
LAA
ITA
C-N
W*-
RA
MH
MY
C-N
W*-
RR
GC
-NW
*-A
RV
RG
C-N
W*-
AK
VR
GC
-NW
*-A
FG
RG
C-N
W*-
VV
PM
SM
MA
C-N
W*-
f(P
ip)R
SG
GG
C-N
W*-
IVR
A(D
ap)(
Dnp
)GC
-NW
Min * = Fl-skGG
20
a
15
10
5
Act
ivat
ion
fluor
esce
nce
(× 1
02 RF
U)
0
0 20 40Time (min)
60 80
Thrombin10% serumTissue factorFXaCathepsin BMMP2MMP7MMP8MMP9MMP14
Renalclearance
Max
Min
Disease Control
eFigure 2 Urinary detection of in vivo protease activity with peptide-nanoworms. (a) Representative activation profiles of peptide-nanoworms after treatment with recombinant proteases. Specific protease-substrate combinations led to rapid increases in sample fluorescence. RFU, relative fluorescence units. (b) Heat map comparison of the cleavage velocities for different substrate-protease combinations grouped according to activity and specificity. NW, nanoworm; Fl-skGG, fluorescein-skGG. (c–e) Fluorescence in vivo images of DDC-treated and control mice after intravenous injection of VivoTag 680–labeled Glu-fib peptides (c), peptide-free nanoworms (d) or peptide-conjugated nanoworms (e). RES, reticuloendothelial system.
npg
© 2
013
Nat
ure
Am
eric
a, In
c. A
ll rig
hts
rese
rved
.

66 VOLUME 31 NUMBER 1 JANUARY 2013 nature biotechnology
A rt i c l e s
serum biomarkers, are limited by their low accuracies and limited prognostic utility35. Thus, there remains an urgent need for non-invasive biomarkers to replace biopsy-based monitoring to facilitate the identification and validation of new anti-fibrotic agents and support clinical decision making36. We sought to identify synthetic biomarkers with the capacity to monitor liver fibrosis and resolution and extended our DDC model to include both aspects of the disease.
We first evaluated the potential toxicity of nanoworms to determine whether serial monitoring could be performed safely. Nanoworms are composed of iron oxide cores that are approved by the US Food and Drug Administration for use in humans (e.g., Feridex); we further examined whether fibrotic livers could be sensitized to nanomaterial toxicity. To investigate nanomaterial safety, we administered peptide- nanoworms (1 mg per kg body weight) or PBS weekly (day 0, 7 and 14) to mice fed DDC or control chow for 3 consecutive weeks (Supplementary Fig. 7a) and found that nanoworms did not exac-erbate fibrosis, decrease body weight or induce hepatotoxicity com-pared to PBS (Supplementary Fig. 7b–e). Serial nanoworm infusions could also introduce experimental artifacts if residual urinary report-ers from prior administrations are insufficiently cleared. Analysis of urine samples after the last nanoworm injection (day 14) revealed that both residual fluorescent and mass reporters were cleared within 5 d (day 19) (Supplementary Fig. 7f,g). Collectively, these experiments showed that nanoworms are well tolerated at the dosage selected and require 5 d for full clearance.
We next investigated whether urinary responses are specifically produced by fibrosis-associated proteases such as MMPs by testing urinary sensitivity to pharmacological inhibition of MMPs (Fig. 4a). Whereas infusion of our 10-plex iCORE-encoded nanoworm cock-tail (G1–G10) in mice given DDC chow for 3 weeks resulted in a strong increase in ensemble urinary fluorescence over mice given control chow (P < 0.001 by analysis of variance (ANOVA); Fig. 4b), urinary responses were significantly attenuated in mice addition-ally treated with the broad-spectrum MMP inhibitor Marimastat by oral gavage for 2 d before nanoworm administration, resulting in over 70% inhibition of urinary fluorescence (P < 0.01; Fig. 4b). To determine the accessibility of nanoworms to sites of fibrosis, we performed immunofluorescence analysis of liver sections, which
revealed that most nanoworms infiltrated freely into the parenchyma and further penetrated periportal zones of active fibrosis, escaping sequestration by resident macrophages (Supplementary Fig. 8a). Compared to control sections, these regions showed substantial upregulation of MMP9, a representative fibrosis-associated MMP (Supplementary Fig. 8b,c). Fibrotic sections treated with DQ gelatin substrates had similar punctate patterns (Supplementary Fig. 8d), confirming the enzymatic activity of collagen-degrading proteases (e.g., MMP2 and MMP9). These results showed that MMPs upregu-lated during fibrosis are proteolytically active and largely responsible for urinary responses.
We next monitored the processes of fibrosis and resolution by iCORE mass analysis to determine the response of individual biomar-kers apart from their collective fluorescence in urine. Mice treated transiently with DDC for 3 weeks and then given DDC-free chow developed distinct fibrosis and resolution windows (0–3 and 7– 11 weeks, respectively; Fig. 4c), as verified macroscopically by Sirius red collagen staining of liver sections and hydroxyproline quantifi-cation (Fig. 4d,e). With this treatment regime, the amount of liver collagen increased approximately threefold compared to pretreatment amounts after 3 weeks on DDC (P < 0.005), persisted from week 3–7 after initial removal of DDC and significantly decreased from week 7–11 (P < 0.05 by ANOVA) after sustained DDC withdrawal (n = 3). Thus, to monitor the transitions between fibrosing and resolving disease, we administered nanoworms at 0, 3, 7 and 11 weeks into DDC-treated and age-matched control mice and then performed iCORE MS/MS analysis.
The resulting activities of the ten synthetic biomarkers showed markedly divergent kinetics (Fig. 4f). The activities of biomarkers G3 and G4 both strongly increased relative to pretreatment baselines, reaching a plateau by week 11 despite staggered onset at weeks 7 and 3, respectively (P < 0.01). G5 and G6 showed opposing kinetics, signifi-cantly decreasing (P < 0.01) at week 3 before either gradually return-ing to pretreatment intensities (G5) or persisting to week 11 (G6). G7 tracked with the kinetics of DDC treatment, elevating sharply at week 3 and then rapidly reversing at week 7 (P < 0.01 by repeated
a c
d
e
b
f
(I)
10-plex iCORE library
LC-MS
hν
hν
� ~ 350 nm
(II)
881.7 [l+3H+]789.85 [m+2H+]
785.4 [ll+2H+]
100
700 800 900 1,000 1,100m/z
m/z m/z
500 600
700 800 900
G1–G10
1,000 1,100
MS/MS
MMP9
500 600
Inte
nsity
(%
)
+
50
0
100
Inte
nsity
(%
)
50
0
15
Inte
nsity
(%
)
5
10
0
30
Inte
nsity
(%
)
10
20
0
682 684 686 688 690 692
692.
369
1.3
690.
368
9.3
688.
368
7.3
686.
368
5.3
684.
368
3.3
694
m/z682 684 686 688 690 692 694
0 10 20 30
LC-MS/MS
min
XIC
40
100
Inte
nsity
(%
)50
0
Figure 3 Photocaged iCORE libraries for multiplexed profiling of protease activities by LC-MS/MS. (a) Structures of a tandem peptide (compound I) containing an internal UV-sensitive linker and free Glu-fib (compound II) generated after photolysis (~350 nm). (b) LC-MS spectra of compound I before (top; triply charged, 881.7 m/z) and after (bottom; doubly charged, 785.4 m/z) exposure to UV light. (c) 10-plex isobaric peptide library derived from Glu-fib (R1–R10). Blue, y6 reporter. (d) Extracted ion chromatogram (XIC) of an equimolar 10-plex iCORE mixture (789.80–789.90 m/z). The entire multiplexed set was chromatographically indistinguishable. (e) iCORE MS/MS spectrum after collision-induced disassociation. Individual reporters were identified using unique y6 reporter ions (683.3–692.3 m/z), each differentiable by a single mass unit. (f) iCORE MS/MS spectrum after incubation of a 10-plex, iCORE-encoded peptide-nanoworm cocktail with recombinant MMP9.
npg
© 2
013
Nat
ure
Am
eric
a, In
c. A
ll rig
hts
rese
rved
.

nature biotechnology VOLUME 31 NUMBER 1 JANUARY 2013 67
A rt i c l e s
measures ANOVA and Tukey’s post test). None of the remaining biomarkers (G1, G2, G8, G9 and G10) deviated from their initial pretreatment activities (n = 10 DDC-treated mice), which was also true for all biomarkers in control mice (Supplementary Fig. 9).
Having identified a set of putative biomarkers for liver fibrosis in the context of DDC, we next sought to crossvalidate promising biomark-ers in mice with deletion of Mdr2 (also known as Abcb4), a mecha-nistically distinct model of liver fibrosis. Crossvalidating biomarker responses in an independent cohort not involved in hypothesis gen-eration is crucial for eliminating potential model-specific artifacts from the use of inbred mice as well as from data overfitting37. Mdr2−/− mice lack a crucial phospholipid transporter that is required for bile stabilization and develop chronic liver injury from birth as a result of bile leakage to the portal tract38.
At 8 weeks of age, Mdr2−/− mice showed evidence of periportal fibrosis as well as significant upregulation of MMP9 compared to age-matched wild-type mice (Fig. 4g and Supplementary Fig. 10a,b). From our library of ten probes, we selected G7 for crossvalidation because it was highly specific for liver fibrosis in our DDC study, tracking with fibrogenesis and declining after fibrotic resolution (Fig. 4f). Similar to our initial observations, we detected significant elevations in urinary fluorescence in 8-week-old Mdr2−/− mice over wild-type mice (Fig. 4h,i). By contrast, G8, a biomarker revealed to be unresponsive in our DDC studies, did not show potential for monitoring fibrosis in Mdr2−/− mice (Fig. 4i). Collectively, these results further corroborated the ability of G7 to track liver fibrosis and underscored the potential for monitoring fibrogenesis with distinct molecular etiologies.
To explore potential improvements in disease classification that could be gained by using more than one biomarker, we further ana-lyzed biomarker responses in our DDC study using receiver operating characteristic (ROC) curves. ROC curves characterize the predictive power of a biomarker by returning the area under the curve (AUC) as a metric, with a baseline AUC of 0.5 representing a random biomarker classifier (Supplementary Figs. 11–13). Within the 0–3 week fibro-genesis window, biomarkers G4, G5, G6 and G7 each discriminated disease with high sensitivity and specificity with associated AUCs ranging from 0.83 to 0.96 (Supplementary Fig. 11), and combinato-rial panels, such as the best dual (G5 and G7) and triple (G5, G6 and G7) biomarker combinations, led to improvements in predictivity (0.98 and 1.0, respectively; Supplementary Fig. 13). Conversely, dur-ing fibrotic resolution, the ability of candidate biomarkers, such as G1 (AUC = 0.73), to track disease was improved in the dual (G1 and G9, AUC = 0.9) and triple (G1, G7 and G9, AUC = 0.91) biomarker combinations (Supplementary Fig. 13).
Collectively, these experiments demonstrated that liver fibrosis and resolution are revealed by distinct collections of synthetic biomar-kers and multiplexed combinations allowed the highest diagnostic performance, illustrating the ability of this platform to noninvasively illuminate otherwise inaccessible aspects of liver disease evolution.
Early detection of colorectal cancerWhen diagnosed before systemic dissemination, many primary tumors can be treated effectively with conventional clinical interventions39. However, the rates at which most biomarkers are shed from tumors are prohibitively low and cannot be readily augmented40, precluding
0 0 3 7 11–2Day Week
NW injection NWs:
±DDC ±Marimastat gavage
19
30b
f
h
d
a c e
100
80
60
40
20
Week0DDC
Marimastat
****** *
***25
20
15
1.2
G1
G6 G7 G8 G9 G10
G2 G3 G4
7 week 11 week
3 week0 week
** **
**
*****
***• *
****
G5
1.0
0.8
1.2
1.0
0.8
0 3 7 11 0 3 7 11 0 3 7 11 0 3 7 11 0 3 7 11Week
Rel
ativ
e iC
OR
E in
tens
ity(D
DC
/con
trol
)U
rine
fluor
esce
nce
(× 1
04 RF
U)
Hyd
roxy
prol
ine
(µg/
100
mg
liver
)
10
5
– +– +
+–
20
0 3
Fibrosing Resolving
7 11
Chow: Ctrl CtrlDDC
21
g*
50
WT
Mdr2–/
–
40
30
20
10
0
Hyd
roxy
prol
ine
(µg/
100
mg
liver
) Max
Min
WT Mdr2–/–
i G7
P = 0.63
G8
**
20
15
10
5
10
8
6
4
2WT Mdr2–/– WT Mdr2–/–
Urin
e flu
ores
cenc
e(×
104 R
FU
)
Figure 4 Urinary biomarkers of hepatic fibrosis and resolution in DDC-treated mice. (a) Timeline for DDC and Marimastat treatment. NW, nanoworm. (b) Urinary biomarker concentrations by anti-fluorescein isothiocyanate (FITC) immunoprecipitation after G1–G10 administration (**P < 0.01, ***P < 0.001 by ANOVA). RFU, relative fluorescence units. (c) Induction of fibrogenesis and resolution timeline. Ctrl, control. (d) Quantification of total liver collagen by hydroxyproline analysis. DDC treatment led to an approximate threefold increase in liver collagen concentrations by week (wk) 3 (***P < 0.001) and a ~30% reduction between weeks 7 and 11 (*P < 0.05) that remained above the pretreatment values (*P < 0.05) (one-way ANOVA and Tukey’s post test, n = 3 mice). Error bars, s.e.m. (e) Sirius Red staining of representative liver sections indicating the presence of fibrotic extensions emanating from portal triads at week 3, persisting to week 7 and reversing by week 11. Scale bar, 50 µm. (f) Box and whisker plots of individual iCORE peak intensities plotted as DDC over control at 0, 3, 7 and 11 weeks (*P < 0.05, **P < 0.01 by repeated measures ANOVA and Tukey’s post test, n = 8–10). (g) Crossvalidation of G7 as a urinary biomarker of fibrosis in Mdr2−/− mice by quantification of liver collagen by hydroxyproline analysis (*P < 0.05, n = 3; error bars, s.e.m.). (h) In vivo fluorescence imaging of urinary responses in Mdr2−/− mice after nanoworm infusion. (i) Administration of G7 led to elevations in urinary fluorescence, whereas G8 did not track with fibrosis (**P < 0.01).
npg
© 2
013
Nat
ure
Am
eric
a, In
c. A
ll rig
hts
rese
rved
.

68 VOLUME 31 NUMBER 1 JANUARY 2013 nature biotechnology
A rt i c l e s
early detection9,18. Thus there remains a stark mismatch between the smallest tumors detectable by blood biomarkers (>2–5 cm) and the size of tumors that would best respond to treatment (<1–5 mm), resulting in delayed detection, low drug-response rates and reduced overall patient survival. Here we hypothesized that because nanopar-ticles can passively target tumors to sample proteases through fenes-trated angiogenic tumor vessels15, cancer-specific proteases could be co-opted to amplify tumor detection through sustained enzymatic release of synthetic urinary biomarkers.
To explore this hypothesis, we compared carcinoembryonic antigen (CEA), a clinically used blood biomarker for colorectal cancer (CRC), with our nanoworms. Because plasma CEA concentrations in patients with CRC are highly variable, we first compiled CEA production rates documented by the American Type Culture Collection from 24 estab-lished human CRC lines (14 additional lines were uncharacterized) and found the rates to have a range of well over 4 log units and a median value of 1.65 ng per 106 cells per 10 d (Supplementary Fig. 14). We selected the cell line LS174T to represent colorectal tumors capable of producing CEA near the maximum observed rates (~100× above the median) and validated its ability to secrete CEA in vitro by enzyme-linked immunosorbent assay (ELISA) that had a detection limit of ~0.1 ng ml−1 (Supplementary Fig. 15a,b). To fully capture the broad spectrum of activities from matrix remode-ling proteases shared by most invasive tumors, we infused our biomar-ker ensemble (G1–G10) into mice bearing LS174T flank tumors (Fig. 5a,b) and detected a significant rise in urinary fluorescence. We verified nanoworm extravasation into the tumor parenchyma by fluorescence imaging of excised tumors and analysis of tissue sec-tions (Supplementary Fig. 16a,b). To test whether urinary responses were specifically produced by proteolysis from MMPs, we treated a separate cohort of tumor-bearing mice with Marimastat for 2 d before G1–G10 administration. Pharmacological inhibition of MMPs resulted in near abrogation of urinary signals, reducing the signal intensities by ~73% (Fig. 5b).
We next directly compared synthetic uri-nary biomarkers to CEA for early cancer detection. After implantation of LS174T cells, we monitored tumor growth noninvasively by quantifying serum CEA concentrations every 3 d by ELISA, which revealed disease by day 13 when the average tumor volume reached ~330 mm3 (P < 0.01 by two-way ANOVA, n = 5 mice; Fig. 5c,d). In parallel, we moni-tored tumor growth by infusing G1–G10 at days 0 and 10 (~130 mm3). Whereas CEA was unable to detect tumor burdens <330 mm3, ensemble urinary responses at day 10 were significantly elevated relative to those in samples before tumor growth, allowing the detection of tumors ~60 % smaller than those detectable with CEA (130 mm3 compared to 330 mm3, respectively; Fig. 5e). To further characterize the discriminatory sensitivity and specificity of these two approaches, we subjected serum CEA and urinary biomar-ker concentrations to ROC analysis. In con-trast to the limited predictive power of CEA for early detection (AUC = 0.61), ensemble urinary fluorescence was highly discrimi-natory, producing a collective AUC of 0.94 (n = 10 mice; Fig. 5f). To determine the
underlying biomarkers driving the predictivity of the ensemble, the responses of the individual probes were quantified and plotted as ROC curves (Supplementary Figs. 17 and 18). Disease classification by the best-performing individual probes (G1, G2 and G3, AUCs = 0.78–0.81) did not fully recapitulate the multiplexed set but was improved in the dual (G1 and G2, AUC = 0.88) and triple (G1, G2 and G3, AUC = 0.89) biomarker panels (Supplementary Fig. 19). This latter observation underscored the value of using a diverse family of probes for the most sensitive detection.
Having established the potential of biomarker amplification for early cancer detection, we sought crossvalidation in an independent cohort of CRC-bearing mice. In light of the high variability in CEA secretion rates, we hypothesized that our ensemble library of probes could detect tumors that secrete biomarkers at low rates. We selected HCT-15 cells, a genetically distinct CRC line that secretes CEA at a rate ~33% of the median value (Supplementary Fig. 14). As anticipated by the >99% reduction in CEA production relative to LS174T tumors, growth of HCT-15 tumors could not be detected by serum analysis even at up to day 29, when the average tumor burden measured ~1,300 mm3 (Fig. 5c,d), the maximum allow-able limit in this mouse model. By contrast, HCT-15 tumors were readily discriminated by nanoworm infusion and urine analysis at day 13 (~150 mm3; Fig. 5c,e), representing, at the minimum, a more than ninefold improvement in detection over CEA (150 mm3 compared to 1,300 mm3, respectively). Collectively, these results showed that synthetic urinary biomarkers have the potential to detect cancer earlier compared to conventional blood biomark-ers, with particularly marked enhancements for tumors secreting biomarkers at low rates.
DISCUSSIONAn ideal biomarker should be secreted at high amounts relative to the native background, remain stable or persistent in circulation until detection, be readily accessible from compositionally simple host
Max
Min
ControlTumor
––
+ ++–
25
** *20
15
10
5
Urin
e flu
ores
cenc
e(×
103 R
FU
)
LS174TMarimastat
Ser
um C
EA
(ng
ml–1
)
2.0
1.0
0.5
0
NW ** **LS174TCtrl
1.0
0.5
0
HCT-15Ctrl NW
1 4 7 10Day
13 16 29
4
3
LS174T HCT-15
2
1
Urin
e flu
ores
cenc
e(×
104 R
FU
)
0
Day
* *
0 010 13
Vol
ume
(mm
3 )
104
103
102
10
LS174THCT-15
0 0.2 0.4 0.61-Specificity
0.8 1.0
1.0
0.8
0.6
0.4
Sen
sitiv
ity
0.2AUC
CEA: 0.61Urine: 0.94
0
a
b
c e
f
d
Figure 5 Synthetic urinary biomarkers outperform serum CEA in early cancer detection. (a) IVIS fluorescence imaging showing urinary accumulation of synthetic biomarkers released by LS174T colorectal tumors. (b) Quantification of urinary fluorescence with (+) and without (−) Marimastat treatment (*P < 0.05, **P < 0.01 by ANOVA). (c) Growth kinetics of LS174T and HCT-15 colorectal tumors (n = 5 mice). Error bars, s.d. (d) Circulating concentrations of CEA analyzed by ELISA every third day after tumor implantation (**P < 0.01 by two-way ANOVA and Tukey’s post test). Arrows indicate nanoworm (NW) injections. Ctrl, control. Error bars, s.e.m. (e) Early detection of human colorectal tumors. Urinary responses were significantly elevated after nanoworm infusions in mice bearing LS174T or HCT-15 tumors at day 10 or 13, respectively (*P < 0.05 by two-tailed paired t test). (f) AUC comparison between the ensemble urinary biomarker panel and serum CEA at day 10 (n = 10 mice).
npg
© 2
013
Nat
ure
Am
eric
a, In
c. A
ll rig
hts
rese
rved
.

nature biotechnology VOLUME 31 NUMBER 1 JANUARY 2013 69
A rt i c l e s
fluids and discriminate disease with high sensitivity and specificity. In practice, these parameters are often difficult to improve or control for naturally occurring biomarkers and, consequently, many prom-ising biomarkers fail during rigorous evaluation for clinical trans-lation. Here we devised a system of synthetic biomarkers with the capacity to (i) amplify biomarker concentrations through substrate turnover by targeting aberrant protease activities, (ii) release stable, d isomer–enriched mass reporters designed to be present within a narrow mass window free of host molecules, (iii) trigger reporter clearance from blood into urine to reduce matrix complexity and facilitate facile extraction and (iv) simultaneously monitor libraries of candidate synthetic biomarkers in vivo to identify and validate lead biomarkers.
An enabling feature of our platform is the use of a nanoscale scaf-fold to direct the traffic of peptides in vivo. Although free peptides are typically cleared rapidly from the circulation through urinary secre-tion, we showed that nanoworm-conjugated peptides are endowed with long circulation times to allow transport into diseased tissues across porous vasculature and are present in urine only after release from nanoworms by disease-associated proteases. Several reports have highlighted the potential of applying peptide substrates to patient serum samples followed by mass spectrometry profiling to uncover disease-specific activity signatures4,29,30,41. However, without a delivery mechanism, in vitro serum analysis cannot sample proteases expressed on the membrane of cells residing in the disease micro-environment (e.g., MMP9 expression by liver-resident macrophages in fibrosis). Similarly to blood biomarkers, secreted proteases are markedly diluted in the circulation and are often challenging to detect above highly abundant plasma proteins5, potent proteolytic cascades activated during sample collection (e.g., coagulation) and pan- protease inhibitors in plasma (e.g., α2-macroglobulin). Here we chose nanoworms as chaperones because iron oxide nanoparticles are safe for use in humans, but a broad range of nontoxic scaffolds, including proteins and sugars (e.g., albumin and dextran, respectively), would also be amenable for peptide delivery. Given the cumulative wealth of nanomaterials, targeting ligands and enhanced delivery strategies available in nanomedicine, we expect this work to be transferrable to many additional formulations to gain access to different organs, types of vasculature and tissue depths42,43.
Our library of isobaric mass tags to track the response of ten pep-tides in vivo provides a level of multiplexing that is currently challeng-ing to attain with molecular and activity-based imaging probes11–13. The vast majority of these approaches make use of modified protease substrates that emit fluorescent signals after proteolytic cleavage. Consequently, substrate multiplexing is limited by emission overlap as well as the need to emit in the near-infrared window (600–900 nm) to minimize signal attenuation from tissue absorption, constraining most of these studies to single probes. Conversely, our work dem-onstrates the generation of a synthetic biomarker library that is five to ten times more densely multiplexed than existing state-of-the-art activity-based probes, compares favorably with commercial isobaric tags (e.g., 8-plex iTRAQ) and, with additional parent peptides, is extensible to hundreds of orthogonal mass codes.
In addition to its invasiveness, a major limitation of the core biopsy for liver fibrosis is that tissue specimens are only ~1/50,000th the size of an adult liver, leading to sampling variation that can result in inac-curate diagnosis or staging and repeat biopsies. Here we show how nanoparticles accumulate uniformly in the liver, penetrating without bias into regions of active fibrosis to release urinary biomarkers as inte-grated measures of disease burden. Our work in two models of fibrosis with different mechanisms of induction (i.e., xenobiotic compared
to genetic) indicates the value of biomarker G7 for monitoring fibrosis. These results are reflective of fibrosis as a conserved tissue response to diverse chronic liver diseases (e.g., viral hepatitis, alcohol abuse or fatty liver disease) and suggest that biomarker G7 could be useful for monitoring fibrosis stemming from distinct underlying pathologies. Moving forward, an important area for future study will be eluci-dating the biological mechanisms that are ultimately responsible for the release of individual reporters. This could be accomplished, for example, by comparing urinary signatures from mice lacking specific proteases (e.g., Mmp9−/− mice) to those of their wild-type counter-parts or the use of clodronate liposomes to deplete liver macrophages to identify reporters that track with cellular inflammation.
A major factor preventing early detection of cancer is the tremen-dous dilution biomarkers experience on release from tumor cells into systemic circulation. Recent computational estimates18 revealed that solid tumors could potentially remain undetectable for 10–12 years and reach spherical diameters >2.5 cm before biomarker concentra-tions become sufficiently elevated to indicate disease. The advantage of our system is the ability to amplify tumor responses by leveraging enzymatic turnover (i.e., a single copy of a protease can cleave hun-dreds of peptide substrates per hour) and the renal system’s natural capacity to remove and concentrate plasma peptides into urine (i.e., from ~5 l of blood to 300 ml void volume). Our study shows that the combined effects of protease amplification and renal concentration can lead to promising results, such as the detection of small tumors that CEA could not discriminate even at the highest tumor burdens allowable in our mouse models. As many tumors do not secrete biomarkers at rates sufficient for detection (or at all), targeting tumor proteases should allow a broader range of cancers to be discovered at an early stage because proteases are uniformly implicated during tumor invasion and metastasis. Extension of this platform to multi-ple types of cancers would benefit from the development of cancer type–specific tests that could be accomplished by identifying unique biomarker panels for each cancer44. Conversely, a highly sensitive, pan-cancer test comprised of a single set of diverse probes would be useful in clinical settings when the primary tumor is already known, such as monitoring for recurrence or metastases after surgical resec-tion of primary tumors.
The successful translation of this platform to humans would require further confirmation of our lead biomarkers in patients as well as quantification of the potential benefits of monitoring biomarker panels compared to single markers. A crucial limitation of existing single-biomarker assays is their relatively poor disease specificity (e.g., CEA is elevated in smokers). These assays can be improved by multiplexing (e.g., prenatal triple screening) or specifying their use in well-defined clinical contexts (e.g., prostate-specific antigen is now recommended for recurrence monitoring but not screening). Similarly, the ability of this platform to differentiate protease-driven diseases (e.g., inflammation compared to cancer) would benefit from multiplexing and serial measurements in high-risk populations.
A general concern with rodent studies is the relatively small number of animals used for hypotheses testing and validation. In this study, the number of mice selected per experimental condition (n = 5–10) allowed reasonable estimation of the mean and variance on the basis of a normal distribution. The statistical power of our study was fur-ther bolstered by the prominent effect sizes (e.g., large AUCs) in both diseases studied, as well as the concordant biomarker responses across distinct models. Nonetheless, looking forward and in light of recent expert recommendations regarding biomarker qualifications37, the results of this study will require further confirmation and rigorous evaluation in humans.
npg
© 2
013
Nat
ure
Am
eric
a, In
c. A
ll rig
hts
rese
rved
.
70 VOLUME 31 NUMBER 1 JANUARY 2013 nature biotechnology
A rt i c l e s
In summary, this study provides a framework for engineering diag-nostic agents that can exploit fundamental features of human disease and physiology for noninvasive urinary monitoring. Future expansion and inclusion of additional enzymatic families (e.g., lipases, nucle-ases or glycosidases), organ-specific delivery strategies and broader multiplexing capabilities will provide opportunities for systems-level monitoring of disease and elucidating multienzymatic networks in health and disease.
METHODSMethods and any associated references are available in the online version of the paper.
Note: Supplementary information is available in the online version of the paper.
AcKNOWLeDGMeNtSWe thank R. Cook, N. Schiller and M. Brown (Swanson Biotechnology Center (SBC), Massachusetts Institute of Technology (MIT)) for peptide synthesis and tissue sectioning, C. Whittaker (SBC, MIT) for bioinformatic insight, R. Tomaino (Harvard Taplin mass spectrometry facility) for mass spectrometry analysis, F. Giammo and D. Kim (MIT) for initial probe work and urine purification, S. Carr (Broad Institute of MIT/Harvard) for mass spectrometry expertise and M. Sailor (University of California San Diego (UCSD)), J. Park (UCSD) and S. Friedman (Mount Sinai School of Medicine) for insightful discussions. This work was funded by the US National Institutes of Health (Bioengineering Research Partnership: R01 CA124427 to S.N.B.), the Kathy and Curt Marble Cancer Research Fund to S.N.B. and US National Institutes of Health grants U19 AI066313 and 1R21 DK075857 to D.S. G.A.K. is supported by the Ruth L. Kirschstein National Research Service Award (F32CA159496-01). S.N.B. is a Howard Hughes Institute Investigator.
AUtHOR cONtRIBUtIONSG.A.K., G.v.M. and S.N.B. conceived the study and designed the experiments. G.v.M. and S.M. performed the in vitro substrate screen and initial pharmacokinetic studies. G.A.K. developed the mass-encoding scheme. G.A.K., G.M. and O.A. performed the fibrosis experiments. Y.P., D.Y.S., S.B.L. and D.S. developed and provided expertise for the fibrosis progression and reversal protocols, and performed fibrosis quantification assays. G.A.K. and A.D.W. performed cancer experiments. G.A.K. and I.A.P. collected in vivo mass spectrometry data. G.A.K., G.v.M. and S.N.B. wrote the manuscript.
cOMPetING FINANcIAL INteReStSThe authors declare no competing financial interests.
Published online at http://www.nature.com/doifinder/10.1038/nbt.2464. reprints and permissions information is available online at http://www.nature.com/reprints/index.html.
1. Sawyers, C.L. The cancer biomarker problem. Nature 452, 548–552 (2008).2. Hanash, S.M., Pitteri, S.J. & Faca, V.M. Mining the plasma proteome for cancer
biomarkers. Nature 452, 571–579 (2008).3. Sreekumar, A. et al. Metabolomic profiles delineate potential role for sarcosine in
prostate cancer progression. Nature 457, 910–914 (2009).4. Findeisen, P. & Neumaier, M. Functional protease profiling for diagnosis of malignant
disease. Proteomics Clin. Appl. 6, 60–78 (2012).5. Surinova, S. et al. On the development of plasma protein biomarkers. J. Proteome
Res. 10, 5–16 (2011).6. Schwarzenbach, H., Hoon, D.S.B. & Pantel, K. Cell-free nucleic acids as biomarkers
in cancer patients. Nat. Rev. Cancer 11, 426–437 (2011).7. Moon, P.-G., You, S., Lee, J.-E., Hwang, D. & Baek, M.-C. Urinary exosomes and
proteomics. Mass Spectrom. Rev. 30, 1185–1202 (2011).8. Nagrath, S. et al. Isolation of rare circulating tumour cells in cancer patients by
microchip technology. Nature 450, 1235–1239 (2007).9. Lutz, A.M., Willmann, J.K., Cochran, F.V., Ray, P. & Gambhir, S.S. Cancer screening:
a mathematical model relating secreted blood biomarker levels to tumor sizes. PLoS Med. 5, e170 (2008).
10. Haun, J.B. et al. Micro-NMR for rapid molecular analysis of human tumor samples. Sci. Transl. Med. 3, 71ra16 (2011).
11. Edgington, L.E., Verdoes, M. & Bogyo, M. Functional imaging of proteases: recent advances in the design and application of substrate-based and activity-based probes. Curr. Opin. Chem. Biol. 15, 798–805 (2011).
12. Nomura, D.K., Dix, M.M. & Cravatt, B.F. Activity-based protein profiling for biochemical pathway discovery in cancer. Nat. Rev. Cancer 10, 630–638 (2010).
13. Hilderbrand, S.A. & Weissleder, R. Near-infrared fluorescence: application to in vivo molecular imaging. Curr. Opin. Chem. Biol. 14, 71–79 (2010).
14. Braet, F. & Wisse, E. Structural and functional aspects of liver sinusoidal endothelial cell fenestrae: a review. Comp. Hepatol. 1, 1 (2002).
15. Jain, R.K. & Stylianopoulos, T. Delivering nanomedicine to solid tumors. Nat. Rev. Clin. Oncol. 7, 653–664 (2010).
16. López-Otín, C. & Bond, J.S. Proteases: multifunctional enzymes in life and disease. J. Biol. Chem. 283, 30433–30437 (2008).
17. Schuppan, D. & Afdhal, N.H. Liver cirrhosis. Lancet 371, 838–851 (2008).18. Hori, S.S. & Gambhir, S.S. Mathematical model identifies blood biomarker-based
early cancer detection strategies and limitations. Sci. Transl. Med. 3, 109ra116 (2011).
19. Bremer, C., Tung, C.H. & Weissleder, R. In vivo molecular target assessment of matrix metalloproteinase inhibition. Nat. Med. 7, 743–748 (2001).
20. Kridel, S.J. et al. A unique substrate binding mode discriminates membrane type-1 matrix metalloproteinase from other matrix metalloproteinases. J. Biol. Chem. 277, 23788–23793 (2002).
21. Lutolf, M.P. et al. Repair of bone defects using synthetic mimetics of collagenous extracellular matrices. Nat. Biotechnol. 21, 513–518 (2003).
22. Mahmood, U. & Weissleder, R. Near-infrared optical imaging of proteases in cancer. Mol. Cancer Ther. 2, 489–496 (2003).
23. Turk, B.E., Huang, L.L., Piro, E.T. & Cantley, L.C. Determination of protease cleavage site motifs using mixture-based oriented peptide libraries. Nat. Biotechnol. 19, 661–667 (2001).
24. Park, J.-H. et al. Systematic surface engineering of magnetic nanoworms for in vivo tumor targeting. Small 5, 694–700 (2009).
25. Fickert, P. et al. A new xenobiotic-induced mouse model of sclerosing cholangitis and biliary fibrosis. Am. J. Pathol. 171, 525–536 (2007).
26. Morris, T.A. et al. Urine and plasma levels of fibrinopeptide b in patients with deep vein thrombosis and pulmonary embolism. Thromb. Res. 110, 159–165 (2003).
27. Choi, H.S. et al. Renal clearance of quantum dots. Nat. Biotechnol. 25, 1165–1170 (2007).
28. Park, J.-H. et al. Magnetic iron oxide nanoworms for tumor targeting and imaging. Adv. Mater. 20, 1630–1635 (2008).
29. Villanueva, J. et al. Differential exoprotease activities confer tumor-specific serum peptidome patterns. J. Clin. Invest. 116, 271–284 (2006).
30. Villanueva, J. et al. A sequence-specific exopeptidase activity test (sseat) for “functional” biomarker discovery. Mol. Cell. Proteomics 7, 509–518 (2008).
31. Brown, B.B., Wagner, D.S. & Geysen, H.M. A single-bead decode strategy using electrospray ionization mass spectrometry and a new photolabile linker: 3-amino-3-(2-nitrophenyl)propionic acid. Mol. Divers. 1, 4–12 (1995).
32. Ross, P.L. et al. Multiplexed protein quantitation in Saccharomyces cerevisiae using amine-reactive isobaric tagging reagents.ralph. Mol. Cell. Proteomics 3, 1154–1169 (2004).
33. Thompson, A. et al. Tandem mass tags: a novel quantification strategy for comparative analysis of complex protein mixtures by MS/MS. Anal. Chem. 75, 1895–1904 (2003); erratum 75, 4942 (2003); erratum 78, 4235 (2006).
34. Rockey, D.C. et al. Liver biopsy. Hepatology 49, 1017–1044 (2009).35. Popov, Y. & Schuppan, D. Targeting liver fibrosis: strategies for development and
validation of antifibrotic therapies. Hepatology 50, 1294–1306 (2009).36. Bedossa, P., Dargère, D. & Paradis, V. Sampling variability of liver fibrosis in chronic
hepatitis C. Hepatology 38, 1449–1457 (2003).37. Mischak, H. et al. Recommendations for biomarker identification and qualification
in clinical proteomics. Sci. Transl. Med. 2, 46ps42 (2010).38. Popov, Y., Patsenker, E., Fickert, P., Trauner, M. & Schuppan, D. Mdr2 abcb4−/−
mice spontaneously develop severe biliary fibrosis via massive dysregulation of pro- and antifibrogenic genes. J. Hepatol. 43, 1045–1054 (2005).
39. Etzioni, R. et al. The case for early detection. Nat. Rev. Cancer 3, 243–252 (2003).
40. D’Souza, A.L. et al. A strategy for blood biomarker amplification and localization using ultrasound. Proc. Natl. Acad. Sci. USA 106, 17152–17157 (2009).
41. Dekker, L.J.M. et al. Differential expression of protease activity in serum samples of prostate carcinoma patients with metastases. Proteomics 10, 2348–2358 (2010).
42. Ruoslahti, E., Bhatia, S.N. & Sailor, M.J. Targeting of drugs and nanoparticles to tumors. J. Cell Biol. 188, 759–768 (2010).
43. Sugahara, K.N. et al. Coadministration of a tumor-penetrating peptide enhances the efficacy of cancer drugs. Science 328, 1031–1035 (2010).
44. Kulasingam, V., Pavlou, M.P. & Diamandis, E.P. Integrating high-throughput technologies in the quest for effective biomarkers for ovarian cancer. Nat. Rev. Cancer 10, 371–378 (2010).
npg
© 2
013
Nat
ure
Am
eric
a, In
c. A
ll rig
hts
rese
rved
.

nature biotechnologydoi:10.1038/nbt.2464
ONLINE METHODSNanomaterial synthesis. Nanoworms were synthesized according to pre-viously published protocols24. Peptides were synthesized at MIT (Swanson Biotechnology Center); isotopically labeled Fmoc amino acids were purchased from Cambridge Isotopes, and 3-Nα-Fmoc-amino-3-(2-nitrophenyl)propionic acid was purchased from Advanced Chemtech. Amine-terminated nanoworms were first reacted with VivoTag 680 (PerkinElmer) to enable in vivo imag-ing and then with succinimidyl iodoacetate (Pierce) to introduce sulfhydryl- reactive handles. Cysteine peptides and polyethylene glycol–SH were then mixed with nanoworms overnight at room temperature (95:20:1 molar ratio), and excess peptides were removed by size filtration. Peptide-nanoworm stock solutions were stored in PBS at 4 °C.
In vitro protease assays. For substrate screening, Fl-peptide-nanoworms (2.5 µM by peptide) were mixed with recombinant MMP2, MMP8 and MMP9 (R&D Systems), MMP7 and MMP14 (AnaSpec), thrombin, tissue fac-tor, FXa or cathepsin B (Haematologic Technologies) in a 96-well plate at 37 °C in activity buffers according to the manufacturer’s instructions and monitored with a microplate reader (SpectroMax Gemini EM). For mass spectrometry analysis, equimolar iCORE-encoded nanoworms (Table 1) were incubated with proteases for 2.5 h at 37 °C. Cleavage fragments were purified from nanoworms by size filtration before UV treatment (365 nm; CL-1000 UV crosslinker, UVP). Reporters were then dried by speed vacuum centrifuge and stored at 4 °C.
In vivo imaging. All animal work was approved by the committee on ani-mal care (MIT, protocol 0408-038-11). FVB/NJ mice (Jackson Labs) were fed with 0.1% (w/w) DDC (Sigma) rodent chow for 3 weeks (Research Diets). Fibrotic and age-matched control female mice were i.v. infused with VivoTag 680–labeled reagents and visualized by IVIS imaging (Xenogen). For tumor xenografts, LS174T cancer cell lines were maintained in 10% FBS Eagle’s mini-mum essential medium and inoculated subcutaneously (5 × 10⁶ cells per flank) in nude female mice (Charles River) before imaging.
Characterization of models. For in situ zymography, fibrotic sections were covered with 90 µl solution of 0.5% (wt/vol) low-melt agarose (Sigma) in MMP activation buffer (50 mM Tris, 150 NaCl, 5 mM CaCl2 and 0.025% Brij 35, pH 7.5) with 10 µl of DQ gelatin (1 mg ml−1; Invitrogen) and Hoechst dye at 37 °C. Slides were solidified at 4 °C and then incubated at room tempera-ture overnight to promote gelatin proteolysis by tissue proteases. To quan-tify hepatic collagen, tissue from the right and left lobes (250–300 mg) was hydrolyzed in 5 ml of 6 N HCl at 110 °C for 16 h followed by hydroxyproline quantification as previously described38. To quantify CEA, blood was col-lected from tumor-bearing mice into Capiject microtubes (Terumo) to isolate serum before ELISA (Calbiotech). For immunofluorescence analysis, equi-molar nanoworm cocktails (5 µM per peptide) were administered in fibrotic FVB/NJ or tumor-bearing nude mice. After perfusion, livers or tumors were
fixed in 4% paraformaldehyde, frozen for sectioning and stained for F4/80 (AbD Serotec), MMP9 (R&D Biosystems), CD31 (Santa Cruz Biotechnologies) and/or FITC (Genetex) before being analyzed by fluorescence microscopy (Nikon Eclipse Ti).
Collection of urinary peptides. Mice were i.v. infused with 200 µl PBS con-taining equimolar nanoworm cocktails (5 µM per peptide) with EDTA-free protease inhibitor tablets (Roche) to isolate MMP activity. Marimastat was dosed at 100 mg per kg body weight in 0.45% methylcellulose twice daily by orogastric gavage for 2 d before nanoworm infusion. Mice were placed over 96-well plates surrounded by cylindrical sleeves for urine collection. To pre-vent further reporter degradation, voided samples were spiked with EDTA plus complete protease inhibitors (Roche) immediately after collection. To quan-tify urinary fluorescence, 2 µl of each sample was incubated with magnetic beads (Dynal) coated with FITC antibodies (Genetex) in 50 µl binding buffer (100 nM NH4OAc and 0.01% CHAPS) for 1 h at 37 °C, washed twice with 100 mM NH4OAc and eluted twice with 15 µl 5% acetic acid. Samples were neutralized with 2 M Tris and quantified by microplate fluorimetry. For iCORE analysis, samples were irradiated with UV light for 30 min before trichloroace-tic acid precipitation (20% final volume) to remove proteins. Soluble fractions were applied to C18 reverse-phase columns (Nest Group) and eluted by step gradients of 20% acetonitrile (ACN) increments in 0.1% formic acid. Sixty percent ACN fractions containing Glu-fib peptides were collected and dried by vacuum centrifuge.
LC-MS/MS analyses. Peptide samples were reconstituted in 5% ACN and 0.1% formic acid and analyzed at MIT or the Taplin mass spectrometry facility (Harvard Medical School). At MIT, peptides were captured and eluted from a C18 nanoflow high-performance liquid chromatography (HPLC) column (75 µm internal diameter; Magic C18 AQ, Michrom BioResources) at a flow rate of 300 nl per min using a water-acetonitrile solvent system with 0.1% formic acid. Electrospray ionization mass spectrometry was carried out on a QSTAR Elite Q-TOF mass spectrometer (AB Sciex). At Harvard, samples were reconstituted in 2.5% ACN and 0.1% formic acid. Samples were injected using a Famos autosampler (LC Packings) into an Agilent 1100 HPLC before mass analysis on a LTQ-Orbitrap (Thermo Electron). To account for discrep-ancies in urine volumes and concentrations, peak intensities of individual reporters were scaled relative to their respective total iCORE ion currents before normalization against control samples to account for technical and age-related variations.
Statistical analyses. Pearson’s correlation coefficients between different pro-tease profiles were calculated with MATLAB. ANOVA analyses were calculated with GraphPad 5.0 (Prism). For ROC analyses, risk score functions were first estimated by logistic regression on individual biomarkers and then ROC curve analyses of single or biomarker combinations were performed (SigmaPlot).
npg
© 2
013
Nat
ure
Am
eric
a, In
c. A
ll rig
hts
rese
rved
.
Supplementary Information
Mass-encoded synthetic biomarkers for multiplexed urinary monitoring of disease
Gabriel A. Kwong1,2, Geoffrey von Maltzahn1,2,3, Gayathree Murugappan1,4, Omar Abudayyeh1,
Steven Mo1, Ioannis A. Papayannopoulos2,5, Deanna Y. Sverdlov6, Susan B. Liu6, Andrew D.
Warren1,2, Yury Popov6, Detlef Schuppan6,7 & Sangeeta N. Bhatia1,2,8,9,10
1 Harvard-MIT Health Sciences and Technology, Massachusetts Institute of Technology,
Cambridge, MA, USA. 2 David H. Koch Institute for Integrative Cancer Research,
Massachusetts Institute of Technology, Cambridge, MA, USA. 3 Current address: VentureLabs,
The Flagship Innovation Factory, Cambridge, MA, USA. 4 Harvard Medical School, Boston, MA,
USA. 5 Swanson Biotechnology Center, Massachusetts Institute of Technology, MA, USA. 6
Division of Gastroenterology and Hepatology, Beth Israel Deaconess Medical Center and
Harvard Medical School, Boston, MA, USA. 7 Division of Molecular and Translational Medicine,
Department of Medicine I, University of Mainz Medical School, Mainz, Germany. 8 Electrical
Engineering and Computer Science, Massachusetts Institute of Technology, Cambridge, MA,
USA. 9 Department of Medicine, Brigham and Women’s Hospital and Harvard Medical School,
Boston, MA, USA. 10 Howard Hughes Medical Institute, Chevy Chase, Maryland, USA.
Correspondence should be addressed to S.N.B. ([email protected]).
Nature Biotechnology doi:10/1038/nbt.2464

Supplementary Figure 1. Long-circulating iron oxide nanoworm chaperones. (a) Size
distribution of dextran-coated, iron oxide NWs as determined by dynamic light scattering. (b)
Absorbance spectra of free NWs (red) and NWs conjugated with Fluorescein-labeled peptides
(~ 500 nm) and Alexa 647 (blue). (c) In vivo clearance kinetics of PEG-coated (blue) and PEG-
free (red) NWs conjugated with substrate peptides. Pegylated NWs extended circulation half-life
by ~4 hours.
Nature Biotechnology doi:10/1038/nbt.2464

Supplementary Figure 2. Isobaric COded REporter (iCORE) mass encoding. (a) MS/MS
spectrum of Glu-fib following collision induced disassociation. Peaks correspond to c-terminal,
y-type peptide fragments. (b) List of 10 isotopic analogs and corresponding masses produced
via isobaric encoding. Each sequence was constructed by selectively enriching the balance or
reporter regions with ‘heavy’ amino acids to produce unique y6 reporter ions while maintaining a
uniform total mass.
Nature Biotechnology doi:10/1038/nbt.2464
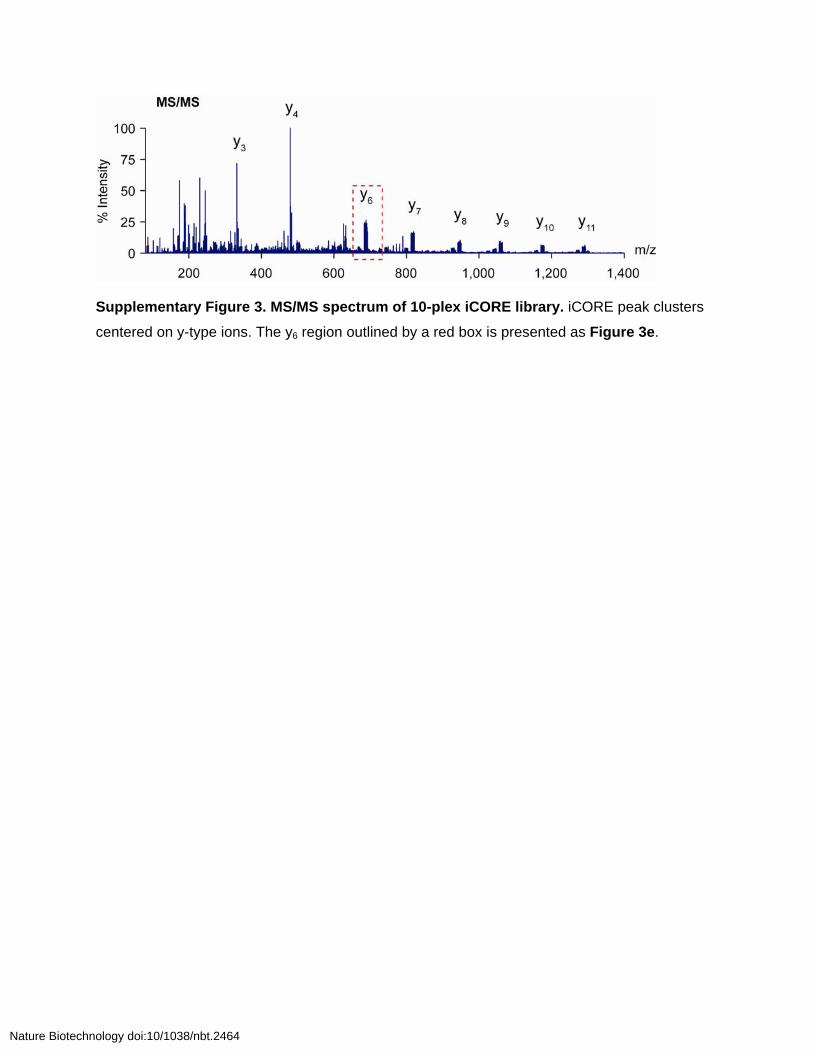
Supplementary Figure 3. MS/MS spectrum of 10-plex iCORE library. iCORE peak clusters
centered on y-type ions. The y6 region outlined by a red box is presented as Figure 3e.
Nature Biotechnology doi:10/1038/nbt.2464

Supplementary Figure 4. Unit collection window for peptide fragmentation minimizes
peak overlap arising from naturally occurring isotopes. (a) A typical MS spectrum of an
isotope-coded Glu-fib peptide. The parent precursor peptide was collected for fragmentation via
a unit mass window (gray), excluding the naturally occurring isotope peaks. (b) Resulting
MS/MS spectrum. Isotope peak was minimized, comprising ~5% of the original peak intensity.
Nature Biotechnology doi:10/1038/nbt.2464

Supplementary Figure 5. iCORE LC MS/MS analysis is quantitative. (a) MS/MS spectrum of
a 10-plex mixture of iCORE reporters combined in a 1:2:3:5:10:10:5:3:2:1 ratio. (b) Extracted
peak intensities were highly correlated with the input reporter stoichiometry (r2 = 0.99; n = 3;
error bars = s.e.m.). (c) To account for naturally occurring isotopes (Supplementary Fig. 4),
individual reporter intensities were modified by subtracting 5% of the prior reporter intensity.
Compensated reporter ratios also strongly correlated with reporter ratios (r2 = 0.99; n = 3; error
bars = s.e.m.).
Nature Biotechnology doi:10/1038/nbt.2464

Supplementary Figure 6. Protease-specific iCORE mass signatures. (a) iCORE MS/MS
profiles of recombinant proteases MMP2, MMP12, and thrombin. (b) Graphical representation of
Pearson’s correlation coefficients between proteases.
Nature Biotechnology doi:10/1038/nbt.2464
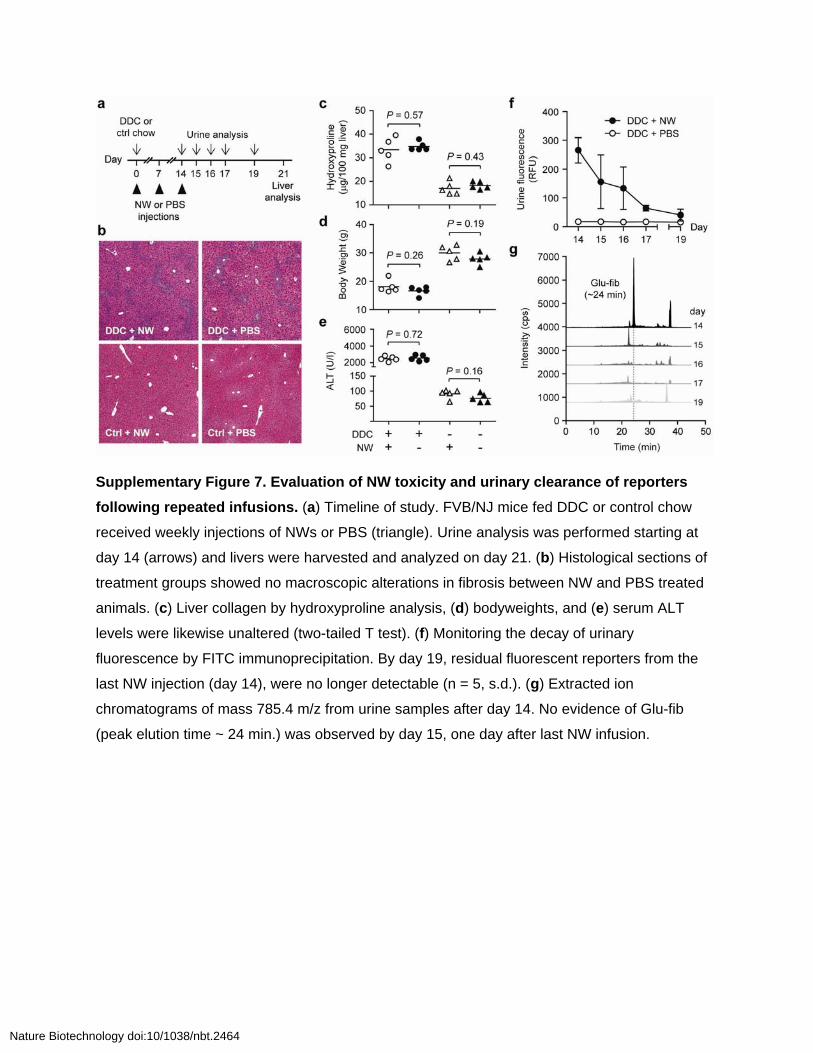
Supplementary Figure 7. Evaluation of NW toxicity and urinary clearance of reporters
following repeated infusions. (a) Timeline of study. FVB/NJ mice fed DDC or control chow
received weekly injections of NWs or PBS (triangle). Urine analysis was performed starting at
day 14 (arrows) and livers were harvested and analyzed on day 21. (b) Histological sections of
treatment groups showed no macroscopic alterations in fibrosis between NW and PBS treated
animals. (c) Liver collagen by hydroxyproline analysis, (d) bodyweights, and (e) serum ALT
levels were likewise unaltered (two-tailed T test). (f) Monitoring the decay of urinary
fluorescence by FITC immunoprecipitation. By day 19, residual fluorescent reporters from the
last NW injection (day 14), were no longer detectable (n = 5, s.d.). (g) Extracted ion
chromatograms of mass 785.4 m/z from urine samples after day 14. No evidence of Glu-fib
(peak elution time ~ 24 min.) was observed by day 15, one day after last NW infusion.
Nature Biotechnology doi:10/1038/nbt.2464
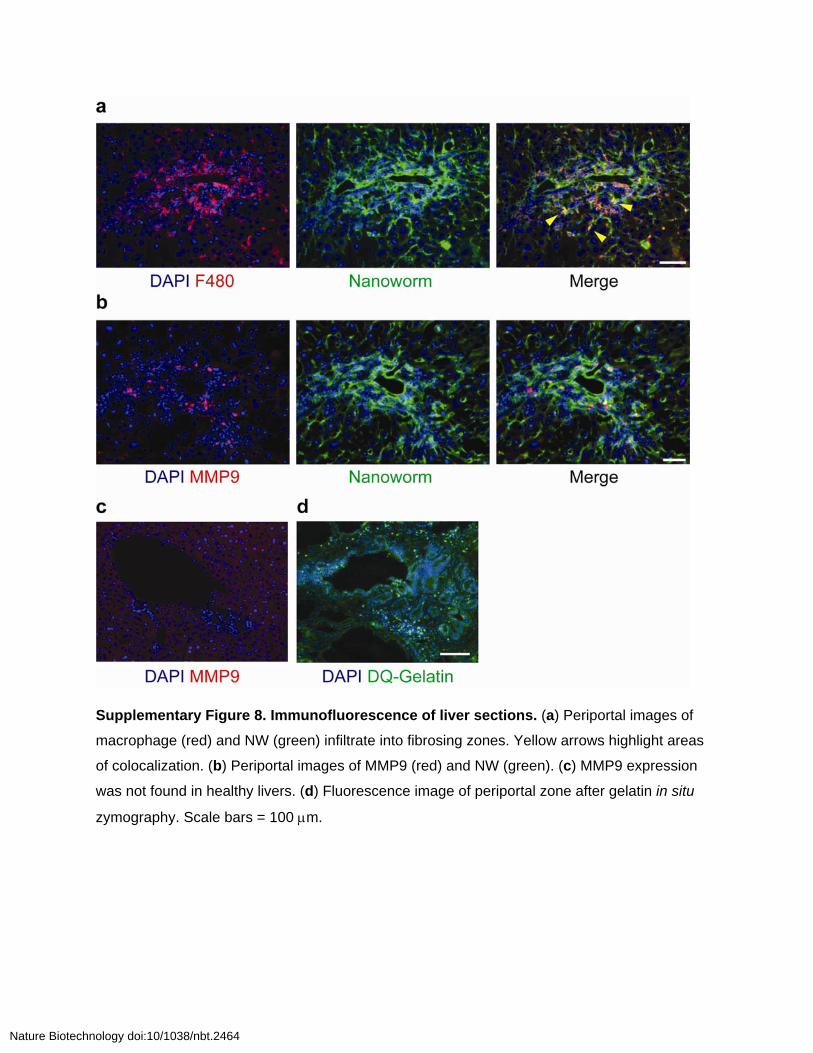
Supplementary Figure 8. Immunofluorescence of liver sections. (a) Periportal images of
macrophage (red) and NW (green) infiltrate into fibrosing zones. Yellow arrows highlight areas
of colocalization. (b) Periportal images of MMP9 (red) and NW (green). (c) MMP9 expression
was not found in healthy livers. (d) Fluorescence image of periportal zone after gelatin in situ
zymography. Scale bars = 100 m.
Nature Biotechnology doi:10/1038/nbt.2464

Supplementary Figure 9. iCORE profiles of control animals. Box-and-whisker plots of
individual iCORE peak intensities (repeated measures ANOVA, n = 5).
Nature Biotechnology doi:10/1038/nbt.2464

Supplementary Figure 10. Mdr2–/– mice spontaneously develop liver fibrosis from birth.
(a) Histological staining of wild type FVB/NJ and Mdr2–/– knockout mice at 8 weeks of age.
Significant periportal fibrosis was observed in Mdr2–/– liver sections. (b) Immunofluorescence
staining of MMP9. Significant upregulation of MMP9 was observed in knockout animals at 8
weeks of age (scale bars = 100 m).
Nature Biotechnology doi:10/1038/nbt.2464

Supplementary Figure 11. ROC curves of fibrosing biomarkers.
Nature Biotechnology doi:10/1038/nbt.2464

Supplementary Figure 12. ROC curves of resolving biomarkers.
Nature Biotechnology doi:10/1038/nbt.2464

Supplementary Figure 13. Biomarker panels improve sensitivity and specificity. (a) ROC
curves of the best single, dual and triple biomarker combinations of liver fibrosis with associated
area under curves (AUC). (b) ROC curves of biomarkers associated with fibrotic resolution.
Nature Biotechnology doi:10/1038/nbt.2464
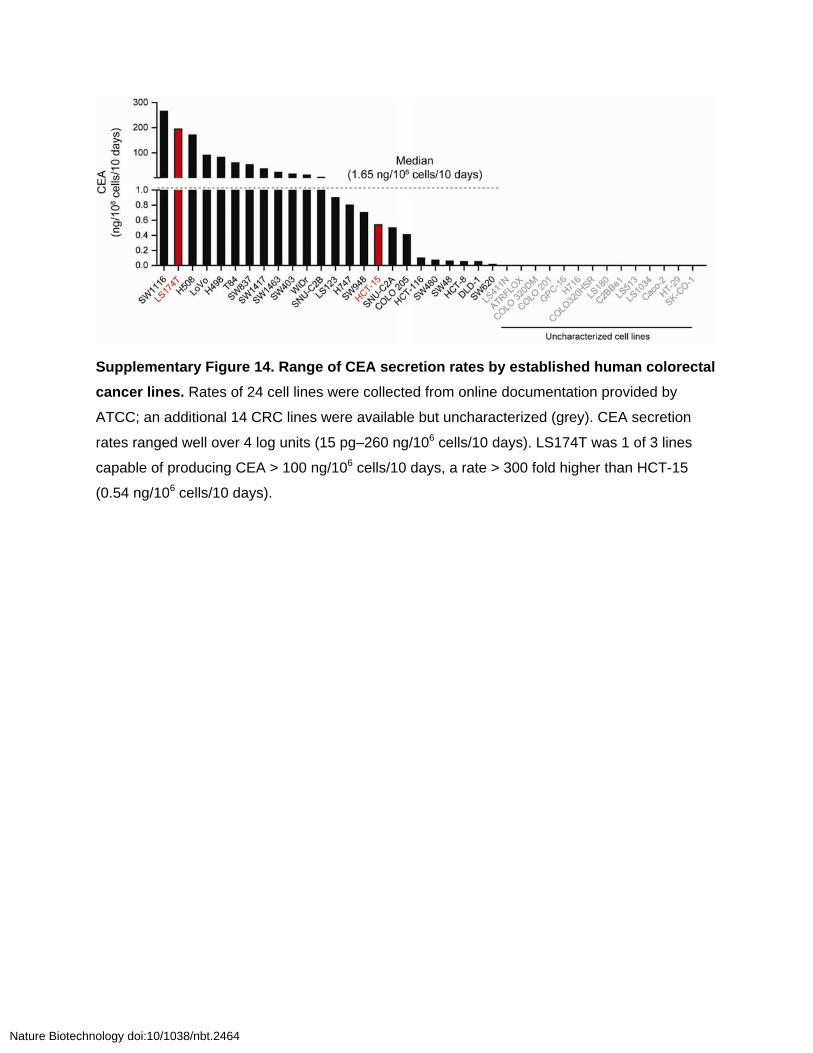
Supplementary Figure 14. Range of CEA secretion rates by established human colorectal
cancer lines. Rates of 24 cell lines were collected from online documentation provided by
ATCC; an additional 14 CRC lines were available but uncharacterized (grey). CEA secretion
rates ranged well over 4 log units (15 pg–260 ng/106 cells/10 days). LS174T was 1 of 3 lines
capable of producing CEA > 100 ng/106 cells/10 days, a rate > 300 fold higher than HCT-15
(0.54 ng/106 cells/10 days).
Nature Biotechnology doi:10/1038/nbt.2464

Supplementary Figure 15. In vitro CEA secretion by LS174T and HCT-15 colorectal
cancer cells. (a) Quantification of CEA from conditioned media by ELISA. (b) Details of ELISA
assay from Calbiotech. Standards were further diluted to enable quantification of CEA at low
levels with a limit of detection of ~ 0.1 ng/ml.
Nature Biotechnology doi:10/1038/nbt.2464

Supplementary Figure 16. NW accumulation in tumor tissue. (a) VivoTag-680-labeled NWs
or saline solutions were injected into LS 174T xenograft animals. Following excision, the tumors
were scanned for NW accumulation. (b) Immunofluoresence analysis of tumor sections for
blood vessels (red) and NW (green). Scale bar = 50 m.
Nature Biotechnology doi:10/1038/nbt.2464
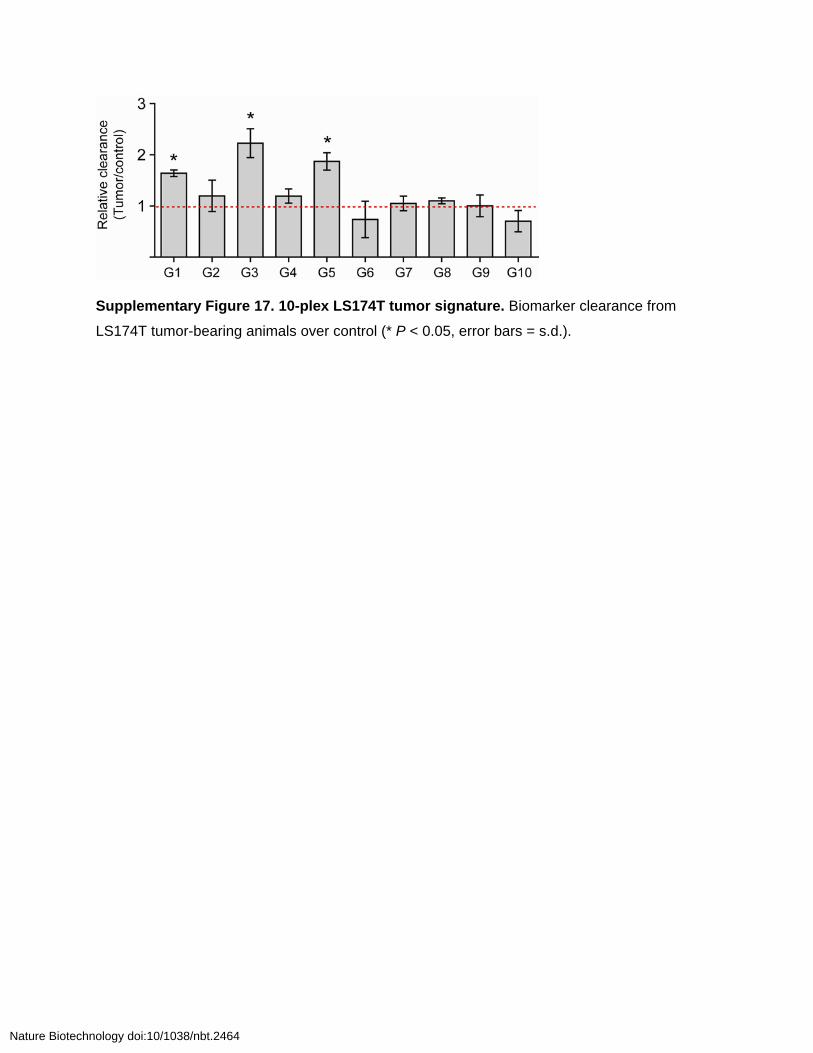
Supplementary Figure 17. 10-plex LS174T tumor signature. Biomarker clearance from
LS174T tumor-bearing animals over control (* P < 0.05, error bars = s.d.).
Nature Biotechnology doi:10/1038/nbt.2464
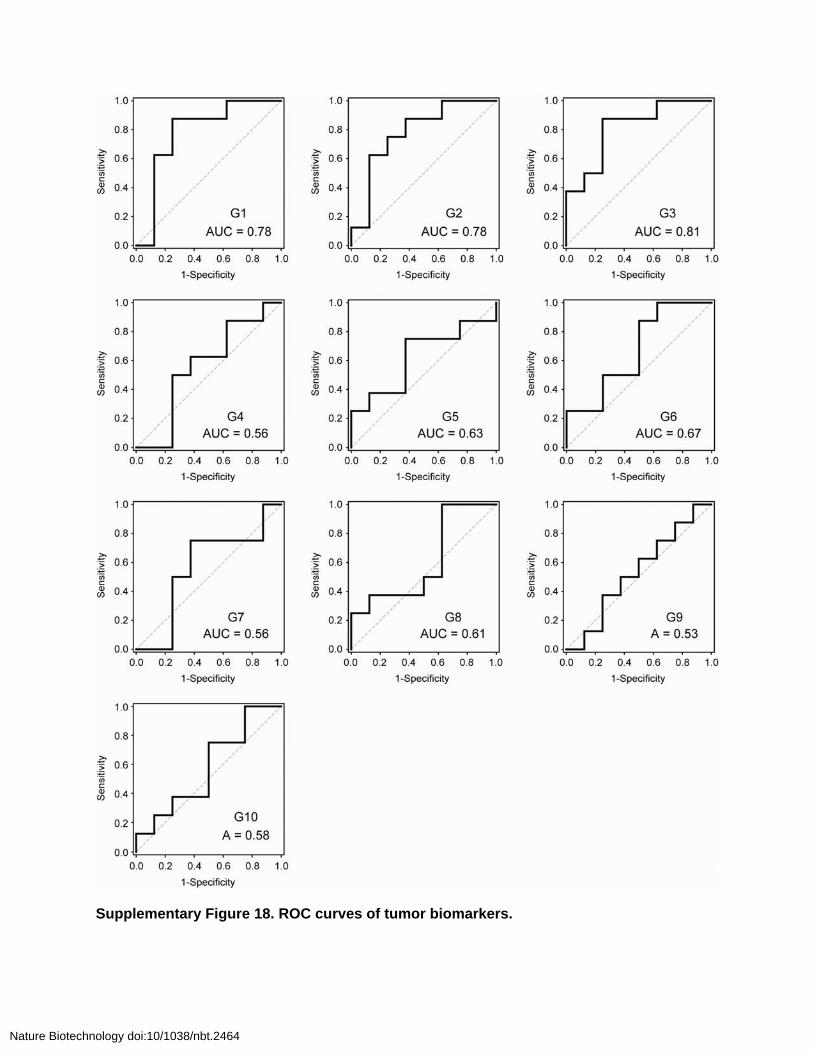
Supplementary Figure 18. ROC curves of tumor biomarkers.
Nature Biotechnology doi:10/1038/nbt.2464

Supplementary Figure 19. Biomarker panels increase detection sensitivity and specificity
of LS174T tumors. The collective area-under-curves (AUC) of the best single (G1, blue),
double (G1+G2, green) and triple (G1+G2+G3, red) biomarker combinations.
Nature Biotechnology doi:10/1038/nbt.2464