Embed Size (px)
Citation preview
Mass Spectrometric Analysis of Protein Complexes Isolated from Rhodopseudomonas palustris
Gregory B. Hurst1, Nathan C. VerBerkmoes3, Trish K. Lankford2,Dale A. Pelletier2, Frank W. Larimer2, Robert L. Hettich1,
Michelle V. Buchanan1, Michael B. Strader1, Yisong Wang2,Linda J. Foote2, Stephen J. Kennel2
1Chemical Sciences Division and 2Life Sciences DivisionOak Ridge National Laboratory
3Genome Science and Technology Graduate SchoolUniversity of Tennessee
Overview
Initial target proteins in Rhodopseudomonas palustrishave been expressed as fusions with affinity labels to enable isolation of protein complexes.
The GroELS and nitrogenase complexes have been affinity-isolated and characterized by MS.
The 70S ribosome from R. palustris has been isolated biochemically, and its subunits characterized by “bottom-up” and “top-down” MS.
Introduction
The bacterial species Rhodopseudomonas palustrisoccurs widely in the environment survives in a variety of conditions
light / darkaerobic / anaerobic
This species thus has the potential to express markedly different complements of proteins and protein complexes under different growth conditions.
As part of a center funded by the U.S. Department of Energy Genomes To Life program [1], we are analyzing protein complexes from R. palustris by expressing target proteins as fusions with affinity tags to allow subsequent isolation of other proteins associated with the target [2], followed by both “top-down” and “bottom-up” mass spectrometry analysis [3]. For comparison, we have isolated the 70S ribosome from R. palustris and analyzed by mass spectrometry.

Methods
Selected R. palustris genes were cloned with affinity tags and expressed in both E. coli and R. palustris using modified pDEST vectors (Invitrogen).
His6, His6-V5 epitope, and GST affinity tagsN- and C-terminal positions
Isolation of fusion proteins affinity purification with Ni-NTA, anti-V5 antibody, or glutathione-bearing agarosebeadsExpression confirmed using 1-D PAGE and western blots.
Isolation of 70S ribosomeSucrose density gradient fractionation [4]
“Shotgun” analysis: analysis by mass spectrometry without prior gel separation [5]“top-down” (with FTICR MS) “bottom-up”
trypsin digestionReverse-phase HPLC separation online with electrospray/quadrupole ion trap MS-MS Protein ID’s: tandem mass spectral data with sequence database using Sequest .
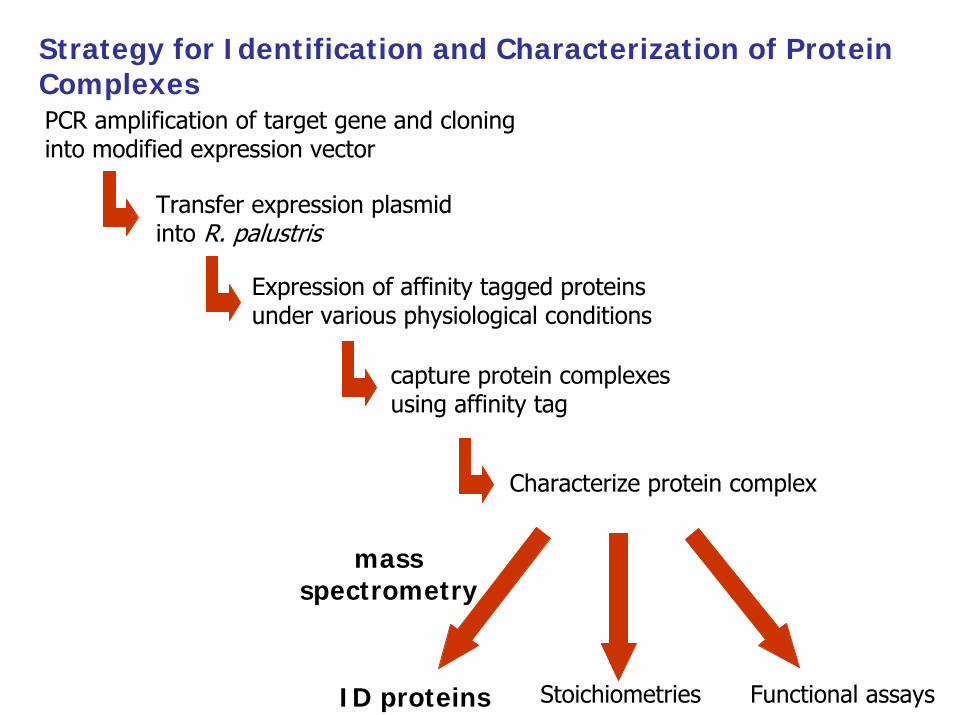
Strategy for Identification and Characterization of Protein ComplexesPCR amplification of target gene and cloning into modified expression vector
Transfer expression plasmid into R. palustris
Expression of affinity tagged proteins under various physiological conditions
capture protein complexesusing affinity tag
Characterize protein complex
ID proteins Stoichiometries Functional assays
massspectrometry
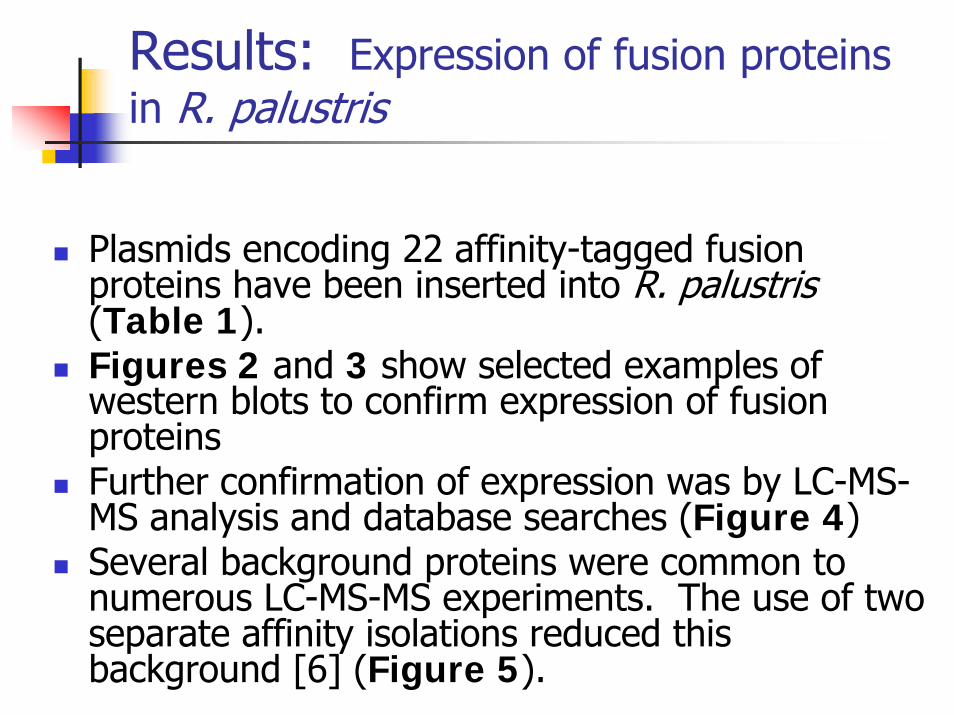
Results: Expression of fusion proteins in R. palustris
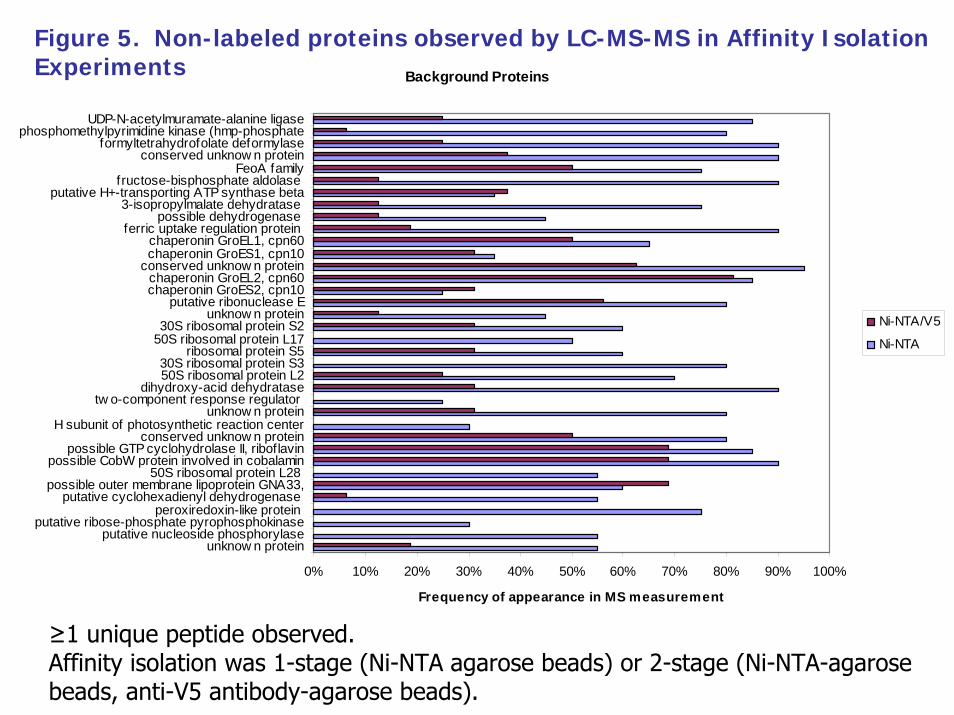
Plasmids encoding 22 affinity-tagged fusion proteins have been inserted into R. palustris(Table 1). Figures 2 and 3 show selected examples of western blots to confirm expression of fusion proteinsFurther confirmation of expression was by LC-MS-MS analysis and database searches (Figure 4)Several background proteins were common to numerous LC-MS-MS experiments. The use of two separate affinity isolations reduced this background [6] (Figure 5).
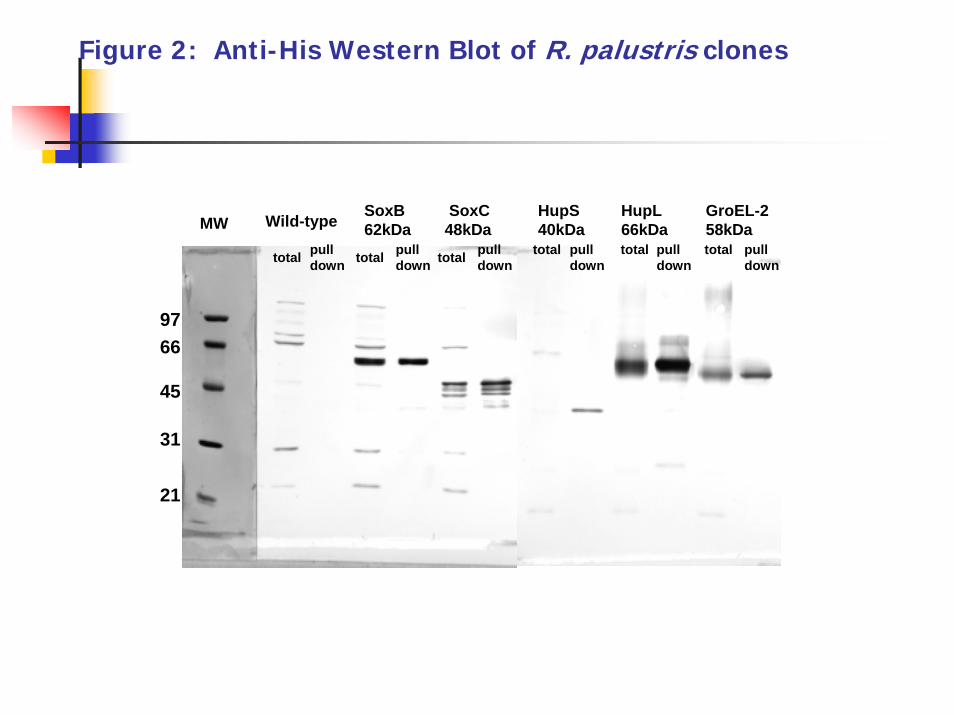
Figure 2: Anti-His Western Blot of R. palustris clones
9766
45
31
21
total pulldown total pull
down total pulldown
total pulldown
total pulldown
total pulldown
SoxB62kDa
SoxC48kDa
HupS40kDa
HupL66kDa
GroEL-258kDaWild-typeMW

Figure 3: Anti-V5 Western Blot of R. palustris clones
SoxB62kDa
SoxC48kDa
HupS40kDa
HupL66kDa
GroEL-258kDaWild-typeMW
9766
45
31
21
total pulldown
total pulldown
total pulldown
total pulldown
total pulldown
total pulldown
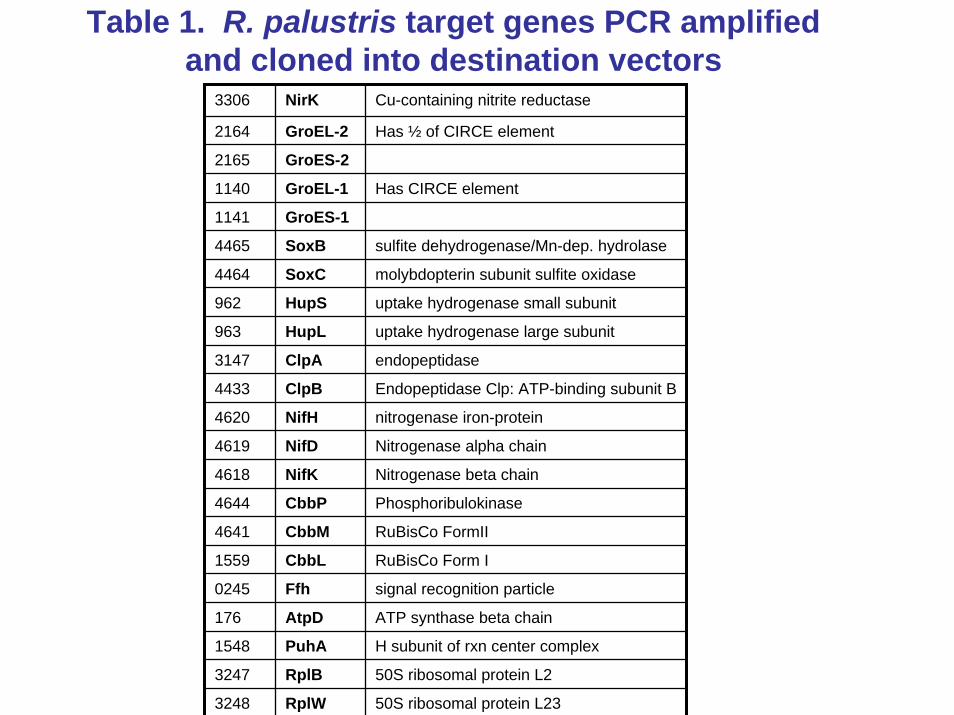
Table 1. R. palustris target genes PCR amplified and cloned into destination vectors
3306 NirK Cu-containing nitrite reductase
2164 GroEL-2 Has ½ of CIRCE element
2165 GroES-2
1140 GroEL-1 Has CIRCE element
1141 GroES-1
4465 SoxB sulfite dehydrogenase/Mn-dep. hydrolase
4464 SoxC molybdopterin subunit sulfite oxidase
962 HupS uptake hydrogenase small subunit
963 HupL uptake hydrogenase large subunit
3147 ClpA endopeptidase
4433 ClpB Endopeptidase Clp: ATP-binding subunit B
4619 NifD Nitrogenase alpha chain
4618 NifK Nitrogenase beta chain
4644 CbbP Phosphoribulokinase
1559 CbbL RuBisCo Form I
4620 NifH nitrogenase iron-protein
4641 CbbM RuBisCo FormII
0245 Ffh signal recognition particle
176 AtpD ATP synthase beta chain
1548 PuhA H subunit of rxn center complex
3247 RplB 50S ribosomal protein L2
3248 RplW 50S ribosomal protein L23
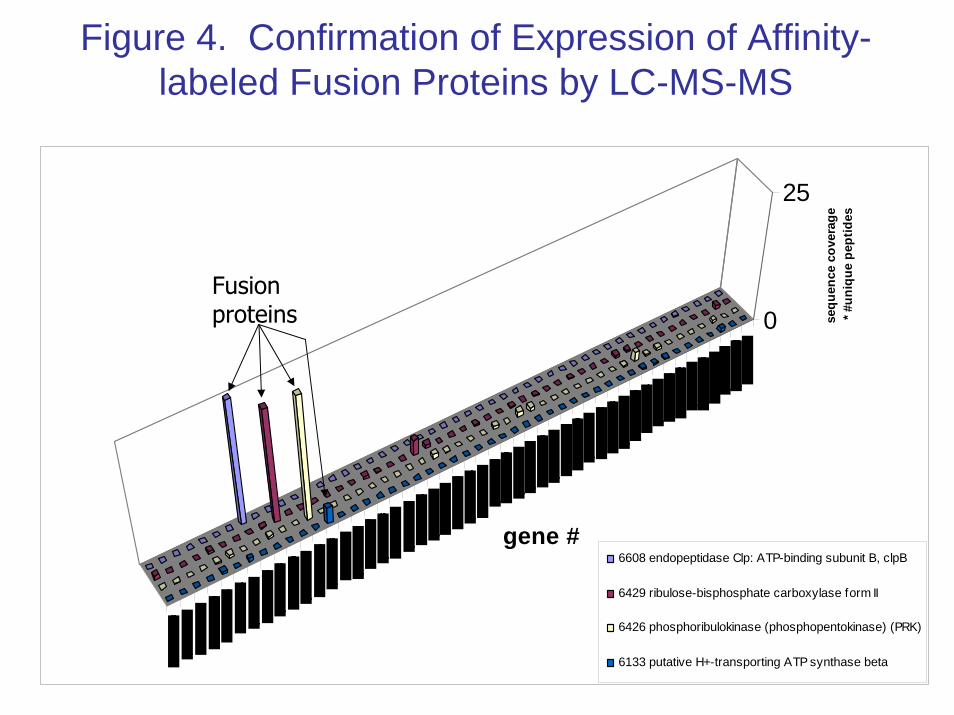
Figure 4. Confirmation of Expression of Affinity-labeled Fusion Proteins by LC-MS-MS
0
25
sequ
ence
cov
erag
e * #
uniq
ue p
eptid
es
gene #6608 endopeptidase Clp: ATP-binding subunit B, clpB
6429 ribulose-bisphosphate carboxylase form II
6426 phosphoribulokinase (phosphopentokinase) (PRK)
6133 putative H+-transporting ATP synthase beta
Fusionproteins
Background Proteins
0% 10% 20% 30% 40% 50% 60% 70% 80% 90% 100%
unknow n proteinputative nucleoside phosphorylase
putative ribose-phosphate pyrophosphokinaseperoxiredoxin-like protein
putative cyclohexadienyl dehydrogenase possible outer membrane lipoprotein GNA33,
50S ribosomal protein L28 possible CobW protein involved in cobalamin
possible GTP cyclohydrolase II, riboflavinconserved unknow n protein
H subunit of photosynthetic reaction centerunknow n protein
tw o-component response regulator dihydroxy-acid dehydratase
50S ribosomal protein L230S ribosomal protein S3
ribosomal protein S550S ribosomal protein L1730S ribosomal protein S2
unknow n proteinputative ribonuclease E
chaperonin GroES2, cpn10chaperonin GroEL2, cpn60
conserved unknow n proteinchaperonin GroES1, cpn10chaperonin GroEL1, cpn60
ferric uptake regulation protein possible dehydrogenase
3-isopropylmalate dehydratase putative H+-transporting ATP synthase beta
fructose-bisphosphate aldolase FeoA family
conserved unknow n proteinformyltetrahydrofolate deformylase
phosphomethylpyrimidine kinase (hmp-phosphateUDP-N-acetylmuramate-alanine ligase
Frequency of appearance in MS measurement
Ni-NTA/V5
Ni-NTA
Figure 5. Non-labeled proteins observed by LC-MS-MS in Affinity IsolationExperiments
≥1 unique peptide observed. Affinity isolation was 1-stage (Ni-NTA agarose beads) or 2-stage (Ni-NTA-agarosebeads, anti-V5 antibody-agarose beads).

ResultsIsolation of GroELS complex
Most fusion proteins expressed to date in R. palustrisare not normally produced under the growth conditions used.
GroEL is an exception.
C-terminally His6 tagged GroEL-2 was expressed and isolated using an ATP-containing buffer in order to stabilize the GroEL-GroES interaction.
LC-MS-MS analysis of the digested isolate allowed identification of components of both versions of the GroELS chaperonin complex (Table 2).
ESI-FTICR-MS of the undigested complex shows the His6 tagged GroEL-2 and the native GroEL-1 (Figure 6).

Table 2. GroELS Complex ID
Locus Protein Name
distinct peptide
ID's
Peptides unique to protein
Sequence Coverage
RPA2165 GroES2 7 7 58%
RPA2164 GroEL2 + HIS6 48 44 76%
RPA1141 GroES1 2 2 32%
RPA1140 GroEL1 29 25 64%
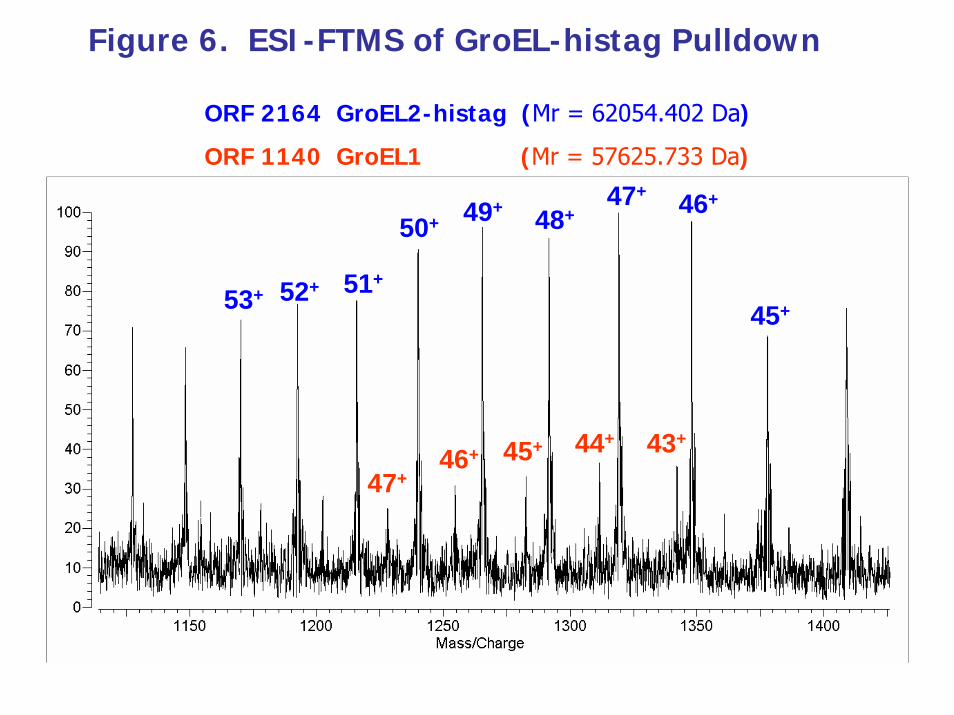
Figure 6. ESI-FTMS of GroEL-histag Pulldown
ORF 2164 GroEL2-histag (Mr = 62054.402 Da)
ORF 1140 GroEL1 (Mr = 57625.733 Da)
53+ 52+ 51+
50+ 49+ 48+47+ 46+
45+
47+46+ 45+ 44+ 43+
ResultsIsolation of Nitrogenase complex
Three proteins in a nitrogenase complex (NifD, NifH, NifK) were each cloned with both His6 and V5 epitope tags, expressed under photoheterotrophic, nitrogen-fixing conditions, and isolated.LC-MS-MS analysis of the isolate from each labeled component showed evidence for all three components of the nitrogenase complex (Figure 7).

Figure 7. Nitrogenase Complex 6xHis, V5 tandem purification
photoheterotrophic nitrogen fixing R.palustris
nifKnifH
0
25
sequ
ence
co
vera
ge *
#uni
que
pept
ides
gene #
nifKnifDnifHwild type
Nitrogenase components
Arrows indicate affinity-labeled protein
Analysis of the 70S Ribosome
from R. palustris [4]
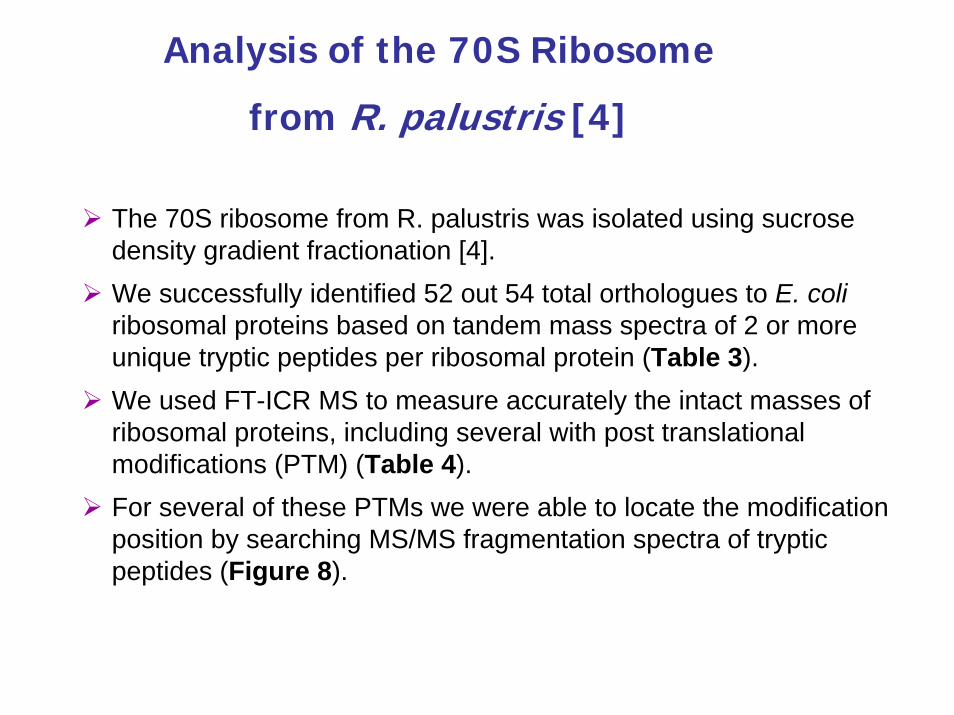
The 70S ribosome from R. palustris was isolated using sucrose density gradient fractionation [4].We successfully identified 52 out 54 total orthologues to E. coli ribosomal proteins based on tandem mass spectra of 2 or more unique tryptic peptides per ribosomal protein (Table 3). We used FT-ICR MS to measure accurately the intact masses of ribosomal proteins, including several with post translational modifications (PTM) (Table 4).For several of these PTMs we were able to locate the modification position by searching MS/MS fragmentation spectra of tryptic peptides (Figure 8).
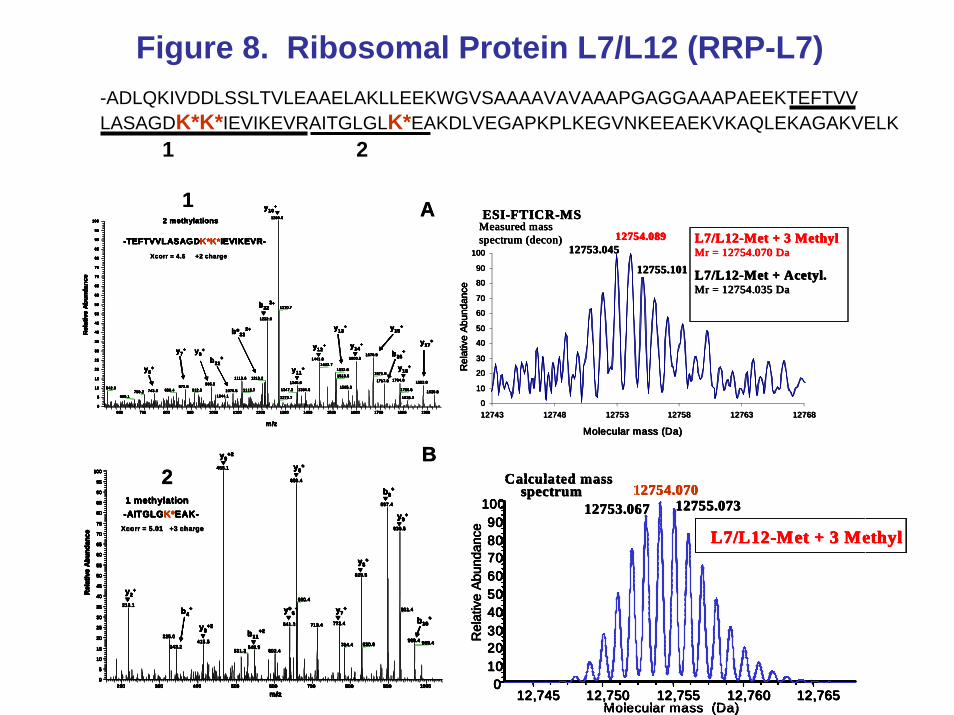
Figure 8. Ribosomal Protein L7/L12 (RRP-L7)-ADLQKIVDDLSSLTVLEAAELAKLLEEKWGVSAAAAVAVAAAPGAGGAAAPAEEKTEFTVVLASAGDK*K*IEVIKEVRAITGLGLK*EAKDLVEGAPKPLKEGVNKEEAEKVKAQLEKAGAKVELK
1 2
600 700 800 900 1000 1100 1200 1300 1400 1500 1600 1700 1800 19000
5
10
15
20
25
30
35
40
45
50
55
60
65
70
75
80
85
90
95
1001269.6
1270.7
1222.0
1670.91600.81441.8
1442.71512.6
1671.81513.81213.21113.6 1784.01717.8 1883.01348.6985.5
872.6 1565.3542.0 1384.81347.3 1786.81115.7912.3836.4 1076.5743.5700.2 1929.81044.1659.1 1272.7 1816.2
y10+
m/z
Rel
ativ
e A
bund
ance
y6+
y7+
b*222+
b11+
b222+
y12+
y11+
y13+
y14+
y15+
y17+
y16+
b16+y8
+
-TEFTVVLASAGDK*K*IEVIKEVR-
2 methylations
Xcorr = 4.6 +2 charge
600 700 800 900 1000 1100 1200 1300 1400 1500 1600 1700 1800 19000
5
10
15
20
25
30
35
40
45
50
55
60
65
70
75
80
85
90
95
1001269.6
1270.7
1222.0
1670.91600.81441.8
1442.71512.6
1671.81513.81213.21113.6 1784.01717.8 1883.01348.6985.5
872.6 1565.3542.0 1384.81347.3 1786.81115.7912.3836.4 1076.5743.5700.2 1929.81044.1659.1 1272.7 1816.2
y10+
m/z
Rel
ativ
e A
bund
ance
y6+
y7+
b*222+
b11+
b222+
y12+
y11+
y13+
y14+
y15+
y17+
y16+
b16+y8
+
-TEFTVVLASAGDK*K*IEVIKEVR-
2 methylations
600 700 800 900 1000 1100 1200 1300 1400 1500 1600 1700 1800 19000
5
10
15
20
25
30
35
40
45
50
55
60
65
70
75
80
85
90
95
1001269.6
1270.7
1222.0
1670.91600.81441.8
1442.71512.6
1671.81513.81213.21113.6 1784.01717.8 1883.01348.6985.5
872.6 1565.3542.0 1384.81347.3 1786.81115.7912.3836.4 1076.5743.5700.2 1929.81044.1659.1 1272.7 1816.2
y10+
m/z
Rel
ativ
e A
bund
ance
y6+
y7+
b*222+
b11+
b222+
y12+
y11+
y13+
y14+
y15+
y17+
y16+
b16+y8
+
-TEFTVVLASAGDK*K*IEVIKEVR-
600 700 800 900 1000 1100 1200 1300 1400 1500 1600 1700 1800 19000
5
10
15
20
25
30
35
40
45
50
55
60
65
70
75
80
85
90
95
1001269.6
1270.7
1222.0
1670.91600.81441.8
1442.71512.6
1671.81513.81213.21113.6 1784.01717.8 1883.01348.6985.5
872.6 1565.3542.0 1384.81347.3 1786.81115.7912.3836.4 1076.5743.5700.2 1929.81044.1659.1 1272.7 1816.2
y10+
m/z
Rel
ativ
e A
bund
ance
y6+
y7+
b*222+
b11+
b222+
y12+
y11+
y13+
y14+
y15+
y17+
y16+
b16+
600 700 800 900 1000 1100 1200 1300 1400 1500 1600 1700 1800 19000
5
10
15
20
25
30
35
40
45
50
55
60
65
70
75
80
85
90
95
1001269.6
1270.7
1222.0
1670.91600.81441.8
1442.71512.6
1671.81513.81213.21113.6 1784.01717.8 1883.01348.6985.5
872.6 1565.3542.0 1384.81347.3 1786.81115.7912.3836.4 1076.5743.5700.2 1929.81044.1659.1 1272.7 1816.2
600 700 800 900 1000 1100 1200 1300 1400 1500 1600 1700 1800 19000
5
10
15
20
25
30
35
40
45
600 700 800 900 1000 1100 1200 1300 1400 1500 1600 1700 1800 19000
5
10
15
20
25
30
35
40
45
50
55
60
65
70
75
80
85
90
95
100
50
55
60
65
70
75
80
85
90
95
1001269.6
1270.7
1222.0
1670.91600.81441.8
1442.71512.6
1671.81513.81213.21113.6 1784.01717.8 1883.01348.6985.5
872.6 1565.3542.0 1384.81347.3 1786.81115.7912.3836.4 1076.5743.5700.2 1929.81044.1659.1 1272.7 1816.2
y10+
m/z
Rel
ativ
e A
bund
ance
y6+
y7+
b*222+
b11+
b222+
y12+
y11+
y13+
y14+
y15+
y17+
y16+
b16+y8
+
-TEFTVVLASAGDK*K*IEVIKEVR-
2 methylations
Xcorr = 4.6 +2 charge
200 300 400 500 600 700 800 900 1000
m/z
0
5
10
15
20
25
30
35
40
45
50
55
60
65
70
75
80
85
90
95
100466.1
659.4
897.4
930.5
829.5
660.4218.1
931.4
772.4641.3 713.4
325.0968.4415.5 969.4830.6784.4343.2 548.9
531.3 602.4
Rel
ativ
e A
bund
ance
y9+2
y6+
y8+2
y2+
y*6+ y7
+
y8+
b9+
b11+2
b4+
b10+
y9+-AITGLGK*EAK-
1 methylation
Xcorr = 5.01 +3 charge
200 300 400 500 600 700 800 900 1000
m/z
0
5
10
15
20
25
30
35
40
45
50
55
60
65
70
75
80
85
90
95
100466.1
659.4
897.4
930.5
829.5
660.4218.1
931.4
772.4641.3 713.4
325.0968.4415.5 969.4830.6784.4343.2 548.9
531.3 602.4
Rel
ativ
e A
bund
ance
y9+2
y6+
y8+2
y2+
y*6+ y7
+
y8+
b9+
b11+2
b4+
b10+
y9+-AITGLGK*EAK-
1 methylation
200 300 400 500 600 700 800 900 1000
m/z
0
5
10
15
20
25
30
35
40
45
50
55
60
65
70
75
80
85
90
95
100466.1
659.4
897.4
930.5
829.5
660.4218.1
931.4
772.4641.3 713.4
325.0968.4415.5 969.4830.6784.4343.2 548.9
531.3 602.4
Rel
ativ
e A
bund
ance
y9+2
y6+
y8+2
y2+
y*6+ y7
+
y8+
b9+
b11+2
b4+
b10+
y9+-AITGLGK*EAK-
200 300 400 500 600 700 800 900 1000
m/z
0
5
10
15
20
25
30
35
40
45
50
55
60
65
70
75
80
85
90
95
100466.1
659.4
897.4
930.5
829.5
660.4218.1
931.4
772.4641.3 713.4
325.0968.4415.5 969.4830.6784.4343.2 548.9
531.3 602.4
Rel
ativ
e A
bund
ance
y9+2
y6+
y8+2
y2+
y*6+ y7
+
y8+
b9+
b11+2
b4+
b10+
y9+
200 300 400 500 600 700 800 900 1000
m/z
0
5
10
15
20
25
30
35
40
45
50
55
60
65
70
75
80
85
90
95
100466.1
659.4
897.4
930.5
829.5
660.4218.1
931.4
772.4641.3 713.4
325.0968.4415.5 969.4830.6784.4343.2 548.9
531.3 602.4
200 300 400 500 600 700 800 900 1000
m/z200 300 400 500 600 700 800 900 1000
m/z
0
5
10
15
20
25
30
35
40
45
50
55
60
65
70
75
80
85
90
95
100
0
5
10
15
20
25
30
35
40
45
50
55
60
65
70
75
80
85
90
95
100466.1
659.4
897.4
930.5
829.5
660.4218.1
931.4
772.4641.3 713.4
325.0968.4415.5 969.4830.6784.4343.2 548.9
531.3 602.4
Rel
ativ
e A
bund
ance
y9+2
y6+
y8+2
y2+
y*6+ y7
+
y8+
b9+
b11+2
b4+
b10+
y9+-AITGLGK*EAK-
1 methylation
Xcorr = 5.01 +3 charge
12,76512,76012,75512,75012,745
1009080706050403020100
Calculated massspectrum 12754.070
12755.07312753.067
Molecular mass (Da)
Rel
ativ
e Ab
unda
nce
L7/L12-Met + 3 Methyl
12,76512,76012,75512,75012,745
1009080706050403020100
12,76512,76012,75512,75012,745
1009080706050403020100
Calculated massspectrum 12754.070
12755.07312753.067
Molecular mass (Da)
Rel
ativ
e Ab
unda
nce
L7/L12-Met + 3 Methyl
0
10
20
30
40
50
60
70
80
90
100
12743 12748 12753 12758 12763 12768
ESI-FTICR-MSMeasured mass spectrum (decon) 12754.089
12753.045
12755.101
L7/L12-Met + 3 Methyl Mr = 12754.070 Da
L7/L12-Met + Acetyl. Mr = 12754.035 Da
Molecular mass (Da)
Rel
ativ
e Ab
unda
nce
0
10
20
30
40
50
60
70
80
90
100
12743 12748 12753 12758 12763 12768
ESI-FTICR-MSMeasured mass spectrum (decon) 12754.089
12753.045
12755.101
L7/L12-Met + 3 Methyl Mr = 12754.070 Da
L7/L12-Met + Acetyl. Mr = 12754.035 Da
Molecular mass (Da)
Rel
ativ
e Ab
unda
nce
A
B
1
2
600 700 800 900 1000 1100 1200 1300 1400 1500 1600 1700 1800 19000
5
10
15
20
25
30
35
40
45
50
55
60
65
70
75
80
85
90
95
1001269.6
1270.7
1222.0
1670.91600.81441.8
1442.71512.6
1671.81513.81213.21113.6 1784.01717.8 1883.01348.6985.5
872.6 1565.3542.0 1384.81347.3 1786.81115.7912.3836.4 1076.5743.5700.2 1929.81044.1659.1 1272.7 1816.2
y10+
m/z
Rel
ativ
e A
bund
ance
y6+
y7+
b*222+
b11+
b222+
y12+
y11+
y13+
y14+
y15+
y17+
y16+
b16+y8
+
-TEFTVVLASAGDK*K*IEVIKEVR-
2 methylations
Xcorr = 4.6 +2 charge
600 700 800 900 1000 1100 1200 1300 1400 1500 1600 1700 1800 19000
5
10
15
20
25
30
35
40
45
50
55
60
65
70
75
80
85
90
95
1001269.6
1270.7
1222.0
1670.91600.81441.8
1442.71512.6
1671.81513.81213.21113.6 1784.01717.8 1883.01348.6985.5
872.6 1565.3542.0 1384.81347.3 1786.81115.7912.3836.4 1076.5743.5700.2 1929.81044.1659.1 1272.7 1816.2
y10+
m/z
Rel
ativ
e A
bund
ance
y6+
y7+
b*222+
b11+
b222+
y12+
y11+
y13+
y14+
y15+
y17+
y16+
b16+y8
+
-TEFTVVLASAGDK*K*IEVIKEVR-
2 methylations
600 700 800 900 1000 1100 1200 1300 1400 1500 1600 1700 1800 19000
5
10
15
20
25
30
35
40
45
50
55
60
65
70
75
80
85
90
95
1001269.6
1270.7
1222.0
1670.91600.81441.8
1442.71512.6
1671.81513.81213.21113.6 1784.01717.8 1883.01348.6985.5
872.6 1565.3542.0 1384.81347.3 1786.81115.7912.3836.4 1076.5743.5700.2 1929.81044.1659.1 1272.7 1816.2
y10+
m/z
Rel
ativ
e A
bund
ance
y6+
y7+
b*222+
b11+
b222+
y12+
y11+
y13+
y14+
y15+
y17+
y16+
b16+y8
+
-TEFTVVLASAGDK*K*IEVIKEVR-
600 700 800 900 1000 1100 1200 1300 1400 1500 1600 1700 1800 19000
5
10
15
20
25
30
35
40
45
50
55
60
65
70
75
80
85
90
95
1001269.6
1270.7
1222.0
1670.91600.81441.8
1442.71512.6
1671.81513.81213.21113.6 1784.01717.8 1883.01348.6985.5
872.6 1565.3542.0 1384.81347.3 1786.81115.7912.3836.4 1076.5743.5700.2 1929.81044.1659.1 1272.7 1816.2
y10+
m/z
Rel
ativ
e A
bund
ance
y6+
y7+
b*222+
b11+
b222+
y12+
y11+
y13+
y14+
y15+
y17+
y16+
b16+
600 700 800 900 1000 1100 1200 1300 1400 1500 1600 1700 1800 19000
5
10
15
20
25
30
35
40
45
50
55
60
65
70
75
80
85
90
95
1001269.6
1270.7
1222.0
1670.91600.81441.8
1442.71512.6
1671.81513.81213.21113.6 1784.01717.8 1883.01348.6985.5
872.6 1565.3542.0 1384.81347.3 1786.81115.7912.3836.4 1076.5743.5700.2 1929.81044.1659.1 1272.7 1816.2
600 700 800 900 1000 1100 1200 1300 1400 1500 1600 1700 1800 19000
5
10
15
20
25
30
35
40
45
600 700 800 900 1000 1100 1200 1300 1400 1500 1600 1700 1800 19000
5
10
15
20
25
30
35
40
45
50
55
60
65
70
75
80
85
90
95
100
50
55
60
65
70
75
80
85
90
95
1001269.6
1270.7
1222.0
1670.91600.81441.8
1442.71512.6
1671.81513.81213.21113.6 1784.01717.8 1883.01348.6985.5
872.6 1565.3542.0 1384.81347.3 1786.81115.7912.3836.4 1076.5743.5700.2 1929.81044.1659.1 1272.7 1816.2
y10+
m/z
Rel
ativ
e A
bund
ance
y6+
y7+
b*222+
b11+
b222+
y12+
y11+
y13+
y14+
y15+
y17+
y16+
b16+y8
+
-TEFTVVLASAGDK*K*IEVIKEVR-
2 methylations
Xcorr = 4.6 +2 charge
200 300 400 500 600 700 800 900 1000
m/z
0
5
10
15
20
25
30
35
40
45
50
55
60
65
70
75
80
85
90
95
100466.1
659.4
897.4
930.5
829.5
660.4218.1
931.4
772.4641.3 713.4
325.0968.4415.5 969.4830.6784.4343.2 548.9
531.3 602.4
Rel
ativ
e A
bund
ance
y9+2
y6+
y8+2
y2+
y*6+ y7
+
y8+
b9+
b11+2
b4+
b10+
y9+-AITGLGK*EAK-
1 methylation
Xcorr = 5.01 +3 charge
200 300 400 500 600 700 800 900 1000
m/z
0
5
10
15
20
25
30
35
40
45
50
55
60
65
70
75
80
85
90
95
100466.1
659.4
897.4
930.5
829.5
660.4218.1
931.4
772.4641.3 713.4
325.0968.4415.5 969.4830.6784.4343.2 548.9
531.3 602.4
Rel
ativ
e A
bund
ance
y9+2
y6+
y8+2
y2+
y*6+ y7
+
y8+
b9+
b11+2
b4+
b10+
y9+-AITGLGK*EAK-
1 methylation
200 300 400 500 600 700 800 900 1000
m/z
0
5
10
15
20
25
30
35
40
45
50
55
60
65
70
75
80
85
90
95
100466.1
659.4
897.4
930.5
829.5
660.4218.1
931.4
772.4641.3 713.4
325.0968.4415.5 969.4830.6784.4343.2 548.9
531.3 602.4
Rel
ativ
e A
bund
ance
y9+2
y6+
y8+2
y2+
y*6+ y7
+
y8+
b9+
b11+2
b4+
b10+
y9+-AITGLGK*EAK-
200 300 400 500 600 700 800 900 1000
m/z
0
5
10
15
20
25
30
35
40
45
50
55
60
65
70
75
80
85
90
95
100466.1
659.4
897.4
930.5
829.5
660.4218.1
931.4
772.4641.3 713.4
325.0968.4415.5 969.4830.6784.4343.2 548.9
531.3 602.4
Rel
ativ
e A
bund
ance
y9+2
y6+
y8+2
y2+
y*6+ y7
+
y8+
b9+
b11+2
b4+
b10+
y9+
200 300 400 500 600 700 800 900 1000
m/z
0
5
10
15
20
25
30
35
40
45
50
55
60
65
70
75
80
85
90
95
100466.1
659.4
897.4
930.5
829.5
660.4218.1
931.4
772.4641.3 713.4
325.0968.4415.5 969.4830.6784.4343.2 548.9
531.3 602.4
200 300 400 500 600 700 800 900 1000
m/z200 300 400 500 600 700 800 900 1000
m/z
0
5
10
15
20
25
30
35
40
45
50
55
60
65
70
75
80
85
90
95
100
0
5
10
15
20
25
30
35
40
45
50
55
60
65
70
75
80
85
90
95
100466.1
659.4
897.4
930.5
829.5
660.4218.1
931.4
772.4641.3 713.4
325.0968.4415.5 969.4830.6784.4343.2 548.9
531.3 602.4
Rel
ativ
e A
bund
ance
y9+2
y6+
y8+2
y2+
y*6+ y7
+
y8+
b9+
b11+2
b4+
b10+
y9+-AITGLGK*EAK-
1 methylation
Xcorr = 5.01 +3 charge
12,76512,76012,75512,75012,745
1009080706050403020100
Calculated massspectrum 12754.070
12755.07312753.067
Molecular mass (Da)
Rel
ativ
e Ab
unda
nce
L7/L12-Met + 3 Methyl
12,76512,76012,75512,75012,745
1009080706050403020100
12,76512,76012,75512,75012,745
1009080706050403020100
Calculated massspectrum 12754.070
12755.07312753.067
Molecular mass (Da)
Rel
ativ
e Ab
unda
nce
L7/L12-Met + 3 Methyl
0
10
20
30
40
50
60
70
80
90
100
12743 12748 12753 12758 12763 12768
ESI-FTICR-MSMeasured mass spectrum (decon) 12754.089
12753.045
12755.101
L7/L12-Met + 3 Methyl Mr = 12754.070 Da
L7/L12-Met + Acetyl. Mr = 12754.035 Da
Molecular mass (Da)
Rel
ativ
e Ab
unda
nce
0
10
20
30
40
50
60
70
80
90
100
12743 12748 12753 12758 12763 12768
ESI-FTICR-MSMeasured mass spectrum (decon) 12754.089
12753.045
12755.101
L7/L12-Met + 3 Methyl Mr = 12754.070 Da
L7/L12-Met + Acetyl. Mr = 12754.035 Da
Molecular mass (Da)
Rel
ativ
e Ab
unda
nce
A
B
1
2
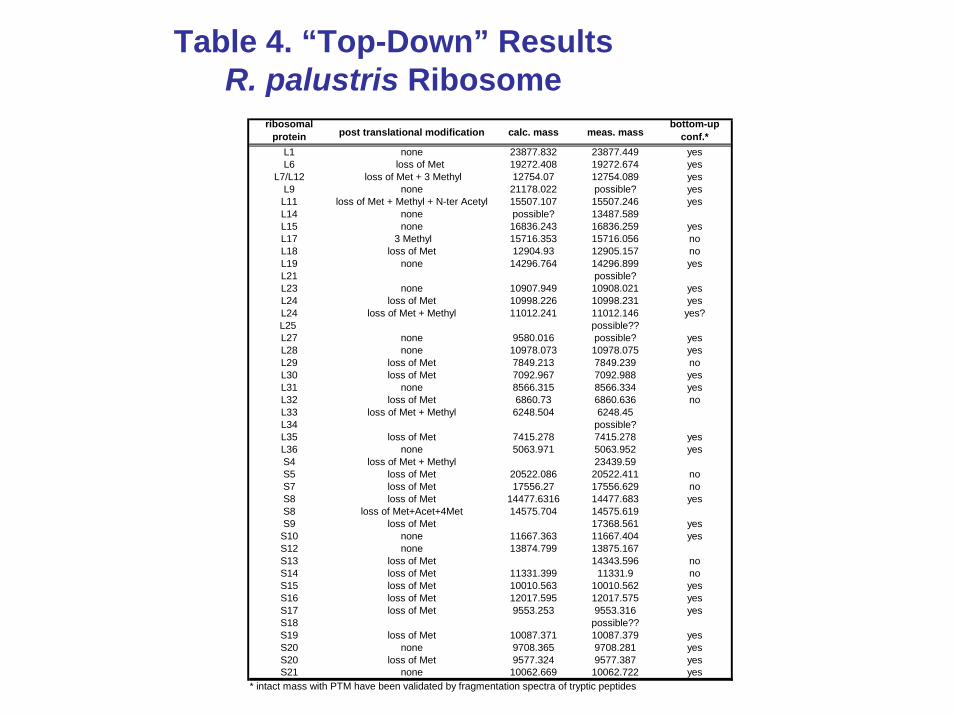
Table 4. “Top-Down” ResultsR. palustris Ribosome
ribosomal protein post translational modification calc. mass meas. mass
bottom-up conf.*
L1 none 23877.832 23877.449 yesL6 loss of Met 19272.408 19272.674 yes
L7/L12 loss of Met + 3 Methyl 12754.07 12754.089 yesL9 none 21178.022 possible? yes
L11 loss of Met + Methyl + N-ter Acetyl 15507.107 15507.246 yesL14 none possible? 13487.589L15 none 16836.243 16836.259 yesL17 3 Methyl 15716.353 15716.056 noL18 loss of Met 12904.93 12905.157 noL19 none 14296.764 14296.899 yesL21 possible?L23 none 10907.949 10908.021 yesL24 loss of Met 10998.226 10998.231 yesL24 loss of Met + Methyl 11012.241 11012.146 yes?L25 possible??L27 none 9580.016 possible? yesL28 none 10978.073 10978.075 yesL29 loss of Met 7849.213 7849.239 noL30 loss of Met 7092.967 7092.988 yesL31 none 8566.315 8566.334 yesL32 loss of Met 6860.73 6860.636 noL33 loss of Met + Methyl 6248.504 6248.45L34 possible?L35 loss of Met 7415.278 7415.278 yesL36 none 5063.971 5063.952 yesS4 loss of Met + Methyl 23439.59S5 loss of Met 20522.086 20522.411 noS7 loss of Met 17556.27 17556.629 noS8 loss of Met 14477.6316 14477.683 yesS8 loss of Met+Acet+4Met 14575.704 14575.619S9 loss of Met 17368.561 yes
S10 none 11667.363 11667.404 yesS12 none 13874.799 13875.167S13 loss of Met 14343.596 noS14 loss of Met 11331.399 11331.9 noS15 loss of Met 10010.563 10010.562 yesS16 loss of Met 12017.595 12017.575 yesS17 loss of Met 9553.253 9553.316 yesS18 possible??S19 loss of Met 10087.371 10087.379 yesS20 none 9708.365 9708.281 yesS20 loss of Met 9577.324 9577.387 yesS21 none 10062.669 10062.722 yes
* intact mass with PTM have been validated by fragmentation spectra of tryptic peptides
Conclusions
Fusion proteins with affinity tags can be expressed in R. palustris
The GroELS and nitrogenase complexes were isolated using affinity-labeled subunits.
The 70S ribosome was analyzed in detail using “bottom-up” and “top-down” methods, verifying expected post-translational modifications.
We are implementing higher-throughput production and analysis of fusion proteins in R. palustris.
References
1. http://www.genomestolife.org
2. (a) Gavin, A.-C. et al., "Functional organization of the yeast proteome by systematic analysis of protein complexes," Nature 2002, 415, 141-147.
(b) Ho, Y. et al., "Systematic identification of protein complexes in Saccharomyces cerevisiae by mass spectrometry," Nature 2002, 415, 180-183.
3. Verberkmoes, N.C., et al., “Integrating “top-down” and “bottom-up” mass spectrometric approaches for proteomic analysis of Shewanella oneidensis,” J. Proteome Res. 2002, 1, 239-252.
4. Strader, M.B., et al., “Analysis of the 70S ribosome from Rhodopseudomonas palustris using integrated top-down and bottom-up mass spectrometric approaches.” Sixth International Symposium on Mass Spectrometry in the Health and Life Sciences: Molecular and Cellular Proteomics, San Francisco, CA, Aug. 24-28, 2003.
5. Link, A.J. et al., "Direct analysis of protein complexes using mass spectrometry," Nature Biotech. 1999, 17, 676-682.
6. Puig, O. et al., "The tandem affinity purification (TAP) method: a general procedure of protein complex purification," Methods 2001, 24, 218-229.
Acknowledgements
This research sponsored by the Office of Biological and Environmental Research, U.S. Department of Energy. Oak Ridge National Laboratory is managed by UT-Battelle, LLC, for the U.S. Department of Energy under Contract No. DE-AC05-00OR22725.