Embed Size (px)
Citation preview
RESEARCH Open Access
Mass-spectrometric profiling ofcerebrospinal fluid reveals metabolitebiomarkers for CNS involvement in varicellazoster virus reactivationMaike Kuhn1,2,3†, Kurt-Wolfram Sühs4†, Manas K. Akmatov1,2,3, Frank Klawonn2,5, Junxi Wang2, Thomas Skripuletz4,Volkhard Kaever6, Martin Stangel3,4,7*† and Frank Pessler1,2,3*†
Abstract
Background: Varicella zoster virus (VZV) reactivation spans the spectrum from uncomplicated segmental herpeszoster to life-threatening disseminated CNS infection. Moreover, in the absence of a small animal model for thishuman pathogen, studies of pathogenesis at the organismal level depend on analysis of human biosamples.Changes in cerebrospinal fluid (CSF) metabolites may reflect critical aspects of host responses and end-organdamage in neuroinfection and neuroinflammation. We therefore applied a targeted metabolomics screen of CSF tothree clinically distinct forms of VZV reactivation and infectious and non-infectious disease controls in order toidentify biomarkers for CNS involvement in VZV reactivation.
Methods: Metabolite profiles were determined by targeted liquid chromatography-mass spectrometry in CSF frompatients with segmental zoster (shingles, n = 14), facial nerve zoster (n = 16), VZV meningitis/encephalitis (n = 15),enteroviral meningitis (n = 10), idiopathic Bell’s palsy (n = 11), and normal pressure hydrocephalus (n = 15).
Results: Concentrations of 88 metabolites passing quality assessment clearly separated the three VZV reactivationforms from each other and from the non-infected samples. Internal cross-validation identified four metabolites(SM C16:1, glycine, lysoPC a C26:1, PC ae C34:0) that were particularly associated with VZV meningoencephalitis.SM(OH) C14:1 accurately distinguished facial nerve zoster from Bell’s palsy. Random forest construction revealedeven more accurate classifiers (signatures comprising 2–4 metabolites) for most comparisons. Some of the mostaccurate biomarkers correlated only weakly with CSF leukocyte count, indicating that they do not merely reflectrecruitment of inflammatory cells but, rather, specific pathophysiological mechanisms. Across all samples, only thesum of hexoses and the amino acids arginine, serine, and tryptophan correlated negatively with leukocyte count.Increased expression of the metabolites associated with VZV meningoencephalitis could be linked to processesrelating to neuroinflammation/immune activation, neuronal signaling, and cell stress, turnover, and death (e.g.,autophagy and apoptosis), suggesting that these metabolites might sense processes relating to end-organdamage.(Continued on next page)
* Correspondence: [email protected];[email protected]†Equal contributors3Centre for Individualized Infection Medicine, Feodor-Lynen-Str. 15, 30625Hannover, Germany1TWINCORE Centre for Experimental and Clinical Infection Research GmbH,Feodor-Lynen-Str. 7, 30625 Hannover, GermanyFull list of author information is available at the end of the article
© The Author(s). 2018 Open Access This article is distributed under the terms of the Creative Commons Attribution 4.0International License (http://creativecommons.org/licenses/by/4.0/), which permits unrestricted use, distribution, andreproduction in any medium, provided you give appropriate credit to the original author(s) and the source, provide a link tothe Creative Commons license, and indicate if changes were made. The Creative Commons Public Domain Dedication waiver(http://creativecommons.org/publicdomain/zero/1.0/) applies to the data made available in this article, unless otherwise stated.
Kuhn et al. Journal of Neuroinflammation (2018) 15:20 DOI 10.1186/s12974-017-1041-0
(Continued from previous page)
Conclusions: The results provide proof-of-concept for the value of CSF metabolites as (1) disease-associatedsignatures suggesting pathophysiological mechanisms, (2) degree and nature of neuroinflammation, and (3)biomarkers for diagnosis and risk stratification of VZV reactivation and, likely, neuroinfections due to otherpathogens.
Trial registration: Not applicable (non-interventional study).
Keywords: Amino acid, Biomarker, Cerebrospinal fluid, CNS infections, Encephalitis, Herpes zoster, Metabolomics,Phosphatidylcholine, Sphingolipid, Varicella zoster virus
BackgroundVaricella zoster virus (VZV; termed human alphaherpes-virus 3 by the International Committee on Taxonomy ofViruses) is the causative agent of chicken pox. After thisprimary infection or immunization with attenuated VZV,latent viral reservoirs persist in neuronal ganglia along theneuraxis, and upon reactivation, the virus spreads along thenervous system. The lifetime risk of reactivation is 20–30%but increases with age or immunosuppression, presumablydue to waning T cell immunity [1, 2]. Even though viro-static treatments are available, the clinical presentation ofVZV reactivation spans the spectrum from uncomplicatedherpes zoster (shingles), over involvement of cranial nerves,to a life-threatening meningoencephalitis. Complicationsinclude vasculitis, increased risk of myocardial infarction,or post-herpetic neuralgia, which affects up to 20% of allpatients [3], and the overall mortality of VZV reactivationin the USA is nearly 5% [4]. Considering this widespectrum of clinical severity and complications, there is agreat need for biomarkers that would aid in early diagnosis,risk stratification, and outcome prediction and that wouldhelp to elucidate the mechanisms of clinical variability.If VZV reactivation is suspected based on clinical
examination, current diagnostics include serology, PCR,and culture. The value of VZV culture is limited due tothe low sensitivity of around 45% [5]. VZV PCR has ahigh specificity (>95%) and sensitivity (80–95%) [6], butCSF viral load does not correlate well with outcome [7,8]. Its usefulness may also be limited at early stages ofdisease, as PCR turns negative within about 1–3 weeksof detectable infection or reactivation. Antibodies arenot detected up to two weeks after acute infection andcan persist in humans after initial infection [9]. In termsof pathogen-independent CSF parameters, pleocytosis isusually present in VZV reactivation affecting the CNS[10] but can be absent especially in immunocomprom-ised patients [11] or complications such as VZV vascu-lopathy [12]. With respect to experimental markers,increased CSF concentrations of neurofilament proteinand glial fibrillary acidic protein were recently describedin VZV-infected patients with facial palsy, indicatingneuronal damage and astrogliosis, but their levels didnot correlate with outcome [13, 14].
As demonstrated in recent studies on neurodegen-erative disorders (e.g., Alzheimer’s disease, amyo-trophic lateral sclerosis, and multiple sclerosis),metabolomic and/or lipidomic profiling of CSF hasconsiderable potential for identifying biomarker can-didates and suggesting disease-associated metabolicnetworks, also in the context of neuroinflammation[15–19]. The work on HIV-associated neurocognitivedisorder revealed that CSF lipid profiles correlatewith increasing severity of neurocognitive pathologyin HIV-positive humans and simian immunodefi-ciency virus-infected macaques [20, 21], suggestingthat CSF metabolomics could be successfully appliedto neuropathology associated with an infectious dis-ease. Despite these encouraging results and the well-documented observations that altered CNS glucoseand lactate concentrations are associated with certaintypes of CNS infections, thus far, only three studies(all focusing on glucose metabolism) have appliedsmall molecule profiling to discover CSF biomarkersfor neuroinfections [22–24]. These studies used nu-clear magnetic resonance spectroscopy and positronemission tomography/computed tomography andwere therefore limited to the detection of relativelyabundant analytes. A more recent study applied anuntargeted LC-MS approach to analyze CSF in thecontext of the parasitic disease trypanosomiasis andreported 11 CSF metabolites to distinguish amongdisease stages [25].The lack of a small animal model for VZV infection and
reactivation has been impeding studies of its pathogenesis,meaning that such studies at the organismal level dependon analyses of biosamples from well-characterized pa-tients or samples obtained at autopsy. The use of the latteris limited due to well-known artifacts from post-mortemchanges. Considering (1) the successful applications ofCSF metabolite profiling for biomarker discovery in theaforementioned studies and (2) the need for diagnosticand prognostic biomarkers for VZV reactivation and abetter understanding of its pathogenesis including the na-ture of the associated neuroinflammation, we aimed toidentify novel small-molecule CSF signatures and bio-markers for this multifaceted disorder.
Kuhn et al. Journal of Neuroinflammation (2018) 15:20 Page 2 of 15
MethodsStudy populationCSF samples were obtained during initial routine lumbarpuncture, were performed according to standard guide-lines, and were collected prospectively in the context ofthe establishment of a CSF biobank encompassing a var-iety of neurological disorders. The patients whose sampleswere included in the present study were seen between2005 and 2013 for routine neurological evaluation. Thesamples to be analyzed were selected retrospectively in2015. This study was approved by the Ethics Committeeof Hannover Medical School (file no. 2413-2014) and wasconducted according to the Helsinki Declaration. In-formed consent was waived due to the use of anonymizedpatient data. Inclusion criteria for evidence of VZV reacti-vation were either detection of VZV in CSF by PCR, intra-thecal synthesis of VZV IgG, or the typical skin rash.Patients were categorized according to three differentVZV reactivation patterns: (1) segmental zoster (Z.segmental, n = 14; defined by the presence of the typicalcervical, thoracic, or lumbar rash); (2) facial nerve zoster(Z. facial, n = 16; facial nerve palsy with evidence of VZVinfection, six of whom had the typical rash in the facialnerve distribution); and (3) zoster meningitis and/orencephalitis (Z. meningoencephalitis, n = 15; clinicallyconfirmed CNS involvement such as altered mental status,focal neurological deficits, or meningeal signs plus evi-dence of VZV infection). Three control groups were in-cluded: (1) enteroviral meningitis (ent. men, n = 10;defined as clinically confirmed CNS involvement and de-tection of enteroviruses in CSF by PCR) as infectious dis-ease control; (2) idiopathic facial paresis (Bell’s palsy,n = 11, defined as facial paralysis with normal CSFleukocyte count, excluding patients with evidence of infec-tious diseases, such as CSF PCR positive for VZV or HSV,or intrathecal specific antibody production for VZV, HSV,or Borrelia burgdorferi sensu lato); and (3) normal pres-sure hydrocephalus (controls, n = 15; defined as normalCSF pressure, cranial computed or magnetic resonancetomography scan indicative of normal pressure hydro-cephalus, and at least one symptom of the Hakim triad[26, 27], excluding other symptoms as non-infected/non-inflamed CSF controls). Upon lumbar puncture, CSFsamples were processed within 2 h to minimize time-dependent changes in CSF metabolomes. Aliquots of cell-free CSF were obtained by centrifugation and kept frozenuntil analysis for the present study. The following CSFparameters were analyzed directly after lumbar puncture:leukocyte count (counted manually with a Fuchs-Rosenthal counting chamber), protein concentration(Bradford dye-binding assay), lactate concentration, Q-albumin ratio (albumin concentration in CSF/albuminconcentration in serum [28]), IgG-index (IgG concentra-tion in CSF/IgG concentration in serum divided by Q-
albumin ratio; age-adjusted reference limit = 4+(age/15)[28]), and PCR for viral diagnostics. IgG and albumin weremeasured in CSF and serum in the same latex-enhancedassay by kinetic nephelometry (Beckman CoulterIMMAGE). All methods are quality assured by participat-ing in external quality control programs, the CSF survey ofINSTAND [29]. A clinical epidemiological analysis, includ-ing the standard CSF parameters, of the same VZV reacti-vation patients is included in a separate manuscript(Skripuletz et al., manuscript submitted). Patients withVZV reactivation were treated with acyclovir (10 mg/kgbody weight for 14 days, intravenously) as standard of care.Ten patients in the Z. facial group were treated with ste-roids (1 mg/kg body weight/day). Patients in the Bell’spalsy group were treated with steroids (1 mg/kg bodyweight/day) for 10 days with subsequent tapering. CSF wasobtained prior to onset of acyclovir or steroid treatment.
Metabolite profilingWe applied the AbsoluteIDQ®-p180 kit (Biocrates LifeScience AG, Innsbruck, Austria) for CSF analysis [30] ona triple-quadrupole mass spectrometer (API4000, Sciex,Framingham, MA, USA) with an electrospray-ionizationion source coupled to a high-performance liquidchromatography system (SIL-HTc, Shimadzu, Japan). Thiscombination allows to detect (1) 21 amino acids and 21biogenic amines by liquid chromatography separationfollowed by targeted tandem mass spectrometry (MS/MS)and (2) 91 glycerophospholipids (phosphatidyl- andlysophosphatidylcholines) and isomers, 40 acylcarnitines,15 sphingolipids (sphingo- and hydroxysphingomyelins)and isomers, and the sum of hexoses by direct infusionMS/MS (flow injection analysis). Thus, up to 188 metabo-lites can be analyzed per sample. All assays were per-formed according to the manufacturer’s recommendations(user manual UM_p180_ABSciex_11 and application note1003-1, Biocrates Life Science AG, Innsbruck, Austria). Inbrief, manufacturer’s internal standard solution and cali-brator/quality control samples or 30 μL of CSF wereloaded onto a filter plate, derivatized using 5%phenylisothiocyanate in ethanol/water/pyridine (1/1/1, v/v/v), and extracted using 5 mM ammonium acetate inmethanol. Remaining extracts were diluted and measuredaccording to the manufacturer’s instructions. The follow-ing lipid nomenclature is used: sphingomyelin (SM) andhydroxysphingomyelin (SM(OH)): Cx:y: x = total numberof carbon atoms and y = total number of double bonds inthe amide bond. Phosphatidylcholines (PC): aa: both sidechains are fatty acids linked to glycerol backbone by esterbonds, ae: one of the side chains is a fatty alcohol linkedto glycerol backbone by an ether bond, and Cx:y: x = totalnumber of carbon atoms and y = total number of doublebonds in both fatty acid chains. Peak integration and cal-culation of metabolite concentrations were performed
Kuhn et al. Journal of Neuroinflammation (2018) 15:20 Page 3 of 15
with the Analyst® (version 1.5.2, Sciex, Framingham, MA,USA) and MetIDQ™ software (Biocrates Life Science AG,Innsbruck, Austria) [30]. Metabolites with concentrationsabove the limit of detection (>LOD) were included in thesubsequent statistical analyses.
Statistical analysesIn order to generate a dataset that can be used for statis-tical analyses not compatible with missing values, valuesbelow LOD were replaced by multiple imputation usingSPSS Statistics for Windows, version 20 (IBM Corporation,Armonk, NY, USA; from here on referred to as SPSS), ac-cording to the SPSS Missing Values Manual [31], usingage, sex, diagnosis, and CSF leukocyte count as predictors.Data from five imputations were pooled to generate a“pooled estimate” dataset which was used for all analysesexcept jackknife cross-validation and random forest con-struction (see below). Standard statistical analyses wereperformed with the “stats” package of the R Foundationfor Statistical Computing (version 3.2.3; from here on re-ferred to as “R”) [32] or SPSS. Significance of between- andamong-group differences was defined as a P value of < 0.05unless stated otherwise. Corrections for multiple-hypothesis testing were not performed in those caseswhere data were shown to visualize the distribution of dif-ferential expression (Fig. 3) or correlations (Fig. 5), but aBenjamini-Hochberg correction [33] was applied whenselecting specific markers (Fig. 4c–f). Nonmetric multidi-mensional scaling (MDS) of metabolite concentrations wasdone with the R package “MASS.” Spearman correlationanalysis was used to assess correlations between leukocytecount and metabolite concentrations using SPSS.The leave-one-out (jackknife) method was used for
internal cross-validation, which was necessary becausean external validation based on additional samples wasnot feasible due to the low incidences of some of the eti-ologies studied. Leave-one-out cross-validation is recom-mended as a validation strategy if no independent testdataset is available and sample sizes are limited [34, 35].Briefly, the internal cross-validation process splits thecohort into a training subset (n = 80 patients) and a val-idation subset (n = 1 patient) and computes the bestclassifier on the training subset. The selected classifier isthen tested on the validation subset. In an iterative ap-proach, every sample is used as the validation subset andall classifiers are ranked according to the frequency ofselection, with the most frequently selected classifiersconstituting the best validated biomarkers. In detail,values <LOD were imputed with the k-nearest neighborsalgorithm and the Heterogeneous Euclidean OverlapMetric (HEOM) [36]. Features were then selected basedon the AUC values of the biomarker candidates on thetraining dataset, followed by the construction of a randomforest classifier based on the 10 biomarker candidates with
the highest AUC values. Subsequently, the classifier wastested on the single sample that was left out during thecorresponding iteration of the jackknife method. In eachiteration of this method, a different subset of biomarkerscan be selected. In the end, a random forest classifier basedon the biomarkers that were most often selected was againevaluated based on the jackknife method. Since this canlead to a selection bias [35], the procedure described abovewas repeated with 1000 bootstrap samples in order tocompute a confidence interval (CI) for the AUC of thefinal classifier (i.e., small subset of metabolites).
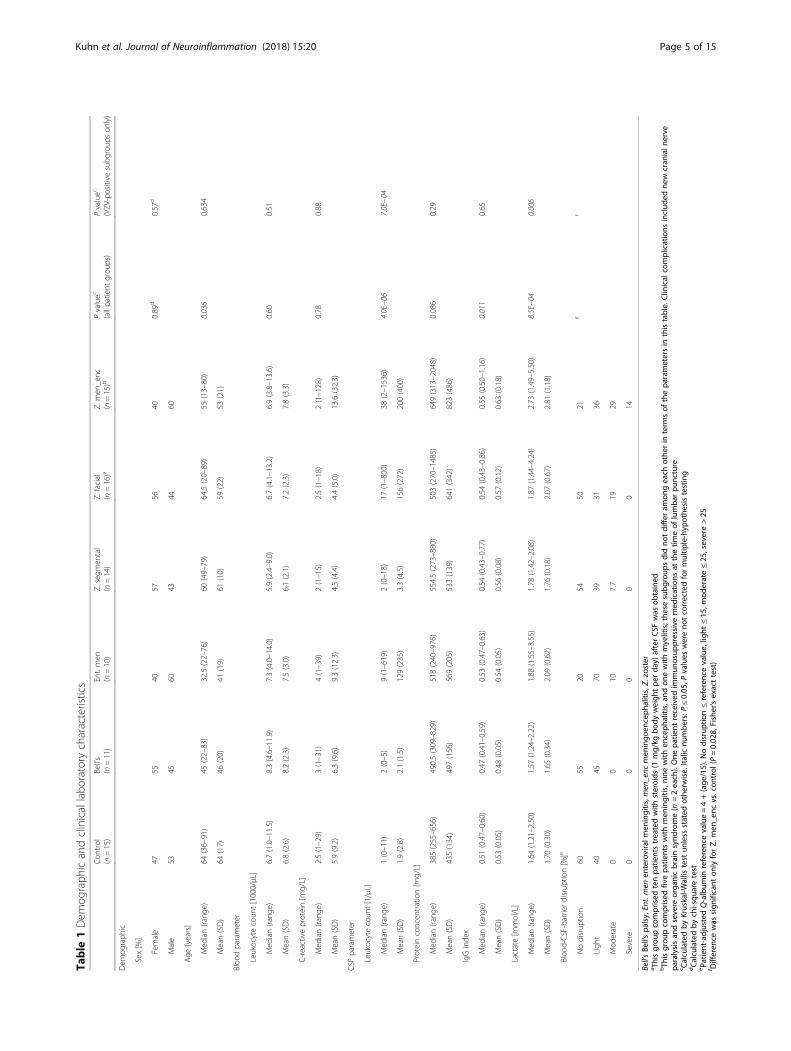
ResultsStudy populationTable 1 summarizes sociodemographic and clinicalfeatures of the study population and results of standarddiagnostic parameters. Consistent with the epidemiologyof the diseases, median age was lower in the ent. men andBell’s palsy groups. Peripheral blood leukocyte count andserum C-reactive protein (CRP) concentrations did notdiffer significantly across groups, although the highest in-dividual CRP values were measured in Z. meningoenceph-alitis. CSF leukocyte count was two- to fourfold higher inpatients with Z. facial and Z. meningoencephalitis than inthe other groups, whereas total CSF protein concentrationwas lowest in controls. IgG index was lower in Bell’s palsybut was similar among the other groups. Lactate concen-tration was highest in Z. meningoencephalitis, and blood-CSF-barrier disruption was most pronounced in Z.meningoencephalitis, followed by ent. men and Z. facial.Taken together, these results demonstrate that the in-cluded patient groups (and CSF samples) have the featuresexpected from their clinical diagnoses and that controlsand idiopathic Bell’s palsy can be considered non-inflamedcontrols for the purpose of this study.
CSF metabolite detectionAll metabolites detected above LOD were initially consid-ered and were grouped into four categories according tocompleteness of detection (Fig. 1). The groups “100%” (i.e.,detected in 100% of samples; n = 54) and “75–99%” (n = 34)were merged and used for all subsequent analyses. Theanalytes detected in 75–99% and <75% of all samples didnot comprise metabolites that were completely absent inany particular patient groups but present in the others, butwere rather missing due to low abundance, or lack of detec-tion due to technical reasons, across all groups. Neverthe-less, the concentrations measured and the analyticalcoverage for the analyzed metabolites agreed with the infor-mation provided by the manufacturer [30] and the resultspublished by Mandal et al. [37]. The subsequently included88 analytes comprised 28% of acylcarnitines, 86% of aminoacids, 24% of biogenic amines, 46% of glycerophospholi-pids, 80% of sphingolipids, and the sum of hexoses.
Kuhn et al. Journal of Neuroinflammation (2018) 15:20 Page 4 of 15
Table
1Dem
ograph
icandclinicallabo
ratory
characteristics
Con
trol
(n=15)
Bell’s
(n=11)
Ent.men
(n=10)
Z.segm
ental
(n=14)
Z.facial
(n=16)a
Z.men
_enc
(n=15)b
Pvaluec
(allpatient
grou
ps)
Pvaluec
(VZV
-positive
subg
roup
son
ly)
Dem
ograph
ic
Sex[%]
Female
4755
4057
5640
0.89
d0.57
d
Male
5345
6043
4460
Age
[years]
Med
ian(rang
e)64
(36–91)
45(22–83)
32.5(22–76)
60(49–79)
64.5(20–89)
55(13–80)
0.036
0.634
Mean(SD)
64(17)
46(20)
41(19)
61(10)
59(22)
53(21)
Bloo
dparameter
Leukocytecoun
t[1000/μL]
Med
ian(rang
e)6.7(1.0–11.5)
8.3(4.6–11.9)
7.3(4.0–14.0)
5.9(2.4–9.0)
6.7(4.1–13.2)
6.9(3.8–13.6)
0.60
0.51
Mean(SD)
6.8(2.6)
8.2(2.3)
7.5(3.0)
6.1(2.1)
7.2(2.3)
7.8(3.3)
C-reactiveprotein[m
g/L]
Med
ian(rang
e)2.5(1–29)
3(1–31)
4(1–39)
2(1–15)
2.5(1–18)
2(1–128)
0.78
0.88
Mean(SD)
5.9(9.2)
6.3(9.6)
9.3(12.3)
4.5(4.4)
4.4(5.0)
13.6(32.3)
CSF
parameter
Leukocytecoun
t[1/μL]
Med
ian(rang
e)1(0–11)
2(0–5)
9(1–619)
2(0–18)
17(1–800)
38(2–1536)
4.0E−06
7.0E−04
Mean(SD)
1.9(2.8)
2.1(1.5)
129(235)
3.3(4.5)
156(272)
200(400)
Proteinconcen
tration[m
g/L]
Med
ian(rang
e)385(255–656)
490.5(309–829)
518(240–976)
554.5(273–880)
503(270–1485)
649(313–2048)
0.086
0.29
Mean(SD)
435(134)
497(156)
569(205)
533(139)
641(342)
823(486)
IgGinde
x
Med
ian(rang
e)0.51
(0.47–0.60)
0.47
(0.41–0.59)
0.53
(0.47–0.63)
0.54
(0.43–0.77)
0.54
(0.43–0.86)
0.55
(0.50–1.16)
0.011
0.65
Mean(SD)
0.53
(0.05)
0.48
(0.05)
0.54
(0.05)
0.56
(0.08)
0.57
(0.12)
0.63
(0.18)
Lactate[m
mol/L]
Med
ian(rang
e)1.64
(1.21–2.50)
1.57
(1.24–2.22)
1.88
(1.55–3.55)
1.78
(1.42–2.08)
1.87
(1.44–4.24)
2.73
(1.49–5.50)
8.5E−04
0.006
Mean(SD)
1.70
(0.30)
1.65
(0.34)
2.09
(0.62)
1.76
(0.18)
2.07
(0.67)
2.81
(1.18)
Bloo
d-CSF-barrierdisrup
tion[%]e
Nodisrup
tion
6055
2054
5021
ff
Ligh
t40
4570
3931
36
Mod
erate
00
107.7
1929
Severe
00
00
014
Bell’sBe
ll’spa
lsy,Ent.men
enteroviralm
eningitis,m
en_enc
men
ingo
enceph
alitis,Z.
zoster
a Thisgrou
pcomprised
tenpa
tientstreatedwith
steroids
(1mg/kg
body
weigh
tpe
rda
y)afterCSF
was
obtained
bTh
isgrou
pcomprised
fivepa
tientswith
men
ingitis,n
inewith
enceph
alitis,an
don
ewith
myelitis;the
sesubg
roup
sdidno
tdiffer
amon
geach
othe
rin
term
sof
thepa
rametersin
thistable.Clin
ical
complications
includ
edne
wcran
ialn
erve
paralysisan
dsevere
orga
nicbrainsynd
rome(n
=2each).One
patie
ntreceived
immun
osup
pressive
med
ications
atthetim
eof
lumba
rpu
ncture
c Calculatedby
Kruskal-W
allis
test
unless
stated
othe
rwise.Ita
licnu
mbe
rs:P
≤0.05
,Pvalues
wereno
tcorrectedformultip
le-hyp
othe
sistesting
dCalculatedby
chi-squ
aretest
ePa
tient-adjustedQ-album
inreferencevalue=4+(age
/15).N
odisrup
tion≤referencevalue,lig
ht≤15
,mod
erate≤25
,severe>25
f Differen
cewas
sign
ificant
onlyforZ.
men
_enc
vs.con
trol
(P=0.02
8,Fisher’sexacttest)
Kuhn et al. Journal of Neuroinflammation (2018) 15:20 Page 5 of 15
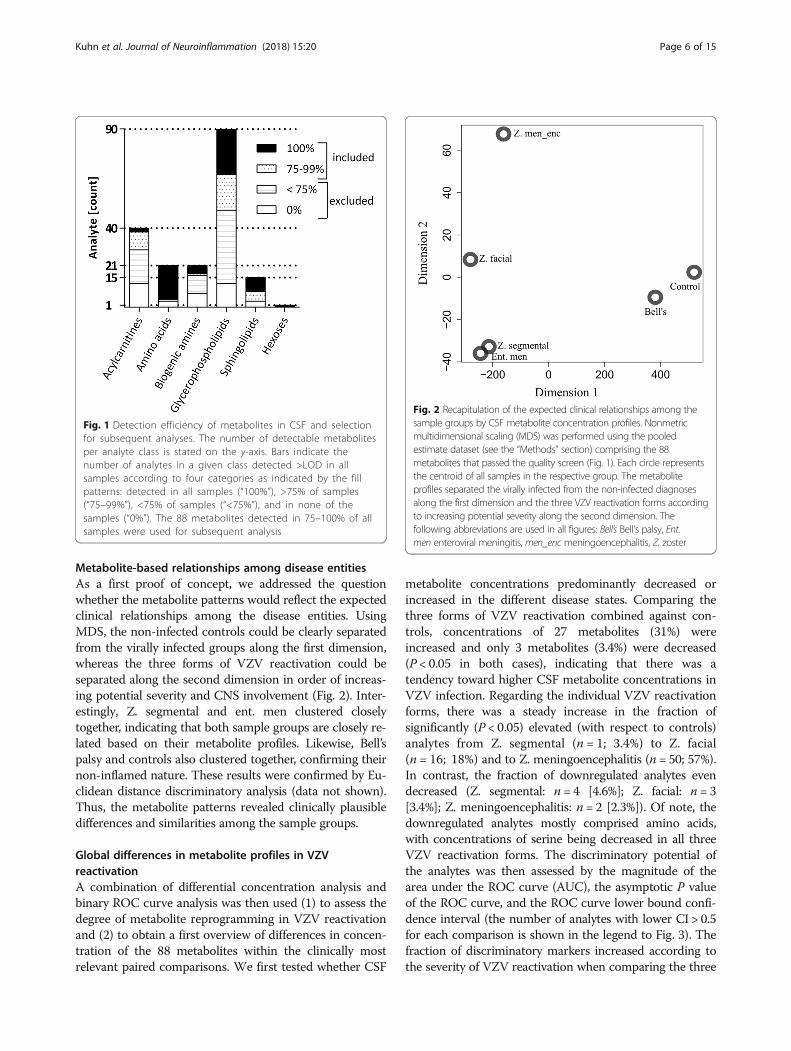
Metabolite-based relationships among disease entitiesAs a first proof of concept, we addressed the questionwhether the metabolite patterns would reflect the expectedclinical relationships among the disease entities. UsingMDS, the non-infected controls could be clearly separatedfrom the virally infected groups along the first dimension,whereas the three forms of VZV reactivation could beseparated along the second dimension in order of increas-ing potential severity and CNS involvement (Fig. 2). Inter-estingly, Z. segmental and ent. men clustered closelytogether, indicating that both sample groups are closely re-lated based on their metabolite profiles. Likewise, Bell’spalsy and controls also clustered together, confirming theirnon-inflamed nature. These results were confirmed by Eu-clidean distance discriminatory analysis (data not shown).Thus, the metabolite patterns revealed clinically plausibledifferences and similarities among the sample groups.
Global differences in metabolite profiles in VZVreactivationA combination of differential concentration analysis andbinary ROC curve analysis was then used (1) to assess thedegree of metabolite reprogramming in VZV reactivationand (2) to obtain a first overview of differences in concen-tration of the 88 metabolites within the clinically mostrelevant paired comparisons. We first tested whether CSF
metabolite concentrations predominantly decreased orincreased in the different disease states. Comparing thethree forms of VZV reactivation combined against con-trols, concentrations of 27 metabolites (31%) wereincreased and only 3 metabolites (3.4%) were decreased(P < 0.05 in both cases), indicating that there was atendency toward higher CSF metabolite concentrations inVZV infection. Regarding the individual VZV reactivationforms, there was a steady increase in the fraction ofsignificantly (P < 0.05) elevated (with respect to controls)analytes from Z. segmental (n = 1; 3.4%) to Z. facial(n = 16; 18%) and to Z. meningoencephalitis (n = 50; 57%).In contrast, the fraction of downregulated analytes evendecreased (Z. segmental: n = 4 [4.6%]; Z. facial: n = 3[3.4%]; Z. meningoencephalitis: n = 2 [2.3%]). Of note, thedownregulated analytes mostly comprised amino acids,with concentrations of serine being decreased in all threeVZV reactivation forms. The discriminatory potential ofthe analytes was then assessed by the magnitude of thearea under the ROC curve (AUC), the asymptotic P valueof the ROC curve, and the ROC curve lower bound confi-dence interval (the number of analytes with lower CI > 0.5for each comparison is shown in the legend to Fig. 3). Thefraction of discriminatory markers increased according tothe severity of VZV reactivation when comparing the three
Fig. 1 Detection efficiency of metabolites in CSF and selectionfor subsequent analyses. The number of detectable metabolitesper analyte class is stated on the y-axis. Bars indicate thenumber of analytes in a given class detected >LOD in allsamples according to four categories as indicated by the fillpatterns: detected in all samples (“100%”), >75% of samples(“75–99%”), <75% of samples (“<75%”), and in none of thesamples (“0%”). The 88 metabolites detected in 75–100% of allsamples were used for subsequent analysis
Fig. 2 Recapitulation of the expected clinical relationships among thesample groups by CSF metabolite concentration profiles. Nonmetricmultidimensional scaling (MDS) was performed using the pooledestimate dataset (see the “Methods” section) comprising the 88metabolites that passed the quality screen (Fig. 1). Each circle representsthe centroid of all samples in the respective group. The metaboliteprofiles separated the virally infected from the non-infected diagnosesalong the first dimension and the three VZV reactivation forms accordingto increasing potential severity along the second dimension. Thefollowing abbreviations are used in all figures: Bell’s Bell’s palsy, Ent.men enteroviral meningitis, men_enc meningoencephalitis, Z. zoster
Kuhn et al. Journal of Neuroinflammation (2018) 15:20 Page 6 of 15
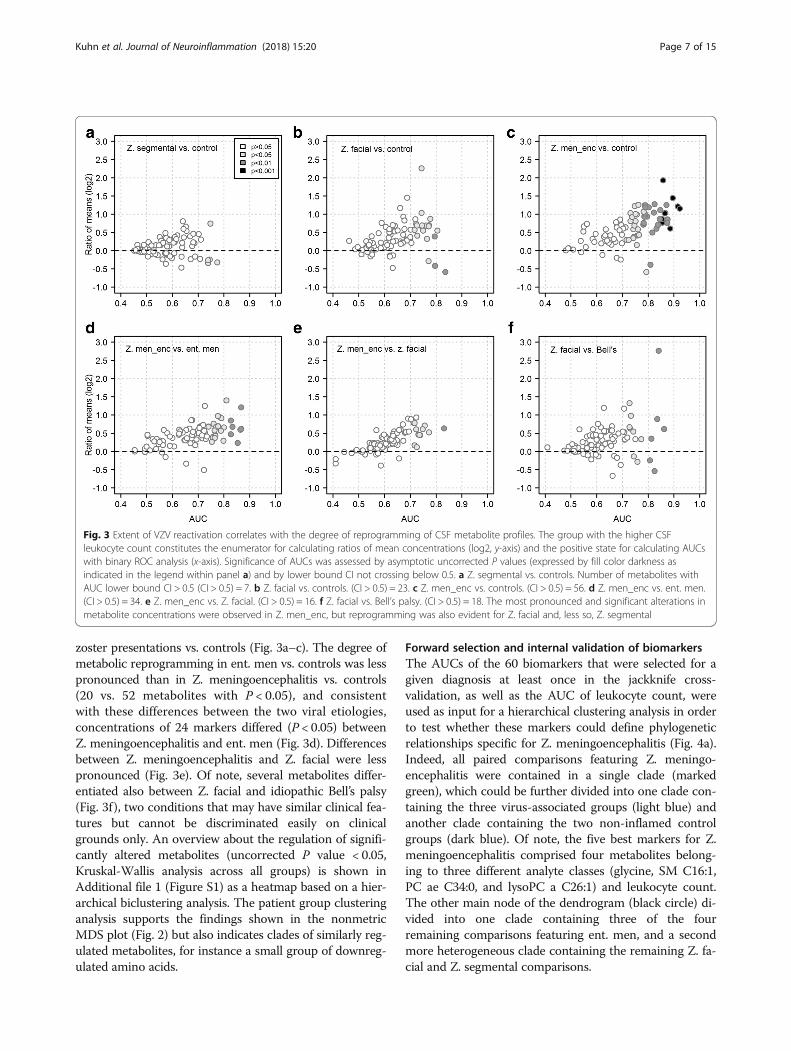
zoster presentations vs. controls (Fig. 3a–c). The degree ofmetabolic reprogramming in ent. men vs. controls was lesspronounced than in Z. meningoencephalitis vs. controls(20 vs. 52 metabolites with P < 0.05), and consistentwith these differences between the two viral etiologies,concentrations of 24 markers differed (P < 0.05) betweenZ. meningoencephalitis and ent. men (Fig. 3d). Differencesbetween Z. meningoencephalitis and Z. facial were lesspronounced (Fig. 3e). Of note, several metabolites differ-entiated also between Z. facial and idiopathic Bell’s palsy(Fig. 3f), two conditions that may have similar clinical fea-tures but cannot be discriminated easily on clinicalgrounds only. An overview about the regulation of signifi-cantly altered metabolites (uncorrected P value < 0.05,Kruskal-Wallis analysis across all groups) is shown inAdditional file 1 (Figure S1) as a heatmap based on a hier-archical biclustering analysis. The patient group clusteringanalysis supports the findings shown in the nonmetricMDS plot (Fig. 2) but also indicates clades of similarly reg-ulated metabolites, for instance a small group of downreg-ulated amino acids.
Forward selection and internal validation of biomarkersThe AUCs of the 60 biomarkers that were selected for agiven diagnosis at least once in the jackknife cross-validation, as well as the AUC of leukocyte count, wereused as input for a hierarchical clustering analysis in orderto test whether these markers could define phylogeneticrelationships specific for Z. meningoencephalitis (Fig. 4a).Indeed, all paired comparisons featuring Z. meningo-encephalitis were contained in a single clade (markedgreen), which could be further divided into one clade con-taining the three virus-associated groups (light blue) andanother clade containing the two non-inflamed controlgroups (dark blue). Of note, the five best markers for Z.meningoencephalitis comprised four metabolites belong-ing to three different analyte classes (glycine, SM C16:1,PC ae C34:0, and lysoPC a C26:1) and leukocyte count.The other main node of the dendrogram (black circle) di-vided into one clade containing three of the fourremaining comparisons featuring ent. men, and a secondmore heterogeneous clade containing the remaining Z. fa-cial and Z. segmental comparisons.
Fig. 3 Extent of VZV reactivation correlates with the degree of reprogramming of CSF metabolite profiles. The group with the higher CSFleukocyte count constitutes the enumerator for calculating ratios of mean concentrations (log2, y-axis) and the positive state for calculating AUCswith binary ROC analysis (x-axis). Significance of AUCs was assessed by asymptotic uncorrected P values (expressed by fill color darkness asindicated in the legend within panel a) and by lower bound CI not crossing below 0.5. a Z. segmental vs. controls. Number of metabolites withAUC lower bound CI > 0.5 (CI > 0.5) = 7. b Z. facial vs. controls. (CI > 0.5) = 23. c Z. men_enc vs. controls. (CI > 0.5) = 56. d Z. men_enc vs. ent. men.(CI > 0.5) = 34. e Z. men_enc vs. Z. facial. (CI > 0.5) = 16. f Z. facial vs. Bell’s palsy. (CI > 0.5) = 18. The most pronounced and significant alterations inmetabolite concentrations were observed in Z. men_enc, but reprogramming was also evident for Z. facial and, less so, Z. segmental
Kuhn et al. Journal of Neuroinflammation (2018) 15:20 Page 7 of 15
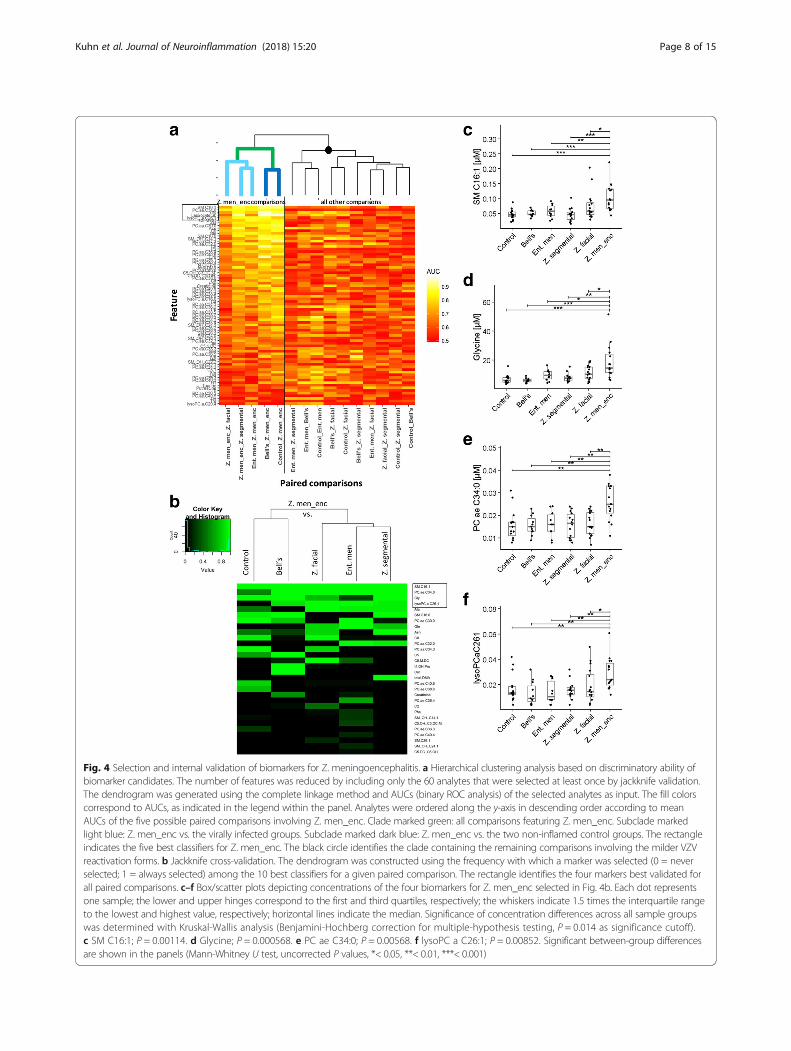
Fig. 4 Selection and internal validation of biomarkers for Z. meningoencephalitis. a Hierarchical clustering analysis based on discriminatory ability ofbiomarker candidates. The number of features was reduced by including only the 60 analytes that were selected at least once by jackknife validation.The dendrogram was generated using the complete linkage method and AUCs (binary ROC analysis) of the selected analytes as input. The fill colorscorrespond to AUCs, as indicated in the legend within the panel. Analytes were ordered along the y-axis in descending order according to meanAUCs of the five possible paired comparisons involving Z. men_enc. Clade marked green: all comparisons featuring Z. men_enc. Subclade markedlight blue: Z. men_enc vs. the virally infected groups. Subclade marked dark blue: Z. men_enc vs. the two non-inflamed control groups. The rectangleindicates the five best classifiers for Z. men_enc. The black circle identifies the clade containing the remaining comparisons involving the milder VZVreactivation forms. b Jackknife cross-validation. The dendrogram was constructed using the frequency with which a marker was selected (0 = neverselected; 1 = always selected) among the 10 best classifiers for a given paired comparison. The rectangle identifies the four markers best validated forall paired comparisons. c–f Box/scatter plots depicting concentrations of the four biomarkers for Z. men_enc selected in Fig. 4b. Each dot representsone sample; the lower and upper hinges correspond to the first and third quartiles, respectively; the whiskers indicate 1.5 times the interquartile rangeto the lowest and highest value, respectively; horizontal lines indicate the median. Significance of concentration differences across all sample groupswas determined with Kruskal-Wallis analysis (Benjamini-Hochberg correction for multiple-hypothesis testing, P = 0.014 as significance cutoff).c SM C16:1; P = 0.00114. d Glycine; P = 0.000568. e PC ae C34:0; P = 0.00568. f lysoPC a C26:1; P = 0.00852. Significant between-group differencesare shown in the panels (Mann-Whitney U test, uncorrected P values, *< 0.05, **< 0.01, ***< 0.001)
Kuhn et al. Journal of Neuroinflammation (2018) 15:20 Page 8 of 15
Jackknife internal cross-validation (see the “Methods”section) was then used to identify the best internally vali-dated biomarker candidates for the comparisons betweenZ. meningoencephalitis and each of the other five groups(Fig. 4b). This analysis identified the same four best ana-lytes as the AUC-based hierarchical clustering (Fig. 4a),suggesting that increased concentrations of these four me-tabolites were most closely associated with a diagnosis ofZ. meningoencephalitis. As shown in Fig. 4c–f, concentra-tions of all four were highest in Z. meningoencephalitis,and concentrations were significantly lower (P < 0.05) inall other disease etiologies, even in ent. men, which wasincluded as disease control (viral CNS infection of differ-ent etiology). When the cross-validation was applied toidentify markers for the two milder forms of VZV reacti-vation in clinically relevant comparisons, there was moreheterogeneity among the best validated markers for thevarious paired comparisons. Nonetheless, markers ofmoderate to excellent discriminatory ability could be vali-dated for all comparisons (see below).
Comparison of diagnostic performance of CSFmetabolites and standard CSF parametersTable 2 summarizes the results of ROC analysis forstandard diagnostic parameters (section A), the best in-ternally validated metabolite biomarkers for the mostrelevant comparisons involving the three VZV reactiva-tion patterns (section B), and best classifiers (biomarkercombinations, section C). Leukocyte count differentiatedZ. meningoencephalitis accurately from Z. segmental,non-inflamed controls, and Bell’s palsy, but not from Z.facial or ent. men. The discriminatory ability of lactatecame close to that of leukocyte count, whereas proteinconcentration had only low discriminatory value. Themetabolite markers (section B) were inferior only in thetwo cases where leukocyte count already demonstratedhigh discrimination, but they showed significantly betterdiscrimination where traditional markers had only lim-ited value (e.g., Z. facial vs. Bell’s palsy, or Z. meningo-encephalitis vs. Z. facial or ent. men). Lastly, optimalcombinations of biomarkers (including leukocyte count,which was included because it is easily and rapidly deter-mined in clinical practice) were selected by random for-est construction (section C). This led to superior AUCsin all except two comparisons.
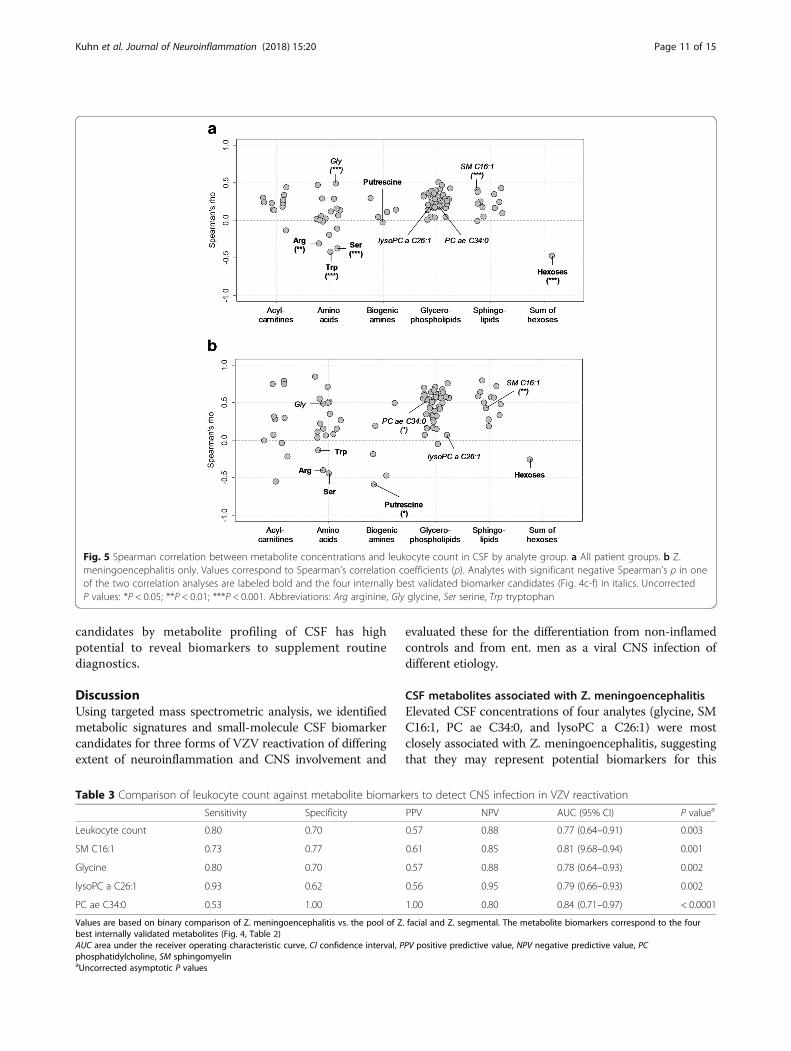
Correlation between metabolite concentrations andleukocyte countCSF leukocyte count (“cell count”) is a currently used in-dicator for the degree of overall CNS inflammation, in-dependent of underlying disease etiology, but is alsoused to aid in making important clinical decisions suchas institution or termination of anti-infective medica-tions. In order to test whether the four metabolites
specific for Z. meningoencephalitis merely reflect the de-gree of CNS inflammation, as does CSF leukocyte count,or whether they are indicative of distinct pathophysio-logical mechanisms, we performed a Spearman’s corre-lation analysis between metabolite concentrations andCSF leukocyte count. Correlation with leukocyte countwas not preferentially associated with any of the analyteclasses (Fisher’s exact test, P = 0.18, χ2 = 7.181). Overall,there were weak-to-moderate correlations between ana-lyte concentrations and leukocyte count, as indicated bycomparatively low Spearman coefficients (Spearman’s ρbetween − 0.5 and 0.5, Fig. 5a). Most correlations werepositive, but amino acids formed a distinct exception inthat there were also significant negative correlations.The three amino acids with significant negative Spear-man’s ρ (P < 0.05, identified by labels) and the sum ofhexoses were also among the analytes with decreasedconcentrations in VZV reactivation identified in Fig. 3.Of note, the Z. meningoencephalitis-associated metabo-lites selected by the cross-validation shown in Fig. 4 (SMC16:1, glycine, PC ae 34:0, and lysoPC a C26:1, markedin the figure) did not always correlate most strongly withleukocyte count. When limiting this analysis to Z. men-ingoencephalitis (Fig. 5b), the overall degree of correl-ation increased, but again, the four biomarker candidateswere not among the metabolites with the strongest cor-relations. Thus, the observed differences in metaboliteprofiles among the sample groups did not merely reflectthe degree of overall CNS inflammation, but other, pre-sumably disease- or pathogen-specific, pathophysio-logical processes.
Diagnostic comparison of leukocyte count and the four Z.meningoencephalitis-associated metabolitesTo test their performance in a clinically relevant sce-nario, we then used standard measures of diagnostic testevaluation to assess the abilities of the four best vali-dated metabolites (SM C16:1, glycine, PC ae 34:0, andlysoPC a C26:1) to diagnose Z. meningoencephalitisamong all VZV-positive samples (Table 3). Leukocytecount was evaluated for comparison, as our data re-vealed it as the most accurate standard diagnosticmarker (please refer to Table 2). Although it had somediagnostic value, the four metabolites performedequally well or better in most aspects, indicating theirvalue as novel biomarkers for clinical application andas sensors of the associated neuroinflammation. In par-ticular, lysoPC a C26:1 had by far the highest sensitivityand negative predictive value, and PC ae 34:0 had bothperfect sensitivity and positive predictive value. Theseresults also agree with our finding that dysregulation ofthese four metabolites in CSF did not correlate stronglywith leukocyte count (Fig. 5). Both findings indicatethat the identification of novel metabolite biomarker
Kuhn et al. Journal of Neuroinflammation (2018) 15:20 Page 9 of 15
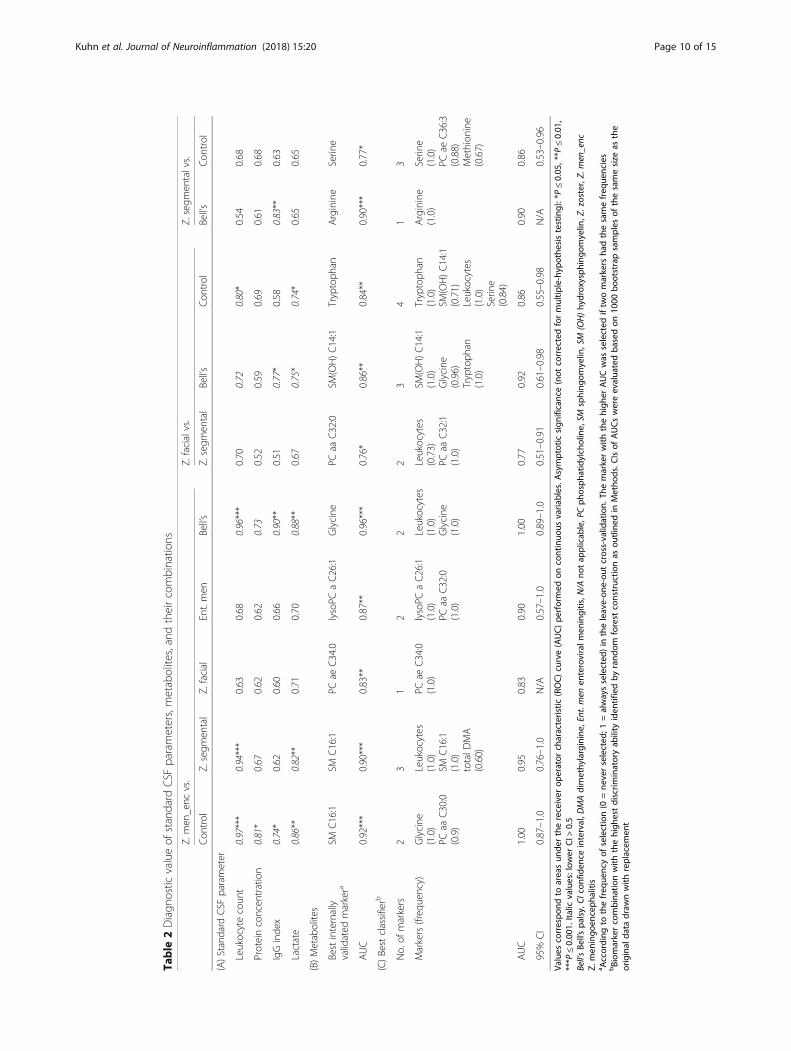
Table
2Diagn
ostic
valueof
standard
CSF
parameters,metabolites,andtheircombinatio
ns
Z.men
_enc
vs.
Z.facialvs.
Z.segm
entalvs.
Con
trol
Z.segm
ental
Z.facial
Ent.men
Bell’s
Z.segm
ental
Bell’s
Con
trol
Bell’s
Con
trol
(A)Standard
CSF
parameter
Leukocytecoun
t0.97***
0.94***
0.63
0.68
0.96***
0.70
0.72
0.80*
0.54
0.68
Proteinconcen
tration
0.81*
0.67
0.62
0.62
0.73
0.52
0.59
0.69
0.61
0.68
IgGinde
x0.74*
0.62
0.60
0.66
0.90**
0.51
0.77*
0.58
0.83**
0.63
Lactate
0.86**
0.82**
0.71
0.70
0.88**
0.67
0.75*
0.74*
0.65
0.65
(B)Metabolites
Bestinternally
validated
markera
SMC16:1
SMC16:1
PCae
C34.0
lysoPC
aC26:1
Glycine
PCaa
C32:0
SM(OH)C14:1
Tryptoph
anArginine
Serin
e
AUC
0.92***
0.90***
0.83**
0.87**
0.96***
0.76*
0.86**
0.84**
0.90***
0.77*
(C)Bestclassifierb
No.of
markers
23
12
22
34
13
Markers(freq
uency)
Glycine
(1.0)
PCaa
C30:0
(0.9)
Leukocytes
(1.0)
SMC16:1
(1.0)
totalD
MA
(0.60)
PCae
C34:0
(1.0)
lysoPC
aC26:1
(1.0)
PCaa
C32:0
(1.0)
Leukocytes
(1.0)
Glycine
(1.0)
Leukocytes
(0.73)
PCaa
C32:1
(1.0)
SM(OH)C14:1
(1.0)
Glycine
(0.96)
Tryptoph
an(1.0)
Tryptoph
an(1.0)
SM(OH)C14:1
(0.71)
Leukocytes
(1.0)
Serin
e(0.84)
Arginine
(1.0)
Serin
e(1.0)
PCae
C36:3
(0.88)
Methion
ine
(0.67)
AUC
1.00
0.95
0.83
0.90
1.00
0.77
0.92
0.86
0.90
0.86
95%
CI
0.87–1.0
0.76–1.0
N/A
0.57–1.0
0.89–1.0
0.51–0.91
0.61–0.98
0.55–0.98
N/A
0.53–0.96
Values
correspo
ndto
areasun
derthereceiver
operator
characteristic
(ROC)curve(AUC)pe
rformed
oncontinuo
usvaria
bles.A
symptoticsign
ificance(not
correctedformultip
le-hyp
othe
sistesting):*P≤0.05
,**P
≤0.01
,***P
≤0.00
1.Ita
licvalues:low
erCI>
0.5
Bell’sBe
ll’spa
lsy,CI
confiden
ceinterval,D
MAdimethy
larginine,
Ent.men
enteroviralm
eningitis,N
/Ano
tap
plicab
le,P
Cph
osph
atidylcholine,
SMsphing
omyelin
,SM
(OH)hy
droxysph
ingo
myelin
,Z.zoster,Z.
men_enc
Z.men
ingo
enceph
alitis
a According
tothefreq
uencyof
selection(0
=ne
verselected
;1=alwaysselected
)in
theleave-on
e-ou
tcross-valid
ation.
Themarkerwith
thehigh
erAUCwas
selected
iftw
omarkers
hadthesamefreq
uencies
bBiom
arkercombina
tionwith
thehigh
estdiscrim
inatoryab
ility
iden
tifiedby
rand
omforest
constructio
nas
outline
din
Metho
ds.C
Isof
AUCswereevalua
tedba
sedon
1000
bootstrapsamples
ofthesamesize
asthe
original
data
draw
nwith
replacem
ent
Kuhn et al. Journal of Neuroinflammation (2018) 15:20 Page 10 of 15
candidates by metabolite profiling of CSF has highpotential to reveal biomarkers to supplement routinediagnostics.
DiscussionUsing targeted mass spectrometric analysis, we identifiedmetabolic signatures and small-molecule CSF biomarkercandidates for three forms of VZV reactivation of differingextent of neuroinflammation and CNS involvement and
evaluated these for the differentiation from non-inflamedcontrols and from ent. men as a viral CNS infection ofdifferent etiology.
CSF metabolites associated with Z. meningoencephalitisElevated CSF concentrations of four analytes (glycine, SMC16:1, PC ae C34:0, and lysoPC a C26:1) were mostclosely associated with Z. meningoencephalitis, suggestingthat they may represent potential biomarkers for this
Fig. 5 Spearman correlation between metabolite concentrations and leukocyte count in CSF by analyte group. a All patient groups. b Z.meningoencephalitis only. Values correspond to Spearman’s correlation coefficients (ρ). Analytes with significant negative Spearman’s ρ in oneof the two correlation analyses are labeled bold and the four internally best validated biomarker candidates (Fig. 4c-f) in italics. UncorrectedP values: *P < 0.05; **P < 0.01; ***P < 0.001. Abbreviations: Arg arginine, Gly glycine, Ser serine, Trp tryptophan
Table 3 Comparison of leukocyte count against metabolite biomarkers to detect CNS infection in VZV reactivation
Sensitivity Specificity PPV NPV AUC (95% CI) P valuea
Leukocyte count 0.80 0.70 0.57 0.88 0.77 (0.64–0.91) 0.003
SM C16:1 0.73 0.77 0.61 0.85 0.81 (9.68–0.94) 0.001
Glycine 0.80 0.70 0.57 0.88 0.78 (0.64–0.93) 0.002
lysoPC a C26:1 0.93 0.62 0.56 0.95 0.79 (0.66–0.93) 0.002
PC ae C34:0 0.53 1.00 1.00 0.80 0.84 (0.71–0.97) < 0.0001
Values are based on binary comparison of Z. meningoencephalitis vs. the pool of Z. facial and Z. segmental. The metabolite biomarkers correspond to the fourbest internally validated metabolites (Fig. 4, Table 2)AUC area under the receiver operating characteristic curve, CI confidence interval, PPV positive predictive value, NPV negative predictive value, PCphosphatidylcholine, SM sphingomyelinaUncorrected asymptotic P values
Kuhn et al. Journal of Neuroinflammation (2018) 15:20 Page 11 of 15
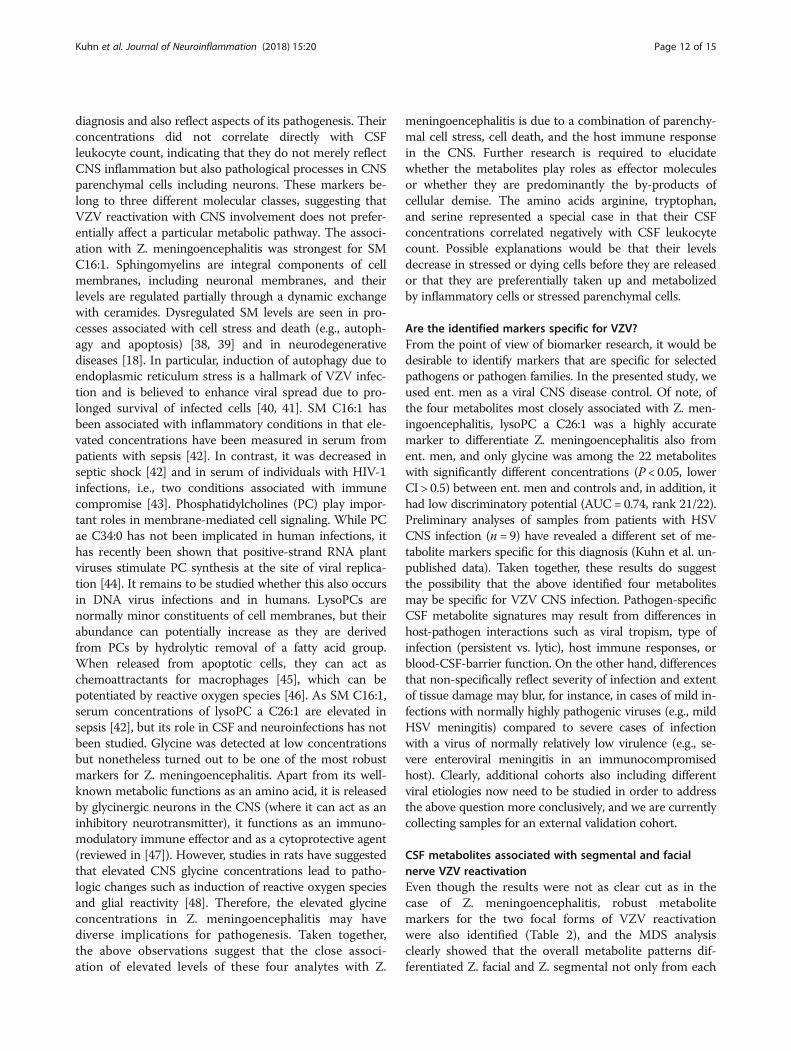
diagnosis and also reflect aspects of its pathogenesis. Theirconcentrations did not correlate directly with CSFleukocyte count, indicating that they do not merely reflectCNS inflammation but also pathological processes in CNSparenchymal cells including neurons. These markers be-long to three different molecular classes, suggesting thatVZV reactivation with CNS involvement does not prefer-entially affect a particular metabolic pathway. The associ-ation with Z. meningoencephalitis was strongest for SMC16:1. Sphingomyelins are integral components of cellmembranes, including neuronal membranes, and theirlevels are regulated partially through a dynamic exchangewith ceramides. Dysregulated SM levels are seen in pro-cesses associated with cell stress and death (e.g., autoph-agy and apoptosis) [38, 39] and in neurodegenerativediseases [18]. In particular, induction of autophagy due toendoplasmic reticulum stress is a hallmark of VZV infec-tion and is believed to enhance viral spread due to pro-longed survival of infected cells [40, 41]. SM C16:1 hasbeen associated with inflammatory conditions in that ele-vated concentrations have been measured in serum frompatients with sepsis [42]. In contrast, it was decreased inseptic shock [42] and in serum of individuals with HIV-1infections, i.e., two conditions associated with immunecompromise [43]. Phosphatidylcholines (PC) play impor-tant roles in membrane-mediated cell signaling. While PCae C34:0 has not been implicated in human infections, ithas recently been shown that positive-strand RNA plantviruses stimulate PC synthesis at the site of viral replica-tion [44]. It remains to be studied whether this also occursin DNA virus infections and in humans. LysoPCs arenormally minor constituents of cell membranes, but theirabundance can potentially increase as they are derivedfrom PCs by hydrolytic removal of a fatty acid group.When released from apoptotic cells, they can act aschemoattractants for macrophages [45], which can bepotentiated by reactive oxygen species [46]. As SM C16:1,serum concentrations of lysoPC a C26:1 are elevated insepsis [42], but its role in CSF and neuroinfections has notbeen studied. Glycine was detected at low concentrationsbut nonetheless turned out to be one of the most robustmarkers for Z. meningoencephalitis. Apart from its well-known metabolic functions as an amino acid, it is releasedby glycinergic neurons in the CNS (where it can act as aninhibitory neurotransmitter), it functions as an immuno-modulatory immune effector and as a cytoprotective agent(reviewed in [47]). However, studies in rats have suggestedthat elevated CNS glycine concentrations lead to patho-logic changes such as induction of reactive oxygen speciesand glial reactivity [48]. Therefore, the elevated glycineconcentrations in Z. meningoencephalitis may havediverse implications for pathogenesis. Taken together,the above observations suggest that the close associ-ation of elevated levels of these four analytes with Z.
meningoencephalitis is due to a combination of parenchy-mal cell stress, cell death, and the host immune responsein the CNS. Further research is required to elucidatewhether the metabolites play roles as effector moleculesor whether they are predominantly the by-products ofcellular demise. The amino acids arginine, tryptophan,and serine represented a special case in that their CSFconcentrations correlated negatively with CSF leukocytecount. Possible explanations would be that their levelsdecrease in stressed or dying cells before they are releasedor that they are preferentially taken up and metabolizedby inflammatory cells or stressed parenchymal cells.
Are the identified markers specific for VZV?From the point of view of biomarker research, it would bedesirable to identify markers that are specific for selectedpathogens or pathogen families. In the presented study, weused ent. men as a viral CNS disease control. Of note, ofthe four metabolites most closely associated with Z. men-ingoencephalitis, lysoPC a C26:1 was a highly accuratemarker to differentiate Z. meningoencephalitis also froment. men, and only glycine was among the 22 metaboliteswith significantly different concentrations (P < 0.05, lowerCI > 0.5) between ent. men and controls and, in addition, ithad low discriminatory potential (AUC = 0.74, rank 21/22).Preliminary analyses of samples from patients with HSVCNS infection (n = 9) have revealed a different set of me-tabolite markers specific for this diagnosis (Kuhn et al. un-published data). Taken together, these results do suggestthe possibility that the above identified four metabolitesmay be specific for VZV CNS infection. Pathogen-specificCSF metabolite signatures may result from differences inhost-pathogen interactions such as viral tropism, type ofinfection (persistent vs. lytic), host immune responses, orblood-CSF-barrier function. On the other hand, differencesthat non-specifically reflect severity of infection and extentof tissue damage may blur, for instance, in cases of mild in-fections with normally highly pathogenic viruses (e.g., mildHSV meningitis) compared to severe cases of infectionwith a virus of normally relatively low virulence (e.g., se-vere enteroviral meningitis in an immunocompromisedhost). Clearly, additional cohorts also including differentviral etiologies now need to be studied in order to addressthe above question more conclusively, and we are currentlycollecting samples for an external validation cohort.
CSF metabolites associated with segmental and facialnerve VZV reactivationEven though the results were not as clear cut as in thecase of Z. meningoencephalitis, robust metabolitemarkers for the two focal forms of VZV reactivationwere also identified (Table 2), and the MDS analysisclearly showed that the overall metabolite patterns dif-ferentiated Z. facial and Z. segmental not only from each
Kuhn et al. Journal of Neuroinflammation (2018) 15:20 Page 12 of 15
other but also from the non-inflamed controls. Amongthe best metabolite markers for Z. facial were SM(OH)C14:1, tryptophan, creatinine, and PC aa C32:0, whereasZ. segmental-specific markers were mainly the aminoacids methionine, arginine, histidine, and serine and alsothe acylcarnitine C5 and the sum of hexoses (resultscombined from best classifier and frequency analysis). Itremains to be explained why altered amino acid concen-trations were particularly associated with Z. segmental,but their overrepresentation is consistent with the no-tion that its pathogenesis differs from that of Z. menin-goencephalitis. Highly discriminatory biomarkers werealso identified even for the differentiation between Z.facial and idiopathic Bell’s palsy (SM(OH) C14:1, glycine,and tryptophan), two conditions that can present withthe same clinical signs and symptoms. Infectious or in-flammatory etiologies have been postulated for Bell’spalsy, but our results suggest that this is not the case, atleast in individuals with normal CSF leukocyte count.
Comparison of standard diagnostic markers andmetabolite biomarker candidatesThis is, to our knowledge, the first study to quantify thediscriminatory ability of standard CSF parameters forthe differentiation among distinct forms of VZV reacti-vation and diverse control groups. The results under-score the value of determining CSF leukocyte count inselected scenarios, for instance to evaluate the likelihoodof disseminated CNS VZV infection. Elevated lactateconcentrations (> 3.5 mM) are useful to differentiatebacterial from viral meningitis [49], but lactate also dem-onstrated considerable value in selected comparisons,particularly involving Z. meningoencephalitis. However,there were several scenarios where traditional CSF pa-rameters were of limited value, for instance for differen-tiating between Z. meningoencephalitis and ent. men orZ. facial. Of note, metabolite biomarkers proved to bemore accurate for these potentially clinically relevantcomparisons, underscoring the potential importance ofour findings to clinical practice. In addition, metabolitebiomarkers might be particularly valuable in settingswhere established markers such as leukocyte count areunreliable, as in immunocompromised patients [50]. Se-lected combinations of markers led to further improve-ment of discrimination in all comparisons but one. Allthese examples imply that metabolomics screening ofCSF can reveal metabolites superior to routine diagnos-tics for selected scenarios and therefore constitutes apowerful approach to identify novel biomarkers for CNSinfections and other neurological diseases. AlthoughCSF is not an easily accessible body fluid and lumbarpuncture is an invasive method, it is nevertheless rou-tinely performed and important to diagnose many dis-eases of the nervous system, as also emphasized by
Reiber [28] and Zunt and Marra [51], among others. Inaddition, an increasing number of publications investi-gate CSF metabolite profiles especially for neurodegener-ative disorders. We are currently preparing a study toassess the value of serum and CSF pairs for routine diag-nostics in order to test whether peripheral blood metab-olite markers might potentially replace CSF markersobtained by the invasion lumbar puncture. Nevertheless,the analysis of CSF is still the method of choice todiagnose CNS diseases. This primarily diagnostic studywas not powered to assess associations between bio-marker concentrations and disease severity within agiven group. As outlined above, the metabolites moststrongly associated with Z. meningoencephalitis couldbe functionally linked to CNS stress and, thus, end-organ damage of the infection. Considering that tra-ditional diagnostics (including VZV viral load) do notpredict disease severity or outcome, it is conceivablethat CSF metabolites may prove superior for the earlyidentification of patients requiring higher levels ofcare or follow-up. Along the same lines, it is possiblethat changes in CSF metabolites follow different kin-etics than viral nucleic acids in CSF, allowing for theuse of metabolite biomarkers outside the narrow timewindow during which PCR is positive.
LimitationsEven though we used a relatively broad screen encom-passing several analyte classes, the 88 analytes thatpassed the quality assessment represent only a subpop-ulation of potentially important molecules in CSF.Therefore, broader and more sensitive screens mightunveil additional important metabolite changes. Theannotated sphingo- and glycerophospholipids measuredwith the targeted MS/MS approach inherent to the Bio-crates AbsoluteIDQ®-p180 kit can also stem from iso-mers and isobars [52], which makes it more difficult toinfer about pathophysiological mechanisms. However,detection of a combined lipid signal can nevertheless beuseful in biomarker research and diagnostics. As appar-ent from Fig. 1, 34 metabolites were detected only in75–99% of all samples, which is inherent to the overalllow abundance of these metabolites in CSF, but not tothe absence or presence of these metabolites in any par-ticular patient group. Nevertheless, our overall detec-tion rate of 88/188 metabolites (=47%) agrees well withprevious reports analyzing metabolites in CSF withthese kits [30, 37]. Regarding sample quality, the sam-ples were collected during an 8-year period, potentiallyintroducing artifacts from differences in stability duringstorage. However, we did not find any obvious associa-tions between analyte concentrations and year of sam-ple collection (data not shown). We used samples frompatients with normal pressure hydrocephalus as non-
Kuhn et al. Journal of Neuroinflammation (2018) 15:20 Page 13 of 15
inflamed controls. Even though CSF from this condi-tion is likely not completely comparable to CSF fromhealthy individuals, the standard CSF indices werewithin the normal range. CSF parameters may changewith age, and we are not aware of any data regardingage-associated changes in CSF of the metabolites inves-tigated. Only limited follow-up information was avail-able from most patients, thus limiting our ability toinclude patient outcomes in the analyses. The limitedsample numbers are inherent to the low incidences ofsome of the clinical presentations studied and the factthat lumbar puncture is only rarely performed on pa-tients with uncomplicated shingles. We therefore usedan internal cross-validation method to identify the mostvalid biomarker candidates.
ConclusionsThe results suggest that assessing CSF metabolite pat-terns may be a powerful tool for identifying small-molecule biomarkers for diagnosis and risk stratificationof CNS infections, extent and nature of neuroinflamma-tion, and to improve our understanding of the pathogen-esis of VZV reactivation at the organismal level.Considering the observed differences between Z. menin-goencephalitis and ent. men, it is tempting to speculatethat patterns characteristic of certain pathogens orpathogen families can be identified which could aid inestablishing a diagnosis in patients in whom a pathogencannot be detected.
Additional file
Additional file 1: Figure S1. Biclustering analysis based on differentiallyabundant metabolites. Fold changes (ratio of mean concentrations in eachgroup relative to control) of metabolites with significant across-groupdifferences (uncorrected Kruskal-Wallis P value < 0.05, n= 39) were used asinput using the R function gplots::heatmap.2 (www.r-project.org, Authors:Andy Liaw; revised by R. Gentleman, M. Maechler, W. Huber, G. Warnes).Between-group relationships support those identified in the nonmetric MDSanalysis (Fig. 2). The greatest concentration changes are evident in Z.meningoencephalitis. Some co-regulation of metabolites is evident in thedendrogram, in particular clustering of five almost exclusively downregulatedmetabolites (including Arg, Trp and Ser, and the sum of hexoses (H1), all ofwhich correlated negatively with CSF leukocyte count, see Fig. 5). Theapparent upregulation of C5 in the Z. facial group was due to four patientswith high concentrations of unknown significance. (TIFF 337 kb)
AbbreviationsAUC: Area under the curve; CI: Confidence interval; CRP: C-reactive protein;CSF: Cerebrospinal fluid; LOD: Limit of detection; MDS: Multidimensionalscaling; MS/MS: Tandem mass spectrometry; PC: Phosphatidylcholine;ROC: Receiver operating characteristic; SM: Sphingomyelin; VZV: Varicellazoster virus
AcknowledgementsThe authors thank Annette Garbe for the expert technical support andBettina Fries (Stony Brook University, Stony Brook, NY) for a critical reading ofthe manuscript and helpful discussion.
FundingFunding for this work was provided by iMed – the Helmholtz Association’sInitiative on Personalized Medicine (to MK, FP, and MKA), the HelmholtzAssociation’s Portfolio Topic “Metabolic Dysfunction and Chronic Diseases”(to MK, FP, and MKA), the Young Academy of Hannover Medical School(Junge Akademie MHH, awarded to KWS), and the Niedersachsen ResearchNetwork on Neuroinfectiology (N-RENNT) of the Ministry of Science andCulture of Lower Saxony (awarded to MS). The funding bodies had no rolesin the design of the study and collection, analysis, and interpretation of dataand in writing and submitting the manuscript.
Availability of data and materialsThe dataset obtained and analyzed in the current study is available from thecorresponding author on a reasonable request.
Authors’ contributionsFP, KWS, and MS designed the study. FP, MK, and KWS wrote the manuscript.KWS and MS provided the CSF samples and clinical data. MK provided themass spectrometry measurements, data analysis, and graphics. MKA, JW, andFK provided the data analysis and graphics. KWS and TS collected thepatient data. VK oversaw the mass spectrometry measurements. All authorsedited the manuscript and approved the final version.
Ethics approval and consent to participateThis present study included patient samples which were retrospectivelyselected from a sample collection which was approved by the EthicsCommittee of Hannover Medical School (file no. 2413-2014) and conductedaccording to the Helsinki Declaration.
Consent for publicationNot applicable.
Competing interestsThe authors declare that they have no competing interests.
Publisher’s NoteSpringer Nature remains neutral with regard to jurisdictional claims inpublished maps and institutional affiliations.
Author details1TWINCORE Centre for Experimental and Clinical Infection Research GmbH,Feodor-Lynen-Str. 7, 30625 Hannover, Germany. 2Helmholtz-Centre forInfection Research, Inhoffenstr. 7, 38124 Braunschweig, Germany. 3Centre forIndividualized Infection Medicine, Feodor-Lynen-Str. 15, 30625 Hannover,Germany. 4Clinical Neuroimmunology and Neurochemistry, Department ofNeurology, Hannover Medical School, Carl-Neuberg-Str. 1, 30625 Hannover,Germany. 5Ostfalia University, Salzdahlumer Str. 46/48, 38302 Wolfenbüttel,Germany. 6Research Core Unit Metabolomics, Hannover Medical School,Carl-Neuberg-Str. 1, 30625 Hannover, Germany. 7Center for SystemsNeuroscience, Bünteweg 2, 30559 Hannover, Germany.
Received: 11 October 2017 Accepted: 12 December 2017
References1. Brisson M, Edmunds WJ, Law B, Gay NJ, Walld R, Brownell M, Roos LL, De
Serres G. Epidemiology of varicella zoster virus infection in Canada and theUnited Kingdom. Epidemiol Infect. 2001;127:305–14.
2. Ultsch B, Siedler A, Rieck T, Reinhold T, Krause G, Wichmann O. Herpes zosterin Germany: quantifying the burden of disease. BMC Infect Dis. 2011;11:173.
3. Gilden D, Cohrs RJ, Mahalingam R, Nagel MA. Varicella zoster virusvasculopathies: diverse clinical manifestations, laboratory features,pathogenesis, and treatment. Lancet Neurol. 2009;8:731–40.
4. George BP, Schneider EB, Venkatesan A. Encephalitis hospitalization rates andinpatient mortality in the United States, 2000-2010. PLoS One. 2014;9:e104169.
5. Wilson DA, Yen-Lieberman B, Schindler S, Asamoto K, Schold JD, ProcopGW. Should varicella-zoster virus culture be eliminated? A comparison ofdirect immunofluorescence antigen detection, culture, and PCR, with ahistorical review. J Clin Microbiol. 2012;50:4120–2.
6. Debiasi RL, Tyler KL. Molecular methods for diagnosis of viral encephalitis.Clin Microbiol Rev. 2004;17:903–25.
Kuhn et al. Journal of Neuroinflammation (2018) 15:20 Page 14 of 15
7. Persson A, Bergstrom T, Lindh M, Namvar L, Studahl M. Varicella-zoster virusCNS disease—viral load, clinical manifestations and sequels. J Clin Virol.2009;46:249–53.
8. Aberle SW, Aberle JH, Steininger C, Puchhammer-Stockl E. Quantitative realtime PCR detection of varicella-zoster virus DNA in cerebrospinal fluid inpatients with neurological disease. Med Microbiol Immunol. 2005;194:7–12.
9. Grahn A, Studahl M. Varicella-zoster virus infections of the central nervoussystem—prognosis, diagnostics and treatment. J Inf Secur. 2015;71:281–93.
10. Kaewpoowat Q, Salazar L, Aguilera E, Wootton SH, Hasbun R. Herpessimplex and varicella zoster CNS infections: clinical presentations, treatmentsand outcomes. Infection. 2016;44:337–45.
11. Corti M, Villafane MF, Vittar N, Banco MC, Priarone M, Mammana L, Gilardi L.Meningoencephalitis due to varicella zoster virus in aids patients. Report ofeleven cases and review of the literature. Rev Inst Med Trop Sao Paulo.2015;57:505–8.
12. Nagel MA, Cohrs RJ, Mahalingam R, Wellish MC, Forghani B, Schiller A,Safdieh JE, Kamenkovich E, Ostrow LW, Levy M, et al. The varicella zostervirus vasculopathies: clinical, CSF, imaging, and virologic features.Neurology. 2008;70:853–60.
13. Grahn A, Hagberg L, Nilsson S, Blennow K, Zetterberg H, Studahl M.Cerebrospinal fluid biomarkers in patients with varicella-zoster virus CNSinfections. J Neurol. 2013;260:1813–21.
14. Lindstrom J, Grahn A, Zetterberg H, Studahl M. Cerebrospinal fluid viral loadand biomarkers of neuronal and glial cells in Ramsay Hunt syndrome. Eur JNeurosci. 2016;44:2944–9.
15. Martinez-Morillo E, Hansson O, Atagi Y, Bu G, Minthon L, Diamandis EP,Nielsen HM. Total apolipoprotein E levels and specific isoform compositionin cerebrospinal fluid and plasma from Alzheimer’s disease patients andcontrols. Acta Neuropathol. 2014;127:633–43.
16. Fonteh AN, Cipolla M, Chiang J, Arakaki X, Harrington MG. Humancerebrospinal fluid fatty acid levels differ between supernatant fluid andbrain-derived nanoparticle fractions, and are altered in Alzheimer’s disease.PLoS One. 2014;9:e100519.
17. Trushina E, Dutta T, Persson XM, Mielke MM, Petersen RC. Identification ofaltered metabolic pathways in plasma and CSF in mild cognitive impairmentand Alzheimer’s disease using metabolomics. PLoS One. 2013;8:e63644.
18. Koal T, Klavins K, Seppi D, Kemmler G, Humpel C. Sphingomyelin SM(d18:1/18:0) is significantly enhanced in cerebrospinal fluid samples dichotomizedby pathological amyloid-beta42, tau, and phospho-tau-181 levels. JAlzheimers Dis. 2015;44:1193–201.
19. Pieragostino D, D'Alessandro M, di Ioia M, Rossi C, Zucchelli M, Urbani A, DiIlio C, Lugaresi A, Sacchetta P, Del Boccio P. An integrated metabolomicsapproach for the research of new cerebrospinal fluid biomarkers of multiplesclerosis. Mol BioSyst. 2015;11:1563–72.
20. Wikoff WR, Pendyala G, Siuzdak G, Fox HS. Metabolomic analysis of thecerebrospinal fluid reveals changes in phospholipase expression in the CNSof SIV-infected macaques. J Clin Invest. 2008;118:2661–9.
21. Haughey NJ, Zhu X, Bandaru VV. A biological perspective of CSF lipids assurrogate markers for cognitive status in HIV. J NeuroImmune Pharmacol.2013;8:1136–46.
22. O'Sullivan A, Willoughby RE, Mishchuk D, Alcarraz B, Cabezas-Sanchez C,Condori RE, David D, Encarnacion R, Fatteh N, Fernandez J, et al.Metabolomics of cerebrospinal fluid from humans treated for rabies. JProteome Res. 2013;12:481–90.
23. Dietmann A, Putzer D, Beer R, Helbok R, Pfausler B, Nordin AJ, Virgolini I,Grams AE, Schmutzhard E. Cerebral glucose hypometabolism in tick-borneencephalitis, a pilot study in 10 patients. Int J Infect Dis. 2016;51:73–7.
24. Mason S, van Furth AM, Mienie LJ, Engelke UF, Wevers RA, Solomons R,Reinecke CJ. A hypothetical astrocyte-microglia lactate shuttle derived from a1H NMR metabolomics analysis of cerebrospinal fluid from a cohort of SouthAfrican children with tuberculous meningitis. Metabolomics. 2015;11:822–37.
25. Vincent IM, Daly R, Courtioux B, Cattanach AM, Biéler S, Ndung'u JM, BisserS, Barrett MP. Metabolomics identifies multiple candidate biomarkers todiagnose and stage human African trypanosomiasis. PLoS Negl Trop Dis.2016;10:e0005140.
26. Adams RD, Fisher CM, Hakim S, Ojemann RG, Sweet WH. Symptomaticoccult hydrocephalus with “normal” cerebrospinal-fluid pressure. A treatablesyndrome. N Engl J Med. 1965;273:117–26.
27. Hakim S, Adams RD. The special clinical problem of symptomatichydrocephalus with normal cerebrospinal fluid pressure. Observations oncerebrospinal fluid hydrodynamics. J Neurol Sci. 1965;2:307–27.
28. Reiber H. Cerebrospinal fluid—physiology, analysis and interpretation of proteinpatterns for diagnosis of neurological diseases. Mult Scler. 1998;4:99–107.
29. Reiber H. External quality assessment in clinical neurochemistry: survey ofanalysis for cerebrospinal fluid (CSF) proteins based on CSF/serumquotients. Clin Chem. 1995;41:256–63.
30. Bogumil R, Röhring C, Dammeier S, Namendorf C, Uhr M. Targetedmetabolomics analysis of cerebrospinal fluid using the AbsoluteIDQ™ kit(application note 1003-1). Laborwelt. 2008:17–23.
31. IBM SPSS Missing Values 19. https://www.csun.edu/sites/default/files/missing-values19.pdf. Accessed 25 July 2017.
32. R: a language and environment for statistical computing. https://www.R-project.org/. Accessed 25 July 2017.
33. Benjamini Y, Hochberg Y. Controlling the false discovery rate: a practicaland powerful approach to multiple testing. J R Stat Soc B. 1995;57:289–300.
34. Varma S, Simon R. Bias in error estimation when using cross-validation formodel selection. BMC Bioinformatics. 2006;7:91.
35. Ambroise C, McLachlan GJ. Selection bias in gene extraction on the basis ofmicroarray gene-expression data. Proc Natl Acad Sci U S A. 2002;99:6562–6.
36. Wilson DR, Martinez TR. Improved heterogeneous distance functions. J ArtifIntell Res. 1997;6:1–34.
37. Mandal R, Guo AC, Chaudhary KK, Liu P, Yallou FS, Dong E, Aziat F, Wishart DS.Multi-platform characterization of the human cerebrospinal fluid metabolome:a comprehensive and quantitative update. Genome Med. 2012;4:38.
38. Perrotta C, Cervia D, De Palma C, Assi E, Pellegrino P, Bassi MT, Clementi E. Theemerging role of acid sphingomyelinase in autophagy. Apoptosis. 2015;20:635–44.
39. Taniguchi M, Okazaki T. The role of sphingomyelin and sphingomyelinsynthases in cell death, proliferation and migration-from cell and animalmodels to human disorders. Biochim Biophys Acta. 1841;2014:692–703.
40. Takahashi M-N, Jackson W, Laird DT, Culp TD, Grose C, Haynes JI, Benetti L.Varicella-zoster virus infection induces autophagy in both cultured cells andhuman skin vesicles. J Virol. 2009;83:5466–76.
41. Grose C, Buckingham EM, Carpenter JE, Kunkel JP. Varicella-zoster virusinfectious cycle: ER stress, autophagic flux, and amphisome-mediatedtrafficking. Pathogens. 2016;5:E67.
42. Neugebauer S, Giamarellos-Bourboulis EJ, Pelekanou A, Marioli A, BaziakaF, Tsangaris I, Bauer M, Kiehntopf M. Metabolite profiles in sepsis:developing prognostic tools based on the type of infection. Crit CareMed. 2016;44:1649–62.
43. Scarpelini B, Zanoni M, Sucupira MC, Truong HM, Janini LM, da Silva ID, DiazRS. Correction: plasma metabolomics biosignature according to HIV stage ofinfection, pace of disease progression, viremia level and immunologicalresponse to treatment. PLoS One. 2017;12:e0173164.
44. Zhang J, Zhang Z, Chukkapalli V, Nchoutmboube JA, Li J, Randall G, Belov GA,Wang X. Positive-strand RNA viruses stimulate host phosphatidylcholinesynthesis at viral replication sites. Proc Natl Acad Sci U S A. 2016;113:E1064–73.
45. Lauber K, Bohn E, Krober SM, Xiao YJ, Blumenthal SG, Lindemann RK, MariniP, Wiedig C, Zobywalski A, Baksh S, et al. Apoptotic cells induce migrationof phagocytes via caspase-3-mediated release of a lipid attraction signal.Cell. 2003;113:717–30.
46. Li X, Fang P, Li Y, Kuo YM, Andrews AJ, Nanayakkara G, Johnson C, Fu H,Shan H, Du F, et al. Mitochondrial reactive oxygen species mediatelysophosphatidylcholine-induced endothelial cell activation. ArteriosclerThromb Vasc Biol. 2016;36:1090–100.
47. Zhong Z, Wheeler MD, Li X, Froh M, Schemmer P, Yin M, Bunzendaul H,Bradford B, Lemasters JJ. L-glycine: a novel antiinflammatory,immunomodulatory, and cytoprotective agent. Curr Opin Clin Nutr MetabCare. 2003;6:229–40.
48. Moura AP, Parmeggiani B, Grings M, Alvorcem LM, Boldrini RM, Bumbel AP,Motta MM, Seminotti B, Wajner M, Leipnitz G. Intracerebral glycineadministration impairs energy and redox homeostasis and induces glialreactivity in cerebral cortex of newborn rats. Mol Neurobiol. 2016;53:5864–75.
49. Kleine TO, Zwerenz P, Zöfel P, Shiratori K. New and old diagnostic markersof meningitis in cerebrospinal fluid (CSF). Brain Res Bull. 2003;61:287–97.
50. Fodor PA, Levin MJ, Weinberg A, Sandberg E, Sylman J, Tyler KL. Atypicalherpes simplex virus encephalitis diagnosed by PCR amplification of viralDNA from CSF. Neurology. 1998;51:554–9.
51. Zunt JR, Marra CM. Cerebrospinal fluid testing for the diagnosis of centralnervous system infection. Neurol Clin. 1999;17:675–89.
52. Anonymous: Annotation of potential isobaric and isomeric lipid speciesmeasured with the AbsoluteIDQ® p180 Kit. DocNr. 35016 V1.0 2016–06.Biocrates Life Sciences AG; 2016.
Kuhn et al. Journal of Neuroinflammation (2018) 15:20 Page 15 of 15