Embed Size (px)
Citation preview
ent 370 (2006) 360–371www.elsevier.com/locate/scitotenv
Science of the Total Environm
Mass transfer of soil indoors by track-in on footwear
Andrew Hunt a,⁎, David L. Johnson b, Daniel A. Griffith c
a Upstate New York Specialist Environmental Consulting (UNYSPEC), P.O. Box 91, Baldwinsville, NY 13027, USAb Department of Chemistry, State University of New York, College of Environmental Science and Forestry,
1 Forestry Drive, Syracuse, NY 13210, USAc School of Social Sciences, University of Texas at Dallas, Box 830688, Richardson, Texas 75083, USA
Received 21 July 2005; received in revised form 5 July 2006; accepted 6 July 2006Available online 7 September 2006
Abstract
Inadvertent soil ingestion, especially by young children, can be an important route of exposure for many environmentalcontaminants. The introduction of exterior soil into the interior environment is a significant element of the exposure pathway. Theunintentional collection of outside soil on footwear followed by subsequent deposition indoors is a principal route of soil ingress.Here we have investigated likely rates of dry and wet soil deposition on indoor hard surface flooring as a result of mass transferfrom soiled footwear. In this pilot study, testing involved both single track-in events (with deposition resulting from a singleprogression of transfer steps) and multiple tracking actions (with deposition and dispersion resulting from repeated transfer steps).Based on soil mass recovery from the floor surface it was found that any contamination introduced by one-time track-in events wasof limited spatial extent. In contrast, under repeated tracking conditions, with multiple soil incursions, widespread floor surfacecontamination was possible. Soil mass recovery was accomplished by brushing, by vacuum cleaner removal and by wet wiping.All the clean-up methods operated imperfectly and failed to remove all initially deposited soil. The level of floor surface soiling thatresulted from the track-in tests, and the incomplete clean-up strongly suggest that under unrestricted transfer conditions rapidaccumulation and dispersal of soil on indoor flooring is likely.© 2006 Elsevier B.V. All rights reserved.
Keywords: Soil; Floor-dust; Contamination; Footwear; Tracking
1. Introduction
Indoor floor dust is a heterogeneous melange of or-ganic and inorganic particulate matter (USEPA, 1997).This medium is composed of material that is derivedfrom a variety of interior and exterior sources (Butte andHeinzow, 2002). From a human health exposure per-spective, the presence of hazardous materials in indoordust (e.g., heavy metals, pesticides) can be of consider-
⁎ Corresponding author. P.O. Box P1, Baldwinsville, NY 13027,USA.
E-mail address: [email protected] (A. Hunt).
0048-9697/$ - see front matter © 2006 Elsevier B.V. All rights reserved.doi:10.1016/j.scitotenv.2006.07.013
able importance (Roberts and Dickey, 1995). Inadvertentingestion of indoor dust by children through hand-to-mouth activity or inhalation following mechanical re-suspension can be important routes of exposure.
A recognized common constant process by whichindoor floor dust mass is accumulated is by mechanicaltransport (e.g., on footwear) of outdoor dust and soil(Fry et al., 1985; Cannell et al., 1987; Allott et al., 1994).A substantial fraction of indoor dust can be derived fromoutdoor soil. Estimates of the exterior soil contributionshave been proposed in the ranges from 20–30% (Davieset al., 1985; Culbard et al., 1988; Rutz et al., 1997), to30–45% (Fergusson and Kim, 1991; Trowbridge and
361A. Hunt et al. / Science of the Total Environment 370 (2006) 360–371
Burmaster, 1997), and the United States EnvironmentalProtection Agency (USEPA, 1994) uses (for modelingpurposes) a default mass fraction of soil in indoor dustof 70% (MSD=0.7). It has, however, been estimated thatas much as 85% of indoor dust is from outside the home(Roberts et al., 1991). Such a contribution to indoor dustis important because soil and dust ingestion is commonamong young children. Daily intake is likely to bebetween 39 mg/day and 271 mg/day with an average of138 mg/day, and 193 mg/day for soil and dust ingestion(USEPA, 2004). Exposure of this magnitude is of con-cern where outdoor soil and dust can be a vector foroutdoor contaminants (Paustenbach et al., 1997). Theintroduction into the indoor environment of herbicidesand pesticides applied outdoors is well recognized (Lewiset al., 1994, Nishioka et al., 1999, Lewis and Nishioka,1999). Similarly, correlations between outdoor soil andindoor dust lead (Pb) levels (e.g., Thornton et al., 1990)are strongly suggestive of indoor transfer of metals insoils. The National Survey of Lead-Based Paint inHousing in the United States demonstrated that exteriorsoil Pb contributes (statistically) to indoor floor dust lead(USEPA, 1993). The importance of the relationship be-tween outdoor soil, indoor dust and Children's blood Pblevels has also been amply documented in many epide-miologic studies (see Lanphear et al., 1998). The Pbcontamination exposure pathway from soil to indoor dusthas been documented through the application of structuralequation models (Marcus and Elias, 1995), that havedemonstrated that soil lead operating through dust Pb ordust on children's hands is an indirect influence of child-ren's blood Pb at various sites (Succop et al., 1998).Measured reductions in indoor dust Pb levels followingefforts to remove and control outdoor soil and dust Pbfurther demonstrate the importance of the track-in ofmetal contaminants (e.g., Von Lindern et al., 2003), as doreductions in pediatric blood Pb levels following outdoorsoil abatement accompanied by a marked decrease inhouse dust Pb (Aschengrau et al., 1994).
Integral to assessments of the exposure threat posed bycontaminated indoor dust derived from outdoor sourcesare questions relating to the degree and rate of mechanicalincursion, residence time of deposited dust, and rates ofremoval. In this study we examine the fate of exterior soiltracked into the indoor environment. The focus is largelyon initial indoor incursions. The interface between theexterior and the interior environment is an important one asit usually marks a rapid transition from one set of surfaceconditions outdoors (e.g., frequently heterogeneous andunconsolidated) to a quite different set indoors (e.g., ho-mogenous and fixed with generally a different surfaceroughness). Concomitant with such abrupt change is an
expected interruption in transport processes. Resultingfailure of continued mass transport presents the possibilityof rapid deposition and contamination. To investigate this,we conducted a pilot study comprised of a number ofexperiments aimed at assessing the likely rates of small-scale indoor deposition and dispersion of both dry and wetsoil on footwear. Here, we used a direct soil mass deposi-tion and recovery method. Unlike indirect tracing tech-niques, which focus on a specific exogenous component ofthe medium, such as those that use a fluorescent tracer(e.g., Cannell et al., 1987) our approach reports on actualparticle dispersal and is not particle size or density depen-dent. Like other tracing methods, our approach is limitedby the amount of material that can be measured afterdeposition (the method detection limit). The dust recoverymethodwe have used is limited by themass ofmaterial thatcan be detected gravimetrically on the collection medium.
In addition to dry soil, wet soil track-in was assessedas it is recognized that indoor floor dust loadings canincrease in wetter weather conditions due to wet dirt andsoil track-in (Al-Radady et al., 1994; Petrosyan et al.,2006), and this effect may account for elevated indoorloadings in winter months in regions with cold wet condi-tions without continuously frozen, snow-covered, ground(Laxen et al., 1988). Even in regionswith significant snowseasons, at wet transitional times (preceding and succeed-ing the winter moths) indoor loadings can increase due towet soil and dust track-in, which may even occur duringthe winter months due to contaminated snow track-in(Yiin et al., 2000). All of the tests in this study involvedunrestricted transfer in that once soil was adhering to ashoe's sole no initial efforts were made to reduce the soilloading (e.g., by wiping on an entrance mat). The studyalso examined the effect of different sole types on deposi-tion and dispersal (smooth versus tread pattern soles). Inaddition, we evaluated the relative effectiveness of dif-ferent mechanical removal mechanisms, by comparingvacuum (cleaner) removal with brushing and wet wiping.The flooring surface of choice in this study was typicalhard surface vinyl floor tiling.
2. Materials
Tracking experiments withwet and dry soils employedsub-samples of a composite surface soil from Syracuse,NY. This composite soil consisted of an amalgamation ofover 150 samples of urban yard soil collected during aprevious investigation (Johnson and Bretsch, 2002). As79% of the U.S. population reside in urban areas (U.S.Census Bureau, 2000), it was deemed appropriate to use arepresentative urban soil to investigate soil track-inprocesses. Prior to use, the composite soil was air dried,
362 A. Hunt et al. / Science of the Total Environment 370 (2006) 360–371
ground, and screened through an 85 μm nylon mesh. Forthe wet soil tracking experiments, the soil was prepared asa slurry. A wet-mud-like consistency for the soil wasachieved after several tests. A mixture of 2 g of test soiland 2 ml of water produced a wet paste with a non-pourable consistency. This volume-to-mass ratio was usedfor each wet soil track test.
Deposition tests involved two (shoe) sole types: aflat, smooth leather sole and a rubber sole with a finetread (U.S. size 11). Both sole types were used in boththe wet and dry soil tracking tests to identify any majorvariations in soil retention by such different sole types.The tests were conducted with 12ʺ×12ʺ Armstrong®vinyl floor tiles. In no test was the same tile set usedmore than once.
The mass of soil deposited in each experiment wasdetermined gravimetrically. Deposited soil recovery formass determinations was either by wet-wiping, vacuum-ing or brushing. These removal methods were chosen toprovide some comparison of the likely efficiency of clean-up methods typically used to remove deposited surfacedust from residential flooring. Wet wiping of tile surfacesemployed commercially available Ghost Wipes®. Thesewipes, each consisting of 15 cm×14 cm squares of cross-linked polyvinyl alcohol material, meet all ASTM E1792specifications for sampling materials for Pb in surfacedust and OSHA Methods ID-125G. Wet wiping is prob-ably the most widely used method of sampling indoorsurfaces for dust borne contaminants (e.g., HUD, 2001).Here, wet wiping removal of material from a tile surfacewas accomplished by following a modified version of theASTM E1728-02 wiping methods. The same pattern ofsurface wiping was used across the entire surface of a tilebut repeated until the tile surface visually appeared free ofdeposited soil. In some instances (depending on the test orthe loading of deposited soil), multiple wipes were usedon an individual tile. To determine the mass of soil re-covered, each wipe was initially dried overnight at 60 °C,set aside to equilibrate in the lab for a minimum of threedays, and then pre-weighed. Prior to wipe recovery eachwipe was wetted with distilled water and after samplingwas again dried and weighed. The laboratory dry and wetbulb temperatures were measured during pre- and post-sampling weighing and a relative humidity correctionfactor was applied before determining the recovered soilmass by difference. Vacuum removal of dust employed anon-commercial test vacuum cleaner. This employed amodified General Electric vacuum cleaner motor andblower assembly (Model AVF28) with dust collection fol-lowing the method of Watt et al. (1983) using a pre-weighed Whatman 25 mm×80 mm single thickness ex-traction thimble (nominal pore size ∼10 μm). A 1/2ʺ Bel
Art tubing connector “T” with an inlet ∼3.5 mm×62 mmwith a face velocity of∼225 cmper secondwas used as thenozzle for sampling. Brushing removal was accomplishedusing a hand-held, stiff bristle brush. A stiff bristle hand-brush was chosen to affect the most complete (mechanical)removal of dried soil from the tile surface. Brush removedsoilwas collected on pre-weighed glassene paper. Brushingwas continued until no more soil could be removed fromthe tile.
3. Methods
Thewet soil deposition tests were designed to simulatethe immediate indoor shoe-to-floor transfer of wet soilfrom a single ingress event. These tests were conductedwith eight floor tiles. The tests involved the application ofa (subsequently) known mass of wet soil to the sole of atest shoe. Each shoe was then walked across four tiles. Atthe start of a test the wet soil (prepared in a mixing bowl)was pasted evenly by spatula over the entire toe area of ashoe sole. The wet soil was not applied to the heel or theinstep of the shoe. To assess themass deposition per tile ineach test approximately 2 g of wet soil was prepared forapplication to the shoe sole. Following each test, any soilthat remained in the mixing bowl was recovered todetermine the mass of soil not applied to the shoe sole. Inaddition, any soil adhering to the sole of the shoe oncompletion of the test was washed off and filtered througha pre-weighed Whatman qualitative filter. The mass offiltered soil was determined following overnight dryingand room temperature equilibration.With the exception oftwo track tests, deposition was initiated immediately afterthe wet soil was applied to the sole of the shoe. In the finaltwo tracking tests (with smooth soled shoes), the wet soilwas allowed to dry on the sole for approximately oneminute until the wet sheen on the wet soil vanished. Thewet deposition test was replicated eight times (twice witheach sole type).
The dry soil deposition tests were conducted withtwo sets of five tiles that provided separate depositionsurfaces for right and left shoes. For each single track-intest approximately 10 g of soil was evenly spread acrossa plastic tray simulating an exterior source of dry friablesoil. At the start of each test both right and left shoeswere pressed (under the weight of the tester) into the testsoil to acquire a coating of dry soil on the sole and heel ofeach shoe. After this one-time coating of the soles, eachshoe was trodden in sequence on each of the assignedfive tiles. Following each test, any soil adhering to thesole of the shoe was washed off and filtered through apre-weighed qualitative filter. The mass of filtered soilwas determined following overnight drying and room
363A. Hunt et al. / Science of the Total Environment 370 (2006) 360–371
temperature equilibration. The dry deposition test wasreplicated four times (twice with each sole type). Soilrecovery from tiles was accomplished by both wet wiping(following track-in tests using smooth and treaded soles)and vacuum removal (after the other smooth and treadedsole track-in tests).
To assess the spatial distribution of track-in dry soilfollowing multiple tracking events with multiple incur-sions of dry soil, a similar experimental set-up as thesingle track-in of dry soil test was employed. The testwas designed to simulate the repeated tracking across atile floor room following multiple introductions of soilon footwear from the outdoor environment. A pristineset of one hundred pre-cleaned floor tiles was arrangedin five adjacent/touching columns of twenty tiles. Thecenter column of 20 tiles was designated the primarydeposition (“walk-on”) surface that was traversed by thetester. The columns of tiles on either side served as adeposition surface for dry soil laterally displaced duringthe tracking tests. The tester did not come into contactwith these adjacent tiles during the experiment, and con-siderable care was taken to confine foot placement withinthe tile area and to accurately replicate the designated stepsequence throughout the experiment. The initial test soilsample (approximately 10 g) was spread across a plastictray large enough to accommodate the test footwear. Atthe start of the experiment the tester stood on the tray andground the sole of the shoe into the dry soil to simulatecollection of dry soil of the shoe in the outdoor environ-ment. The test then involved the tester walking along thecenter column of tiles, alternating between tiles with eachfootfall. In the first pass (forward), the tester trod on 10tiles (5 right and 5 left footfalls). An alternate step patternwas employed that involved a right then left foot sequencewith intervening tiles stepped over (to simulate a naturalstride pattern). At the end of the first forward pass thetester pivoted on tile 20 and then made a return passstepping on the alternate tiles not stepped on during theforward pass. At the end of the return pass, the testerpivoted on the first tile then repeated the forward pass.Each forward and return pass was repeated 10 times.Upon completion of the tenth return pass approximately1 g of dry soil was added to the initial soil reservoir, andthe tester once more stepped onto the soil and ground thefootwear into the soil. The 10 forward and 10 return passsequence was then repeated. In all, this operation wasrepeated five times with intervening soil pick-ups on eachoccasion. On completion of the test, the soil on each of the100 tiles was recovered using separate Ghost wipes (twowipes were used for each of the center “walk-on” tiles).
Following gravimetric analysis of the Ghost wipesamples recovered from the multiple tracking, the wipes
(120, plus 18 blank wipes) were subject to wet ashingand subsequent element analysis by inductively coupledplasma optical emission spectroscopy (ICP-OES). Theacid digest involved adding 5 ml of concentrated nitricacid and 5 ml of distilled water to each wipe followed byboiling to dryness. Each sample was then re-suspendedwith 20 ml of 10% nitric acid and 5 ml of 30% hydrogenperoxide and heated for a further 20 min. Samples weregravity filtered through VWR® 410 qualitative filters andmade up to 25 ml volume with 10% nitric acid. Elementconcentrations were measured on a Perkin Elmer Optima3300DV OES instrument. Calibration and quality controlstandards (10% of the analytes) were made up from com-mercially available primary standards. Element data wasrecorded as tile loadings (quantity of element obtainedfrom each tile) following the subtraction of the (average)blank wipe value from each test wipe value. An elementdetection limit was set at three times the standard deviationof the blank wipe values. At this level of detection, severalof the measured elements (Cu, Zn, Ba, Ca) were onlyreportable for the wipes from the “walk-on” column oftiles, and were not subsequently included in the summaryresults.
The individual particles in the test soil were character-ized by automated scanning electron microscopy (SEM)and X-ray energy spectroscopy (EDX). This techniqueprovides data on the size and elemental composition (X-ray spectral data) of a statistically significant number ofmicroscopic particles in a sample. This analysis wascarried out using an ETEC Autoscan SEM operating intandem with a Advanced Research Instruments (ARI)AutoSEM Image Analysis System and a Kevex 7500 X-ray Spectrometer (Johnson, 1983).During the analysis, 16elemental regions of interest and 32 background regionsfor net X-ray relative intensity computations were as-signed within the X-ray spectrum. The fraction of indi-vidual particle mass contributed by the detected elementswas defined by the X-ray relative intensity times theestimated particle volume (assumed to be a prolate ellip-soid rotated about the long axis). This was weighted bythe common molecular form of occurrence for each ele-ment in the soil (Johnson et al., 1981).
4. Results
In the wet soil deposition tests, between 1.5 g and 2 gof soil was consistently applied to each sole (Table 1).The subsequent track-in tests demonstrated that theamount of wet soil deposited from the shoe soles de-creased with each successive step. Recovery of soil massfrom each successive tile in each experiment revealed aconsistent deposition pattern. This is illustrated in Fig. 1,
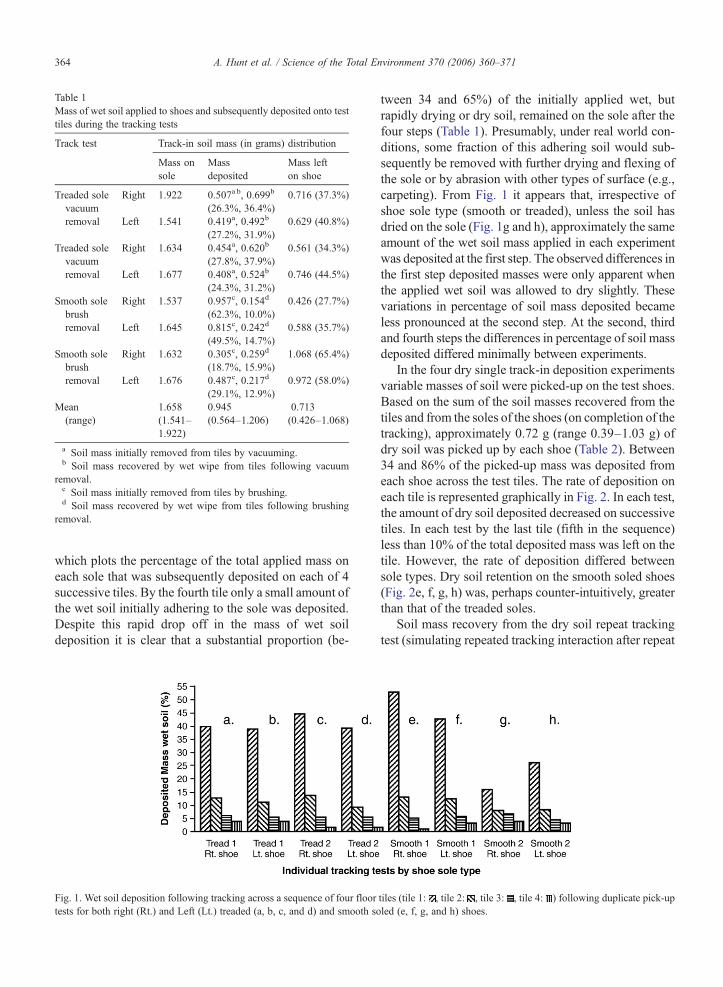
Table 1Mass of wet soil applied to shoes and subsequently deposited onto testtiles during the tracking tests
Track test Track-in soil mass (in grams) distribution
Mass onsole
Massdeposited
Mass lefton shoe
Treaded solevacuumremoval
Right 1.922 0.507a b, 0.699b
(26.3%, 36.4%)0.716 (37.3%)
Left 1.541 0.419a, 0.492b
(27.2%, 31.9%)0.629 (40.8%)
Treaded solevacuumremoval
Right 1.634 0.454a, 0.620b
(27.8%, 37.9%)0.561 (34.3%)
Left 1.677 0.408a, 0.524b
(24.3%, 31.2%)0.746 (44.5%)
Smooth solebrushremoval
Right 1.537 0.957c, 0.154d
(62.3%, 10.0%)0.426 (27.7%)
Left 1.645 0.815c, 0.242d
(49.5%, 14.7%)0.588 (35.7%)
Smooth solebrushremoval
Right 1.632 0.305c, 0.259d
(18.7%, 15.9%)1.068 (65.4%)
Left 1.676 0.487c, 0.217d
(29.1%, 12.9%)0.972 (58.0%)
Mean(range)
1.658(1.541–1.922)
0.945(0.564–1.206)
0.713(0.426–1.068)
a Soil mass initially removed from tiles by vacuuming.b Soil mass recovered by wet wipe from tiles following vacuum
removal.c Soil mass initially removed from tiles by brushing.d Soil mass recovered by wet wipe from tiles following brushing
removal.
364 A. Hunt et al. / Science of the Total Environment 370 (2006) 360–371
which plots the percentage of the total applied mass oneach sole that was subsequently deposited on each of 4successive tiles. By the fourth tile only a small amount ofthe wet soil initially adhering to the sole was deposited.Despite this rapid drop off in the mass of wet soildeposition it is clear that a substantial proportion (be-
Fig. 1. Wet soil deposition following tracking across a sequence of four floortests for both right (Rt.) and Left (Lt.) treaded (a, b, c, and d) and smooth so
tween 34 and 65%) of the initially applied wet, butrapidly drying or dry soil, remained on the sole after thefour steps (Table 1). Presumably, under real world con-ditions, some fraction of this adhering soil would sub-sequently be removed with further drying and flexing ofthe sole or by abrasion with other types of surface (e.g.,carpeting). From Fig. 1 it appears that, irrespective ofshoe sole type (smooth or treaded), unless the soil hasdried on the sole (Fig. 1g and h), approximately the sameamount of the wet soil mass applied in each experimentwas deposited at the first step. The observed differences inthe first step deposited masses were only apparent whenthe applied wet soil was allowed to dry slightly. Thesevariations in percentage of soil mass deposited becameless pronounced at the second step. At the second, thirdand fourth steps the differences in percentage of soil massdeposited differed minimally between experiments.
In the four dry single track-in deposition experimentsvariable masses of soil were picked-up on the test shoes.Based on the sum of the soil masses recovered from thetiles and from the soles of the shoes (on completion of thetracking), approximately 0.72 g (range 0.39–1.03 g) ofdry soil was picked up by each shoe (Table 2). Between34 and 86% of the picked-up mass was deposited fromeach shoe across the test tiles. The rate of deposition oneach tile is represented graphically in Fig. 2. In each test,the amount of dry soil deposited decreased on successivetiles. In each test by the last tile (fifth in the sequence)less than 10% of the total deposited mass was left on thetile. However, the rate of deposition differed betweensole types. Dry soil retention on the smooth soled shoes(Fig. 2e, f, g, h) was, perhaps counter-intuitively, greaterthan that of the treaded soles.
Soil mass recovery from the dry soil repeat trackingtest (simulating repeated tracking interaction after repeat
tiles (tile 1: , tile 2: , tile 3: , tile 4: ) following duplicate pick-upled (e, f, g, and h) shoes.
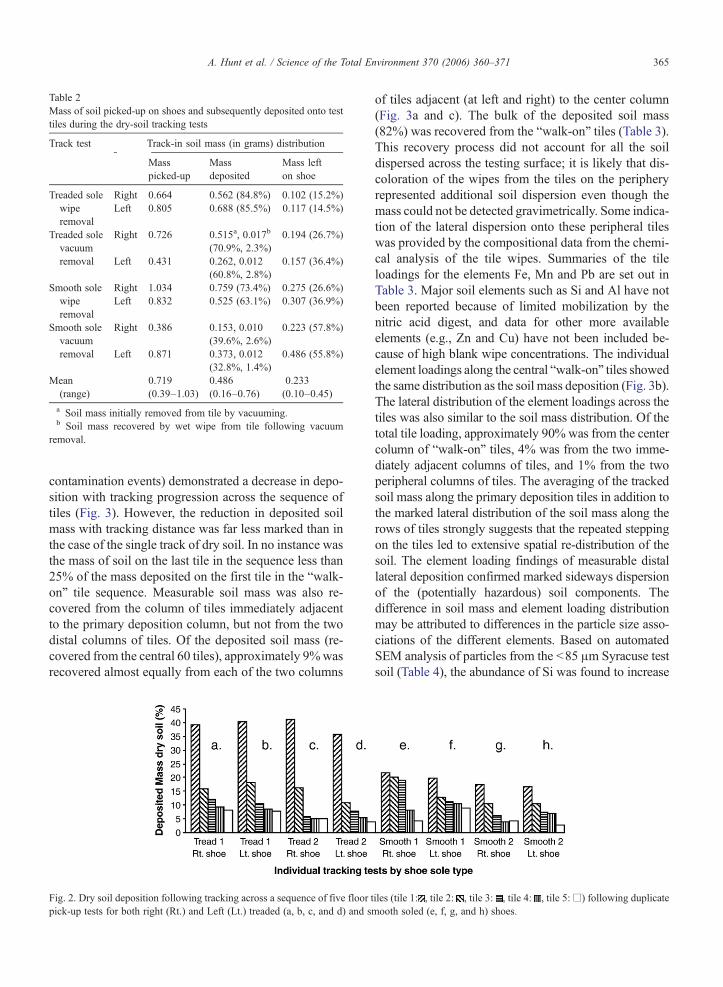
Table 2Mass of soil picked-up on shoes and subsequently deposited onto testtiles during the dry-soil tracking tests
Track test Track-in soil mass (in grams) distribution
Masspicked-up
Massdeposited
Mass lefton shoe
Treaded solewiperemoval
Right 0.664 0.562 (84.8%) 0.102 (15.2%)Left 0.805 0.688 (85.5%) 0.117 (14.5%)
Treaded solevacuumremoval
Right 0.726 0.515a, 0.017b
(70.9%, 2.3%)0.194 (26.7%)
Left 0.431 0.262, 0.012(60.8%, 2.8%)
0.157 (36.4%)
Smooth solewiperemoval
Right 1.034 0.759 (73.4%) 0.275 (26.6%)Left 0.832 0.525 (63.1%) 0.307 (36.9%)
Smooth solevacuumremoval
Right 0.386 0.153, 0.010(39.6%, 2.6%)
0.223 (57.8%)
Left 0.871 0.373, 0.012(32.8%, 1.4%)
0.486 (55.8%)
Mean(range)
0.719(0.39–1.03)
0.486(0.16–0.76)
0.233(0.10–0.45)
a Soil mass initially removed from tile by vacuuming.b Soil mass recovered by wet wipe from tile following vacuum
removal.
365A. Hunt et al. / Science of the Total Environment 370 (2006) 360–371
contamination events) demonstrated a decrease in depo-sition with tracking progression across the sequence oftiles (Fig. 3). However, the reduction in deposited soilmass with tracking distance was far less marked than inthe case of the single track of dry soil. In no instance wasthe mass of soil on the last tile in the sequence less than25% of the mass deposited on the first tile in the “walk-on” tile sequence. Measurable soil mass was also re-covered from the column of tiles immediately adjacentto the primary deposition column, but not from the twodistal columns of tiles. Of the deposited soil mass (re-covered from the central 60 tiles), approximately 9%wasrecovered almost equally from each of the two columns
Fig. 2. Dry soil deposition following tracking across a sequence of five floor tpick-up tests for both right (Rt.) and Left (Lt.) treaded (a, b, c, and d) and s
of tiles adjacent (at left and right) to the center column(Fig. 3a and c). The bulk of the deposited soil mass(82%) was recovered from the “walk-on” tiles (Table 3).This recovery process did not account for all the soildispersed across the testing surface; it is likely that dis-coloration of the wipes from the tiles on the peripheryrepresented additional soil dispersion even though themass could not be detected gravimetrically. Some indica-tion of the lateral dispersion onto these peripheral tileswas provided by the compositional data from the chemi-cal analysis of the tile wipes. Summaries of the tileloadings for the elements Fe, Mn and Pb are set out inTable 3. Major soil elements such as Si and Al have notbeen reported because of limited mobilization by thenitric acid digest, and data for other more availableelements (e.g., Zn and Cu) have not been included be-cause of high blank wipe concentrations. The individualelement loadings along the central “walk-on” tiles showedthe same distribution as the soil mass deposition (Fig. 3b).The lateral distribution of the element loadings across thetiles was also similar to the soil mass distribution. Of thetotal tile loading, approximately 90% was from the centercolumn of “walk-on” tiles, 4% was from the two imme-diately adjacent columns of tiles, and 1% from the twoperipheral columns of tiles. The averaging of the trackedsoil mass along the primary deposition tiles in addition tothe marked lateral distribution of the soil mass along therows of tiles strongly suggests that the repeated steppingon the tiles led to extensive spatial re-distribution of thesoil. The element loading findings of measurable distallateral deposition confirmed marked sideways dispersionof the (potentially hazardous) soil components. Thedifference in soil mass and element loading distributionmay be attributed to differences in the particle size asso-ciations of the different elements. Based on automatedSEM analysis of particles from the b85 μm Syracuse testsoil (Table 4), the abundance of Si was found to increase
iles (tile 1: , tile 2: , tile 3: , tile 4: , tile 5:□) following duplicatemooth soled (e, f, g, and h) shoes.
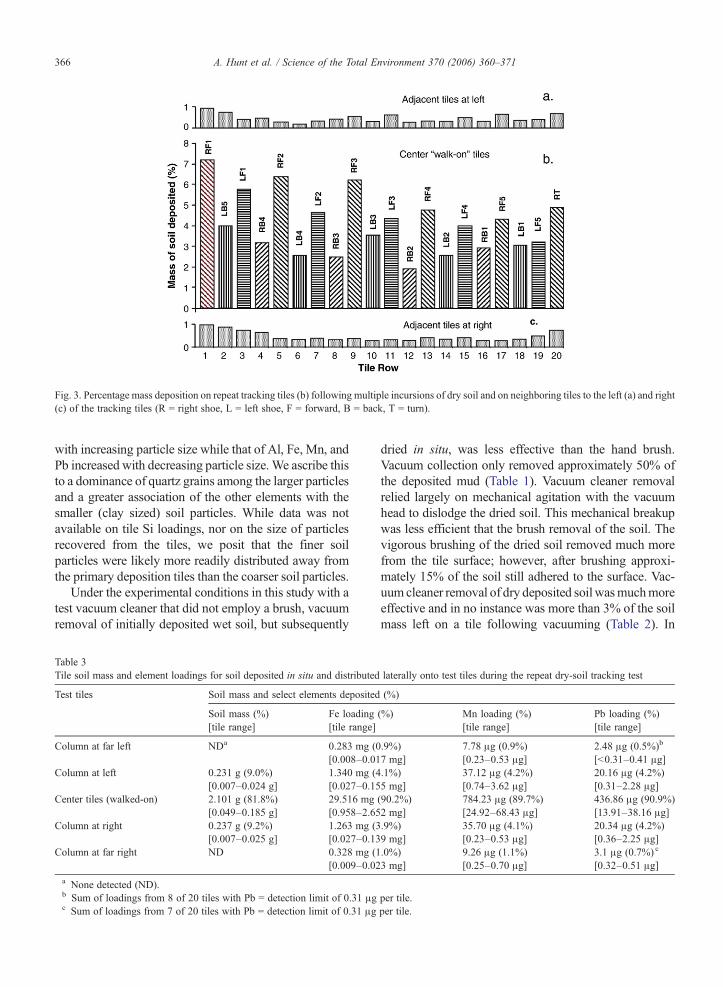
Fig. 3. Percentage mass deposition on repeat tracking tiles (b) following multiple incursions of dry soil and on neighboring tiles to the left (a) and right(c) of the tracking tiles (R = right shoe, L = left shoe, F = forward, B = back, T = turn).
366 A. Hunt et al. / Science of the Total Environment 370 (2006) 360–371
with increasing particle size while that of Al, Fe, Mn, andPb increased with decreasing particle size.We ascribe thisto a dominance of quartz grains among the larger particlesand a greater association of the other elements with thesmaller (clay sized) soil particles. While data was notavailable on tile Si loadings, nor on the size of particlesrecovered from the tiles, we posit that the finer soilparticles were likely more readily distributed away fromthe primary deposition tiles than the coarser soil particles.
Under the experimental conditions in this study with atest vacuum cleaner that did not employ a brush, vacuumremoval of initially deposited wet soil, but subsequently
Table 3Tile soil mass and element loadings for soil deposited in situ and distributed
Test tiles Soil mass and select elements deposited
Soil mass (%)[tile range]
Fe loading[tile range]
Column at far left NDa 0.283 mg (0[0.008–0.01
Column at left 0.231 g (9.0%)[0.007–0.024 g]
1.340 mg (4[0.027–0.15
Center tiles (walked-on) 2.101 g (81.8%)[0.049–0.185 g]
29.516 mg[0.958–2.65
Column at right 0.237 g (9.2%)[0.007–0.025 g]
1.263 mg (3[0.027–0.13
Column at far right ND 0.328 mg (1[0.009–0.02
a None detected (ND).b Sum of loadings from 8 of 20 tiles with Pb = detection limit of 0.31 μgc Sum of loadings from 7 of 20 tiles with Pb = detection limit of 0.31 μg
dried in situ, was less effective than the hand brush.Vacuum collection only removed approximately 50% ofthe deposited mud (Table 1). Vacuum cleaner removalrelied largely on mechanical agitation with the vacuumhead to dislodge the dried soil. This mechanical breakupwas less efficient that the brush removal of the soil. Thevigorous brushing of the dried soil removed much morefrom the tile surface; however, after brushing approxi-mately 15% of the soil still adhered to the surface. Vac-uum cleaner removal of dry deposited soilwasmuchmoreeffective and in no instance was more than 3% of the soilmass left on a tile following vacuuming (Table 2). In
laterally onto test tiles during the repeat dry-soil tracking test
(%)
(%) Mn loading (%)[tile range]
Pb loading (%)[tile range]
.9%)7 mg]
7.78 μg (0.9%)[0.23–0.53 μg]
2.48 μg (0.5%)b
[b0.31–0.41 μg].1%)5 mg]
37.12 μg (4.2%)[0.74–3.62 μg]
20.16 μg (4.2%)[0.31–2.28 μg]
(90.2%)2 mg]
784.23 μg (89.7%)[24.92–68.43 μg]
436.86 μg (90.9%)[13.91–38.16 μg]
.9%)9 mg]
35.70 μg (4.1%)[0.23–0.53 μg]
20.34 μg (4.2%)[0.36–2.25 μg]
.0%)3 mg]
9.26 μg (1.1%)[0.25–0.70 μg]
3.1 μg (0.7%) c
[0.32–0.51 μg]
per tile.per tile.
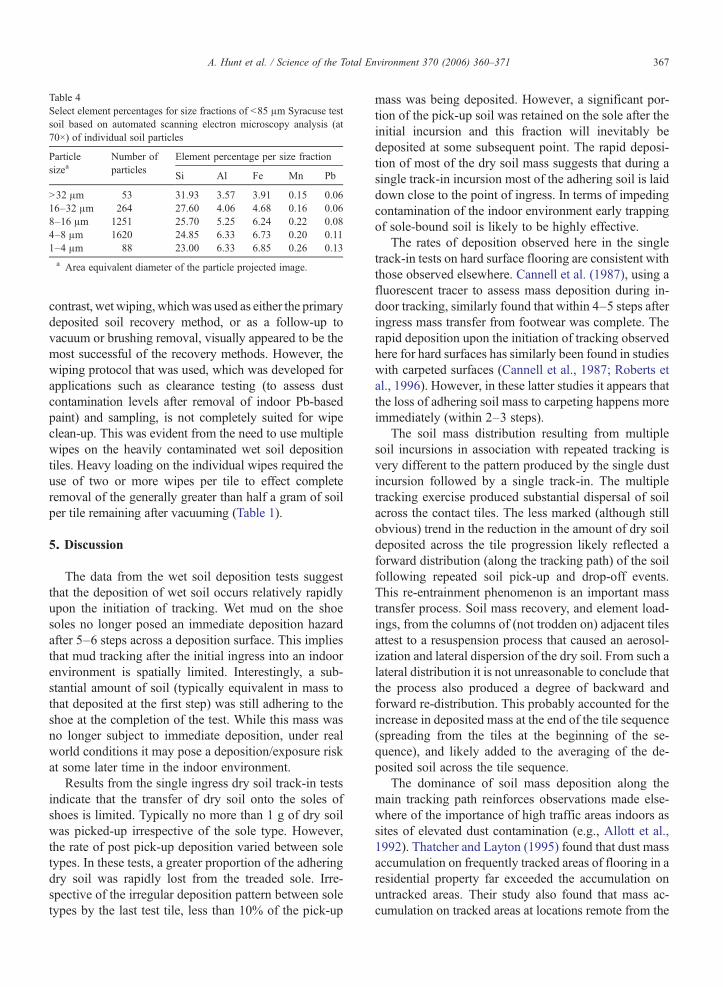
Table 4Select element percentages for size fractions of b85 μm Syracuse testsoil based on automated scanning electron microscopy analysis (at70×) of individual soil particles
Particlesizea
Number ofparticles
Element percentage per size fraction
Si Al Fe Mn Pb
N32 μm 53 31.93 3.57 3.91 0.15 0.0616–32 μm 264 27.60 4.06 4.68 0.16 0.068–16 μm 1251 25.70 5.25 6.24 0.22 0.084–8 μm 1620 24.85 6.33 6.73 0.20 0.111–4 μm 88 23.00 6.33 6.85 0.26 0.13a Area equivalent diameter of the particle projected image.
367A. Hunt et al. / Science of the Total Environment 370 (2006) 360–371
contrast, wet wiping, whichwas used as either the primarydeposited soil recovery method, or as a follow-up tovacuum or brushing removal, visually appeared to be themost successful of the recovery methods. However, thewiping protocol that was used, which was developed forapplications such as clearance testing (to assess dustcontamination levels after removal of indoor Pb-basedpaint) and sampling, is not completely suited for wipeclean-up. This was evident from the need to use multiplewipes on the heavily contaminated wet soil depositiontiles. Heavy loading on the individual wipes required theuse of two or more wipes per tile to effect completeremoval of the generally greater than half a gram of soilper tile remaining after vacuuming (Table 1).
5. Discussion
The data from the wet soil deposition tests suggestthat the deposition of wet soil occurs relatively rapidlyupon the initiation of tracking. Wet mud on the shoesoles no longer posed an immediate deposition hazardafter 5–6 steps across a deposition surface. This impliesthat mud tracking after the initial ingress into an indoorenvironment is spatially limited. Interestingly, a sub-stantial amount of soil (typically equivalent in mass tothat deposited at the first step) was still adhering to theshoe at the completion of the test. While this mass wasno longer subject to immediate deposition, under realworld conditions it may pose a deposition/exposure riskat some later time in the indoor environment.
Results from the single ingress dry soil track-in testsindicate that the transfer of dry soil onto the soles ofshoes is limited. Typically no more than 1 g of dry soilwas picked-up irrespective of the sole type. However,the rate of post pick-up deposition varied between soletypes. In these tests, a greater proportion of the adheringdry soil was rapidly lost from the treaded sole. Irre-spective of the irregular deposition pattern between soletypes by the last test tile, less than 10% of the pick-up
mass was being deposited. However, a significant por-tion of the pick-up soil was retained on the sole after theinitial incursion and this fraction will inevitably bedeposited at some subsequent point. The rapid deposi-tion of most of the dry soil mass suggests that during asingle track-in incursion most of the adhering soil is laiddown close to the point of ingress. In terms of impedingcontamination of the indoor environment early trappingof sole-bound soil is likely to be highly effective.
The rates of deposition observed here in the singletrack-in tests on hard surface flooring are consistent withthose observed elsewhere. Cannell et al. (1987), using afluorescent tracer to assess mass deposition during in-door tracking, similarly found that within 4–5 steps afteringress mass transfer from footwear was complete. Therapid deposition upon the initiation of tracking observedhere for hard surfaces has similarly been found in studieswith carpeted surfaces (Cannell et al., 1987; Roberts etal., 1996). However, in these latter studies it appears thatthe loss of adhering soil mass to carpeting happens moreimmediately (within 2–3 steps).
The soil mass distribution resulting from multiplesoil incursions in association with repeated tracking isvery different to the pattern produced by the single dustincursion followed by a single track-in. The multipletracking exercise produced substantial dispersal of soilacross the contact tiles. The less marked (although stillobvious) trend in the reduction in the amount of dry soildeposited across the tile progression likely reflected aforward distribution (along the tracking path) of the soilfollowing repeated soil pick-up and drop-off events.This re-entrainment phenomenon is an important masstransfer process. Soil mass recovery, and element load-ings, from the columns of (not trodden on) adjacent tilesattest to a resuspension process that caused an aerosol-ization and lateral dispersion of the dry soil. From such alateral distribution it is not unreasonable to conclude thatthe process also produced a degree of backward andforward re-distribution. This probably accounted for theincrease in deposited mass at the end of the tile sequence(spreading from the tiles at the beginning of the se-quence), and likely added to the averaging of the de-posited soil across the tile sequence.
The dominance of soil mass deposition along themain tracking path reinforces observations made else-where of the importance of high traffic areas indoors assites of elevated dust contamination (e.g., Allott et al.,1992). Thatcher and Layton (1995) found that dust massaccumulation on frequently tracked areas of flooring in aresidential property far exceeded the accumulation onuntracked areas. Their study also found that mass ac-cumulation on tracked areas at locations remote from the
Fig. 4. Electron micrographs of contaminated tile surface after initialsoil particle (bright objects) deposition (a) and following wipe removalof soil after several deposition events (b).
368 A. Hunt et al. / Science of the Total Environment 370 (2006) 360–371
property entrance (on the second story) was also less.Similarly, Nishioka et al. (1999), in a study aimed atmeasuring indoor levels of herbicide 2,4-Diclorophenox-yacetic acid after a lawn application, found that the levelsindoors usually followed a gradient (with a maximum atthe entrance) that matched the traffic pattern through thehome that the residents followed when entering fromoutdoors.
Soil clean-up success differed markedly between pro-cedures. Brushing and vacuum cleaner removal of (wetdeposited) dried soil were clearly less effective than wetwiping. Neither aggressive brushing, nor agitation withthe vacuumhead, provided sufficientmechanical abrasionto dislodge all the “dried-on” soil. In contrast, vacuumcleaner removal of dry deposited soil was much moreeffective than vacuum removal of in situ dried soil. How-ever, the adhesion forces binding the dry deposited soilparticles to the tile surface were sufficient to retain a mea-surable amount of soil mass. Vacuum collection can behighly variable depending on the method and the mediaconditions (Byrne, 2000).
Wet wiping was viewed here as the most effectiveclean-up method; however, it was found not to be totallyefficient. Visual inspection indicated that wet wipingwas successful at collecting the soil adhering to the tilesurface, but additional microscopic examination dem-onstrated that dust recovery was not complete. This isillustrated in Fig. 4, which documents the microscopicappearance of a pristine and cleaned tile surface after aninitial deposition of wet soil (Fig. 4a), and then aftermultiple (ten) depositions of wet (slurry) soil with inter-vening wet wiping (Fig. 4b). In this test wet soil wasrepeatedly deposited by pipette onto the tile surface,allowed to dry, and then wet wipe removed (until thesurface was visibly clean). It is apparent that despite wetwiping many small particles are present on the tile surfaceat the end of the test. The difference in particle size betweenthe initial deposited soil and the post wiping residuesuggests that the smaller soil particles have beenpreferentially retained on the tile surface. This may be afunction of size selective wipe removal (i.e., wet wipingfavoring coarse particle pick-up), and/ormicro-topographytrapping. During the wiping process, some of the surfaceparticles may have been too small to be picked-up by thewipe; however, the appearance of the post wipe surfacestrongly suggests that the majority of retained particles aretrapped in micro-scale crevices. It may be the case thatparticle retention under these test conditions was facilitatedby the wiping process. The obvious surface asperities onthe post-wiping tile, which were not present on the initialdeposition tile, is suggestive of tile surface modification(forming wrinkling) during repeated wetting and drying.
Vacuum cleaner removal of floor dust, particularlyfor soiled carpeting, has been recommended by variousstudies (Roberts et al., 1999; Yiin et al., 2002). The post-vacuuming surface retention of soil mass as describedhere is consistent with the results of trials aimed atreducing Pb dust loadings on hard flooring surfaces inresidential properties. Rich et al. (2004) found that usingvacuum cleaner removal of floor dust with follow updetergent and water cleaning resulted in an incompleteremoval of the surface Pb content, confirming the re-sistance of dust to complete removal. Surface dustretention may also in part account for the “multiplesources of sample loss” attributed to vacuum sampling(Farfel et al., 1994).
369A. Hunt et al. / Science of the Total Environment 370 (2006) 360–371
6. Conclusions
Single incursions into the indoor environment of wetor dry soil adhering to footwear appear to lead to heavy,yet fairly limited, spatial contamination of hard surfaceflooring. With most of the deposited test soil being setdown within the first 5 strides, initial soil contaminationis likely to be limited to an area within 7–8 m of theentrance (given an average stride length of approximate-ly 1.5 m). Despite such initial deposition, soil that re-mains adhering to the footwear may be substantial, andthe potential exists for subsequent significant soilingelsewhere indoors following other removal events.
Repeated tracking of dry soil across hard flooringsurfaces leads to a substantial re-distribution of the soilacross the surface. This process clearly has the ability tocreate widespread contamination of the indoor environ-ment. This will occur not only by repeated soil pick-upand deposition during the tracking process, but by aprocess of lateral displacement. The mechanical inter-action between footwear, soil, and flooring that leads tosoil aerosolization and lateral re-distribution results indistal parts of a floor, that are not directly affected by thetrack-in activity, becoming contaminated.
Track-in simulations furnish data on the quantities ofsoil conveyed indoors upon initial ingress. Estimateddeposition rates provide basic inputs for indoor exposuremodels, and dose calculations. However, the magnitudeof external soil contributions may bemodulated by any ofa number of factors. The number, age structure, and habitsof the occupants are important modifiers. Similarly, dif-ferences in floor covering, variations in activity patterns,and the frequency and effectiveness of the cleaning prac-tices, are important controls on subsequent indoor re-distribution. It is anticipated that in our future work theimpact of such variables will be addressed. Based on thispilot study, before-and-after simulations are envisionedthat factor in the movement of children (in specific ageranges), and adults engaged in unrestricted movementswithin mock-up residential spaces.
The clean-up of dry and wet deposited soil from hardsurface flooring appears to be more effectively accom-plished using wet wiping methods rather than mechanicalremoval (e.g., by vacuuming or brushing). However, noneof the tested removal techniques seems capable of fullyeliminating all post-deposition residual soil particles.With some soil particles retained in situ after removalefforts, in some instances an un-recognized post-cleaningexposure threat may remain on hard surface flooring.Such a hazard is probably of most concern in situationswhere the exposure risk is direct, such as in the case ofcrawling infants with repeated hand contact with the floor.
In some circumstances the problem may be compoundedby the size selective nature of clean-up removal. It isrecognized that detachment forces, of the type involved invacuum removal, are dependent on particle mass, and thatsmaller particles exhibit greater resistance to removal(Corn, 1961). So, the enrichment of a pollutant in thefinest particle sizes, which is the case for many metals insoils (e.g., Spittler and Feder, 1979; Dong et al., 1984;Qian et al., 1996), and for pesticides in indoor dust(Fortune et al., 2000), may lead to an elevated surfaceloading. This would be facilitated by the preferentialtrack-in of finer sized soils and dusts (Allott et al., 1992).An obvious concern is that repeated cleaning may lead toa pollutant build-up, and any received dose will not bediluted by a coarse particle component because coarsematerial has been preferentially removed with cleaning.Moreover, the risk would possibly be exacerbated by thefact that finer sized particles are more likely to adhere tothe hand (Driver et al., 1989).
Acknowledgments
This work was supported by National ScienceFoundation Grant # BCS-0221949. The authors wishto acknowledge the technical assistance provided byJ. Brooks, J. Hager, and H. Stella Levinson.
References
Allott RW, Kelly M, Hewitt CN. Behavior of urban dust contaminatedby Chernobyl fallout: environmental half-lives and transfercoefficients. Environ Sci Technol 1992;26(11):2142–7.
Allott RW, Kelly M, Hewitt CN. A model of environmental behaviourof contaminated dust and its application to determining dust fluxesand residence times. Atmos Environ 1994;4:679–87.
Al-Radady AS, Davies BE, French MJ. Distribution of lead inside thehome: case studies in the North of England. Sci Total Environ1994;145:143–56.
Aschengrau A, Beiser A, Bellinger D, Copenhafer D, Weitzman M.The impact of soil lead abatement on urban children's blood leadlevels: phase II results from the Boston Lead-In-Soil Demonstra-tion. Environ Res 1994;67(2):125–48.
Butte W, Heinzow B. Pollutants in house dust as indicators of indoorcontamination. Rev Environ Contam Toxicol 2002;175:1-46.
Byrne MA. Suction methods for assessing contamination on surfaces.Ann Occup Hyg 2000;44(7):523–8.
Culbard EB, Thornton I, Watt JM, Wheatley M, Moorcroft S,Thompson M. Metal contamination in British urban dusts and soil.J Environ Qual 1988;17(2):226–34.
Cannell RJ, Goddard AJH, ApSimon HM. Contamination of dwellingsby particulate matter: ingress and distribution within the dwelling.Radiat Prot Dosimetry 1987;21:111–6.
Corn M. The adhesion of solid particles to solid surfaces I: A review.J Air Pollut Control Assoc 1961;11:566–75.
Davies BE, Elwood J, Gallacher J, Ginnever RC. The relationshipbetween heavy metals in garden soils and housedusts in an old
370 A. Hunt et al. / Science of the Total Environment 370 (2006) 360–371
mining area of North Wales, Great Britain. Environ Pollut 1985;B9:255–66.
DongA,ChestersG, SimsimanGV.Metal composition of soil, sediments,and urban dust and dirt samples from the Menomonee riverwatershed,Wisconsin, U.S.A.Water Air Soil Pollut 1984;22:257–75.
Driver JH, Whitmyre GK, Konz JJ. Soil adherence to human skin. BullEnviron Contam Toxicol 1989;43(6):814–20.
Farfel MR, Lees PS, Rohde CA, Lim BS, Bannon D, Chisolm Jr JJ.Comparison of a wipe and a vacuum collection method for thedetermination of lead in residential dusts. Environ Res 1994;65(2):291–301.
Fergusson JE, Kim ND. Trace elements in street dust and house dusts:sources and speciation. Sci Total Environ 1991;100:125–50.
Fortune CR, Blanchard FT, Ellenson. Analysis of aged in-homecarpeting to determine the distribution of pesticide residuesbetween dust, carpet, and pad compartments. EPA/600/R-00/030.Research Triangle Park, NC 27711: National Exposure ResearchLaboratory, U.S. Environmental Protection Agency; 2000. p. 125.
Fry FA, Green N, Dodd NJ, Hammond DJ. Radionuclides in housedust. NRPB - R181. Chilton, Didcot, UK: National RadiologicalProtection Board; 1985.
HUD. National survey of lead and allergens in housing, final report.Analysis of lead hazards, vol. 1. Office of Lead Hazard Control, U.S.Department of Housing and Urban Development; 2001 [April].
Johnson DL. SAX characterization of particulate inclusions inbiological tissue. Scan Electron Microsc 1983:1211–28 [1983/III].
Johnson D, Bretsch J. Soil lead and children's BLL Levels inSyracuse, NY, USA. Environ Geochem Health 2002;24(4):375–85.
Johnson DL, McIntyre BL, Fortmann R, Stevens RK, Hanna RB.Chemical element comparison of individual particle analysis andbulk chemical analysis. Scan Electron Microsc 1981:469–76[1983/I].
Lanphear BP, Matte TD, Rogers J, Clickner RP, Dietz B, BornscheinRL, et al. The Contribution of Lead-Contaminated House Dust andResidential Soil to Children's Blood Lead Levels A PooledAnalysis of 12 Epidemiologic Studies. Environ Res 1998;79(1):51–68.
Laxen DPH, Lindsay F, Raab GM, Hunter R, Fell GS, Fulton M. Thevariability of lead in dusts within the homes of young children.Environ Geochem Health 1988;10(1):3–9.
Lewis RG, Fortmann RC, Camann DE. Evaluation of methods formonitoring the potential exposure of small children to pesticides inthe residential environment. Arch Environ Contam Tox 1994;26:37–46.
Lewis RG, Nishioka MG. Residential indoor exposure of children topesticides following lawn applications. Proc Indoor Air 1999;2:416–21.
Marcus AH, Elias RW. Estimating the contribution of lead-based paintto soil lead, dust lead and childhood blood lead. In: BeardME, IskeSDA, editors. Lead in Paint, Soil and Dust: Health Risks, ExposureStudies, Control Measures, Measurement Methods, and QualityAssurance. ASTM STPPhiladelphia: American Society for Testingand Materials; 1995. p. 12–21.
Nishioka MG, Burkholder HM, Brinkman MC, Lewis RG. Distribu-tion of 2,4-Dichlorophenoxyacetic acid in floor dust throughouthomes following homeowner and commercial lawn applications:quantitative effects of children, pets and shoes. Environ SciTechnol 1999;33:1359–65.
Paustenbach DJ, Finley BL, Long TF. The critical role of house dust inunderstanding the hazards posed by contaminated soils. Int JToxicol 1997;16:339–62.
Petrosyan V, von Braun MC, Spalinger SM, von Lindern IH. Seasonalvariations of lead concentration and loading rates in residentialhouse dust in northern Idaho. J Hazard Mater 2006;132:68–79.
Qian J, Shan QQ, Wang ZJ, Tu Q. Distribution and plant availability ofheavy metals in different particle-size fractions of soil. Sci TotalEnviron 1996;187:131–41.
Rich DQ, Rhoads GG, Yiin LM, Zhang J, Bai Z, Adgate JL, et al.Comparison of home lead dust reduction techniques on hardsurfaces: the New Jersey assessment of cleaning techniques trial.Environ Health Perspect 2004;110(9):889–93.
Roberts JW, Dickey P. Exposure of children to pollutants in house dustand indoor air. Rev Environ Contam Toxicol 1995;143:59–78.
Roberts JW, Camaan DE, Spittler TM. Reducing lead exposure fromremodeling and soil track-in in older home. Air and wastemanagement association paper 91-134.2, 84th annual meeting andexhibition, Vancouver, British Columbia, June 16–21; 1991.
Roberts JW, Crutcher ER, Crutcher ER, Glass G, Spittler TM.Quantitative analysis of road and carpet dust on shoes. Proc. Int.Specialty Conf. on Measurement of Toxic and Related AirPollutants, May 7–9. Research Triangle Park, NC: Air andWaste Management Association; 1996. p. 829–35.
Roberts JW, Clifford WS, Glass G, Hummer PG. Reducing dust, lead,dust mites, bacteria, and fungi in carpets by vacuuming. ArchEnviron Contam Toxicol 1999;36:477–84.
Rutz E, Valentine J, Eckart R, Yu A. Pilot study to determine levels ofcontamination in indoor dust resulting from contamination of soils.J Soil Contam 1997;6(5):525–36.
Spittler TM, Feder WA. A study of soil contamination and plant leaduptake in Boston Urban gardens. Commun Soil Sci Plant Anal1979;10(9):1195–210.
Succop P, Bornschein R, Brown K, Tseng CY. An empiricalcomparison of lead exposure pathway models. Environ HealthPerspect 1998;106(Suppl 6):1577–83.
Thornton I, Davies DJ, Watt JM, Quinn MJ. Lead exposure in youngchildren from dust and soil in the United Kingdom. Environ HealthPerspect 1990;89:55–60.
Thatcher TL, Layton DW. Deposition, resuspension, and penetrationof particles within a residence. Atmos Environ 1995;13:1487–97.
Trowbridge PR, Burmaster DE. Parametric distribution for thefraction of outdoor soil in indoor dust. J Soil Contam 1997;6(2):161–8.
U.S. Census Bureau. Summary File 1, GCT-P1. Urban/Rural andMetropolitan/Nonmetropolitan population; 2000. http://factfinder.census.gov/servlet/GCTTable?_bm=y&-geo_id=01000US&-_box_head_nbr=GCT-P1&-ds_name=DEC_2000_SF1_U&-format=US-1, June 2006.
USEPA. Data Analysis of Lead in Soil and Dust, EPA/747/R-93/011.Washington, DC 20460: U.S. Environmental Protection Agency;1993.
USEPA. Guidance Manual for the Integrated Exposure UptakeBiokinetic model for lead in Children U.S. EnvironmentalProtection Agency, EPA/540/R-93/081, PB93-963510. Washing-ton, DC 20460: U.S. Environmental Protection Agency; 1994.
USEPA. Exposure Factors Handbook. National Center for Environ-mental Assessment. Washington, DC 20460: U.S. EnvironmentalProtection Agency; 1997.
USEPA. Child-Specific Exposure Factors Handbook. National Centerfor Environmental Assessment. Washington, DC 20460: U.S.Environmental Protection Agency; 2004.
Von Lindern IH, Spalinger SM, Bero BN, Petrosyan V, von BraunMC.The influence of soil remediation on lead in house dust. Sci TotalEnviron 2003;203:59–78.

371A. Hunt et al. / Science of the Total Environment 370 (2006) 360–371
Watt JM, Moorecroft S, Brooks K, Culbard E, Thornton I. Metalcontamination in dusts and soils in urban and rural households inthe UnitedKingdom. Trace Subst EnvironHealth 1983;17:229–35.
Yiin LM, Rhoads GG, Lioy PJ. Seasonal influences on childhood leadexposure. Environ Health Perspect 2000;108(2):177–82.
Yiin LM, Rhoads GG, Rich DQ, Zhang J, Bai Z, Adgate JL, et al.Comparison of techniques to reduce residential lead dust on carpetand upholstery: the New Jersey assessment of cleaning techniquestrial. Environ Health Perspect 2002;110(12):1233–7.