Embed Size (px)
Citation preview
Master of Arts in the Field of ICT Policy and Regulation
INVESTIGATING MOTIVATIONAL FACTORS INFLUENCING BROADBAND ADOPTION AND USAGE
IN SOUTH AFRICAN LOW-INCOME HOUSEHOLDS
KOPANO MONYETSANE STUDENT NUMBER: 1144055
SUPERVISED BY DR. KIRU PILLAY
A research report submitted to the Faculty of Humanities, University of the Witwatersrand
In partial fulfilment of the requirements for the degree of Master of Arts in the field of ICT Policy and Regulation

Page | i
Declaration
I declare that this report is my own, unaided work. It is submitted in partial fulfilment of the requirements for the degree of Master of Arts in the field of ICT Policy and Regulation at the University of the Witwatersrand, Johannesburg. It has not been submitted before for any other degree or examination in any other university.
Kopano Shadrack Monyetsane 04 June 2018
Page | ii
Abstract
Broadband technology has been identified as a vital contributor to socio-economic
development in South Africa. Hoverer, the rate of broadband adoption and usage
in low-income households is lower as compared to middle and high-income
households. Although there are studies that have presented motivational factors
for broadband adoption in South Africa, there is little knowledge about how these
motivational factors collectively influence the adoption and usage of broadband
in low-income households and how they use the technology. To address this gap,
this study investigated motivational factors that influence low-income households
in South Africa to adopt and use broadband. An extended Model for Broadband
Adoption (MBA) was derived from literature and used to provide the basis for the
theoretical and conceptual framework for this study. The researcher then followed
a phenomenological approach to collect qualitative data that was analysed using
a computer-assisted qualitative data analysis software (CAQDAS). The findings of
this study show that the participants from low-income households used
broadband everyday but only for basic applications and the high cost of data
hindered increased usage. The findings further suggest that attitude, normative
beliefs and control factors can have both positive and negative influence on the
adoption and usage of broadband by low-income households. In addition, low-
income households regarded broadband as a key element towards improving their
livelihood and confirmed the lack of local content in most broadband platforms.
The study recommends that policy makers, regulatory authorities and broadband
service providers should consider adopting models such as the MBA to advance
their understanding on the interactions between low-income households and
broadband, in order to develop policy interventions and products that are relevant
to the lived experience of low-income households. The study emphases further
the importance of expediting policies and regulations that are meant to address
the high cost of data to ensure that broadband adoption and usage is inclusive of
all income groups in South Africa.
Keywords: Broadband, South Africa, Broadband Adoption, Broadband Usage
Page | iii
Dedication
I dedicate this achievement to my loving wife Mmakgotso “Pino” Monyetsane. I
thank you for the constant support and motivation through this journey. This
would have never been possible without you by my side.
Page | iv
Acknowledgements I would like to acknowledge Dr Kiru Pillay, my supervisor, for the support and continuous encouragement on my journey towards the completion of this research report. A special acknowledgement goes to the communities of Sohanguve Blocks M, H and T, to you I say thank you for dedicating your time and sharing your highly valued opinions with me. To all the colleagues and fellow comrades in the programme, I would like to express my sincere gratitude to you all for the knowledge, experience and wisdom that I have honed from you. I would also like to thank all my friends and family their unwavering support and
encouragement.
Page | v
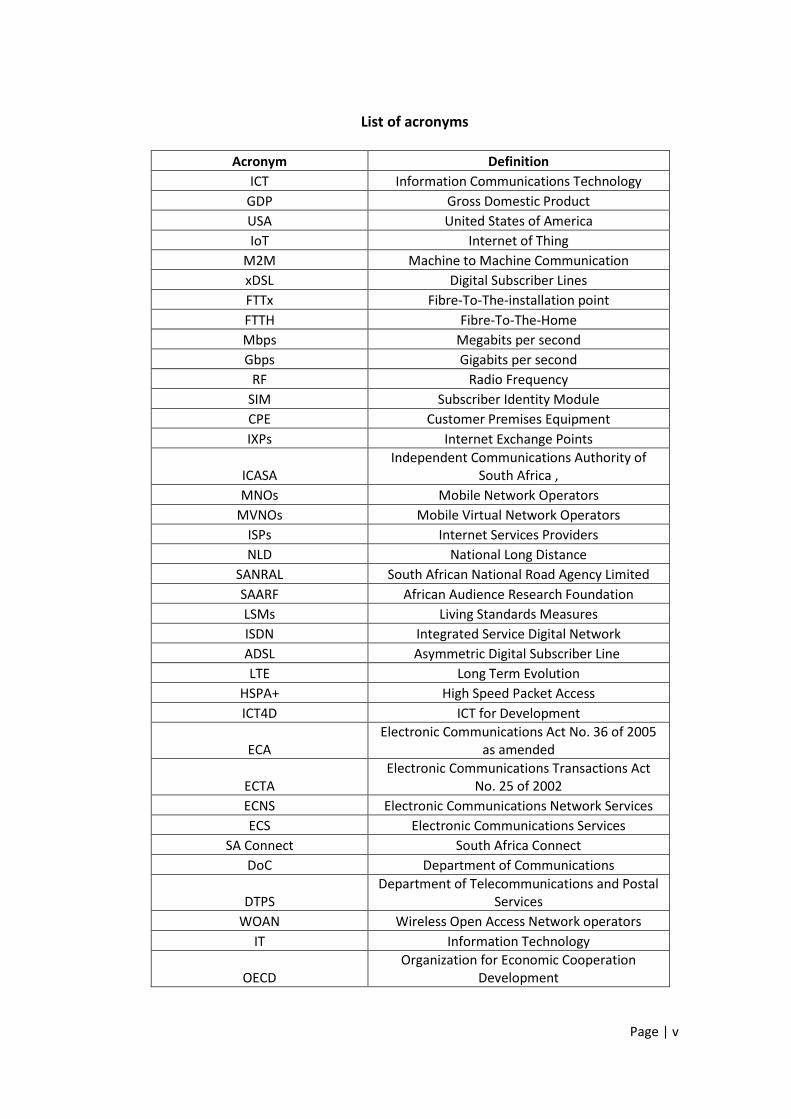
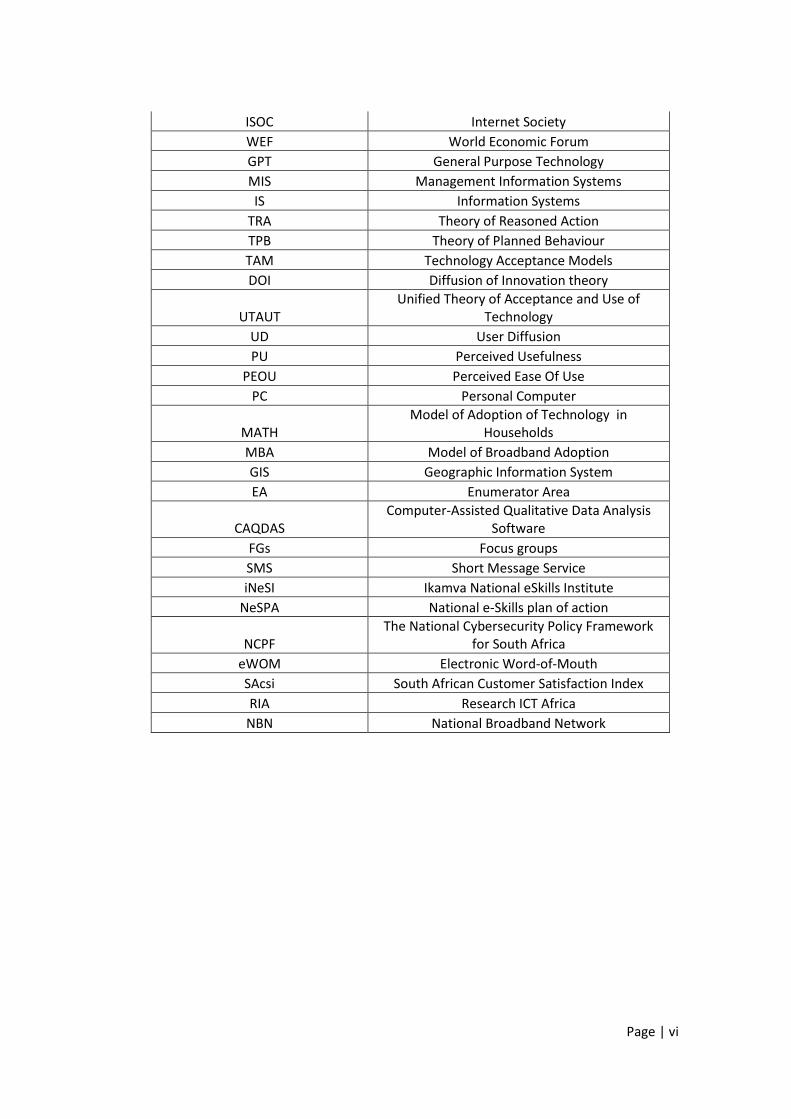
List of acronyms
Acronym Definition
ICT Information Communications Technology
GDP Gross Domestic Product
USA United States of America
IoT Internet of Thing
M2M Machine to Machine Communication
xDSL Digital Subscriber Lines
FTTx Fibre-To-The-installation point
FTTH Fibre-To-The-Home
Mbps Megabits per second
Gbps Gigabits per second
RF Radio Frequency
SIM Subscriber Identity Module
CPE Customer Premises Equipment
IXPs Internet Exchange Points
ICASA Independent Communications Authority of
South Africa ,
MNOs Mobile Network Operators
MVNOs Mobile Virtual Network Operators
ISPs Internet Services Providers
NLD National Long Distance
SANRAL South African National Road Agency Limited
SAARF African Audience Research Foundation
LSMs Living Standards Measures
ISDN Integrated Service Digital Network
ADSL Asymmetric Digital Subscriber Line
LTE Long Term Evolution
HSPA+ High Speed Packet Access
ICT4D ICT for Development
ECA Electronic Communications Act No. 36 of 2005
as amended
ECTA Electronic Communications Transactions Act
No. 25 of 2002
ECNS Electronic Communications Network Services
ECS Electronic Communications Services
SA Connect South Africa Connect
DoC Department of Communications
DTPS Department of Telecommunications and Postal
Services
WOAN Wireless Open Access Network operators
IT Information Technology
OECD Organization for Economic Cooperation
Development
Page | vi
ISOC Internet Society
WEF World Economic Forum
GPT General Purpose Technology
MIS Management Information Systems
IS Information Systems
TRA Theory of Reasoned Action
TPB Theory of Planned Behaviour
TAM Technology Acceptance Models
DOI Diffusion of Innovation theory
UTAUT Unified Theory of Acceptance and Use of
Technology
UD User Diffusion
PU Perceived Usefulness
PEOU Perceived Ease Of Use
PC Personal Computer
MATH Model of Adoption of Technology in
Households
MBA Model of Broadband Adoption
GIS Geographic Information System
EA Enumerator Area
CAQDAS Computer-Assisted Qualitative Data Analysis
Software
FGs Focus groups
SMS Short Message Service
iNeSI Ikamva National eSkills Institute
NeSPA National e-Skills plan of action
NCPF The National Cybersecurity Policy Framework
for South Africa
eWOM Electronic Word-of-Mouth
SAcsi South African Customer Satisfaction Index
RIA Research ICT Africa
NBN National Broadband Network
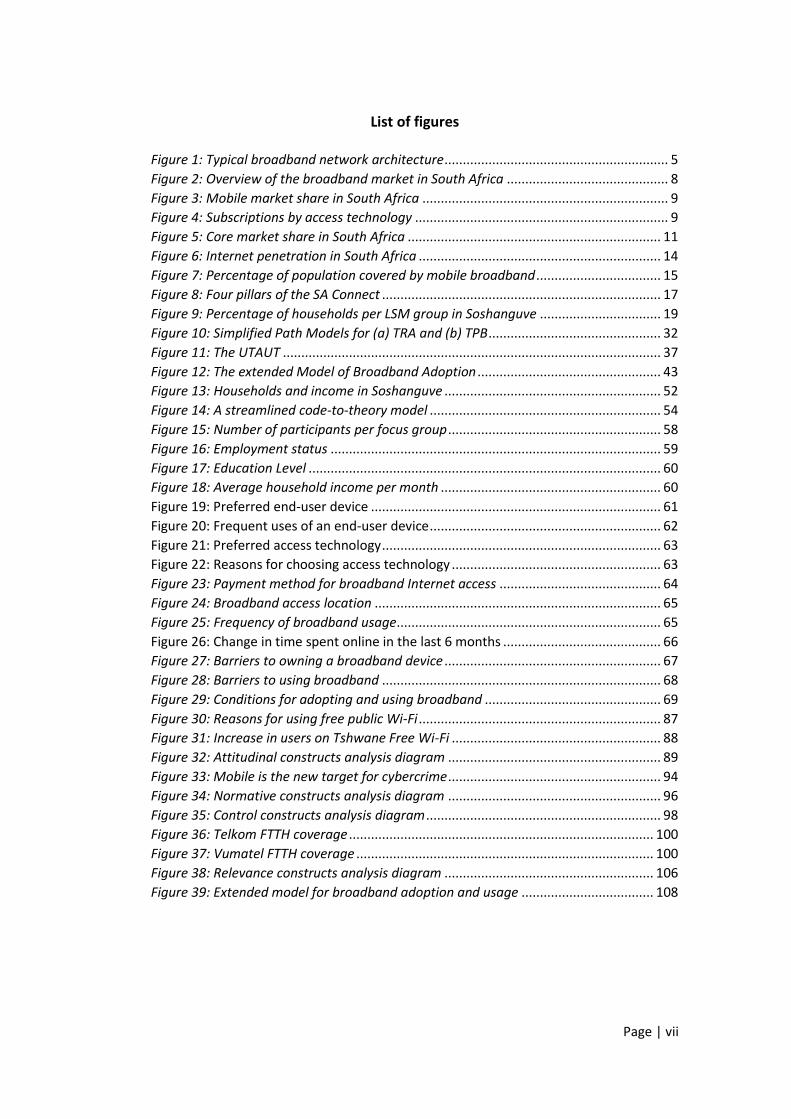
Page | vii
List of figures Figure 1: Typical broadband network architecture ............................................................. 5
Figure 2: Overview of the broadband market in South Africa ............................................ 8
Figure 3: Mobile market share in South Africa ................................................................... 9
Figure 4: Subscriptions by access technology ..................................................................... 9
Figure 5: Core market share in South Africa ..................................................................... 11
Figure 6: Internet penetration in South Africa .................................................................. 14
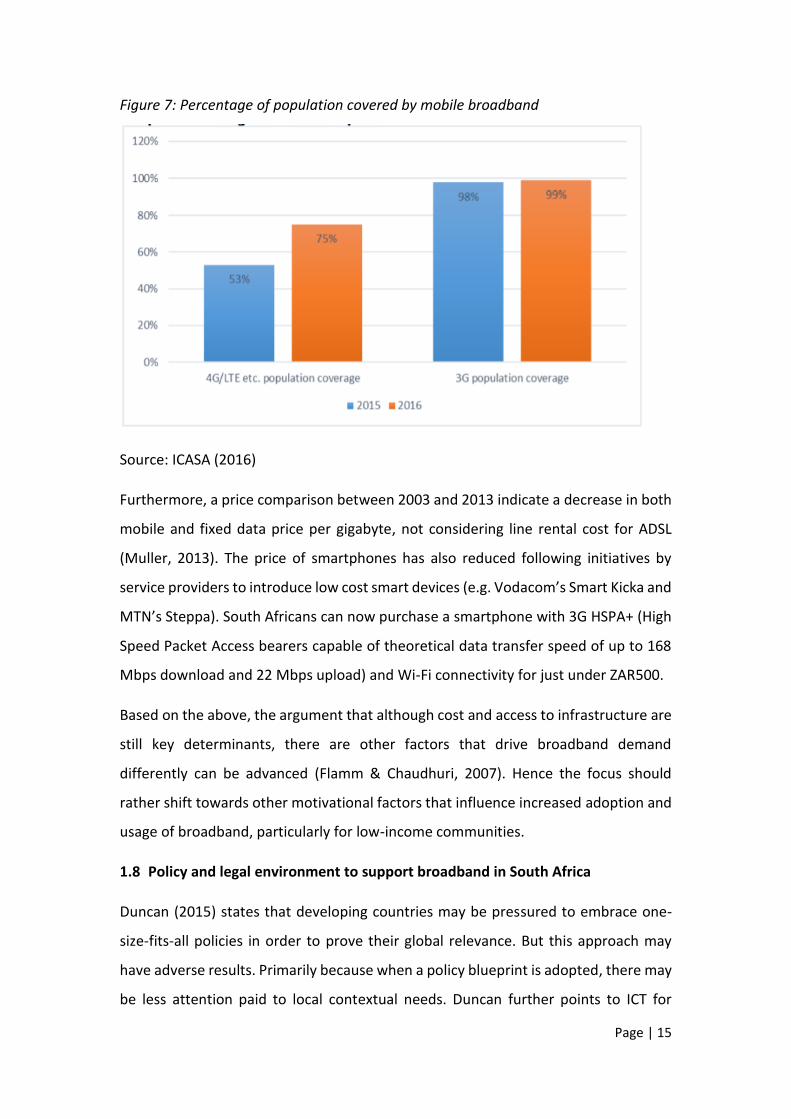
Figure 7: Percentage of population covered by mobile broadband .................................. 15
Figure 8: Four pillars of the SA Connect ............................................................................ 17
Figure 9: Percentage of households per LSM group in Soshanguve ................................. 19
Figure 10: Simplified Path Models for (a) TRA and (b) TPB ............................................... 32
Figure 11: The UTAUT ....................................................................................................... 37
Figure 12: The extended Model of Broadband Adoption .................................................. 43
Figure 13: Households and income in Soshanguve ........................................................... 52
Figure 14: A streamlined code-to-theory model ............................................................... 54
Figure 15: Number of participants per focus group .......................................................... 58
Figure 16: Employment status .......................................................................................... 59
Figure 17: Education Level ................................................................................................ 60
Figure 18: Average household income per month ............................................................ 60
Figure 19: Preferred end-user device ............................................................................... 61
Figure 20: Frequent uses of an end-user device ............................................................... 62
Figure 21: Preferred access technology ............................................................................ 63
Figure 22: Reasons for choosing access technology ......................................................... 63
Figure 23: Payment method for broadband Internet access ............................................ 64
Figure 24: Broadband access location .............................................................................. 65
Figure 25: Frequency of broadband usage........................................................................ 65
Figure 26: Change in time spent online in the last 6 months ........................................... 66
Figure 27: Barriers to owning a broadband device ........................................................... 67
Figure 28: Barriers to using broadband ............................................................................ 68
Figure 29: Conditions for adopting and using broadband ................................................ 69
Figure 30: Reasons for using free public Wi-Fi .................................................................. 87
Figure 31: Increase in users on Tshwane Free Wi-Fi ......................................................... 88
Figure 32: Attitudinal constructs analysis diagram .......................................................... 89
Figure 33: Mobile is the new target for cybercrime .......................................................... 94
Figure 34: Normative constructs analysis diagram .......................................................... 96
Figure 35: Control constructs analysis diagram ................................................................ 98
Figure 36: Telkom FTTH coverage ................................................................................... 100
Figure 37: Vumatel FTTH coverage ................................................................................. 100
Figure 38: Relevance constructs analysis diagram ......................................................... 106
Figure 39: Extended model for broadband adoption and usage .................................... 108
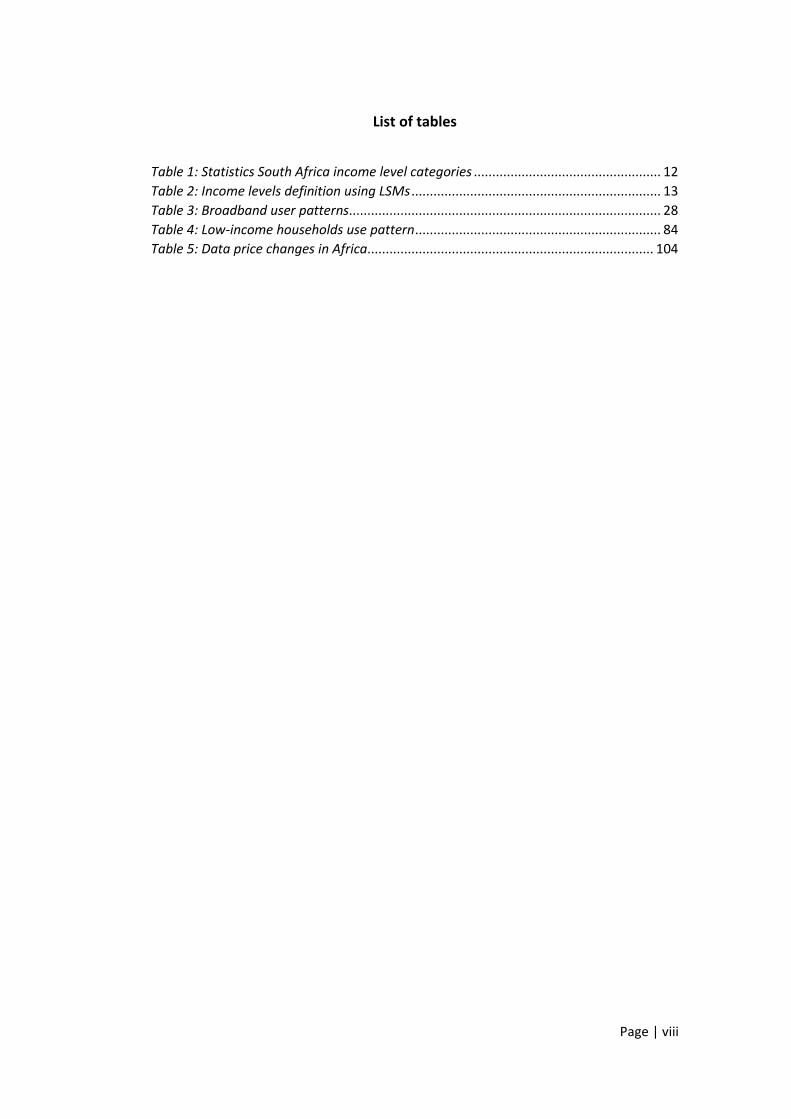
Page | viii
List of tables
Table 1: Statistics South Africa income level categories ................................................... 12
Table 2: Income levels definition using LSMs .................................................................... 13
Table 3: Broadband user patterns..................................................................................... 28
Table 4: Low-income households use pattern ................................................................... 84
Table 5: Data price changes in Africa.............................................................................. 104
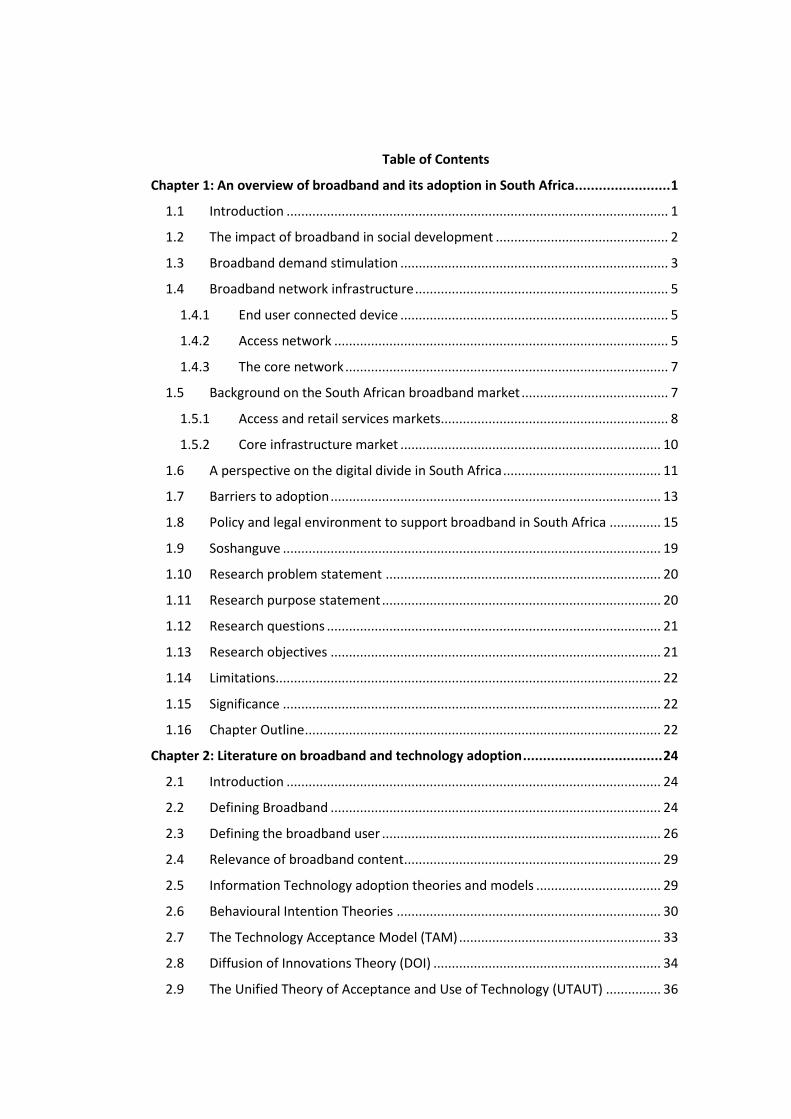
Table of Contents
Chapter 1: An overview of broadband and its adoption in South Africa ........................ 1
1.1 Introduction ........................................................................................................ 1
1.2 The impact of broadband in social development ............................................... 2
1.3 Broadband demand stimulation ......................................................................... 3
1.4 Broadband network infrastructure ..................................................................... 5
1.4.1 End user connected device ......................................................................... 5
1.4.2 Access network ........................................................................................... 5
1.4.3 The core network ........................................................................................ 7
1.5 Background on the South African broadband market ........................................ 7
1.5.1 Access and retail services markets.............................................................. 8
1.5.2 Core infrastructure market ....................................................................... 10
1.6 A perspective on the digital divide in South Africa ........................................... 11
1.7 Barriers to adoption .......................................................................................... 13
1.8 Policy and legal environment to support broadband in South Africa .............. 15
1.9 Soshanguve ....................................................................................................... 19
1.10 Research problem statement ........................................................................... 20
1.11 Research purpose statement ............................................................................ 20
1.12 Research questions ........................................................................................... 21
1.13 Research objectives .......................................................................................... 21
1.14 Limitations......................................................................................................... 22
1.15 Significance ....................................................................................................... 22
1.16 Chapter Outline ................................................................................................. 22
Chapter 2: Literature on broadband and technology adoption ................................... 24
2.1 Introduction ...................................................................................................... 24
2.2 Defining Broadband .......................................................................................... 24
2.3 Defining the broadband user ............................................................................ 26
2.4 Relevance of broadband content ...................................................................... 29
2.5 Information Technology adoption theories and models .................................. 29
2.6 Behavioural Intention Theories ........................................................................ 30
2.7 The Technology Acceptance Model (TAM) ....................................................... 33
2.8 Diffusion of Innovations Theory (DOI) .............................................................. 34
2.9 The Unified Theory of Acceptance and Use of Technology (UTAUT) ............... 36
2.10 Technology adoption models at household level ............................................. 38
2.11 A global overview on motivational factors for broadband adoption ............... 39
2.12 Broadband adoption studies in South Africa .................................................... 41
2.13 Choosing the theoretical and conceptual model .............................................. 42
2.14 Chapter Summary ............................................................................................. 43
Chapter 3: A methodological approach for investigating the influence of motivational
factors on broadband adoption and usage by low-income households ...................... 44
3.1 Introduction ...................................................................................................... 44
3.2 Research Problem Statement ........................................................................... 44
3.3 Research Purpose Statement ............................................................................ 44
3.4 Research Questions .......................................................................................... 45
3.5 Research Approach ........................................................................................... 45
3.6 Research Design ................................................................................................ 47
3.7 Research Procedures and Methods .................................................................. 48
3.7.1 Data collection method and instrument. .................................................. 48
3.7.2 Population selection and sampling ........................................................... 50
3.7.3 Data collection process ............................................................................. 53
3.8 Data analysis ..................................................................................................... 54
3.9 Ethical considerations ....................................................................................... 55
3.10 Research strengths ............................................................................................ 56
3.11 Chapter Summary ............................................................................................. 57
Chapter 4: Presentation of motivational factors influencing broadband adoption and
usage by low-income households ............................................................................. 58
4.1 Introduction ...................................................................................................... 58
4.2 Focus groups demographics ............................................................................. 58
4.3 Broadband usage profile of low-income households ....................................... 61
4.3.1 Preferred end user device ......................................................................... 61
4.3.2 Preferred access technology ..................................................................... 62
4.3.3 Payment method for broadband Internet access ..................................... 64
4.3.4 Access location .......................................................................................... 64
4.3.5 Frequency of use ....................................................................................... 65
4.3.6 Change in time spent online ..................................................................... 66
4.3.7 Barriers to adoption and usage ................................................................. 66
4.4 Attitudinal Constructs ....................................................................................... 69
4.4.1 Hedonic and Utilitarian outcomes ............................................................ 69
4.4.2 Perceived Ease of Use ............................................................................... 71
4.4.3 Relative advantage .................................................................................... 72
4.4.4 Perceived lack online security and privacy ............................................... 73
4.4.5 Social status .............................................................................................. 73
4.5 Normative Constructs ....................................................................................... 74
4.5.1 Primary influence ...................................................................................... 74
4.5.2 Secondary influence .................................................................................. 74
4.6 Control constructs ............................................................................................. 75
4.6.1 Knowledge ................................................................................................. 75
4.6.2 Self-efficacy ............................................................................................... 77
4.6.3 Facilitating conditions resources .............................................................. 78
4.7 Relevance constructs ........................................................................................ 80
4.7.1 Livelihood .................................................................................................. 80
4.7.2 Local content ............................................................................................. 80
4.8 Chapter summary.............................................................................................. 82
Chapter 5: Analysis on motivational factors influencing broadband adoption and usage
by low-income households ....................................................................................... 83
5.1 Introduction ...................................................................................................... 83
5.2 Low-income households usage profile ............................................................. 84
5.2.1 Low-income households are frequent broadband users .......................... 84
5.2.2 Low-income households are progressive users ........................................ 85
5.2.3 Low-income households are basic users................................................... 85
5.2.4 Low-income households use broadband at home .................................... 86
5.2.5 Low-income households are prepaid users .............................................. 86
5.2.6 Low-income households prefer public Wi-Fi ............................................ 87
5.3 The influence of attitudinal constructs on low-income households broadband
adoption and usage ...................................................................................................... 88
5.3.1 Broadband is both entertainment and a utility ........................................ 89
5.3.2 Conflicting views on the ease of use of broadband .................................. 90
5.3.3 Device choice is all about status ............................................................... 92
5.3.4 Perceived lack of online security and privacy ........................................... 93
5.3.5 Mobile has relative advantage over other access technologies ............... 94
5.4 The influence of normative constructs on low-income households broadband
adoption and usage ...................................................................................................... 96
5.4.1 Reliance on experience of others ............................................................. 96
5.4.2 Secondary influence .................................................................................. 97
5.5 The influence of control constructs on low-income households broadband
adoption and usage ...................................................................................................... 98
5.5.1 Knowledge ................................................................................................. 99
5.5.2 Facilitating conditions resources ............................................................ 102
5.5.3 Self-efficacy ............................................................................................. 105
5.6 The relevance of broadband to the livelihood of low-income households .... 105
5.6.1 Broadband is essential to low-income households ................................ 106
5.6.2 Limited local content and applications ................................................... 107
5.7 Chapter summary............................................................................................ 108
Chapter 6: A perspective on the influence of motivational factors on broadband
adoption and usage in low-income households ....................................................... 110
6.1 Introduction .................................................................................................... 110
6.2 Revisiting the objectives of the study ............................................................. 110
6.3 Broadband usage in low-income households ................................................. 110
6.4 Outcomes of the extended and applied theoretical framework .................... 111
6.4.1 Attitude as a factor ................................................................................. 111
6.4.2 Normative beliefs as factors ................................................................... 113
6.4.3 Control as a factor ................................................................................... 114
6.4.4 Relevance as a factor .............................................................................. 115
6.5 Conclusion ....................................................................................................... 115
6.6 Contribution to the body of knowledge ......................................................... 116
6.7 Suggestions for future research ...................................................................... 116
6.8 Limitations of the study .................................................................................. 117
6.9 Recommendations .......................................................................................... 117
List of References ................................................................................................... 119
Annexure A ............................................................................................................ 133
Annexure B ............................................................................................................ 142
Annexure C ............................................................................................................ 144
Annexure D ............................................................................................................ 146
Page | 1
Chapter 1: An overview of broadband and its adoption in South Africa
1.1 Introduction
There is no doubt that ICT, in particular the Internet, has transformed how we do
things. The internet has disrupted and broken traditions in many industries such as
the entertainment, health, education, manufacturing and transportation industries. It
is this fact that provides confidence that broadband, as a much improved way of
providing connectivity to the Internet, has the ability to unlock even more potential.
The introduction of broadband technology brought even more opportunities to
Internet users. Broadband offers enhanced functionality which includes high data
transfer rate and low latency. However, the rate of broadband adoption and usage in
South African low-income households is low as compared to middle and high-income
households. Furthermore, there are no detailed studies on how low-income
households use broadband, what motivates them to adopt and use it as well as how
it is relevant to them in terms of their livelihood and the content they consume.
This study sought to investigate motivational factors that influence low-income
households to adopt and use broadband and gain a deeper understanding on their
interaction with the technology by exploring how they use it and its impact on their
daily lives and the availability of relevant content.
This chapter builds a context on the impact of broadband in society, considerations
for broadband demand stimulation and an overview of broadband network
infrastructure. The chapter then provides a background on the South African
broadband market, the country’s digital divide, barriers to Internet adoption and the
current policy environment to support broadband development. The chapter then
presents a profile of the selected population of Soshanguve and a summary of the
research problem and purpose statements, the research questions, the research
objectives, its limitations and significance and concludes with the chapter outline for
this report.
Page | 2
1.2 The impact of broadband in social development
Picot and Wernick (2007) argue that broadband should be regarded as a public good.
In economics, a public good is defined as a commodity or service that is provided
without profit to all members of society. A public good should be non-rival, meaning
its consumption by one individual does not reduce the quantity for consumption by
other individuals. It should also be non-excludable i.e. when it is produced, no one can
be prevented from using it (Burrel, 2012).
On the other hand, should broadband really have the same priority as other essential
services such as water and public safety? Firths and Mellor (2005) contend that
although literature presents a multiplicity of economic and social benefits that can be
derived from the proliferation of broadband, there are still controversies surrounding
the notion of broadband being an all-round enabler of many industries and substantial
improvements in public service delivery. These controversies stem from the inability
of the same literature to provide explicit understanding and measurement of these
benefits. This situation has led to policy makers opting to focus rather on increased
uptake without an understanding if this will be at the best interest of the society (Firth
& Mellor, 2005; Rampersad & Troshani, 2013).
To address this gap in literature, researchers have taken different approaches when
attempting to develop frameworks and measurement instruments that will bring tacit
benefits of broadband. There are studies that have taken a macro approach by
focusing on the contribution on economic growth or gross domestic product (GDP)
(Bojnec & Ferto, 2012; Katz & Avila, 2010; Koutroumpis, 2009), some tend to shift their
focus to sectoral impact by concentrating on key sectors like education, health and
commerce (Firth & Mellor, 2005; Rampersad & Troshani, 2013), while others take a
more granular approach by focusing on the impact on individuals, households and
organizations (Anderson, 2008).
Although the focus might be different, all approaches provide findings of realisable
benefits. For example, those who study the impact of broadband on economic growth
found that there is positive correlation between broadband penetration and GDP
growth (Koutroumpis, 2009; Katz & Avila, 2010; Katz, Vaterlaus, Zenhausern, & Suter,
Page | 3
2010). The common result is that an increase in broadband penetration translates to
positive GDP growth. Of course the actual contribution (i.e. percentage increase in
broadband penetration on GDP growth) varies between studies depending on the
availability of data and the economic state of the countries studied (Katz & Avila,
2010).
Sectorial studies also indicate that although there might be challenges (Firth & Mellor,
2005), there are greater benefits such as inclusive access to high quality education
material, overall improvement in academic performance and innovativeness.
Broadband can also enable the uptake of tele-medicine and e-health by remote
communities (Rampersad & Troshani, 2013). There is evidence from countries like
South Korea that electronic commerce activities (e.g. online stock trading, online
banking and online shopping) grew rapidly following increased access to broadband
(Lee, Oh, & Shim, 2005).
1.3 Broadband demand stimulation
Many countries have developed broadband development strategies to make
broadband readily accessible to all. Broadband strategies seek to coordinate the
usually fragmented infrastructure rollout efforts from the public and the private
sector and reduce the cost of access and stimulate demand (Mugeni, Wanyembi &
Wafula, 2012). According to Kelly & Rossotto (2012), a broadband development
strategy requires attention from both the supply (i.e. provisioning of network
infrastructure) and demand (uptake and usage). Hence it is important for policy
makers to further understand what broadband means to different communities, why
they adopt it and how they use it. Typically, supply side orientated strategies
concentrate on investing in network infrastructure and technologies with an
assumption that there is a demand or demand will grow to justify this investment
(Kim, Kelly, & Raja, 2010).
Although previously focus was on the supply side for broadband adoption, inroads
were made to incorporate demand stimulation as well. As part of the American
Recovery and Reinvestment Act, the United States of America (USA) developed the
National Broadband Plan which stated that to make advances in segments of the
Page | 4
population that have not adopted broadband, both the demand and supply side must
be considered as important aspects of the market (Hauge & Prieger, 2010). Trends
also show that the majority of countries that developed broadband plans have
included strategies to address the demand side.
Kim, et al., (2010) identifies broadband demand as a subject of three main pillars:
awareness, affordability and attractiveness. For potential users to adopt broadband,
they first have to be aware and have the basic skills to use it, it must be accessible by
all, and it should be translated to some sociological benefit.
The awareness pillar refers to the broader knowledge about broadband (also referred
to as digital or ICT literacy) that will enable individuals to participate in a knowledge
society. Since the beginning of society, word-of-mouth has been regarded as one the
most influential marketing tools for experience goods (Duan, Gu, & Whinston, 2008).
Through word-of-mouth, consumers can alter their attitudes and perceived risk levels
about certain products by gathering information from those who had already
experienced the goods (Elwalda & Lu, 2014). In the context of broadband adoption
and usage, this is evident through online products and services consumer ratings and
reviews. The concept of electronic word-of-mouth (eWOM) refers to the sharing of
consumption experience by consumers using Internet-based communication
(Vimaladevi & Dhanabhakaym, 2012; Elwalda & Lu, 2014).
The cost to access broadband is still a major focus for most developing countries. Out-
of-reach prices to acquire devices and high subscription charges in particular has been
identified as some of the contributors to low broadband adoption in South Africa
(Seymour & Naidoo, 2013), hence the affordability pillar is applicable. Although
trends are showing steady cost reduction (RIA, 2016), more still needs to be done to
bring it to a level where the majority of the population can be able to afford access to
broadband without sacrificing other basic needs.
Attractiveness refers to the noticeable benefits that broadband delivers to its users.
This includes the relevance of content, applications and services to the livelihood of
users. The relevance can be through entertainment, productivity, business, and
government services. Hauge and Prieger (2010) assert that programmes that are
Page | 5
targeted at specific market segments with information of particular use are important
to mitigate against perceived lack of value as a barrier to adoption.
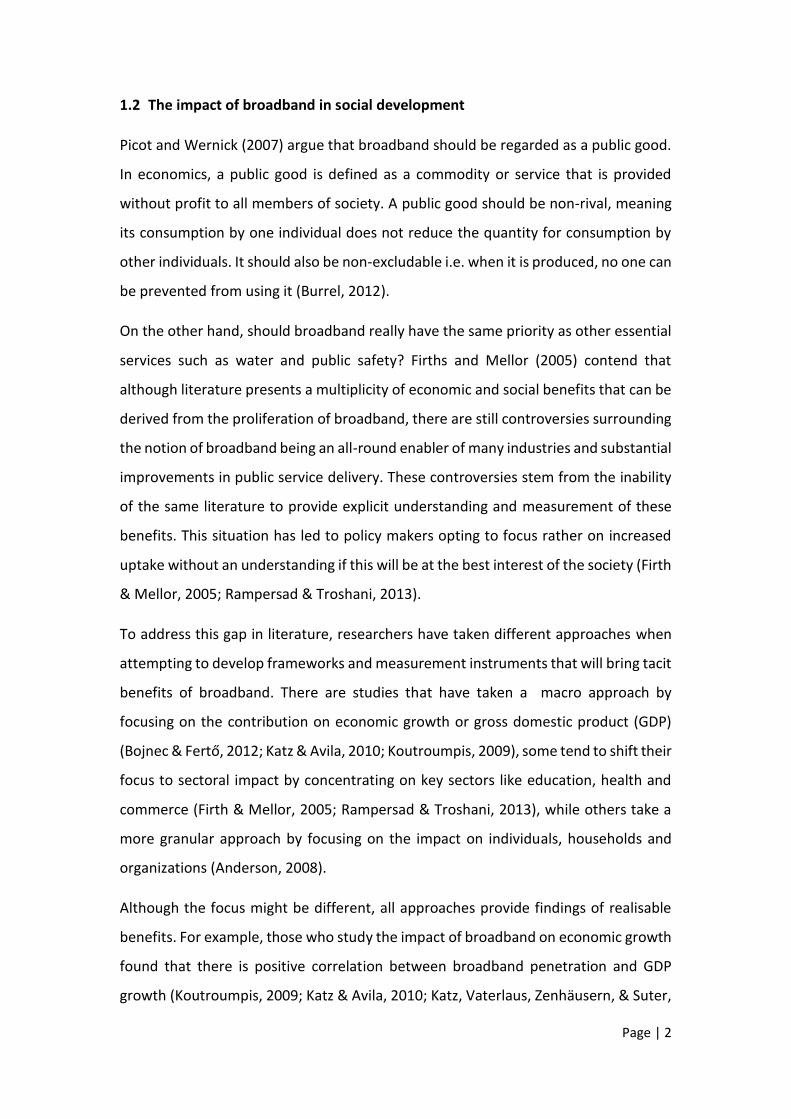
1.4 Broadband network infrastructure
A typical broadband network consists of four major components as illustrated in
Figure 1.
Figure 1: Typical broadband network architecture
Source: Researcher (2018)
1.4.1 End user connected device
The end user connected device is the interface between the user and the network.
This is how the user accesses the Internet and other broadband based services. These
used to be desktops, laptops or smart mobile devices (smartphones, tablets etc.), but
now with advances in the internet of thing (IoT) and machine to machine
communication (M2M) technologies, these can be anything from home appliances,
industrial equipment and machinery, vehicles, monitoring and control systems,
medical equipment, agricultural equipment, as well as interactive class room
equipment. IoT and M2M enable connected devices to communicate and coordinate
with less or no human intervention. This is achieved by using the information gathered
by these connected devices through embedded sensors.
1.4.2 Access network
The access network forms the interface between the end user connected device and
the network. There are generally three types of access network technologies. Fixed
Page | 6
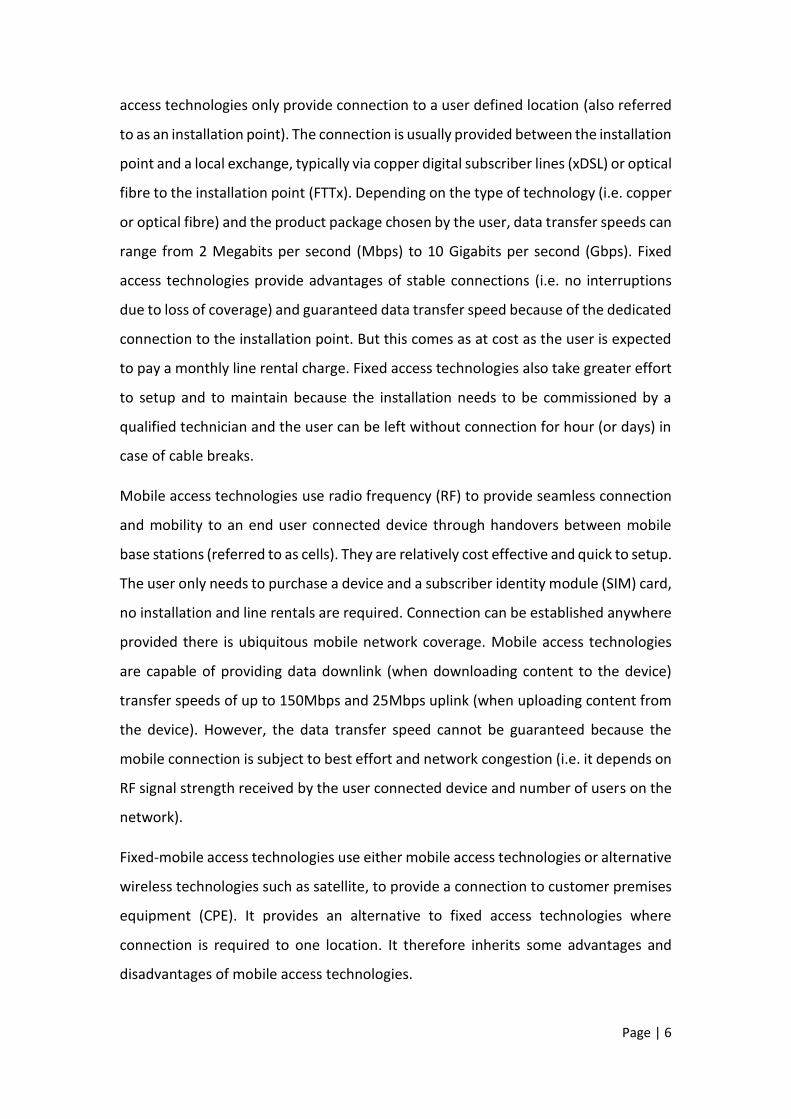
access technologies only provide connection to a user defined location (also referred
to as an installation point). The connection is usually provided between the installation
point and a local exchange, typically via copper digital subscriber lines (xDSL) or optical
fibre to the installation point (FTTx). Depending on the type of technology (i.e. copper
or optical fibre) and the product package chosen by the user, data transfer speeds can
range from 2 Megabits per second (Mbps) to 10 Gigabits per second (Gbps). Fixed
access technologies provide advantages of stable connections (i.e. no interruptions
due to loss of coverage) and guaranteed data transfer speed because of the dedicated
connection to the installation point. But this comes as at cost as the user is expected
to pay a monthly line rental charge. Fixed access technologies also take greater effort
to setup and to maintain because the installation needs to be commissioned by a
qualified technician and the user can be left without connection for hour (or days) in
case of cable breaks.
Mobile access technologies use radio frequency (RF) to provide seamless connection
and mobility to an end user connected device through handovers between mobile
base stations (referred to as cells). They are relatively cost effective and quick to setup.
The user only needs to purchase a device and a subscriber identity module (SIM) card,
no installation and line rentals are required. Connection can be established anywhere
provided there is ubiquitous mobile network coverage. Mobile access technologies
are capable of providing data downlink (when downloading content to the device)
transfer speeds of up to 150Mbps and 25Mbps uplink (when uploading content from
the device). However, the data transfer speed cannot be guaranteed because the
mobile connection is subject to best effort and network congestion (i.e. it depends on
RF signal strength received by the user connected device and number of users on the
network).
Fixed-mobile access technologies use either mobile access technologies or alternative
wireless technologies such as satellite, to provide a connection to customer premises
equipment (CPE). It provides an alternative to fixed access technologies where
connection is required to one location. It therefore inherits some advantages and
disadvantages of mobile access technologies.
Page | 7
1.4.3 The core network
Aggregation network consist of points where the data from access networks is
aggregated and routed to the desired destinations, this includes local and regional
Internet exchange points (IXPs). The transport or backbone network forms the key
connectivity between aggregation networks. The aggregated data is transmitted to
external networks (national and international) through the national backbone
network (also fibre optic or microwave) and international undersea cables or satellite.
The national data will be terminated on local destinations and the international data
will be transferred to international undersea cable landing stations where it will be
further aggregated with data from other networks and transmitted to international
destinations.
1.5 Background on the South African broadband market
The ICT sector has been identified as one of the key sectors to drive economic growth
in South Africa (Statistics South Africa, 2014). Its contribution to the country’s GDP
was estimated at 3% with telecommunications services (which also include
broadband) amounting to 62% of the total contribution (Statistics South Africa, 2014).
Figure 2 represents the overview of the broadband market in South Africa. It should
be noted that the figure only depicts market players with considerable market share,
there is a number of other smaller players providing access infrastructure and services
as well. According to the ICT regulator, the Independent Communications Authority
of South Africa (ICASA), there were over 370 companies that were licenced to provide
network infrastructure and services by September 2017.
Page | 8
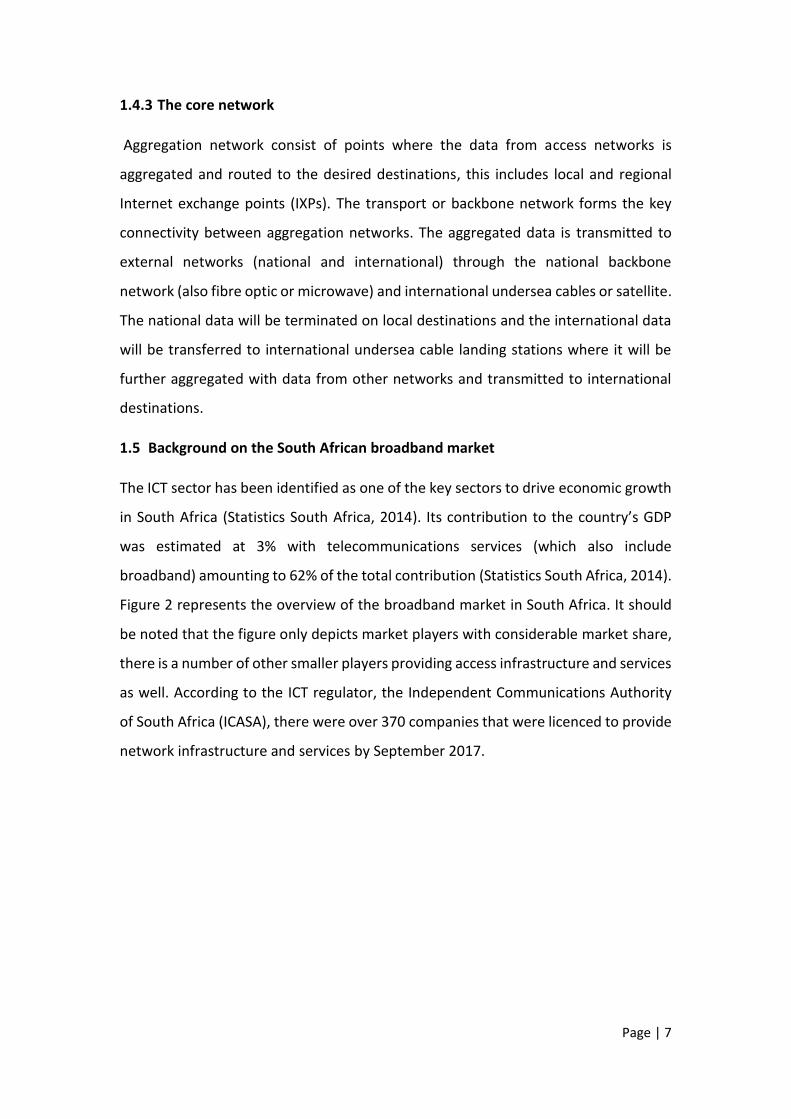
Figure 2: Overview of the broadband market in South Africa
Source: Researcher (2018)
1.5.1 Access and retail services markets
The figure depicts a number of vertically integrated market players operating in all
spheres of the market. Vodacom and MTN are South Africa’s dominant mobile
network operators (MNOs) with over 42% and close to 35% market share respectively
as shown in Figure 3 Both Vodacom and MTN own and operate core and access
infrastructure and they also provide retail services. The third MNO to enter the market
(Cell C), owns just over 17% of the mobile market and the fourth market entrant,
Telkom Mobile, has manged to accrue 4.5% or the market since it was launched in
2010. The other 1.1% of the market is shared by mobile virtual network operators
(MVNOs) who only operate at retail services level. MVNOs do not own and operate
network infrastructure, they usually enter into national roaming contracts with MNOs.
Page | 9
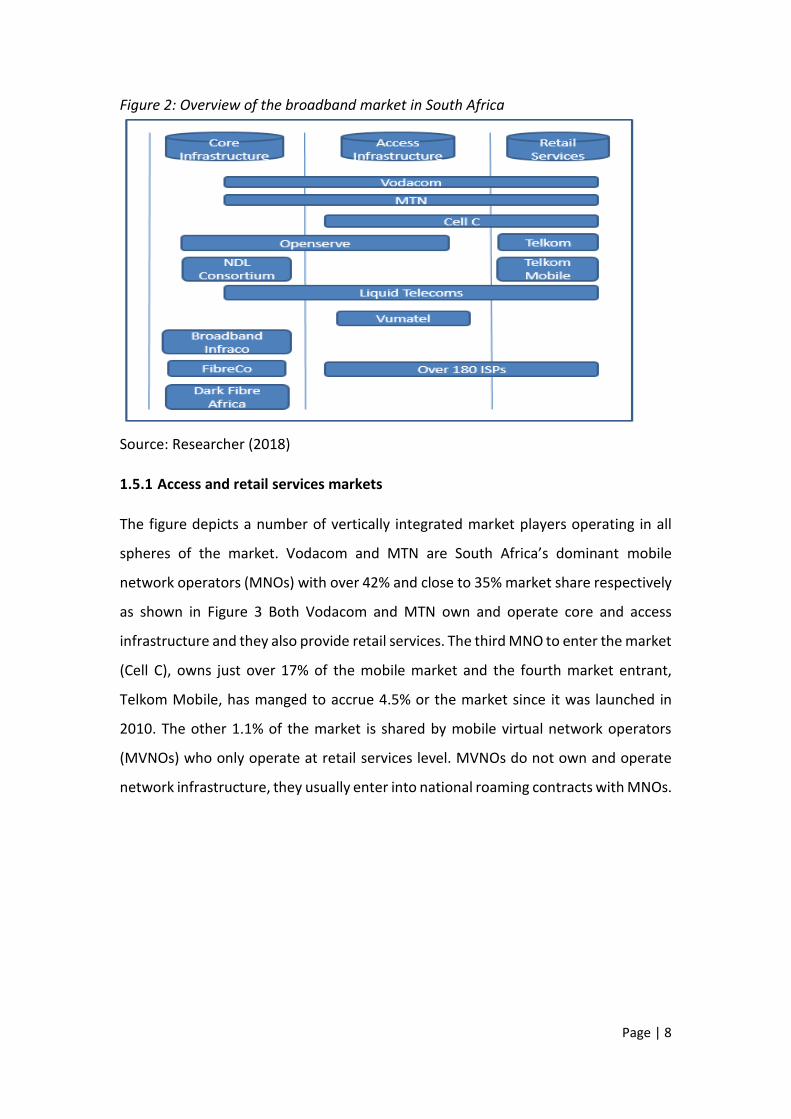
Figure 3: Mobile market share in South Africa
Source: BusinessTech (2017)
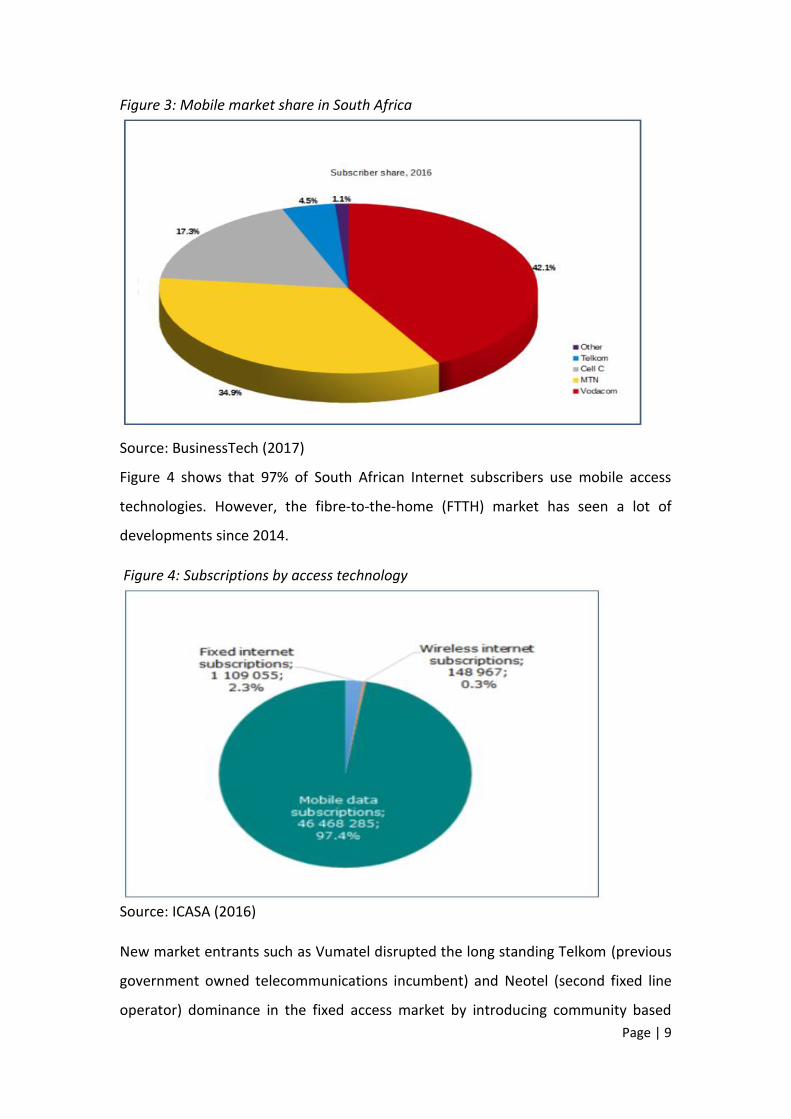
Figure 4 shows that 97% of South African Internet subscribers use mobile access
technologies. However, the fibre-to-the-home (FTTH) market has seen a lot of
developments since 2014.
Figure 4: Subscriptions by access technology
Source: ICASA (2016)
New market entrants such as Vumatel disrupted the long standing Telkom (previous
government owned telecommunications incumbent) and Neotel (second fixed line
operator) dominance in the fixed access market by introducing community based
Page | 10
open access FTTH infrastructure. Since then, mobile operators also ventured in to the
FTTH market. Then the market witnessed the structural separation of Telkom to form
a wholesale open access network infrastructure subsidiary, Openserve. There has also
been a number of acquisitions in this market, the most notable being that of Vumatel
acquiring Fibrehoods, the acquisition of Neotel by Liquid Telecom and MTN acquiring
Smart Village. Although there are claims from Openserve and Vumatel to be market
leaders in FTTH, there has not been any comprehensive study to evaluate the state of
competition in this market so far.
The retail services market also comprise over 179 internet services providers (ISPs)
(The Internet Service Providers’ Association, 2017), providing access to broadband
Internet through a mixture of technologies such as satellite, point to point microwave
links and Wi-Fi hotspots. Local and regional governments have also put initiatives in
place to ensure easy access to broadband Internet for citizens. Successful examples of
these initiatives includes the City of Tshwane Wi-Fi project in partnership with Project
Isizwe where hotspots were installed in public places (schools, libraries, parks, and
other public facilities) to allow free access to a limited amount of data usage per device
per day, and the City of Cape Town broadband project which has over 800 kilometres
of optic fibre network and has connected over 1 million users on its public Wi-Fi
hotspots (Philip, 2017).
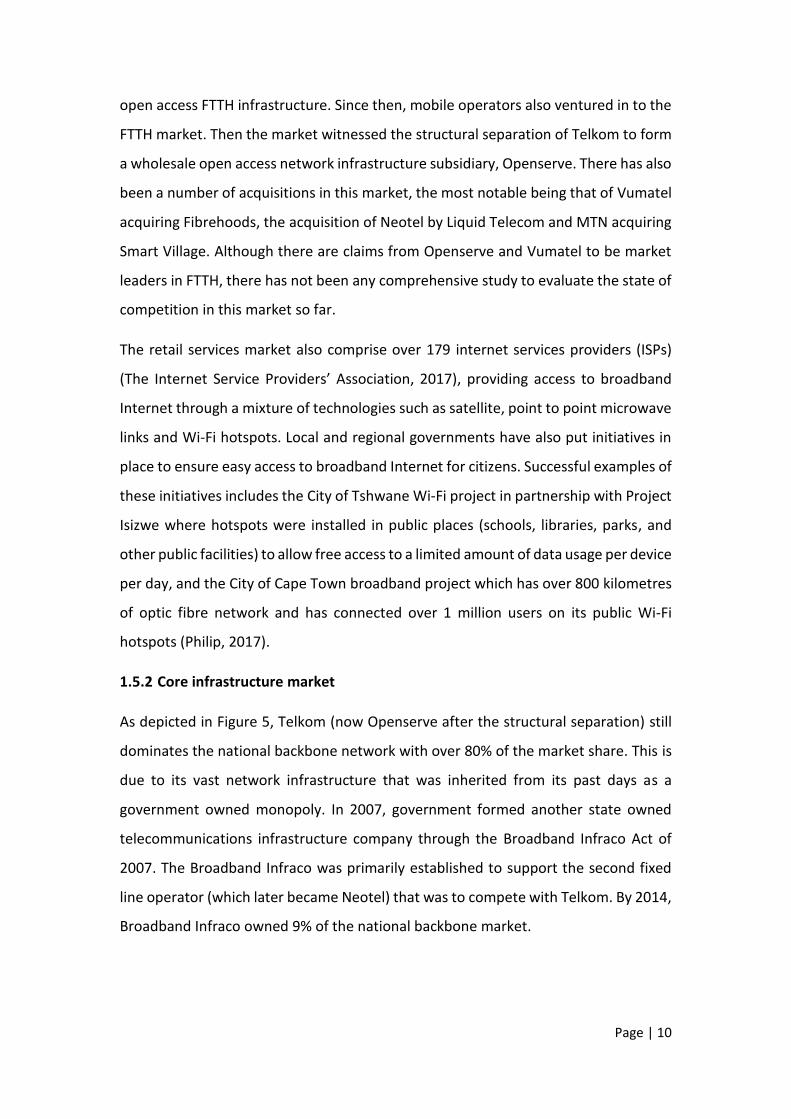
1.5.2 Core infrastructure market
As depicted in Figure 5, Telkom (now Openserve after the structural separation) still
dominates the national backbone network with over 80% of the market share. This is
due to its vast network infrastructure that was inherited from its past days as a
government owned monopoly. In 2007, government formed another state owned
telecommunications infrastructure company through the Broadband Infraco Act of
2007. The Broadband Infraco was primarily established to support the second fixed
line operator (which later became Neotel) that was to compete with Telkom. By 2014,
Broadband Infraco owned 9% of the national backbone market.
Page | 11
Figure 5: Core market share in South Africa
Data Source: Mott MacDonald (2014)
The National Long Distance (NLD) Consortium was launched 2013 as a partnership
between Vodacom, Neotel, MTN and the South African National Road Agency Limited
(SANRAL) to use road infrastructure and servitudes to provide long distance fibre
network that will connect major cities in South Africa and compete with Broadband
Infraco and Telkom. The other 5% of the market was shared by Neotel, FiberCo and
Dark Fiber Africa.
1.6 A perspective on the digital divide in South Africa
Although connectivity to the Internet, in particular broadband, presents so much
benefits to societal development, most developing countries are still grappling with a
considerable degree of digital divide. The adoption and usage of broadband has over
the years seen a disproportionate growth between income levels, with the main
barriers identified as cost and access to infrastructure. Broadband adoption and usage
comes at a considerable cost that is out of reach for some members of society (i.e.
device and data cost).
Furthermore, broadband infrastructure rollout in developing countries has been
driven by private entities whose main focus is to generate profit (Nedohe, 2014). This
resulted in infrastructure gaps in areas that are deemed to have low or no return on
investment. The potential socio-economic benefits and exclusive provisioning of
access to broadband services and infrastructure has caused common concern and

Page | 12
prompted action from politicians and national governments around world (Picot &
Wernick, 2007).
South Africa is no exception to this phenomenon. Its social inequalities are rooted in
the past political and economic exclusions which shaped unequal access to resources,
infrastructure and other services (education, healthcare, telecommunications etc.).
The fact that this level of disparity is still prevalent even over 20 years after South
Africa became a democratic country, draws attention to how policies are being
developed and implemented to support social development (in certain sectors) by the
government. ICT is one sector with high social development potential, but also reliant
on sound policy and implementation to realise the benefits.
South Africa is a developing country with a total population of 55.9 million, a GDP of
294.8 billion USA dollars (World Bank, 2017). The country is currently challenged by a
high unemployment rate of more than 30% and a high income disparity as evidenced
by the country’s Gini Coefficient of 0.68 (Statistics SA, 2017). To separate and define
household income levels, Statistics South Africa (2015) divided annual household
income into four categories as shown in Table 1.
Table 1: Statistics South Africa income level categories
Source: Data derived from Statistics South Africa (2015)
However, Statistics South Africa (2015) alludes to the challenge of defining income
levels accurately as income is an inherently difficult variable to measure because it its
definition as the sum of consumption and change in net worth. Furthermore, the
Statistics South Africa definition of income levels is based on the data collected from
the 2011 census. Therefore, there might have been considerable changes in net worth
over the past years. Hence an updated and granular measure was necessary for this
study.
Annual Income Income Category
R1–R19 200 No income
R1–R19 200 Low income
R19 201–R307 200 Middle income
R307 201 and above Upper income
Page | 13
The Living Standard Measures (LSMs) were developed by the South African Audience
Research Foundation (SAARF) in the late 1980’s after realising the need for an index
that will use a number of variables (rather than one) to segment the population in to
10 markets or LSM groups (1 being the lowest and 10 the highest) based on the
average monthly household income and affordability. The index has since been
improved throughout the years to cater for rapid market changes. LSM has become
the most popular tool used for market research in South Africa (SAARF, 2015).
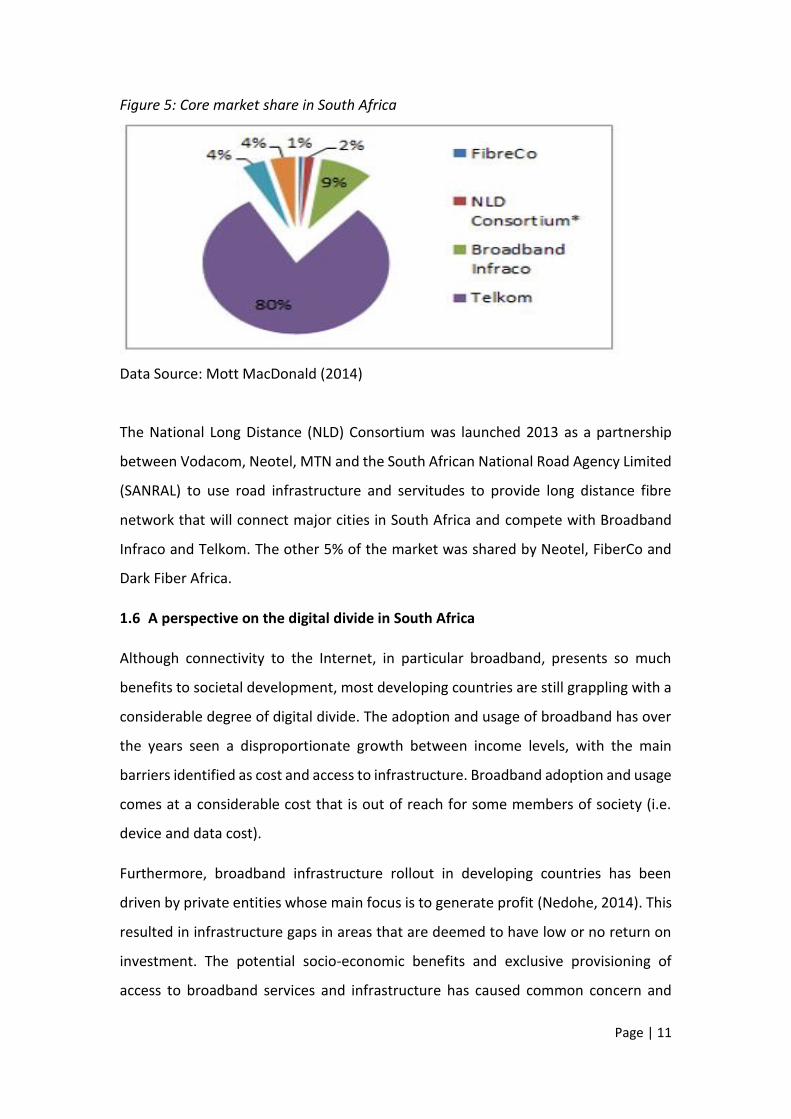
In the absence of an accurate measure for income levels, the SAARF LSMs were used
to propose three income levels for the purpose of this study. Table 2 illustrates the
LSMs data as published by SAARF in 2016 and how it was grouped to define the income
levels. Following the proposed income levels, the data SAARF LSMs data showed that
84.1% of the South African population fell within the low-income level.
Table 2: Income levels definition using LSMs
Source: Data derived from SAARF (2016)
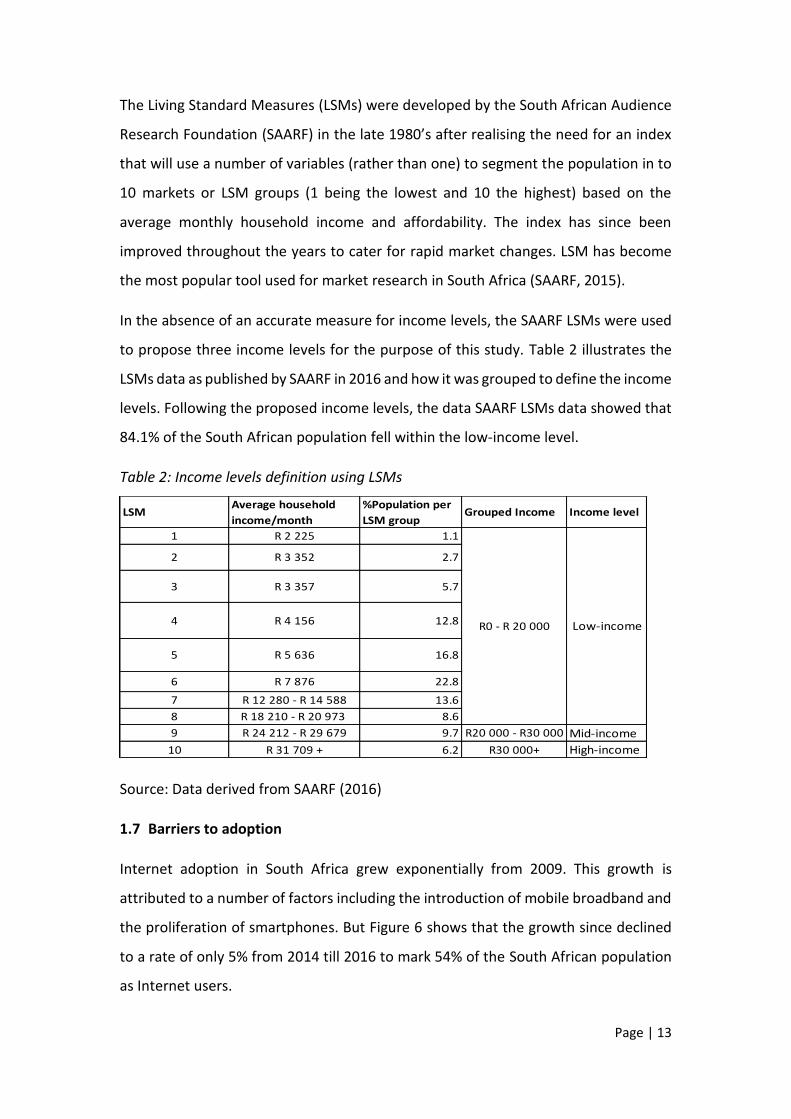
1.7 Barriers to adoption
Internet adoption in South Africa grew exponentially from 2009. This growth is
attributed to a number of factors including the introduction of mobile broadband and
the proliferation of smartphones. But Figure 6 shows that the growth since declined
to a rate of only 5% from 2014 till 2016 to mark 54% of the South African population
as Internet users.
LSMAverage household
income/month
%Population per
LSM groupGrouped Income Income level
1 R 2 225 1.1
2 R 3 352 2.7
3 R 3 357 5.7
4 R 4 156 12.8
5 R 5 636 16.8
6 R 7 876 22.8
7 R 12 280 - R 14 588 13.6
8 R 18 210 - R 20 973 8.6
9 R 24 212 - R 29 679 9.7 R20 000 - R30 000 Mid-income
10 R 31 709 + 6.2 R30 000+ High-income
R0 - R 20 000 Low-income
Page | 14
Figure 6: Internet penetration in South Africa
Source: Data from ITU (2017)
The declined Internet penetration is regarded as a result of factors such as high cost
and lack of access to infrastructure as the most significant barriers for broadband
uptake and usage (Brown, Letsididi & Nazeer, 2009; Naidoo, 2011; Seymor, 2012;
Seymor & Naidoo, 2013). Since the introduction of the Internet in South Africa in the
early 1990s, connection was primarily via fixed line technologies like Integrated
Service Digital Network (ISDN) and later Asymmetric digital subscriber line (ADSL)
which kept the cost of Internet high and out of reach for many households. But the
fast growing mobile industry soon surpassed fixed line subscription numbers due to
the added advantages of mobility and the ease of connection, vast coverage, and
lower connection rates. In 2016, ICASA reported that 99% of the South African
population was within 3G coverage and the Long Term Evolution (LTE) coverage grew
by over 20% in the same period (see Figure 7). Mobile broadband technologies are
now considered as viable substitutes and preferred methods of connecting to the
Internet by majority of South African subscribers (Moroeng, 2011).
0.00
10.00
20.00
30.00
40.00
50.00
60.002
00
0
20
01
20
02
20
03
20
04
20
05
20
06
20
07
20
08
20
09
20
10
20
11
20
12
20
13
20
14
20
15
20
16
SA Internet penetration(% pop)
SA Internetpenetration(% pop)
Page | 15
Figure 7: Percentage of population covered by mobile broadband
Source: ICASA (2016)
Furthermore, a price comparison between 2003 and 2013 indicate a decrease in both
mobile and fixed data price per gigabyte, not considering line rental cost for ADSL
(Muller, 2013). The price of smartphones has also reduced following initiatives by
service providers to introduce low cost smart devices (e.g. Vodacom’s Smart Kicka and
MTN’s Steppa). South Africans can now purchase a smartphone with 3G HSPA+ (High
Speed Packet Access bearers capable of theoretical data transfer speed of up to 168
Mbps download and 22 Mbps upload) and Wi-Fi connectivity for just under ZAR500.
Based on the above, the argument that although cost and access to infrastructure are
still key determinants, there are other factors that drive broadband demand
differently can be advanced (Flamm & Chaudhuri, 2007). Hence the focus should
rather shift towards other motivational factors that influence increased adoption and
usage of broadband, particularly for low-income communities.
1.8 Policy and legal environment to support broadband in South Africa
Duncan (2015) states that developing countries may be pressured to embrace one-
size-fits-all policies in order to prove their global relevance. But this approach may
have adverse results. Primarily because when a policy blueprint is adopted, there may
be less attention paid to local contextual needs. Duncan further points to ICT for
Page | 16
Development (ICT4D) projects as an example, with many of the projects failing to
increase ICT adoption and use in the intended communities because they were mainly
supply-driven. Moreover, policy makers assumed that when ICT infrastructure and
facilities (e.g. community telecentres) are provided, communities will by default adopt
and use them. This approach neglected the need to integrate technologies in
communities, specifically the understanding of why and how communities use ICT to
improve their livelihood, which in turn stimulates demand.
Since the repealing of the Telecommunications Act No. 103 of 1996 by the Electronic
Communications Act No. 36 of 2005 as amended (ECA), the South African ICT sector
has seen major reforms in the Internet service provisioning market. The ECA is the
current legislation that governs the ICT sector and it is supported by other legislations
such as the Broadcasting Act No. 4 of 1999, Postal Services Act No.124 of 1998,
Electronic Communications Transactions Act No. 25 of 2002 (ECTA) and the
Independent Communications Authority of South Africa Act No. 13 of 2000 (ICASA Act)
which established the sector regulator.
The current licensing regime under the ECA caters for an electronic communications
network services (ECNS) licence that allows a licensee to construct and operate
network infrastructure, and an electronic communications services (ECS) licence
which only allow provisioning of wholesale and retail services without owning and
operating network infrastructure. The licensing regime enables licensees to acquire
either the ECNS, ECS or both. This provides a dynamic platform where competition
can be realised at both infrastructure and services levels.
The publication of the national broadband policy in 2013 was a major milestone for
the country. South Africa Connect (SA Connect) as it is formally known, is premised on
four pillars as illustrated in Figure 8.
Page | 17
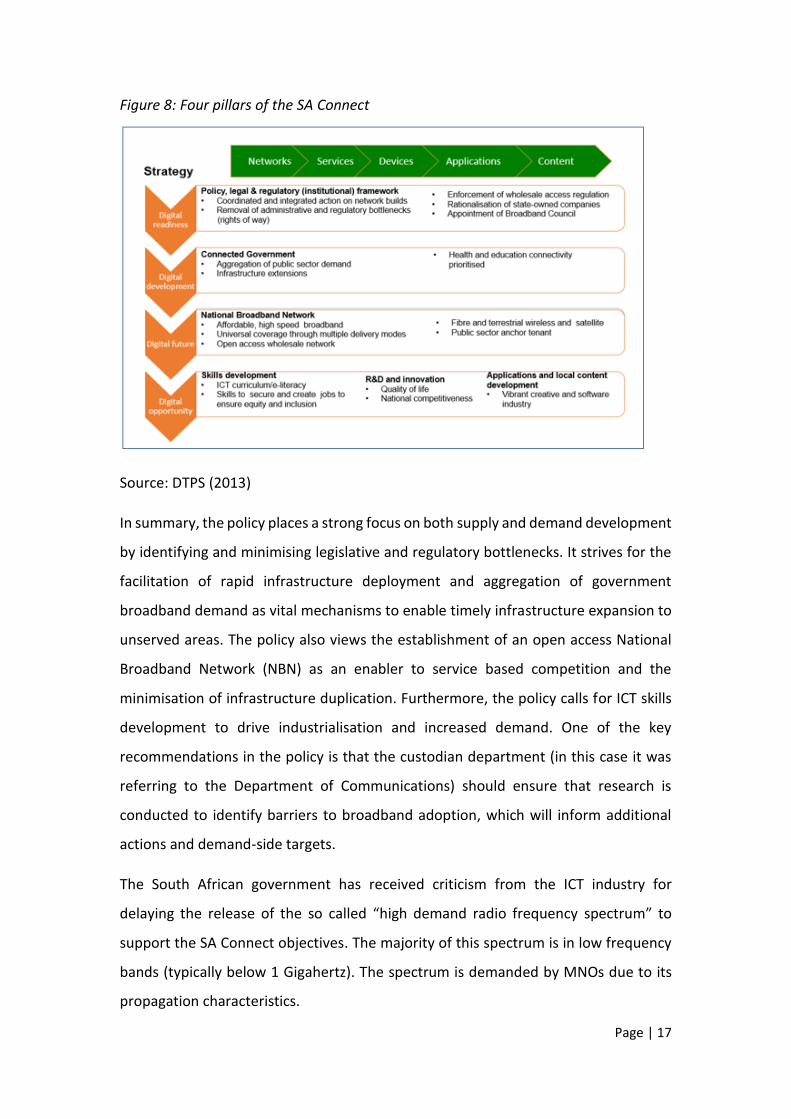
Figure 8: Four pillars of the SA Connect
Source: DTPS (2013)
In summary, the policy places a strong focus on both supply and demand development
by identifying and minimising legislative and regulatory bottlenecks. It strives for the
facilitation of rapid infrastructure deployment and aggregation of government
broadband demand as vital mechanisms to enable timely infrastructure expansion to
unserved areas. The policy also views the establishment of an open access National
Broadband Network (NBN) as an enabler to service based competition and the
minimisation of infrastructure duplication. Furthermore, the policy calls for ICT skills
development to drive industrialisation and increased demand. One of the key
recommendations in the policy is that the custodian department (in this case it was
referring to the Department of Communications) should ensure that research is
conducted to identify barriers to broadband adoption, which will inform additional
actions and demand-side targets.
The South African government has received criticism from the ICT industry for
delaying the release of the so called “high demand radio frequency spectrum” to
support the SA Connect objectives. The majority of this spectrum is in low frequency
bands (typically below 1 Gigahertz). The spectrum is demanded by MNOs due to its
propagation characteristics.
Page | 18
The signal can travel for longer distances without being distorted because the
frequency is low, thus enabling MNOs to cover wide areas with high speed broadband
at less investment on infrastructure. This is particularly beneficial in sparsely
populated areas.
A considerable amount of this spectrum (in the 400 Megahertz band) is currently used
by analogue television broadcasting. Hence the migration of television broadcasting
from analogue to digital will release the spectrum for broadband services. The delays
are embroiled in long standing legal disputes between the national Department of
Communications (DoC) and broadcasters on the implementation process and the
encryption of television set-top boxes. This led to South Africa missing the deadline of
June 2015 that was declared by the International Telecommunication Union (ITU) for
countries to migrate television broadcasting to digital.
The other aspect that has hampered the release of the high demand spectrum is the
inability of the national Department of Telecommunications and Postal Services
(DTPS) to provide a policy directive on how this spectrum should be licensed. The DTPS
is concerned that the spectrum (as a key national resource) should be licensed in the
manner that will ensure that the proceeds from the licensing process will meet the
developmental objectives of the government and drive transformation. In July 2015,
ICASA issued an invitation to apply for licensing part of the spectrum in the 700, 800
Megahertz and 2.3 Gigahertz bands through an auction process. The DTPS then lodged
a legal challenge, claiming that ICASA was acting outside of its legal mandate to initiate
the licensing process without the concern from the ministry. The DPTS won an
interdict for ICASA to halt the process until the court makes a ruling on its claims.
In October 2016, the DTPS published the National ICT Policy White Paper that was
approved by parliament after a lengthy drafting and consultation process. The
National ICT policy white paper is said to be an overarching policy document that will
govern the development of the ICT sector for the next 10 to 15 years. Therefore, the
document will see the repealing of the ECA and amendments of other legislations such
as the ICASA Act, Postal Service Act, and South African Post Office Act. One of the key
highlights of the National ICT policy white paper is the call to establish a Wireless Open
Page | 19
Access Network operators (WOAN). The aim is to consolidate the high demand
spectrum under the control of the WOAN for it to provide open access infrastructure
to all service providers in a fair and equal manner in order to facilitate effective
competition at services level.
1.9 Soshanguve
The township of Soshanguve was chosen as the target population for this study.
Soshanguve is located 25 kilometers on North West of South Africa’s administrative
capital Tshwane. It dates back to 1974 and the name “Soshanguve” was derived from
abbreviating each of the ethnic groups that were relocated to the township, namely:
Sotho, Shangaan (Tsonga), Nguni and Venda.
The township is subdivided into sections or extensions and covers an area of 126 km².
The total population is estimated at over 400,000 with 106,057 households and a
density of 836 households per km² (Statistics South Africa, 2011). Soshanguve has a
diverse cultural heritage with all South African official languages represented. The
township is mostly residential and the majority of people work in Tshwane central
business district and surrounding areas (i.e. Tshwane North, West and East, Rosslyn,
Hatfield and Centurion).
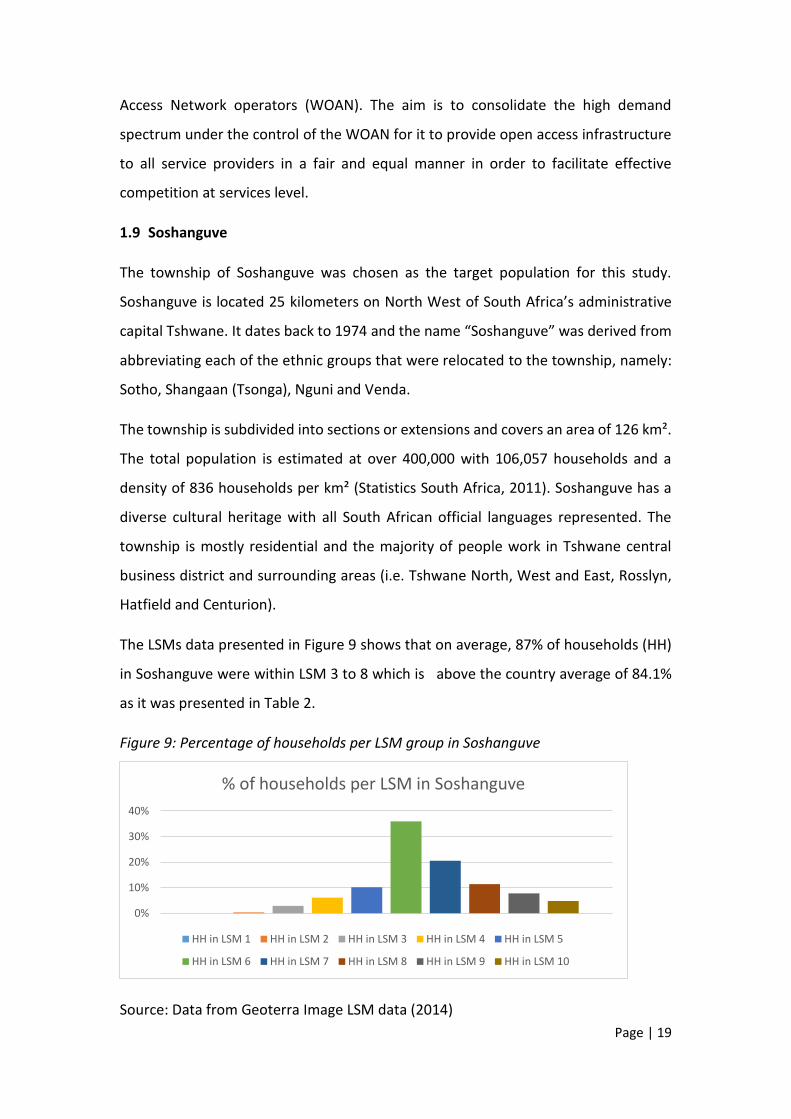
The LSMs data presented in Figure 9 shows that on average, 87% of households (HH)
in Soshanguve were within LSM 3 to 8 which is above the country average of 84.1%
as it was presented in Table 2.
Figure 9: Percentage of households per LSM group in Soshanguve
Source: Data from Geoterra Image LSM data (2014)
0%
10%
20%
30%
40%
% of households per LSM in Soshanguve
HH in LSM 1 HH in LSM 2 HH in LSM 3 HH in LSM 4 HH in LSM 5
HH in LSM 6 HH in LSM 7 HH in LSM 8 HH in LSM 9 HH in LSM 10
Page | 20
Therefore the township’s income profile and its close proximity and accessibility to
the researcher, presented a suitable population for this study.
1.10 Research problem statement
Apart from the commonly known determinants (i.e. cost and access to network
infrastructure), there are motivational factors that can be identified from literature
that influence the decision of consumers to adopt and use broadband. To this end,
research is still focused on ranking factors in order of significance in an attempt to
explain which factors have the most influence on the user’s decision to adopt and use
broadband. Little consideration is being assigned to the examination of the collective
effect of these motivational factors and how they influence the behaviour of users to
adopt and use broadband. There is also less emphasis on the role played by
demographics such as income level to the determination of the motivational factors.
Although there are studies that have presented motivational factors for broadband
adoption in South Africa, there is little knowledge about how these motivational
factors collectively influence the adoption and usage of broadband by low-income
households, as this has not yet been studied in detail.
1.11 Research purpose statement
The purpose of this research is to investigate how motivational factors influence the
behaviour of low-income households in South Africa to adopt and use broadband. The
research was conducted in the township of Soshanguve in the City of Tshwane, South
Africa. The study first sought to uncover how broadband was utilised by low-income
households. Then it examined how low-income households are influenced by
attitudinal constructs, normative constructs, control constructs as well as relevance
constructs to adopt and use broadband. This sought to provide a deeper
understanding on the interaction of low-income households and broadband in order
to give inputs to policy, regulation and market strategies for broadband demand
stimulation.
Page | 21
1.12 Research questions
The following research question was posed to address the aforementioned problem
statement:
Main Research question
How do motivational factors influence the adoption and usage of broadband in low-
income households?
To support the main research question, the following sub-questions were
investigated:
Sub question 1
What are the characteristics of broadband use among low-income households?
Sub question 2
How do attitudinal, normative and control constructs influence the behaviour of low-
income households to adopt and use broadband?
Sub question 3
How do relevance constructs support the influence on behaviour of low-income
households to adopt and use broadband?
1.13 Research objectives
This research investigates how motivational factors influenced the decision of low-
income households in terms of adoption and use of broadband. There are multiple
factors that affect the decision of households and individual users to adopt broadband
that have already been identified in literature. This study does not attempt to uncover
additional factors, nor rate factors in terms of their prominence as previous studies
have done. The focus is rather on motivational factors, as identified in literature, and
how they collectively influence low-income households to adopt and use broadband.
In addressing the aforementioned objectives, the study first seek to build a deeper
understanding on how low-income households use broadband.
Page | 22
1.14 Limitations
Due to the short timelines provided to complete the study and cost considerations,
samples were drawn from three sections in one township only. Therefore, the results
of this study has limited generalisability to South African low-income households.
The measure that was used to classify income levels had limited accuracy because
income is dynamic variable that needs to be measured frequently. In addition, the fact
that a 47% of participants did not know their monthly household income may also
present a weakness in validating the findings since the study was premised on income
level.
The theoretical framework that was adopted for this study was extended to include
relevance constructs which have not yet been proved statistically to have had any
influence on technology adoption. This may imply inherent weakness on the findings
deduced on these constructs.
1.15 Significance
The results of this study provide the basis for understanding how motivational factors
influence the behaviour of low-income households in their adoption and use of
broadband in South Africa. The study also provides suggestions for future research
and make recommendations that can be beneficial to policy makers, regulators and
industry players when developing broadband policy, regulations and demand
strategies and also supplement the growing global knowledge in broadband adoption
and usage.
1.16 Chapter Outline
Chapter 1 has provided a context on the impact of broadband in society,
considerations for broadband demand stimulation and an overview of broadband
network infrastructure. The chapter then provides a background on the South African
broadband market, the country’s digital divide, barriers to Internet adoption and the
current policy environment to support broadband development. The background is
followed by a profile of the selected population of Soshanguve and a summary of the
research problem and purpose statements, the research questions, the research
Page | 23
objectives, its limitations and significance and concludes with the chapter outline for
this report.
Chapters 2 is a review of literature. The chapter lays a theoretical foundation around
technology adoption as related to Information Technology (IT). A global review to
identify gaps in broadband adoption literature and to uncover factors that motivate
potential users to adopt and use broadband is conducted. A list of the most influential
factors is then selected to inform a theoretical framework for this study.
Chapter 3 builds on the research problem statement and purpose statements, then
research questions are drawn from the theoretical framework developed in Chapter
2 to address the research problem. The chapter also introduces the research
approach, the research design and methods used to collect and analyse data.
Chapter 4 provides a presentation of data collected from the focus groups based on
the research questions and methods stated in Chapter 3. The chapter begins by
providing the profile of the participants. Then the results are presented on each tested
factor as per the theoretical framework and any other factors that are apparent from
the collected data.
Chapter 5 is an in-depth analysis of the data presented in Chapter 4. The chapter
provides a perspective narrative on the literature review on how motivational factors
influence low-income household to adopt and use broadband. And lastly, the chapter
presents the detailed extended theoretical framework.
Chapter 6 concludes the research report by reassessing the objectives of the study in
line with the collected and analysed data and how these objectives were met make
recommendations. The chapter further provides proposed areas of future research,
assesses its contribution to the body of knowledge and closes with a conclusion for
the study.
Page | 24
Chapter 2: Literature on broadband and technology adoption
2.1 Introduction
Considering the clear assertions from literature about the potential benefits and the
impact of broadband on society, it is important to further outline the link between
broadband and socio-economic development and what makes it a public policy issue.
In this chapter, the researcher turns to literature to find a suitable definition for
broadband and an insight on user patterns, as well as the importance of local content
and its impact on broadband adoption and usage. The researcher also reviews
literature to provide a background on technology adoption models and theories as
well usage in order to define user patterns. A review of key theories and models as
applied or integrated by researchers in information systems is conducted. Followed
by a narrowed focus on the models developed specifically to study adoption of
broadband by households and individuals in order to identify the motivational factors.
Then a global overview of motivational factors for broadband adoption with an aim of
identifying any differences or similarities between developed and developing
countries is conducted. Lastly, a conceptual and theoretical framework for this study
is drawn from the literature.
2.2 Defining Broadband
There is no standard or universal definition for the term “broadband” (Choudrie &
Dwivedi, 2006; Kelly & Rossotto, 2012) therefore this chapter first turns to literature
in order to identify a suitable definition of broadband for this study. Traditionally,
broadband is regarded as an evolution in network technology to enhance functionality
that could not be achieved with its predecessor’s (narrowband) technologies due to
the nature of content conveyed (Van den Broeck & Lievens, 2007). Hence broadband
is commonly defined as the amount of data (in bits) that can be transferred through a
particular network connection in a given period of time, usually per second (Van den
Broeck & Lievens, 2007; Seymour, 2012; Abrahams, Bakker, & Bhyat, 2007).
Although the former definition is widely accepted by network and end user equipment
manufacturers, network operators, content providers and users, it is limited when
considering it from the view of policy and regulation because of the potential impact
Page | 25
of broadband to the entire economy (Kelly, Mulas, Raja, Qiang, & Williams, 2009; Picot
& Wernick, 2007). There are three limitations with defining broadband in terms of
data transfer speed as identified by Kelly and Rossotto (2012). First there is no
consensus among influential organisations such as the ITU, Organization for Economic
Cooperation and Development (OECD), Internet Society (ISOC), and the World
Economic Forum (WEF) and countries on what should be the minimum data transfer
speed to qualify a connection as broadband. Secondly, even if a minimum speed can
be agreed upon, it will have to be revised frequently to keep up with rapid
technological developments and user demands. The third limitation has much to do
with the actual network configurations (different types of backbone and access
technologies) and end user device capabilities. All these factors have a considerable
impact on the connection speed, thus it is difficult for network operators to always
guarantee data transfer speed to a user.
Considering these limitations, it is a futile exercise to set broadband policy objectives
or targets using the data transfer speed definition. It can culminate in governments
setting targets that are either too low or too high for network operators to meet (Kelly
& Rossotto, 2012), with negative consequences to the user in both cases. The other
aspect that makes developing policy under the above mentioned definition of
broadband flawed is its supply side orientation. Its main concern is providing high
speed data networks with less regard to different user (i.e. business, government and
individual) requirements and usage. This can also lead to either over supply of network
infrastructure in areas where it is not needed, resulting in return on investment issues
for network operators, or under supply in high demand areas resulting in poor quality
of service.
For these reasons, Kim, et al., (2010) proposed that the definition should go beyond
network capabilities and data transfer speed to an ecosystem that encompasses high
speed networks, services, products, applications and users. The authors hold a view
that policymakers should see broadband as an enabling platform and key input to
growth across many sectors. In addition to the direct benefits from investment in
broadband technology development and infrastructure deployment, broadband can
Page | 26
drive innovation to improve productivity and create new products and services in
other sectors.
Kelly and Rossotto (2012, p. 3) further assert that from a policy perspective, a more
holistic view of broadband should be taken, so they define it as “a high-capacity ICT
platform that improves the variety, utility, and value of services and applications
offered by a wide range of providers, to the benefit of users, society, and multiple
sectors of the economy”. Hence broadband can be considered a General Purpose
Technology (GPT) with the potential to induce improvements across different sectors
(Kelly & Rossotto, 2012; Kelly, et al., 2009).
This study will therefore assume the holistic definition of broadband as an ecosystem
as proposed by Kim, et al., (2010) with the focal point being on the interaction of
broadband with low-income households. This definition is congruent with the
underlying objective of this study to examine how motivational factors influence low-
income households to adopt and use broadband in two ways. Firstly, it does not
consider broadband as just a technology but an enabler that can enhance the
livelihood of its users, this is important to low-income household members. Secondly,
it does not consider adoption as only access to high speed network infrastructure but
also ownership of devices and usage of applications and services provided over this
infrastructure.
For the purposes of this study, the words “adoption” and “uptake” refer to the
ownership of any end user device capable of connecting to either mobile broadband
connection (e.g. 3G, 4G or Wi-Fi), fixed wireless or fixed data connection. “Usage”
refers to regular purchase of data credits (postpaid or prepaid) for Internet browsing,
content download, instant messaging, social media and any other services (e.g.
banking, education and government services).
2.3 Defining the broadband user
The other element that is important to technology diffusion is usage. Research shows
that technology adoption does not necessarily translate to usage (Lanzolla & Suarez,
2009). Zhang (2013) affirms that technology adoption models only measure the
intentional behaviour of users to adopt, but not the actual use after adoption. To
Page | 27
better understand broadband usage, it is important to define “the broadband user”.
All that is apparent to this stage is the distinction set by performance between
broadband and narrowband. But ultimately both are methods of connecting to the
Internet. Therefore it will be less controversial to define the “Internet user” holding a
view that users are characterised by the behaviour or patterns they exhibit once they
have established an Internet connection.
In their User Diffusion (UD) model to study household use of computers, Shih and
Venkatesh (2004) propose four possible types of Internet use patterns, namely:
intense, experimental, specialised and low use. Each type of use pattern is premised
on the rate and the variety (i.e. number of applications used) of use, where intense
use relates to both high rate and high variety, experimental use refers to low rate and
high variety, specialised use is high rate and low variety, while low use is both low rate
and low variety. The drawback with the use patterns proposed in the UD model is that
they are only limited to two dimensions, so a user can only be classified under the four
possible use types.
It might however be of interest to understand other aspects that affect user patterns
particularly when the aim is to use this information for further demand stimulation.
Norliah et al. (2017) propose that the Internet usage pattern can be identified using
the time spent online, location of access and the purpose of use. The authors argue
that by using these three factors, a user can be classified either as an average,
excessive or addicted Internet user. However, they also propose only three possible
user categories and their focus is on the rate of use.
For the purpose of this study, a more elaborate approach will be used to categorise
Internet users. The approach builds on the UD model by Shih and Venkatesh (2004) as
well as that of Norliah et al. (2007) to add six dimensions as illustrated in Table 3.
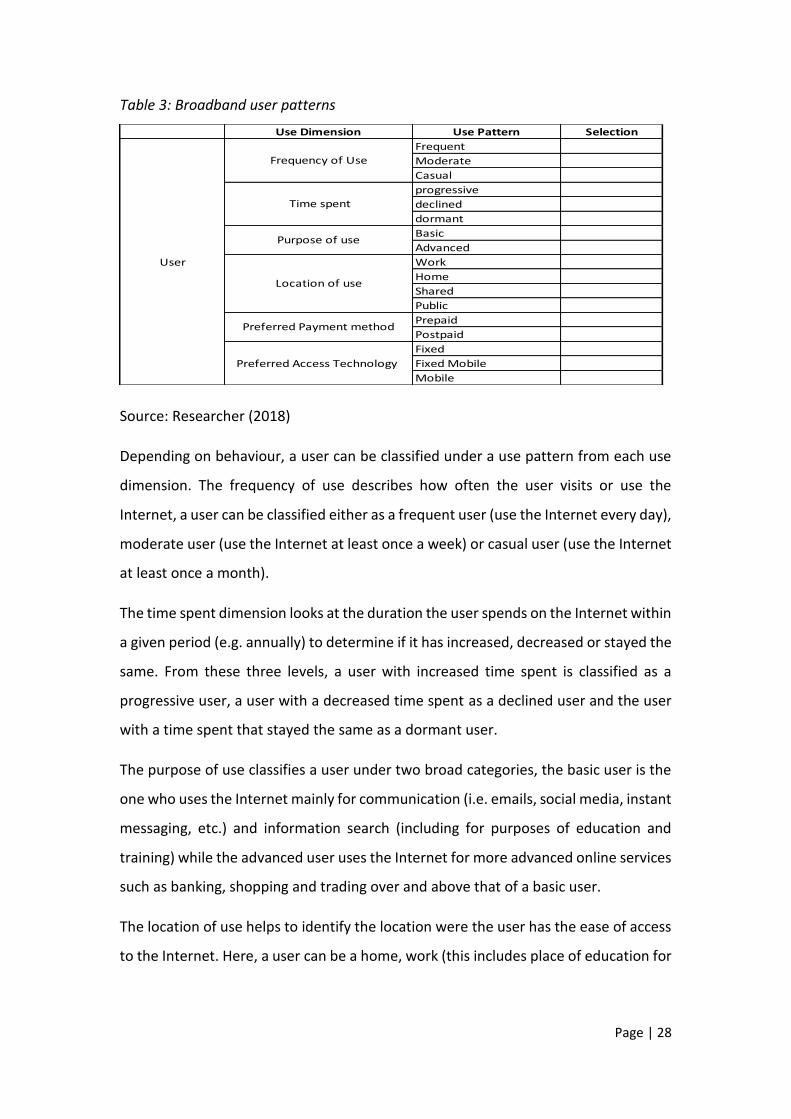
Page | 28
Table 3: Broadband user patterns
Source: Researcher (2018)
Depending on behaviour, a user can be classified under a use pattern from each use
dimension. The frequency of use describes how often the user visits or use the
Internet, a user can be classified either as a frequent user (use the Internet every day),
moderate user (use the Internet at least once a week) or casual user (use the Internet
at least once a month).
The time spent dimension looks at the duration the user spends on the Internet within
a given period (e.g. annually) to determine if it has increased, decreased or stayed the
same. From these three levels, a user with increased time spent is classified as a
progressive user, a user with a decreased time spent as a declined user and the user
with a time spent that stayed the same as a dormant user.
The purpose of use classifies a user under two broad categories, the basic user is the
one who uses the Internet mainly for communication (i.e. emails, social media, instant
messaging, etc.) and information search (including for purposes of education and
training) while the advanced user uses the Internet for more advanced online services
such as banking, shopping and trading over and above that of a basic user.
The location of use helps to identify the location were the user has the ease of access
to the Internet. Here, a user can be a home, work (this includes place of education for
Use Dimension Use Pattern Selection
Frequent
Moderate
Casual
progressive
declined
dormant
Basic
Advanced
Work
Home
Shared
Public
Prepaid
Postpaid
Fixed
Fixed Mobile
Mobile
User
Frequency of Use
Time spent
Purpose of use
Location of use
Preferred Payment method
Preferred Access Technology
Page | 29
learners), sharing (has access to Internet at other people’s places) or public user
(access to Internet at public facilities such as libraries and community telecentres).
The preferred payment method refers to how the user pays for Internet access. The
user can be classified either as a prepaid user (buys and loads prepaid data vouchers),
postpaid user (has contract a contract with a service provider and pays on account) or
free users (prefers to use the free option available including Wi-Fi hotspots).
Lastly, the preferred access technology dimension considers if the user prefers mobile
technologies, fixed-mobile technologies or fixed technologies to access the internet.
2.4 Relevance of broadband content
Howell (2002) likens the content carried over broadband networks to water or gas
that is delivered to consumers through pipe systems. Howell argues that investment
in infrastructure without understanding how the consumer will apply the contents
thereof is a flawed approach. Garcia-Murillo (2005) adds that the availability of local
content to the population in their own language will result in increased broadband
uptake. Lee, Marcu and Lee (2011) further affirmed that the availability of interesting
content and “killer applications” will drive broadband demand.
It is therefore apparent that the lack of relevant content may have a negative impact
on the rate of adoption and usage of broadband. A study by Mwanankuwa (2016)
further affirms that low broadband adoption rate in rural Zambia was partly
attributable to the lack of local content that addresses the needs of a specific
community.
2.5 Information Technology adoption theories and models
Information Technology (IT) adoption and diffusion is a matured field of study. Most,
if not all, literature in this field originates from management information systems
(MIS) or information systems (IS) studies. IS defined by the School of Economic and
Business Sciences at the University of Witwatersrand, as “systems that allow
individuals, organisations, and societies to gather, store, organise, protect, retrieve,
share, and make sense of the information in their environments.”
Page | 30
The focus of IS studies is therefore on how people, organisations and societies interact
with technologies. Hence the study of technology adoption requires an insight in social
psychology, in particular user motivation over and above the understanding of the
technology itself (Davis, 1985).
There are many models and theories developed to investigate the adoption and
diffusion of IT by individuals, households and businesses (Oliveira & Martins, 2011).
The majority of these models are extensions or combinations of previous models and
theories. Developed either to test the limits or form stronger variants or explain new
phenomena as technologies and users evolve.
For this study, the focus will be on the prominent theories and models as developed
by researchers who were most concerned with adoption and usage of information
technology by individuals and households. A literature review by Korpelainen (2011)
reveals that the Theory of Reasoned Action (TRA) (Fishbein & Ajzen, 1975), Theory of
Planned Behavior (TPB) by Ajzen (1985), Technology Acceptance Models (TAM) (Davis,
1985), Diffusion of Innovation Theory (Rogers, 1983), and the Unified Theory of
Acceptance and Use of Technology (UTAUT) (Venkatesh, Morris, Davis, & Davis, 2003)
are among the top five most cited theories in IT adoption studies.
Most models used in IS studies today are rooted in psychology, in particular human
behavioural studies. Researchers endeavoured to discover what will encourage the
acceptance of new technology to assist organisations to predict if the technology will
be accepted by users (Davis, 1985) or to assist innovators to predict if their innovations
will be well accepted by the market and at what rate will they be diffused (Rogers,
1983). Therefore, it is important to first provide a theoretical background in human
behaviour and different models that have been developed over the years.
2.6 Behavioural Intention Theories
As Ajzen (1991) pointed out, predicting human behaviour is a difficult task. It involves
the consideration of many psychological and social complexities. However, it is
important to understand the key aspects of human behaviour because adoption of
technology is a social subject as much as it is a technical one (Rogers, 1985). Hence it
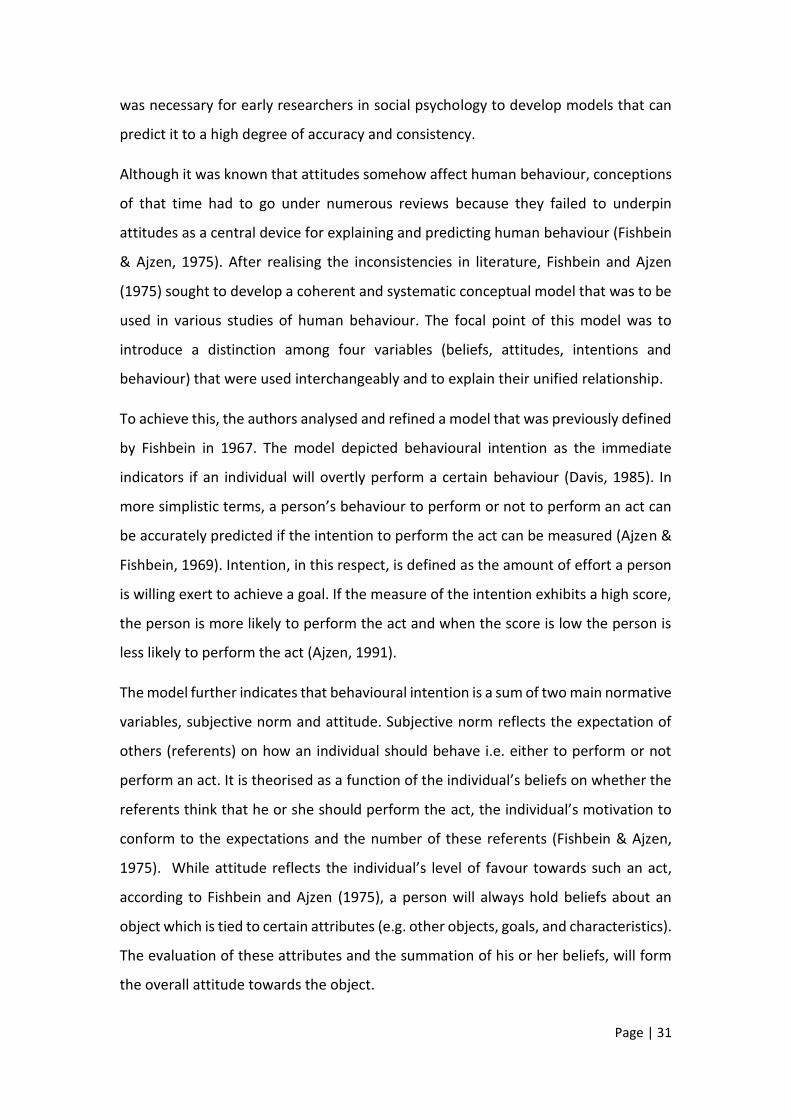
Page | 31
was necessary for early researchers in social psychology to develop models that can
predict it to a high degree of accuracy and consistency.
Although it was known that attitudes somehow affect human behaviour, conceptions
of that time had to go under numerous reviews because they failed to underpin
attitudes as a central device for explaining and predicting human behaviour (Fishbein
& Ajzen, 1975). After realising the inconsistencies in literature, Fishbein and Ajzen
(1975) sought to develop a coherent and systematic conceptual model that was to be
used in various studies of human behaviour. The focal point of this model was to
introduce a distinction among four variables (beliefs, attitudes, intentions and
behaviour) that were used interchangeably and to explain their unified relationship.
To achieve this, the authors analysed and refined a model that was previously defined
by Fishbein in 1967. The model depicted behavioural intention as the immediate
indicators if an individual will overtly perform a certain behaviour (Davis, 1985). In
more simplistic terms, a person’s behaviour to perform or not to perform an act can
be accurately predicted if the intention to perform the act can be measured (Ajzen &
Fishbein, 1969). Intention, in this respect, is defined as the amount of effort a person
is willing exert to achieve a goal. If the measure of the intention exhibits a high score,
the person is more likely to perform the act and when the score is low the person is
less likely to perform the act (Ajzen, 1991).
The model further indicates that behavioural intention is a sum of two main normative
variables, subjective norm and attitude. Subjective norm reflects the expectation of
others (referents) on how an individual should behave i.e. either to perform or not
perform an act. It is theorised as a function of the individual’s beliefs on whether the
referents think that he or she should perform the act, the individual’s motivation to
conform to the expectations and the number of these referents (Fishbein & Ajzen,
1975). While attitude reflects the individual’s level of favour towards such an act,
according to Fishbein and Ajzen (1975), a person will always hold beliefs about an
object which is tied to certain attributes (e.g. other objects, goals, and characteristics).
The evaluation of these attributes and the summation of his or her beliefs, will form
the overall attitude towards the object.
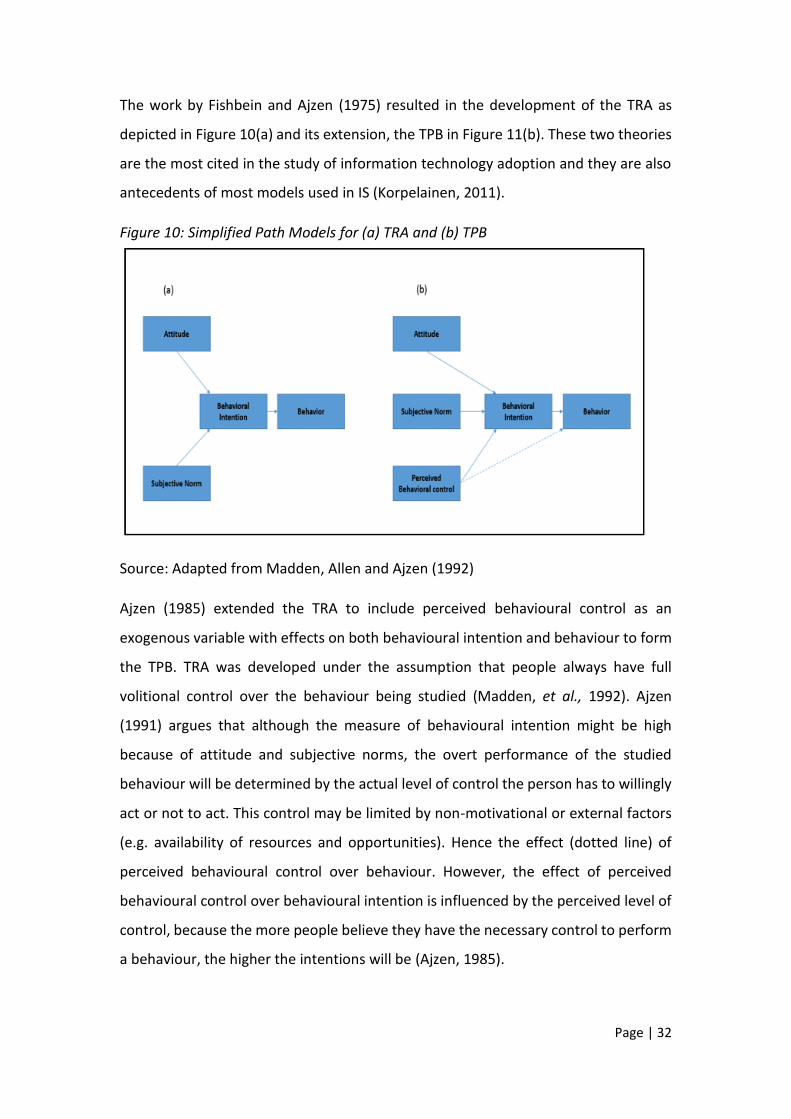
Page | 32
The work by Fishbein and Ajzen (1975) resulted in the development of the TRA as
depicted in Figure 10(a) and its extension, the TPB in Figure 11(b). These two theories
are the most cited in the study of information technology adoption and they are also
antecedents of most models used in IS (Korpelainen, 2011).
Figure 10: Simplified Path Models for (a) TRA and (b) TPB
Source: Adapted from Madden, Allen and Ajzen (1992)
Ajzen (1985) extended the TRA to include perceived behavioural control as an
exogenous variable with effects on both behavioural intention and behaviour to form
the TPB. TRA was developed under the assumption that people always have full
volitional control over the behaviour being studied (Madden, et al., 1992). Ajzen
(1991) argues that although the measure of behavioural intention might be high
because of attitude and subjective norms, the overt performance of the studied
behaviour will be determined by the actual level of control the person has to willingly
act or not to act. This control may be limited by non-motivational or external factors
(e.g. availability of resources and opportunities). Hence the effect (dotted line) of
perceived behavioural control over behaviour. However, the effect of perceived
behavioural control over behavioural intention is influenced by the perceived level of
control, because the more people believe they have the necessary control to perform
a behaviour, the higher the intentions will be (Ajzen, 1985).
Page | 33
A comparison test of the two theories by Madden, et al., (1992) yielded that both
models can accurately predict behaviour provided that the subjects have full volitional
control over the target behaviour. But when the control was limited, TRA was found
to be inferior and TPB recorded on average more variations of behavioural intention
than TRA. This was to attest that the addition of separate belief measurement to the
original TRA can improve its accuracy. Furthermore, Madden, et al., (1992) also posit
that in other settings, it may be beneficial to improve the level of control in order to
influence the behaviour rather than focus on attitude and subjective norm.
Although TRA and TPB has been widely accepted and used in many fields of study,
Ajzen and Fishbein (2005) concede that there are some concerns raised about the
accuracy of the models. The models do not adequately cater for other irrational and
non-cognitive determinants of human behaviour like emotions and compulsions.
Consequently, people can provide different responses depending on their current
moods (Ajzen & Fishbein, 2005).
2.7 The Technology Acceptance Model (TAM)
TAM is one of the most successful theories in technology adoption studies. Its success
saw it being implemented in many fields like medicine, banking, and the public sector.
The original theoretical model was developed by Davis (1985) with the aim of
improving understanding in the user acceptance process and theoretical basis for
testing and successful implementation of information systems. Davis (1985) defined
MIS success criteria around three variables, namely: actual use of the system, user
attitudes, and performance impact. His concern was to develop techniques that will
enable policy and decision makers to motivate targeted users to accept and use the
intended systems.
Since one of the main objectives for developing TAM was to understand the user
acceptance process, it was essential for Davis to integrate in his framework a well-
established theory with human behaviour as a foundation. Hence TRA was chosen to
form the basis of TAM. Davis theorised that if users are exposed to a certain
technology, they will develop an attitude that will determine the likelihood of
acceptance of the technology (intention) and its continuous use. This attitude is
Page | 34
determined to be a function of two major beliefs which are perceived usefulness and
persevered ease of use. Perceived usefulness (PU) is defined as "the degree to which
an individual believes that using a particular system would enhance his or her job
performance" (Davis 1985). While perceived ease of use (PEOU) is defined as "the
degree to which an individual believes that using a particular system would be free of
physical and mental effort" (Davis 1985).
Although TAM has received favourable empirical support through the years due to its
specificity and simplicity (Todd & Taylor, 1995), it is found to be too parsimonious by
other researchers because it relies only on two constructs to define the user attitude
which tends to be a limitation when considering descriptive richness (Poong & Eze,
2008). Taylor and Todd (1995) view TAM as a special case of TRA because it does not
consider subjective norms. This is due to the fact that the model was originally
developed with a strong focus on technology acceptance by individuals at
organisational level for work purposes.
But Davis (1985) contend that subjective norms have no significant impact on
technology acceptance if the user’s attitude and intention is influenced by the
usefulness of the technology towards improving productivity.
This was proven not to be the case by Taylor and Todd (1995) and Venkatesh and Davis
(2000) who view the exclusion of subjective norms as a limitation on TAM. Hence they
propose the decomposed TPB (Taylor & Todd, 1995) and TAM2 (Venkatesh & Davis,
2000). This is expected to be true especially in settings where personal control and
social influence play an important role in decision making (e.g. individual users and
households who are intending to adopt the technology for personal use). Rogers
(1983, p. 4) also emphasise that “an important factor affecting the adoption rate of
any innovation is its compatibility with the values, beliefs, and past experiences of the
social system.”
2.8 Diffusion of Innovations Theory (DOI)
DOI was pioneered by Rogers (1983), and he defines diffusion as a managed or
spontaneous process to spread (communication) messages of new ideas (innovation),
through certain channels over a period of time, among members of a social system.
Page | 35
Hence the four main elements of DOI are innovation, communication channels, time
and the social system (Rogers, 1983).
Rogers identifies three main role players in the process, namely: the change agencies,
change agents and adopters. Change agencies are those who intend to address certain
needs or solve problems through innovation (e.g. inventors, decision makers within
organisations, governments and other authorities), change agents are the ones who
influence the behaviour of others and advocate toward the successful implementation
of the intended objectives of the innovation (e.g. marketers and referents) while
adopters are the target society (individuals or organisations).
The main distinction between DOI and other models is that it is premised on process
principles. Rogers proclaims that diffusion alone will not determine if the innovation
will be successfully adopted or rejected by the society. Therefore, the author proposes
that the ultimate adoption or rejection of an innovation is subject to the innovation
decision process. The process involves continuous evaluation of the innovations
(through five stages) towards a decision whether to adopt or not to adopt.
The knowledge stage occurs when an individual or a decision making unit in an
organisation (e.g. management, government, and other authorities) is exposed to an
innovation and gains sufficient information on how it functions.
The persuasion stage is when an individual or decision making unit develops an
attitude towards the innovation (either favourable or unfavourable).
The decision process is when the individual or decision making unit gets to apply the
innovation in activities that will allow them to make a decision or adopt or reject the
innovation.
The implementation stage is when the innovation is now put into an ongoing use (but
not fully adopted) and last stage is confirmation, which is said to occur when the
individual or decision making unit seeks confirmation from others with similar interest
to ascertain that there are no contrary views and to ensure that their final decision
about the innovation will be sound (Rogers, 1983).
Page | 36
The author further proclaims that innovations are inherently different, this is
explained by why some new products fail while others succeed. Although diffusion
researchers tend to treat them as equal units because more effort is placed studying
people and determining different types of adopters. Hence his proposition of the
attributes of innovation, namely: Relative advantage which relates to how superior is
the new innovation over its predecessor (i.e. functionality and cost), compatibility
refers to how compatible the innovation is with the existing values, skills, and work
practice of potential adopters, complexity is concerned with how difficult the
innovation is to understand and use, trialability checks if the innovation can be
subjected to trials without undue effort and cost, can it be implemented incrementally
with positive benefits, and observability which confirms if the results and benefits
adopting and using the innovation be observed and communicated to others.
According to Rogers (1983), these attributes are what will determine the adoption
rate of an innovation.
Advocates of the DOI regard it as the best model to evaluate the success of an
innovation from the concept till implementation as well as post adoption
sustainability (Wonglimpiyarat & Yuberk, 2005; Aizstrauta, Ginters, & Eroles, 2015;
Dibra, 2015; Moore & Benbasat, 1991). For example, a developer of an innovation can
engage potential adopters through the innovation decision process to evaluate the
innovation based on the attributes. This will allow the developer to have an indication
on the adoption rate of the innovation before even going forward with full scale
production and distribution. On the contrary, Karahanna, Straub and Chervany (1999)
believe that although the DOI alludes to attitudes formed by the adopter during the
persuasion stage, the model is not clear on how these attitudes are developed. The
authors are of the view that this serves as a lack of depth when considering the
psychological aspects of understanding the adoption of an innovation.
2.9 The Unified Theory of Acceptance and Use of Technology (UTAUT)
UTAUT, as the name suggests, is a combination of eight prominent models from IS,
psychology and sociology. The model was developed after a need was identified to
have a unified model that will combine the strengths of well-established theories.
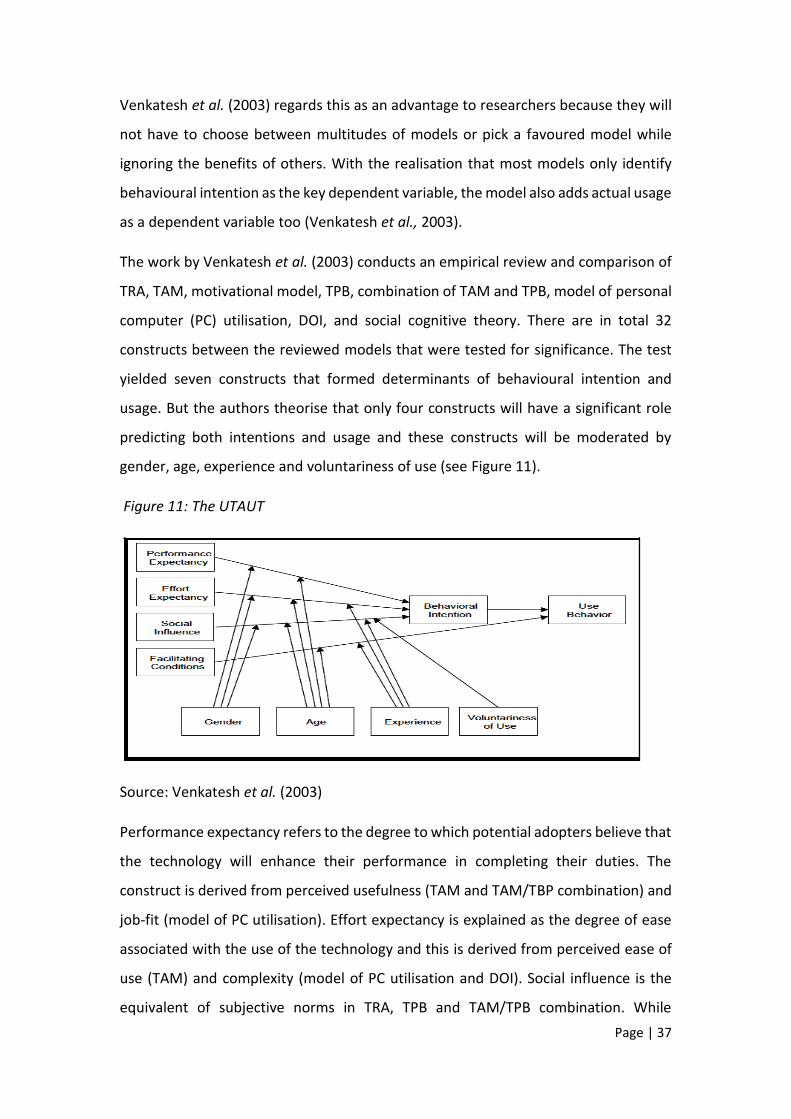
Page | 37
Venkatesh et al. (2003) regards this as an advantage to researchers because they will
not have to choose between multitudes of models or pick a favoured model while
ignoring the benefits of others. With the realisation that most models only identify
behavioural intention as the key dependent variable, the model also adds actual usage
as a dependent variable too (Venkatesh et al., 2003).
The work by Venkatesh et al. (2003) conducts an empirical review and comparison of
TRA, TAM, motivational model, TPB, combination of TAM and TPB, model of personal
computer (PC) utilisation, DOI, and social cognitive theory. There are in total 32
constructs between the reviewed models that were tested for significance. The test
yielded seven constructs that formed determinants of behavioural intention and
usage. But the authors theorise that only four constructs will have a significant role
predicting both intentions and usage and these constructs will be moderated by
gender, age, experience and voluntariness of use (see Figure 11).
Figure 11: The UTAUT
Source: Venkatesh et al. (2003)
Performance expectancy refers to the degree to which potential adopters believe that
the technology will enhance their performance in completing their duties. The
construct is derived from perceived usefulness (TAM and TAM/TBP combination) and
job-fit (model of PC utilisation). Effort expectancy is explained as the degree of ease
associated with the use of the technology and this is derived from perceived ease of
use (TAM) and complexity (model of PC utilisation and DOI). Social influence is the
equivalent of subjective norms in TRA, TPB and TAM/TPB combination. While
Page | 38
facilitating conditions refer to the degree to which potential adopters believe that
they have access to the infrastructure and resources that will support the use of the
technology, this is derived from perceived behavioural control in TPB (Venkatesh et
al., 2003).
2.10 Technology adoption models at household level
Venkatesh and Brown (2001) indicate that the majority of adoption studies
concentrated on the diffusion of IT in the workplace. They found the need to study IT
adoption at a household level so as to understand its particular driving factors. This
led to the development of the model of technology adoption in households (MATH)
which also drew from most technology adoption models in IS and psychology theories
to investigate PC adoption in American households (Venkatesh & Brown, 2001).
MATH is based on 3 main constructs. Firstly, it considers the attitudinal constructs
which consists of the perceived usefulness to enhance household productivity
(utilitarian outcomes), aspects of entertainment or pleasure derived from using the
technology (hedonic outcomes) and the relative advantage over predecessor
technologies. Secondly, the model reflects on normative constructs such as primary
social influence by other users as well as influence from secondary sources like media
and advertisements. Lastly, control constructs are considered as possible constraints
or barriers for technology adoption. Taylor and Todd (1995) refers to both internal
and external constraints, where internal constraints are the perception of an
individual’s own ability to use a technology (self-efficacy) and external constraints are
facilitating conditions (Venkatesh et al., 2003) which includes knowledge around the
technology (i.e. awareness), cost and availability of network infrastructure (Choudrie
& Dwivedi, 2004; Venkatesh & Brown, 2001)
Although the model can predict the intention of households to adopt and use PCs, it
received some criticism from other researchers. Choudrie and Dwivedi (2004) argue
that it does not prove how attitude building can influence behaviour to adopt a
technology and the findings are weak due to more emphasis on barriers and enablers
of adoption.
Page | 39
This paved the way for the development of the model of broadband adoption (MBA)
by Dwivedi, Mustafee, Williams and Lal (2010). While the MBA draws most of the
constructs from TPB and MATH, its main advantage is the simultaneous consideration
of psychological (attitudinal and normative) and socio-economic factors (level of
education and income) that support the ability of consumers to use broadband. Due
to its versatility, variations of the MBA has been used in a number of studies in
different settings (Choudrie & Dwivedi, 2006; Ooi, Sim, Yew, & Lin, 2011; Mugeni et
al., 2012; Tiamnara, Madan, & Malisuwan, 2015) and it has proved to be effective in
both individual and household investigations. The MBA was chosen for deployment in
this study and extended to include relevance constructs as it is further elaborated in
Section 2.13.
There are several other studies that focus on broadband adoption in households. The
majority of these studies are either limited to socio economic inhibitors like the
inability of a household to afford broadband (Weiner, Puniello, Noland, Ciemnecki, &
Turakhia, 2012; Flamma & Chaudhuri, 2007; Ruz, Varas, & Villena, 2013; Dwivedi &
Lal, 2007; Carare, McGovern, Noriega, & Schwarz, 2015) or geographical location as a
limitation to broadband access (i.e. broadband adoption in rural areas) (Hill, Burgan,
& Troshani, 2011; Peronard & Just, 2011).
2.11 A global overview on motivational factors for broadband adoption
Generally, all the constructs from technology adoption models have been identified
as having influence on the behaviour of consumers to adopt broadband. Although the
majority of constructs are common, there are distinct constructs that stand out based
mostly on economic and technological developments in each country. There is an
indication that under attitudinal constructs, consumers in developed countries are
more influenced by the relative advantage i.e. capabilities of broadband over
predecessor technologies and utilitarian outcomes more than its hedonic outcomes.
Oh, Ahn and Kim (2003) found that broadband technology had an influence on
constructs such as perceived usefulness and perceived ease of use which played a
major role in influencing Koreans to adopt broadband at a high rate. In the United
Kingdom, relative advantage was established as the most significant motivator for
Page | 40
influencing household behaviour to adopt broadband, while hedonic outcomes were
the least influential factors, in between the two extremes were primary influence,
utilitarian outcomes, self-efficacy and facilitating conditions (Dwivedi et al., 2010).
This was also confirmed by Choudrie and Dwivedi (2006) as well as Dwivedi,
Khoumbati, Williams, Lal, and Gharavi (2007).
In developing countries, studies found mixed results in terms of dominant constructs.
It should be noted that the settings in these studies may not be precisely comparable
to the one proposed for this study when considering infrastructure development,
cultural and economic dynamics. In Pakistan utilitarian outcomes, or usefulness of
broadband, was found to be the dominating construct statistically, followed by
facilitating conditions resources, with social influence coming out last (Manzoor,
2015). Social influence and self-efficacy were determined as the most dominant
constructs in Thailand, closely followed by facilitating conditions resources and
hedonic outcomes (Tiamnara, Madan, & Malisuwan, 2015).
Ooi, Sim, Yew and Lin (2011) identified primary influence as the most important
motivational factor in adopting broadband amongst Malaysians, followed by self-
efficacy, relative advantage and hedonic outcomes while facilitating conditions
resources had the least influence. A study in Kenya show that relative advantage was
the most dominant construct followed by utilitarian outcomes and broadband
awareness (Mugeni et al., 2012). The study conducted by Seymour (2012) illustrates
that in South Africa, perceived ease of use was ranked first as most significant factor
for adoption of broadband, followed by perceived IT skills or self-efficacy, while the
cost of broadband, hedonic outcomes and relevant PC access were ranked on third,
fourth and fifth place respectively. This finding is consistent with that of Naidoo
(2011).
There are many potential explanations as to why consumers in different countries are
influenced by different factors to adopt broadband, mostly socio-economic (i.e.
education and income levels) and infrastructure development (Tiamnara, Madan, &
Malisuwan, 2015). Consumers in developed countries where access to infrastructure
is not a major concern, tend to be interested in the new features that come with
Page | 41
broadband technology, like entertainment, social networks and productivity
enhancement. In developing countries where fixed broadband is not pervasive and
access is expensive, consumers consider the relative advantage of mobile broadband
(i.e. wider coverage and cheaper rates) as a key determinant for adoption (Mugeni et
al., 2012).
2.12 Broadband adoption studies in South Africa
There are several studies that investigated factors that influence broadband adoption
and usage in South Africa by households (Seymour, 2012; Naidoo, 2011; Seymour &
Naidoo, 2013; Brown et al., 2009) and businesses (Gareeb & Naicker, 2015). These
studies share similar characteristic, their main focus is to depict the most influential
factors in a particular setting by ranking them according to the order of significance.
Although the studies are useful for presenting factors that should be considered for
the adoption and usage of broadband, they stop short in explaining how these factors
collectively influence users, in particular in low-income households, to adopt and use
the technology. This explanation could further enhance the understanding on the
interaction of users and broadband.
Furthermore, this literature did not consider income disparities when selecting a
population and sampling, which can play a significant role in determining the
significance of factors (i.e. high-income communities may not necessarily be affected
by the same factors as low-income communities). The consideration of income
disparities can assist to uncover how each factor affects different income groups, for
example, the attitude of a particular income group on broadband and how it affects
their decision to adopt.
Other recent broadband adoption studies in South Africa are either focused on the
adoption rate of a specific access technology (Ramosolo, 2014), specific service (Wu,
2005) or specific products (Nainkin, 2014). While others focused on the supply and
development of broadband infrastructure (Macharia, 2013; Jiya, 2013). Though the
findings from these studies are limited to factors that influence adoption of specific
facets of the broadband eco-system, they provide valuable insight and considerations
for studies that are taking a holistic view such as the current one.
Page | 42
2.13 Choosing the theoretical and conceptual model
The review of literature provided that the attitude of potential users toward a
technology is an important determinant for its adoption and ultimately its use. Hence,
attitudinal constructs formed part of the motivational factors that were considered
for this study. Perceived ease of use, relative advantage, utilitarian outcome and
hedonic outcomes were chosen to examine the overall attitude of low-income
households toward broadband and how it affected their behaviour to adopt and use
it.
The second important factor that was considered is normative constructs. As
literature has shown in models such as the TRA, TPB and DOI, people are most likely
to be influenced directly by others or information around them to perform a particular
behaviour and they are also more likely to consult for affirmation from others before
making a decision. Primary and secondary influence were included to investigate how
normative constructs influence the behaviour of low-income households to adopt and
use broadband.
Thirdly, the TPB, UTAUT and MATH stresses the point that control contracts are also
a key determinant of adoption of a technology. The models provide that even if
potential users can have a favourable attitude toward a technology, and also duly
influenced by others who already use the technology, their decision to adopt may still
be affected by internal factors (perception on their abilities to use the technology) and
external factors (not obtaining enough information and the accessibility of such
technology to them). Hence the inclusion of knowledge, self-efficacy and facilitating
conditions resources as control constructs to examine how they affect the behaviour
low-income households to adopt and use broadband.
Since the MBA incorporates the characteristics of almost all the well-developed
models that were discussed in literature, it became the best suitable model for this
study.
Recalling from section 2.2 and 2.3, literature demonstrated that broadband does play
a role in social development and it can provide tangible benefits to its users. Literature
also illustrate that the availability of local content (or the lack thereof) affects the
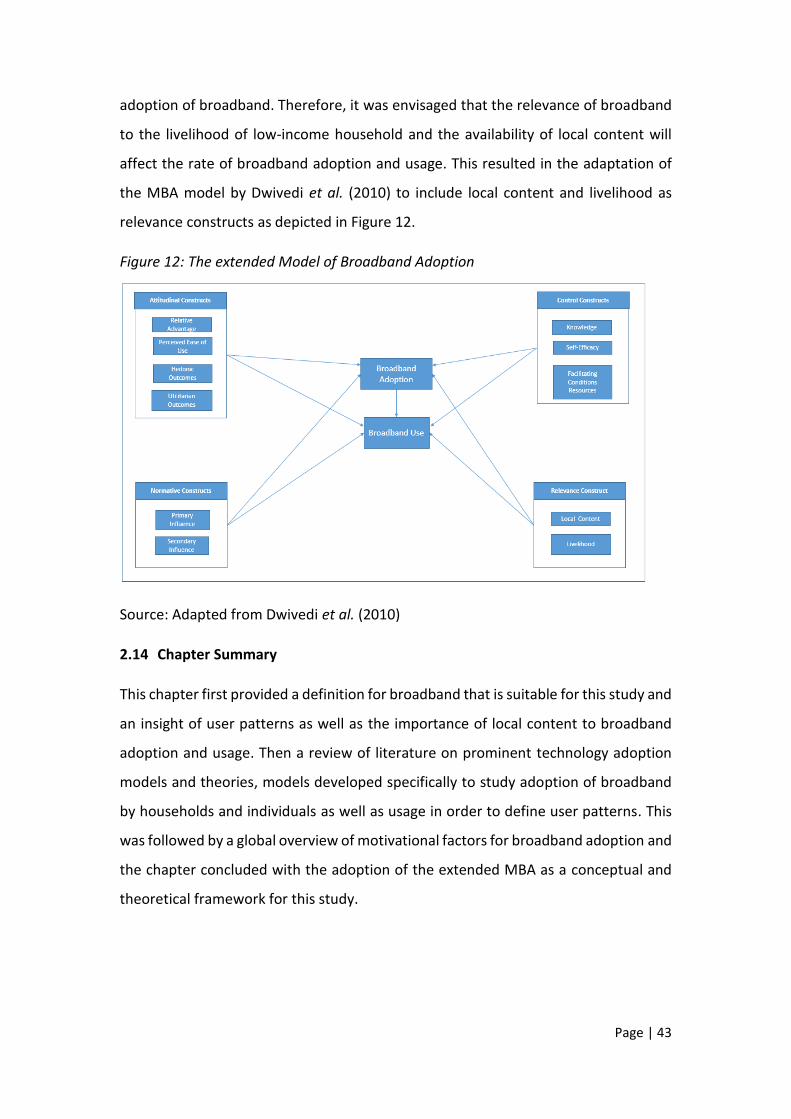
Page | 43
adoption of broadband. Therefore, it was envisaged that the relevance of broadband
to the livelihood of low-income household and the availability of local content will
affect the rate of broadband adoption and usage. This resulted in the adaptation of
the MBA model by Dwivedi et al. (2010) to include local content and livelihood as
relevance constructs as depicted in Figure 12.
Figure 12: The extended Model of Broadband Adoption
Source: Adapted from Dwivedi et al. (2010)
2.14 Chapter Summary
This chapter first provided a definition for broadband that is suitable for this study and
an insight of user patterns as well as the importance of local content to broadband
adoption and usage. Then a review of literature on prominent technology adoption
models and theories, models developed specifically to study adoption of broadband
by households and individuals as well as usage in order to define user patterns. This
was followed by a global overview of motivational factors for broadband adoption and
the chapter concluded with the adoption of the extended MBA as a conceptual and
theoretical framework for this study.
Page | 44
Chapter 3: A methodological approach for investigating the influence of
motivational factors on broadband adoption and usage by low-income households
3.1 Introduction
This chapter presents the detailed approach taken by the researcher to address the
research problem as previously identified in Chapter 1. The problem and purpose
statements are reiterated and the main research question as well as sub questions
that supports it are derived. The researcher then outlines the details and rationale on
the chosen research approach, research design, research procedures and methods, as
well as data analysis. The chapter concludes with the view on the ethical
considerations that were made for this study and its strengths.
3.2 Research Problem Statement
Apart from the commonly known determinants (i.e. cost and access to network
infrastructure), there are motivational factors that can be identified from literature
that influence the decision of consumers to adopt and use broadband. To this end,
research is still focused on ranking factors in order of significance in an attempt to
explain which factors have the most influence on the user’s decision to adopt and use
broadband. Little consideration is being assigned to the examination of the collective
effect of these motivational factors and how they influence the behaviour of users to
adopt and use broadband. There is also less emphasis on the role played by
demographics such as income level to the determination of the motivational factors.
Although there are studies that have presented motivational factors for broadband
adoption in South Africa, there is little knowledge about how these motivational
factors collectively influence the adoption and usage of broadband by low-income
households, as this has not yet been studied in detail.
3.3 Research Purpose Statement
The purpose of this research was to investigate how motivational factors influence the
behaviour of low-income households in South Africa to adopt and use broadband. The
research was conducted in the township of Soshanguve in the City of Tshwane, South
Africa. The study first uncovered how broadband was utilised by low-income
Page | 45
households. Then it examined how low-income households are influenced by
attitudinal constructs, normative constructs, control constructs as well as relevance
constructs to adopt and use broadband. This sought to provide a deeper
understanding on the interaction of low-income households and broadband in order
to give inputs to policy, regulation and market strategies for broadband demand
stimulation.
3.4 Research Questions
The following research question was posed to address the aforementioned problem
statement:
Main Research question
How do motivational factors influence the adoption and usage of broadband in low-
income households?
To support the main research question, the following sub-questions were
investigated:
Sub question 1
What are the characteristics of broadband use among low-income households?
Sub question 2
How do attitudinal, normative and control constructs influence the behaviour of low-
income households to adopt and use broadband?
Sub question 3
How do relevance constructs support the influence on behaviour of low-income
households to adopt and use broadband?
3.5 Research Approach
A research approach (also known as research strategy or research paradigm) can
simply be described as an underlying floor plan of which a research paper will be built.
Creswell (2014) describes research approaches as “plans and procedures for research
that span the steps from broad assumptions to detailed methods of data collection,
Page | 46
analysis, and interpretation. The research approach outlines the philosophical
assumptions that a researcher adopts to address the research problem statement”
(Creswell, 2014, p. 31).
Historically, there have been two philosophical approaches to research (Welman,
Kruger, & Mitchell, 2005). The positivist or quantitative approach which is based on
logical positivism, underpins all natural sciences and the notion that research results
will be accepted only if they can be observed and measured objectively with no
influence from the opinion and feelings of an individual (Welman, et al., 2005). Starke
(2010) adds that the quantitative approach “relies heavily on linear attributes,
measurements, and statistical analysis” (Starke, 2010, p. 11). While Creswell (2014)
defines quantitative approach as the examination of how variables relate in order to
confirm objective theories.
The anti-positivist or qualitative approach is popular with human behavioural
sciences. Anti-positivists believe that the study of human behaviour is a complex field
that cannot only be explained with rigid natural-scientific methods. Hence it is
inadequate for a researcher to detach human feelings and opinions when trying to
explain a phenomenon that involves human behavioural aspects (Welman, et al.,
2005). According to Creswell (2014), “qualitative research is an approach for exploring
and understanding them” (Creswell, 2014, p. 32), meaning individuals or groups
ascribed to a social or human problem.
Throughout the years, there has been as strong development of what is referred to as
“mixed methods” approach. The mixed method approach is now being recognised as
the third research paradigm by researchers (Bryman 2012). The process involves
collection and analysis of both quantitative and qualitative data and collective
interpretation to form a more complete understanding or a problem than with either
approach alone (Creswell, 2014). Mixed methods are commonly used in research to
address, among others, the concerns about generalisability, e.g. a survey with a larger
and more representative sample can be used to compensate for the weaknesses of
unstructured interviews with small samples (Leedy & Ormond, 2013).
Page | 47
This study sought to gain a deeper understanding on the motivational factors that
influence the decisions made by low-income households to adopt and use broadband,
why these particular factors and how they use broadband in their livelihood. In
considering these objectives, the qualitative approach stood out as the most
appropriate approach to adopt. As it was referred in Chapter 2, the adoption of
broadband is a social matter as far as it is a technological one. Hence it required a
social orientated approach to address problems that relate to this topic. To further
align with the objectives of this study, a qualitative approach provides rich description
of personal action and complex environment, it provides different viewpoints to social
issues and uncover the not-so-obvious explanations to human behaviour, it works on
understanding individual perceptions, it is not concerned with rearranging things in
order but rather to explain the phenomenon as it exists, and it aims to provide
knowledge towards the development of policy and practice (Starke, 2010).
3.6 Research Design
A research design outlines the detailed procedure that a researcher will follow to
address the research problem statement (Welman, et al., 2005). The research design
guides the execution of the research and determines the methods used during data
collection and analysis. According to Creswell (2014), a design is a type of study or
inquiry selected by the researcher within a chosen approach (i.e. quantitative,
qualitative, or mixed methods). There are many designs available within the
qualitative approach, in particular narrative research, phenomenological research,
grounded theory, ethnography, content analysis, and case studies are popular in social
science studies (Starke, 2010; Creswell, 2014).
This study adopted a phenomenological design to answer the research questions and
to address the problem statement. Phenomenological research originates from
philosophy and psychology, and it is centered on describing the lived experience of
social groups through individual participants who have experienced the phenomenon
studied (Creswell, 2014). Vagle (2016) describes a prominent design by Giorgi (2009)
(a modified Husserlian approach) where one is asked to use human consciousness in
order to study human consciousness and is asked to bracket his or her past
Page | 48
understandings and knowledge in order to be able to analyse the raw data from a
fresh perspective. Phenomenological studies are typically conducted through
interviews (Creswell, 2014).
The phenomenological design was best suited for this study because it helps the
researcher to understand the social and psychological phenomena from the
perspective of the people involved (Welman, et al., 2005). This was in line with the
purpose and outcomes of this study which are not only to identify the influential
factors for adoption and usage but to provide a deeper understanding on the lived
experience of broadband in low-income households in South Africa. The research time
frame was cross-sectional, meaning the data was collected at one point in time only
and there was no follow up data collection session with the selected sample.
3.7 Research Procedures and Methods
The research procedures and methods provide (in detail) the instruments that were
used to collect data, where the data was collected, ethical considerations during data
collection, how the data was collected and stored, how the data was processed and
analysed, as well as the description of the participants who participated in the data
collection process.
3.7.1 Data collection method and instrument.
There are well-developed data collection methods documented in handbooks,
textbooks, and journals, but the choice of a method should be guided primarily by the
research questions and the review of literature on how other researchers have
approached similar studies (Starke, 2010). Creswell (2014) adds that the choice of a
method will depend on whether the intention is to specify the type of information to
be collected in advance or to allow it to emerge from the participants. How the data
is analysed will then depend on the type of data collected (e.g. statistical analysis for
numerical data or thematic analysis for words, pictures, videos, and other content).
Creswell (2014) summarises the types or methods of qualitative data collection as
“when the researcher takes field notes on the behavior and activities of individuals at
the research site” (Creswell, 2014, p. 239) either as a participant or an observer.
Page | 49
Qualitative interviews involve discussions with individual participants (either
telephonically or face-to-face) or with a group of participants. Qualitative content
deals with the collection of documents, audio and visual materials (e.g. sound
recordings, photographs, art objects, and videos) for analysis.
In research, interviews can be structured, semi-structured, or unstructured. The
distinction between them is set on how and what type of questions are prepared in
the questionnaire. This is typically referred to as the interview schedule (Welman, et
al., 2005).
In structured interviews, the questions are pre-selected and the interviewer is
restricted to the wording and the order of how they appear in the schedule and the
respondent may also be restricted to pre-coded answers (Welman, et al., 2005).
Although semi-structured interviews also consist of a schedule with pre-selected
questions, these questions are open ended and can be tailored to what is special
about the participants. This provides the interviewer with flexibility to rephrase
questions or to ask probing questions if he or she wishes to uncover more from
participant (Starke, 2010).
With unstructured interviews, there are no prepared questions and no formal
structure to follow. The interview process is guided, and the questions are shaped by
the feedback from the participants while the interviewer keeps close focus on what
he or she wants to discover. Unstructured interviews are often referred to as in-depth
interviews because of their intimate and explorative nature (Welman, et al., 2005).
Focus groups using semi-structured questions were used as data collection tools for
this study. Bryman (2012) points out that a focus group researcher (usually referred
to as a moderator or facilitator) is more concerned with how participants respond to
each other’s views on the issue under discussion. So, an unstructured setting should
be maintained and the researcher should guide the session and be less intrusive. The
primary role of the researcher is to initiate discussions by posing open-ended
questions and keep the discussion under control. The researcher should be able to
detect when the discussion is drifting towards an unproductive direction and guide it
back on course (Leedy & Ormond, 2013). The researcher should also suspend any
Page | 50
presumptions on participants’ responses. This normally occurs because in some
instances the interviewer is familiar with the phenomenon and it is not easy to detach
him or herself from it (Leedy & Ormond, 2013).
Focus groups offer the advantage of obtaining data rapidly and in a cost effective
manner as compared to one-on-one interviews, because a number of participants
who are knowledgeable about a topic can be gathered in one place and interviewed
at the same time (Welman, et al., 2005; Bryman, 2012). Since focus groups are meant
to open up a discussion between participants, the interviewer often gets the
opportunity to spot contradictory responses and can always probe participants for
clarity.
According to Bryman (2012), participants can disclose issues that they deem
important to the topic and it offers the researcher an opportunity to evaluate the
participants’ collective responses to a phenomenon. These characteristics were a best
fit to answer the research questions for this study because observation of both
individual and group behaviour was necessary.
Although focus groups can be a convenient way of collecting data, Welman, et al.
(2005) warn that they can be particularly difficult to control. The authors refer to
limiting selection and participation of the ‘expert’ in a topic under discussion because
they may exhibit intimidating behaviour and inhibit other participants from freely
expressing their views.
3.7.2 Population selection and sampling
In research, the term population refers to a full set of units of analysis (i.e. people,
organisations, documents) identified by a researcher from which data will be collected
to address a particular research problem (Welman, et al., 2005). In most cases it is
impractical to engage each member or unit of analysis in a population due to time,
cost and ethical constraints (Marshall, 1996). Hence a number of units of analysis, or
a sample, is selected to represent the wider population, this process is known as
sampling (Bryman, 2012). It is thus important to choose a sample that is a
representative of the wider population so that the results can be generalised to the
entire population (Marshall, 1996).
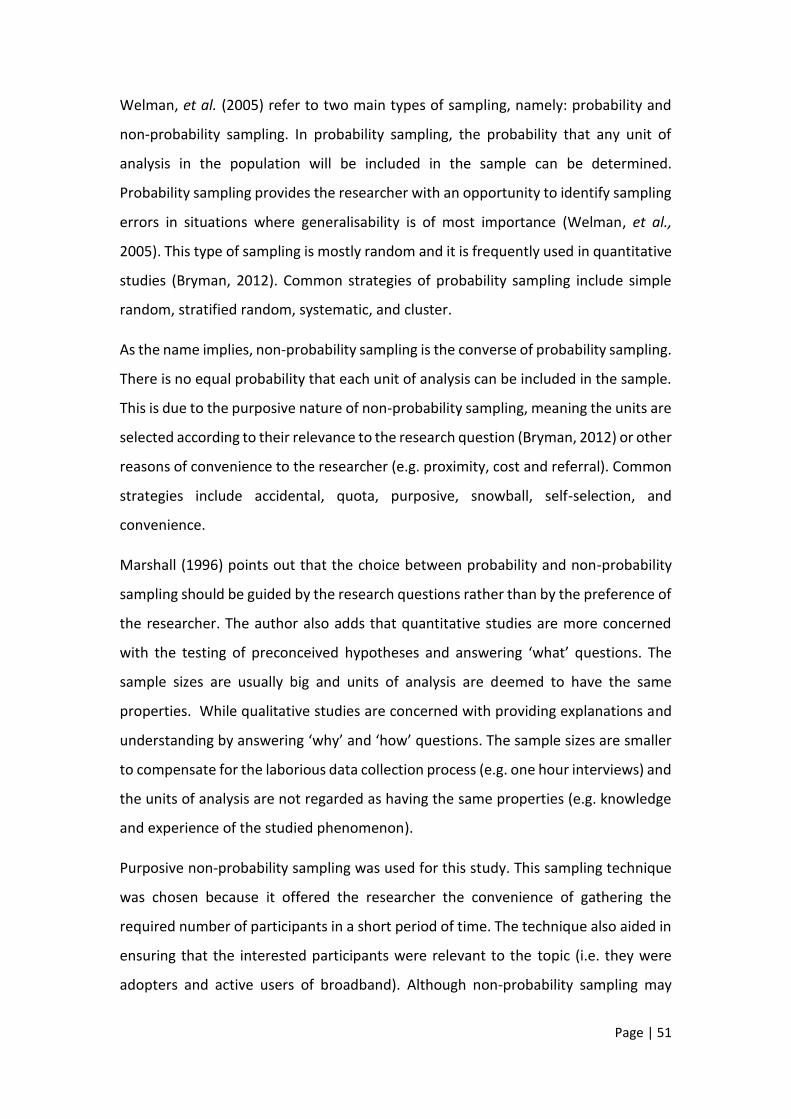
Page | 51
Welman, et al. (2005) refer to two main types of sampling, namely: probability and
non-probability sampling. In probability sampling, the probability that any unit of
analysis in the population will be included in the sample can be determined.
Probability sampling provides the researcher with an opportunity to identify sampling
errors in situations where generalisability is of most importance (Welman, et al.,
2005). This type of sampling is mostly random and it is frequently used in quantitative
studies (Bryman, 2012). Common strategies of probability sampling include simple
random, stratified random, systematic, and cluster.
As the name implies, non-probability sampling is the converse of probability sampling.
There is no equal probability that each unit of analysis can be included in the sample.
This is due to the purposive nature of non-probability sampling, meaning the units are
selected according to their relevance to the research question (Bryman, 2012) or other
reasons of convenience to the researcher (e.g. proximity, cost and referral). Common
strategies include accidental, quota, purposive, snowball, self-selection, and
convenience.
Marshall (1996) points out that the choice between probability and non-probability
sampling should be guided by the research questions rather than by the preference of
the researcher. The author also adds that quantitative studies are more concerned
with the testing of preconceived hypotheses and answering ‘what’ questions. The
sample sizes are usually big and units of analysis are deemed to have the same
properties. While qualitative studies are concerned with providing explanations and
understanding by answering ‘why’ and ‘how’ questions. The sample sizes are smaller
to compensate for the laborious data collection process (e.g. one hour interviews) and
the units of analysis are not regarded as having the same properties (e.g. knowledge
and experience of the studied phenomenon).
Purposive non-probability sampling was used for this study. This sampling technique
was chosen because it offered the researcher the convenience of gathering the
required number of participants in a short period of time. The technique also aided in
ensuring that the interested participants were relevant to the topic (i.e. they were
adopters and active users of broadband). Although non-probability sampling may
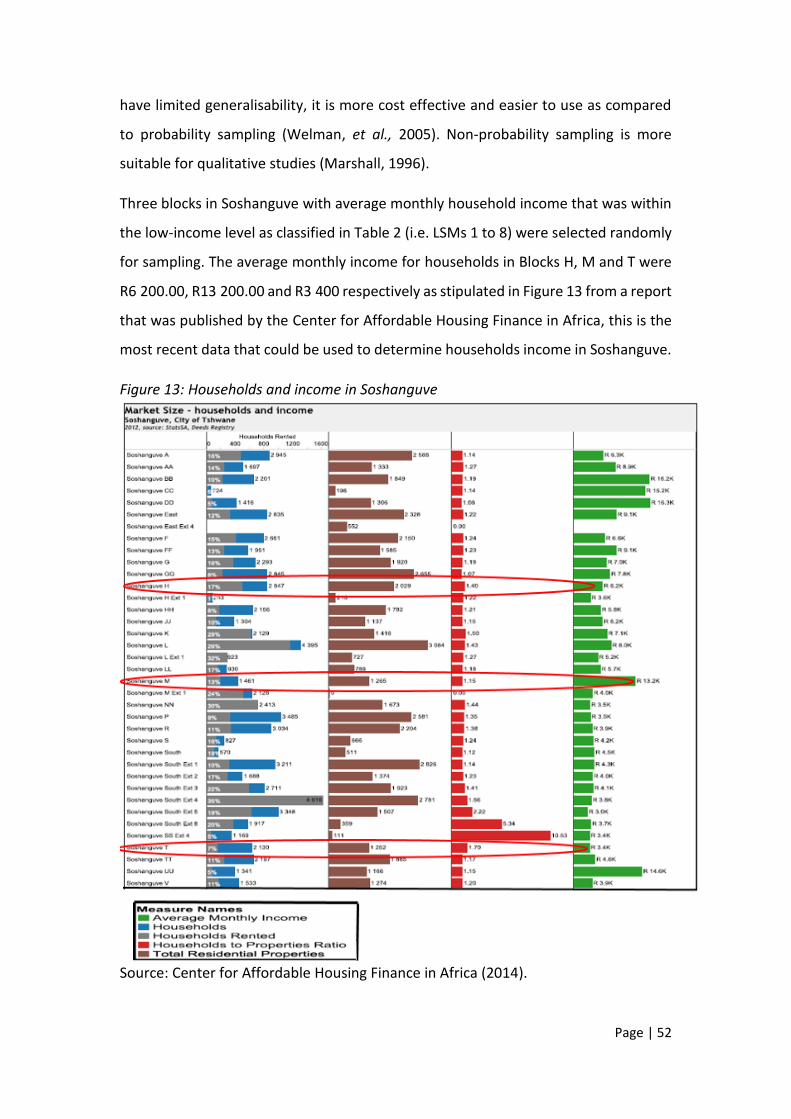
Page | 52
have limited generalisability, it is more cost effective and easier to use as compared
to probability sampling (Welman, et al., 2005). Non-probability sampling is more
suitable for qualitative studies (Marshall, 1996).
Three blocks in Soshanguve with average monthly household income that was within
the low-income level as classified in Table 2 (i.e. LSMs 1 to 8) were selected randomly
for sampling. The average monthly income for households in Blocks H, M and T were
R6 200.00, R13 200.00 and R3 400 respectively as stipulated in Figure 13 from a report
that was published by the Center for Affordable Housing Finance in Africa, this is the
most recent data that could be used to determine households income in Soshanguve.
Figure 13: Households and income in Soshanguve
Source: Center for Affordable Housing Finance in Africa (2014).

Page | 53
3.7.3 Data collection process
Three focus groups sessions were organised in different blocks of Soshanguve. The
number of groups were limited to three because by the third session, it became
apparent that the information gathered from the three sessions was consistent. It was
then predicted that the outcomes of the next sessions will be closely aligned to that
of the previous sessions. Calder (1977) in Bryman (2012) asserts that the researcher
can determine if the number of focus group sessions is adequate when it can be
predict that the next group might say what is similar to the previous groups.
The first session was held on 09th July 2016 at Block M at a participant’s house, the
second session was held on 27th August 2016 at Block H in a pub close, while the third
session was on 14th January 2017 at Block T at a participant’s house.
All sessions were recorded using a voice recorder, the sessions started with an
introduction of the researcher and the topic and the general rules of the focus group
session were outlined. Then participants were asked to complete a 10 minutes
questionnaire consisting of 17 questions to capture demographics data (i.e. gender,
education, employment and income) and broadband user profile (i.e. adoption profile,
broadband internet access and usage and barrier for adoption and usage). The
sessions then proceeded to the open discussion where a set of semi-structured
questions were posed to the participants. The questionnaire and the focus group
schedule are attached in Annexure A.
The focus group questions were piloted with a group of post-graduate students from
the University of Witwatersrand’s post-graduate social media group. The group was
asked to review the initial set of questions so as to establish if they will be relevant to
the research questions, the language will be comprehensible to the target population,
if the questions will encourage group discussion and if they will be relevant to the
target population. The group provided inputs that were used to revise the questions
to better align them with the aforementioned requirements.
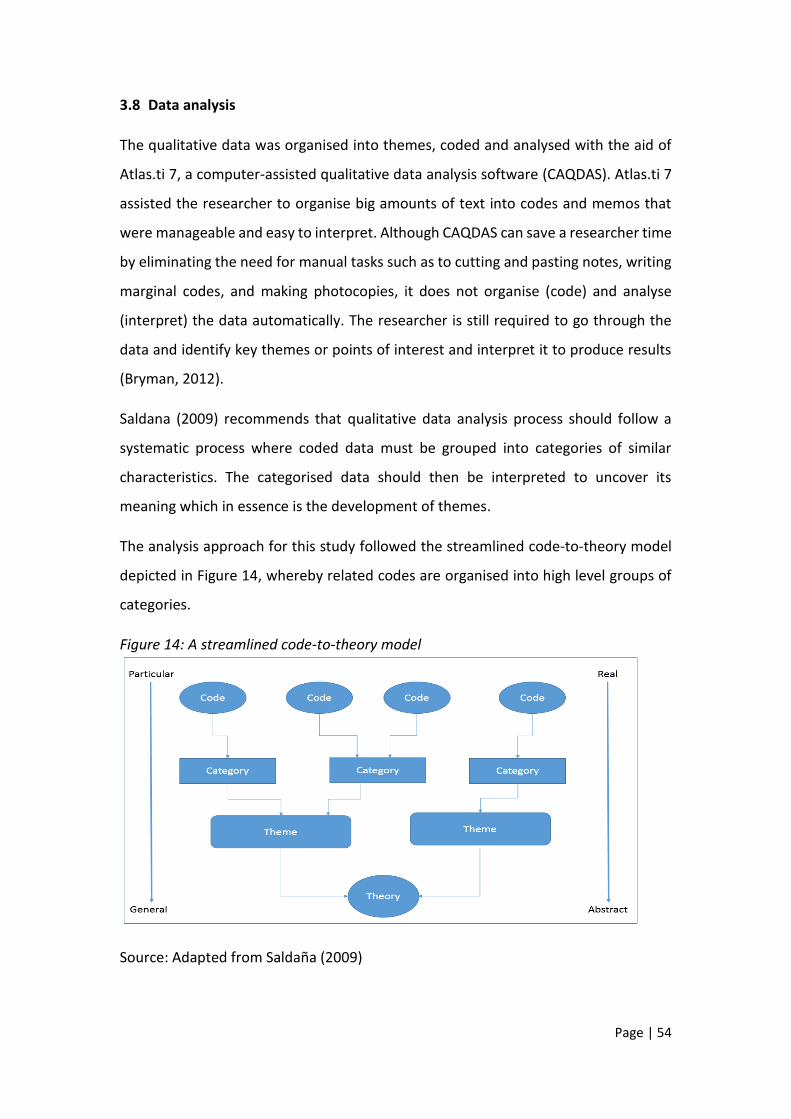
Page | 54
3.8 Data analysis
The qualitative data was organised into themes, coded and analysed with the aid of
Atlas.ti 7, a computer-assisted qualitative data analysis software (CAQDAS). Atlas.ti 7
assisted the researcher to organise big amounts of text into codes and memos that
were manageable and easy to interpret. Although CAQDAS can save a researcher time
by eliminating the need for manual tasks such as to cutting and pasting notes, writing
marginal codes, and making photocopies, it does not organise (code) and analyse
(interpret) the data automatically. The researcher is still required to go through the
data and identify key themes or points of interest and interpret it to produce results
(Bryman, 2012).
Saldana (2009) recommends that qualitative data analysis process should follow a
systematic process where coded data must be grouped into categories of similar
characteristics. The categorised data should then be interpreted to uncover its
meaning which in essence is the development of themes.
The analysis approach for this study followed the streamlined code-to-theory model
depicted in Figure 14, whereby related codes are organised into high level groups of
categories.
Figure 14: A streamlined code-to-theory model
Source: Adapted from Saldana (2009)
Page | 55
Themes are developed from the categories to provide meaning to the data. A theory
or key assertion can then be derived from themes. Saldana (2009) describes this
approach as an attempt to progress from the particular to the general or from the real
to the abstract by transferring what was observed in one setting and generalising it to
other comparable settings.
3.9 Ethical considerations
Ethical considerations are important in social research because subjects are, in most
cases, human beings. Bryman (2012) mentions that ethics in social research revolve
around two issues, “how should we treat the people on whom we conduct research?”
and “are there activities in which we should or should not engage in our relations with
them?” (Bryman, 2012, p. 130).
For this study, the main considerations were to ensure that the participants
understood their rights in terms of participating in a focus group. The participant
information sheet attached in Annexure B was compiled and circulated to prospective
participants before the focus groups were conducted. The sheet included a brief
introduction and background of the topic and its objectives, a section detailing the
possible duration of the focus group session and explained that participation was
voluntary, and the confidentiality and anonymity section pledged that the true
identities of the participants will not be used in any parts on the report. Participants
were also requested to sign the informed consent form attached in Annexure C to
confirm that they understand the contents of the participant information sheet and
gave permission for the session to be voice recorded.
A formal process to obtain an ethics clearance certificate was undertaken through the
University of Witwatersrand’s ethics committee. The ethics committee recommended
that both the participant information sheet and the informed consent form be
translated to a common language in Soshanguve and be written in a simplistic manner
to accommodate participants who are not proficient in English. The recommendations
of the committee were implemented and a clearance certificate attached in Annexure
D was issued before data collection started.
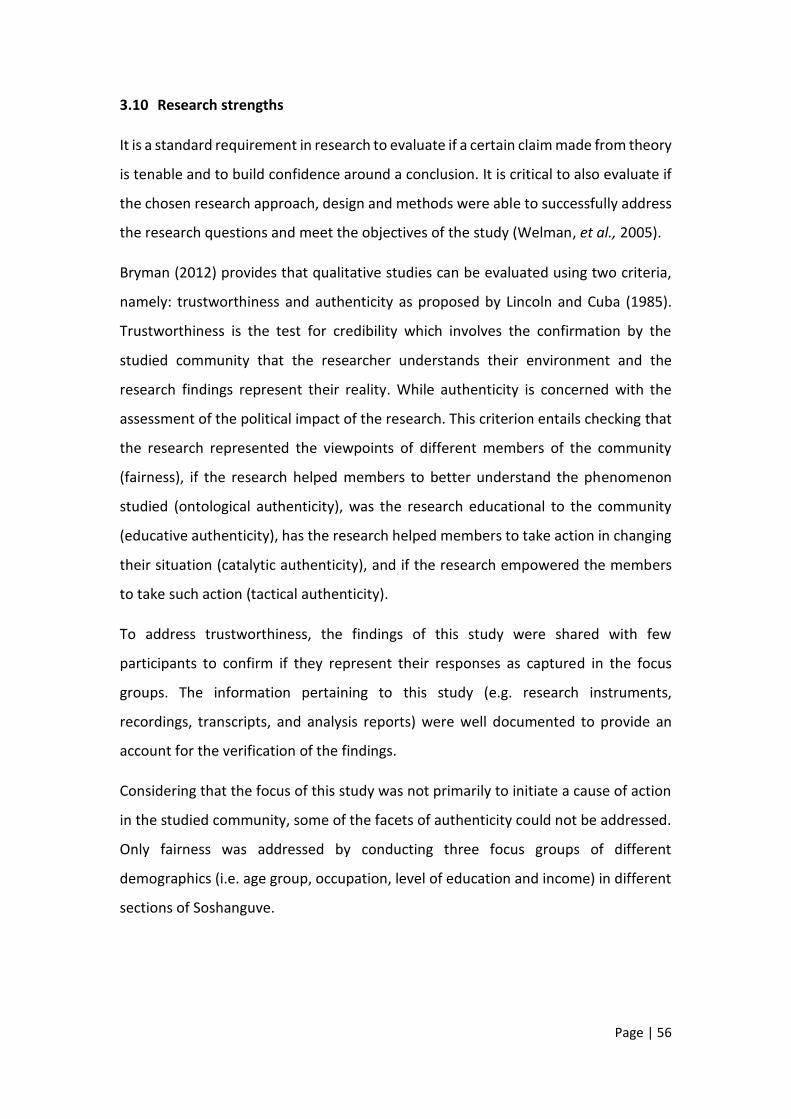
Page | 56
3.10 Research strengths
It is a standard requirement in research to evaluate if a certain claim made from theory
is tenable and to build confidence around a conclusion. It is critical to also evaluate if
the chosen research approach, design and methods were able to successfully address
the research questions and meet the objectives of the study (Welman, et al., 2005).
Bryman (2012) provides that qualitative studies can be evaluated using two criteria,
namely: trustworthiness and authenticity as proposed by Lincoln and Cuba (1985).
Trustworthiness is the test for credibility which involves the confirmation by the
studied community that the researcher understands their environment and the
research findings represent their reality. While authenticity is concerned with the
assessment of the political impact of the research. This criterion entails checking that
the research represented the viewpoints of different members of the community
(fairness), if the research helped members to better understand the phenomenon
studied (ontological authenticity), was the research educational to the community
(educative authenticity), has the research helped members to take action in changing
their situation (catalytic authenticity), and if the research empowered the members
to take such action (tactical authenticity).
To address trustworthiness, the findings of this study were shared with few
participants to confirm if they represent their responses as captured in the focus
groups. The information pertaining to this study (e.g. research instruments,
recordings, transcripts, and analysis reports) were well documented to provide an
account for the verification of the findings.
Considering that the focus of this study was not primarily to initiate a cause of action
in the studied community, some of the facets of authenticity could not be addressed.
Only fairness was addressed by conducting three focus groups of different
demographics (i.e. age group, occupation, level of education and income) in different
sections of Soshanguve.

Page | 57
3.11 Chapter Summary
In this chapter, the researcher provided a buildup on the research problem statement
and purpose statements, and the research questions were drawn from the conceptual
framework as developed in Chapter 2 to address the research problem. The chapter
also introduced the research approach taken, the research design and methods used
to collect and analyse data. The chapter concluded with the evaluation of ethical
considerations and the strengths of the study.
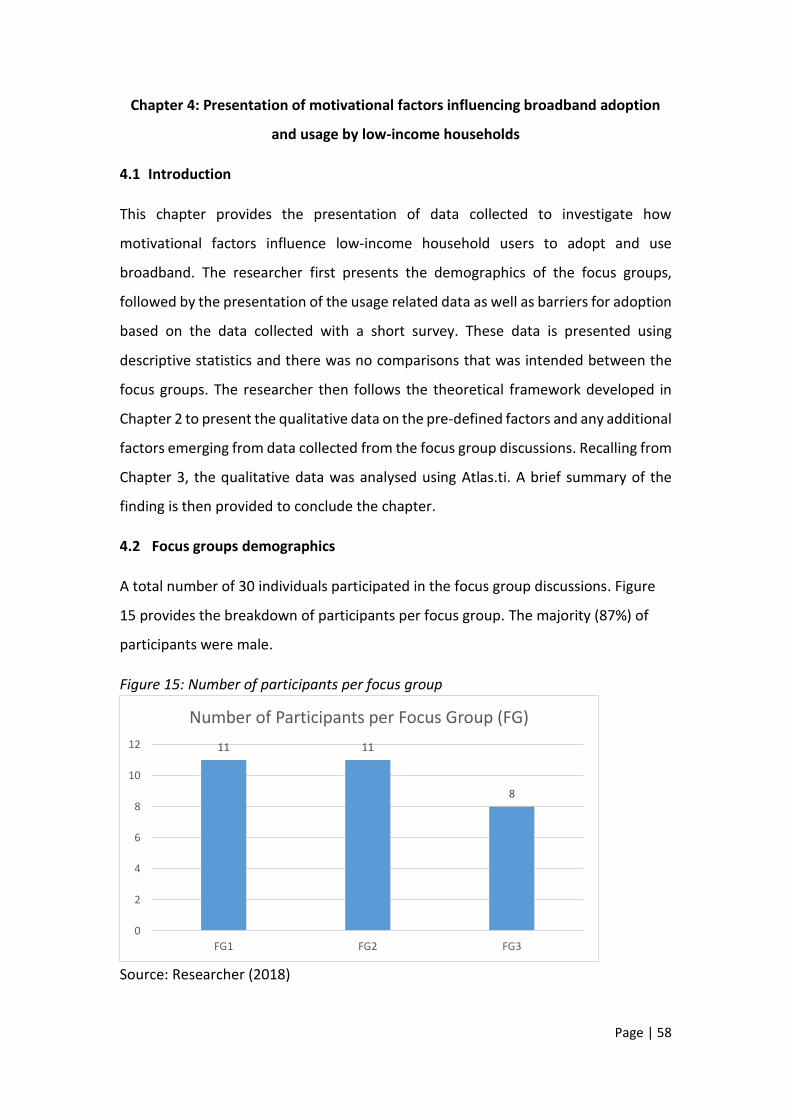
Page | 58
Chapter 4: Presentation of motivational factors influencing broadband adoption
and usage by low-income households
4.1 Introduction
This chapter provides the presentation of data collected to investigate how
motivational factors influence low-income household users to adopt and use
broadband. The researcher first presents the demographics of the focus groups,
followed by the presentation of the usage related data as well as barriers for adoption
based on the data collected with a short survey. These data is presented using
descriptive statistics and there was no comparisons that was intended between the
focus groups. The researcher then follows the theoretical framework developed in
Chapter 2 to present the qualitative data on the pre-defined factors and any additional
factors emerging from data collected from the focus group discussions. Recalling from
Chapter 3, the qualitative data was analysed using Atlas.ti. A brief summary of the
finding is then provided to conclude the chapter.
4.2 Focus groups demographics
A total number of 30 individuals participated in the focus group discussions. Figure
15 provides the breakdown of participants per focus group. The majority (87%) of
participants were male.
Figure 15: Number of participants per focus group
Source: Researcher (2018)
11 11
8
0
2
4
6
8
10
12
FG1 FG2 FG3
Number of Participants per Focus Group (FG)
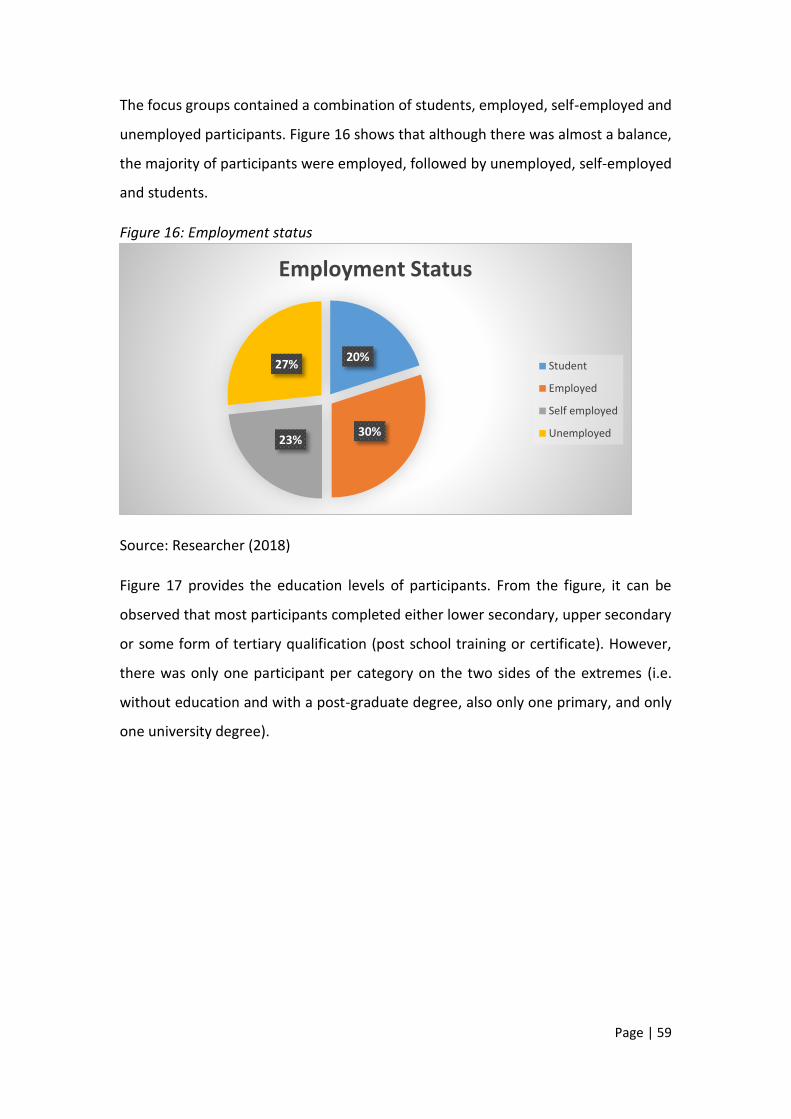
Page | 59
The focus groups contained a combination of students, employed, self-employed and
unemployed participants. Figure 16 shows that although there was almost a balance,
the majority of participants were employed, followed by unemployed, self-employed
and students.
Figure 16: Employment status
Source: Researcher (2018)
Figure 17 provides the education levels of participants. From the figure, it can be
observed that most participants completed either lower secondary, upper secondary
or some form of tertiary qualification (post school training or certificate). However,
there was only one participant per category on the two sides of the extremes (i.e.
without education and with a post-graduate degree, also only one primary, and only
one university degree).
20%
30%23%
27%
Employment Status
Student
Employed
Self employed
Unemployed
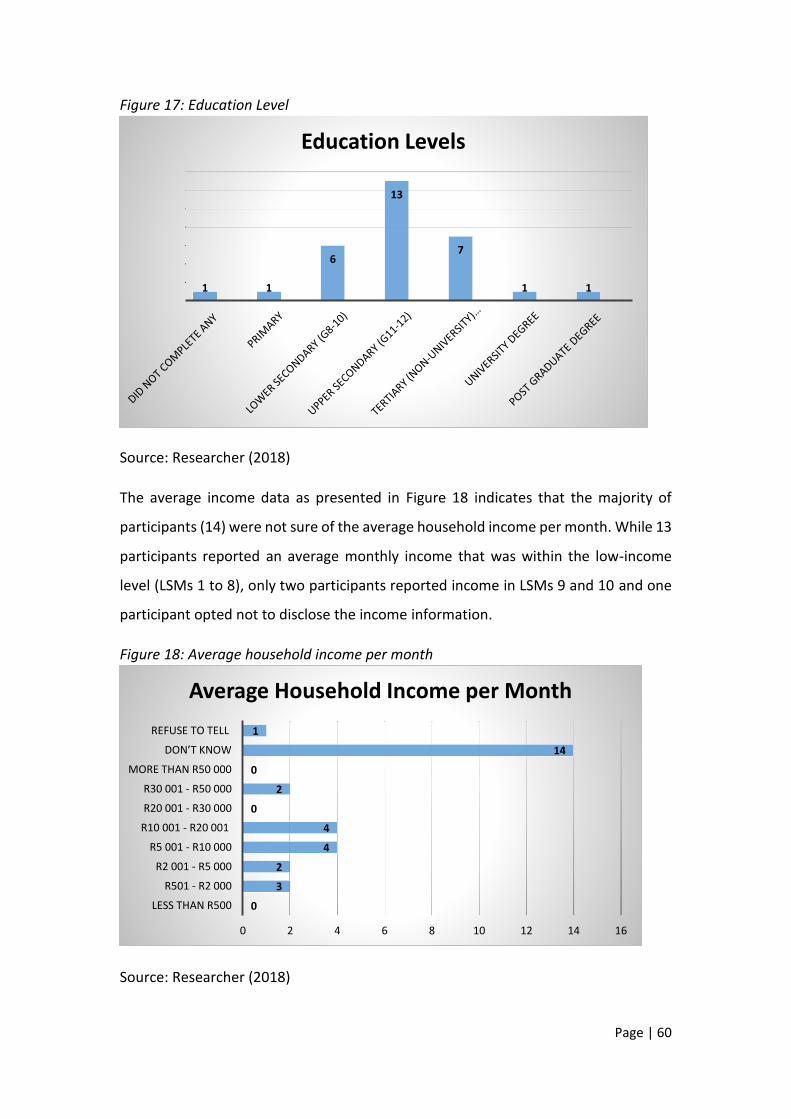
Page | 60
Figure 17: Education Level
Source: Researcher (2018)
The average income data as presented in Figure 18 indicates that the majority of
participants (14) were not sure of the average household income per month. While 13
participants reported an average monthly income that was within the low-income
level (LSMs 1 to 8), only two participants reported income in LSMs 9 and 10 and one
participant opted not to disclose the income information.
Figure 18: Average household income per month
Source: Researcher (2018)
1 1
6
13
7
1 1
Education Levels
0
3
2
4
4
0
2
0
14
1
0 2 4 6 8 10 12 14 16
LESS THAN R500
R501 - R2 000
R2 001 - R5 000
R5 001 - R10 000
R10 001 - R20 001
R20 001 - R30 000
R30 001 - R50 000
MORE THAN R50 000
DON’T KNOW
REFUSE TO TELL
Average Household Income per Month
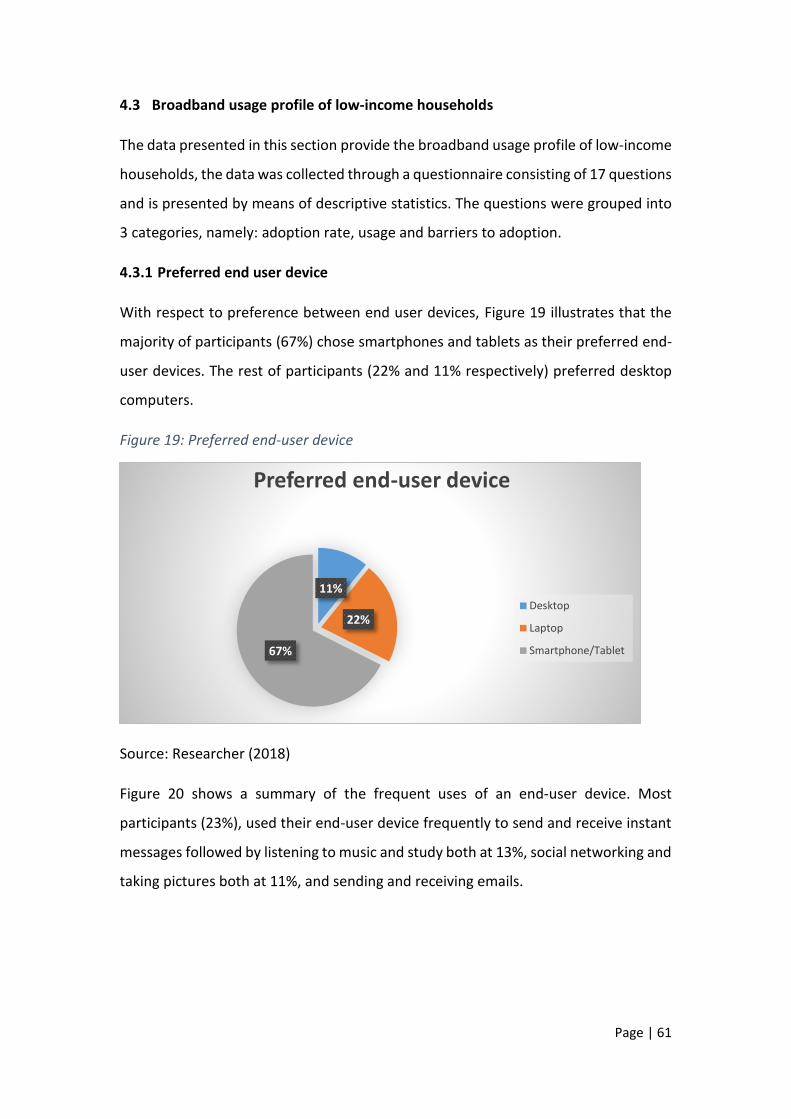
Page | 61
4.3 Broadband usage profile of low-income households
The data presented in this section provide the broadband usage profile of low-income
households, the data was collected through a questionnaire consisting of 17 questions
and is presented by means of descriptive statistics. The questions were grouped into
3 categories, namely: adoption rate, usage and barriers to adoption.
4.3.1 Preferred end user device
With respect to preference between end user devices, Figure 19 illustrates that the
majority of participants (67%) chose smartphones and tablets as their preferred end-
user devices. The rest of participants (22% and 11% respectively) preferred desktop
computers.
Figure 19: Preferred end-user device
Source: Researcher (2018)
Figure 20 shows a summary of the frequent uses of an end-user device. Most
participants (23%), used their end-user device frequently to send and receive instant
messages followed by listening to music and study both at 13%, social networking and
taking pictures both at 11%, and sending and receiving emails.
11%
22%
67%
Preferred end-user device
Desktop
Laptop
Smartphone/Tablet
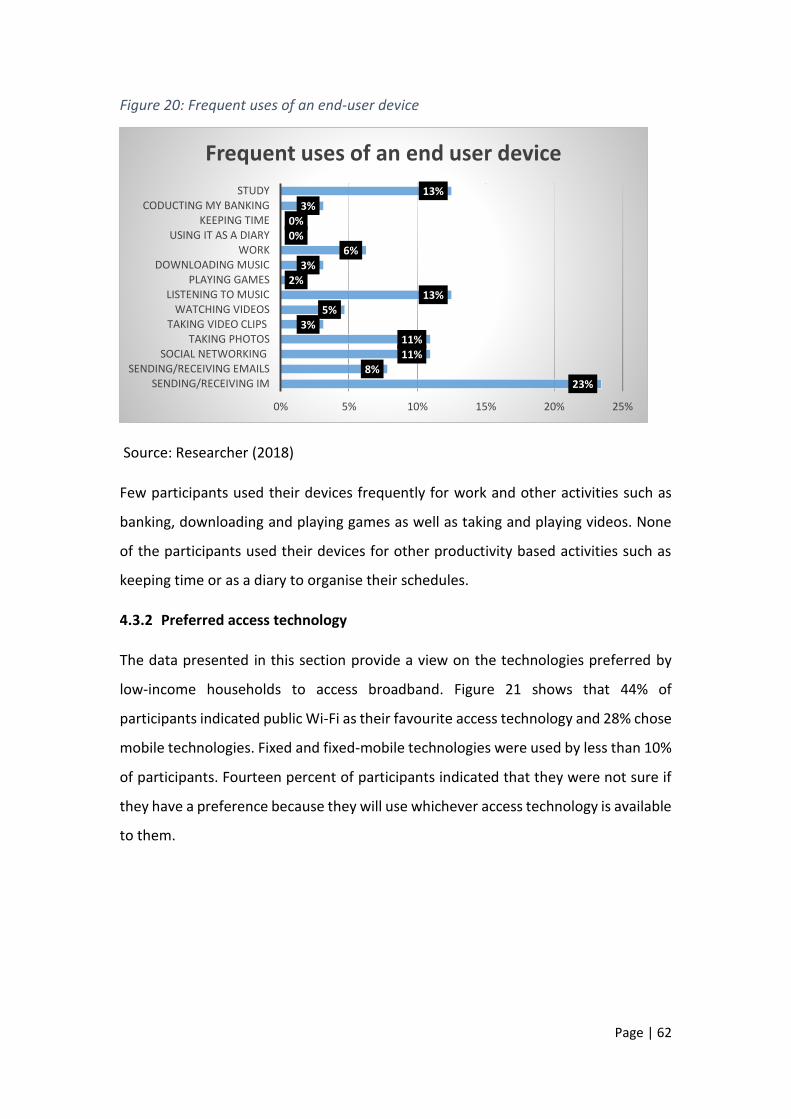
Page | 62
Figure 20: Frequent uses of an end-user device
Source: Researcher (2018)
Few participants used their devices frequently for work and other activities such as
banking, downloading and playing games as well as taking and playing videos. None
of the participants used their devices for other productivity based activities such as
keeping time or as a diary to organise their schedules.
4.3.2 Preferred access technology
The data presented in this section provide a view on the technologies preferred by
low-income households to access broadband. Figure 21 shows that 44% of
participants indicated public Wi-Fi as their favourite access technology and 28% chose
mobile technologies. Fixed and fixed-mobile technologies were used by less than 10%
of participants. Fourteen percent of participants indicated that they were not sure if
they have a preference because they will use whichever access technology is available
to them.
23%8%
11%11%
3%5%
13%2%
3%6%
0%0%
3%13%
0% 5% 10% 15% 20% 25%
SENDING/RECEIVING IMSENDING/RECEIVING EMAILS
SOCIAL NETWORKING TAKING PHOTOS
TAKING VIDEO CLIPS WATCHING VIDEOS
LISTENING TO MUSICPLAYING GAMES
DOWNLOADING MUSICWORK
USING IT AS A DIARYKEEPING TIME
CODUCTING MY BANKINGSTUDY
Frequent uses of an end user device
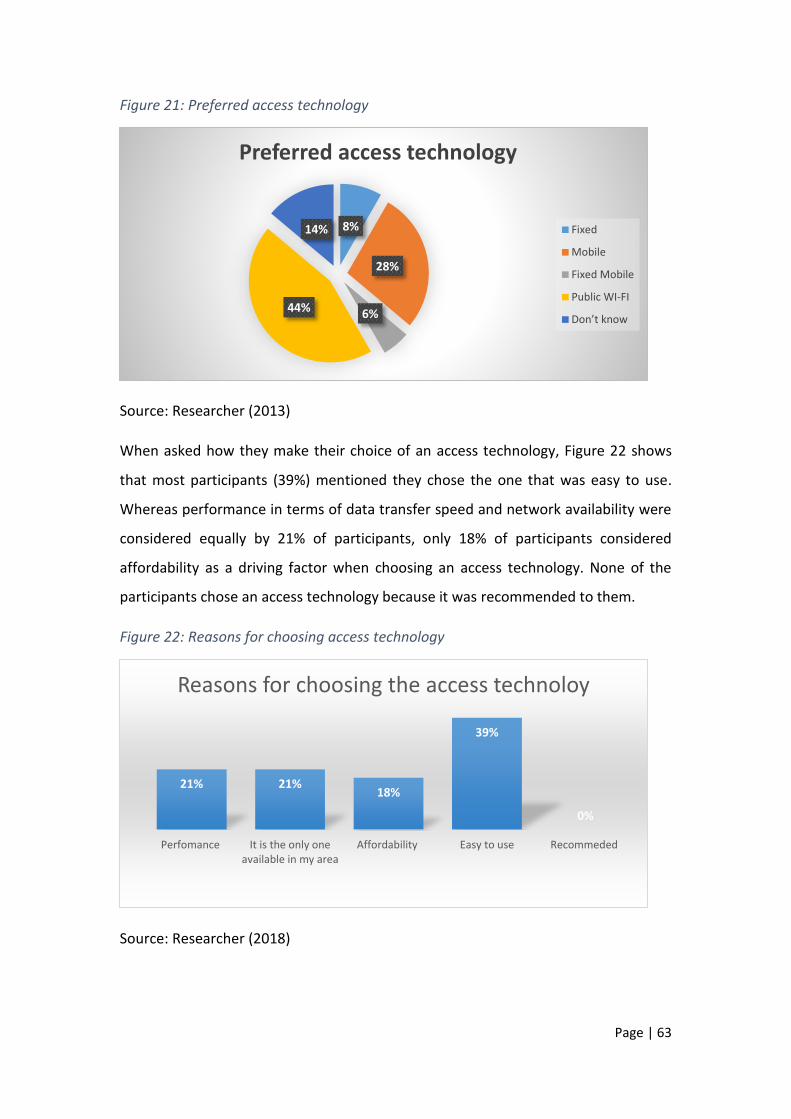
Page | 63
Figure 21: Preferred access technology
Source: Researcher (2013)
When asked how they make their choice of an access technology, Figure 22 shows
that most participants (39%) mentioned they chose the one that was easy to use.
Whereas performance in terms of data transfer speed and network availability were
considered equally by 21% of participants, only 18% of participants considered
affordability as a driving factor when choosing an access technology. None of the
participants chose an access technology because it was recommended to them.
Figure 22: Reasons for choosing access technology
Source: Researcher (2018)
8%
28%
6%44%
14%
Preferred access technology
Fixed
Mobile
Fixed Mobile
Public WI-FI
Don’t know
21% 21%18%
39%
0%
Perfomance It is the only oneavailable in my area
Affordability Easy to use Recommeded
Reasons for choosing the access technoloy
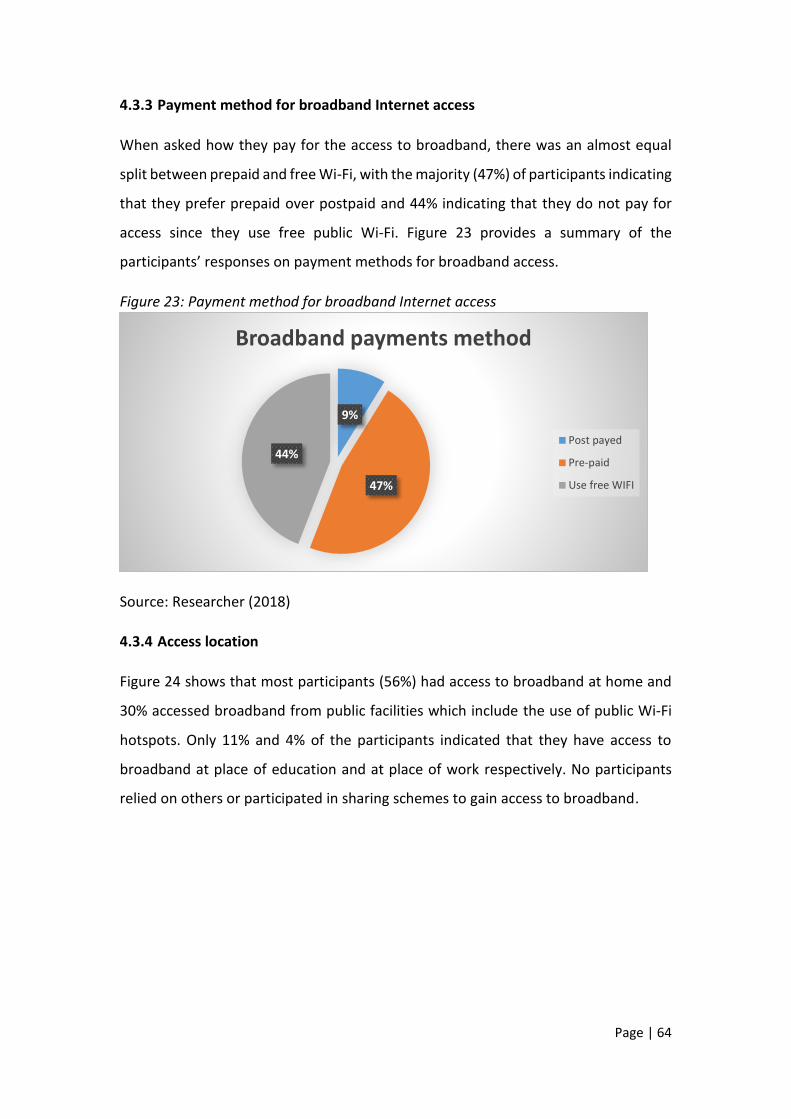
Page | 64
4.3.3 Payment method for broadband Internet access
When asked how they pay for the access to broadband, there was an almost equal
split between prepaid and free Wi-Fi, with the majority (47%) of participants indicating
that they prefer prepaid over postpaid and 44% indicating that they do not pay for
access since they use free public Wi-Fi. Figure 23 provides a summary of the
participants’ responses on payment methods for broadband access.
Figure 23: Payment method for broadband Internet access
Source: Researcher (2018)
4.3.4 Access location
Figure 24 shows that most participants (56%) had access to broadband at home and
30% accessed broadband from public facilities which include the use of public Wi-Fi
hotspots. Only 11% and 4% of the participants indicated that they have access to
broadband at place of education and at place of work respectively. No participants
relied on others or participated in sharing schemes to gain access to broadband.
9%
47%
44%
Broadband payments method
Post payed
Pre-paid
Use free WIFI
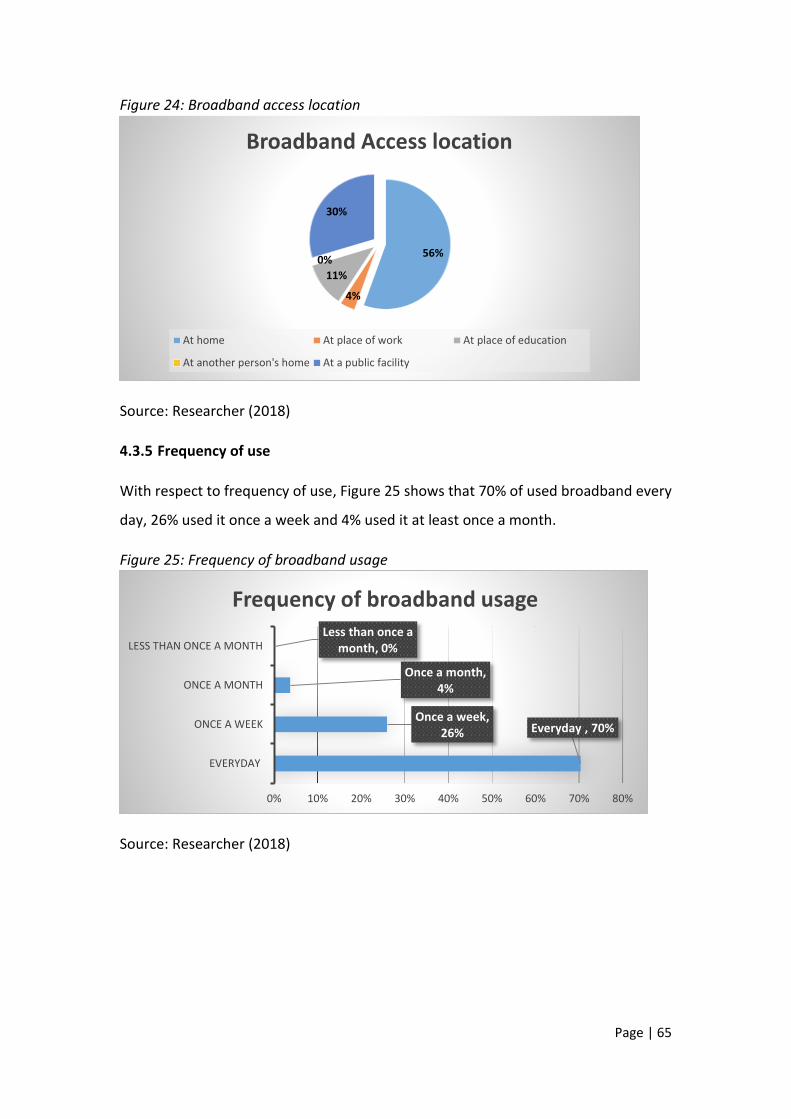
Page | 65
Figure 24: Broadband access location
Source: Researcher (2018)
4.3.5 Frequency of use
With respect to frequency of use, Figure 25 shows that 70% of used broadband every
day, 26% used it once a week and 4% used it at least once a month.
Figure 25: Frequency of broadband usage
Source: Researcher (2018)
56%
4%
11%
0%
30%
Broadband Access location
At home At place of work At place of education
At another person's home At a public facility
Everyday , 70%Once a week,
26%
Once a month, 4%
Less than once a month, 0%
EVERYDAY
ONCE A WEEK
ONCE A MONTH
LESS THAN ONCE A MONTH
0% 10% 20% 30% 40% 50% 60% 70% 80%
Frequency of broadband usage
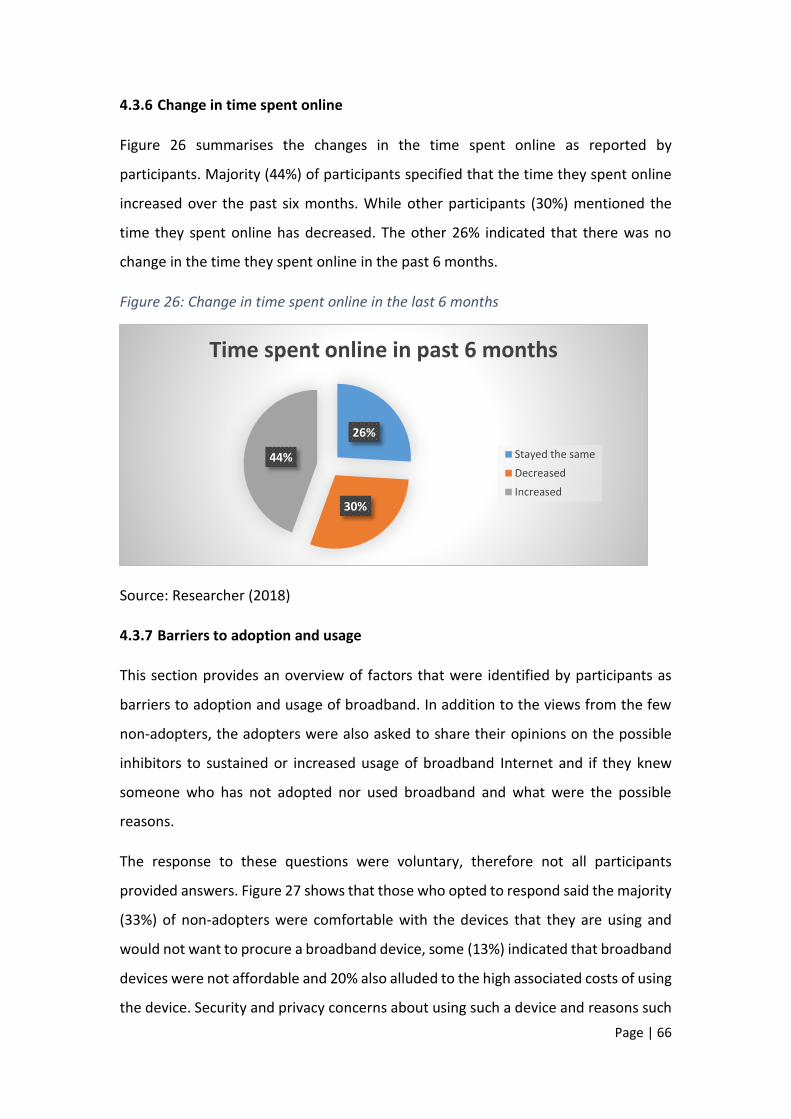
Page | 66
4.3.6 Change in time spent online
Figure 26 summarises the changes in the time spent online as reported by
participants. Majority (44%) of participants specified that the time they spent online
increased over the past six months. While other participants (30%) mentioned the
time they spent online has decreased. The other 26% indicated that there was no
change in the time they spent online in the past 6 months.
Figure 26: Change in time spent online in the last 6 months
Source: Researcher (2018)
4.3.7 Barriers to adoption and usage
This section provides an overview of factors that were identified by participants as
barriers to adoption and usage of broadband. In addition to the views from the few
non-adopters, the adopters were also asked to share their opinions on the possible
inhibitors to sustained or increased usage of broadband Internet and if they knew
someone who has not adopted nor used broadband and what were the possible
reasons.
The response to these questions were voluntary, therefore not all participants
provided answers. Figure 27 shows that those who opted to respond said the majority
(33%) of non-adopters were comfortable with the devices that they are using and
would not want to procure a broadband device, some (13%) indicated that broadband
devices were not affordable and 20% also alluded to the high associated costs of using
the device. Security and privacy concerns about using such a device and reasons such
26%
30%
44%
Time spent online in past 6 months
Stayed the same
Decreased
Increased
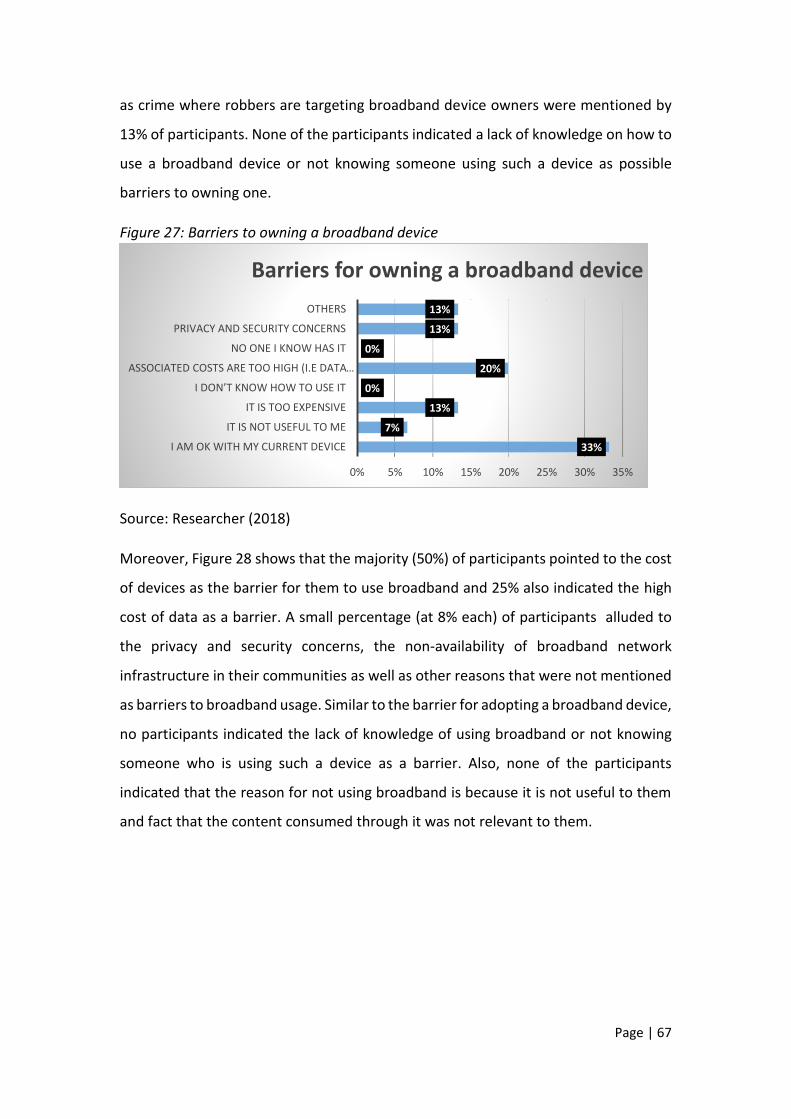
Page | 67
as crime where robbers are targeting broadband device owners were mentioned by
13% of participants. None of the participants indicated a lack of knowledge on how to
use a broadband device or not knowing someone using such a device as possible
barriers to owning one.
Figure 27: Barriers to owning a broadband device
Source: Researcher (2018)
Moreover, Figure 28 shows that the majority (50%) of participants pointed to the cost
of devices as the barrier for them to use broadband and 25% also indicated the high
cost of data as a barrier. A small percentage (at 8% each) of participants alluded to
the privacy and security concerns, the non-availability of broadband network
infrastructure in their communities as well as other reasons that were not mentioned
as barriers to broadband usage. Similar to the barrier for adopting a broadband device,
no participants indicated the lack of knowledge of using broadband or not knowing
someone who is using such a device as a barrier. Also, none of the participants
indicated that the reason for not using broadband is because it is not useful to them
and fact that the content consumed through it was not relevant to them.
33%
7%
13%
0%
20%
0%
13%
13%
0% 5% 10% 15% 20% 25% 30% 35%
I AM OK WITH MY CURRENT DEVICE
IT IS NOT USEFUL TO ME
IT IS TOO EXPENSIVE
I DON’T KNOW HOW TO USE IT
ASSOCIATED COSTS ARE TOO HIGH (I.E DATA …
NO ONE I KNOW HAS IT
PRIVACY AND SECURITY CONCERNS
OTHERS
Barriers for owning a broadband device
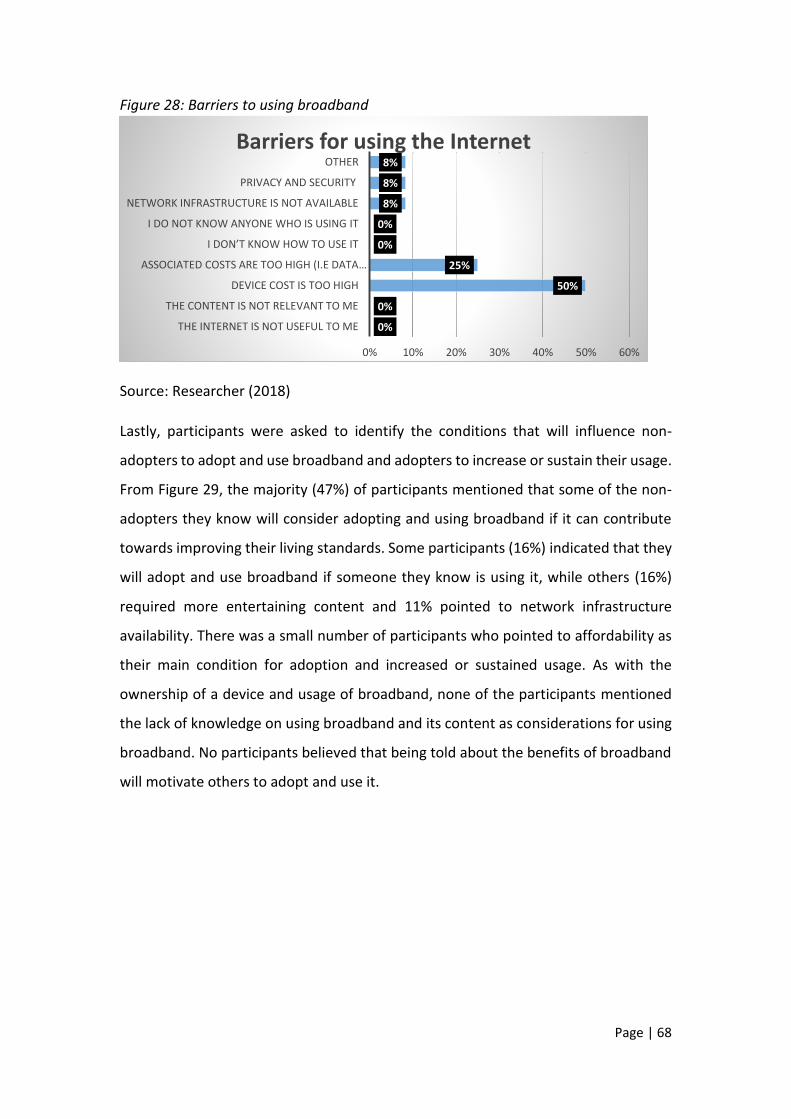
Page | 68
Figure 28: Barriers to using broadband
Source: Researcher (2018)
Lastly, participants were asked to identify the conditions that will influence non-
adopters to adopt and use broadband and adopters to increase or sustain their usage.
From Figure 29, the majority (47%) of participants mentioned that some of the non-
adopters they know will consider adopting and using broadband if it can contribute
towards improving their living standards. Some participants (16%) indicated that they
will adopt and use broadband if someone they know is using it, while others (16%)
required more entertaining content and 11% pointed to network infrastructure
availability. There was a small number of participants who pointed to affordability as
their main condition for adoption and increased or sustained usage. As with the
ownership of a device and usage of broadband, none of the participants mentioned
the lack of knowledge on using broadband and its content as considerations for using
broadband. No participants believed that being told about the benefits of broadband
will motivate others to adopt and use it.
0%
0%
50%
25%
0%
0%
8%
8%
8%
0% 10% 20% 30% 40% 50% 60%
THE INTERNET IS NOT USEFUL TO ME
THE CONTENT IS NOT RELEVANT TO ME
DEVICE COST IS TOO HIGH
ASSOCIATED COSTS ARE TOO HIGH (I.E DATA …
I DON’T KNOW HOW TO USE IT
I DO NOT KNOW ANYONE WHO IS USING IT
NETWORK INFRASTRUCTURE IS NOT AVAILABLE
PRIVACY AND SECURITY
OTHER
Barriers for using the Internet
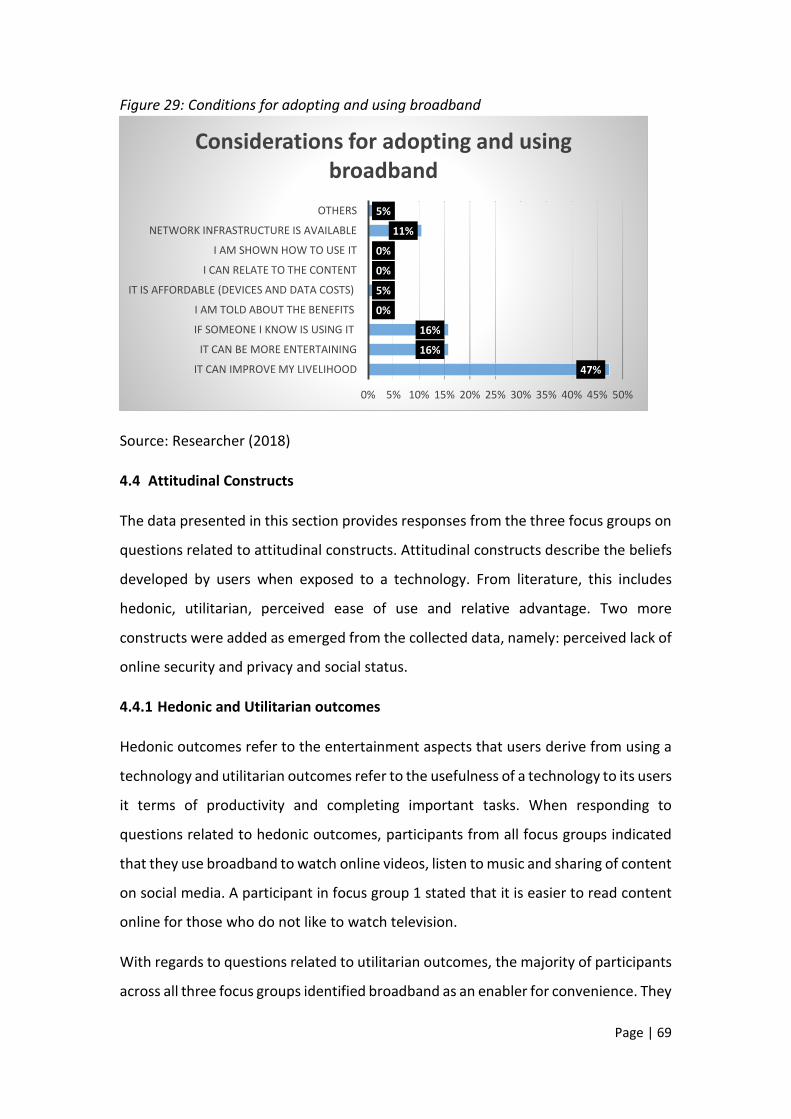
Page | 69
Figure 29: Conditions for adopting and using broadband
Source: Researcher (2018)
4.4 Attitudinal Constructs
The data presented in this section provides responses from the three focus groups on
questions related to attitudinal constructs. Attitudinal constructs describe the beliefs
developed by users when exposed to a technology. From literature, this includes
hedonic, utilitarian, perceived ease of use and relative advantage. Two more
constructs were added as emerged from the collected data, namely: perceived lack of
online security and privacy and social status.
4.4.1 Hedonic and Utilitarian outcomes
Hedonic outcomes refer to the entertainment aspects that users derive from using a
technology and utilitarian outcomes refer to the usefulness of a technology to its users
it terms of productivity and completing important tasks. When responding to
questions related to hedonic outcomes, participants from all focus groups indicated
that they use broadband to watch online videos, listen to music and sharing of content
on social media. A participant in focus group 1 stated that it is easier to read content
online for those who do not like to watch television.
With regards to questions related to utilitarian outcomes, the majority of participants
across all three focus groups identified broadband as an enabler for convenience. They
47%
16%
16%
0%
5%
0%
0%
11%
5%
0% 5% 10% 15% 20% 25% 30% 35% 40% 45% 50%
IT CAN IMPROVE MY LIVELIHOOD
IT CAN BE MORE ENTERTAINING
IF SOMEONE I KNOW IS USING IT
I AM TOLD ABOUT THE BENEFITS
IT IS AFFORDABLE (DEVICES AND DATA COSTS)
I CAN RELATE TO THE CONTENT
I AM SHOWN HOW TO USE IT
NETWORK INFRASTRUCTURE IS AVAILABLE
OTHERS
Considerations for adopting and using broadband

Page | 70
mentioned the use of broadband to pay accounts, do banking, and pay for electricity,
rent and online shopping to avoid waiting in traffic and standing in long queues. A
participant in focus group three said: “...I think convenience as well because when you
download an app you download to make your life easier to make things convenient
for you so the one thing I look for is convenience.”
Broadband was also regarded as an empowering tool to members of the community.
A participant in focus group two stated: “It goes back to the issue that we talked about
that it makes life easy. Even if you are sick or crippled you can do online shopping and
pay your bills.”
Participants also used broadband as their key source of information for educational
purposes, searching and applying for jobs as well as bursaries and learnerships. A
participant in focus group one supplemented:
For us it is productivity because entertainment is not
something that is more important for us to spend data on so
meaning I would not spend my data on entertainment rather
than go online and look at Sasol’s learnerships and what
bursaries are there, there is no benefit in me looking for
something that won’t benefit me tomorrow.
When asked to indicate if broadband means more entertainment or productivity to
them, majority of participants in focus group one concurred that they use broadband
equally for both entertainment and productivity. A participant in focus group one
mentioned that “It covers all of the aspects of our living in todays’ life, you have your
emails, your camera, music, everything you need on your phone, entertainment and
both personal life.”
However, the majority of participants in focus group two preferred entertainment
over productivity and mentioned activities such as online dating. There was no
consensus among focus group three participants in this regard, while one participant
indicated that for him broadband was more about entertainment, another participant
pointed out that he downloads videos for learning. Another participant in focus group
three added that “It depends on the user of the particular phone or computer because
Page | 71
if you like entertainment you will use most of your data on entertainment but if you’re
a busy person you can do stuff to succeed in your life.”
4.4.2 Perceived Ease of Use
Perceived ease of use as the name implies, refers to how user friendly users of a
technology perceive it to be. When they were asked what important considerations
are taken into account when choosing a broadband end-user device, participants
highlighted user friendliness as one of the main drivers for them to make a decision,
a participant specified that:
We were looking for a phone that won’t give you a hassle when
you are trying to access the internet meaning that it is a phone
that has to be internet friendly with our community Wi-Fi that
is the one thing that we look at when buying a phone.
There were conflicting views among participants on their perceptions on the ease of
use of broadband, meaning both the use of broadband devices and the use of
broadband services. Some participants pointed out that they perceive broadband to
be relatively easy to use. A participant in focus group three highlighted that although
broadband has been regarded as a technology that is more suitable for the young
generation, the older generation is also adopting and using broadband because it is
user friendly.
In contrast, some participants held a view that the technology still does not cater for
everybody. A participant in focus group two raised a concern that the user manuals or
help menus on the devices are mainly in English so this is a problem for people who
cannot read and understand English. The participant went further to propose that it
will make it easier if a local language was included in the help menu. Another
participant in focus group two recommended voice recognition technology as a
possible solution if the feature can be added to affordable devices.
Furthermore, another concern was raised regarding the need for users to always
upgrade their devices. Participants indicated that although broadband is easy to use,
they are compelled to frequently change their devices to keep up with technological
Page | 72
developments. A participant in focus group three suggested that it will be better if an
application can be developed that will allow them to simply update the software on
their devices when developments are made. Additionally, a participant in focus group
one mentioned that some people might not be using broadband because they want
something less complicated and easy to use.
4.4.3 Relative advantage
Relative advantage refers to facets of the technology that makes it superior to its
predecessors or competing technologies as perceived by users. Participants submitted
that fast data transfer speed is the key driver for their choice of broadband products
and services. A participant in focus group two added that “for me I decided to buy it
so that I can google and go on the Internet and I could Facebook and WhatsApp really
fast.” Participants further indicated that a fixed broadband connection is more reliable
as compared to a mobile connection and it provides better performance as compared
to the free Wi-Fi because there is less congestion on the network.
But it emerged that although participants deemed it beneficial to have a dedicated
fixed connection, few of them actually had fixed connections installed at their houses
because they regard it to be expensive. Therefore, participants preferred mobile
broadband not only because it is cheaper as compared to fixed broadband, but
because it also offers mobility which translates to flexibility of staying connected
everywhere they go.
In addition, participants mentioned that mobile phones allow them to install
applications on their personal devices without depending on a single home computer.
A participant in focus group three supported the view by saying: “most of the apps we
have them on the mobile phone, even now that we can get them on the laptop, but
the mobile phone you can get internet everywhere.”
Another feature that made participants prefer mobile devices is the ability to create a
Wi-Fi hotspot wherein a number of devices can be connected to share data
connection. A participant in focus group one pointed out that the Wi-Fi hotspot
feature allows them to share data which makes broadband more accessible for them.
Page | 73
4.4.4 Perceived lack online security and privacy
Adopters and non-adopters of broadband mentioned online privacy and security as
factors of concern. These factors did not form part of the conceptual framework but
they proved to be of importance to participants. The factors also had a potential to
affect their behaviour toward the adoption and continued usage of broadband.
Participants in focus group two mentioned that many people still do not use the
Internet due to the fear of getting hacked or personal information being stolen. A
participant in focus group two mentioned that “there isn’t enough privacy, people can
get your confidential information. You get people sending you messages that you
didn’t subscribe to.” While another participant in focus group three also affirmed this
by stating:
Whereas, we are saying that we are trying to create a better
nation to enhance South Africans or our own country views or
to take South Africa to that certain level but the problem is we
are not safe from security point of view, we don’t have security
at all because whereas we say that we communicate safely
whereas the servers belong to them so how safe are we?
4.4.5 Social status
Although social status was also not identified from literature as an attitudinal
construct, it was regarded as an important factor by participants for adoption and
usage of broadband. Participants also added that social status plays an important role
in choosing a product. A participant in focus group two supplemented:
So you see living in the township, most of us we don’t care
about how a phone works, we just want the most expensive
phone, even if you don’t have the knowledge about the phone
you just want to make sure that they know that this is the
phone that you have.
Page | 74
4.5 Normative Constructs
The data presented in this section provides responses from the three focus groups on
questions related to normative constructs. Normative constructs refer to how people
get influenced by others and the information around them to adopt and use a
technology. From literature, this includes primary and secondary influences.
4.5.1 Primary influence
Primary influence is the social pressure that is imposed upon an individual by family,
friends and other members of the society to use a technology. A participant in focus
group one pointed out: “I actually saw one of my friends using the phone I have right
now and I liked it so I asked my mom to buy it for me.” Another participant in focus
group three also indicated that he was referred by a business partner to try a
particular service provider.
The majority of participants in all three focus groups highlighted that they rely on the
experience of others as a deciding factor to buy a particular product. They mentioned
that they would rather wait for more people to buy the product first and learn from
their experiences and the practice also assists them to get the products at affordable
prices since products are usually expensive when they are new in the market.
4.5.2 Secondary influence
Secondary influence refers to how individuals are influenced by other sources of
information such as media and advertising to use new technology. The majority of
participants in all focus groups believed that although broadband products and
services are advertised in the media, the information was still not enough to influence
more people in their communities to adopt and use broadband because there are still
products and services they are not aware of. Participants further indicated that more
people will consider broadband products and services if information is provided on it,
and they classified television as the best form of media for advertising and informing
them about new products and services.
Page | 75
Participants also alluded to the points that there is an element of selective marketing
where information about certain products and services is not disseminated to their
communities. A participant in focus group one added:
I think he is right, it is more about the situation of where you
are based due to the fact that most of the people that live in
townships we don’t get as much information that we should be
getting compared to the people that live in the suburbs.
They also mentioned cases where infrastructure was deployed in the community but
no information was provided on how to access it. Participants believed that market
segmentation has led to the situation were fixed broadband products and services in
particular are not marketed to them because they are not regarded as the target
market, even though the infrastructure is available in some of their communities.
Therefore, only few people who seek information will know about such products and
services.
4.6 Control constructs
The data presented in this section provides responses to questions that were linked
to control constructs. Control constructs refer to the level at which potential users
believe that they have internal and external control to use a technology. From
literature, these factors include knowledge, self-efficacy and facilitating conditions
resources.
4.6.1 Knowledge
The knowledge construct refers to the level of awareness at which potential adopters
and users of technology are exposed. This may include knowledge about the benefits
of using the technology, how to procure it and how to use it optimally.
Although participants believed that they have a high level of awareness of broadband,
they alluded to some aspects of the technology that they still do not understand. A
participant in focus group one mentioned that in most cases they buy devices without
fully understanding the capabilities and features. Another participant in focus group
one added that the information about the devices is normally communicated in

Page | 76
technical terms like bits and pixels which is confusing to people without a technical
background. The participant added: “I think the information should be simplified for
someone that doesn’t know because when you come as a consumer you just want a
fast phone, a phone that connect to the internet with ease.”
Another concern that was raised by the participants was the complexities of choosing
between products. Participants concurred that the information they get on products
does not enable them to easily compare and make a choice. A participant in focus
group two stated that it is not always clear to them how much data they can get for a
certain amount of money, hence they always have to do research.
Furthermore, a participant in focus group one revealed that they are also not sure
how their devices utilise the data. The participant mentioned that retailers should
provide information on:
How the phone actually manages its own data, if I had to
upload data, how long will it stay number one, and then on
what kind of usage will it be maintained, on what type of things
would I be using it for it to maintain itself and then thirdly the
fact that if I had to download something, will it be faster to save
me more data or would it take a while and still eat my data.
Some participants were not aware of applications and automatic updates that run in
the background and use data. They mentioned that sometimes their data and airtime
disappears and they do not seem to have control over the situation as the applications
will update without their consent. A participant in focus group two complained:
When you get a new modem and then things install without
your consent, just like google play and its’ auto updates, it uses
your data and downloads applications that you never asked for
and the hundred megabytes that you bought are finished.
However, another participant in focus group one held a view that sometimes it is a
matter of people being ignorant. The participants mentioned:
Page | 77
What I am saying is we watch the same TV and we go to the
same shops, the problem is that when we get a product, like a
phone, we get there and say I like this phone, we don’t ask
the right questions, exactly, we are being ignorant.
Another participant in focus group one supported the view that “people do not read
the terms and conditions when downloading applications, they just press ok and
install”. By doing this, users effectively give their consent to applications to run and
update in the background. A participant in focus group two added that by letting their
children play games on their devices also contributes to the issue of high data usage
because they are sometimes not aware what their children do with the devices. A
participant in focus group three also indicated that most of the free applications they
install on their devices come with pop-up advertisements which can also add to data
usage.
Although some participants were aware of features on devices that help them to
restrict background data usage, others resorted to completely disabling mobile data
on the devices when it is not being used as means of controlling usage. Participants
felt that more awareness is needed on this matter because they believed that
network operators are taking advantage of the situation. A participant in focus
group one said:
Yes, that is why I am talking about it because it used my data
and then I ended up calling customer care and told them that
they are ripping me off because I told them that I haven’t
been making calls or anything but my airtime still disappears
so I called and they told me that I need to switch off my
background data but since I have done it I can cope.
4.6.2 Self-efficacy
Self-efficacy refers to the internal factors or perceived confidence of users in using a
technology. This includes the belief that they have the right skills and proper
understanding on how the technology functions. Notwithstanding the technical issues
discussed in section 4.6.1, responses from all focus groups showed that the majority
Page | 78
of participants were comfortable with using broadband. This is supported by the fact
that the majority of participants were adopters and active users of broadband and the
minority who were classified as non-adopters also have an understanding on how
broadband functions.
Participants exhibited a high level of understanding with regards to the knowledge of
access technologies, devices and services that are associated with broadband.
Participants mentioned they were confident using mobile technologies such as 3G, 4G
and Wi-Fi on smartphones, tablets and laptop computers. A participant in focus group
one added: “so we have the smartphone and the modem that we use with the laptop”.
Participants also listed the use of a range of services and applications from emails,
social media, instant messaging, online shopping and internet banking.
However, there were some participants who believed that they did not entirely have
the requisite skills and full confidence of using broadband. In this case, some rely on
the younger generation of users as they are believed to have superior knowledge on
the technology as compared to their older generation counterparts. As a participant
in focus group two mentioned: “another thing that I saw is that we aren’t really good
at using these phones but our kids are. I sometimes get stuck and my kids help me
out.”
4.6.3 Facilitating conditions resources
Facilitating condition resources refers to the external factors that may serve as
limitations for the adoption and usage of broadband. This includes factors such as
affordability, time and availability of infrastructure with regards to broadband
adoption and usage. Participants indicated that although they were aware of fixed
broadband access technologies like ADSL, they preferred mobile broadband access
technologies because they are cost effective and provides mobility. Participants also
indicated that they use the free Wi-Fi extensively.
However, there were concerns from participants on the quality of service provided by
the mobile network operators. The majority of participants in all focus groups
indicated that the availability of mobile network coverage was not consistent
throughout their community and the network gets congested which slows down the
Page | 79
connection speed. Therefore, their choice of a service provider depends on who has
the best coverage in a particular area. A participant in focus group three mentioned:
I think what he is saying in terms of Cell C it differs on location,
where I am right now MTN is the problem, where he is staying
Cell C is the problem. Right now I am currently using Cell C and
it is fast, it’s okay but not in his area so it depends on location.
Participants pointed out that the quality of service must be improved to provide
uniform coverage everywhere. A participant in focus group three mentioned that this
situation limits their choice and compels them to choose more expensive service
providers over cheaper alternatives just because the quality of service is better in their
area. Another participant in focus group three indicated that they have to carry
multiple sim cards from different service providers to allow them to access the best
network at a specific location. A participant in focus group one also added that the
connection speed is fast after midnight when less people are on the network.
Participants also alluded to the limited range of the free Wi-Fi hotspots as a challenge.
A participant in focus group one stated: “this free Wi-Fi, can’t reach it from here, I
wish I could reach it from my own bed, so the person that stays closer to the Wi-Fi
station has a better advantage than I do.” Another participant in focus group one
raised a concern that they risk a chance of getting robbed every time they carry their
devices to get closer to the Wi-Fi hotspot.
The cost of adopting and using broadband was also cited as a major barrier by
participants. The indication was that more people would adopt and use broadband if
the devices and associated usage costs (i.e. purchase of data bundles) were
affordable. A participant in focus group two referred to the prices they pay to
purchase data bundles as being “unfair.” While a participant in focus group three
stressed that it was a common view among everybody in their communities that data
bundles are too expensive and it is not financially viable for increased usage. Another
participant in focus group two further supplemented that devices that are considered
to be of good quality are expensive and out of reach for them.
Page | 80
4.7 Relevance constructs
Relevance constructs refer to the use of broadband by low-income households toward
the improvement of their livelihood, as well as the availability of content that is
produced locally to keep the community informed and advance community
development programmes.
4.7.1 Livelihood
By and large, participants who were broadband adopters confirmed that it is already
an integral part of their lives. Participants regard broadband as an essential service to
their communities to unlock potential and improve their living conditions. Participants
described broadband as “a must have” and a participant in focus group two said:
Most of the time you cannot say people must not use it
because now it is a must have, whenever you apply for a job
they tell you, you must go to the internet so for more of us to
get jobs we have to have broadband.
Another participant then added: “I believe in these days every house must have a
computer, these things are very useful.” A participant in focus group one also
mentioned that all people must use the internet. While a participant in focus group
three said he recommends broadband to everyone in the community because it is easy
to use and it makes life easy.
4.7.2 Local content
With regards to local content, participants indicated that there was (to some extent)
information that is relevant to their communities on platforms such as application
stores, video and audio online stores and social media. Although there was no
mention of specific community based websites, blogs or chat groups, participants
mentioned that the free Wi-Fi portal provided information on local news and other
community based information. A participant in focus group one mentioned: “like this
free Wi-Fi, you can apply for a job on that free Wi-Fi, you can see opportunities, even
if you have maxed out your 500 Meg usage you can still view jobs and news that are
happening around.”
Page | 81
Participant in focus group three added that although the free Wi-Fi provides this
facility, people tend to ignore it most of the time. While another participant in focus
group one supplemented: “because that free Wi-Fi was put there for educational
purpose but we use it for our entertainment that’s why if you can see most of the
entertainment websites they are blocked from the website.”
When asked if there was sufficient production and consumption of local content
through broadband, participants alluded to the issue of low data transfer speeds and
high cost as a limiting factors for uploading and accessing the content. A participant in
focus group three said:
We don’t have local content because of the lack of speed in
terms of downloading and uploading those things, you create
them, there is a lot of videos there is a lot of content out there
but for them to actually upload them to the internet is a
process on its own, it costs money, it’s not affordable for them
to do that, you understand so now for us to actually get that
we need to actually improve our infrastructure
In addition, there was also a concern about hosting of content online. A participant
in focus group three stated that they do not feel comfortable in sharing their ideas
on the internet because there is not sufficient protection for intellectual property.
The participant asserted that because the information is hosted on servers, the
owners of the servers will always have access to the information so they run a risk of
their ideas being stolen. Another participant in focus group three also alluded to the
lack of developmental funding and lack of information for innovators. The
participants cited:
We may have free WIFI and then take ourselves there to get
information about building some apps but first thing that we
have to watch out, where are we going to get the funds to
proceed with that app, where are going to get that sort of
material to proceed with that app?
Page | 82
4.8 Chapter summary
The data collected through the short survey found that low-income households had
access to a variety of network technologies in both fixed and mobile broadband,
although it was not pervasive. They used broadband frequently to perform basic and
advanced activities ranging from information search, emails, social media and instant
messaging to banking, online shopping, training and education. The data collected
through the focus group discussions revealed that low-income households were
influenced by all motivational factors discussed in the literature. In addition to the pre-
determined motivational factors, perceived lack of online security and privacy as well
as social status emerged from the collected data as influential attitudinal factors for
broadband adoption and usage by low-income households.
Page | 83
Chapter 5: Analysis on motivational factors influencing broadband adoption and
usage by low-income households
5.1 Introduction
This chapter provides the interpretation and discussion of the data presented in
Chapter 4. The analysis followed Saldana (2009) streamlined code-to-theory model
described in section 3.8. The chapter is structured according to the research questions
posed in Chapter 3 and also in the context of the theoretical framework that guides
this study. The main research question for this study is how do motivational factors
influence the adoption and usage of broadband in low-income households? And
following sub questions were derived to support the main research question:
Sub question 1
What are the characteristics of broadband use among low-income households?
Sub question 2
How do attitudinal, normative and control constructs influence the behaviour of low-
income households to adopt and use broadband?
Sub question 3
How do relevance constructs support the influence on behaviour of low-income
households to adopt and use broadband?
Section 5.2 sought to answers Sub question 1, using the data collected through the
short survey and presented using descriptive statistics in Chapter 4. While Sections 5.3
to 5.6 sought to address Sub questions 2 and 3 respectively.
The findings in these sections are presented in line with the extended model for
broadband adoption as proposed in Chapter 2 as well as new constructs that emerged
in the interpretation and analysis of the collected data. Themes are developed and
discussed under each construct to build explanations on how it affects the behaviour
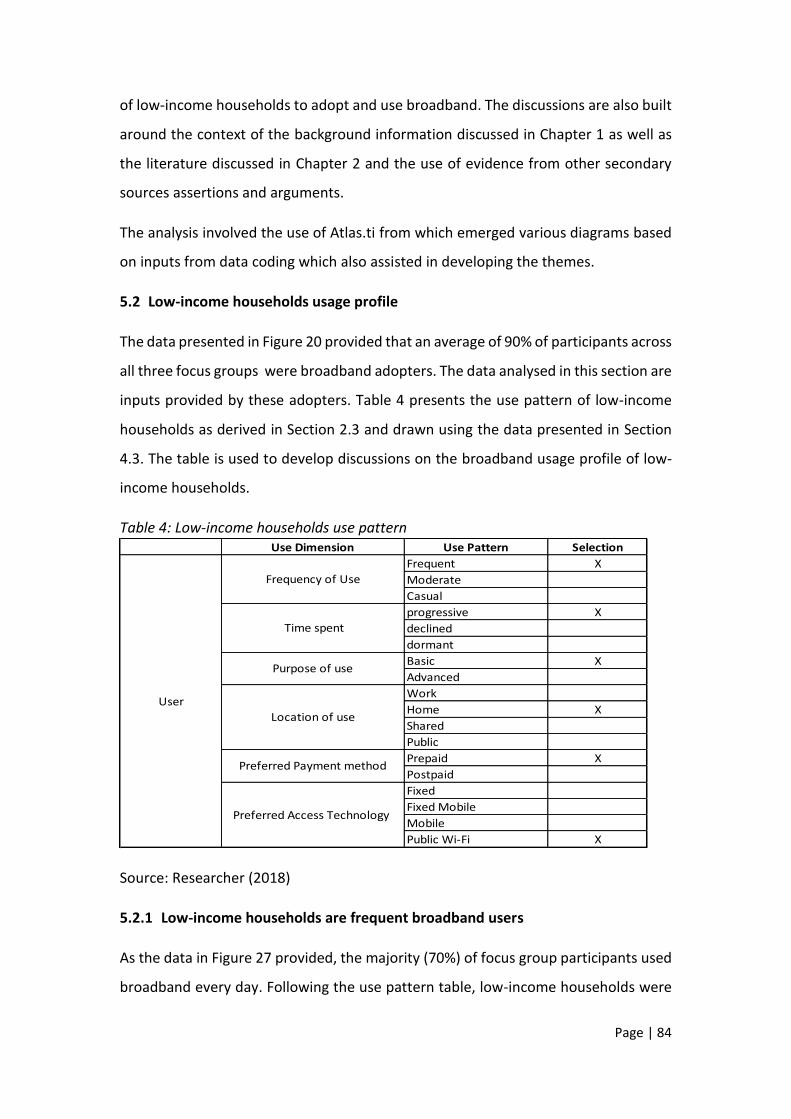
Page | 84
of low-income households to adopt and use broadband. The discussions are also built
around the context of the background information discussed in Chapter 1 as well as
the literature discussed in Chapter 2 and the use of evidence from other secondary
sources assertions and arguments.
The analysis involved the use of Atlas.ti from which emerged various diagrams based
on inputs from data coding which also assisted in developing the themes.
5.2 Low-income households usage profile
The data presented in Figure 20 provided that an average of 90% of participants across
all three focus groups were broadband adopters. The data analysed in this section are
inputs provided by these adopters. Table 4 presents the use pattern of low-income
households as derived in Section 2.3 and drawn using the data presented in Section
4.3. The table is used to develop discussions on the broadband usage profile of low-
income households.
Table 4: Low-income households use pattern
Source: Researcher (2018)
5.2.1 Low-income households are frequent broadband users
As the data in Figure 27 provided, the majority (70%) of focus group participants used
broadband every day. Following the use pattern table, low-income households were
Use Dimension Use Pattern Selection
Frequent X
Moderate
Casual
progressive X
declined
dormant
Basic X
Advanced
Work
Home X
Shared
Public
Prepaid X
Postpaid
Fixed
Fixed Mobile
Mobile
Public Wi-Fi X
User
Frequency of Use
Time spent
Purpose of use
Location of use
Preferred Payment method
Preferred Access Technology
Page | 85
classified as frequent broadband users. Based on Rogers (1995) DOI, low-income
households can be said to be at the confirmation stage of broadband diffusion
because the technology was used frequently and on continuous basis by the majority
of the studied population, even though there was still a small number of users that
still sought confirmation on the benefits of the frequent use of the technology.
5.2.2 Low-income households are progressive users
Although the data in Figure 26 provided that the majority of participants in low-
income households were progressive users because the time they spent online had
increased in 6 months, the same figure also shows considerable percentages of
dormant (26%) and declined (30%) users, which suggested that there are factors that
hamper the increased usage of broadband. Combining the data presented in Figures
27, 28 and 29, it was realised that the declined and dormant usage were attributable
to the high cost of data. This may be an indication that some low-income households
did not find value in spending more on data (to increase the time spent online), but
rather bought enough data to meet their basic needs and some even reduced their
spending. This should be an important consideration for policy makers and services
providers. The cost of data as a barrier to broadband adoption and usage is elaborated
further in Section 2.6.2.2
5.2.3 Low-income households are basic users
Looking at the range of broadband services and application used as presented in
Figure 20, low-income households were classified as basic users. Although low-income
households used less advanced services and applications, this may not suggest that a
demographic indicator such as income played a significant role in determining how
users used broadband. The use of broadband by low-income households was
observed to be influenced by a mixture of applications which covered both
productivity and entertainment activities.
Lee, Marcu and Lee (2011) refer to killer applications as the main catalysts of adoption.
Today instant messaging and social media applications such as WhatsApp and
Facebook are common and most popular applications that can be found in any
smartphone and that drives the user interest to smartphones. The popularity of these
Page | 86
applications was raised by the ability to provide easy to use and cost effective instant
communication everywhere as long as one has an Internet connection. The inclusion
of voice and video calling services further strengthened their global dominance over
the conventional short message service (SMS), voice and video calling. This further
provided an indication that for advanced applications and services to also gain
popularity among broadband users, they should be developed in way that will provide
tangible benefits to users.
5.2.4 Low-income households use broadband at home
The data presented in Figure 24 showed that although the majority of participants
(56%) indicated that they had access to broadband at home, 30% of participants also
had access to broadband at public facilities. This observation suggested that public
facilities did play a critical role in providing access to broadband for low-income
households. The availability of Wi-Fi hot spots at public parks, schools, libraries and
other public facilities provided much needed broadband access infrastructure to low-
income households. This is characterised by the success of the Tshwane free Wi-Fi
project as further outlined in Section 5.2.6.
5.2.5 Low-income households are prepaid users
Recalling from Section 4.3.4 specifically Figure 23, it emerged that the majority of
participants preferred pre-paid as a method of paying for broadband access.
Participants associated post-paid with high cost because of the mandatory monthly
subscription fees and lack of control over data usage. The dominant prepaid market
was not a surprise as research has shown that 80% of mobile phone users in South
Africa are on prepaid (ICASA, 2016). This trend is likely to continue for many more
years to come because prepaid services provide users with the freedom to vary and
control their spending on data bundles depending on how much they can afford. It
also offers ease of porting or changing service providers (i.e. users do not have to wait
for contracts to expire or pay penalties to port to a new service provider). This has
created a highly dynamic and competitive environment which has compelled service
providers to respond quickly with products that are attractive to the prepaid market.
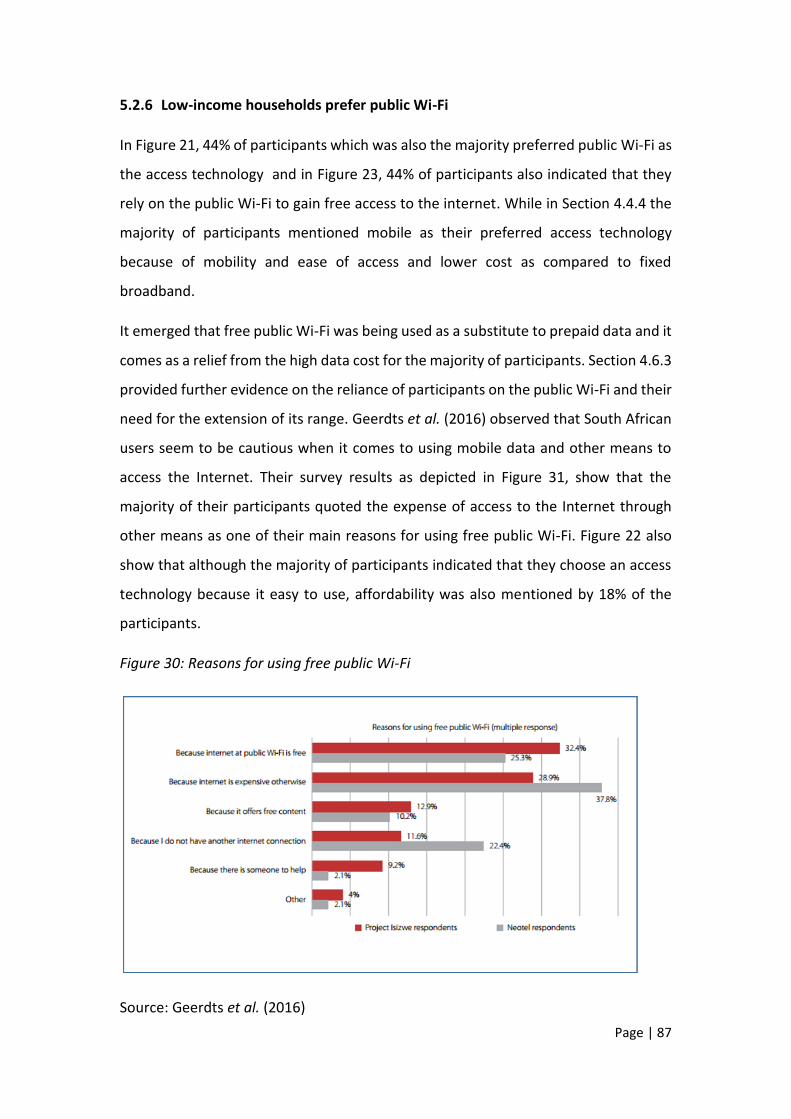
Page | 87
5.2.6 Low-income households prefer public Wi-Fi
In Figure 21, 44% of participants which was also the majority preferred public Wi-Fi as
the access technology and in Figure 23, 44% of participants also indicated that they
rely on the public Wi-Fi to gain free access to the internet. While in Section 4.4.4 the
majority of participants mentioned mobile as their preferred access technology
because of mobility and ease of access and lower cost as compared to fixed
broadband.
It emerged that free public Wi-Fi was being used as a substitute to prepaid data and it
comes as a relief from the high data cost for the majority of participants. Section 4.6.3
provided further evidence on the reliance of participants on the public Wi-Fi and their
need for the extension of its range. Geerdts et al. (2016) observed that South African
users seem to be cautious when it comes to using mobile data and other means to
access the Internet. Their survey results as depicted in Figure 31, show that the
majority of their participants quoted the expense of access to the Internet through
other means as one of their main reasons for using free public Wi-Fi. Figure 22 also
show that although the majority of participants indicated that they choose an access
technology because it easy to use, affordability was also mentioned by 18% of the
participants.
Figure 30: Reasons for using free public Wi-Fi
Source: Geerdts et al. (2016)
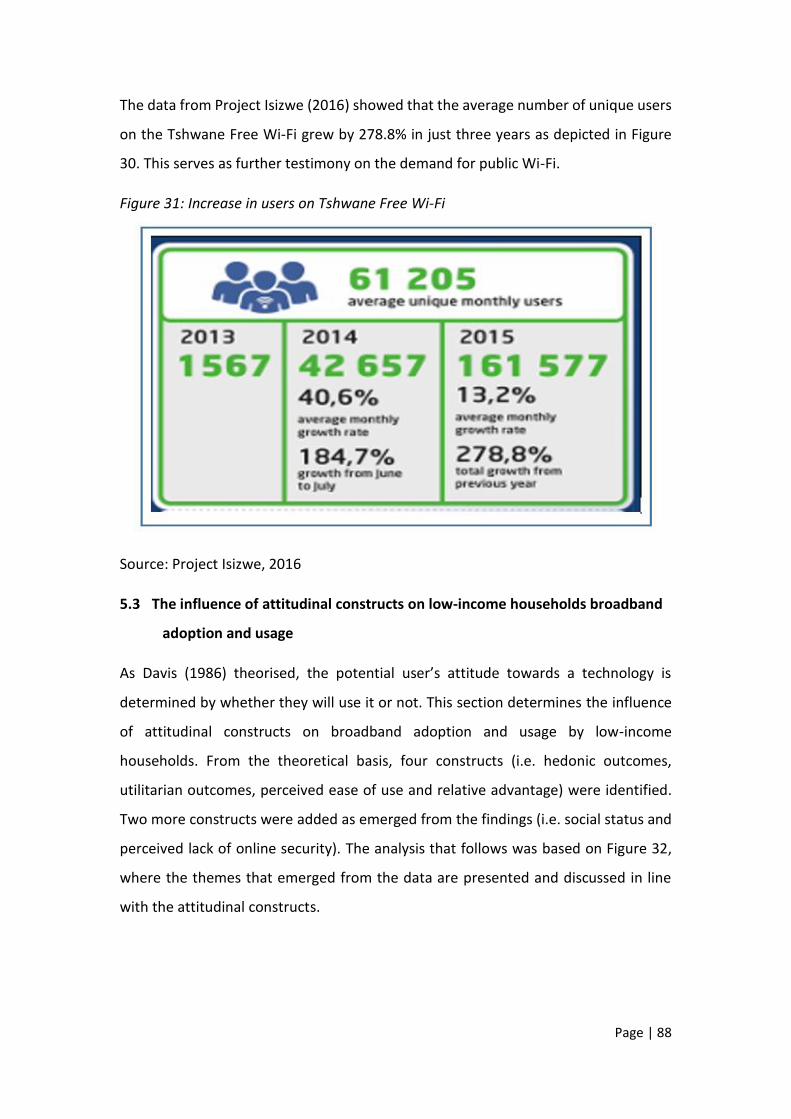
Page | 88
The data from Project Isizwe (2016) showed that the average number of unique users
on the Tshwane Free Wi-Fi grew by 278.8% in just three years as depicted in Figure
30. This serves as further testimony on the demand for public Wi-Fi.
Figure 31: Increase in users on Tshwane Free Wi-Fi
Source: Project Isizwe, 2016
5.3 The influence of attitudinal constructs on low-income households broadband
adoption and usage
As Davis (1986) theorised, the potential user’s attitude towards a technology is
determined by whether they will use it or not. This section determines the influence
of attitudinal constructs on broadband adoption and usage by low-income
households. From the theoretical basis, four constructs (i.e. hedonic outcomes,
utilitarian outcomes, perceived ease of use and relative advantage) were identified.
Two more constructs were added as emerged from the findings (i.e. social status and
perceived lack of online security). The analysis that follows was based on Figure 32,
where the themes that emerged from the data are presented and discussed in line
with the attitudinal constructs.
Page | 89
Figure 32: Attitudinal constructs analysis diagram
Source: Researcher (2018)
5.3.1 Broadband is both entertainment and a utility
Hedonic outcomes represent the pleasure derived from the use of a product or service
while utilitarian outcomes are the degree at which the use of such product or service
enhances the effectiveness of executing important activities (Venkatesh & Brown,
2001). Previous research has identified hedonic and utilitarian outcomes as key
determinants for adoption of broadband in households (Choudrie & Dwivedi, 2004;
Choudrie & Dwivedi, 2006; Naidoo, 2011; Seymour, 2012).
From the collected data, it emerged that participants found it difficult to set a clear
distinction on whether broadband is an entertainment or productivity tool. Their
motivation seemed to be driven by how broadband meets their needs for both
entertainment and productivity based on their past experience. While broadband was
regarded as an essential tool for communication, access to educational material and
buying and selling of goods and services online, it was also found to be equally vital
for downloading, sharing and consumption of content such as music and videos.
Page | 90
The results were consistent with those of Adams, Farrell, Dalgarno, and Oczkowski
(2017) who argued that household users will look for a technology that will provide
both entertainment as well as productivity in line with their current needs and past
experience without setting a distinction between productivity and entertainment. The
authors therefore proposed “lifestyle compatibility” as a single measure that includes
both utilitarian and hedonic outcomes. This also supports the measure proposed by
Rogers (1983) of “compatibility” which was later affirmed by Moore and Benbasat
(1991). The measure refers to the degree to which an innovation is consistent with
the potential adopter’s existing values, past experience and needs.
However it must be borne in mind that the majority of broadband adoption models
insist in treating hedonic and utilitarian outcomes as separate measures (Choudrie &
Dwivedi, 2004; Choudrie & Dwivedi, 2006; Dwivedi et al., 2010; Naidoo, 2011). A
possible explanation for this might be entrenched in the origins of these constructs in
the context of measuring IT adoption by households. Venkatesh & Brown (2001)
proposed these constructs for PC adoption in households. Their view was that a PC
has the potential to provide both hedonic and utilitarian outcomes to household users
but the aim was to measure which one will mostly influence the behaviour to adopt.
Due to the technological advancements since the introduction of the PC and the
introduction of broadband, it can be argued that user’s expectations have changed.
Hence different measures are necessary to determine their motivation for adopting
the technology.
5.3.2 Conflicting views on the ease of use of broadband
Davis (1986) defines perceived ease of use as "the degree to which an individual
believes that using a particular system would be free of physical and mental effort”
(Davis, 1986, p. 26). Literature indicates that people are more likely to have a positive
attitude toward adopting and using a technology if they believe that it is easy to use
(Davis, 1986; Venkatesh & Davis, 2000). From these theoretical basis, it was envisaged
that the behaviour of low-income household users to adopt and use broadband will
be affected by the extent to which they perceive broadband to be easy to use.
Page | 91
The data did not provide a conclusive view on whether the participants perceived
broadband to be easy or difficult to use. The convolution arose from the impact of
other demographics such as age, level of education, gender, and skills. The data
suggested that age, the level of education attainment and lack of e-skills are the
divisive factors that determined the perceived ease of use of broadband in low-
income households. It is important to note that since income level was the focal
demographic for this study, other demographics were not considered as motivational
factors but rather moderators to the motivational factors as outlined in the discussion
of the UTAUT in Section 2.9.
However, Venkatesh at el. (2003) outline the importance of moderators towards the
determination of behavioural intention. Dwivedi and Lal (2007) also found that the
majority of broadband adopters in the UK were the youth and the middle aged, who
had higher levels of educational attainment, higher household annual income, and
were male. Hence it is important to target moderators when the aim is to improve
motivation in order to change behaviour.
Since some demographics such as age and gender cannot be altered, and others like
annual household income are highly dependent on external factors such as
economics, the easier option for most countries to influence the perception of citizens
on broadband is through education. Kim et al. (2010) recognise awareness, ICT skills
development and digital literacy as one of the key components that facilitated
broadband demand in Korea.
In the South African context, both the SA Connect and the National e-strategy calls for
the development of e-skills in three tiers, namely: the integration of ICT in teaching
and learning in basic and higher education curriculums (the integration in this instance
refers to ICT being used as a tool to deliver other subject contents and ICT as a subject),
ICT skills development to build work force capacity in related sectors, and conducting
awareness and e-literacy campaigns to ensure that citizens in general have the
requisite skills to use ICT.
Page | 92
5.3.3 Device choice is all about status
Rogers (1983) provided that social status is an inherent aspect of adopting an
innovation. In fact, he maintained that for certain innovations (e.g. fashion), social
status can be the only benefit the adopter will enjoy. Rogers added that the adoption
of all highly visible innovations is likely to be status motivated.
Social status was found to be an influential factor on the attitude of the participants
towards the adoption of broadband. The finding yielded that some participants chose
certain broadband products and services to attain social recognition. Participants
referred to a practice where they will prefer certain brands or types of devices only
because they are associated with a certain status in society (e.g. wealth and fashion).
In this instance, less consideration was made towards other aspects such as features
and cost.
In a seminal piece of work, Moore and Benbasat (1991) observed that social status
was generally regarded as part of relative advantage by most researchers. They
proposed a standalone construct and referred to it as “image” to measure “the degree
to which use of an innovation is perceived to enhance one’s image or status in one’s
social system” (Moore & Benbasat, 1991, p. 195). In subsequent research, Venkatesh
and Brown (2001) later proposed “social outcomes” as part of attitudinal belief. They
defined the construct as the “recognition that would be achieved as a result of
adopting an innovation…” which “may lead to an elevation in power, knowledge,
and/or status if the decision is thought by others to be a good one” (Venkatesh &
Brown, 2001, p. 74).
However, the construct was considered irrelevant by Choudrie and Dwivedi (2004)
based on the argument that broadband was not a directly observable product. This
view might have been motivated by the definition of broadband that the authors
adopted for their study. Since their definition was only limited to connection data
transfer speed, end-user devices were not considered as part of their definition of
broadband adoption. But the definition of broadband that was adopted for this study
encompasses end-user devices as part of the broadband ecosystem. Therefore,
broadband cannot be regarded as a non-observable product.
Page | 93
5.3.4 Perceived lack of online security and privacy
Online security and privacy are seldom considered as factors in broadband adoption
and usage studies. Albeit being important considerations for users with a potential to
define their attitude towards the adoption and use of broadband. These factors are
not considered in most broadband adoption models (Naidoo, 2011). The perception
of users on how secure the use of broadband is and the level of surety that their
private data is protected can have an impact on their attitude to use broadband for
security sensitive activities such as online shopping and banking (Naidoo, 2011).
The data suggested that online security and privacy, as a construct, had an influence
on the behaviour of low-income households towards the use of broadband. It was
observed that low-income household users perceived the use of broadband as less
secure and lacked privacy. The common view was there is no guarantee that if they
share their data online it will be kept secure. Participants also felt that their online
activities are being monitored. The finding also concurs with that of Brown et al.
(2009) that there is a general concern about online security among South African
Internet users.
However, Naidoo (2011) observed that knowledgeable users were generally satisfied
with the level of security provided by their Internet service providers. Hence a closer
look into the matter revealed that the concerns about privacy and security were
influenced by the lack of awareness on how to stay safe online and how broadband or
the Internet functions beyond the devices and network connections. There was
anxiety due to users not knowing who owns the infrastructure that is used to transmit
and store their personal information. There were also concerns about who else has
access to their information when it is online? What do they do with it? And who is
watching what they do online? Thomson, von Solms and Louw (2006) identified lack
of knowledge as the major contributor to unsafe online user behaviour.
The RSA (2016) stated that as mobile platforms are becoming dominant for instant
communication, banking and commerce, they have also become new targets for
cybercriminals. As illustrated in Figure 33, mobile and other non-PC platforms are
particularly vulnerable to cyberattacks because they are less secure (RSA, 2016). This
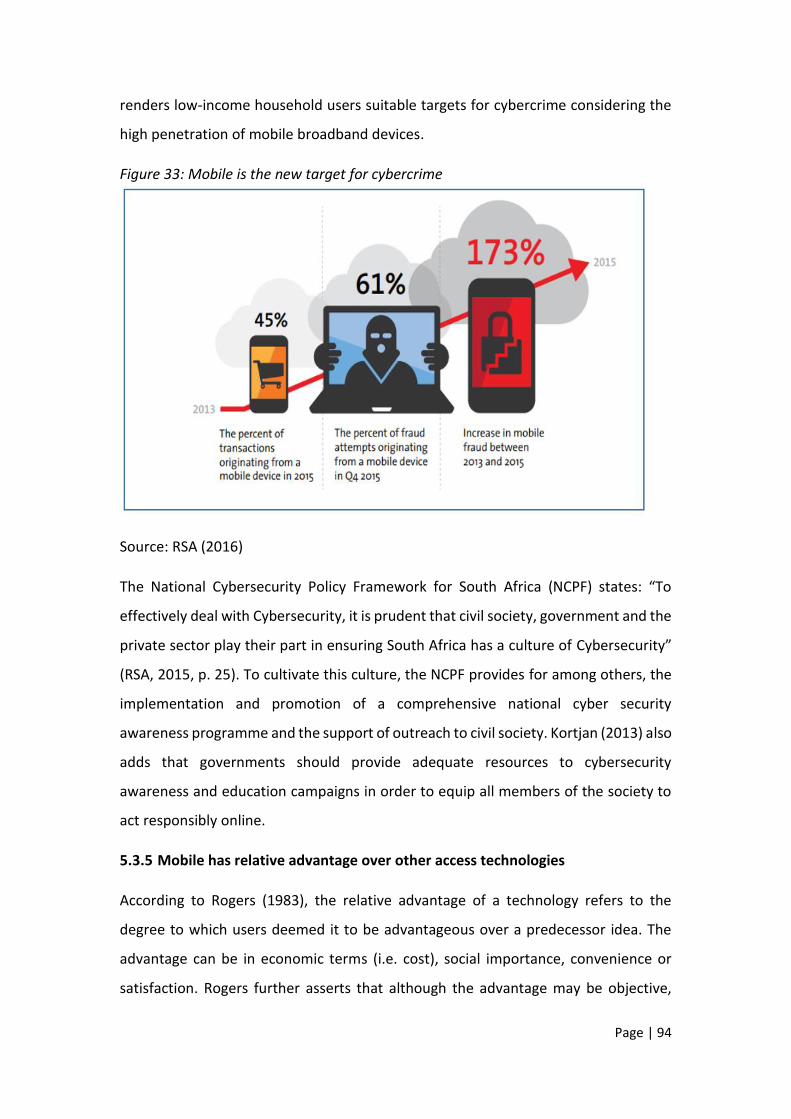
Page | 94
renders low-income household users suitable targets for cybercrime considering the
high penetration of mobile broadband devices.
Figure 33: Mobile is the new target for cybercrime
Source: RSA (2016)
The National Cybersecurity Policy Framework for South Africa (NCPF) states: “To
effectively deal with Cybersecurity, it is prudent that civil society, government and the
private sector play their part in ensuring South Africa has a culture of Cybersecurity”
(RSA, 2015, p. 25). To cultivate this culture, the NCPF provides for among others, the
implementation and promotion of a comprehensive national cyber security
awareness programme and the support of outreach to civil society. Kortjan (2013) also
adds that governments should provide adequate resources to cybersecurity
awareness and education campaigns in order to equip all members of the society to
act responsibly online.
5.3.5 Mobile has relative advantage over other access technologies
According to Rogers (1983), the relative advantage of a technology refers to the
degree to which users deemed it to be advantageous over a predecessor idea. The
advantage can be in economic terms (i.e. cost), social importance, convenience or
satisfaction. Rogers further asserts that although the advantage may be objective,
Page | 95
what matters is the perception of the potential users which drives their attitude
toward the technology. Therefore, the greater the relative advantage of a technology,
the higher its adoption rate will be.
Relative advantage is commonly found to be an influential factor to user’s attitude
and it is featured in the majority of models and theories in IT adoption literature
(Choudrie & Dwivedi, 2004; Choudrie & Dwivedi, 2006; Naidoo, 2011; Seymor, 2012).
However, the premise has always been to compare newer technologies with their
predecessors (e.g. broadband versus narrowband). This might be considered as
investigating the obvious since innovators and technology developers will always seek
to include improvements in newer technologies to provide advantage over their
predecessors in order to guarantee success in the market.
The approach that was taken for this study was to investigate relative advantage
between broadband access technologies. The data suggested that low-income
household users prefer mobile broadband over other access technologies (i.e. fixed
and fixed-wireless). Due to mobility, low input and subscription cost (no installation
and line rental charges) and being ubiquitous, mobile was regarded to have a
significant relative advantage over fixed broadband.
Although public Wi-Fi was also favoured by some participants, it was still not
considered as a viable alternative but rather a supplement to mobile broadband. This
was due to it being accessible only at hotspots around public parks, municipal facilities
and public schools. The usage limit set per user device and the low data transfer speed
due to high traffic during peak hours were also mentioned as limitations to the public
Wi-Fi.
This finding supported the observation made by Ramosolo (2014) that users in the
townships preferred mobile broadband over ADSL as a cheaper and always available
option. Moroeng (2011) also affirmed that South African users preferred mobile
broadband because it offered an always on connection with multimedia capabilities
everywhere they go.
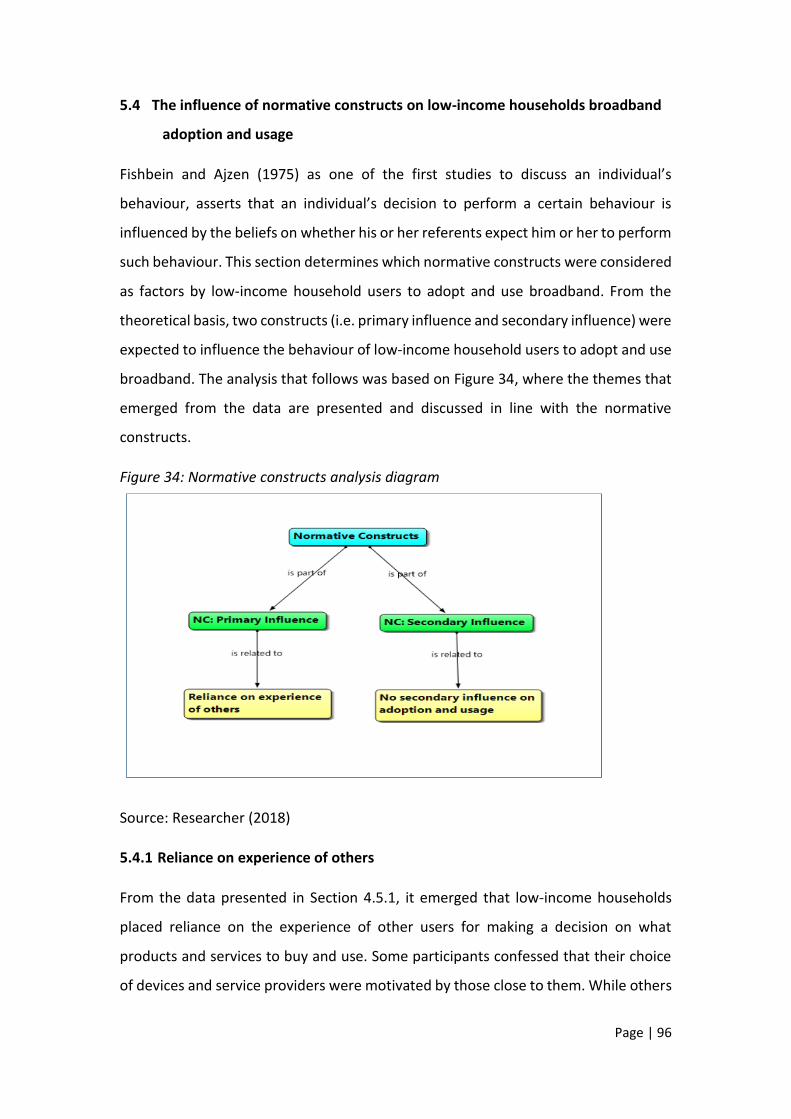
Page | 96
5.4 The influence of normative constructs on low-income households broadband
adoption and usage
Fishbein and Ajzen (1975) as one of the first studies to discuss an individual’s
behaviour, asserts that an individual’s decision to perform a certain behaviour is
influenced by the beliefs on whether his or her referents expect him or her to perform
such behaviour. This section determines which normative constructs were considered
as factors by low-income household users to adopt and use broadband. From the
theoretical basis, two constructs (i.e. primary influence and secondary influence) were
expected to influence the behaviour of low-income household users to adopt and use
broadband. The analysis that follows was based on Figure 34, where the themes that
emerged from the data are presented and discussed in line with the normative
constructs.
Figure 34: Normative constructs analysis diagram
Source: Researcher (2018)
5.4.1 Reliance on experience of others
From the data presented in Section 4.5.1, it emerged that low-income households
placed reliance on the experience of other users for making a decision on what
products and services to buy and use. Some participants confessed that their choice
of devices and service providers were motivated by those close to them. While others
Page | 97
held a view that when a new product or service was launched in the market, it was
always best to wait and learn from others before they tried it.
Primary influence is the social pressure that is exerted to a potential adopter of a
technology by friends and family (Dwivedi, et al., 2010). Early adopters of a technology
will influence future adopters through word-of-mouth and referrals, while also more
often future adopters will wait for the technology to be proven and well-settled in the
market before making a commitment (Venkatesh & Brown, 2001). Rogers (1983) also
proposed that “the observability of an innovation, as perceived by members of a social
system, is positively related to its rate of adoption” (Rogers, 1983, p. 232). Therefore,
if potential adopters see more people around them using a technology and they can
clearly observe the benefits, they are more likely to also adopt it (Moore & Benbasat,
1991).
The concept of eWOM as discussed in Section 1.3 refers to the sharing of consumption
experience by consumers using Internet-based communication (Vimaladevi &
Dhanabhakaym, 2012; Elwalda & Lu, 2014). Studies show that there is a positive
relationship between eWOM and product sales (Duan, et al, 2008; Vimaladevi &
Dhanabhakaym, 2012; Elwalda & Lu, 2014). Power Reviews (2016) showed that other
than the variety of products, free shipment and better deals, 55% of Amazon online
shoppers regard reviews, as the most important aspect of their shopping experience.
The report further reveals that 61% of these shoppers always consult reviews before
making their decision on a product and 92% of them finalise the purchase online.
5.4.2 Secondary influence
Secondary influence refers to how individuals are influenced by other sources of
information such as media and advertising to adopt and use a technology (Dwivedi, et
al., 2010). Venkatesh and Brown (2001) argue that early adopters are less likely to be
influenced by friends and family since the information about the technology will not
be available in their social circles. Consequently, early adopters will learn about the
technology from secondary sources of information.
The data suggested that secondary influence did not have much influence on the
behaviour of low-income households to adopt and use broadband. This may be
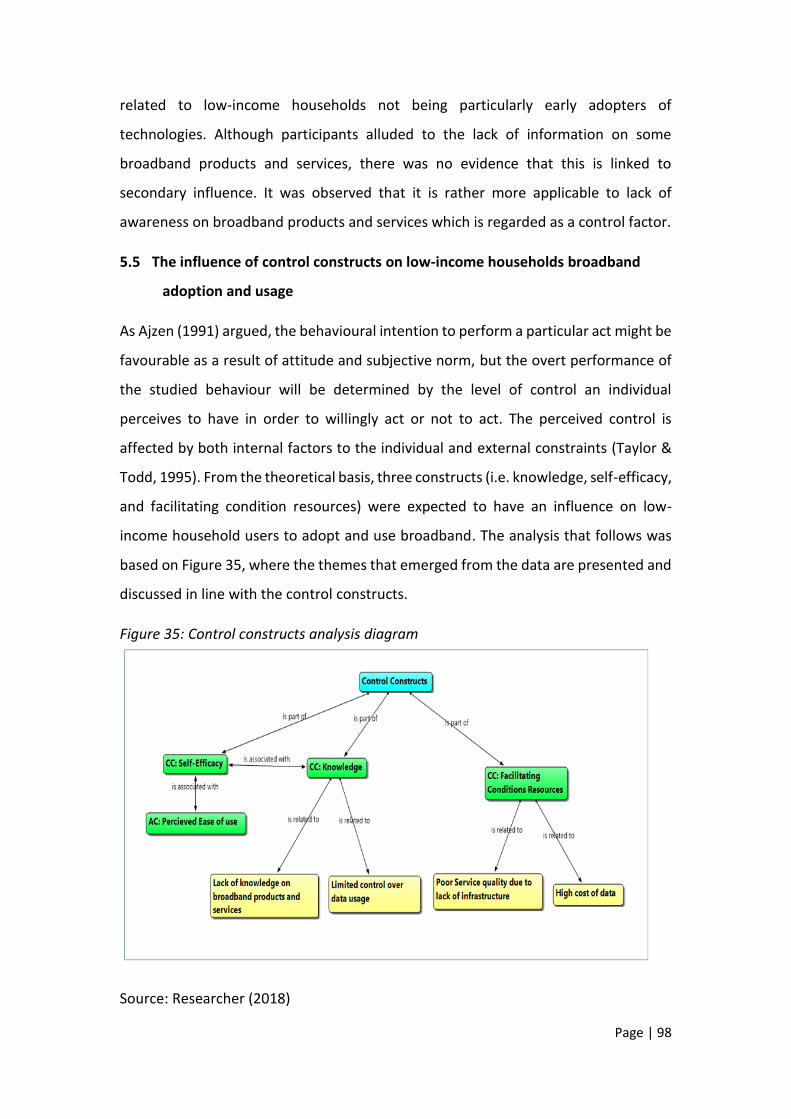
Page | 98
related to low-income households not being particularly early adopters of
technologies. Although participants alluded to the lack of information on some
broadband products and services, there was no evidence that this is linked to
secondary influence. It was observed that it is rather more applicable to lack of
awareness on broadband products and services which is regarded as a control factor.
5.5 The influence of control constructs on low-income households broadband
adoption and usage
As Ajzen (1991) argued, the behavioural intention to perform a particular act might be
favourable as a result of attitude and subjective norm, but the overt performance of
the studied behaviour will be determined by the level of control an individual
perceives to have in order to willingly act or not to act. The perceived control is
affected by both internal factors to the individual and external constraints (Taylor &
Todd, 1995). From the theoretical basis, three constructs (i.e. knowledge, self-efficacy,
and facilitating condition resources) were expected to have an influence on low-
income household users to adopt and use broadband. The analysis that follows was
based on Figure 35, where the themes that emerged from the data are presented and
discussed in line with the control constructs.
Figure 35: Control constructs analysis diagram
Source: Researcher (2018)
Page | 99
5.5.1 Knowledge
Knowledge construct can be considered from two aspects, namely: the knowledge
about the technology and its benefits (awareness) as well as requisite skills to use the
technology (Choudrie & Dwivedi, 2004). The view is that potential adopters are less
likely to adopt a technology if they are not aware of its availability and benefits or if
they lack requisite knowledge on how to use it (Choudrie & Dwivedi, 2004).
5.5.1.1 Lack of knowledge on broadband products and services
While it was observed that the majority of low-income household users were aware
of most broadband products and service, it was discovered that some low-income
household users believe that they do not receive similar access and information on
broadband products and services as compared to users in more affluent communities.
This led to them not knowing about the availability of new products and services
offerings.
It is important to note that it is not uncommon for service providers to launch certain
products and services based on market segments in the ICT industry. Aligned with
Roger (1983)’s diffusion of innovation theory, high-income users may be associated
with early adopters of an innovation and low-income users with late adopters and
laggards. This is attributed to the inherent high cost of products and services when
they are initially launched in the market (Venkatesh & Brown, 2001). Therefore,
service providers will focus their marketing efforts on high-income users during the
initial stages of diffusion.
This is evident through the trend followed by service providers in rolling out
technologies such as FTTH in South Africa. Figures 36 and 37 below are snapshots of
FTTH availability maps in Soshanguve as of July 2017. The pictures were taken from
Telkom SA and Vumatel websites respectively, which were the most competitive
players in the rollout of FTTH. From the maps, it was evident that low-income
households in Soshanguve were not target areas for rollout of new broadband
technologies such as FTTH.
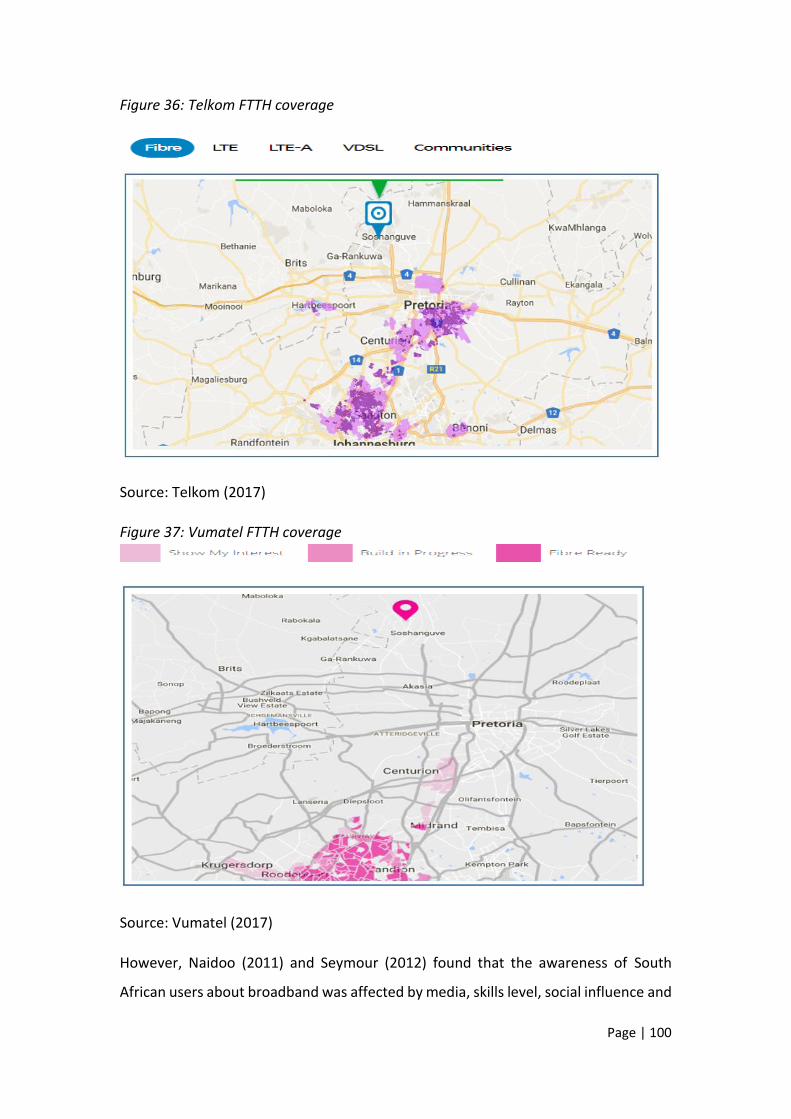
Page | 100
Figure 36: Telkom FTTH coverage
Source: Telkom (2017)
Figure 37: Vumatel FTTH coverage
Source: Vumatel (2017)
However, Naidoo (2011) and Seymour (2012) found that the awareness of South
African users about broadband was affected by media, skills level, social influence and
Page | 101
the following of trends. Both authors also observed that non-adopters who were not
aware of broadband and its benefits associated their lack of awareness to them not
taking the necessary initiatives to find information about the technology. But these
findings were based on the assumption that there is seamless coverage of broadband
technology and equal dissemination of information in all communities.
5.5.1.2 Limited control over data usage
The collected data suggested that some low-income household users admitted to not
having control over their data usage. There were number of instances where
participants raised their frustrations on the issue of “disappearing data”. Participants
complained about quick an unjustified depletion of data on their devices. There was a
common belief that service providers are using complex billing methods to exploit
consumers into spending more on data.
At face value, it seemed like the matter was linked solely to the lack of knowledge on
how to use smartphones and manage data usage, as some participants admitted that
although they use broadband devices and applications, they still do not know much
about certain features. Not all participants were aware that applications can be
restricted to run, refresh and update in the background through the proper settings
on their devices. Moreover, service providers also put the blame on consumers for not
taking control and monitoring the usage of data on their devices and recommended
measures such as disabling mobile data when not in use, disabling application auto
updates, avoiding applications with advertisements, streaming of video in standard
definition and the use of Wi-Fi to download and upload big files and to perform
software updates.
However, as it appeared from the results of an experiment conducted by
Mybroadband (2017), some of the allegations made by users about disappearing data
were not completely unfounded. The experiment revealed that MTN was charging or
deducting data from its subscribers for LTE connection setup messages. These are
default handshake data messages between the user device and the network to
establish a data connection before the user starts the actual transmission which
should be at no charge to the user as other service providers indicated.
Page | 102
5.5.2 Facilitating conditions resources
Venkatesh et al. (2003) define facilitating conditions “as the degree to which an
individual believes that an organisational and technical infrastructure exists to support
use of the system” (Venkatesh et al., 2003, p. 453). Taylor and Todd (1995) argue that
from an IT usage perspective, facilitating conditions provides two dimensions, namely:
resources (which includes time and money) and the availability of compatible
technology that allows the user easy access (conditions). Hence the lack of facilitating
conditions resources will constrain adoption and usage of a technology (Taylor &
Todd, 1995).
5.5.2.1 Poor Service quality due to lack of infrastructure
The fact that participants reported mobile broadband coverage to be sporadic with
poor service reception and low data transfer speed, suggested that there was
insufficient network infrastructure in their communities to provide seamless mobile
broadband coverage and capacity. From these responses, it was determined that
there was no sufficient investment in upgrading and provisioning of broadband
infrastructure in low-income communities.
Service quality was proposed by Choudrie & Dwivedi (2004) as a measure of user’s
satisfaction with their current service provider. The authors hypothesised that users
are more likely to continue their subscription with a service provider if they perceive
the service quality to be satisfactory.
The South African Customer Satisfaction Index (SAcsi) reported that the South African
mobile broadband average satisfaction score has been declining in the past three
years. Consumers provided a score of 76.7 out of 100 in 2014 which decreased to 75.4
in 2015 and further declined to 68.2 in 2016. Low broadband speed and unreliable
service was listed among the key contributors to dissatisfaction (SAcsi, 2016).
The Akamai (2016) further indicated that South Africa was ranked 80th in the world
with an average connection speed of 6 Mbps. Furthermore, a study by Chetty,
Sundaresan, Muckaden, Feamster, and Calandro (2013) found that low data
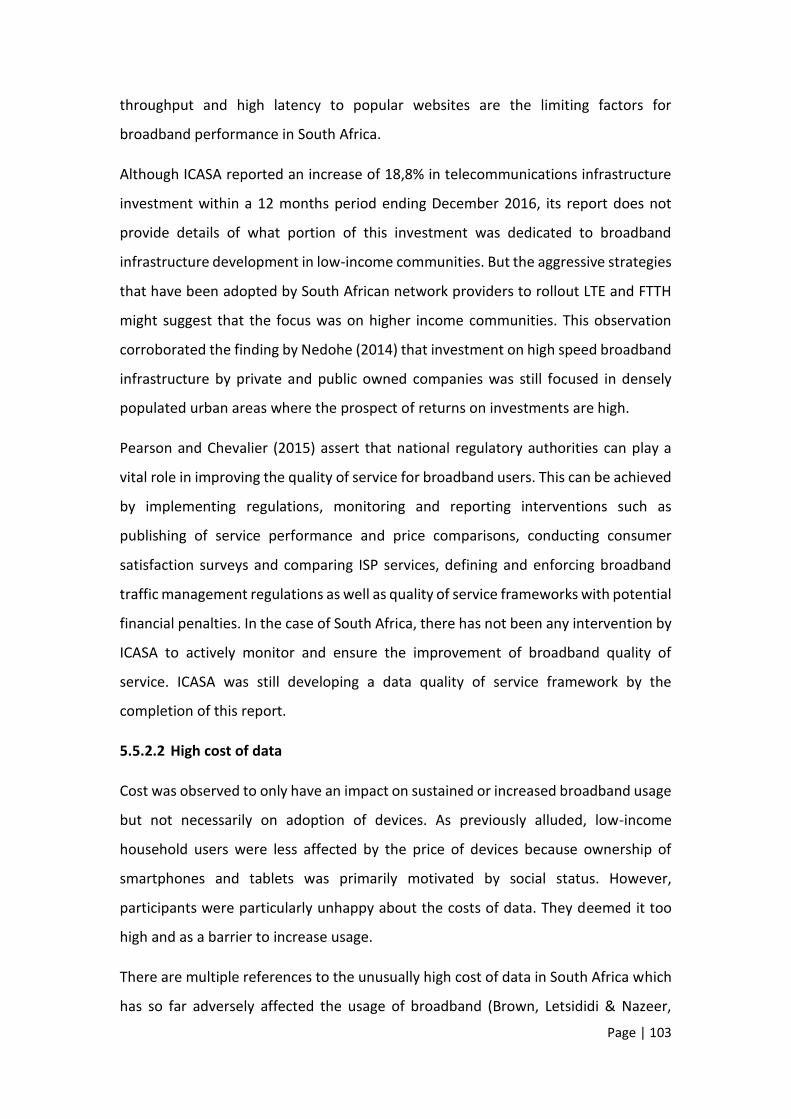
Page | 103
throughput and high latency to popular websites are the limiting factors for
broadband performance in South Africa.
Although ICASA reported an increase of 18,8% in telecommunications infrastructure
investment within a 12 months period ending December 2016, its report does not
provide details of what portion of this investment was dedicated to broadband
infrastructure development in low-income communities. But the aggressive strategies
that have been adopted by South African network providers to rollout LTE and FTTH
might suggest that the focus was on higher income communities. This observation
corroborated the finding by Nedohe (2014) that investment on high speed broadband
infrastructure by private and public owned companies was still focused in densely
populated urban areas where the prospect of returns on investments are high.
Pearson and Chevalier (2015) assert that national regulatory authorities can play a
vital role in improving the quality of service for broadband users. This can be achieved
by implementing regulations, monitoring and reporting interventions such as
publishing of service performance and price comparisons, conducting consumer
satisfaction surveys and comparing ISP services, defining and enforcing broadband
traffic management regulations as well as quality of service frameworks with potential
financial penalties. In the case of South Africa, there has not been any intervention by
ICASA to actively monitor and ensure the improvement of broadband quality of
service. ICASA was still developing a data quality of service framework by the
completion of this report.
5.5.2.2 High cost of data
Cost was observed to only have an impact on sustained or increased broadband usage
but not necessarily on adoption of devices. As previously alluded, low-income
household users were less affected by the price of devices because ownership of
smartphones and tablets was primarily motivated by social status. However,
participants were particularly unhappy about the costs of data. They deemed it too
high and as a barrier to increase usage.
There are multiple references to the unusually high cost of data in South Africa which
has so far adversely affected the usage of broadband (Brown, Letsididi & Nazeer,
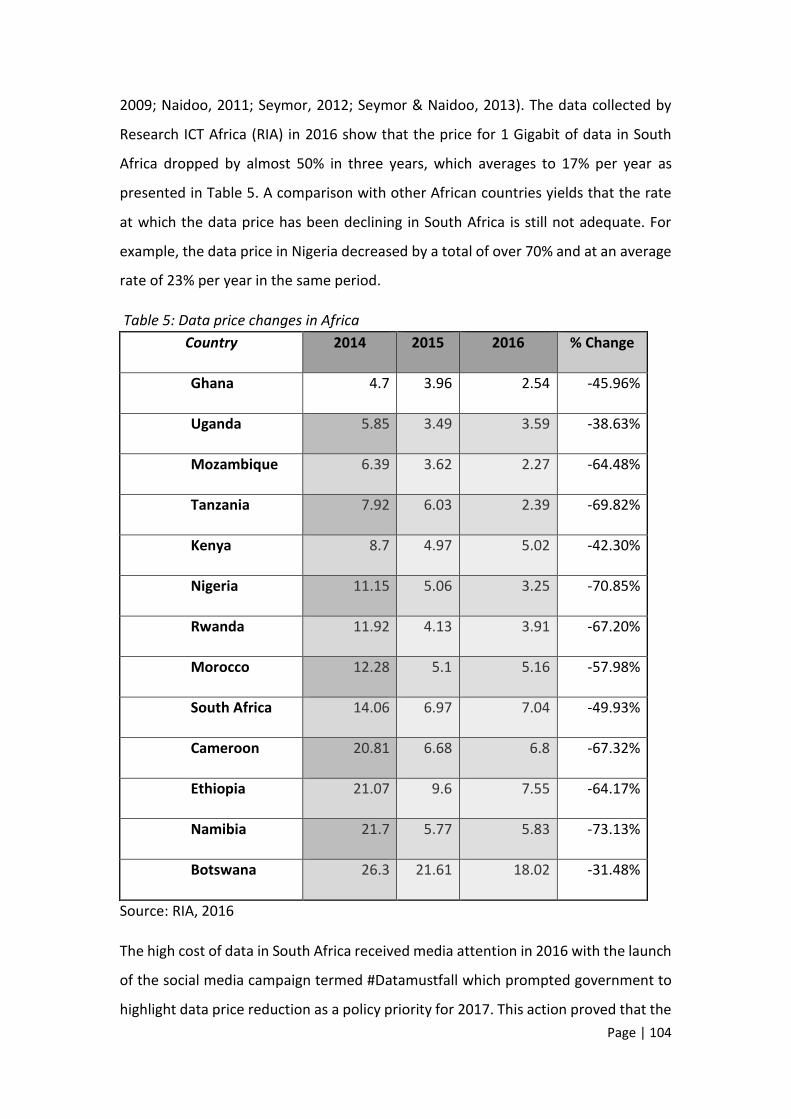
Page | 104
2009; Naidoo, 2011; Seymor, 2012; Seymor & Naidoo, 2013). The data collected by
Research ICT Africa (RIA) in 2016 show that the price for 1 Gigabit of data in South
Africa dropped by almost 50% in three years, which averages to 17% per year as
presented in Table 5. A comparison with other African countries yields that the rate
at which the data price has been declining in South Africa is still not adequate. For
example, the data price in Nigeria decreased by a total of over 70% and at an average
rate of 23% per year in the same period.
Table 5: Data price changes in Africa
Country 2014 2015 2016 % Change
Ghana 4.7 3.96 2.54 -45.96%
Uganda 5.85 3.49 3.59 -38.63%
Mozambique 6.39 3.62 2.27 -64.48%
Tanzania 7.92 6.03 2.39 -69.82%
Kenya 8.7 4.97 5.02 -42.30%
Nigeria 11.15 5.06 3.25 -70.85%
Rwanda 11.92 4.13 3.91 -67.20%
Morocco 12.28 5.1 5.16 -57.98%
South Africa 14.06 6.97 7.04 -49.93%
Cameroon 20.81 6.68 6.8 -67.32%
Ethiopia 21.07 9.6 7.55 -64.17%
Namibia 21.7 5.77 5.83 -73.13%
Botswana 26.3 21.61 18.02 -31.48%
Source: RIA, 2016
The high cost of data in South Africa received media attention in 2016 with the launch
of the social media campaign termed #Datamustfall which prompted government to
highlight data price reduction as a policy priority for 2017. This action proved that the
Page | 105
high cost of broadband is affecting all users irrespective of income, which makes its
impact even more severe on low-income households.
Data prices are currently not regulated in South Africa. This has arguably been one of
the contributing factors to the slow decline in data cost. In 2016, the DTPS issued a
policy directive to ICASA to investigate data prices and competition in the ICT sector.
In March 2017, ICASA announced its plans to develop a framework for data prices
regulation.
5.5.3 Self-efficacy
Taylor and Todd (1995) defines self-efficacy as the perceived ability to perform an act.
A high level of self-efficacy means an individual has the confidence to use a technology
without any assistance (Dwivedi, Khoumbati, Williams, Lal, & Gharavi, 2007). The data
provided that although the majority of participants exhibited high levels of confidence
in using broadband, there were cases where self-efficacy was proven to be a limitation
for adoption and usage , particularly among elderly users.
Although it might not be uncommon for age as a moderating factor to be associated
with low confidence in using new technologies (Venkatesh at el., 2003), it was also
observed that there was a link between knowledge, perceived ease of use and self-
efficacy. The participants who lacked the relevant knowledge on the use of
broadband, perceived it to be difficult to use and exhibited relatively low levels of
confidence in using broadband without being aided by others.
Therefore, self-efficacy is not considered to have a direct influence on the behaviour
of low-income household users to adopt and use broadband because of its high
dependence on other motivational factors and moderators. This validated the
contention by Venkatesh and Brown (2001) that the lack of relevant knowledge has
an adverse impact on self-efficacy and further affirms the finding by Brown et al.
(2009) that a perception of ease of use lends credence to a high level of self-efficacy.
5.6 The relevance of broadband to the livelihood of low-income households
Rogers (1993) refers to consequences of innovations as the “changes that occur to an
individual or to a social system as a result of the adoption or rejection of an
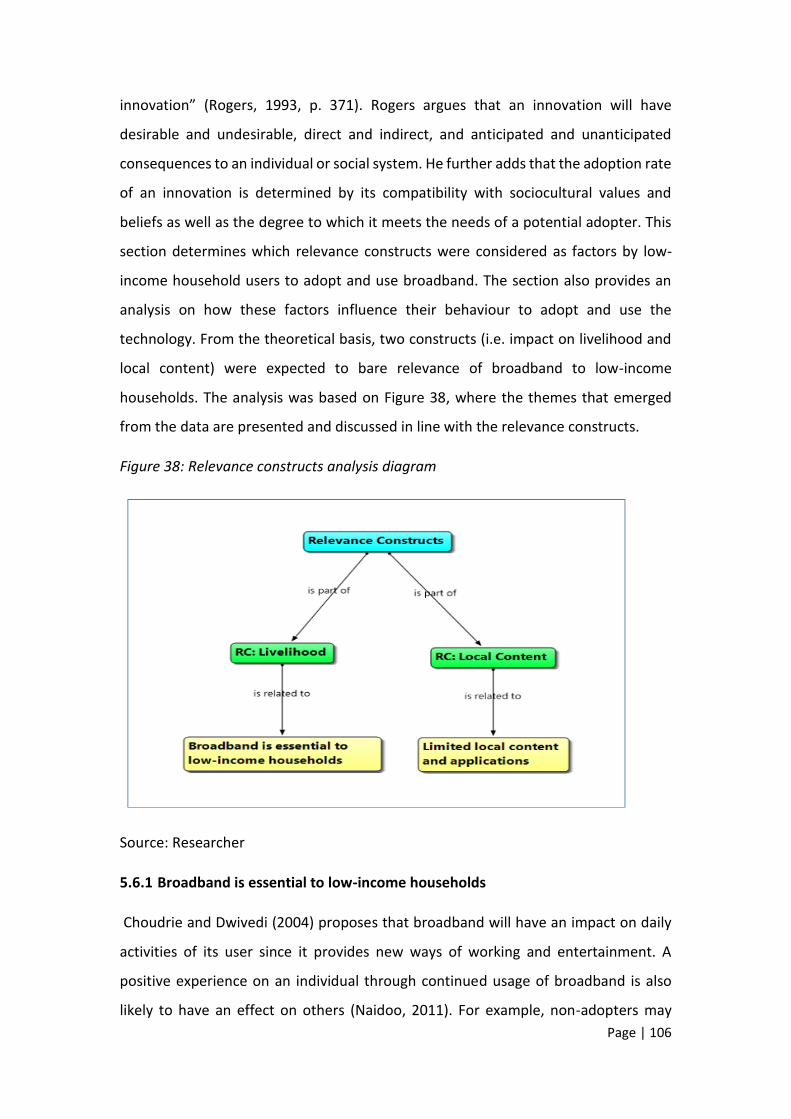
Page | 106
innovation” (Rogers, 1993, p. 371). Rogers argues that an innovation will have
desirable and undesirable, direct and indirect, and anticipated and unanticipated
consequences to an individual or social system. He further adds that the adoption rate
of an innovation is determined by its compatibility with sociocultural values and
beliefs as well as the degree to which it meets the needs of a potential adopter. This
section determines which relevance constructs were considered as factors by low-
income household users to adopt and use broadband. The section also provides an
analysis on how these factors influence their behaviour to adopt and use the
technology. From the theoretical basis, two constructs (i.e. impact on livelihood and
local content) were expected to bare relevance of broadband to low-income
households. The analysis was based on Figure 38, where the themes that emerged
from the data are presented and discussed in line with the relevance constructs.
Figure 38: Relevance constructs analysis diagram
Source: Researcher
5.6.1 Broadband is essential to low-income households
Choudrie and Dwivedi (2004) proposes that broadband will have an impact on daily
activities of its user since it provides new ways of working and entertainment. A
positive experience on an individual through continued usage of broadband is also
likely to have an effect on others (Naidoo, 2011). For example, non-adopters may
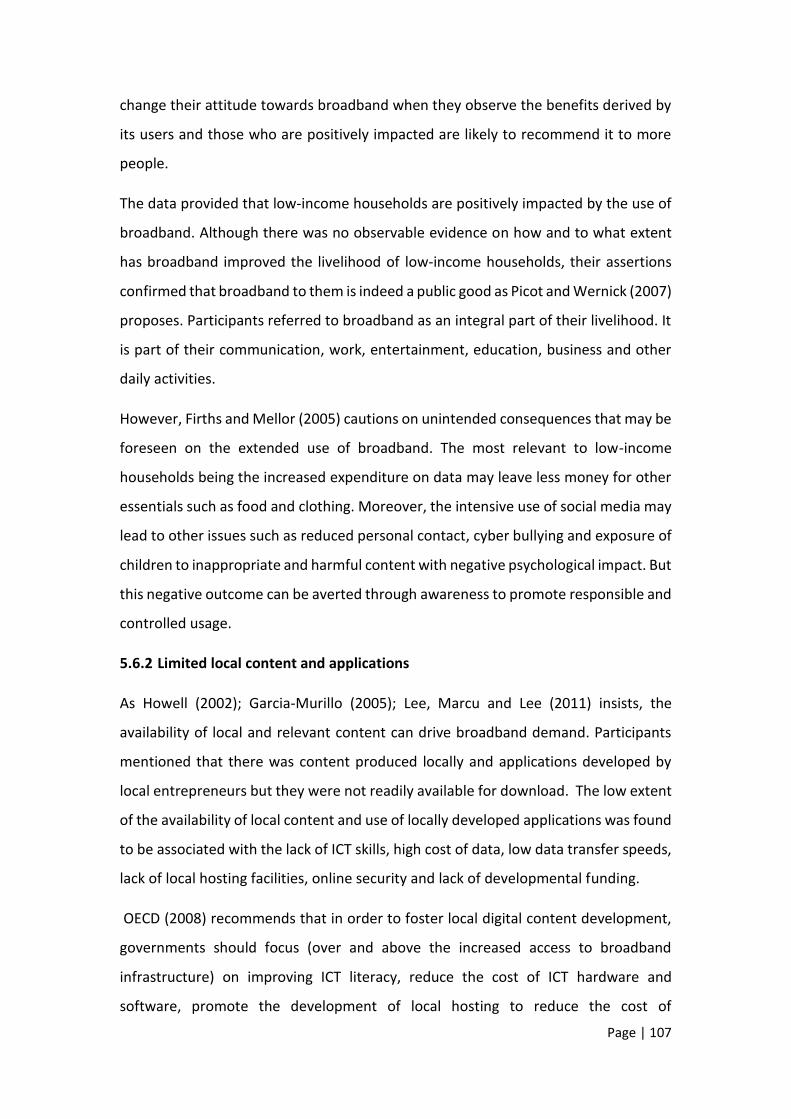
Page | 107
change their attitude towards broadband when they observe the benefits derived by
its users and those who are positively impacted are likely to recommend it to more
people.
The data provided that low-income households are positively impacted by the use of
broadband. Although there was no observable evidence on how and to what extent
has broadband improved the livelihood of low-income households, their assertions
confirmed that broadband to them is indeed a public good as Picot and Wernick (2007)
proposes. Participants referred to broadband as an integral part of their livelihood. It
is part of their communication, work, entertainment, education, business and other
daily activities.
However, Firths and Mellor (2005) cautions on unintended consequences that may be
foreseen on the extended use of broadband. The most relevant to low-income
households being the increased expenditure on data may leave less money for other
essentials such as food and clothing. Moreover, the intensive use of social media may
lead to other issues such as reduced personal contact, cyber bullying and exposure of
children to inappropriate and harmful content with negative psychological impact. But
this negative outcome can be averted through awareness to promote responsible and
controlled usage.
5.6.2 Limited local content and applications
As Howell (2002); Garcia-Murillo (2005); Lee, Marcu and Lee (2011) insists, the
availability of local and relevant content can drive broadband demand. Participants
mentioned that there was content produced locally and applications developed by
local entrepreneurs but they were not readily available for download. The low extent
of the availability of local content and use of locally developed applications was found
to be associated with the lack of ICT skills, high cost of data, low data transfer speeds,
lack of local hosting facilities, online security and lack of developmental funding.
OECD (2008) recommends that in order to foster local digital content development,
governments should focus (over and above the increased access to broadband
infrastructure) on improving ICT literacy, reduce the cost of ICT hardware and
software, promote the development of local hosting to reduce the cost of
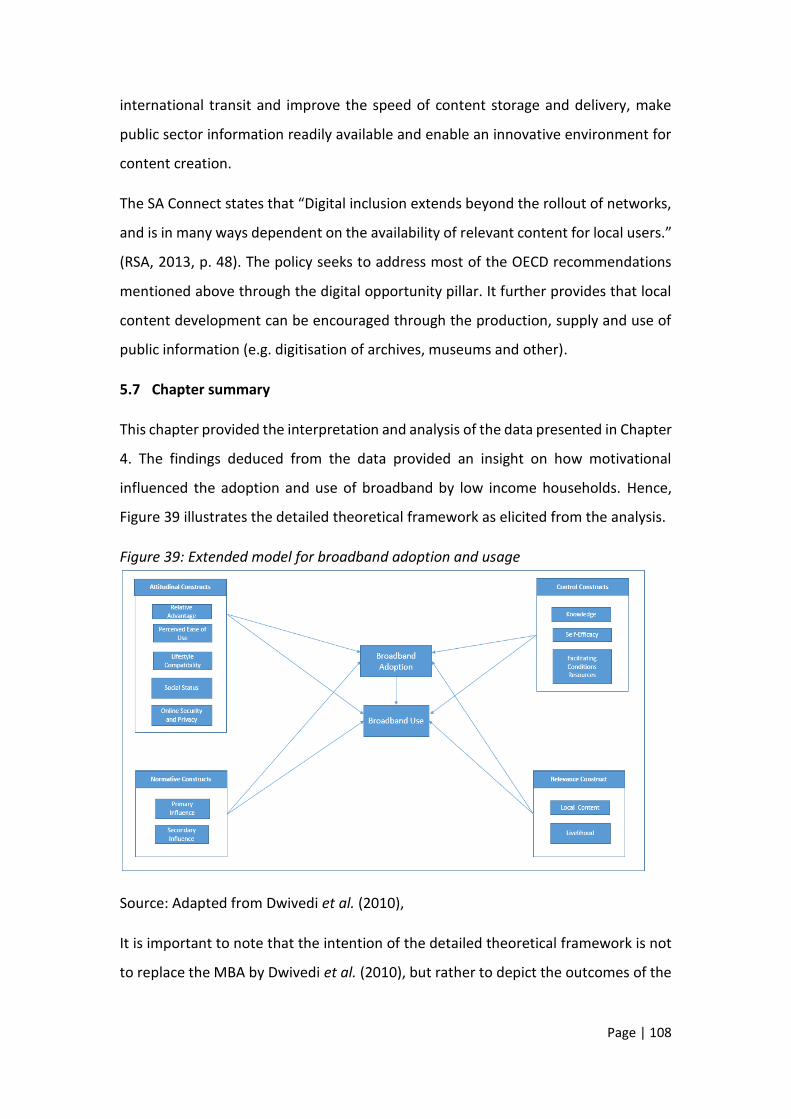
Page | 108
international transit and improve the speed of content storage and delivery, make
public sector information readily available and enable an innovative environment for
content creation.
The SA Connect states that “Digital inclusion extends beyond the rollout of networks,
and is in many ways dependent on the availability of relevant content for local users.”
(RSA, 2013, p. 48). The policy seeks to address most of the OECD recommendations
mentioned above through the digital opportunity pillar. It further provides that local
content development can be encouraged through the production, supply and use of
public information (e.g. digitisation of archives, museums and other).
5.7 Chapter summary
This chapter provided the interpretation and analysis of the data presented in Chapter
4. The findings deduced from the data provided an insight on how motivational
influenced the adoption and use of broadband by low income households. Hence,
Figure 39 illustrates the detailed theoretical framework as elicited from the analysis.
Figure 39: Extended model for broadband adoption and usage
Source: Adapted from Dwivedi et al. (2010),
It is important to note that the intention of the detailed theoretical framework is not
to replace the MBA by Dwivedi et al. (2010), but rather to depict the outcomes of the
Page | 109
studied setting and provide more insight on how motivational factors influence low-
income households to adopt and use broadband.
Page | 110
Chapter 6: A perspective on the influence of motivational factors on broadband
adoption and usage in low-income households
6.1 Introduction
This chapter relooks at the objectives of the study in line with the collected and
analysed data. It provides high level recommendations for policy makers, regulatory
authorities and service providers and also proposes future areas of research and
draws a conclusion for the study based on the findings. The MBA developed by
Dwivedi et al. (2010) provided a basis for the theoretical conceptual frameworks for
this study. The MBA was extended to include relevance constructs with the aim of
exploring the impact of broadband on the livelihood of low-income households and
the availability of local content to establish how they also influence adoption and
usage. Since technology adoption models such as the MBA only provides theoretical
frameworks, the results can be different if the model is applied in different settings as
detailed in sections 2.11 and 2.12. Hence the detailed extended MBA was derived
after the analysis of the collected data in Chapter 5.
6.2 Revisiting the objectives of the study
This study sought to provide an insight on how motivational factors including the
relevance of broadband collectively influence the behaviour of low-income
households to adopt and use broadband. To achieve the latter, it was imperative to
first uncover how broadband is being utilised in low-income households. By grouping
the data into themes in line with the extended MBA and research sub-questions, more
insight was gained towards answering the main research question on how
motivational factors influence low-income households to adopt and use broadband.
The answers to the main research question adds on the existing knowledge to aid
policy makers, regulatory authorities and service providers to increase broadband
demand particularly in low-income communities.
6.3 Broadband usage in low-income households
Usage profile of low-income households was pursued through the collection and
analysis of data using a questionnaire that was handed to participants prior to the
Page | 111
focus group discussions. In determining the usage pattern of low-income households,
it was discovered that the majority of low-income households can be classified as basic
users. Although this might be the case, there is potential to introduce even more
advanced services and applications to assist low-income households to improve their
livelihood through broadband. Considering that the majority of participants regarded
themselves as frequent and progressive users, linked with the observation that the
majority of non-adopters indicated that they can consider adopting and using
broadband if it can improve their livelihoods, this can be used as a stepping stone by
online service providers such as banks, retailers and government to introduce
platforms were low-income households can interact seamlessly with their offerings.
6.4 Outcomes of the extended and applied theoretical framework
The extended MBA provided constructs pre-determined by Dwivedi et al. (2010) with
the addition of relevance constructs. The analysis of data showed that all the factors
(i.e. attitudinal, normative, control and relevance) influenced the behaviour of low-
income households to adopt and use broadband. The analysis also prompted the
updating of the theoretical framework presented in Chapter 2.
6.4.1 Attitude as a factor
The literature provided that the attitude that potential users develop towards a
technology will ultimately determine its adoption rate and usage (Rogers, 1983).
Literature also provides that attitude is a psychological factor that can be changed
through motivation or persuasion (Davis, 1985).
Since attitude forms the basis of technology adoption and usage, it was important to
consider its influence on low-income households to ascertain if it impedes or
promotes the adoption and usage of broadband. As the data analysis and presentation
revealed, there are multiple constructs that affect the attitude of low-income
households towards broadband. These constructs have the potential to influence the
attitude in both positive and negative ways.
The constructs that are observed to have positive influence on the attitude of low-
income households towards broadband are lifestyle compatibility, relative advantage
Page | 112
and social status. Lifestyle compatibility which is a construct that was realised through
combining hedonic and utilitarian outcomes also following the assertion by Adams et
al. (2017), served as the key deciding factor if broadband will provide the required
level of entertainment and productivity to enhance the life style of its users.
The relative advantage between broadband access technologies proved to be a
considerable attitude factor for low-income households. As it emerged, wireless
technologies that provide seamless connection and flexibility were more favoured
over fixed technologies. This may also be linked to the historical connotation and
seemingly the current trend where low-income communities are not considered as
viable markets for fixed broadband access technologies by service providers, leaving
low-income users with the belief that fixed broadband access technologies are
expensive and cumbersome to setup.
The social status that is gained by using certain devices provided a positive
contribution towards the attitude of low-income households about broadband.
Participants indicated that their choice is all about the most popular devices at the
time because devices are also considered fashion accessories.
The perception of low-income households about the ease of use of broadband was
inconclusive. Although some participants alluded to the fact that more can be done to
simplify and customise broadband devices and recommended the use of less technical
terms to describe broadband products and services, there was no evidence that this
influenced their attitude that broadband is a difficult technology to use. What was
apparent though is that other demographical factors such as age, education and e-
skills levels played a critical role in influencing this perception. Hence it is important
for policy makers to introduce e-skills programmes that target the elderly and the least
literate to ensure that this does not continue to become a barrier for adoption and
usage.
The only construct that seemed to have had a negative influence on the attitude of
low-income households towards broadband adoption and usage is online security and
privacy. As it emerged from the data, low-income household users were anxious about
how their personal data is being handled online and they had fears of their activities
Page | 113
being monitored. Recent cybercrime literature proves that these concerns are not
unfounded as low-income households fall under the most vulnerable user groups
because of their extensive use of mobile technologies which are now the most
targeted by cyber criminals (RSA, 2016). Moreover, low-income households seemed
not to have had adequate awareness around safe online behaviour and protection of
personal information. This will have a negative impact towards the uptake and usage
of applications and services that require sensitive personal data (e.g. online banking
and shopping). Hence the recommendation by Kortjan (2013) government should
provide adequate resources to cyber security awareness and education campaigns in
order to equip all members of the society to act safely online is upheld.
6.4.2 Normative beliefs as factors
Recalling from Chapter 2, subjective norms reflect the expectation of others on how
an individual should behave (i.e. either to perform or not perform a behaviour). It is
theorised as a function of the individual’s beliefs on whether the referents think that
he or she should perform the behaviour, the individual’s motivation to comply with
the exception and the number of these referents (Fishbein & Ajzen, 1975). Literature
further provides that the expectation or pressure to comply with social norms can
come from primary sources such as those close to the individual or secondary sources
such as media and advertising (Venkatesh & Brown, 2001).
The data analysis revealed that primary influence had a positive influence on adoption
and use broadband by low-income households. Word-of-mouth served as the key
channel to spread information about broadband products and services. Today social
media and instant messaging applications provide a fertile ground for consumers to
share information about their experience with certain products, giving rise to eWOM.
The eWOM phenomenon has grown to be an important aspect of every business
today. Every major brand around the world has a Facebook and Twitter account and
companies invest substantially on monitoring and maintaining these platforms.
Primary influence was also closely linked with social status in attitudinal constructs,
both constructs tap into the social element and the need for the user to be associated
with the current trends.
Page | 114
Although secondary influence was not identified as an influential factor by low-income
households, it cannot be ruled out as a tool to also drive broadband demand. New
advertising strategies may be necessary to captivate targeted audiences such as low-
income households.
6.4.3 Control as a factor
Ajzen (1991) argues that although the attitude might be favourable and there is
enough pressure and intention for an individual to comply with social norms to
perform a certain behaviour, the overt performance of the studied behaviour will be
determined by the actual level of control the person has to willingly act or not to act.
This control may be limited by external factors (e.g. availability of resources and
opportunities) as well as internal factors such as the proficiency and the level of
confidence the individual poses to perform the studied behaviour.
The data analysis suggested that the lack of knowledge on new broadband
technologies by low-income households limited their options when it comes to the
choice of broadband connection. As indicated in section 5.4.1.1, low-income
households are often kept in the dark when it relates to new access technologies
because they are not deemed to be the target market. But this action is often justified
by those providing the infrastructure as protecting their investment by targeting areas
with the potential of high returns first, which is an acceptable fact when considering
the amount of money that is required to develop this infrastructure.
The data analysis also showed that low-income households were not entirely satisfied
with the broadband quality of service they received. This was found to be related to
the inadequacy of infrastructure to cater for the growing demand. Service providers
are found to be lagging behind when it comes to upgrading and expanding network
infrastructure, leading to degraded quality of service over time.
The analysis further confirmed the negative influence that the high cost of data in
South Africa has on the adoption and usage of broadband by low-income households.
The cost of data was highlighted as the most significant barrier to adoption and usage
of broadband in low-income households. This coupled with their suspicions that
service providers were using unscrupulous methods to deplete their data balances,
Page | 115
has left low-income households with doubting the value they get for their money.
Hence is vital for regulatory authorities to protect the interest of the consumers and
shield them from exploitation by their service providers.
The dependence of self-efficacy on other motivational constructs such knowledge and
perceived ease of as well as on moderating factors or demographics such as the level
of education, gender and level of income, made it difficult to determine if it has any
kind of influence on the adoption and usage broadband by low-income households.
6.4.4 Relevance as a factor
Recalling from section 1.3, the attractiveness of broadband refers to the noticeable
benefits that it delivers to its users. This includes the relevance of content,
applications and services to the livelihood of its users. Hauge and Prieger (2010) assert
that programmes that are targeted at specific market segments with information of
specific use are important to mitigate against perceived lack of value as a barrier to
adoption.
Hence relevance was considered as a motivational factor to broadband adoption and
it was added to extend the MBA. The assertions by participants to the fact that
broadband plays an important role in their daily lives as a utility, proved that although
low-income households were observed to be basic users, they are increasingly
advancing to a stage where they will use broadband to earn a living. This further
strengthened the positive influence on its adoption and usage.
Furthermore, the data also suggested that low-income households do appreciate
consumption of local content, but raised concerns about its limited availability and the
lack of support to local content developers. This was observed to have had a negative
influence on increasing the adoption rate and usage of broadband.
6.5 Conclusion
This study took a qualitative approach in determining how motivational factors
influence low-income households to adopt and use broadband. Based on the findings,
the assertion is upheld that motivational factors form a key determinant to broadband
adoption and usage by low-income households. Therefore motivational factors should
Page | 116
be considered as important aspects of broadband demand stimulation strategies by
policy makers, regulators and the ICT industry. The learnings from this study can form
key input in understanding how broadband infrastructure that is rolled out in low-
income communities will be effectively utilised, and also in ensuring that services and
content that is provided to these communities will be relevant to the users to increase
adoption and usage.
6.6 Contribution to the body of knowledge
By taking a different approach in building an understating around how motivational
factors affect low-income households to adopt and use broadband, the study has
added to the current knowledge on broadband adoption particularly in developing
countries. Since income level has never been used as a distinguishing demographic for
studying broadband adoption in South Africa, the study sets the basis on income level
broadband adoption. The study also brought an in-depth understanding on the
relevance of broadband to low-income households and how local content affects their
decision to adopt and use the technology.
6.7 Suggestions for future research
Although the qualitative data analysis provided depth in understanding how the
motivational factors collectively influenced low-income households to adopt and use
broadband, the study was only limited to one community. This may present
generalisability issues when considering the vast population of low-income
households in South Africa. This presents an opportunity for future research wherein
the approach can be adopted to collect and analyse data from a number of low-
income communities to further enhance the findings of this study. In addition, the
extended MBA may be subjected to quantitative data analysis to prove the statistical
relevance of the relevance constructs since all other constructs (i.e. attitudinal,
normative and control) have been proven before in many settings.
Page | 117
6.8 Limitations of the study
Due to the short timelines provided to complete the study and cost considerations,
samples were drawn from three sections in one township only. Therefore, the results
of this study has limited generalisability to South African low-income households.
The measure that was used to classify income levels had limited accuracy because
income is dynamic variable that needs to be measured frequently. In addition, the fact
that 47% of participants did not know their monthly household income may also
presented a weakness in validating the findings since the study was premised on
income level.
The theoretical framework that was adopted for this study was extended to include
relevance constructs which have not yet been proved statistically to have had any
influence on technology adoption. This may imply inherent weakness on the findings
deduced on this constructs.
6.9 Recommendations
From the theoretical basis, the MBA model that was adapted from Dwivedi et al.
(2010) and used for this study presents a cornerstone for all stakeholders that are
involved in the development and proliferation of broadband. Since the model is
rooted on human behavioral theories and IS, it can be used as an effective tool by
policy makers and regulatory authorities to advance the understanding on the
interactions between low-income households and broadband. This will help them to
design policy and regulatory interventions that are relevant to the lived experience of
low-income households and reduce the temptation to apply one-size-fits-all policies
as recommended by Duncan (2015). Furthermore, the same understanding can be
used by service providers for development of products and services that are tailored
specifically for low-income households.
In light of the findings of this study as derived from the collected and analysed data,
the following recommendations are made for further consideration by policy makers,
regulatory authorities and ICT industry players:
Page | 118
Although this might seem like an overstated fact, the outcomes of this study explicitly
portray cost as a major barrier to broadband adoption and usage by low income
households. This means that while the transition to understand other motivational
factors is important, it will be premature to underplay the effects of cost as a control
construct.
Hence it is critical for policy makers and regulatory authorities to expedite policy
interventions that are meant for the reduction of cost associated with broadband to
ensure that it is inclusive of all income groups. In the South African context this refers
to the release and licensing of high demand radio frequency spectrum and the
regulation of data prices.
To further improve the attitude of low-income holds about broadband, efforts should
be made by policy makers and the ICT industry on awareness campaigns to inform
users on safe online behaviour and to address the concerns that were raised about
online security and privacy.
Since low-income households placed value on status, service providers and retailers
of broadband products can leverage on this to drive demand by making trendy
products that are affordable so that they can be appealing to low-income households.
To provide and improve access to good broadband quality of service, it is important
for government to support infrastructure development programmes to ensure that
other access technologies such as FTTH are expanded to realise an access technology
mix of high speed broadband to low-income communities too. It is also important for
regulatory authorities to keep a close eye on the grade of service provided to
consumers and put mechanisms in place that will incentivise compliant service
providers and equally penalise non-compliance.
With regard to increasing the availability and consumption of local content, the
government needs to continue providing platforms where local content can be easily
accessible and to incubate and provide financial support to local content developers
particularly those from low-income communities. The move towards promoting local
hosting of content will also assist in curbing costs for accessing content.
Page | 119
List of References
Abrahams, L., Bakker, B., & Bhyat, M. (2007). Municipal broadband: the next
generation and the last mile. The African Journal of Information and
Communication, 2007(8), 136–153.
Adams, P., Farrell, M., Dalgarno, B., & Oczkowski, E. (2017). Household adoption of
technology: The case of high-speed broadband adoption in Australia.
Technology in Society, 49, 37–47.
https://doi.org/10.1016/j.techsoc.2017.03.001
Aizstrauta, D., Ginters, E., & Eroles, M. A. P. (2015). Applying theory of diffusion of
innovations to evaluate technology acceptance and sustainability. Procedia
Computer Science, 43, 69–77. https://doi.org/10.1016/j.procs.2014.12.010
Ajzen, I. (1985). From intentions to actions: A theory of planned behavior. In P. D. J.
Kuhl & D. J. Beckmann (Eds.), Action Control (pp. 11–39). Berlin Heidelberg:
Springer. https://doi.org/10.1007/978-3-642-69746-3_2
Ajzen, I. (1991). The theory of planned behavior. Organizational Behavior and
Human Decision Processes, 50(2), 179–211.
Ajzen, I., & Fishbein, M. (1969). The prediction of behavioral intentions in a choice
situation. Journal of Experimental Social Psychology, 5(4), 400–416.
https://doi.org/10.1016/0022-1031(69)90033-X
Ajzen, I., & Fishbein, M. (1970). The prediction of behavior from attitudinal and
normative variables. Journal of Experimental Social Psychology, 6(4), 466–
487. https://doi.org/10.1016/0022-1031(70)90057-0
Ajzen, I., & Fishbein, M. (2005). The influence of attitudes on behavior. In D.
Albarracín, B. T. Johnson, & M. P. Zanna (Eds.), The handbook of attitudes
(pp. 173-221). Mahwah, NJ: Erlbaum.
Akamai. (2016). Akamai state of the internet Q4 2016 report. Retrieved from
https://www.akamai.com/kr/ko/multimedia/documents/state-of-the-
internet/q4-2016-state-of-the-internet-connectivity-report.pdf
Page | 120
Bojnec, Š., & Ferto, I. (2012). Broadband availability and economic growth. Industrial
Management & Data Systems, 112(9), 1292–1306.
https://doi.org/10.1108/02635571211278938
Brown, I. T. J., Letsididi, B. N., & Nazeer, M. N. (2009). Internet access in South
African homes: A preliminary study on factors influencing consumer choice.
The Electronic Journal of Information Systems in Developing Countries, 38, 1–
13.
Bryman, A. (2012). Social Research Methods. Oxford, England: OUP Oxford.
Burrell, A. (2011). Evaluating policies for delivering agri-environmental public goods.
In OECD Workshop on the Evaluation of Agri-environmental Policies (p. 49).
Thünen Institute, Germany: OECD.
BusinessTech. (2017). SA mobile subscribers in 2017: Vodacom vs MTN vs Cell C vs
Telkom. Retrieved from https://businesstech.co.za/news/mobile/182301/sa-
mobile-market-share-in-2017-vodacom-vs-mtn-vs-cell-c-vs-telkom/
Carare, O., McGovern, C., Noriega, R., & Schwarz, J. (2015). The willingness to pay for
broadband of non-adopters in the U.S.: Estimates from a multi-state survey.
Information Economics and Policy, 30, 19–35.
https://doi.org/10.1016/j.infoecopol.2014.12.001
Centre for Affordable Housing Finance in Africa (2014). Affordable market overview
for Soshanguve, Tshwane 2007 - 2012. Retrieved from
http://housingfinanceafrica.org/app/uploads/CAHF-Soshanguve-Market-
Overview.pdf
Chetty, M., Sundaresan, S., Muckaden, S., Feamster, N., & Calandro, E. (2013).
Investigating broadband performance in South Africa. Retrieved from
https://www.researchictafrica.net/docs/RIA_policy_paper_measuring_broad
band_performance_South_Africa.pdf
Choudrie, J., & Dwivedi, Y. (2004). Towards a conceptual model of broadband
diffusion. CIT. Journal of Computing and Information Technology, 12(4), 323–
338.
Page | 121
Choudrie, J., & Dwivedi, Y. K. (2006). Investigating factors influencing adoption of
broadband in the household. Journal of Computer Information Systems,
46(4), 25–34.
Creswell, J. W. (2014). Research design: qualitative, quantitative, and mixed methods
approaches (4th ed). Thousand Oaks, CA: SAGE Publications.
Davis, F. D. (1985). A technology acceptance model for empirically testing new end-
user information systems: Theory and results. Massachusetts Institute of
Technology, USA. Retrieved from
https://www.researchgate.net/profile/Fred_Davis2/publication/35465050_A
_technology_acceptance_model_for_empirically_testing_new_enduser_infor
mation_systems__theory_and_results_/links/0c960519fbaddf3ba7000000.p
df
Dharma, D., Amelia, B., Powell, A., Joe, K., & Jaewon, C. (2010). Broadband adoption
in low-income communities. Retrieved from
http://webarchive.ssrc.org/broadband_adoption.pdf
Dibra, M. (2015). Rogers theory on diffusion of innovation-the most appropriate
theoretical model in the study of factors influencing the integration of
sustainability in tourism businesses. Procedia - Social and Behavioral
Sciences, 195, 1453–1462. https://doi.org/10.1016/j.sbspro.2015.06.443
Duan, W., Gu, B., & Whinston, A. B. (2008). Do online reviews matter? — An
empirical investigation of panel data. Decision Support Systems, 45(4), 1007–
1016. https://doi.org/10.1016/j.dss.2008.04.001
Dwivedi, Y. K., Khoumbati, K., Williams, M. D., Lal, B., & Gharavi, H. (2007). Examining
role of attitudinal, normative and control factors influencing behavioural
intention to adopt broadband in Pakistan. Transforming Government: People,
Process and Policy, 1(3), 285–297.
https://doi.org/10.1108/17506160710778112
Page | 122
Dwivedi, Y. K., & Lal, B. (2007). Socio‐economic determinants of broadband
adoption. Industrial Management & Data Systems, 107(5), 654–671.
https://doi.org/10.1108/02635570710750417
Dwivedi, Y. K., Mustafee, N., Williams, M. D., & Lal, B. (2010). Developing a
broadband adoption model in the UK context. IS Design Science Research,
IFIP AICT, 318, 192–208.
https://pdfs.semanticscholar.org/58b5/54a2910841d947c80b835fd9ebfe0f8
db087.pdf
Elwalda, A., & Lu, K. (2014). The influence of online customer reviews on purchase
intention: the role of non-numerical factors. Retrieved from
https://www.researchgate.net/profile/Abdulaziz_Elwalda/publication/28646
0238_The_Influence_of_Online_Customer_Reviews_on_Purchase_Intention
_the_Role_of_Non-
numerical_Factors_European_Marketing/links/566b7c3708ae430ab4f9f6d5/
The-Influence-of-Online-Customer-Reviews-on-Purchase-Intention-the-Role-
of-Non-numerical-Factors-European-Marketing.pdf
Ericsson. (2016). Sub-Saharan Africa Ericsson mobility report November 2016.
Retrieved from https://www.ericsson.com/assets/local/mobility-
report/documents/2016/ericsson-mobility-report-november-2016-rssa.pdf
Firth, L., & Mellor, D. (2005). Broadband: benefits and problems.
Telecommunications Policy, 29(2–3), 223–236.
https://doi.org/10.1016/j.telpol.2004.11.004
Fishbein, M., & Ajzen, I. (1975). Belief, attitude, intention and behavior: An
introduction to theory and research. Reading, Massachusetts: Addison-
Wesley Publishing Company.
Flamm, K., & Chaudhuri, A. (2007). An analysis of the determinants of broadband
access. Telecommunications Policy, 31(6–7), 312–326.
https://doi.org/10.1016/j.telpol.2007.05.006
Page | 123
Garcia-Murillo, M. (2005). International broadband deployment: The impact of
unbundling. Communications & Strategies, 57, 83–105. https://mpra.ub.uni-
muenchen.de/2442/1/MPRA_paper_2442.pdf
Gareeb, P., & Naicker, V. (2015). Determinants for South African SMEs to adopt
broadband Internet technologies. The Electronic Journal of Information
Systems in Developing Countries, 68(5), 1–24.
https://onlinelibrary.wiley.com/doi/pdf/10.1002/j.1681-
4835.2015.tb00491.x
Geerdts, C., Gillwald, A., Calandro, E., Chair, C., Moyo, M., & Rademan, B. (2016).
Developing smart public Wi-Fi in South Africa. Retrieved from
https://www.researchictafrica.net/publications/Other_publications/2016_Pu
blic_Wi-Fi_Policy_Paper_-_Developing_Smart_Public_Wi-
Fi_in_South_Africa.pdf
GSMA. (2017). Accelerating affordable smartphone ownership in emerging markets.
Retrieved from https://www.gsma.com/mobilefordevelopment/wp-
content/uploads/2017/07/accelerating-affordable-smartphone-ownership-
emerging-markets-2017.pdf
Hauge, J. A., & Prieger, J. E. (2010). Demand-side programs to stimulate adoption of
broadband: What works? Network Economics, 9(3).
https://doi.org/10.2202/1446-9022.1234
Howell, B. (2002). Broadband uptake and infrastructure regulation: Evidence from
the OECD countries.
http://citeseerx.ist.psu.edu/viewdoc/download?doi=10.1.1.201.5854&rep=re
p1&type=pdf
Independent Communications Authority of South Africa. (2016). Report on the state
of the ICT sector in South Africa. Retrieved from
https://www.ellipsis.co.za/wp-content/uploads/2015/10/ICASA-Report-on-
State-of-SA-ICT-Sector-2016.pdf
Page | 124
Independent Communications Authority of South Africa. (2017). List of class
Licensees for September 2017. https://www.ellipsis.co.za/updated-list-of-
class-licence-holders/
Karahanna, E., Straub, D. W., & Chervany, N. L. (1999). Information technology
adoption across time: A cross-sectional comparison of pre-adoption and post-
adoption beliefs. MIS Quarterly, 23(2), 183. https://doi.org/10.2307/249751
Katz, R. L., & Avila, J. G. (2010). The impact of broadband policy on the economy.
http://www.acorn-redecom.org/papers/acornredecom2010katz.pdf
Katz, R. L., Vaterlaus, S., Zenhäusern, P., & Suter, S. (2010). The impact of broadband
on jobs and the German economy. Intereconomics, 45(1), 26–34.
https://archive.intereconomics.eu/year/2010/1/the-impact-of-broadband-
on-jobs-and-the-german-economy/
Kelly, T., Mulas, V., Raja, S., Qiang, C. Z. W., & Williams, M. (2009). What role should
governments play in broadband development?. Retrieved from
https://www.oecd.org/ict/4d/43631862.pdf
Kelly, T., & Rossotto, C. M. (Eds.). (2012). Broadband Strategies Handbook.
Washington, D.C., USA: The World Bank. https://doi.org/10.1596/978-0-
8213-8945-4
Kim, Y., Kelly, T., & Raja, S. (2010). Building broadband: Strategies and policies for the
developing world. Washington, D.C., USA: The World Bank. Retrieved from
http://siteresources.worldbank.org/EXTINFORMATIONANDCOMMUNICATIO
NANDTECHNOLOGIES/Resources/282822-
1208273252769/Building_broadband.pdf
Korpelainen, E. (2011). Theories of ICT system implementation and adoption – A
critical review. Retrieved from
http://lib.tkk.fi/Diss/2011/isbn9789526043869/article1.pdf
Kortjan, N. (2013). A cyber security awareness and education framework for South
Africa. https://core.ac.uk/download/pdf/145053774.pdf
Page | 125
Koutroumpis, P. (2009). The economic impact of broadband on growth: A
simultaneous approach. Telecommunications Policy, 33(9), 471–485.
https://doi.org/10.1016/j.telpol.2009.07.004
Lanzolla, G., & Suarez, F. F. (2009). Closing the Technology Adoption/Use divide:
The role of Contiguous User Bandwagon.
http://people.bu.edu/fsuarez/Fernando_Suarez_Website/Publications_files/
2010_JM_Closing%20the%20Tech%20Adoption-Use%20Divide_Lanzola-
Suarez.pdf
Lee, H., Oh, S., & Shim, Y. (2005). Do we need broadband? Impacts of broadband in
Korea. Info, 7(4), 47–56. https://doi.org/10.1108/14636690510607295
Lee, S., Marcu, M., & Lee, S. (2011). An empirical analysis of fixed and mobile
broadband diffusion. Information Economics and Policy, 23(3), 227–233.
http://www.sciencedirect.com/science/article/pii/S0167624511000278
Leedy, P. D., & Ormrod, J. E. (2013). Practical research: planning and design. Boston,
MA: Pearson.
Madden, T. J., Ellen, P. S., & Ajzen, I. (1992). A Comparison of the Theory of Planned
Behavior and the Theory of Reasoned Action. Personality and Social
Psychology Bulletin, 18(1), 3–9. https://doi.org/10.1177/0146167292181001
Marshall, M. N. (1996). Sampling for qualitative research. Family Practice, 13(6),
522–526. https://doi.org/10.1093/fampra/13.6.522
Moore, G. C., & Benbasat, I. (1991). Development of an instrument to measure the
perceptions of adopting an information technology innovation. Information
Systems Research, 2(3), 192–222. https://doi.org/10.1287/isre.2.3.192
Moroeng, L. H. (2012). Fixed-to-mobile broadband substitution in South Africa.
Retrieved from http://146.141.12.21/handle/10539/12136
Mugeni, G. B., Wanyembi, G. W., & Wafula, J. M. (2012). Evaluating factors affecting
broadband intensity in Kenya. International Journal of Information, 2(10),
Page | 126
769–778.
http://esjournals.org/journaloftechnology/archive/vol2no10/vol2no10_4.pdf
Muller, R. (n.d.). 2003 vs 2013 prices: ADSL, mobile data, DStv, petrol, Big Mac.
Retrieved from https://mybroadband.co.za/news/general/89661-2003-vs-
2013-prices-adsl-mobile-data-dstv-petrol-big-mac.html
Mwanankuwa, R. (2016). Barriers to broadband market development in rural
Zambia: A case study of Lusaka rural broadband market. Retrieved from
http://dspace.unza.zm:8080/xmlui/bitstream/handle/123456789/4880/Main
%20Document.pdf?sequence=1&isAllowed=y
Mybroadband. (2017). “Disappearing airtime” is real – We have the proof. Retrieved
from https://mybroadband.co.za/news/cellular/220880-disappearing-
airtime-is-real-we-have-the-proof.html
Naidoo, M. (2011). Broadband diffusion in households of South Africa. Retrieved
from
https://open.uct.ac.za/bitstream/item/11680/thesis_com_2011_naidoo_m.p
df?sequence=1
Nainkin, S. (2014). A national study of smartphone adoption factors in South Africa.
Retrieved from http://scholar.sun.ac.za/handle/10019.1/96211
Natanson, E. (2016). 2016: A Pivotal year for the smartphone industry. Retrieved
from https://www.forbes.com/sites/eladnatanson/2016/09/12/2016-a-
pivotal-year-for-the-smartphone-industry/
Nedohe, M. L. F. (2014). Investment in broadband and the emerging market
structure in South Africa. Retrieved from
http://wiredspace.wits.ac.za/handle/10539/18448
Norliah, K., Safiah, S., Zakiah, I., Mahadi, A. H., & Shahrulanuar, M. (2017). Internet
usage pattern and types of Internet users among Malaysian university
students. Journal of Engineering and Applied Science, 12(6), 1433–1439.
http://docsdrive.com/pdfs/medwelljournals/jeasci/2017/1433-1439.pdf
Page | 127
Oganisation for Economic Co-operation and Development. (2008). OECD policy
guidance for digital content. Retrieved from
https://www.oecd.org/sti/ieconomy/40895797.pdf
Oh, S., Ahn, J., & Kim, B. (2003). Adoption of broadband Internet in Korea: the role of
experience in building attitudes. Journal of Information Technology, 18(4),
267–280. https://doi.org/10.1080/0268396032000150807
Oliveira, T., & Martins, M. F. (2010). Information technology adoption models at firm
level: Review of literature. Retrieved from
http://search.proquest.com/openview/1ed8bb7a41227198d347699aa34bf1
3d/1?pq-origsite=gscholar
Ooi, K.-B., Sim, J.-J., Yew, K.-T., & Lin, B. (2011). Exploring factors influencing
consumers’ behavioral intention to adopt broadband in Malaysia. Computers
in Human Behavior, 27(3), 1168–1178.
https://doi.org/10.1016/j.chb.2010.12.011
Pearson, M., & Chevalier, F. (2015, June 18). National regulatory authorities can help
to ensure quality of service for broadband customers. Retrieved from
http://www.analysysmason.com/About-Us/News/Newsletter/NRAs-
broadband-QoS-Jun2015/
Peronard, J.-P., & Just, F. (2011). User motivation for broadband: A rural Danish
study. Telecommunications Policy, 35(8), 691–701.
https://doi.org/10.1016/j.telpol.2011.06.008
Philip. (2017). Cape Town’s fibre-optic network passes the 800 km mark. Retrieved
from http://www.capetowngreenmap.co.za/blog/cape-town%E2%80%99s-
fibre-optic-network-passes-800-km-mark
Picot, A., & Wernick, C. (2007). The role of government in broadband access.
Telecommunications Policy, 31(10–11), 660–674.
https://doi.org/10.1016/j.telpol.2007.08.002
Poong, Y.-S., & Eze, U. C. (2008). TAM vs. PCI: An analysis on the theoretical model
parsimony and robustness across cultures. Communications of the IBIMA, 1,
Page | 128
198–201.
http://ibimapublishing.com/articles/CIBIMA/2008/970415/970415.pdf
Power Review. (2016). Mapping the path to purchase: How today’s consumers
navigate the shopping journey. Retrieved from
https://www.powerreviews.com/wp-content/uploads/2016/06/Path-to-
Purchase-Whitepaper061716.pdf
Project Isizwe. (2016). Tshwane Free WiFi: Animated infographic. Retrieved from
http://www.projectisizwe.org/tshwane-free-wifi-animated-infographic/
Ramosolo, G. M. (2014). Factors that affects low uptake of ADSL services in Soweto.
University of the Witwatersrand, Johannesburg, South Africa.
Rampersad, G., & Troshani, I. (2013). High‐speed broadband: assessing its social
impact. Industrial Management & Data Systems, 113(4), 541–557.
https://doi.org/10.1108/02635571311322784
Rao Hill, S., Burgan, B., & Troshani, I. (2011). Understanding broadband adoption in
rural Australia. Industrial Management & Data Systems, 111(7), 1087–1104.
https://doi.org/10.1108/02635571111161307
Research ICT Africa. (2016). Q4 African Prepaid Pricing Index. Retrieved from
https://researchictafrica.net/2015/02/27/q4-african-prepaid-pricing-index/
Rogers, E. M. (1983). Diffusion of innovations (3rd ed). New York, NY: Collier
Macmillan.
Republic of South Africa. (2015). The national cybersecurity policy framework for
South Africa. Retrieved from
https://www.gov.za/sites/www.gov.za/files/39475_gon609.pdf
RSA. (2016). 2016: current state of cybercrime.
https://www.rsa.com/content/dam/en/white-paper/2016-current-state-of-
cybercrime.pdf
Page | 129
Ruz, G. A., Varas, S., & Villena, M. (2013). Policy making for broadband adoption and
usage in Chile through machine learning. Expert Systems with Applications,
40(17), 6728–6734. https://doi.org/10.1016/j.eswa.2013.06.039
Saldaña, J. (2009). The coding manual for qualitative researchers. Los Angeles, CA:
SAGE Publishing.
Seymour, L. (2012). Understanding broadband adoption in South African households.
Retrived from
https://www.researchgate.net/publication/269928595_Understanding_Broa
dband_Adoption_in_South_African_Households
Seymour, L., & Naidoo, M. (2013). The usage and impact of broadband: A South
African household analysis. The Electronic Journal Information Systems
Evaluation, 16(2), 134–147.
http://www.ejise.com/issue/download.html?idArticle=909
Shih, C. F., & Venkatesh, A. (2004). Beyond adoption: Development and application
of Use Diffusion (UD) model to study household use of computers. Journal of
Marketing, 68(1), 59–72. https://doi.org/10.1509/jmkg.68.1.59.24029
Republic of South Africa. (2005). Electronic Communications Act No. 36 of 2005.
Retrieved from http://www.wipo.int/edocs/lexdocs/laws/en/za/za082en.pdf
Republic of South Africa. (2013). South Africa Connect: creating opportunities,
ensuring inclusion. Retrieved from https://www.ellipsis.co.za/wp-
content/uploads/2014/01/DOC-Presentation-NBP-2013-PPC-19-February-
2014-.pdf
Republic of South Africa. (2016). National integrated ICT policy white paper.
Retrieved from https://www.ellipsis.co.za/wp-content/uploads/2016/11/Joe-
Mjwara-National-ICT-WP-Conference.pdf
South African Customer Satisfaction Index. (2016). Mobile data service provider
loyalty drops to three-year low. Retrieved from
http://sacsi.consulta.co.za/viewarticle.aspx?id=1555&type=1&cat=60
Page | 130
Stake, R. E. (2010). Qualitative research: studying how things work. New York, NY:
Guilford Press.
Statistics South Africa. (2014). Information and communication technology satellite
account for South Africa, 2006-2011. Retrieved from
http://www.statssa.gov.za/publications/Report-04-07-01/Report-04-07-
01January2012.pdf
Statistics South Africa. (2017). Poverty trends in South Africa: An examination of
absolute poverty between 2006 and 2016. Retrieved from
http://www.statssa.gov.za/publications/Report-03-10-06/Report-03-10-
062015.pdf
Taylor, S., & Todd, P. A. (1995). Understanding information technology usage: A test
of competing models. Information Systems Research, 6(2), 144–176.
https://doi.org/10.1287/isre.6.2.144
Telkom SA. (2017). Futurehood LTE & Fibre - Telkom. Retrieved from
https://secure.telkom.co.za/today/shop/futurehood/
The Internet Service Providers’ Association. (2017). List of Members. Retrieved from
https://ispa.org.za/membership/list-of-members/
The South African Audience Research Foundation. (2016). SAARF LSM Descriptors.
Retrieved from http://www.saarf.co.za/lsm/lsms.asp.
Thomson, K.-L., von Solms, R., & Louw, L. (2006). Cultivating an organizational
information security culture. Computer Fraud & Security, 2006(10), 7–11.
https://doi.org/10.1016/S1361-3723(06)70430-4
Tiamnara, N., Madan, N., & Malisuwan, S. (2015). Factors motivating broadband
adoption in Thailand. Journal of Economics, Business and Management, 3(8),
772–779. https://doi.org/10.7763/JOEBM.2015.V3.284
Vagle, M. D. (2016). Crafting Phenomenological Research. Abingdon-on-Thames, UK:
Routledge.
Page | 131
Van den Broeck, W., & Lievens, B. (2007). Why Broadband? The meaning of
broadband for residential users. The African Journal of Information and
Communication, 2007(8), 30–52. https://doi.org/10.23962/10539/19786
Venkatesh, Morris, Davis, & Davis. (2003). User acceptance of information
technology: Toward a unified view. MIS Quarterly, 27(3), 425.
https://doi.org/10.2307/30036540
Venkatesh, V., & Brown, S. A. (2001). A longitudinal investigation of personal
computers in homes: adoption determinants and emerging challenges. MIS
Quarterly, 25(1), 71 – 102. https://misq.org/a-longitudinal-investigation-of-
personal-computers-in-homes-adoption-determinants-and-emerging-
challenges.html
Venkatesh, V., & Davis, F. D. (2000). A Theoretical Extension of the Technology
Acceptance Model: Four Longitudinal Field Studies. Management Science,
46(2), 186–204. https://doi.org/10.1287/mnsc.46.2.186.11926
Vimaladevi, K., & Dhanabhakaym, M. (2012). A study on the effects of online
consumer reviews on purchasing decision. Prestige International Journal of
Management & IT-Sanchayan, 1(1), 91.
https://www.researchgate.net/publication/267840057_A_Study_on_the_Eff
ects_of_Online_Consumer_Reviews_on_Purchasing_Decision
Vumatel. (2017). Fibre in my area: Fibre internet coverage map. Retrieved from
https://vumatel.co.za/coverage
Weiner, M. D., Puniello, O. T., Noland, R. B., Ciemnecki, D., & Turakhia, C. (2012).
Consider the non-adopter: Developing a prediction model for the adoption of
household-level broadband access. Socio-Economic Planning Sciences, 46(3),
183–193. https://doi.org/10.1016/j.seps.2012.04.001
Welman, J. C., Kruger, F., Mitchell, B., & Huysamen, G. K. (2005). Research
methodology. Cape Town, South Africa: Oxford University Press.
Page | 132
Wonglimpiyarat, J., & Yuberk, N. (2005). In support of innovation management and
Roger’s innovation diffusion theory. Government Information Quarterly,
22(3), 411–422. https://doi.org/10.1016/j.giq.2005.05.005
The World Bank. (2017). World Bank South Africa GDP. Retrieved from
https://www.google.com/search?q=world+bank+south+africa+gdp&rlz=1C1N
HXL_enZA765ZA765&oq=world+bank+south+afr&aqs=chrome.2.0j69i57j0l4.
7262j0j4&sourceid=chrome&ie=UTF-8
Zhang, X. (2013). Income disparity and digital divide: The Internet Consumption Model
and cross-country empirical research. Telecommunications Policy, 37(6–7), 515–529.
https://doi.org/10.1016/j.telpol.2012.1
Page | 133
Annexure A
Investigating motivational factors influencing broadband
adoption and usage in South African low-income households.
Session Leaders
Kopano Monyetsane, Researcher
Kiru Pillay, Supervisor
Focus Group Program and Questions
PROGRAMME
Introduction 15 min
The researcher provides a brief overview of Wits University, describe the objectives of the research and the description of broadband products and services, adoption and usage in the context of this research. Then the participants are allowed to ask questions of clarity on the above. Completion of the questionnaire 15 min
Participants complete a short survey to build household profiles and covers the broad issues relating to broadband adoption and usage.
Open Discussion Session 1hr 0min
According your understanding, what is broadband?
Which broadband products/services are you aware of?
Which broadband services/products are available in your community?
Do you or your household use broadband?
If yes:
What specific broadband products/services are you using?
What interest did you have when you started looking for a broadband product/service?
How did you know about the particular broadband product/service you are using?
Why did you choose the particular broadband product/service?
What do you use your broadband product/service for the most?
What are other benefits of using this broadband product/service?
What are the challenges you are facing with using this broadband product/ service?
Which broadband products/services are you not using but have a desire to use and why?
How do you respond towards new broadband products/services on the market?
Page | 134
Would you recommend to others to use broadband products/service?
If yes, which products would you recommend most and why?
Any additional information we didn’t cover in the discussion? If no:
Why are you not using any of the broadband products/services?
Any additional information we didn’t cover in the discussion? Break & Refreshments, End of Programme
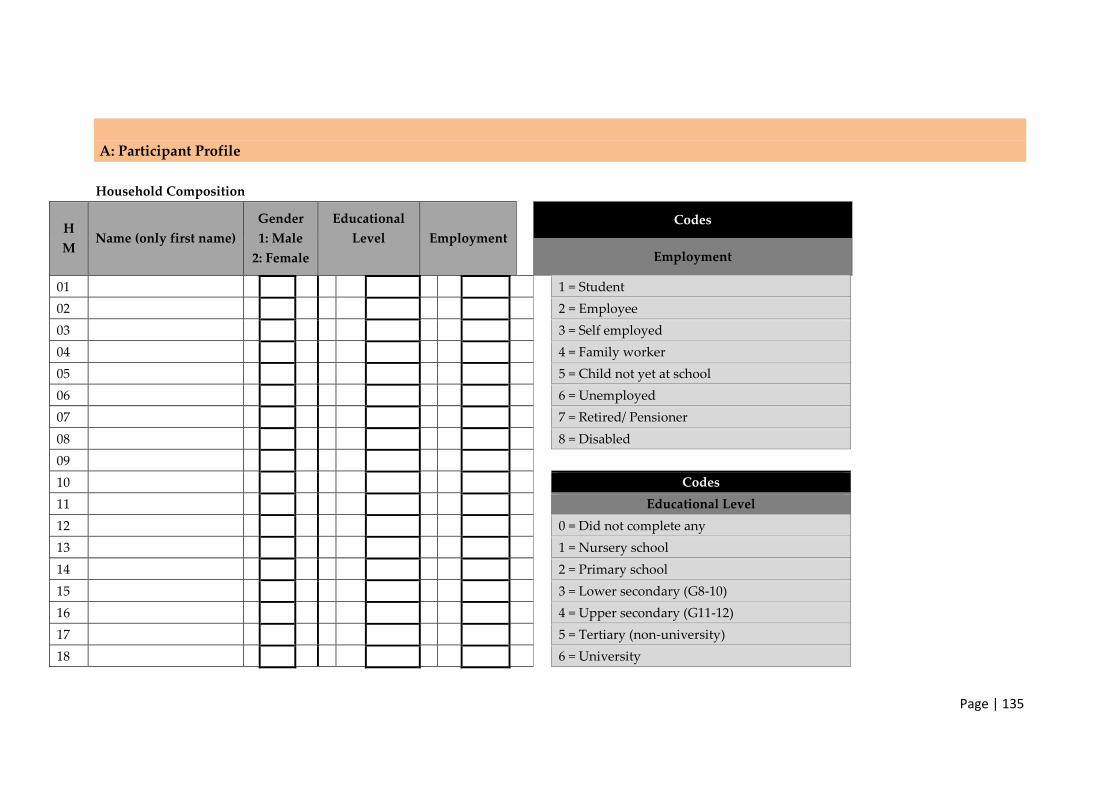
Page | 135
A: Participant Profile
Household Composition
H
M Name (only first name)
Gender
1: Male
2: Female
Educational
Level
Employment
Codes
Employment
01 1 = Student
02 2 = Employee
03 3 = Self employed
04 4 = Family worker
05 5 = Child not yet at school
06 6 = Unemployed
07 7 = Retired/ Pensioner
08 8 = Disabled
09
10 Codes
11 Educational Level
12 0 = Did not complete any
13 1 = Nursery school
14 2 = Primary school
15 3 = Lower secondary (G8-10)
16 4 = Upper secondary (G11-12)
17 5 = Tertiary (non-university)
18 6 = University
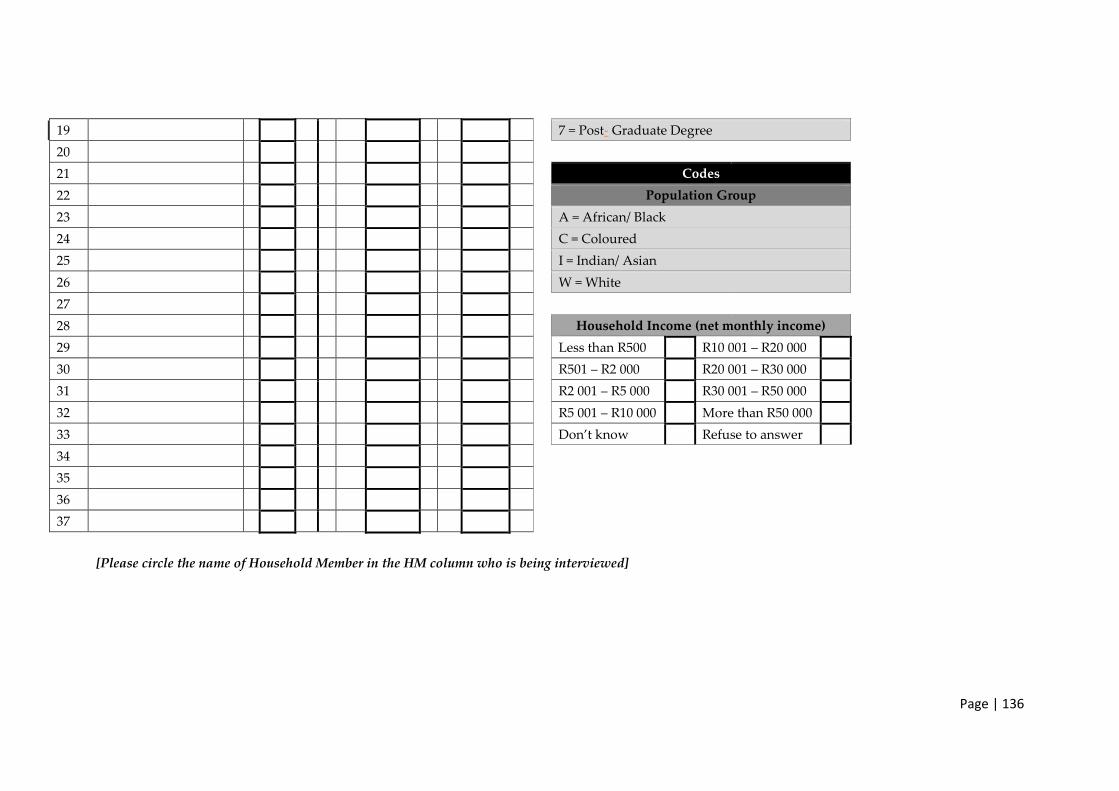
Page | 136
19 7 = Post- Graduate Degree
20
21 Codes
22 Population Group
23 A = African/ Black
24 C = Coloured
25 I = Indian/ Asian
26 W = White
27
28 Household Income (net monthly income)
29 Less than R500 R10 001 – R20 000
30 R501 – R2 000 R20 001 – R30 000
31 R2 001 – R5 000 R30 001 – R50 000
32 R5 001 – R10 000 More than R50 000
33 Don’t know Refuse to answer
34
35
36
37
[Please circle the name of Household Member in the HM column who is being interviewed]
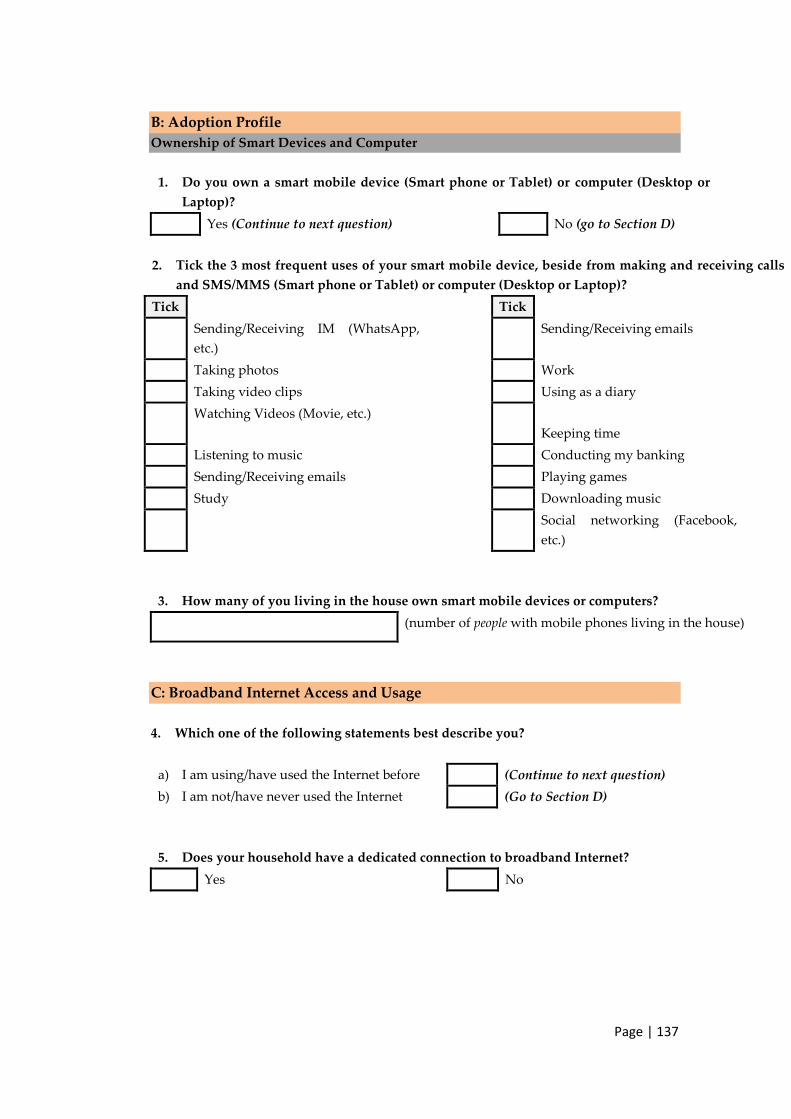
Page | 137
B: Adoption Profile
Ownership of Smart Devices and Computer
1. Do you own a smart mobile device (Smart phone or Tablet) or computer (Desktop or
Laptop)?
Yes (Continue to next question) No (go to Section D)
2. Tick the 3 most frequent uses of your smart mobile device, beside from making and receiving calls
and SMS/MMS (Smart phone or Tablet) or computer (Desktop or Laptop)?
Tick Tick
Sending/Receiving IM (WhatsApp,
etc.)
Sending/Receiving emails
Taking photos Work
Taking video clips Using as a diary
Watching Videos (Movie, etc.)
Keeping time
Listening to music Conducting my banking
Sending/Receiving emails Playing games
Study Downloading music
Social networking (Facebook,
etc.)
3. How many of you living in the house own smart mobile devices or computers?
(number of people with mobile phones living in the house)
C: Broadband Internet Access and Usage
4. Which one of the following statements best describe you?
a) I am using/have used the Internet before (Continue to next question)
b) I am not/have never used the Internet (Go to Section D)
5. Does your household have a dedicated connection to broadband Internet?
Yes No
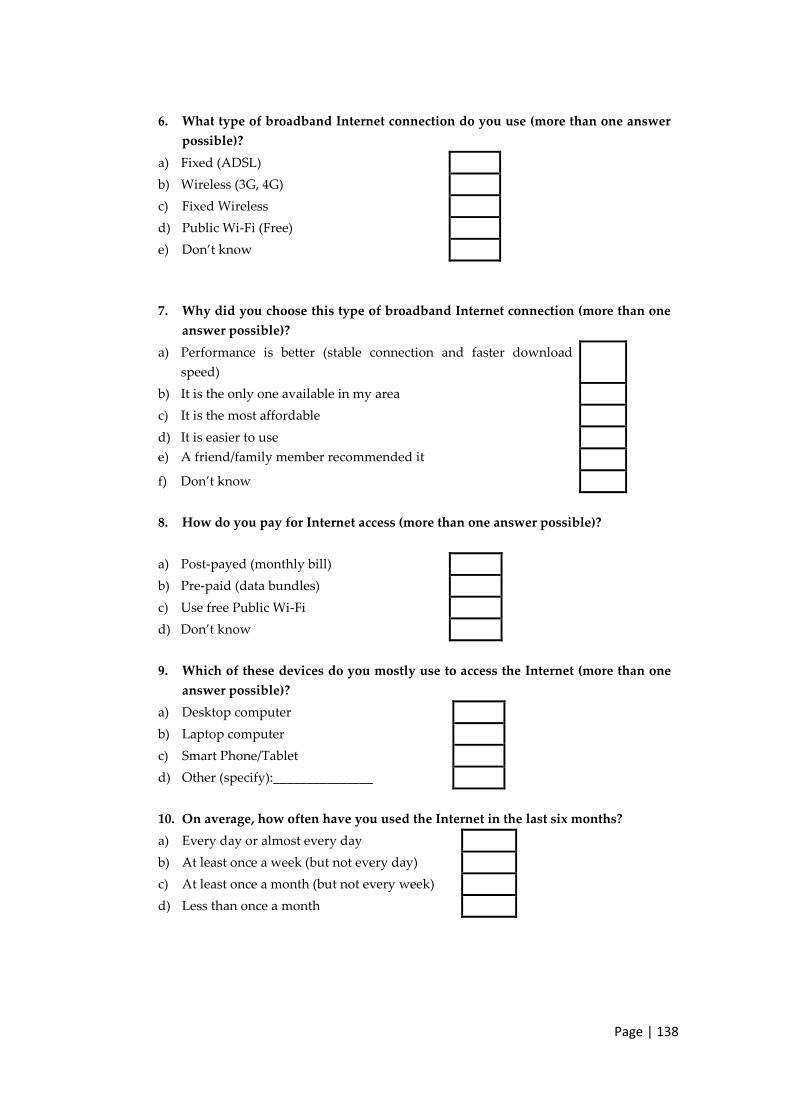
Page | 138
6. What type of broadband Internet connection do you use (more than one answer
possible)?
a) Fixed (ADSL)
b) Wireless (3G, 4G)
c) Fixed Wireless
d) Public Wi-Fi (Free)
e) Don’t know
7. Why did you choose this type of broadband Internet connection (more than one
answer possible)?
a) Performance is better (stable connection and faster download
speed)
b) It is the only one available in my area
c) It is the most affordable
d) It is easier to use
e) A friend/family member recommended it
f) Don’t know
8. How do you pay for Internet access (more than one answer possible)?
a) Post-payed (monthly bill)
b) Pre-paid (data bundles)
c) Use free Public Wi-Fi
d) Don’t know
9. Which of these devices do you mostly use to access the Internet (more than one
answer possible)?
a) Desktop computer
b) Laptop computer
c) Smart Phone/Tablet
d) Other (specify):_______________
10. On average, how often have you used the Internet in the last six months?
a) Every day or almost every day
b) At least once a week (but not every day)
c) At least once a month (but not every week)
d) Less than once a month
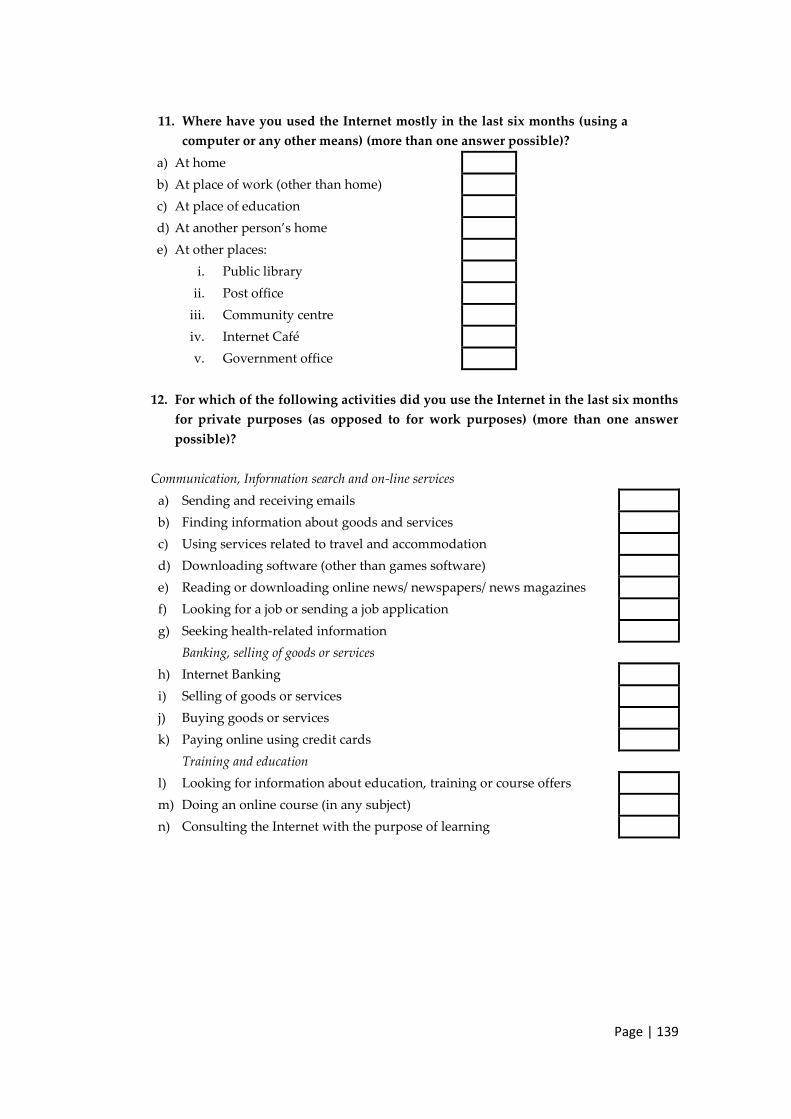
Page | 139
11. Where have you used the Internet mostly in the last six months (using a
computer or any other means) (more than one answer possible)?
a) At home
b) At place of work (other than home)
c) At place of education
d) At another person’s home
e) At other places:
i. Public library
ii. Post office
iii. Community centre
iv. Internet Café
v. Government office
12. For which of the following activities did you use the Internet in the last six months
for private purposes (as opposed to for work purposes) (more than one answer
possible)?
Communication, Information search and on-line services
a) Sending and receiving emails
b) Finding information about goods and services
c) Using services related to travel and accommodation
d) Downloading software (other than games software)
e) Reading or downloading online news/ newspapers/ news magazines
f) Looking for a job or sending a job application
g) Seeking health-related information
Banking, selling of goods or services
h) Internet Banking
i) Selling of goods or services
j) Buying goods or services
k) Paying online using credit cards
Training and education
l) Looking for information about education, training or course offers
m) Doing an online course (in any subject)
n) Consulting the Internet with the purpose of learning
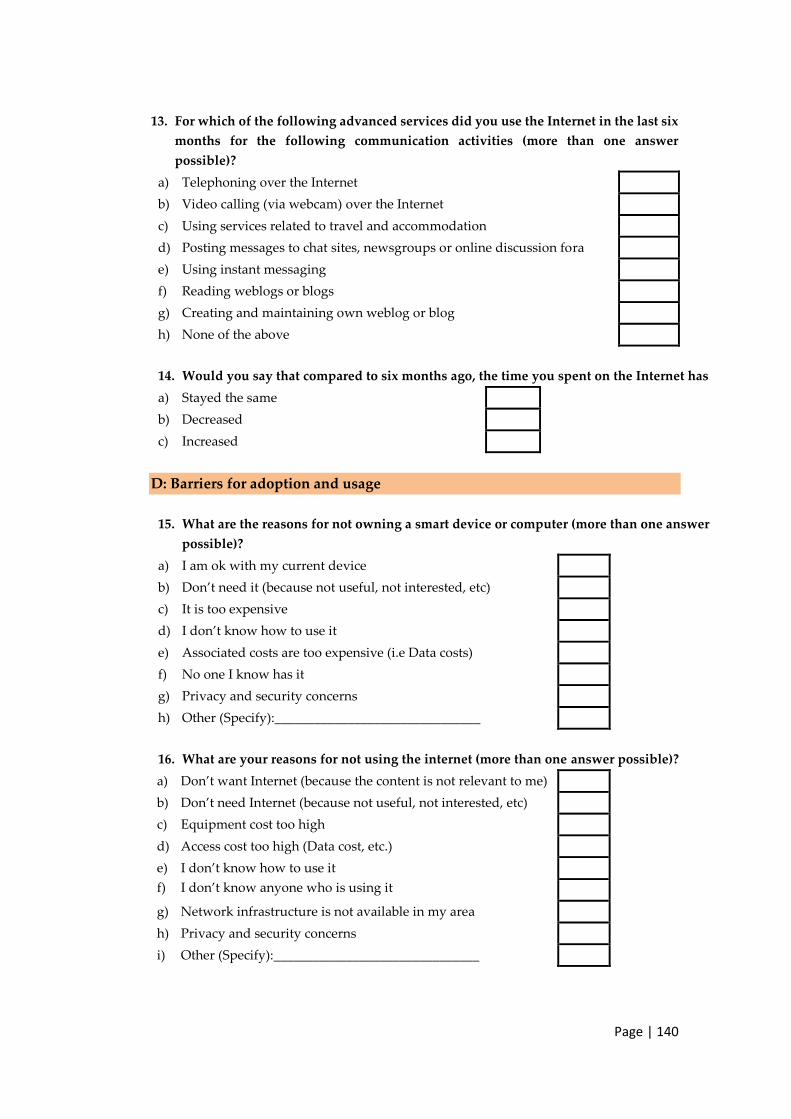
Page | 140
13. For which of the following advanced services did you use the Internet in the last six
months for the following communication activities (more than one answer
possible)?
a) Telephoning over the Internet
b) Video calling (via webcam) over the Internet
c) Using services related to travel and accommodation
d) Posting messages to chat sites, newsgroups or online discussion fora
e) Using instant messaging
f) Reading weblogs or blogs
g) Creating and maintaining own weblog or blog
h) None of the above
14. Would you say that compared to six months ago, the time you spent on the Internet has
a) Stayed the same
b) Decreased
c) Increased
D: Barriers for adoption and usage
15. What are the reasons for not owning a smart device or computer (more than one answer
possible)?
a) I am ok with my current device
b) Don’t need it (because not useful, not interested, etc)
c) It is too expensive
d) I don’t know how to use it
e) Associated costs are too expensive (i.e Data costs)
f) No one I know has it
g) Privacy and security concerns
h) Other (Specify):_______________________________
16. What are your reasons for not using the internet (more than one answer possible)?
a) Don’t want Internet (because the content is not relevant to me)
b) Don’t need Internet (because not useful, not interested, etc)
c) Equipment cost too high
d) Access cost too high (Data cost, etc.)
e) I don’t know how to use it
f) I don’t know anyone who is using it
g) Network infrastructure is not available in my area
h) Privacy and security concerns
i) Other (Specify):_______________________________
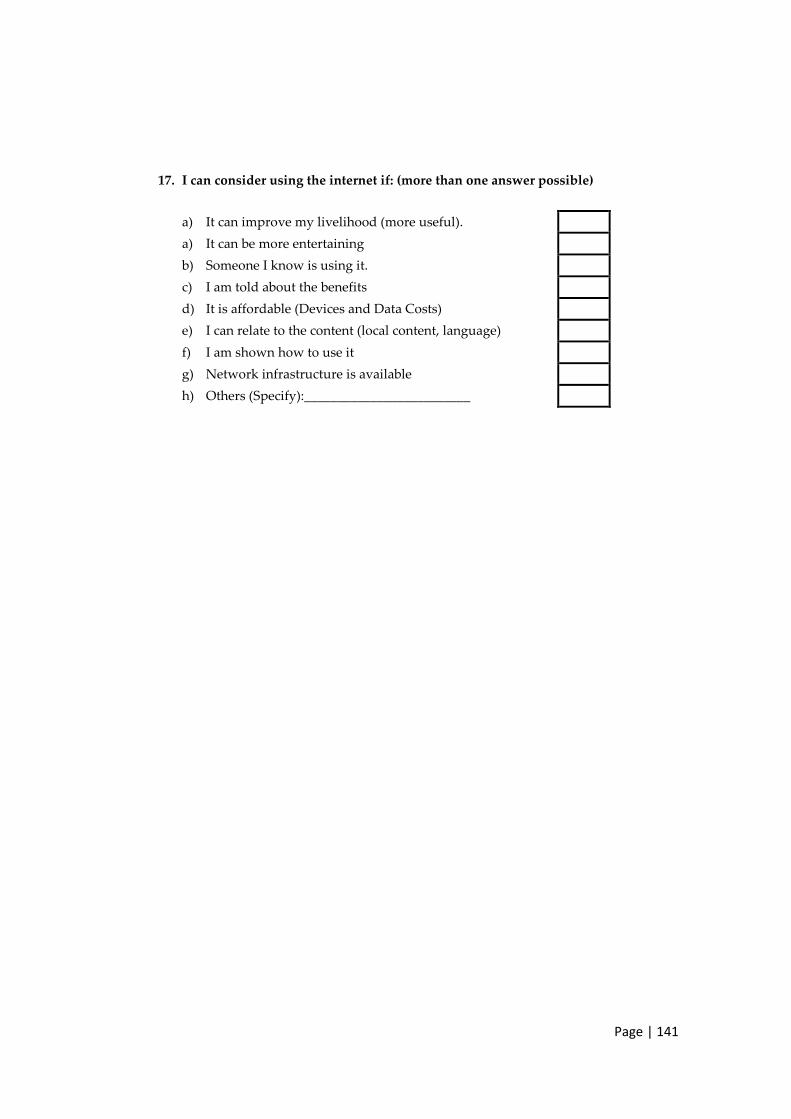
Page | 141
17. I can consider using the internet if: (more than one answer possible)
a) It can improve my livelihood (more useful).
a) It can be more entertaining
b) Someone I know is using it.
c) I am told about the benefits
d) It is affordable (Devices and Data Costs)
e) I can relate to the content (local content, language)
f) I am shown how to use it
g) Network infrastructure is available
h) Others (Specify):_________________________
Page | 142
Annexure B
PARTICIPANT INFORMATION SHEET
MASTERS RESEARCH
INVESTIGATING MOTIVATIONAL FACTORS INFLUENCING BROADBAND
ADOPTION AND USAGE IN SOUTH AFRICAN LOW-INCOME HOUSEHOLDS.
I am a student at the University of the Witwatersrand. In part completion of the Master of
Arts in the field of ICT Policy and Regulation, I am conducting a research study on the
motivational factors for broadband adoption and usage in selected households. You are
invited to take part in this research study. Please read the following information carefully
before you decide to take part in the study.
Ke moithuti univesithing ya Witwatersrand. Ke kgauswi le go fetša dithuto tša Masters ya
Arts lefapeng la ICT Policy and Regulation, ke dira dinyakišišo tša thuto go magato a
thlotleletšo ya gore go fihlelelwe le goba gona ga broadband ka malapeng a mangwe. Le
memiwa go tšea karolo mo dinyakišišong tše tša boithuti. Ka kgopelo bala magato a
latelago pele o ka tšea karolo go dithuto tše.
Background and overview of the study
Kakaretšo ya dithuto
The purpose of the study is to investigate what motivational factors can influence the
behaviour of low-income households to adopt and use broadband, in addition to factors like
cost and access to network infrastructure.
Morero mogolo wa dithuto ke go nyakišiša gore ke magato afe a ka tutuetšago mokgwa
wa batho ba hwetšago mogolo wa fase gore ba ka filhelela goba go shomiša broadband,
go akaretša le mašeleng le phihlelelo go ditlabakelo tša network.
Deciding whether to participate
Kgetho ya go tšea karolo
Taking part in the research is entirely voluntary and you may withdraw your consent and
participation at any stage and without giving a reason. If you decide to take part, you will
be given this information sheet to keep and be asked to sign a consent form. Additionally,
you will be asked participate in a focus group discussion that will last a maximum of 180
minutes with breaks and refreshments provided. Questions will be translated to a common
language used in your community and you will also be allowed to respond in your own
language. The interview may be recorded and the researcher will organise a meeting venue
in your community. There are no direct risks in participating in this study and focus group
discussion. There will be no direct monetary benefits to you for your participation.
Page | 143
Go tšea karolo go dinyakišišo tša boithuti ke ka boithaopo le gona motho a kana a se tšee
karolo nako efe goba efe ntle le go fa mabaka. Ge o ethaopa, o tla fiwa setlankana se lego
se tleketlela. Ka go tlaleletša, o tla kgopelwa go tšea karolo go dikgobotho tša batho tša
go sekaseka bo nako yeo e ka lekanago metsotso e 180 re akaretša nako ya go ikhutša le
go itapološa. Diputšišo di tla hlathollwa ka leleme le šomišwago motseng wa geno le gona
o tla fiwa sebaka sa go fetola ka leleme la geno. Diputšišo di ka gatišiwa le gona
monyakišiši o tla nyaka lefelo la go kopanelwa mo motseng wa geno. Ga gona ditla
morago tše tseneletšego go tšeeng karolo mo dithutong le go batho ba go sekaseka. Ga
gona tshelete ye e tla go holang ge o tšere karolo.
Anonymity and confidentiality
Tiiswa hore lebitso le lekunutu
Any personal information collected about you will be kept strictly confidential. Identifiers
will be removed from data when the research findings are consolidated into a report and
will not be included in any subsequent publications. The anonymised data generated in the
course of the research will be kept securely in paper or electronic format for a period of
five years after the completion of the research. It may be used for further research and
analysis. This report can be made available to you upon your request. Please note that
anonymity and confidentiality will not be guaranteed because you will be participating in
a focus group
Sengwe le sengwe sa boetsibišo bja gago se tla tšeiwa bjalo ka sephiri. Boetsibišo botla
tlošwa ge dinyakišišo di kgobokeditšwe go pego, gape di ka se akaretšwe go dikgatišo dife
goba dife. Go se tsebjwe ga melaetša ye e bilego gona dinyakišišong go tla beiwa go
lephephe le lebolokegilego goba ka mokgwa wa electronic go mengwaga e mehlano ka
morago ga dinyakišišo. Se se ka šomišiwa for dinyakišišong tša pele le ditshekatshekong.
Pego ye e ka ba gona ge o ka e kgopela. Hlokomela, gare tiisetše gore boetsibišo ke
lekunutu gobane otla tšea karolo go dikgobotho tša batho tša go sekaseka.
Research Ethics
If you have concerns about the research, its risks and benefits or about your rights as a
research participant in this study, you may contact the program director or supervisor, see
contact details below.
Ge o ena le maikutlo mabapi le dinyakišišo tše, ditlamorago, le mehola goba ditokelo blale
ka motšeakarolo wa boithuti, o kana wa ekgokaganya le molaodi wa lenanego goba
mohlokomedi. Dinimoro ke tše latelago
Contact for Further Information
Program Director: Supervisor: Researcher:
Lucienne Abrahams Kiru Pillay Kopano Monyetsane
[email protected] [email protected] [email protected]
+27 (0) 825697675 +27 (0) 826027261 +27 (0) 812111141
Page | 144
Annexure C
Faculty of Humanities
University of the Witwatersrand, Johannesburg
P O Box 601, Wits, 2050
INFORMED CONSENT FORM FOR SIGNATURE
Title of Study: Investigating motivational factors influencing broadband
adoption and usage in South African low-income households.
Please initial box
1. I confirm that I have read and understand the information sheet
for the above study and have had the opportunity to ask questions.
Ke kgonthišiša gore ke badile le go kwešiša lephephe la molaetša go
dithuto tše di lego mo godimo, ka ba le sebaka sa go botšiša diputšišo.
2. I understand that my participation is voluntary and that I am free
to withdraw at any time without giving a reason.
Ke kwešiša gore go tšea karolo ga ka keg a maethaopo le gona ke
lokologile gore nka tlogela go tšea karolo nako e kgolo le e nyane ntle
le go fa lebaka.
3. I understand that the researcher will not identify me by name in any
reports using information obtained from this interview and that the views
I express will remain confidential; OR
Ke holofela gore moithuti wa dinyakišišo tše a ka se hlagiše leina laka go
dipampiri dife kapa dife a šomiša molaetša gotšwa go dipotšišo/diteko le
Page | 145
gore dipono tše ke dihlagišago go tla ba tša sephiri goba go se phatlalatšwe.
4. I agree to my name being listed as a participant in this study in the
annexure to the report, but not to be referenced in the main body of the report.
Ke dumela gore leina laka le ka phatlalatšwa bjalo ka motšeakarolo dithutong
tše
setlankaneng sa pego, mara ke sa duleme gore leina la ka le šomišwe go diteng
tša pego.
5. I agree to the interview being audio recorded.
Ke dumela gore diputšišo ditla kgatišiwa.
6. I agree to the use of anonymised quotes in the dissertation.
Ke dumela go tšhumišo ya go setsebje go dissertation
7. I agree that data gathered from me in this study may be stored
(after it has been anonymised) and may be used for future research.
Ke dumela gore melaetša go tšwa go nna mo dithutong tše e ka šomišiwa
dinyakišišong tše di sa tlago
Name of Research Participant Date: Signature:
KOPANO MONYETSANE
Name of Researcher: Date: Signature:
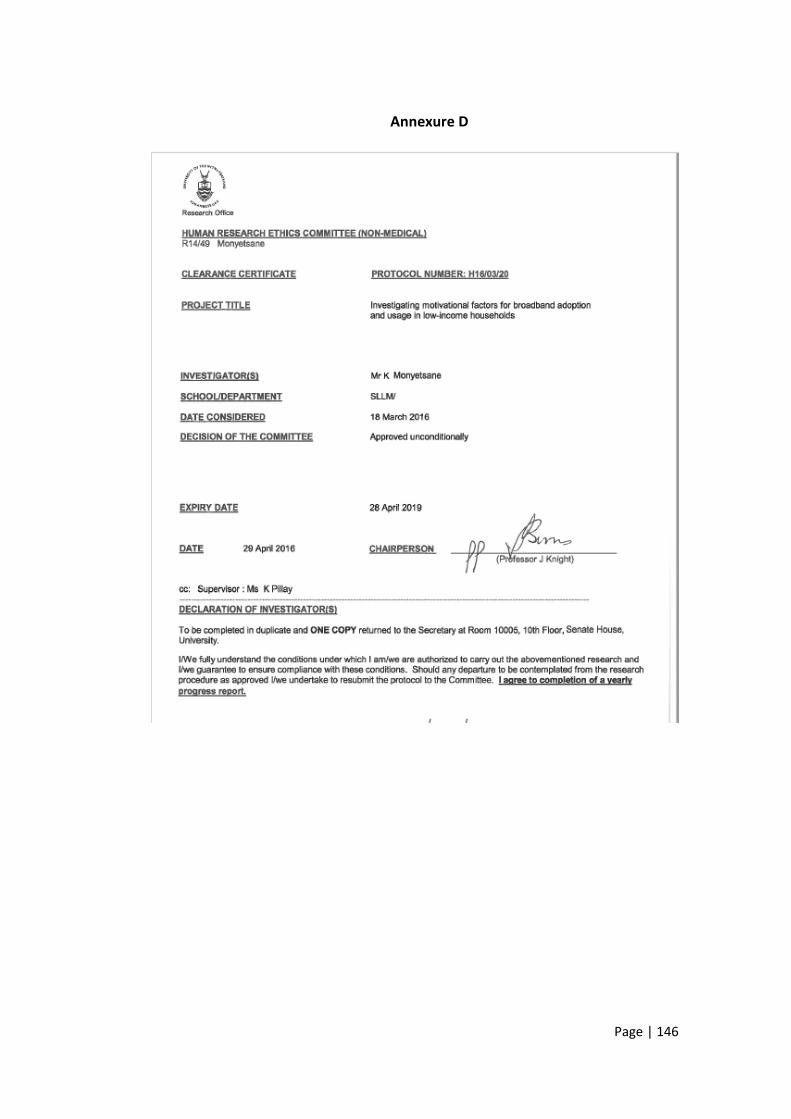
Page | 146
Annexure D