Embed Size (px)
DESCRIPTION
oppgaves
Citation preview

Major Accident Indicators for Drilling and Well Activities
Anniken Resvold Tranberg
Master of Science in Mechanical Engineering
Supervisor: Stein Haugen, IPKCo-supervisor: Jorunn Seljelid, Safetec Nordic AS
Department of Production and Quality Engineering
Submission date: June 2013
Norwegian University of Science and Technology

0 ]f ‘]‘ 1J Date Our reference2013.01.14 SHG/KEDA
Faculty of Engineering Science and TechnologyDepartment of Production and Quality Engineering
MASTER THESISSPRING 2013
for
stud.techn. Anniken Resvold Tranberg
Major Accident Indicators for Drilling and Well Activities(Storulykkesindikatorer for boring og bronnaktiviteter)
In recent years, there has been a significant interest in finding improved methods for measuring majoraccident risk on a continuous basis. The Petroleum Safety Authority has developed a methodologyand an extensive set of indicators being used for the Norwegian petroleum industry, but the datamaterial is not sufficient to reliable measure trends and levels on a company or installation level.There is also increased awareness that many different factors influence major accident risk and thatthese may be difficult to get an overview over.
In several projects, a methodology for visualization of indicators has been developed. The method isbased on identifying factors influencing risk directly or indirectly, establishing the influence betweenthe factors and finding indicators for each factor.
The objective of the thesis is to apply this methodology on a case related to drilling or well operationsin the North Sea. The following tasks are to be performed:
1. Literature survey — review and summarise relevant literature and get familiar with relevantdrilling/well operations
2. Identify risk influencing factors and build a factor model describing the links between thefactors
3. Identify potential indicators for the risk influencing factors4. Summarise, conclude and provide recommendations for further work
Within three weeks after the date of the task handout, a pre-study report shall be prepared. The reportshall cover the following:
• An analysis of the work task’s content with specific emphasis of the areas where newknowledge has to be gained.
• A description of the work packages that shall be performed. This description shall lead to aclear definition of the scope and extent of the total task to be perfonried.
Date Our reference
Master Thesis 2013 for stud.techn. Anniken Resvold Tranberg 2013.01.14 SHG/KEDA
• A time schedule for the project. The plan shall comprise a Gantt diagram with specificationof the individual work packages, their scheduled start and end dates and a specification ofproject milestones.
The pre-study report is a part of the total task reporting. It shall be included in the final report.Progress reports made during the project period shall also be included in the final report.
The report should be edited as a research report with a summary, table of contents, conclusion, list ofreference, list of literature etc. The text should be clear and concise, and include the necessaryreferences to figures, tables, and diagrams. It is also important that exact references are given to anyexternal source used in the text.
Equipment and software developed during the project is a part of the fulfilment of the task. Unlessoutside parties have exclusive property rights or the equipment is physically non-moveable, it shouldbe handed in along with the final report. Suitable documentation for the correct use of such materialis also required as part of the final report.
The candidate shall follow the work regulations at the company’s plant. The candidate may notintervene in the production process in any way. All orders for specific intervention of this kindshould be channelled through company’s plant management.
The student must cover travel expenses, telecommunication, and copying unless otherwise agreed.
If the candidate encounters unforeseen difficulties in the work, and if these difficulties warrant areformation of the task, these problems should immediately be addressed to the Department.
The assignment text shall be enclosed and be placed immediately after the title page.
Deadline: June l0t1 2013.
Two bound copies of the final report and one electronic (pdf-format) version are required.
Date Our reference
Master Thesis 2013 for stud.techn. Anniken Resvold Tranberg 2013.01.14 SHG/KEDA
Responsible supervisor: Stein HaugenE-post: stein.haugen(ntnu.noTelefon: 73590111 /93483907
Industrial supervisor: Jorunn SeijelidB-post: Jorunn.Se1je1id(äsafetec.noTelefon: 93483909
DEPARTMENT OF PRODUCTION
AND QUALITY ENGINEERING
4Per Schjo1be J
Associate Professor/Head of Department
Sfin Haugen
Respsible Supervisor

v
Preface
This report is written by stud.techn. Anniken Resvold Tranberg and is a Master thesis in RAMS
at the Norwegian University of Science and Technology. The title of the thesis is "Major Acci-
dent Indicators for Drilling and Well Activities". It is completed as part of the study program
Mechanical Engineering in the spring semester of 2013 at the Department of Production and
Quality Engineering.
Professor Stein Haugen has provided a lot of guidance and feedback through the process of
writing this assignment, and for that I am truly grateful. I would also like to thank Jorunn Seljelid
at Safetec Nordic for her helpful contributions to my thesis.
Trondheim, 10.06.2013
Anniken Resvold Tranberg

vii
Summary
Several recent accidents such as the Deepwater Horizon Blowout in 2010 and the Texas City
Refinery Explosion in 2005 have demonstrated the need for better control of risk in complex
systems in order to avoid substantial losses of assets such as human lives, economic values and
the environment. Monitoring of risk is a key element in the overall risk management process.
For this reason, the objective of this master thesis is to apply a generic methodology for the
identification of major accident risk indicators on a case relevant to offshore drilling activities.
In this methodology, a factor model which illustrates how risk influencing factors influence the
probability and consequences of an offshore blowout event is developed. Factor models devel-
oped with the methodology used in the thesis can be used to visualize the most critical factors
that are relevant to major accident risk, and how different factors are linked together. It also
shows interdependencies between the factors. This kind of qualitative overview can lead to a
more holistic understanding of the work processes and improved risk awareness throughout
the organization.
Relevant theory of well and drilling activities is introduced in Chapter 3, the methodology is
presented in Chapter 4 and the application of the methodology is performed in Chapter 5. The
purpose of the case study is to develop factors and indicators for monitoring major accident risk
associated with blowouts in drilling operations. This hazardous event is chosen because uncon-
trolled release of pressurized hydrocarbons in the form of blowouts is a large contributor to the
total risk picture in well and drilling activities and has caused catastrophic major accidents in
the past. There are altogether 27 probability influencing factors and nine consequence influ-
encing factors in the factor models developed in this master thesis. In Section 5.3, the factor
model is tested by applying the framework in a retrospective analysis of various investigation
reports from five recent accidents. The factors are related to observations from investigation
reports and classified according to the state described in the investigation reports. The results
from the testing process indicates that the factor model can be a useful supplementary tool for
accident investigations, and the main conclusion from the validation tests is that the findings
from the investigation reports to a large extent fit into the factor model, though some findings
were harder to fit than others.

viii
Section 5.4 shows the indicators which have been identified in the case study. Data sources,
measuring frequency and specific classification dimensions are not included, because this falls
beyond the scope of the master thesis. An important recommendation for further work is that
the model that has been developed in the case study should be implemented and tested in a
full scale setting, to gain more experience with both the use of the methodology and the model
itself. The model should also be tested further as a supplementary tool in accident investigation.
Also, the model should be further developed quantitatively, to gain a better understanding of the
influences between the factors.
ix
Sammendrag
Flere nylige ulykker, slik som utblåsningen på Deepwater Horizon i 2010 og eksplosjonen på
Texas City raffineriet i 2005 har demonstrert behovet for bedre styring av risiko i komplekse sys-
temer. Dette for å unngå betydelige tap av verdier som menneskeliv, økonomiske verdier og
miljø. Overvåking av risiko er et sentralt element i risikostyringprosessen. Derfor er målet med
denne masteroppgaven å bruke en generisk metodikk for identifisering av storulykkesrisikoindika-
torer på et case relevant for offshore boringsaktiviteter. I denne metoden utvikles en faktor-
modell som illustrerer hvordan risikopåvirkende faktorer påvirker sannsynligheten for og kon-
sekvensene av en utblåsningshendelse. Faktormodeller utviklet med metoden kan brukes til
å visualisere de mest kritiske faktorene som er relevante for storulykkesrisiko og viser hvor-
dan ulike faktorer henger sammen. Det viser også avhengigheter mellom faktorene. Denne
typen kvalitativ oversikt kan føre til en mer helhetlig forståelse av arbeidsprosesser og forbedret
risikobevissthet i hele organisasjonen.
Relevant teori om brønn- og boringsaktiviteter blir introdusert i kapittel 3, metodikken blir pre-
sentert i kapittel 4 og anvendelse av metodikken er utført i kapittel 5. Formålet med anvendelsen
er å utvikle faktorer og indikatorer for å overvåke storulykkesrisiko forbundet med utblåsninger
i boreoperasjoner. Denne hendelsen er valgt fordi ukontrollerte utslipp av hydrokarboner i form
av utblåsning er en stor bidragsyter til det totale risikobildet i brønn- og boringsaktiviteter og har
tidligere forårsaket katastrofale storulykker. Det er til sammen 27 sannsynlighets-påvirkende
faktorer og ni konsekvens-påvirkende faktorer i faktormodellene som er utviklet i denne mas-
teroppgaven. I avsnitt 5.3 blir faktormodellen testet ved å bruke rammeverket i en retrospek-
tiv analyse av ulike granskningsrapporter fra fem nylige ulykker. Faktorene er knyttet til ob-
servasjoner fra granskningsrapporter og klassifisert i henhold til tilstanden som er beskrevet i
granskningsrapportene. Resultatene fra testingen indikerer at faktormodellen kan være et nyt-
tig supplerende verktøy for granskninger, og hovedkonklusjonen er at funnene fra granskninger
i stor grad passer inn i faktormodellen, og at noen funn var vanskeligere å plassere enn andre.

x
Avsnitt 5.4 viser indikatorene som har blitt identifisert i oppgaven. Datakilder, målefrekvens
og spesifikke klassifiseringsdimensjoner er ikke forklart, fordi dette faller utenfor omfanget av
masteroppgaven. En viktig anbefaling for videre arbeid er at den modellen som har blitt utviklet
bør implementeres og testes både i risikostyrings- og i granskningsarbeid for å oppnå mer er-
faring med både bruken av metodikken og selve modellen. Modellen bør også videreutvikles
kvantitativt, for å få en bedre forståelse av påvirkningen mellom faktorene.
Contents
Assignment Text i
Preface . . . . . . . . . . . . . . . . . . . . . . . . . . . . . . . . . . . . . . . . . . . . . . . . v
Summary . . . . . . . . . . . . . . . . . . . . . . . . . . . . . . . . . . . . . . . . . . . . . . . vii
1 Introduction 1
1.1 Background . . . . . . . . . . . . . . . . . . . . . . . . . . . . . . . . . . . . . . . . . . 1
1.2 Objectives . . . . . . . . . . . . . . . . . . . . . . . . . . . . . . . . . . . . . . . . . . . 3
1.3 Limitations . . . . . . . . . . . . . . . . . . . . . . . . . . . . . . . . . . . . . . . . . . . 3
1.4 Approach . . . . . . . . . . . . . . . . . . . . . . . . . . . . . . . . . . . . . . . . . . . . 4
1.5 Structure of the Report . . . . . . . . . . . . . . . . . . . . . . . . . . . . . . . . . . . . 4
2 Definitions and abbreviations 5
2.1 Definitions . . . . . . . . . . . . . . . . . . . . . . . . . . . . . . . . . . . . . . . . . . . 5
2.2 Abbreviations . . . . . . . . . . . . . . . . . . . . . . . . . . . . . . . . . . . . . . . . . 7
3 Well Construction and Field Development 9
3.1 Description of a Basic Well System . . . . . . . . . . . . . . . . . . . . . . . . . . . . . 10
3.2 Drilling of Offshore Wells . . . . . . . . . . . . . . . . . . . . . . . . . . . . . . . . . . 11
3.3 Deepwater Drilling Challenges . . . . . . . . . . . . . . . . . . . . . . . . . . . . . . . 14
3.4 Blowouts in Offshore Drilling Activities . . . . . . . . . . . . . . . . . . . . . . . . . . 16
3.4.1 Prevention of Blowouts . . . . . . . . . . . . . . . . . . . . . . . . . . . . . . . 17
4 Methodology for Identification of Major Accident Indicators 19
4.1 Step 1: Identification of Major Accident Types . . . . . . . . . . . . . . . . . . . . . . 20
xi
CONTENTS xii
4.1.1 "Event" as a Term . . . . . . . . . . . . . . . . . . . . . . . . . . . . . . . . . . . 21
4.2 Step 2: Identification of Risk Influencing Factors . . . . . . . . . . . . . . . . . . . . . 22
4.2.1 "Risk Influencing Factor" as a Term . . . . . . . . . . . . . . . . . . . . . . . . 22
4.2.2 Identification of Risk Influencing Factors . . . . . . . . . . . . . . . . . . . . . 23
4.3 Step 3: Identification of Influence in the Model . . . . . . . . . . . . . . . . . . . . . 24
4.3.1 Layering and Illustration of the Factor Model . . . . . . . . . . . . . . . . . . 24
4.4 Step 4: Identification of Major Accident Risk Indicators . . . . . . . . . . . . . . . . 26
4.4.1 "Indicator" as a Term . . . . . . . . . . . . . . . . . . . . . . . . . . . . . . . . . 28
4.4.2 Difficulties Regarding the Use of Risk Indicators . . . . . . . . . . . . . . . . . 30
4.4.3 Identification of Indicators . . . . . . . . . . . . . . . . . . . . . . . . . . . . . 31
4.5 Strengths and Limitations of the Methodology . . . . . . . . . . . . . . . . . . . . . 32
5 Case Study - Blowouts in Drilling Operations 33
5.1 Identification of Risk Influencing Factors . . . . . . . . . . . . . . . . . . . . . . . . . 34
5.2 The Factor Model . . . . . . . . . . . . . . . . . . . . . . . . . . . . . . . . . . . . . . . 36
5.2.1 Model for Probability Influencing Factors . . . . . . . . . . . . . . . . . . . . . 36
5.2.2 Model for Consequence Influencing Factors . . . . . . . . . . . . . . . . . . . 39
5.3 Validation and Testing of the Model . . . . . . . . . . . . . . . . . . . . . . . . . . . . 40
5.3.1 Results From Analysis . . . . . . . . . . . . . . . . . . . . . . . . . . . . . . . . 41
5.4 Identification of Risk Indicators . . . . . . . . . . . . . . . . . . . . . . . . . . . . . . 54
5.4.1 Indicators for Probability Influencing Factors . . . . . . . . . . . . . . . . . . 56
5.4.2 Indicators for Consequence Influencing Factors . . . . . . . . . . . . . . . . . 59
6 Discussion and Concluding Remarks 61
6.1 Discussion of the Case Study . . . . . . . . . . . . . . . . . . . . . . . . . . . . . . . . 61
6.2 Concluding Remarks and Recommendations for Further Work . . . . . . . . . . . . 63
A Pre-study Report 65
A.1 Preface . . . . . . . . . . . . . . . . . . . . . . . . . . . . . . . . . . . . . . . . . . . . . 65
A.2 Background . . . . . . . . . . . . . . . . . . . . . . . . . . . . . . . . . . . . . . . . . . 65
A.3 Main Objective . . . . . . . . . . . . . . . . . . . . . . . . . . . . . . . . . . . . . . . . 66
A.4 Project Description . . . . . . . . . . . . . . . . . . . . . . . . . . . . . . . . . . . . . . 66
CONTENTS xiii
A.5 Work Scope . . . . . . . . . . . . . . . . . . . . . . . . . . . . . . . . . . . . . . . . . . 67
B Additional Information on Risk Influencing Factors 69
C Additional Information from Investigations 81
C.1 Blowout at Deepwater Horizon/Macondo - 2010 . . . . . . . . . . . . . . . . . . . . 82
C.2 Blowout at Snorre A - 2004 . . . . . . . . . . . . . . . . . . . . . . . . . . . . . . . . . . 88
C.3 Well Kick during Drilling Activities on Gullfaks C - 2010 . . . . . . . . . . . . . . . . 93
C.4 Blowout at Montara - 2009 . . . . . . . . . . . . . . . . . . . . . . . . . . . . . . . . . . 96
C.5 Well Kick at Valhall - 2003 . . . . . . . . . . . . . . . . . . . . . . . . . . . . . . . . . . 99
D Additional Information on Risk Indicators 103
Bibliography 109

List of Figures
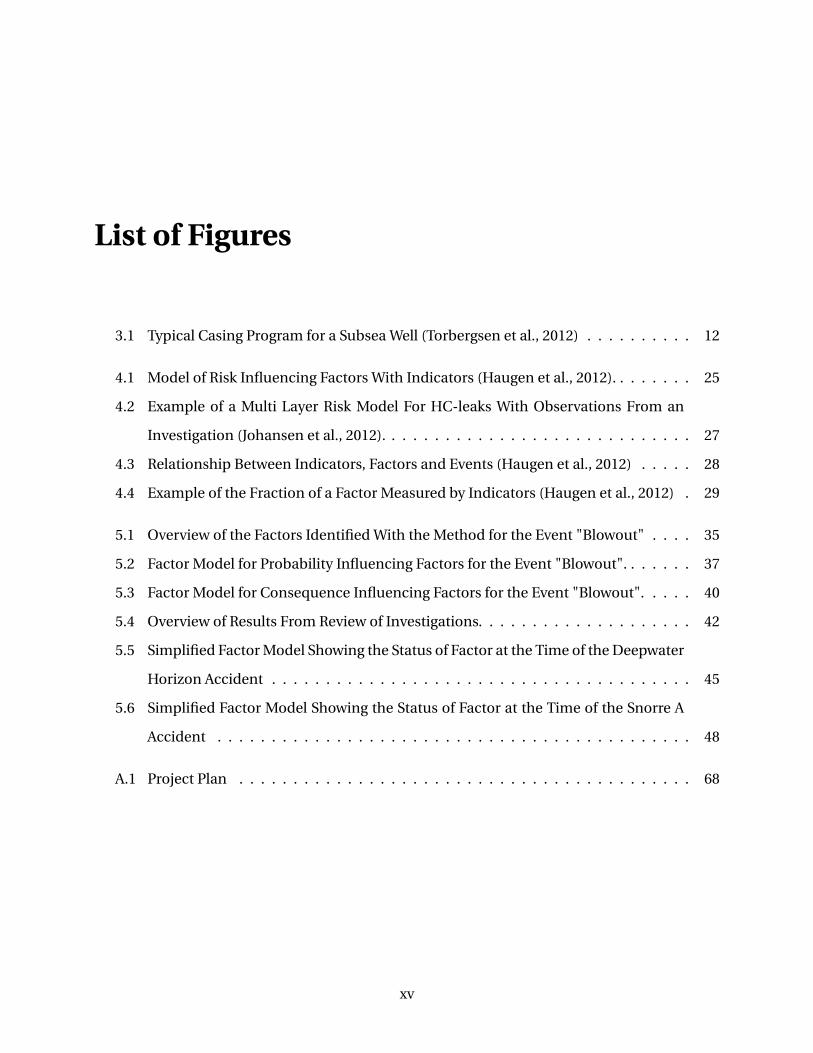
3.1 Typical Casing Program for a Subsea Well (Torbergsen et al., 2012) . . . . . . . . . . 12
4.1 Model of Risk Influencing Factors With Indicators (Haugen et al., 2012). . . . . . . . 25
4.2 Example of a Multi Layer Risk Model For HC-leaks With Observations From an
Investigation (Johansen et al., 2012). . . . . . . . . . . . . . . . . . . . . . . . . . . . . 27
4.3 Relationship Between Indicators, Factors and Events (Haugen et al., 2012) . . . . . 28
4.4 Example of the Fraction of a Factor Measured by Indicators (Haugen et al., 2012) . 29
5.1 Overview of the Factors Identified With the Method for the Event "Blowout" . . . . 35
5.2 Factor Model for Probability Influencing Factors for the Event "Blowout". . . . . . . 37
5.3 Factor Model for Consequence Influencing Factors for the Event "Blowout". . . . . 40
5.4 Overview of Results From Review of Investigations. . . . . . . . . . . . . . . . . . . . 42
5.5 Simplified Factor Model Showing the Status of Factor at the Time of the Deepwater
Horizon Accident . . . . . . . . . . . . . . . . . . . . . . . . . . . . . . . . . . . . . . . 45
5.6 Simplified Factor Model Showing the Status of Factor at the Time of the Snorre A
Accident . . . . . . . . . . . . . . . . . . . . . . . . . . . . . . . . . . . . . . . . . . . . 48
A.1 Project Plan . . . . . . . . . . . . . . . . . . . . . . . . . . . . . . . . . . . . . . . . . . 68
xv

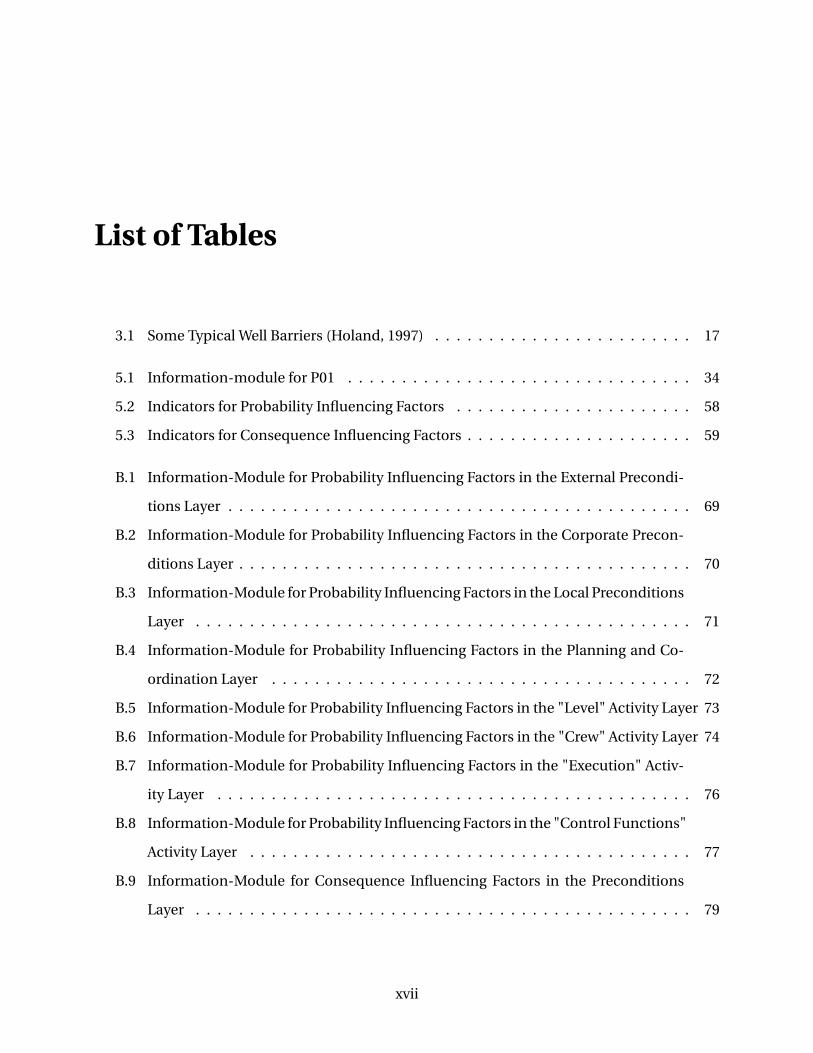
List of Tables
3.1 Some Typical Well Barriers (Holand, 1997) . . . . . . . . . . . . . . . . . . . . . . . . 17
5.1 Information-module for P01 . . . . . . . . . . . . . . . . . . . . . . . . . . . . . . . . 34
5.2 Indicators for Probability Influencing Factors . . . . . . . . . . . . . . . . . . . . . . 58
5.3 Indicators for Consequence Influencing Factors . . . . . . . . . . . . . . . . . . . . . 59
B.1 Information-Module for Probability Influencing Factors in the External Precondi-
tions Layer . . . . . . . . . . . . . . . . . . . . . . . . . . . . . . . . . . . . . . . . . . . 69
B.2 Information-Module for Probability Influencing Factors in the Corporate Precon-
ditions Layer . . . . . . . . . . . . . . . . . . . . . . . . . . . . . . . . . . . . . . . . . . 70
B.3 Information-Module for Probability Influencing Factors in the Local Preconditions
Layer . . . . . . . . . . . . . . . . . . . . . . . . . . . . . . . . . . . . . . . . . . . . . . 71
B.4 Information-Module for Probability Influencing Factors in the Planning and Co-
ordination Layer . . . . . . . . . . . . . . . . . . . . . . . . . . . . . . . . . . . . . . . 72
B.5 Information-Module for Probability Influencing Factors in the "Level" Activity Layer 73
B.6 Information-Module for Probability Influencing Factors in the "Crew" Activity Layer 74
B.7 Information-Module for Probability Influencing Factors in the "Execution" Activ-
ity Layer . . . . . . . . . . . . . . . . . . . . . . . . . . . . . . . . . . . . . . . . . . . . 76
B.8 Information-Module for Probability Influencing Factors in the "Control Functions"
Activity Layer . . . . . . . . . . . . . . . . . . . . . . . . . . . . . . . . . . . . . . . . . 77
B.9 Information-Module for Consequence Influencing Factors in the Preconditions
Layer . . . . . . . . . . . . . . . . . . . . . . . . . . . . . . . . . . . . . . . . . . . . . . 79
xvii
LIST OF TABLES xviii
B.10 Information-Module for Consequence Influencing Factors in the Planning and
Coordination Layer . . . . . . . . . . . . . . . . . . . . . . . . . . . . . . . . . . . . . . 79
B.11 Information-Module for Consequence Influencing Factors in the "Execution" Ac-
tivity Layer . . . . . . . . . . . . . . . . . . . . . . . . . . . . . . . . . . . . . . . . . . . 80
B.12 Information-Module for Consequence Influencing Factors in the "Control Func-
tions" Activity Layer . . . . . . . . . . . . . . . . . . . . . . . . . . . . . . . . . . . . . 80
D.1 Additional Information Concerning Indicators . . . . . . . . . . . . . . . . . . . . . . 108
Chapter 1
Introduction
This master thesis will focus on offshore drilling operations with relevance to operations in the
North Sea. Risk influencing factors which can lead to major accidents in such operations and
major accident risk indicators which can provide early warnings of potential blowouts are iden-
tified in the thesis. This chapter will give some background to the topics, present the problem
formulation, state the objectives, limitations, approach and structure of the thesis.
1.1 Background
Due to several recent catastrophies, the focus on major accidents has been increasing over the
few last decades. These accidents have demonstrated the need for better control of risk in com-
plex systems in order to avoid substantial losses of assets such as human lives, economic values
and the environment. Monitoring of risk is a key element in the overall risk management pro-
cess, but this can often be difficult since accidents are rare and monitoring often requires the use
of indirect measures. Lately, the need to monitor such risks has become an increasingly impor-
tant topic within risk management. Installations like the Texas City refinery and the Deepwater
Horizon drilling rig were renowned for their statistics in personnel risk, but after major acci-
dents, the use of indicators such as the Lost Time Incident-rate has led to increased awareness
that monitoring also needs to provide early warning for major accidents (Hopkins, 2009).
1
CHAPTER 1. INTRODUCTION 2
The exploration and development of offshore oil and gas fields involve a number of risks which
can lead to major accidents. It is therefore crucial that risks are kept at an acceptably low level
in drilling and well operations. Uncontrolled release of pressurized hydrocarbons in the form
of blowouts is a large contributor to the total risk picture and have caused catastrophic major
accidents in the past. A blowout can be defined as: an incident where formation fluid flows
out of the well or between formation layers after all the predefined technical well barriers or the
activation of the same have failed (Holand, 2011). Particularly, the 2010 blowout on the Macondo
rig which led to eleven deaths and the worst environmental disaster in US history has raised
serious concerns about the safety level of deepwater drilling. In Norway, the Petroleum Safety
Authority (PSA) has developed a methodology and an extensive set of indicators (RNNP), but
the data material today is not sufficient to reliably measure trends on a company or installation
level. There is also increased awareness in the industry that many different factors influence
major accident risk and that these may be difficult to get an overview over.
Problem Formulation
In agreement with the supervisors, the problem formulation for the master thesis is as follows:
• Literature survey — review and summarize relevant literature and get familiar with rele-
vant drilling/well operations
• Identify risk influencing factors and build a factor model describing the links between the
factors
• Identify potential indicators for the risk influencing factors
• Summarize, conclude and provide recommendations for further work
CHAPTER 1. INTRODUCTION 3
1.2 Objectives
The objective of the master thesis is to apply a generic methodology for the identification of
major accident risk indicators for offshore drilling activites and to develop a factor model which
illustrates how risk influencing factors influence the probability and consequences of an off-
shore blowout event. Another objective is to gain insight into the topic of Risk Indicators and
risks involved in offshore drilling activities.
The objectives are met by the following steps:
• Conduct a literature review which summarizes the relevant literature
- Define and explain how the various elements of the qualitative model in the methodology can
be interpreted and understood
- Define and explain aspects of offshore drilling and blowouts which will be relevant for devel-
opment of the the factor model
• Develop a factor model and identify indicators by applying the methodology
• Summarize the work done in this thesis and give recommendations for further work
1.3 Limitations
The focus of the modelling and analysis is limited to blowouts in offshore drilling activities.
Though accidents in offshore drilling activites can occur due to a number of other reasons as
well (i.e. hydrocarbon leaks, ship collisions, helicopter accidents, mooring failures and stability
problems), blowouts are typically the scenario that contributes most to major accident risk at
an offshore drilling rig and the master thesis will therefore be limited to this event. Since several
of the steps in the methodology is usually done in teams with operational expertise, knowledge
and experience with offshore drilling, this master thesis is therefore limited by the lack of this in-
depth expertise. Therefore, the modelling and identification is done based on the information
provided in the literature and investigations used, with the weaknesses this may entail.
CHAPTER 1. INTRODUCTION 4
1.4 Approach
This master thesis is a sequel to the project assignment (Tranberg (2012)). The project thesis was
mainly performed as a literature study which describes and evaluated the methodology which is
to be used in this master thesis. The project thesis also contained a preliminary literature review
on indicators.
The approach in this master thesis is further literature study. The objectives of the master the-
sis will be met by using both supplied and additional literature from many different institu-
tions. Much of the source literature will be supplied by the supervisor at Safetec Nordic AS, as
the methodology used in the thesis was developed by Safetec. Investigations into specific ac-
cidents/incidents will also be reviewed. The use of various sources, both research in general
and investigations of specific events, to establish the most relevant factors and indicators will
be crucial for development of a useful model and indicator set.
The last part of the thesis will consist of a summary and discussion of the findings, as well as
recommendations for further work.
1.5 Structure of the Report
The rest of the report is structured as follows: Chapter 2 defines central terms in the thesis and
abbrevations used. Chapter 3 presents relevant drilling and well activities. Chapter 4 intro-
duces central theory concerning risk influencing factors and major accident risk indicators, as
well as the methodology for the master thesis. In Chapter 5 the methodology is applied to the
drilling and well activities and the factor model and indicators which have been identified are
presented and justified. Chapter 6 presents some concluding remarks for the master thesis and
recommendations for further work. Additional information on factors, indicators and results
from review of investigations can be found in the appendices.
Chapter 2
Definitions and abbreviations
2.1 Definitions
Accident - a sudden, unwanted and unplanned event or event sequence that leads to harm to
people, the environment, or other assets (Rausand, 2011).
Barrier - physical or engineered system or human action (based on specific procedures or ad-
ministrative controls) that is implemented to prevent, control, or impede released energy from
reaching the assets and causing harm (Rausand, 2011).
Consequence - outcome of an event affecting objectives (ISO, 2009).
Event - occurence or change of a particular set of circumstances (ISO, 2009).
Failure - termination of the ability of an item to perform a required function (ISO, 2010).
Hazard - source of potential harm (ISO, 2010).
Indicator - a measurable/operational variable that can be used to describe the condition of a
broader phenomenon or aspect of reality (Øien, 2001a).
Major accident/catastrophic event/Disaster - an event that could cause multiple fatalities and
extensive damage to property, system and production. It may cause a shutdown of the plant for
a significant time period and sometimes forever. It may also cause massive environmental effects.
5
CHAPTER 2. DEFINITIONS AND ABBREVIATIONS 6
Such an event recieves international media attention (Rathnayaka et al., 2011).
Risk - effect of uncertainty on objectives (ISO, 2009).
Risk Analysis - process to comprehend the nature of risk and to determine the level of risk (ISO,
2009).
Risk Assessment - overall process of risk identification, risk analysis and risk evaluation (ISO,
2009).
Risk evaluation - process of comparing the results of risk analysis with risk criteria to determine
whether the risk and/or its magnitude is acceptable or tolerable (ISO, 2009).
Risk identification - process of finding, recognizing and describing risks (ISO, 2009).
Risk Indicator - a measurable/operational definition of a RIF (Øien, 2001a).
Risk influencing factor (RIF) - an aspect (event/conditon) of a system or an activity that affects
the risk level of this system/activity (Øien, 2001a).
Safety - freedom from those conditions that can cause death, injury, occupational illness, damage
to or loss of equipment or property, or damage to the environment (DoD, 2000).
CHAPTER 2. DEFINITIONS AND ABBREVIATIONS 7
2.2 Abbreviations
BOP - Blowout Preventer
BORA - Barrier and Operational Risk Analysis
IO - Integrated Operations
HTHP - High-Temperature, High-Pressure well
OCS - Operational Condition Safety
PSA - Petroleum Safety Authority
QRA - Quantitative Risk Analysis
RIF - Risk influencing factor
Risk OMT - Risk modelling: Integration of Organizational, Human and Technical factors
RNNP - Risk level in the Norwegian petroleum industry

Chapter 3
Well Construction and Field Development
In order to create a basis for the identification of risk influencing factors and indicators, this
chapter will outline the main characteristics of well systems and offshore drilling activities by
literature review. The relevant accident scenario, offshore drilling blowouts, will also be de-
scribed in order to create a theoretical background for a later case study. The findings from this
chapter will be used later to create a model which will form the basis for identification of major
accident indicators for offshore drilling activities.
There are two main types of wells: Injection wells and Production wells. Production wells trans-
ports well fluids from the reservoir to the rest of the process facilities on the installation. In gas
injection wells, separated gas from production wells or imported gas is injected into the up-
per gas section of the reservoir. This injected gas is used to maintain the reservoir pressure. A
field will often incorporate a planned distribution of gas-injection wells for this purpose. Water
injection wells are common offshore (Corneliussen, 2006).
Field development can be divided into exploration, development, production and abandon-
ment phases (Torbergsen et al., 2012).
9
CHAPTER 3. WELL CONSTRUCTION AND FIELD DEVELOPMENT 10
3.1 Description of a Basic Well System
Although each well system’s design is adapted for a specific purpose and environment, it can be
valuable to describe the main characteristics of an offshore well by presenting a basic well. A
basic well consists of four main subsystems (Corneliussen, 2006):
The wellhead is the component at the surface of an oil or gas well. The wellhead serves a number
of functions both while the well is being drilled, in operation and in shut down. The wellhead
serves as an attachment point for a BOP and provides facilities for installing casing hangers
during well construction and for hanging the production tubing and installing the x-mas tree.
The x-mas tree is an assembly of valves, chokes and pressure gauges which controls the flow.
The well completion is the assembly of equipment placed inside the production casing, such
as safety valves and tubing hanger, to enable safe and efficient surface access to a pressurized
formation. The well completion gives access to the reservoir.
The casing program encompasses all casing and liner strings in a wellbore. The casing program
has several different functions, it provides protection against caving of formations and enables
the use of drilling fluids. The surface casing string also provides structural strength.
On a surface well, the wellhead, x-mas tree and production control system are positioned on the
platform. On subsea wells these systems are located on the seabed and the reservoir fluids are
transported from the well through a flowline and a riser to the platform (Corneliussen, 2006).
A well also has other functional components in addition to the four main subsystems, such as
tubing hanger and tubing head, which ensure attachment of the x-mas tree to the wellhead and
ensure that the tubing and annulus are hydraulically isolated. The production packer isolates
the annulus and anchors the bottom of the production tubing string. The seal assembly engages
in a sealbore to isolate the production tubing conduit from the annulus. The surface controlled
subsurface safety valve is a fail-safe downhole safety valve which can shut-in the well. The pro-
duction master valve is located on the x-mas tree and controls the flow from the wellbore. The
production wing valve is on the side of the x-mas tree and controls and isolates production.
Lastly, the swab valve is on top of the x-mas tree and provides access to the wellbore.
CHAPTER 3. WELL CONSTRUCTION AND FIELD DEVELOPMENT 11
3.2 Drilling of Offshore Wells
Drilling for oil consists first of finding reservoir zones of trapped hydrocarbons and then drilling
through the trap layers into the soil. The basic offshore wellbore construction process is not
significantly different than the rotary drilling process used for land-based drilling (NPC, 2011).
The main differences are the type of drilling rig used and modified methods in order to carry
out the operations in a more complex situation. Offshore drilling also has considerably higher
costs than land-based drilling, depending on water depth and well complexity, which requires a
larger volume of hydrocarbon reservoirs in order to be economically viable.
The first offshore drilling rig was constructed in the Gulf of Mexico in 1947. At this time, an oil
well operated at water that was just a few feet deep. In the following decades, however, thou-
sands of offshore drilling rigs went into operation all over the world, and by the 1980s, the need
for drilling deepwater arose. With declining production from near-shore, shallow waters, energy
companies shifted their focus on oil and gas resources in deepwater (Skogdalen et al., 2011).
"Deepwater" drilling means drilling for oil at depths deeper than 300 m, but many wells are
much deeper than that. Ultra-deepwater drilling is means at depths larger than 1500 m. Some
drilling operations have been performed in depths up to 3000 m.
According to Chief Counsel (2011), there are three phases to safely extract hydrocarbons from
an offshore deepwater reservoir.
1 - Drilling: Rig crews drill and reinforce a hole from the seafloor down through the trap layers
and into the reservoir zone. Hydrocarbons in the reservoir should not enter the wellbore.
2 - Completion: Rig crews open the wellbore to allow hydrocarbons to flow into it and install
equipment at the wellhead that allows control of the flow and collection the hydrocarbons.
3 - Production: The operator extracts hydrocarbons from the well.
The focus in this master thesis will be on the first phase, drilling, since accident records show
that most of the offshore blowouts have occured in the drilling phase (Holand, 1997). The master
thesis will be concerned mostly with deepwater drilling, as deepwater prospects often encounter
additional challenges to the challenges present in shallow-water drilling.
CHAPTER 3. WELL CONSTRUCTION AND FIELD DEVELOPMENT 12
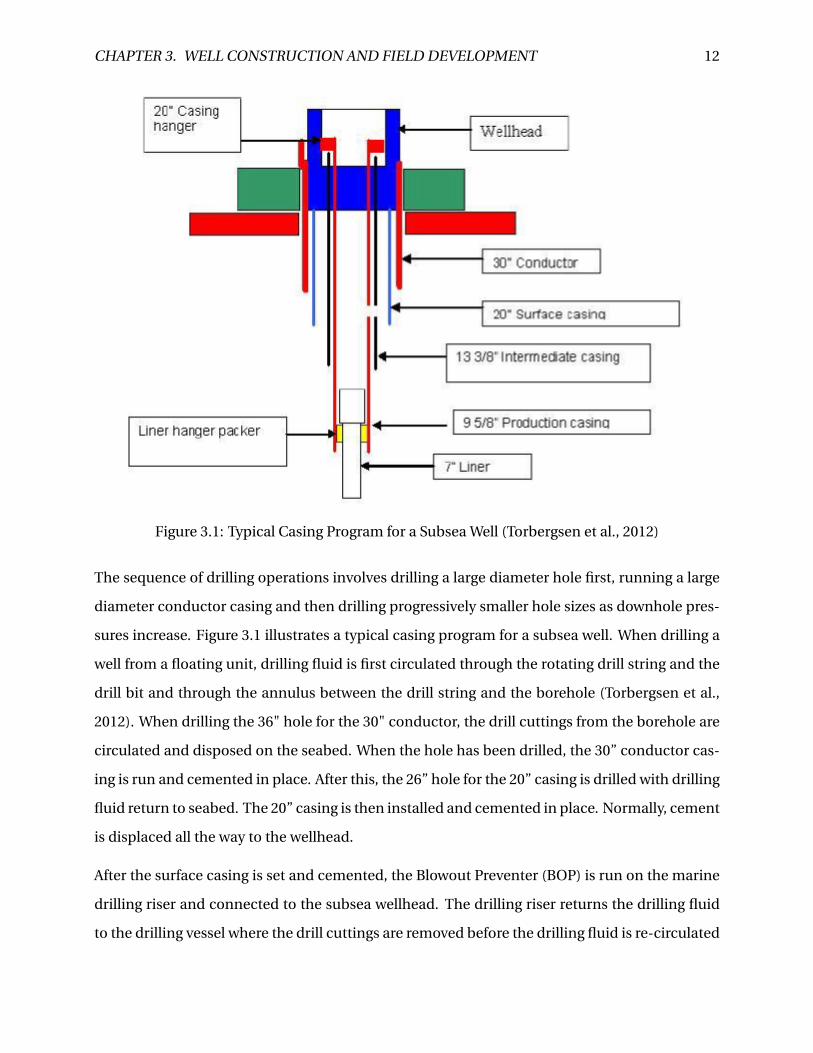
Figure 3.1: Typical Casing Program for a Subsea Well (Torbergsen et al., 2012)
The sequence of drilling operations involves drilling a large diameter hole first, running a large
diameter conductor casing and then drilling progressively smaller hole sizes as downhole pres-
sures increase. Figure 3.1 illustrates a typical casing program for a subsea well. When drilling a
well from a floating unit, drilling fluid is first circulated through the rotating drill string and the
drill bit and through the annulus between the drill string and the borehole (Torbergsen et al.,
2012). When drilling the 36" hole for the 30" conductor, the drill cuttings from the borehole are
circulated and disposed on the seabed. When the hole has been drilled, the 30” conductor cas-
ing is run and cemented in place. After this, the 26” hole for the 20” casing is drilled with drilling
fluid return to seabed. The 20” casing is then installed and cemented in place. Normally, cement
is displaced all the way to the wellhead.
After the surface casing is set and cemented, the Blowout Preventer (BOP) is run on the marine
drilling riser and connected to the subsea wellhead. The drilling riser returns the drilling fluid
to the drilling vessel where the drill cuttings are removed before the drilling fluid is re-circulated

CHAPTER 3. WELL CONSTRUCTION AND FIELD DEVELOPMENT 13
into the borehole. The next hole size will typically be 17 ½” and the intermediate casing string
will be 13 3/8”, as seen in Figure 3.1. Further, a 12 ¼” bit is used to drill the hole section for the 9
5/8” production casing. Finally, a 8 ½” bit is used to drill the hole section for the 7” casing string.
Normally, the 7” casing string is run as a liner. A liner is normally extended back to the wellhead
using a tie-back string.
For offshore drilling, a mechanically stable offshore platform or floating vessel must be pro-
vided. For offshore field development, different types of drilling rigs exist. Examples are bottom-
supported platforms and Mobile Offshore Drilling Units (MODU). Drilling a well from a seabed-
supported platform is less complicated compared to using an floating unit since there is no
movement of the vessel, and the BOP is located on the platform. This makes maintenance and
operations on the BOP more convenient. The conductor in normally installed using the ham-
mer technique to drive the pipe into the top hole formations. Then drilling continues more or
less as in subsea drilling. The main advantages of using platform drilling are access for monitor-
ing of the annulus, easy wellhead access and less complicated and lower cost well intervention
(Torbergsen et al., 2012).
Well completion prepares the well for production or injection. After drilling is completed, the
production tubing string and the subsea x-mas tree is installed. After this, a control umbilical
is used to control the x-mas tree and downhole functions and finally, a pipeline system is con-
nected to the x-mas tree for production or injection.
Well control is established by having barriers to prevent unwanted influxes of formation flu-
ids into the wellbore. Well control and barriers will be presented more thoroughly in section
3.4. Despite an increase in complexity of reservoirs in recent years, improvements in drilling
technology have allowed more complex well patterns to be drilled in greater depths. This has
allowed more energy to be produced with less environmental impact. These improved capa-
bilities include: complex directional and horizontal drilling, ultra-HTHP drilling and extreme
extended-reach drilling (NPC, 2011).
CHAPTER 3. WELL CONSTRUCTION AND FIELD DEVELOPMENT 14
3.3 Deepwater Drilling Challenges
The deep ocean presents both opportunity, attractions and many challenges for drilling activi-
ties. Good shallow water wells produce at rates of a few thousand barrels of oil a day, whereas
deepwater wells can commonly produce more than 10.000 barrels per day (Chief Counsel, 2011).
However, deepwater wells also involve major differences in drilling conditions. The corrosive ef-
fect of salt water and extreme pressures call for much tougher equipment. As much of the tech-
nology needed to extract oil is below the surface, this also makes maintenance and repairs very
difficult, since human divers cannot be sent deepwater. This makes fixing of problems much
more tedious.
According to Skogdalen et al. (2011), another important aspect of deepwater drilling is the use
of integrated operations (IO). Integrated operations means changes to organization, staffing,
management systems and technology, as well as the interaction between these. This can cause
some challenges, as it means that work is controlled and organized in real time, often in different
parts of the world.
Another main limitation when drilling in deep waters is the storage and handling weights of the
marine drilling riser and blowout preventer. In addition to changes in the underlying geology,
the greatly increased water depth requires different drilling approaches. In water depths greater
than a few hundred feet, wells are drilled using floating rather than bottom-based rigs (Chief
Counsel, 2011). Especially in depths greater than 300 m, floating facilities and subsea produc-
tion systems dominate.
Deepwater prospects encounter several challenges, such as huge costs, complex casing pro-
grams, high pressures, high temperatures, difficult formations, uncertain seismic data and lack
of experienced personnel (Skogdalen et al., 2011). Since there are few rigs in the marked today
which are capable of drilling in deepwater environment, the daily cost for such a rig can be very
high. Especially areas like the Gulf of Mexico have extreme challenges compared to other areas.
Water depths there can be greater than 3000 m, pressures over 690 bar, bottom hole tempera-
tures over 195◦C, problematic formations, deep reservoirs, tight sandstone reservoirs and fluids
with extreme flow assurance issues (Close et al., 2008). Drilling operations in such areas can
CHAPTER 3. WELL CONSTRUCTION AND FIELD DEVELOPMENT 15
therefore be extremely difficult, and must consist of very complex operations. This can often
lead to large risks.
Specifically, when drilling the 36" and 26" top hole sections, conductor installation can be more
complicated in deepwater due to lack of formation consolidation. This can cause failure of the
conductor installation. The formation close to the seabed in deepwater also often consists of
unstable clay. This can make it more difficult to use conventional drilling and cementing tech-
niques and makes it difficult to obtain complete displacement of the conductor cement.
Other top hole related problems includes boulders in the upper formation, which may restrict
the drilling operation and cause damage to the drillstring and disturbance of the desired verti-
cal well path. Boulders can also become obstacles which hinder the casing to reach the desired
setting depth when running the casing. Another top hole problem is the topic of pressure con-
trol. In some areas, the riser margin is difficult to obtain due to high pore pressure and/or low
fracture gradient. The mud weight required for riser margin may therefore cost lost circulation
as well as reduced hydrostatic head in the riser. This has the potential to cause an uncontrolled
blowout.
Shallow water flow can also be a significant problem in many deepwater areas, and drilling in
such areas may cause washouts and hole collapse. This may result in loss of the hole. Many
means for avoiding this exists, among others the use of a shallow water flow diverter can control
the back pressure from the well.
The drilling window in deepwater is narrow, and the narrower the window, the more difficult it
is to execute drilling operations (Skogdalen and Vinnem, 2012). Section 3.4 will look closer into
how the risks involved in deepwater drilling can develop into a blowout.
CHAPTER 3. WELL CONSTRUCTION AND FIELD DEVELOPMENT 16
3.4 Blowouts in Offshore Drilling Activities
A "blowout" can be defined as: an incident where formation fluid flows out of the well or between
formation layers after all the predefined technical well barriers or the activation of the same have
failed (Holand, 2011). The formation fluid may consist of natural gases, oil, saline water and/or
well fluids flowing into the atmosphere or an underground formation. A blowout is initiated by
a well kick, and this occurs when the formation pressure exceeds the wellbore pressure, lead-
ing to an unplanned flow into the wellbore. Underlying causes for a well kick may be an un-
expected change in the formation pressure, insufficient pore pressure predictions, insufficient
mud weight or a technical failure of the mud circulation system (Hauge et al., 2012). A kick can
have several possible outcomes, depending on the response of the barrier functions. Failure of
barrier functions can lead to a blowout, which causes hydrocarbons to flow through the drill
string or the annular to the installation. This may lead to ignition and a following fire and ex-
plosion in addition to hydrocarbon release to the environment. A blowout is one of the most
serious accidents which can occur to a rig and its crew and can result in massive damage both
to the marine environment and eco-systems.
Drilling blowouts may occur at nearly all well depths. According to Holand (1997), a blowout is
categorized as "shallow" if one or more of the following things are true: the well depth is less
than 1500 m, shallow gas is stated as the flow medium, only the conductor casing is run, the
BOP is not installed on the wellhead, the gas flow is diverted and no attempts are made to close
in the well and/or the actual blowout dource reservoir is far from the target reservoir. All drilling
blowouts not classified as shallow gas blowouts are classified as "deep".
The potential of a blowout varies with the design of the well, the type of flowing fluid and forma-
tion characteristics. Depending on the installation type, location of wells, well type and similar
characteristics, blowouts represent an important contribution to the total fatality risk in offshore
oil and gas exploration activities (Corneliussen, 2006). In Holand (1997) it is estimated that the
FAR (fatal accident rate, or the expected number of fatalities per 108 hours of exposure) contri-
bution from blowouts in all well phases represent between 3.5% and 7.2% of the total fatality
risk in offshore oil and gas exploration activities in the Gulf of Mexico and the North sea regions.
CHAPTER 3. WELL CONSTRUCTION AND FIELD DEVELOPMENT 17
3.4.1 Prevention of Blowouts
The standard NORSOK D-010 focuses on well integrity by defining the minimum functional and
performance-oriented requirements and guidelines for well design, planning and execution of
well operations in Norway (NORSOK, 2004). Well integrity is defined in the standard as: the
application of technical, operational and organizational solutions to reduce risk of uncontrolled
release of formation fluids. An uncontrolled release of formation fluids can either be defined as
a "blowout" or a "well release". The difference between a blowout and well release is that in
well release, the flow is stopped by the existing barrier system, while a blowout means that pre-
existing barriers have failed to stop the flow. NORSOK D-010 therefore focuses on the prevention
of blowouts, as a well should be designed to minimize the blowout risk.
The means to reduce risk of accidents such as blowouts are called safety barriers. Safety barriers
are physical or non-physical means which should prevent, control, or mitigate undesired events.
Well barriers are envelopes of one or several dependent well barrier elements which prevents
fluids or gases from unintentional flow (NORSOK, 2004). According to the NORSOK-standard,
well barriers are to be defined prior to commencement of an activity or operation in relations to
specfic acceptance criteria.
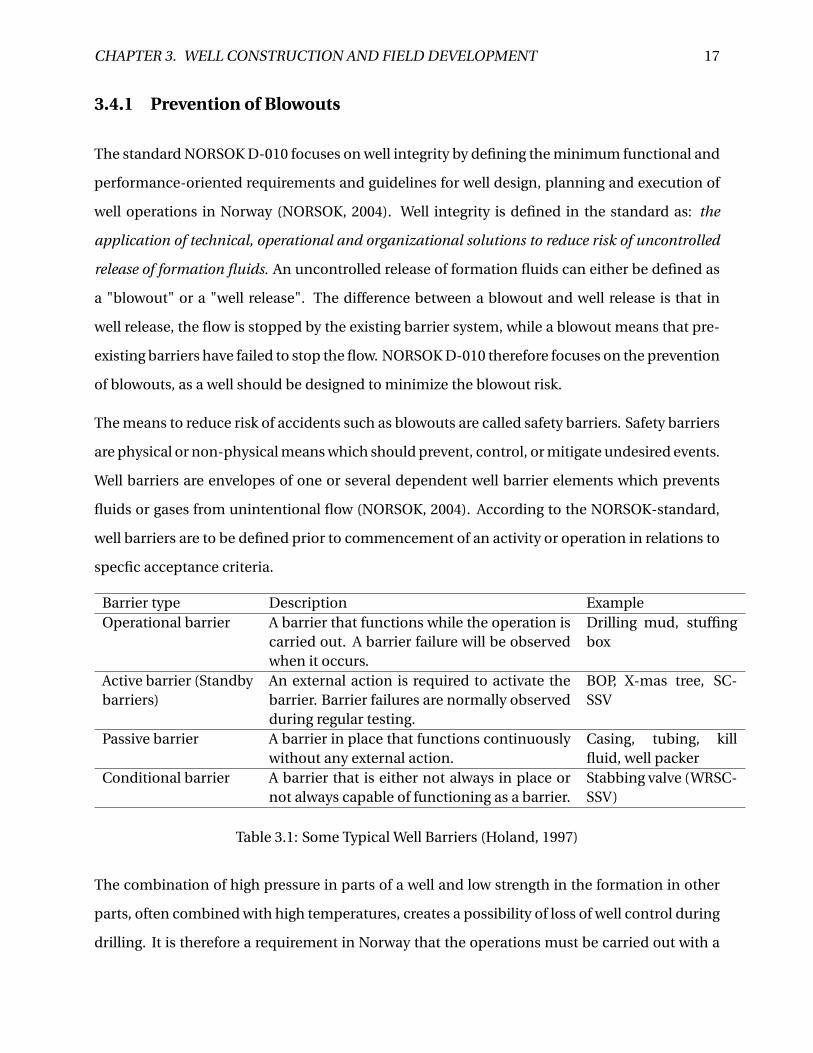
Barrier type Description ExampleOperational barrier A barrier that functions while the operation is
carried out. A barrier failure will be observedwhen it occurs.
Drilling mud, stuffingbox
Active barrier (Standbybarriers)
An external action is required to activate thebarrier. Barrier failures are normally observedduring regular testing.
BOP, X-mas tree, SC-SSV
Passive barrier A barrier in place that functions continuouslywithout any external action.
Casing, tubing, killfluid, well packer
Conditional barrier A barrier that is either not always in place ornot always capable of functioning as a barrier.
Stabbing valve (WRSC-SSV)
Table 3.1: Some Typical Well Barriers (Holand, 1997)
The combination of high pressure in parts of a well and low strength in the formation in other
parts, often combined with high temperatures, creates a possibility of loss of well control during
drilling. It is therefore a requirement in Norway that the operations must be carried out with a
CHAPTER 3. WELL CONSTRUCTION AND FIELD DEVELOPMENT 18
set of barriers (PSA, 2008). The barriers in a well are present to prevent three main categories
of undesired events: well inflow (also known as a "kick"), well leakage and blowouts. According
to Norwegian regulations, a well should have at least two independent and tested well barriers
in all operations. The primary well barrier is the first obstacle against undesirable flow from the
source. The secondary well barrier prevents further unwanted flow should the primary well bar-
rier fail (PSA, 2008). The two-barrier principle is followed both in the U.K. and the U.S. Gulf of
Mexico even though this is not stated explicitly in the regulations (Holand, 1997). During sub-
sea drilling activities, the primary barrier is the fluid (mud) column that balances the reservoir
pressure and the secondary barrier is the blowout preventer combined with structural barrier
elements such as the wellhead and casing (Hauge et al., 2012)
The primary well control barriers include physical barriers and active human/operational bar-
riers (Luning et al., 2013). Physical barriers comprise the fluid column and other physical bar-
riers which retain integrity, such as casing and drilling string. Human/operational barriers are
operator procedures that contribute to the primary well control activity. The primary well bar-
rier should prevent well kicks. The secondary well control barrier directs the well response af-
ter a well kick is signaled. The secondary barrier contains physical barriers on the wellhead,
active barriers like the BOP, inside blowout prevention instruments, diverter and active hu-
man/organizational barriers.
According to PSA (2008) the barriers used during drilling may consist of a blowout preventer
(BOP) and a homogeneous drilling fluid column. The blowout preventer has valves which can
close around the drill string, and sever the string and plug the wellbore in case of an emergency.
In addition, there must be a set of valves on the facility itself or on the seabed which can shut
down the production flow (x-mas tree).
A significant contribution to the overall major accident risk comes from drilling and well-related
activites (Arbeidsdepartementet, 2006). For this reason, competence and training of drilling and
well personnel are defined through industry standards and guidelines in Norway. Norwegian,
British, Danish and Dutch governments are aiming to develop a common understanding and
monitoring of industry in this area.
Chapter 4
Methodology for Identification of Major
Accident Indicators
This chapter will clarify the terms "Risk Influencing Factor" and "Major Accident Risk Indica-
tor", and how these terms are defined in the methodology used in this thesis. The chapter will
also introduce the methodology which will be used in the thesis to identify risk influencing fac-
tors and major accident risk indicators for offshore drilling activities. The conference paper “A
generic method for identifiying major accident risk indicators” (Haugen et al., 2012) describes
the generic method for the identification of risk indicators. The conference paper will be used
as a basis for the introduction of the methodology.
The main reasoning behind the methodology was to develop a generic framework which can be
used to identify more suitable indicators for the monitoring of major accident risk. The method-
ology uses influence modelling to illustrate risk and a factor model is developed to assist with
the identification of potential indicators for major accidents. The factor model can be said to
be a graphical representation of the various risk influencing factors and the model describes the
possible causes and potential effects of any changes in the condition/status of a risk influencing
factor. The factor model also describes the interactions between different risk influencing fac-
tors and the significance that each RIF has on the risk level associated with a specfic accident.
Another purpose of this chapter is to describe and clarify how the various elements of a factor
19
CHAPTER 4. METHODOLOGY FOR IDENTIFICATION OF MAJOR ACCIDENT INDICATORS 20
model can be interpreted and understood.
The methodology assumes that there are RIFs which have influence on the level of risk associ-
ated with an accident. The factors are organized into a factor model where factors may have
direct and /or indirect impact on the level of risk.
The factor model is used to identify indicators for the various factors in the model. The method-
ology structure can be outlined as follows:
Step 1: Identification of the major accident types that should be monitored. Options of what
types of accidents that are relevant may be made on the basis of an existing QRA, or similar
knowledge of the system. In practice, two factor models are created for each accident, one for
probability influencing factors, and one for consequence influencing factors. For each accident
type that is identified, steps 2 through 4 need to be repeated.
Step 2: Identification of the Risk Influencing Factors (RIFs) associated with the event type. This
can be performed in a stepwise manner, by first identifying the factors which influence the event
directly, and then identify the aspects which influence the performance of these factors.
Step 3: Identification of the links of the RIFs between the event or other RIFs with arrows show-
ing the influence. A factor may have any number of relationships with other factors. Factors are
structured in such a way that their influence will never point backwards in the model.
Step 4: Identification of one or more indicators for each RIF which measure characteristics of the
factor. An indicator set will measure the condition or status of a factor. If a RIF can be measured
directly, it can serve as an indicator. Indicators are implemented as factors in the model.
The following sections in this chapter will clarify the terms used in the methodology and go into
more detail of what the different steps in the method entail.
4.1 Step 1: Identification of Major Accident Types
The first step in the methodology is to identify the major accident types and events that should
be monitored. For each factor model developed with the methodology, an event that represents
CHAPTER 4. METHODOLOGY FOR IDENTIFICATION OF MAJOR ACCIDENT INDICATORS 21
the type of accident must be identified. It is important that the events used can cover all possi-
ble event chains which can develop into the same accident type in the best way possible. This
is because a major accident is the result of a chain of events which develops from a safe state
and several different event chains could lead to the same type of major accident. Though the
method is generic, it is not focused on generic indicators as such, but rather identification of in-
fluencing factors for the specific event types that are relevant to consider for a given installation
or operation. The event types should therefore not be too specific.
4.1.1 "Event" as a Term
The term "event" can in this methodology be defined to be the first significant deviation from
normal operation. The reasoning behind this definition is that the factors on the probability
influencing part of the model will then be related to normal operations, while the consequence
influencing side will include factors related to crisis management. This causes modeling of the
factors that are related to the normal operation to be in in one factor model and the factors
related to the organization’s ability to respond to an accident in another. This gives, for each
event, one model that can be used to assess the organization’s ability to handle normal operation
and one for crisis management.
To separate events according to normal operation and crisis management can detect problems
such as a difference in the organizations ability to handle normal operations vs. times of crisis.
Since the definition of an event is the first significant deviation from normal operation, it opens
possibilities for a factor model which could help to identify challenges in both these areas. An
example of this is the Snorre A blowout in 2004. Investigations revealed several discrepancies re-
lated to the operation of drilling operations, where several of these problems had been present
in the organization for a long time (Rosness et al., 2010). This represents the normal opera-
tion in this case. In contrast, the organization’s ability to manage a gas blowout was good, and
prevented the incident from developing into a major accident. A factor model and indicators
analyzing the normal operation in this case could have revealed these problems at an earlier
time, thereby preventing the initial incident.
CHAPTER 4. METHODOLOGY FOR IDENTIFICATION OF MAJOR ACCIDENT INDICATORS 22
4.2 Step 2: Identification of Risk Influencing Factors
In step 2 of the methodology, all factors which may influence the risk associated with the event
type must be identified. These factors are named RIFs (Risk Influencing Factors). Both factors
which influence the event directly and factors which only influence the event through other
factors should be identified, to a level of detail which is appropriate.
4.2.1 "Risk Influencing Factor" as a Term
A "risk influencing factor" can be defined as an aspect (event/condition) of a system or an activ-
ity that affects the risk level of this system/activity (Øien, 2001b). It is important to note that a
RIF is in this context defined as an aspect of a system or an activity, of which status/condition
directly or indirectly may influence the probability of a major accident to occur. The condition
or status of a RIF can therefore influence the probability of the occurence of a major accident
either directly or indirectly. Also, the effects described in the definition can be both positive and
negative. That is, the influence of one factor may result in lower or higher risk, depending on
the condition of the factor.
A factor may either be defined as technical, operational or organizational. Technical factors
typically include technical systems like barriers which have been implemented to prevent or
reduce the impact of an event. Operational factors typically refer to safety critical operations
such as maintenance and inspections, while organizational factors often influence risk or safety
at an organizational or managerial level, e.g. the level of competence or supervision (Haugen
et al., 2012). When identifying barrier-related factors, it is especially important to distinguish
between the barrier itself that may prevent, control, or mitigate the event sequence or accident
scenario directly and the risk influencing factors that influence the barrier performance (Sklet,
2006). A function that has an indirect effect is therefore not classified as a barrier function, but
as a risk influencing factor/function.
CHAPTER 4. METHODOLOGY FOR IDENTIFICATION OF MAJOR ACCIDENT INDICATORS 23
4.2.2 Identification of Risk Influencing Factors
Two main principles are applied when identifying RIFs: (1) logical reasoning combined with
knowledge of the system and activities being considered and (2) information from accidents,
near misses and risk assessments of the relevant major accident types. The identification pro-
cess should also be based on a diversity of perspectives on risk. Though the definition of a RIF
is somewhat unclear as to what can be a factor, the factor model of probability for hydrocar-
bon leakage, presented in Haugen et al. (2012), contains both factors associated with technical
systems and management systems as well as factors outside of the control of the operating or-
ganization. The relevant aspects that affect the risk of an event be related to, but not limited to:
the environment, technical systems, the organization and activities.
A RIF is in principle a theoretical variable. It is therefore not necessarily specified how to mea-
sure a RIF. Quantitative Risk Analysis often provides a useful basis for identification of RIFs,
though the RIFs of each accidental event are not gathered and listed at one specific place in
the QRA. The QRA therefore has to be searched for the identification of the RIFs (Øien, 2001b).
Other methods can also be used for the identification of factors: governing documents, overview
of barriers, other risk assessments, accident investigations or causal analysis. In addition to re-
sults from risk analysis, access to a generic list of relevant factors can be good support in efforts
to identify relevant factors. Reports of accidents and near misses can also provide useful infor-
mation about relevant factors.
In the factor model, the various factors are often divided into layers. Three main layers are
often used: (1) preconditions, (2) planning and coordination and (3) activity. The preconditions
layer is often divided into external, corporate and local preconditions, while the activity layer is
often divided into level, crew, performance and control functions. The factors must therefore
be classified into one of these layers, and preferably, there are multiple factors in each level, in
order to include many types of factors. The complexity that influences risk of a major accident
scenario is, unfortunately, vast. Identification of the factors and the relationships between them
is therefore not an easy task and can be both time consuming and expensive (Haugen et al.,
2012).
CHAPTER 4. METHODOLOGY FOR IDENTIFICATION OF MAJOR ACCIDENT INDICATORS 24
4.3 Step 3: Identification of Influence in the Model
The factors in the model are linked by arrows to other factors or to the event directly. These
links are identified in step 3 of the methodology. There are no restrictions on the number of re-
lationships that a factor may have with other factors. One factor may therefore influence several
others, and it may also be influenced by several other factors. It is important to remember that
the factors with direct impact are influenced by factors with indirect influence. If many factors
are identified to influence and be influenced by the same factors, a "superfactor" can be cre-
ated. Superfactors are factors which contain several elements and are used to group factors to
simplify the modelling. Indicators should still be developed for each element in the superfactor.
Modeling in the method is a further development of findings from the SINTEF indicator project
(Øien and Sklet, 2001), BORA (Haugen et al., 2007), OCS (Sklet et al., 2010) and Risk OMT (Vin-
nem et al., 2012). These projects focused on the relationship between RIFs and the probability of
a specific major accident (Haugen et al., 2012). In the model, the factors are structured such that
their influence never will point backwards. This creates a more logical structure. The framework
also allows for continuous development of the model and the possibility of adding new factors
and new relationships as more knowledge is gathered. The targeted arrow in the factor model
can be understood as the direction of impact. The arrows are targeted in the direction of the
event.
4.3.1 Layering and Illustration of the Factor Model
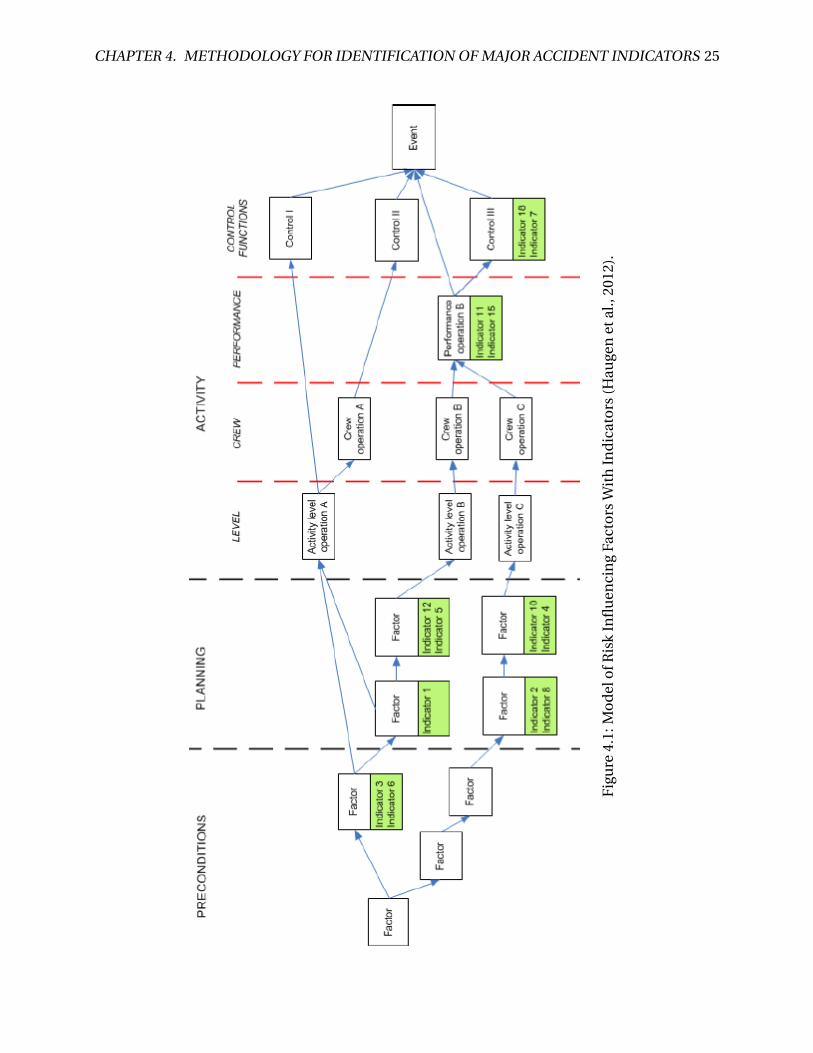
Figure 4.1 illustrates what a model developed using the method may look like. The figure is
generic and does not represent a specific event, but rather simply illustrates how the factors can
be divided into layers. In the figure, the main layers are "Preconditions", "Planning and Coordi-
nation" and "Activity". This is a useful subdivision for most cases, but the layering may need to
be altered for other uses. "Preconditions" are defined as factors which are either fixed or have
a long cycle of change. The precondition level is divided into "external", "corporate" and "lo-
cal" preconditions. The "Planning and Coordination" layer represent the activities which set the
framework for daily operations. Lastly, the "Activity" layer represent the day-to-day operations.
CHAPTER 4. METHODOLOGY FOR IDENTIFICATION OF MAJOR ACCIDENT INDICATORS 25
Fig
ure
4.1:
Mo
del
ofR
isk
Infl
uen
cin
gFa
cto
rsW
ith
Ind
icat
ors
(Hau
gen
etal
.,20
12).
CHAPTER 4. METHODOLOGY FOR IDENTIFICATION OF MAJOR ACCIDENT INDICATORS 26
The activity layer is located closest to the sharp end of the operation. The activity layer normally
includes factors which can be controlled or influenced by the operating organization on an in-
stallation. It can often be appropriate to divide the activity level into several sublayers. In Figure
4.1, the activity level is divided into "level", "crew", "execution" and "control functions". "Level"
are factors which describe the activity level for the different operations, "crew" contains the per-
sonnel groups that influence the event, "execution" are factors that describe the performance of
the different activities which influence the event and "control functions" are the factors which
describe systems or operations which are in place specifically to avoid the event. After the model
is established, indicators for each factor is identified as described in section 4.4.3. These can be
presented in many different ways, i.e in tables which show indicators for each factor.
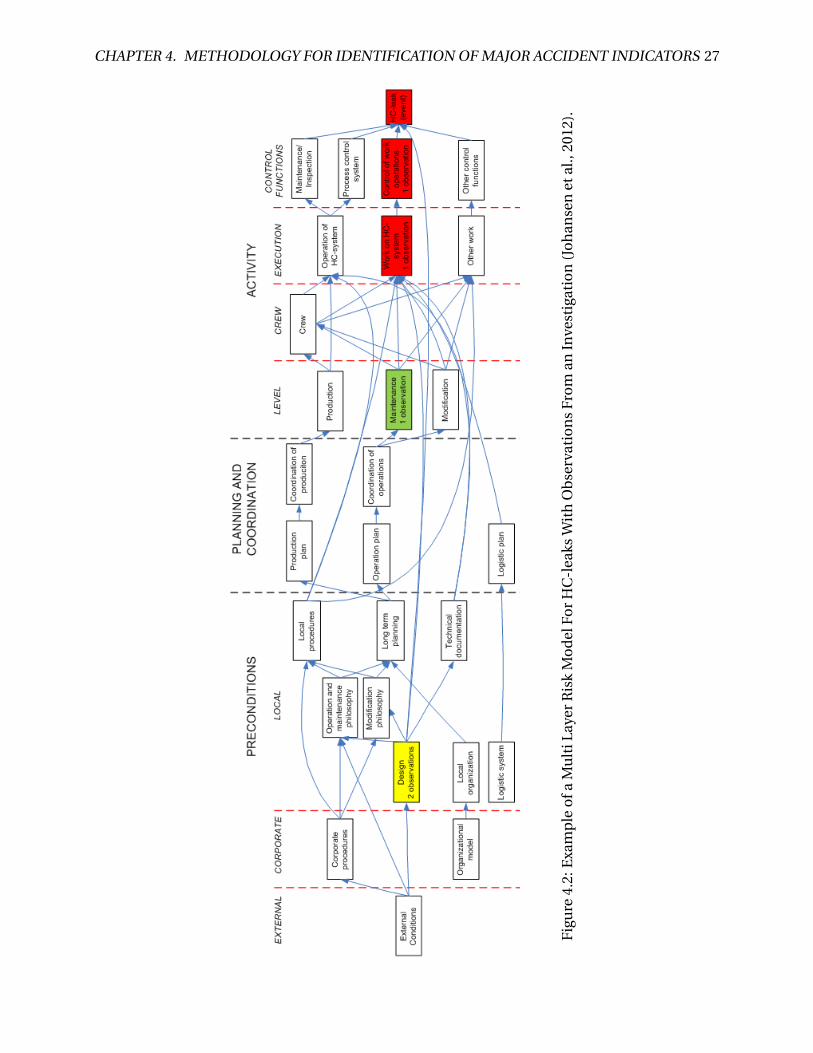
Figure 4.2, taken from the conference paper by Johansen et al. (2012), is a simplified example of
how an analysed investigation report may look when the observations have been shown in the
model framework. The event in the figure is a gas release on the high pressure line in a process
area on an offshore installation. The factors which were found to be contibuting factors for
this particular event are labelled red in the figure. It also shows a probable precondition factor
whose status may have influenced the event. The example in Figure 4.2 also illustrates that the
factors in a factor model may be of very differing natures, from purely technical factors to high
level planning and organizational factors. Some factors may influence the event directly, while
others influence other factors which in turn influence the event.
4.4 Step 4: Identification of Major Accident Risk Indicators
In step 4, one or more indicators which are able to measure the condition/status of a factor need
to be identified. These indicators will serve as a quantification of the RIFs. In some cases, it may
be sufficient with one indicator, while in other cases the factor may have several dimensions or
characteristics which we want to measure. An indicator set will therefore measure the condition
or status of a factor. If a RIF can be measured directly, it can itself serve as an indicator.
CHAPTER 4. METHODOLOGY FOR IDENTIFICATION OF MAJOR ACCIDENT INDICATORS 27
Fig
ure
4.2:
Exa
mp
leo
faM
ult
iLay
erR
isk
Mo
del
For
HC
-lea
ksW
ith
Ob
serv
atio
ns
Fro
man
Inve
stig
atio
n(J
oh
anse
net
al.,
2012
).
CHAPTER 4. METHODOLOGY FOR IDENTIFICATION OF MAJOR ACCIDENT INDICATORS 28
4.4.1 "Indicator" as a Term
According to Øien et al. (2011a), one strategy to avoid accidents is to be continuously vigilant
through the use of indicators which are able to give early warnings. An indicator is defined here
as a measurable/operational variable that can be used to describe the condition of a broader phe-
nomenon or aspect of reality (Øien, 2001a). The main purposes of risk indicators are to monitor
the safety level and to decide if, where, when and how to take action. Indicators are often made
use of when the phenomenon itself can not be measured directly due to a complicated nature
or due to large costs related to measurement. To ensure that an early warning is given if controls
deteriorate to a dangerous level, a small number of carefully chosen indicators can be used to
monitor the status of key systems. According to Øien et al. (2011a), three properties are inherent
to indicators: (1) they provide numerical values, (2) they can be updated at regular intervals and
(3) they can only cover some selected determinants of overall safety or risk.
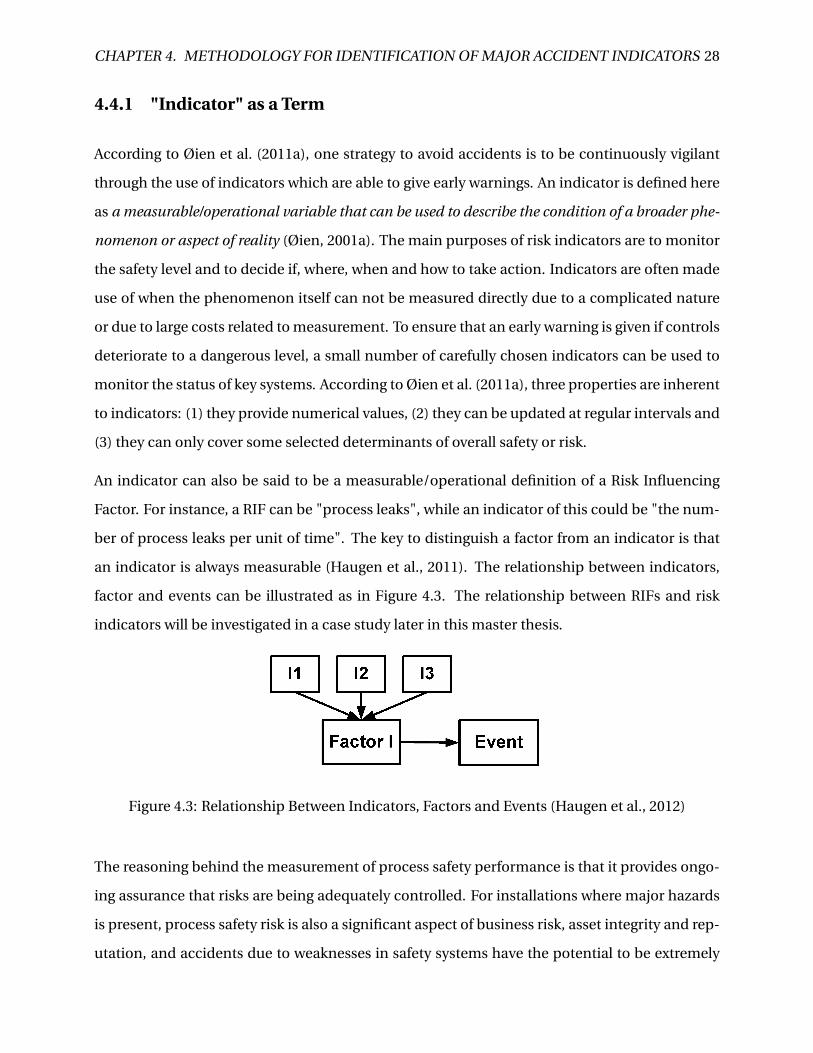
An indicator can also be said to be a measurable/operational definition of a Risk Influencing
Factor. For instance, a RIF can be "process leaks", while an indicator of this could be "the num-
ber of process leaks per unit of time". The key to distinguish a factor from an indicator is that
an indicator is always measurable (Haugen et al., 2011). The relationship between indicators,
factor and events can be illustrated as in Figure 4.3. The relationship between RIFs and risk
indicators will be investigated in a case study later in this master thesis.
Figure 4.3: Relationship Between Indicators, Factors and Events (Haugen et al., 2012)
The reasoning behind the measurement of process safety performance is that it provides ongo-
ing assurance that risks are being adequately controlled. For installations where major hazards
is present, process safety risk is also a significant aspect of business risk, asset integrity and rep-
utation, and accidents due to weaknesses in safety systems have the potential to be extremely
CHAPTER 4. METHODOLOGY FOR IDENTIFICATION OF MAJOR ACCIDENT INDICATORS 29
costly both to individual companies, the environment and community at large.
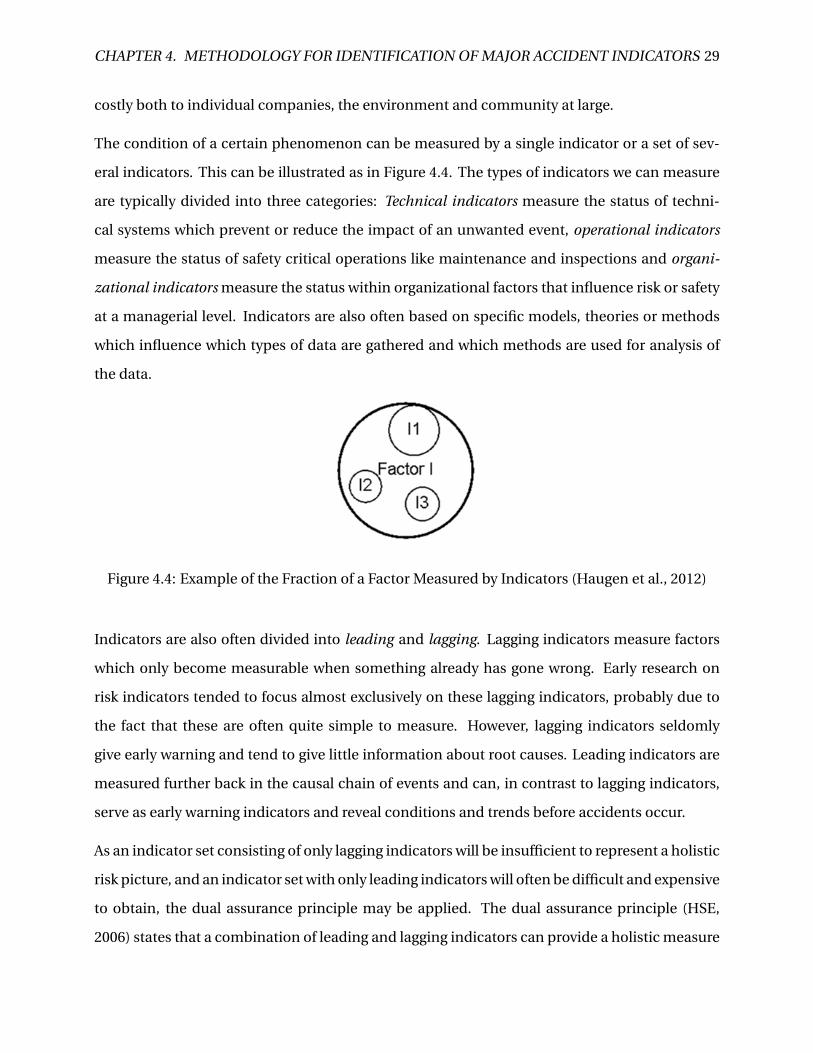
The condition of a certain phenomenon can be measured by a single indicator or a set of sev-
eral indicators. This can be illustrated as in Figure 4.4. The types of indicators we can measure
are typically divided into three categories: Technical indicators measure the status of techni-
cal systems which prevent or reduce the impact of an unwanted event, operational indicators
measure the status of safety critical operations like maintenance and inspections and organi-
zational indicators measure the status within organizational factors that influence risk or safety
at a managerial level. Indicators are also often based on specific models, theories or methods
which influence which types of data are gathered and which methods are used for analysis of
the data.
Figure 4.4: Example of the Fraction of a Factor Measured by Indicators (Haugen et al., 2012)
Indicators are also often divided into leading and lagging. Lagging indicators measure factors
which only become measurable when something already has gone wrong. Early research on
risk indicators tended to focus almost exclusively on these lagging indicators, probably due to
the fact that these are often quite simple to measure. However, lagging indicators seldomly
give early warning and tend to give little information about root causes. Leading indicators are
measured further back in the causal chain of events and can, in contrast to lagging indicators,
serve as early warning indicators and reveal conditions and trends before accidents occur.
As an indicator set consisting of only lagging indicators will be insufficient to represent a holistic
risk picture, and an indicator set with only leading indicators will often be difficult and expensive
to obtain, the dual assurance principle may be applied. The dual assurance principle (HSE,
2006) states that a combination of leading and lagging indicators can provide a holistic measure
CHAPTER 4. METHODOLOGY FOR IDENTIFICATION OF MAJOR ACCIDENT INDICATORS 30
of performance to confirm that the risk control system is operating as intended and provide
early warning should problems arise. More discussion regarding the dual assurance principle
and leading vs. lagging indicators can be found in the project thesis by Tranberg (2012).
4.4.2 Difficulties Regarding the Use of Risk Indicators
Major hazard indicators, as a research field, first began in the 1980s. Still, today, there are few
sources which structure and summarizes past work in the field. There also does not exist any
universally recognized standards or methods for how an appropriate indicator set should be
developed. More reseach is therefore needed on indicators in general and how major accidents
can be avoided with indicator monitoring. Also, the methodology for development of indicator
sets should be chosen carefully and adapted to the specific installation and safety strategy.
It can also be necessary to use several approaches for development, as well as specific well-
known indicators such as leak frequency.
Indicators, as a method to measure HSE performance, have been in use for many years. Com-
monly, personal safety indicators such as Lost Time Incident Rate have been used as a mea-
sure of safety. Through recent major accidents such the Deepwater Horizon catastrophe (2010),
companies such as BP have seen that personal safety indicators are not suitable for use as indi-
cators of major accidents. For both these accidents, which combined led to 26 deaths, massive
environmental damages and enormous economical losses, the installations were renowned for
their personal safety records. Focus on personal safety, however, did not prevent the occurence
of two of the most catastrophic accidents in recent times. This demonstrates the need for more
complete knowledge and methods for the identification of good major risk indicators. Another
main challenge is to identify indicators that will give management an opportunity to act upon
relevant early warnings, and which still can lead to responses within a suitable time frame.
Catastrophic accidents where the use of indicators was insufficient also illustrate that indicators
are often a cost issue for companies. Finding indicators which are reliable, valid, relevant and
yet cost-effective is not easy, so indicator sets should be optimized to give useful information
about risk at an acceptable cost level. It is also important to remember that all development of
CHAPTER 4. METHODOLOGY FOR IDENTIFICATION OF MAJOR ACCIDENT INDICATORS 31
indicators must be context-specific. There does not exist a universal model or method which
will always provide the best result. It is therefore important to make use of several methods to
obtain the most holistic and appropriate set of indicators. By triangulation of different methods,
one can utilize both negative events and positive factors (Øien et al., 2011b).
4.4.3 Identification of Indicators
After the model is established, describing factors and relationships between them, indicators
for each factor is to be identified. Complete measurement of a factor using indicators is not a
simple rask. It can in some cases be impossible to measure all aspects of a factor. It is there-
fore important to consider certain characteristics of indicators in the identification process, in
addition to the fact that indicators should be useful and cost-effective:
• Validity: the indicator must be a valid measurement
• Measurability: it must be possible to record the status of the indicator
• Comprehensibility: the link between RIF and indicator must be easy to comprehend
• Reliability: the results from the measuring must be reliable
Complete indicator sets also have certain evaluation criteria: size (optimize cost versus com-
pleteness), dual assurance (measure both present status and provide early warnings), alarm
and diagnosis (include both alarm and diagnosis indicators) and frequency of measurement
(include both indicators which are measured frequently and seldomly).
The identification of indicators should be based on research, experience from risk analysis and
extensive knowledge of operations within the industry (Haugen et al., 2012). Draft lists of in-
dicators should be subjected to a systematic and critical review based on the criteria above,
preferably in cooperation with operating personnel.
CHAPTER 4. METHODOLOGY FOR IDENTIFICATION OF MAJOR ACCIDENT INDICATORS 32
4.5 Strengths and Limitations of the Methodology
The methodology is a structured approach to identification of risk indicators and can be used
for different purposes. The method is used to identify both direct and indirect influences be-
tween factors and events. A benefit in the model is that is does not assume a linear relationship
between factors, instead assuming that factors can influence the event either directly and indi-
rectly. Another benefit is that the model is possible to change or modify by adding or removing
factors without influencing the model as a whole. The model can also include input from op-
erating personnel, which can be a very valuable input to analysis. It can also take input from
several perspectives on risk. The method is also quite simple and easy to comprehend, also by
non-experts.
A limitation of the model is that some findings, mainly findings related to management and
other generic factors, may be difficult to place in the model. In addition to this, human and
organizational factors were only included to a limited degree. This can be solved by performing
a supplemental analysis of these factors, or further development of the model to better integrate
these factors.
The model is presently not quantifiable, but the paper (Haugen et al., 2012) discusses the pos-
sibilities of developing the model into a quatifiable model. Work is still needed, though, to es-
tablish a formal framework for this. The model can also end up to be difficult to handle if all the
factors are modeled. Focus should therefore be on the most important factors, though this can
often be a challenging process as there are few souces to guide this process.
Another limitation is that there are unavoidably many uncertainties in the identification of the
factors, though this is slightly reduced by using a stepwise analysis. It is also important to have
in mind that an analysis such as this can never include absolutely all possible factors, and can
thus never be considered "complete". The method itself should also be tested in more full scale
settings in order to gain validity and to find possible improvements. This master thesis is meant
as a contribution to the further development of the model, for a specific type of activity.
Chapter 5
Case Study - Blowouts in Drilling Operations
In this chapter, the results from a case study is presented in accordance to the methodology
structure presented in chapter 4. The main objectives of this chapter in the thesis is to present
the results from the application of the methodology for the development of major accident risk
indicators to a case study relevant to drilling activities. Though there are many events that could
lead to major accidents in drilling activities, this application will focus on "blowout" as a specific
major accident type. A blowout is typically the scenario that contributes most to major accident
risk on an offshore drilling rig, and can lead to disastrous consequences, as illustrated by the
Macondo blowout, described in section 5.3.1.
The case study is an important contribution to the further development of the methodology, as it
tests the methodology in a new application. This both tests the feasibility of the methodology for
practical use in general and develops factors and indicators for a specific case. The application
begins with the identification of risk influencing factors in section 5.1, then presents the factor
model and the influence between the factors in section 5.2. Validation and testing of the factor
model is then presented in section 5.3. Finally, the identification of risk indicators is presented
in section 5.4.
33

CHAPTER 5. CASE STUDY - BLOWOUTS IN DRILLING OPERATIONS 34
5.1 Identification of Risk Influencing Factors
Risk Influencing Factors were in this case study identified from a number of sources based on
the principles of the generic method presented in Chapter 4. Internal documents from Safetec,
where similar events had been modelled with the method, combined with the authors knowl-
edge aquired through study of investigations and other types of literature created the basis for
an initial model, which in turn was further developed with the expert knowledge of the supervi-
sors.
Figure 5.1 presents the factors which have been identified for the event "blowout". Appendix
B presents the Risk Influencing Factors separately and describes them with the following at-
tributes: ID/Name, Definition, Critical Elements, Input Factors, Output Factors and Suggested
Indicators. An example of an information module for the factor "Reservoir Conditions" is shown
in table 5.1. There are 27 probability influencing factors and nine consequence influencing fac-
tors in the models. The factor models for probability- and consequence influencing risk factors
are presented in section 5.2. The reasoning behind factor choices can be found in section 5.2,
since the justification will also address influences.
P01: Reservoir conditionsDescription Conditions related to the reservoir and production flowCritical elements All relevant aspects for design and operations of the well should be known
and measured. Uncertainties should be mapped carefully.Input factors - None/reservoirOutput factors - Well construction and drilling methodology
Indicators
- Knowledge of conditions- Reservoir complexity- Wellbore challenges- Knowledge of risk factors- Shallow gas- Number of predicted reservoirs- Drilling margins
Table 5.1: Information-module for P01
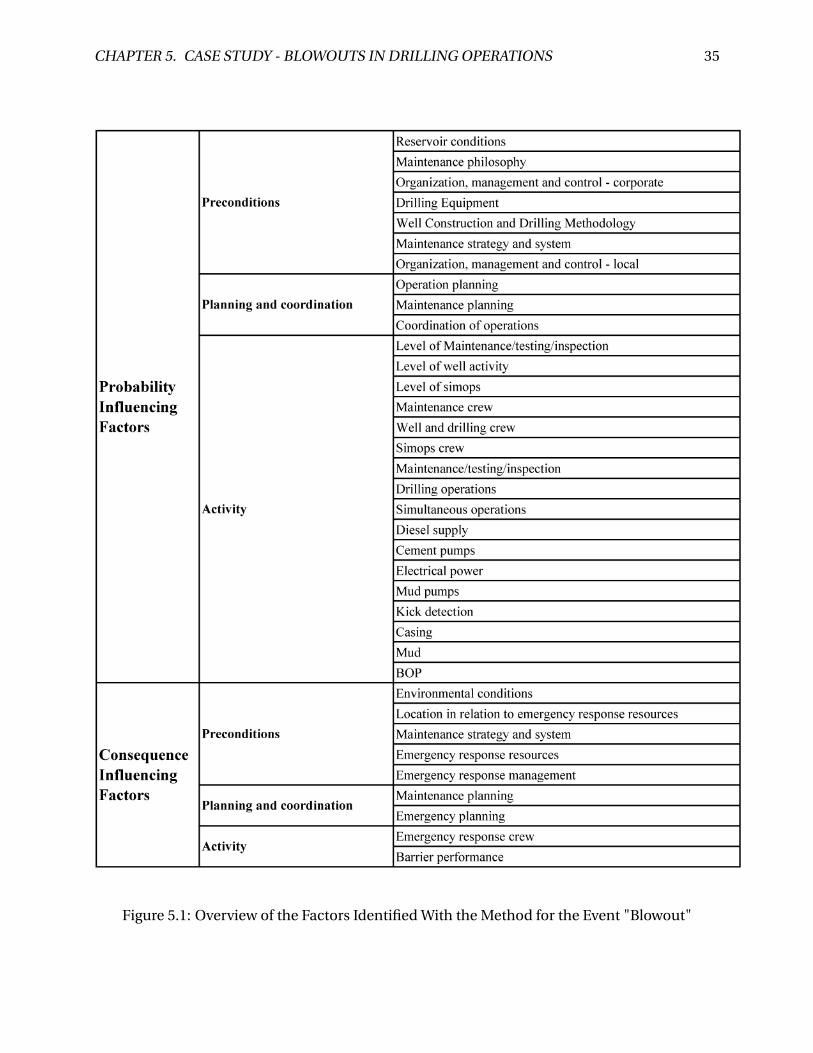
CHAPTER 5. CASE STUDY - BLOWOUTS IN DRILLING OPERATIONS 35
Figure 5.1: Overview of the Factors Identified With the Method for the Event "Blowout"
CHAPTER 5. CASE STUDY - BLOWOUTS IN DRILLING OPERATIONS 36
5.2 The Factor Model
The factor model illustrates the placement of the different factors in the layers and show how
each of these factors influence the probability or consequence of a blowout. In addition to this,
the model shows the influence and direction of influence among the factors, so that factors
which only influence the event indirectly can also be modeled. The layering in the model is as
described in section 4.3.1.
5.2.1 Model for Probability Influencing Factors
The factor model for probability influencing factors contains 27 factors, and show how these
factors influence each other as well as the event itself. The factor model is shown in Figure 5.2.
In the external preconditions layer of the model, which is furthest away from the event in the
model, only reservoir conditions have been included. This is due to the fact that reservoir con-
ditions and the knowledge of these, can be cruical to many of the other factors, and should also
be taken into account. The reservoir conditions influence the Maintenance Strategy and Sys-
tem, as well as Well Construction and Drilling Methodology.
In the corporate preconditions level, Maintenance Philosophy and Organization, Management
and Control on a corporate level are included. These factors are included in the factor model
because they greatly influence the local preconditions by setting preconditions for them. For
instance, the corporate maintenance philosophy decided how high the maintenance budget
will be, while the local maintenance strategy decides how to use this budget.
In the local preconditions level, Maintenance Strategy and System, Drilling Equipment, Well
Construction and Drilling Methodology, as well as Organization, Management and Control on
a local/installation level is included in the model. These factors, with the exception of drilling
equipment, directly influence the planning factors in the next level. The drilling equipment
is a precondition for the well construction and drilling methodology, as it greatly influences
decisions made concerning construction and methodology.
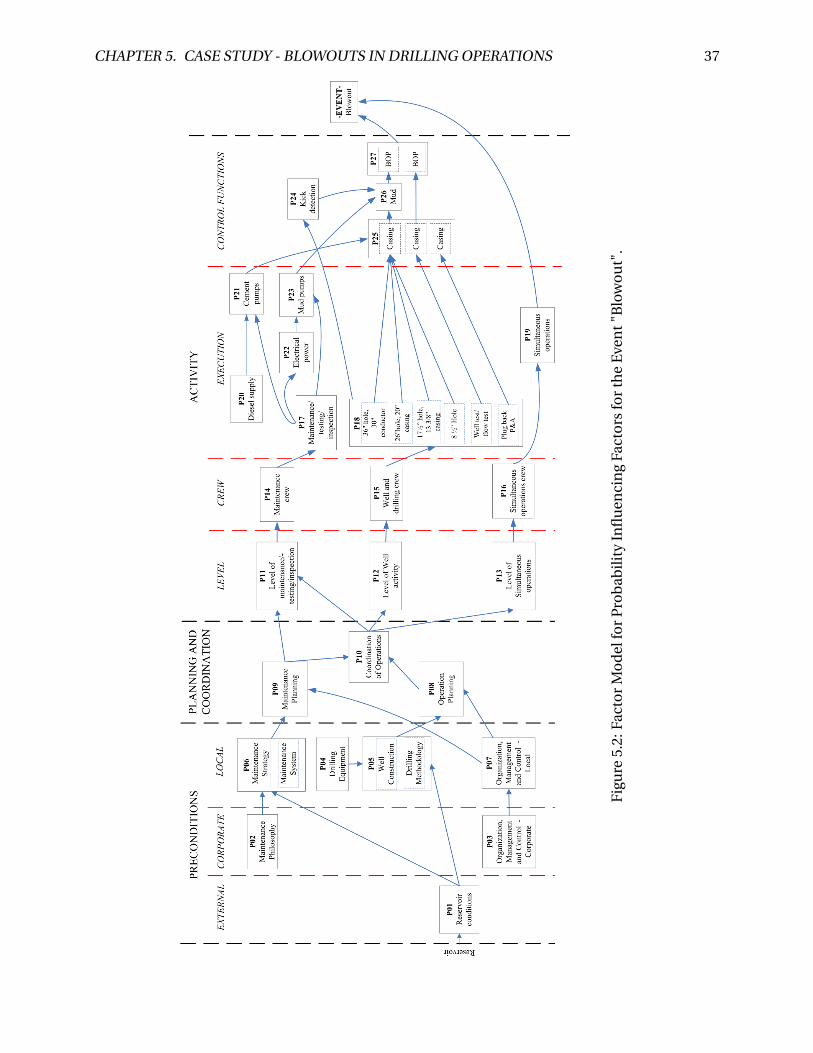
CHAPTER 5. CASE STUDY - BLOWOUTS IN DRILLING OPERATIONS 37
Fig
ure
5.2:
Fact
or
Mo
del
for
Pro
bab
ilit
yIn
flu
enci
ng
Fact
ors
for
the
Eve
nt"
Blo
wo
ut"
.

CHAPTER 5. CASE STUDY - BLOWOUTS IN DRILLING OPERATIONS 38
In the planning and coordination level, three factors are included. These are maintenance plan-
ning, operations planning and coordination of operations. Coordination of operations also in-
cludes quality of contingency planning, and thereby risk evaluations for the operations. Main-
tenance planning also includes the planning of testing and inspections, and is influenced by the
maintenance strategy and system, as well as the local organization, management and control,
and influences the coordination of operations and the level of maintenance/testing/inspection.
Operation planning is influenced by well construction and drilling methodology as well as the
local organization, management and control.
The activity layer is divided into four sublayers. The sublayer "level" includes the level of mainte-
nance/testing/inspection, well activity and simultaneous operations. These factors also serve as
indicators, since level is a measurable quality. These levels are all influenced by the coordination
of operations and the factors all influence the crew factors in the next layer. The crew factors are
divided into maintenance crew, well and drilling crew and simultaneous operations crew. These
crew factors are mostly linked to competence and training of the crew and they influence the ex-
ecution of the tasks. The execution layer includes execution of maintenance/testing/inspection,
drilling operations and simultaneous operations. These factors can normally be said to be the
triggering event of an incident, and if the barriers fail in the control layer as well, this can trig-
ger an accident. Also included in the execution layer are the factors which influence the avail-
ability of the barriers. For the casing barrier, diesel supply and cement pumps are included in
the execution layer. The diesel supply influences the availability of the cement pumps which
in turn influence the availability of the casing. For the mud barrier, electrical power and mud
pumps are included in the execution layer. The electrical power influences the availability of
the mud pumps which in turn influence the availability of the mud. The execution of mainte-
nance/testing/inspection also influences the cement pumps, electrical power and mud pumps.
While the execution of simultaneous operations directly influence the event, the various drilling
operations which are outlined in Figure 5.2 influence the event through the control functions
which are relevant for that drilling operation. The control functions which are present are kick
detection, casing, mud and BOP. Some of these control functions directly influence each other
and some influence the probability of the event directly in cases of barrier failure.
CHAPTER 5. CASE STUDY - BLOWOUTS IN DRILLING OPERATIONS 39
5.2.2 Model for Consequence Influencing Factors
The model created for the consequence influencing factors is focused on emergency response
factors and barrier performance. The model is shown in Figure 5.3, and contains nine factors,
distributed among three main layers.
In the preconditions layer, the environmental conditions at the time of the incident and the loca-
tion in relation to emergency response resources influence the emergency response resources,
which in turn influences the emergency response management.
Maintenance strategy and system is also included in the preconditions layer. This in turn af-
fects maintenance planning and the barrier performance for the consequence-reducing barri-
ers. Emergency planning is included in the planning level, and this affects the only factor in the
"execution" activity layer: Emergency response crew. Since emergency response is a manual
procedure, this is highly dependent on the training and competence of the relevant crew. This is
therefore the only factor in the execution layer. This factor directly influences the consequences
of the event. In the "control functions" sublayer, only barrier performance is included. Barrier
performance includes the emergency response system and other operative barriers relevant to
well events.
The consequence influencing factor model is somewhat simpler than the model for the proba-
bility influencing factors, and contains fewer factors. This is partially due to the complex nature
of a major accident. Probability is therefore a very complicated function and emergency re-
sponse should be designed to be efficient, and not dependent on very many factors. Also, while
emergency response consists of defined functions and technical systems designed to handle the
hazardous event, the number of factors which influence probability can be extremely many. It
is also due to the fact that the focus in this thesis is on avoiding such events, by reducing the
probability to an absolute minimum.
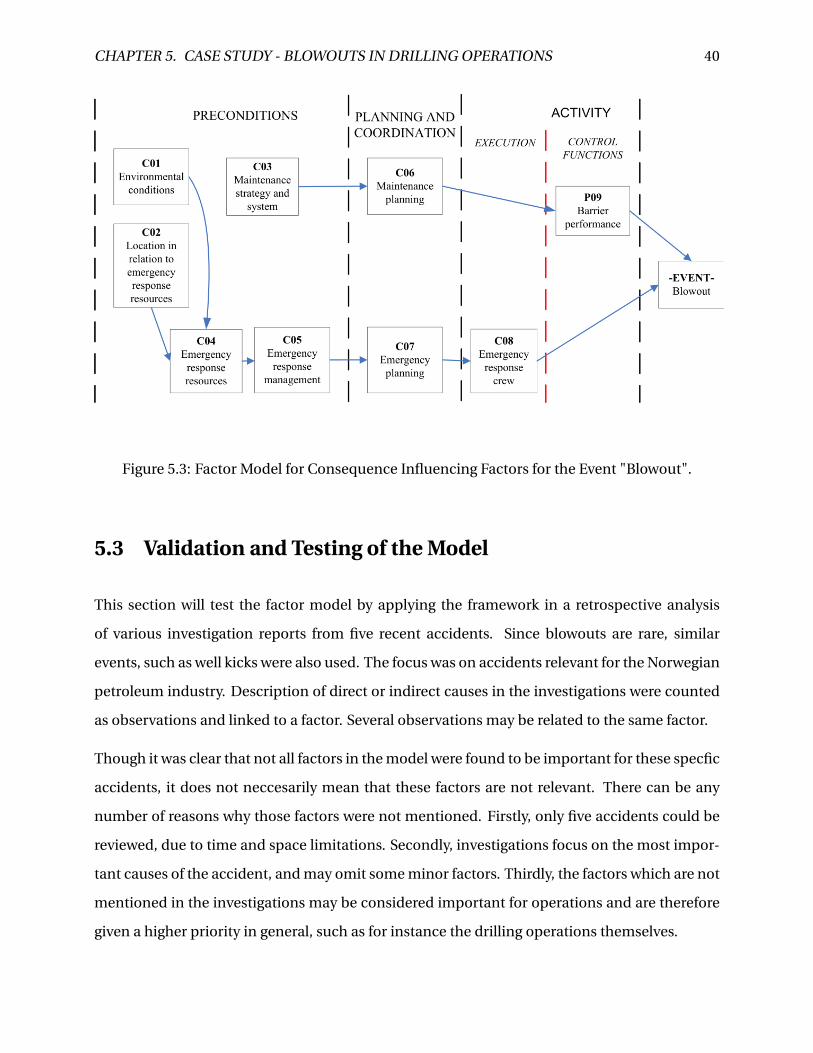
CHAPTER 5. CASE STUDY - BLOWOUTS IN DRILLING OPERATIONS 40
Figure 5.3: Factor Model for Consequence Influencing Factors for the Event "Blowout".
5.3 Validation and Testing of the Model
This section will test the factor model by applying the framework in a retrospective analysis
of various investigation reports from five recent accidents. Since blowouts are rare, similar
events, such as well kicks were also used. The focus was on accidents relevant for the Norwegian
petroleum industry. Description of direct or indirect causes in the investigations were counted
as observations and linked to a factor. Several observations may be related to the same factor.
Though it was clear that not all factors in the model were found to be important for these specfic
accidents, it does not neccesarily mean that these factors are not relevant. There can be any
number of reasons why those factors were not mentioned. Firstly, only five accidents could be
reviewed, due to time and space limitations. Secondly, investigations focus on the most impor-
tant causes of the accident, and may omit some minor factors. Thirdly, the factors which are not
mentioned in the investigations may be considered important for operations and are therefore
given a higher priority in general, such as for instance the drilling operations themselves.
CHAPTER 5. CASE STUDY - BLOWOUTS IN DRILLING OPERATIONS 41
5.3.1 Results From Analysis
The status classifications, as classified by the author on the basis of investigation reports from
the five accidents, can be seen in Figure 5.4 on the next page. The subsections in this section of
the thesis will go through the results.
The classifications are given based on investigations from various institutions, and are based on
statements from these investigation reports. A certain factor can be classified as having a green
(good/sufficient), yellow (possibly dangerous/underlying cause) or red (dangerous status/cause
of accident) status. Factors which are not mentioned in the investigations are omitted. State-
ments matched with the author’s arguments as to why a certain classification is implied based
on the statement are provided in Appendix C.
The accidents used for testing were:
- Blowout at Deepwater Horizon/Macondo - 2010
Investigations used: Reports from Chief Counsel (2011) and BP (2010).
- Blowout at Snorre A - 2004
Investigations used: Reports from Schiefloe and Vikland (2007) and Brattbakk et al. (2005).
- Well Kick at Gullfaks C - 2010
Investigations used: Reports from Austnes-Underhaug et al. (2011) and Talberg et al. (2010).
- Blowout at Montara - 2009
Investigations used: Report from Borthwick et al. (2010).
- Well Kick at Valhall - 2003
Investigations used: Report from PSA (2004).
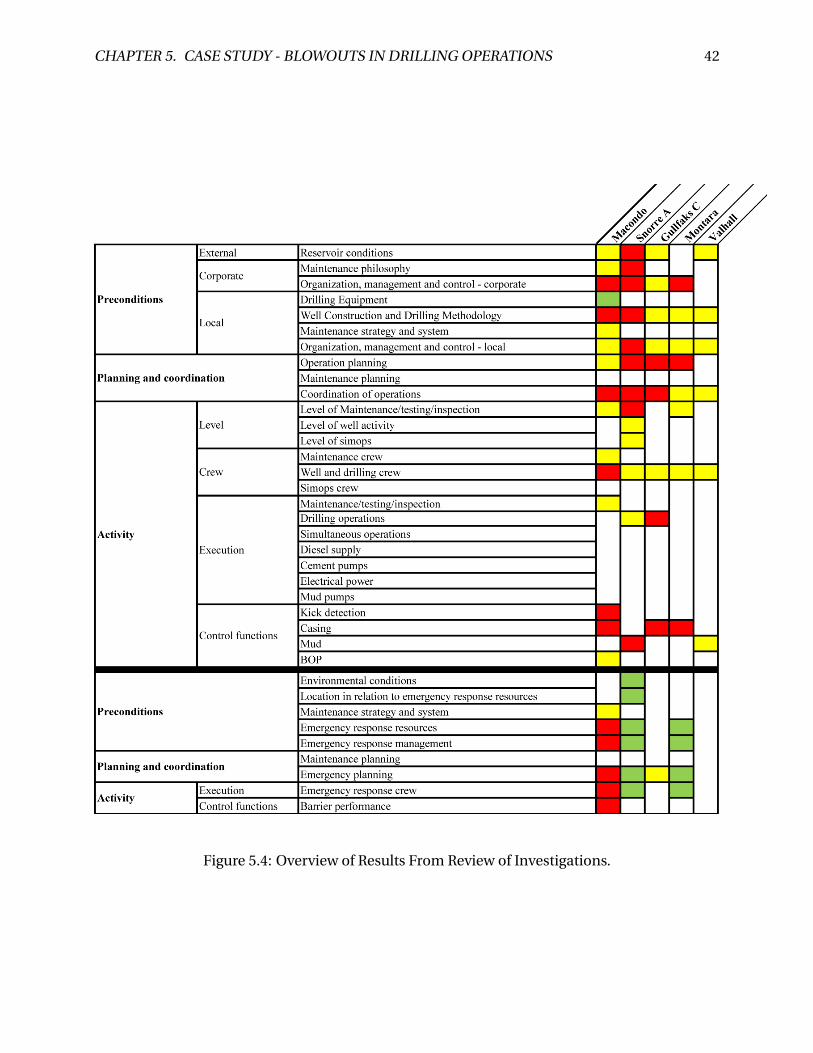
CHAPTER 5. CASE STUDY - BLOWOUTS IN DRILLING OPERATIONS 42
Figure 5.4: Overview of Results From Review of Investigations.
CHAPTER 5. CASE STUDY - BLOWOUTS IN DRILLING OPERATIONS 43
Blowout at Deepwater Horizon/Macondo - 2010
The Macondo/Deepwater Horizon blowout in 2010 demonstrated the consequences of not main-
taining sufficient well integrity. Since this accident occured during drilling activities, resulted in
a major blowout and has been thoroughly investigated, it is considered very relevant for this part
of the thesis and is explained in more detail than the other accidents. The Deepwater Horizon
drilling rig, a fifth generation rig from 2001, started drilling on the Macondo exploratory well,
which was situated approx. 66 km off the southeast coast of Louisiana, US, in February 2010
(Chief Counsel, 2011). The water depth was around 1500 m and the well was 5500 m below sea
level. On the 20th of April 2010, a well control event caused a blowout and immediate ignition,
resulting in explosions and fires on the rig. This caused 11 deaths, 17 serious injuries, devastat-
ing environmental damages and huge economic losses. The rig sank 36 hours later, hydrocarbon
continued to flow for 87 days and the well was finally sealed 151 days after the accident occured.
The Deepwater Horizon accident was a result of failures in multiple barriers related to human,
organizational, and technical barrier elements. Prior to the blowout, the Macondo well expe-
rienced two kicks, one at 2734 m and one at 4055 m depth. The root technical cause of the
blowout was that the cement that BP and Halliburton pumped to the bottom of the well did
not seal off hydrocarbons in the formation. Several factors increased the risk of cement failure:
drilling complications that lead to a low overall volume of cement, the cement slurry was poorly
designed and procedures called for rig personnel to severly underbalance the well before in-
stalling additional barriers. The cement failure which occured could have been discovered and
stopped, but the negative pressure test was misinterpreted. The blowout preventer was there-
fore activated too late, and hydrocarbons were rushing upward through the riser pipe.
The Chief Counsel (2011) report also concludes that the technical failures at Macondo can be
traced back to management errors by the companies responsible. The risks presented by this
kind of drilling activity was not fully appreciated by BP, and the subpar work of the contractors
was not adequately supervised. Also, personnel on the rig were not properly trained and sup-
ported, and communication between the companies was lacking.
The Deepwater Horizon accident is the most relevant of the five accidents for this particular
CHAPTER 5. CASE STUDY - BLOWOUTS IN DRILLING OPERATIONS 44
purpose, as it is extremely thoroughly investigated, and it is exactly the same event as the model
is created for. Some of the other accidents are simply well events that do not develop into
blowouts, and this must be considered when using these accidents to test the model. As can
be seen in Figure 5.4, Deepwater Horizon is the accident in which most of the factors could be
given a status based on investigation reports.
In the investigation reports, it was clear that there were deficiences in all layers of the factor
model, and the status of these factors probably all influenced the event. The deepwater hori-
zon can be considered a "worst scenario" event, as there were very serious consequences of the
accident. This means that the consequence influencing factors are also mentioned in the inves-
tigations, as there were deficiencies also in the emergency response to the accident. This caused
the death of eleven workers.
In the probability influencing model, the most deficient factors were "organization, manage-
ment and control" (corporate), due to the fact that all the technical failures could be traced back
to overarching failures of management, "well construction and drilling methodology", due to
bad design decisions, "coordination of operations" due to lack of risk assessment of last minute
changes to the program, "well and drilling crew" due to inability to interpret test results cor-
rectly, "kick detection", due to the inability to detect the kick both automatically and manually
and "casing", because the casing did not seal off the well. This was named the root technical
cause of the event.
In the consequence influencing model, the most deficient factors were "emergency response re-
sources", "emergency resource management, "emergency planning" and"emergency response
crew" due to the extreme consequences and the inability to prevent the event from developing
into a full-blown blowout, and "barrier performance", because the emergency response barriers
did not function as intended.
Figure 5.5 shows a simplified factor model with the factor statuses identified from deepwater
horizon.
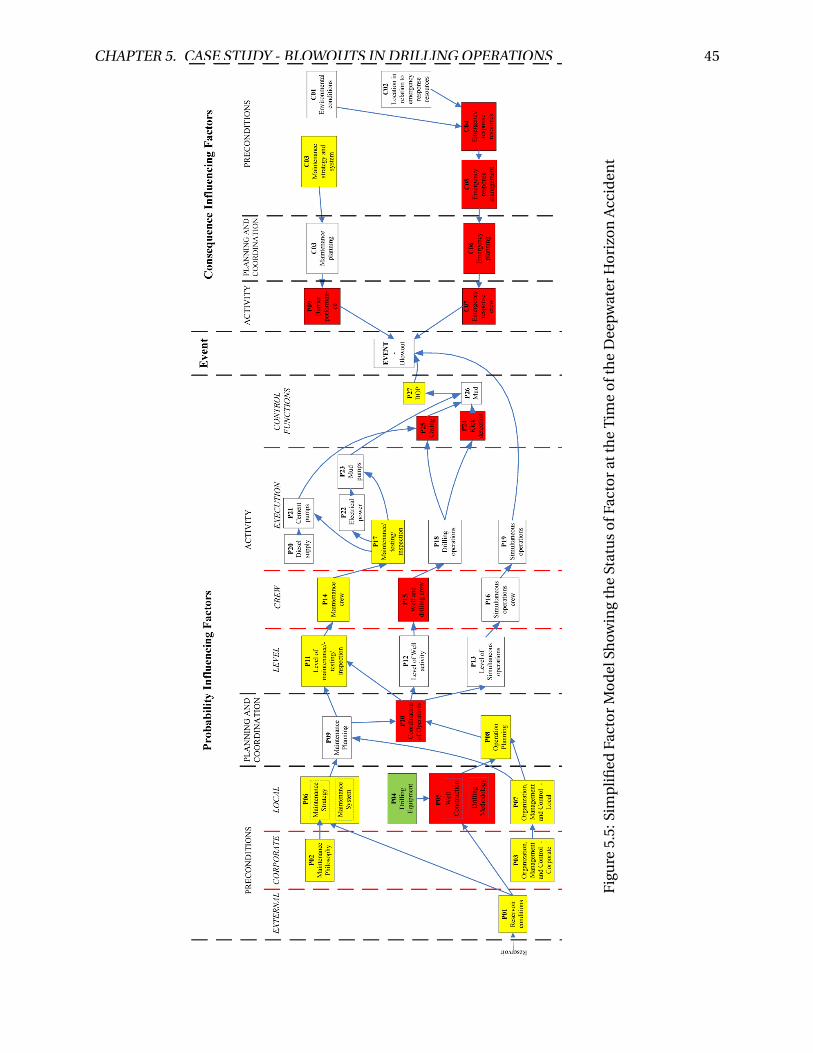
CHAPTER 5. CASE STUDY - BLOWOUTS IN DRILLING OPERATIONS 45
Fig
ure
5.5:
Sim
pli
fied
Fact
or
Mo
del
Show
ing
the
Stat
us
ofF
acto
rat
the
Tim
eo
fth
eD
eep
wat
erH
ori
zon
Acc
iden
t
CHAPTER 5. CASE STUDY - BLOWOUTS IN DRILLING OPERATIONS 46
When applying this framework on the Deepwater Horizon accident, it appears that the different
predefined risk influencing factors in the model captures the different observations described
in the investigation reports quite well. This implies that the framework may be used to visualize
risk influencing factors for cases such as the blowout at Deepwater Horizon.
It is clear from Figure 5.5 that the factor model covers many of the deficient factors that con-
tributed to the accident, as there are deficient factors in every level of the model.
Blowout at Snorre A - 2004
In the summer of 2004 it was decided to reuse the well P-31A on Snorre A through the drilling
of a sidetrack. During work in well P-31A on Snorre A on 28 November 2004, a gas blowout
occurred on the seabed with subsequent gas on and under the facility. Many of the personnel
were evacuated by helicopter to nearby facilities (Brattbakk et al., 2005), however, the emergency
response team on board considered full evacuation on three separate occasions, but stayed.
According to Brattbakk et al. (2005), the flare continued to burn during parts of the incident and
was a potential ignition source for gas from the sea. The flow of gas was halted and the well was
stabilized at 10:22 hours on 29 November 2004.
The investigation report of the incident reveals a lot of mistakes during the process that resulted
in the gas blowout (Schiefloe and Vikland, 2007). These are categorized in Brattbakk et al. (2005)
as follows: Lack of compliance with governing documents, inadequate understanding and im-
plementation of risk assessments, inadequate management involvement and violation of well
barrier requirements. The non-conformities occurred at several levels in the organization on
land and on the facility. There is nothing that would indicate that the incident was a result of
chance circumstances. The PSA characterizes this incident as one of the most serious to occur
on the Norwegian continental shelf, based on the potential of the incident.
The Snorre A blowout was a very different occurence than the Deepwater Horizon accident,
though many of the factors in the probability influencing spectrum reoccurs. Snorre A is also
a very relevant accident, as it entails the original event scenario which the model is designed
for. Unlike Deepwater Horizon, Snorre A also illustrates how important it is to have a suffi-
CHAPTER 5. CASE STUDY - BLOWOUTS IN DRILLING OPERATIONS 47
cient emergency response, since the consequences of the accident was limited to financial and
reputational losses. The emergency response ensured that there were no loss of lives, injuries
or environmental spills. The factors which were mentioned in the consequence spectrum are
therefore labelled as green.
Of the five accidents, Snorre A is the accident in which the second largest number of factors
could be identified. Among these, "Reservoir conditions", "Maintenance philosophy", Orga-
nization, management and control - both corporate and local", Well construction and drilling
methodology", "Operation planning", "Coordination of operations", "Level of maintenance/testing/inspection"
and "Mud" were the most severly deficient factors. The factor model with the observations from
review of investigation reports from the Snorre A accident can be found in Figure 5.6. The ap-
plication of the framework for Snorre A also appears to be a useful way to illustrate the causal
factors in the accident. Is it easy to see that many deficiences in preconditions caused this ac-
cident. It can also clearly be seen from the factor model that the statuses of the consequence
influencing factors are good, and due to this, a major accident was prevented.
The factor model should also be used to illustrate where in the model that improvements should
be made and where indicators should be implemented and monitored. For Snorre A, this would
be valuable, as it is clear where in the model improvements are needed.
Well Kick at Gullfaks C - 2010
Well C-06 AT5 on Gullfaks C was drilled in Managed Pressure Drilling mode (MPD) to a total
depth at 4800 meters. While closing circulation and purification of the hole section was exe-
cuted on 19 May 2010, a hole in the 13 3/8" casing arose, with a consequent loss of drilling fluid
(mud) to the formation. Since the casing was a common barrier element, the hole caused the
failure of both well barriers. Loss of backpressure caused inflow from the exposed reservoir into
the well until an accumulation of soils or drill cuttings sealed the well at the 9 5/8" shoe. This
limited further influx of hydrocarbons into the well. The crew on the platform and onshore or-
ganization had difficulty understanding and managing the complex incident the first day. The
normalization work went on for almost two months before the well barriers were restored.
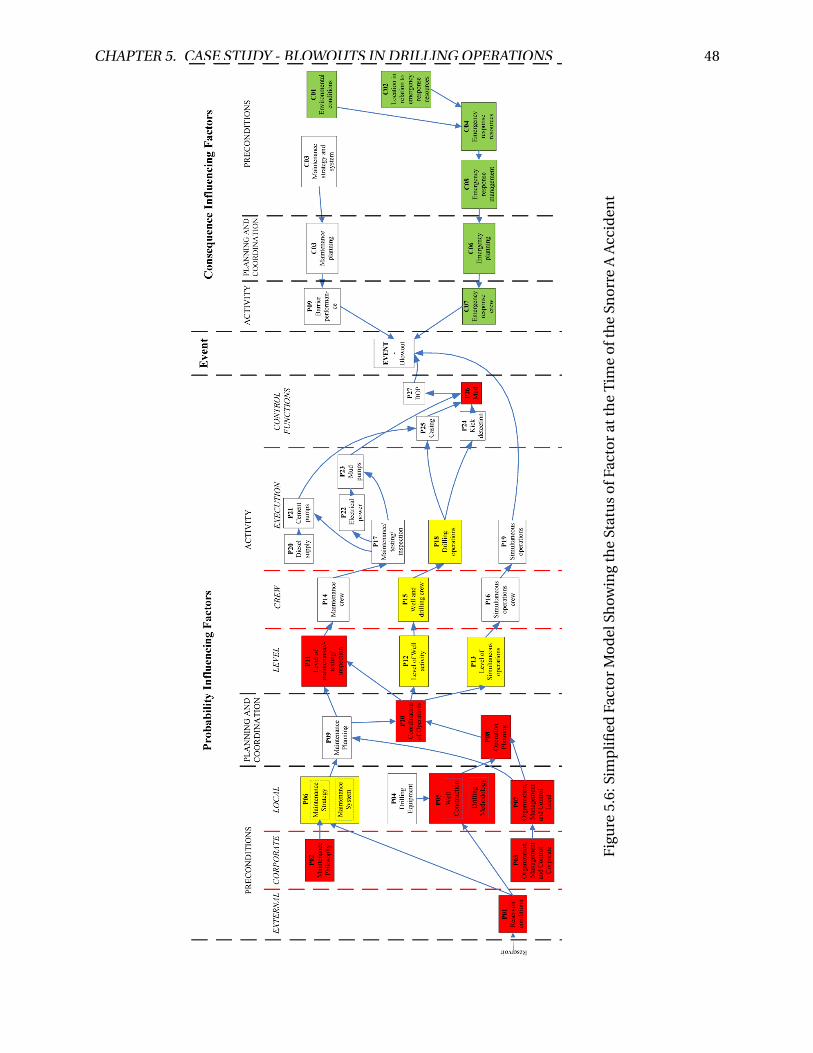
CHAPTER 5. CASE STUDY - BLOWOUTS IN DRILLING OPERATIONS 48
Fig
ure
5.6:
Sim
pli
fied
Fact
or
Mo
del
Show
ing
the
Stat
us
ofF
acto
rat
the
Tim
eo
fth
eSn
orr
eA
Acc
iden
t
CHAPTER 5. CASE STUDY - BLOWOUTS IN DRILLING OPERATIONS 49
The main cause of the accident was a lack of technical integrity in the casing. Root causes of the
accident was a lack of risk assessment for using the casing as a common barrier element, as well
as poor planning activities, lack of compliance with requirements and little competence with the
use of MPD. The incident resulted in no consequences that are relevant to the impact categories
"Personnel damage", "Release" or "Fire / Explosion”, though it is considered a coincidence that
an underground blowout did not occur (Talberg et al., 2010).
At Gullfaks C, no actual blowout occured, but rather a well kick. The incident did, however,
occur during drilling activities and it is, as stated earlier, considered a coincidence that an un-
derground blowout did not occur. Due to this, the accident can be used for testing, but it is not
as relevant as Snorre A and Deepwater Horizon.
Observations made based on investigations of the Gullfaks C well kick categorized the follow-
ing factors as the most deficient: "Operation planning", "Coordination of operations", "Drilling
operations" and "Casing". The only factor which was mentioned in the consequence spectrum
was emergency planning, due to lack of plans for drilling a relief well. In slightly different cir-
cumstances, this lack of emergency plans could have been crucial. It is therefore important to
focus on this even though it did not matter much for this specific incident. The factor model
is therefore also useful for this incident. A figure of the factor model for this accident is not
included in this thesis, as two such example models have been included previously.
Blowout at Montara - 2009
In the early hours of 21 August 2009, a small ‘burp’ of oil and gas was reported as having escaped
from the H1 Well at the Montara Wellhead Platform. The oil and gas had travelled a distance of
over four kilometres from the reservoir beneath the sea bed. Two hours later the H1 Well kicked
with such force that a column of oil, fluid and gas was expelled from the top of the well, through
the hatch on the top deck, hitting the underside of the West Atlas drilling rig and cascading into
the sea (Borthwick et al., 2010). Oil and gas continued to flow unabated into the Timor Sea for
over 10 weeks.
Prior to the Montara blowout, Australia had not seen an oil spill of such a magnitude in over
CHAPTER 5. CASE STUDY - BLOWOUTS IN DRILLING OPERATIONS 50
20 years. The company responsible is PTTEP Australasia (Ashmore Cartier) Pty Ltd (PTTEPAA).
Inquiry has concluded that PTTEPAA did not apply sensible oilfield practices at the Montara Oil-
field. Major shortcomings in the company’s procedures were widespread and systemic, directly
leading to the blowout.
The Montara accident was also a blowout, but the accident did not directly happen during
drilling activities. This accident is therefore also not as relevant for the model as Deepwater
Horizon and Snorre A. The most deficient factors for this accident were "Organization, man-
agement and control - corporate", "Operation planning" and "Casing". In the consequence
spectrum, all factors which were mentioned were given a green status, as evacuation and other
emergency response factors were successful in preventing any deaths, though a huge environ-
mental spill occured.
A figure of the factor model for this accident is not included in this thesis, as two such example
models have been included previously.
Well Kick at Valhall - 2003
On 10 December 2003, BP experienced a well kick in well A08B at Valhall DP in connection
with the drilling of a 60 m deep part of the well’s 95/8 "section. After recovery of well control,
a new well control situation occurred in the same well on the 17 December 2003. The well kick
is regarded as an event with high risk of developing into a blowout (PSA, 2004). There were
many different causal factors which influenced the accident, among others poor well design,
non-compliance of BOP procedures and inadequate control of management and monitoring.
The well kick at Valhall occured during drilling and had a high risk of resulting in a blowout.
However, only a limited investigation of this incident was freely available, so there were very few
factors which could be identified for the incident, and none of these were labelled red. There
were also no mentions of any factors in the consequence spectrum. This is therefore considered
the least relevant incident used in the testing, though the event itself is relevant.
A figure of the factor model for this accident is not included in this thesis, as two such example
models have been included previously, and this incident is considered the least relevant.
CHAPTER 5. CASE STUDY - BLOWOUTS IN DRILLING OPERATIONS 51
Discussion of the Results
Since only five accidents have been reviewed in the retrospective analysis, quantitative results
will not be addressed, though it can be noted that many of the observations are from the pre-
conditions layer, and some factors were mentioned in all accidents, whereas others were never
mentioned. Specifically, the factors which were mentioned in all the accidents were: "Well con-
struction and drilling methodology", "Organization, management and control - local", "Coordi-
nation of operations" and "Well and drilling crew". In addition to this, at least one of the barrier
functions were mentioned as being deficient. This implies that more efficient monitoring of
these specific factors is needed, as improvements in those factors in the time leading up to the
accidents could have avoided all five accidents.
The large proportion of observations related to some of the factors may also indicate that some
of the factors perhaps captures too much, and can maybe be divided into several factors in a
later revision of the model. For instance, organization, management and control tends to be a
very extensive and could perhaps be divided into several factors. This could also be adjusted
to the user of the model, as different users will have different types of organizations and dif-
ferent focuses. The model should therefore be somewhat adjusted according to the needs and
organizational characteristics of the "user".
There were also several of the factors which were not mentioned in any of the accidents. This
does not necessarily mean that these factors should not be in the factor model. There can be
many causes for the omission of the factors. An already existing focus on the factors could be
one cause. This can for instance be in the execution layer. Execution of drilling operations and
simultaneous operations will for instance naturally recieve much focus, since problems or stops
in these operations will be very costly. Diesel supply, electrical power, mud pumps and cement
pumps are probably also not mentioned for this reason, since unavailability of these will mean
full stops in operations. Another reason that some of the factors were not included could be
due to specific focuses in the investigations, where these factors do not fall within the scope of
the investigation. The factor could also be considered to not be important enough in the causal
chain to be mentioned in the investigation. In other words, the observed frequencies from the
analysis indicates that the importance of the various factors differs.
CHAPTER 5. CASE STUDY - BLOWOUTS IN DRILLING OPERATIONS 52
Concerning consequence influencing factors, these were not specifically mentioned in all the
accidents. However, it is possible to assume that in cases where a kick has been detected and a
blowout has been prevented, these factors are in a satisfactory state. For accidents such as deep-
water horizon, which ended in a "worst-case scenario", these factors have not been sufficient to
prevent consequences. It is therefore important to include these factors, so that in the event of
a kick or blowout, the emergency response organization can prevent serious consequences.
An advantage of the model is its ability to capture deviations in multiple risk influencing factors
and visualize both causal and random concurrences, though these types of occurences may be
difficult to separate. A limitation of testing the model with the retrospective method is that the
observations may only indicate where the main focus in investigation reports is. In this case, the
factor model can be considered as a supplementary tool for investigations. As a supplementary
tool, the model provides a framework that can give a nuanced picture of the incident.
There are also some things that show up in the investigations which is perhaps not covered very
well in the current model. All the investigations tended to mention the topic of risk assessment
in general. Though this is included in the "coordination of operations" factor, and to a certain
degree, planning, this could perhaps be included as a separate precondition, as it is such a vital
part in the prevention of major accidents. Including risk assessment in a model like this could
perhaps also raise awareness of how important risk assessments are. Risk assessment policies
could belong in the model both with a corporate philosophy and a local strategy, almost in the
same way as maintenance and testing is included in the model. Maintenance, testing and in-
spection is of course also an important aspect of risk assessment for such operations.
Specifically, in the investigations of the Snorre A accident, it is mentioned that one of the major
causes was noncompliance with governing documents and formal rules (Schiefloe and Vikland,
2007). This kind of noncompliance is also mentioned in the investigations concerning Gullfaks
C and Montara. This kind of practical drift can have catastrophical consequences, and should be
avoided. For this reason, a factor which not only covers the governing documents themselves,
but also how they are used, could be implemented in the model. Though this could be said
to be included in the crew factors in the present model, it could also be a precondition for the
operation. This could perhaps be represented as a factor of the "robustness" of the organization,
CHAPTER 5. CASE STUDY - BLOWOUTS IN DRILLING OPERATIONS 53
which entails the quality of formal and informal organizational safety barriers. In this factor, it
is also important to include whether or not the organization allows for good enough physical
safety barriers, as several of the accidents lacked a necessary secondary barrier. This was often
attributed to practical drift on a corporate level, and should be addressed in this factor.
The data material presented in this thesis in solely based upon the limited information in the
investigation reports from the five accidents. There is no guarantee that the reports provide an
accurate picture of the risk influencing factors and their relationship preceding the incident.
It is also a limitation that only five accidents where reviewed. This is both due to time con-
straints and the seldomness of blowouts. Another limitation is that the review has only been
performed by one reviewer, which may make the observations slightly biased. The supervisors
of the project have therefore also looked through the investigation results, to see if there are
any observations which are counter-intuitive. It is, however, a benefit that the review-process
is made duplicaple by including statements from the investigations to back up observations.
These statements are included in Appendix C.
Looking back at the methodology itself, which was described in chapter 4, it can be said that
developing a complete risk influencing factor model for a complex event such as a blowout is
virtually impossible considering the complexity that influences major accident risk. However,
the applied framework does allow for continuous development of the multi layer model as more
knowledge is gathered, and can later be adjusted without much difficulty. Further developments
with the model should also look into the quantitative influences in the model, as this falls be-
yond the scope of this thesis.
CHAPTER 5. CASE STUDY - BLOWOUTS IN DRILLING OPERATIONS 54
5.4 Identification of Risk Indicators
This chapter will introduce the last step in the methodology: the identification of risk indicators.
This part of the methodology is very difficult to validate without actually implementing the in-
dicator set in an actual setting. The indicators are therefore developed as the generic basis of an
indicator set for the prevention of a blowout in a drilling operation. The indicator set can be re-
viewed for a specific purpose and the final indicator set should be selected based on the criteria
for indicators: validity, measurability, comprehensibility and reliability. It can in some cases be
necessary to develop new indicators if there are no fitting indicators which have already been
identified.
In this thesis, the identification of risk indicators is primarily based on literature review. Espe-
cially sources supplied from Safetec, in which indicators were developed for a specific customer
for hazardous well events, were useful in the process of identifying indicators, as much of the
factors and indicators will be the same for well events in general and blowouts in particular.
This section will simply list possible indicators for the factors, and will not address data sources
or measuring frequency, since this case is not for any specific installation/drilling operation.
The data source and measuring frequency will therefore vary somewhat, and it will be difficult to
generalize for many of the indicators. It is important to emphasize that the choices for indicators
will vary greatly depending on who is going to use them and the context that they are used
within. For instance, the indicator "rig intake process" can be useful for an operator which has
a rig intake process, but will not be a very useful indicator for users of the rig to monitor.
The indicators will be presented in tables in this chapter. In Appendix C, the indicators, as well
as additional information in the form of descriptive questions, are presented. It will be up to
users of the indicators or later developers of this case to determine what warrants a good or bad
status of an indicator. This can for instance be visualized as "traffic signals" by evaluating the
status of a specific indicator into red, yellow and green statuses depending on how much risk
a certain status poses. The answers to the questions in the "additional information" column
can be used as basis for the traffic light system. It is also possible to use a rating system of for
instance five dimensions ranging from a safe status to a highly deficient status.
CHAPTER 5. CASE STUDY - BLOWOUTS IN DRILLING OPERATIONS 55
In addition to this, it is important to address the measuring of the indicators, as some of the
indicators can be quite difficult to quantify in a meaningful way. Also, availability of data is
often a challenge when indicators for major accident risk are established, as it is important that
indicators which are to be updated and used at regular intervals should not require much effort
to measure. Measurement of the indicators is also a topic which will vary from user to user, as it
is important to make use of existing data sources to make the monitoring cost-effective.
For some indicators, such as most of the indicators within the preconditions layer, especially in
the local sublayer, auditing can be a good data source. Audits will typically reveal more about
organizational issues than other sources. However, auditing can not take place very often, so this
method can only provide low frequency status updates. Different aspects of the indicator can
also be more meaningful to some users than others, and for this reason, specific ways to measure
the indicators will not be provided here. In Table D.1, comments are included for indicators
which can be particularly difficult to measure. These indicators are typically "soft" indicators
such as competence of personnel or suitability of equipment. Indicators related to work practice
and the quality of work operations can be particularly difficult to monitor, but due to these
indicators’ importance in major accidents, efforts should be made to find ways to monitor these
types of indicators.
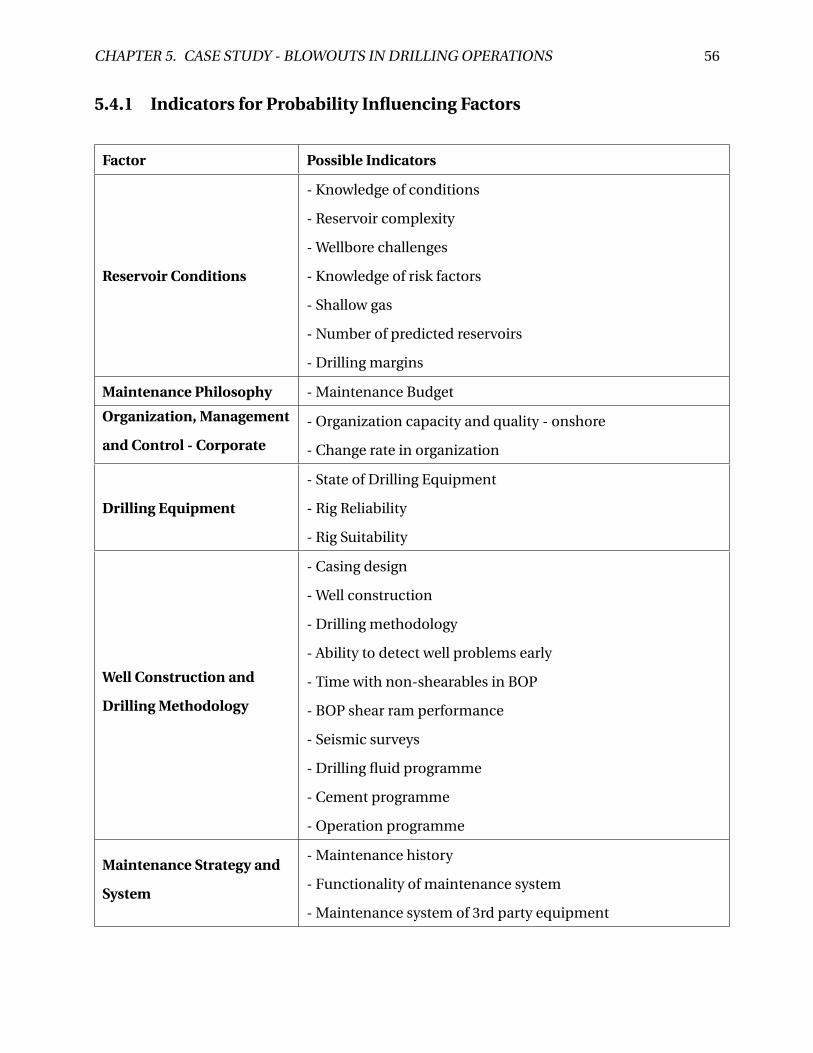
CHAPTER 5. CASE STUDY - BLOWOUTS IN DRILLING OPERATIONS 56
5.4.1 Indicators for Probability Influencing Factors
Factor Possible Indicators
Reservoir Conditions
- Knowledge of conditions
- Reservoir complexity
- Wellbore challenges
- Knowledge of risk factors
- Shallow gas
- Number of predicted reservoirs
- Drilling margins
Maintenance Philosophy - Maintenance Budget
Organization, Management
and Control - Corporate
- Organization capacity and quality - onshore
- Change rate in organization
Drilling Equipment
- State of Drilling Equipment
- Rig Reliability
- Rig Suitability
Well Construction and
Drilling Methodology
- Casing design
- Well construction
- Drilling methodology
- Ability to detect well problems early
- Time with non-shearables in BOP
- BOP shear ram performance
- Seismic surveys
- Drilling fluid programme
- Cement programme
- Operation programme
Maintenance Strategy and
System
- Maintenance history
- Functionality of maintenance system
- Maintenance system of 3rd party equipment
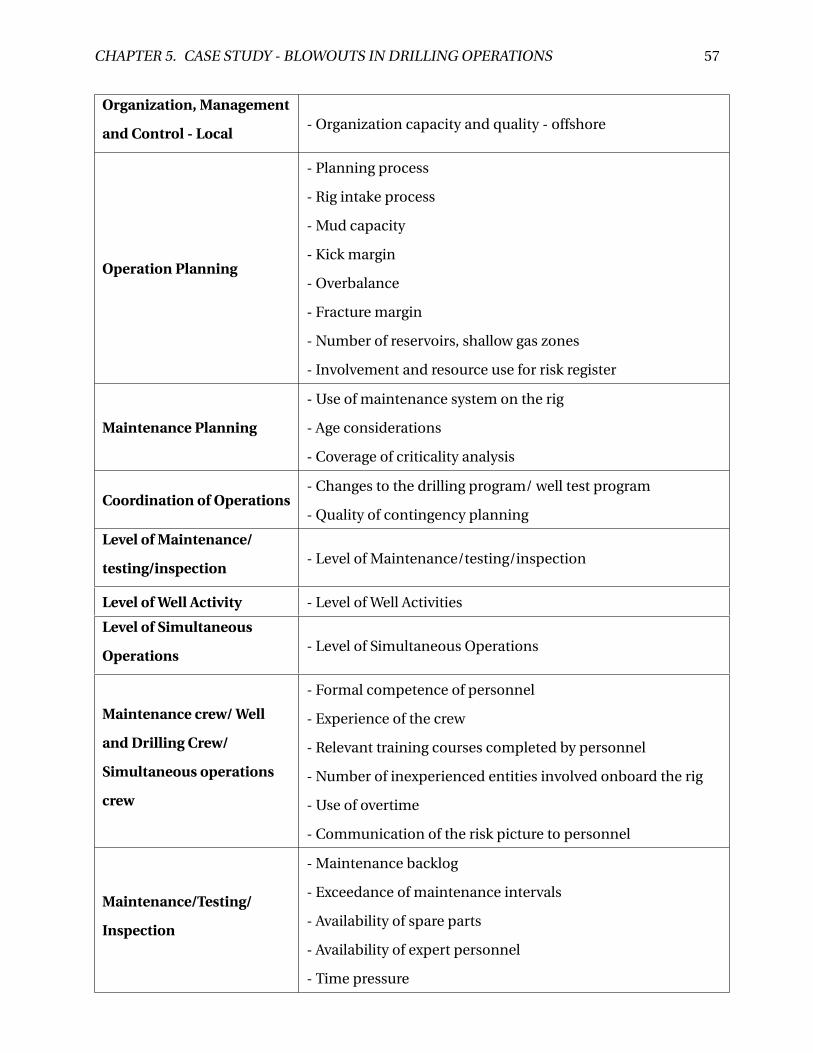
CHAPTER 5. CASE STUDY - BLOWOUTS IN DRILLING OPERATIONS 57
Organization, Management
and Control - Local- Organization capacity and quality - offshore
Operation Planning
- Planning process
- Rig intake process
- Mud capacity
- Kick margin
- Overbalance
- Fracture margin
- Number of reservoirs, shallow gas zones
- Involvement and resource use for risk register
Maintenance Planning
- Use of maintenance system on the rig
- Age considerations
- Coverage of criticality analysis
Coordination of Operations- Changes to the drilling program/ well test program
- Quality of contingency planning
Level of Maintenance/
testing/inspection- Level of Maintenance/testing/inspection
Level of Well Activity - Level of Well Activities
Level of Simultaneous
Operations- Level of Simultaneous Operations
Maintenance crew/ Well
and Drilling Crew/
Simultaneous operations
crew
- Formal competence of personnel
- Experience of the crew
- Relevant training courses completed by personnel
- Number of inexperienced entities involved onboard the rig
- Use of overtime
- Communication of the risk picture to personnel
Maintenance/Testing/
Inspection
- Maintenance backlog
- Exceedance of maintenance intervals
- Availability of spare parts
- Availability of expert personnel
- Time pressure
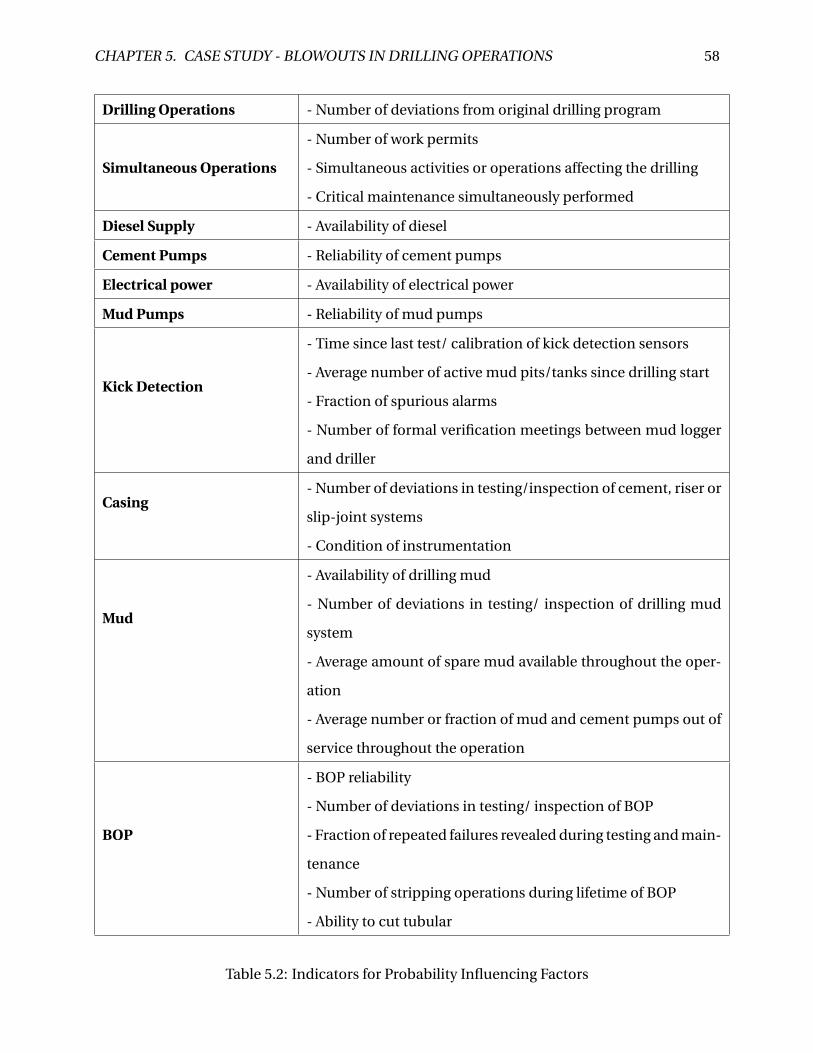
CHAPTER 5. CASE STUDY - BLOWOUTS IN DRILLING OPERATIONS 58
Drilling Operations - Number of deviations from original drilling program
Simultaneous Operations
- Number of work permits
- Simultaneous activities or operations affecting the drilling
- Critical maintenance simultaneously performed
Diesel Supply - Availability of diesel
Cement Pumps - Reliability of cement pumps
Electrical power - Availability of electrical power
Mud Pumps - Reliability of mud pumps
Kick Detection
- Time since last test/ calibration of kick detection sensors
- Average number of active mud pits/tanks since drilling start
- Fraction of spurious alarms
- Number of formal verification meetings between mud logger
and driller
Casing- Number of deviations in testing/inspection of cement, riser or
slip-joint systems
- Condition of instrumentation
Mud
- Availability of drilling mud
- Number of deviations in testing/ inspection of drilling mud
system
- Average amount of spare mud available throughout the oper-
ation
- Average number or fraction of mud and cement pumps out of
service throughout the operation
BOP
- BOP reliability
- Number of deviations in testing/ inspection of BOP
- Fraction of repeated failures revealed during testing and main-
tenance
- Number of stripping operations during lifetime of BOP
- Ability to cut tubular
Table 5.2: Indicators for Probability Influencing Factors
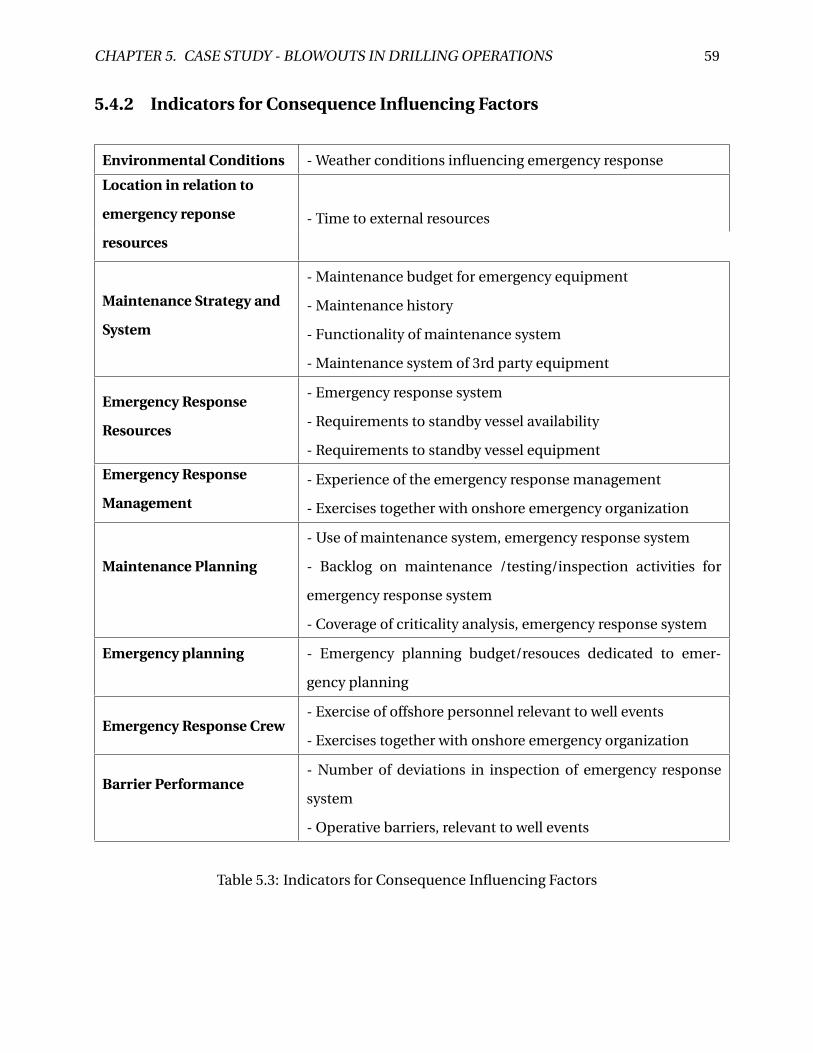
CHAPTER 5. CASE STUDY - BLOWOUTS IN DRILLING OPERATIONS 59
5.4.2 Indicators for Consequence Influencing Factors
Environmental Conditions - Weather conditions influencing emergency response
Location in relation to
emergency reponse
resources
- Time to external resources
Maintenance Strategy and
System
- Maintenance budget for emergency equipment
- Maintenance history
- Functionality of maintenance system
- Maintenance system of 3rd party equipment
Emergency Response
Resources
- Emergency response system
- Requirements to standby vessel availability
- Requirements to standby vessel equipment
Emergency Response
Management
- Experience of the emergency response management
- Exercises together with onshore emergency organization
Maintenance Planning
- Use of maintenance system, emergency response system
- Backlog on maintenance /testing/inspection activities for
emergency response system
- Coverage of criticality analysis, emergency response system
Emergency planning - Emergency planning budget/resouces dedicated to emer-
gency planning
Emergency Response Crew- Exercise of offshore personnel relevant to well events
- Exercises together with onshore emergency organization
Barrier Performance- Number of deviations in inspection of emergency response
system
- Operative barriers, relevant to well events
Table 5.3: Indicators for Consequence Influencing Factors

Chapter 6
Discussion and Concluding Remarks
In this chapter, some final discussion and concluding remarks regarding the application of the
methodology will be given, as well as some recommendations for further work with the case that
was presented in Chapter 5.
6.1 Discussion of the Case Study
The objective of this master thesis has been to apply a generic methodology for the identifi-
cation of major accident risk indicators on a case relevant to offshore drilling activites and to
develop a factor model which illustrates how risk influencing factors influence the probability
and consequences of an offshore blowout event. Relevant theory of well and drilling activities
has been introduced in Chapter 3. The methodology was presented in Chapter 4.
The application was performed in Chapter 5. An overview of the risk influencing factors can
be found in Figure 5.1, while Appendix B explains the factors more thoroughly. The factors
where identified through literature study. The factor model, which illustrates the layering in
the methodology and shows the influences between the factors and the event, can be found
in Figure 5.2 for probability influencing factors. The factor model for consequence influencing
factors can be found in Figure 5.3. There are altogether 27 probability influencing factors and
nine consequence influencing factors in the models.
61
CHAPTER 6. DISCUSSION AND CONCLUDING REMARKS 62
The factor model should illustrate which factors are considered to influence major accident risk
the most and the most important links between these. The focus should therefore not be to in-
clude all possible factors and the theoretical links between them. If the goal of the model was
to include all factors, the model would be too complex and diluted to be a useful tool in holis-
tic risk assessment. The selection of which factors to include and exclude from the model is
therefore the most important and challenging part of the identification process. Though there
is limited data concerning this screening process available, focus should be on which factors
provide increased knowledge of risk. Generally though, a wide range of expertise ranging from
experienced personnel to experts on risk analysis is required for an identification process like
this. A limitation to the identification process in this master thesis is therefore that much of this
"hands-on" expertise is replaced by literature study by a single individual with little previous ex-
perience with these operations. A benefit to the methodology itself, however, is that the model
can be altered and updated easily. Adding or removing factors will only have a local effect and
complete restructuring is not necessary. Increased knowledge in the area can therefore be in-
cluded at a later point and the model can be further developed without much difficulty. This is
especially important, since the most crucial part of the method is the ability to identify all im-
portant factors. This is due to the fact that identification of factors is one of the first steps of the
methodology, and errors in this step will contribute to more errors in later steps.
In Section 5.3 the factor model was tested by applying the framework in a retrospective analysis
of various investigation reports from five recent accidents. The factors were related to obser-
vations from investigation reports and classified according to the state described in the investi-
gation reports. The specific observations and how these are linked to the factors are presented
in Appendix C. The results from the testing process showed that the factor model was a use-
ful supplementary tool for accident investigations. The main conclusion from the validation
tests is that the findings from the investigation reports to a large extent fit into the factor model,
though some findings were harder to fit than others. These results have previously been dis-
cussed in 5.3.1, so further discussion of the results from the testing will not be included in this
chapter. However, it is worth mentioning that findings from accident investigations can also be
used as sources of information for the identification of factors, and as more investigations be-
come available, lessons learned can help to develop the model further, or to support the existing
CHAPTER 6. DISCUSSION AND CONCLUDING REMARKS 63
model depending on the findings. This is especially true since so few relevant accidents could
be reviewed for the validation part of the application.
Section 5.4 shows the indicators which have been identified in the case study. The indicators are
listed in Table 5.2 and are described further in Appendix D. Data sources, measuring frequency
and specific classification dimensions are not included, because this falls beyond the scope of
the master thesis. It will be up to users of the indicators or later developers of this case to deter-
mine what warrants a good or bad status of an indicator and how and at what frequency these
will be measured. When deciding this, it is important to consider availability of data. The effort
required to collect information for the risk indicators should not be too extensive. In addition to
this, the measuring frequency is an important property to consider, because the measuring fre-
quency should be such that the monitoring maintains sufficient control of major accident risk.
When choosing which indicators to include, one should also evaluate the total set of indicators
that are assigned for each factor, in terms of indicator set size and the dual assurance principle.
For each indicator, validity, measurability, comprehensibility and reliability should be used as
criteria for inclusion.
6.2 Concluding Remarks and Recommendations for Further Work
The purpose of the case study has been to develop factors and indicators for monitoring major
accident risk associated with blowouts in drilling operations. The factor models can be used
to visualize the most critical factors that are relevant to major accident risk, and how different
factors are linked together. It also shows interdependencies between the factors. This kind of
qualitative overview can lead to a more holistic understanding of the work processes and im-
proved risk awareness throughout the organization. It should also be noted that the models can
have many different users, depending on how they are implemented and used within the organ-
zation. This is especially true because the indicator step in the case study is left "open" and can
be fitted to many different purposes depending on the choices made for the complete indicator
set.
CHAPTER 6. DISCUSSION AND CONCLUDING REMARKS 64
In addition, the factor models and indicators can also be used as tools in day-to-day planning,
by keeping track of the status of the various factors included in the model and simulating the
effect of different decisions which affect the statuses. For long term planning, the model can be
used to raise awareness about how high level planning and decisions can influence the risk of
major accidents.
An important recommendation for further work is that the model that has been developed in
the case study should be implemented and tested in a full scale setting, to gain more experience
with both the use of the methodology and the model itself. Further data collection should also
be performed at a later stage to keep the model up to date. Potential uses and users of the
model and the indicators should also be investigated, looking at how this can be used in various
contexts both for decision-making and monitoring.
Further, the methodology should be applied to other cases, also included cases outside the
petroleum industry, in order to assess its usefulness further. Also, the model should be further
developed quantitatively. For instance, the influences between the factors in the model should
be identified and quantified. This can be done by using accident investigations to identify corre-
lations between the factors in real-life occurences which are relevant for the model. If the model
is to be used as a supplementary tool in accident investigations in the future, the model should
be tested for this use in an accident investigation, as this would provide further validation and
test the usefulness of this in a real setting.
Appendix A
Pre-study Report
A.1 Preface
This report is a preliminary study that defines some of the objectives and scopes for the master
thesis: “Major Accident Indicators for Drilling and Well Activities”. It is written during the spring
semester of 2013 at the Norwegian University of Science and Technology, the department of
Production and Quality Engineering. The master thesis is partly based on the theory used in the
project thesis “Risk Assessment” which was written during the autumn semester of 2012. The
main supervisor for the master thesis is Professor Stein Haugen at the department of Production
and Quality Engineering. The master thesis is also supervised externally by Jorunn Seljelid from
Safetec Nordic.
A.2 Background
Risk assessment is a useful tool which has been used to analyse risk in different industries for
more than 50 years. Since risk assessment first came into use, different methods for modelling
and analysis of risk has developed, and the discipline is now widely used within industries with
major accident potential. Recently, there has been an increase in interest for finding improved
methods for measuring major accident risk on a continuous basis. There is also an increased
65
APPENDIX A. PRE-STUDY REPORT 66
awareness in major risk industries that many different factors influence risk and that these can
be difficult to get an overview of. Along with this, the Deepwater Horizon catastrophe and sim-
ilar events have cast light on how much of a threat drilling and well activities can present to
invaluable assets.
A.3 Main Objective
The objective of this master thesis is to apply a recently developed methodology for visualiza-
tion of indicators on a case related to drilling or well operations in the North Sea. The method
is based on identifying factors which influence risk both directly and indirectly, establishing the
influence between the factors and finding indicators for each factor. This work will be docu-
mented in a report to be delivered by the 10th of June 2013.
A.4 Project Description
The foundation of this master thesis was laid by the work related to the project thesis "Risk As-
sessment", which was performed as a literature survey. The following tasks are to be performed
in the master thesis:
1. Literature survey — review and summarise relevant literature and get familiar with relevant
drilling/well operations
The first task is intended to give insight and understanding both in relations to the methodology
and drilling and well operations. This will constitute the foundation of the thesis. Sources of
information can be accident/incident investigations, text books about drilling/well operations
and blowouts and case studies were the relevant methodology has been applied.
2. Identify risk influencing factors and build a factor model describing the links between the
factors
This constitutes a large portion of the master thesis, and is a time-consuming step in the method-
ology. Risk influencing factors are to be found from relevant investigations and based on this, a
APPENDIX A. PRE-STUDY REPORT 67
factor model should be built and the relationship between the factors need to be described in
order to achieve a holistic and meaningful factor model.
3. Identify potential indicators for the risk influencing factors
After the factors have been identified and the factor model has been built, potential risk indica-
tors for each factor must be identified. This can be done partially parallell with the identification
of the factors, as this also uses investigations as source material.
4. Summarise, conclude and provide recommendations for further work
A.5 Work Scope
The work with the master thesis will commence on 28th of January 2013. This date is two weeks
later than the formal start date, due to other commitments. After this, the work on the thesis will
take place during the course of 19 weeks, with final delivery on 10th of June 2013. A project plan
with scheduled weeks for each project activity can be seen in Figure A.1.
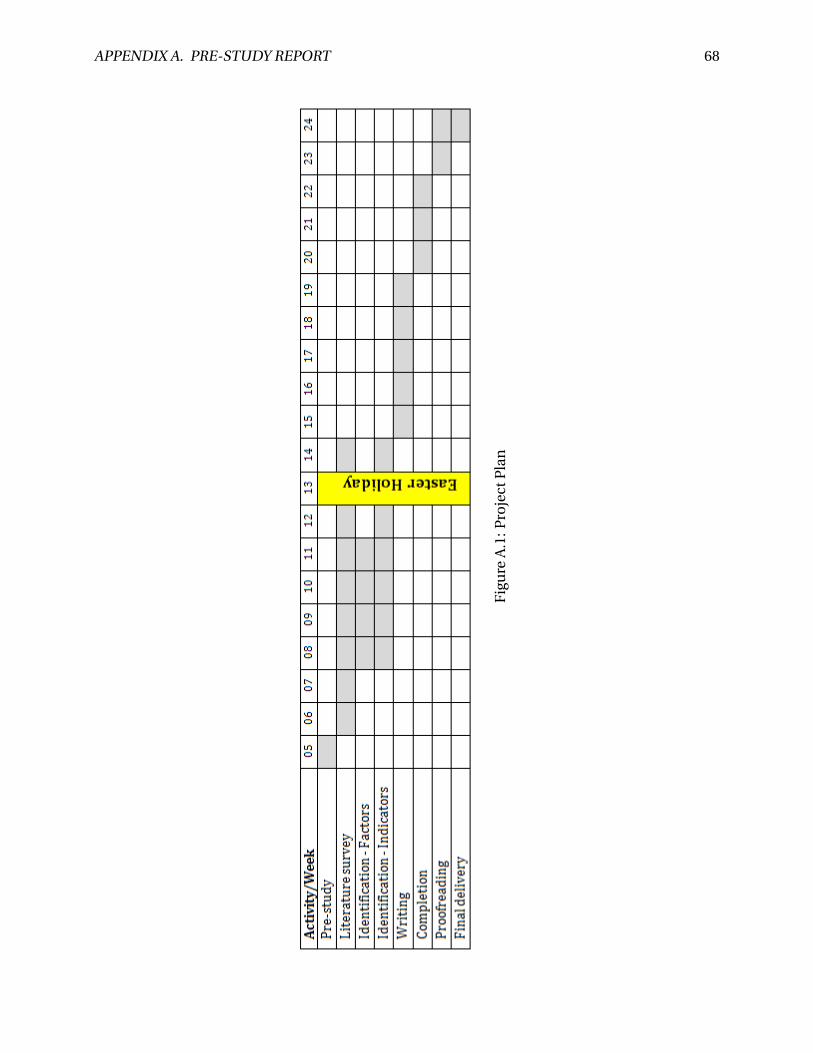
APPENDIX A. PRE-STUDY REPORT 68
Fig
ure
A.1
:Pro
ject
Pla
n
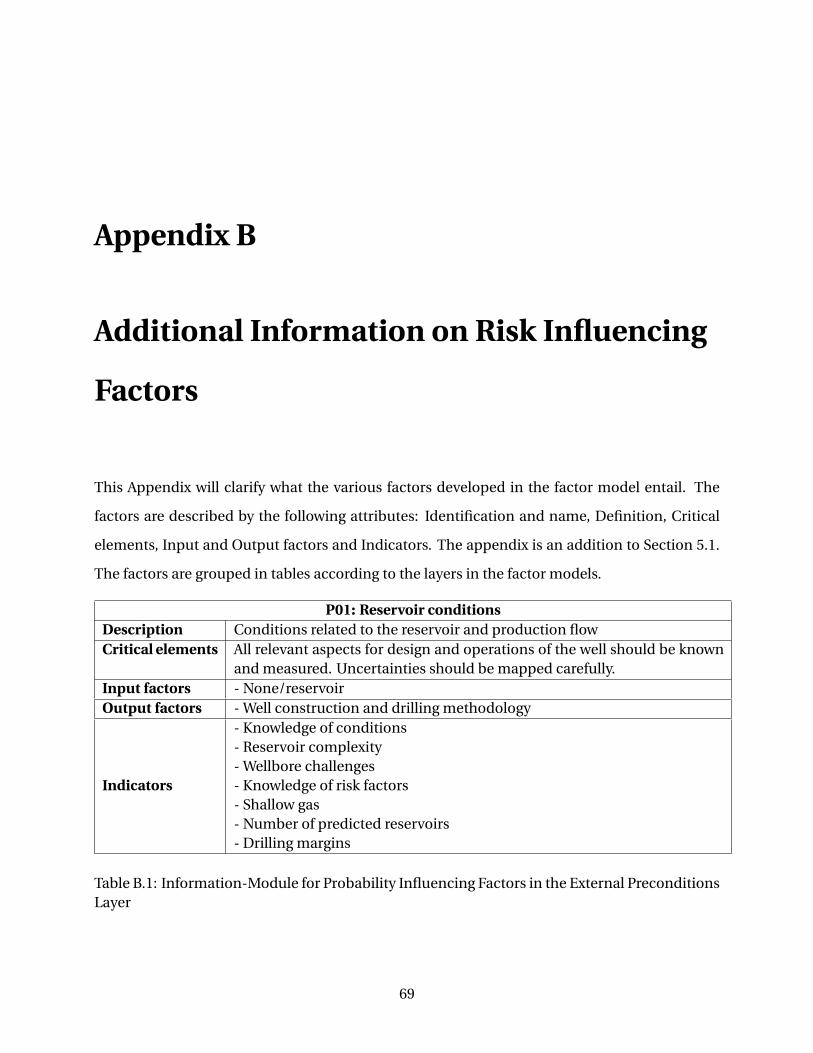
Appendix B
Additional Information on Risk Influencing
Factors
This Appendix will clarify what the various factors developed in the factor model entail. The
factors are described by the following attributes: Identification and name, Definition, Critical
elements, Input and Output factors and Indicators. The appendix is an addition to Section 5.1.
The factors are grouped in tables according to the layers in the factor models.
P01: Reservoir conditionsDescription Conditions related to the reservoir and production flowCritical elements All relevant aspects for design and operations of the well should be known
and measured. Uncertainties should be mapped carefully.Input factors - None/reservoirOutput factors - Well construction and drilling methodology
Indicators
- Knowledge of conditions- Reservoir complexity- Wellbore challenges- Knowledge of risk factors- Shallow gas- Number of predicted reservoirs- Drilling margins
Table B.1: Information-Module for Probability Influencing Factors in the External PreconditionsLayer
69
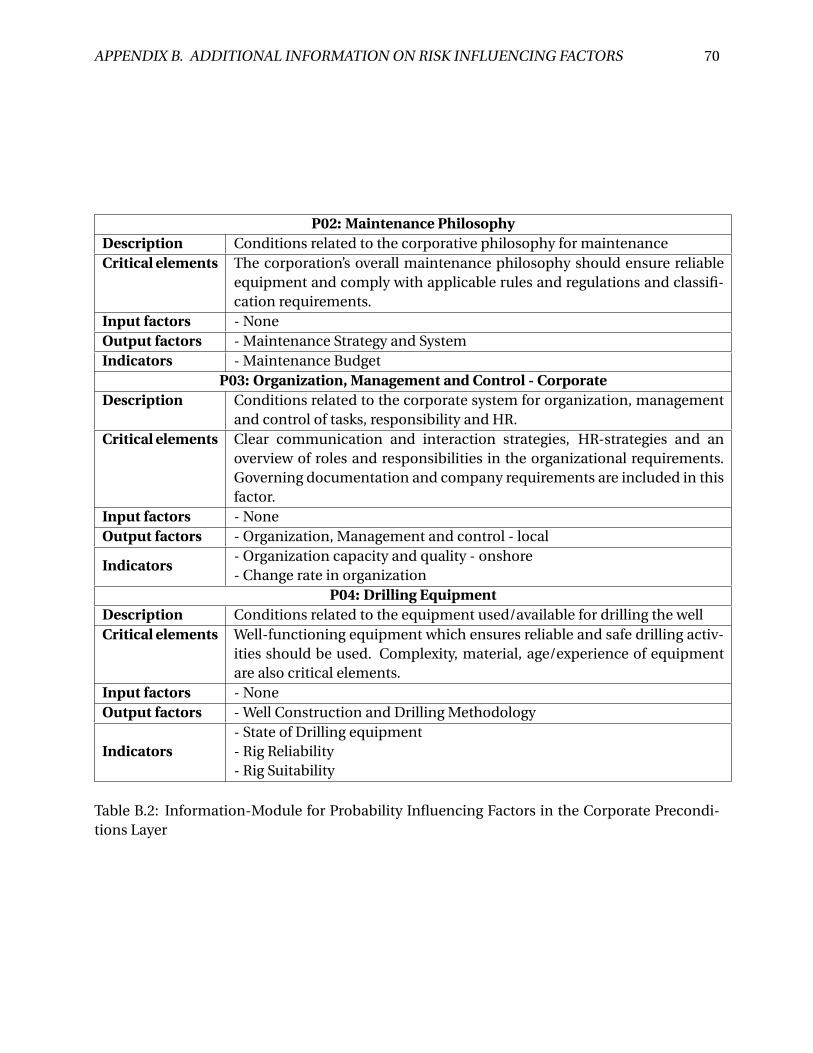
APPENDIX B. ADDITIONAL INFORMATION ON RISK INFLUENCING FACTORS 70
P02: Maintenance PhilosophyDescription Conditions related to the corporative philosophy for maintenanceCritical elements The corporation’s overall maintenance philosophy should ensure reliable
equipment and comply with applicable rules and regulations and classifi-cation requirements.
Input factors - NoneOutput factors - Maintenance Strategy and SystemIndicators - Maintenance Budget
P03: Organization, Management and Control - CorporateDescription Conditions related to the corporate system for organization, management
and control of tasks, responsibility and HR.Critical elements Clear communication and interaction strategies, HR-strategies and an
overview of roles and responsibilities in the organizational requirements.Governing documentation and company requirements are included in thisfactor.
Input factors - NoneOutput factors - Organization, Management and control - local
Indicators- Organization capacity and quality - onshore- Change rate in organization
P04: Drilling EquipmentDescription Conditions related to the equipment used/available for drilling the wellCritical elements Well-functioning equipment which ensures reliable and safe drilling activ-
ities should be used. Complexity, material, age/experience of equipmentare also critical elements.
Input factors - NoneOutput factors - Well Construction and Drilling Methodology
Indicators- State of Drilling equipment- Rig Reliability- Rig Suitability
Table B.2: Information-Module for Probability Influencing Factors in the Corporate Precondi-tions Layer
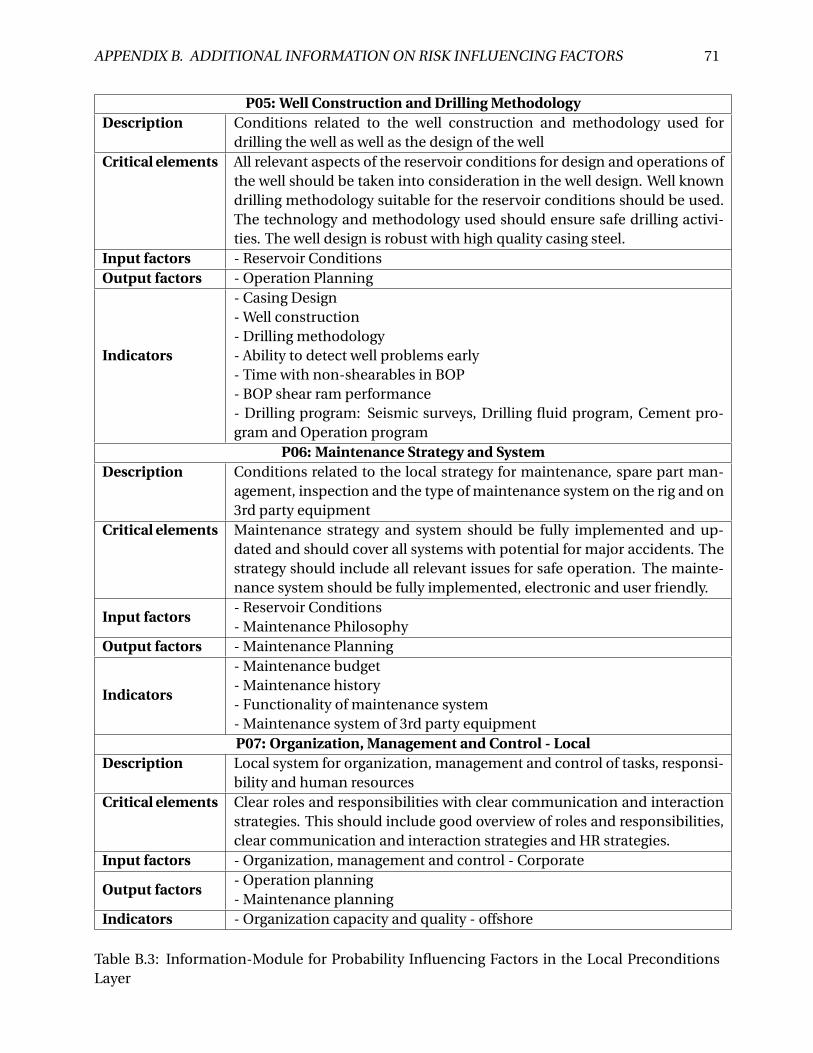
APPENDIX B. ADDITIONAL INFORMATION ON RISK INFLUENCING FACTORS 71
P05: Well Construction and Drilling MethodologyDescription Conditions related to the well construction and methodology used for
drilling the well as well as the design of the wellCritical elements All relevant aspects of the reservoir conditions for design and operations of
the well should be taken into consideration in the well design. Well knowndrilling methodology suitable for the reservoir conditions should be used.The technology and methodology used should ensure safe drilling activi-ties. The well design is robust with high quality casing steel.
Input factors - Reservoir ConditionsOutput factors - Operation Planning
Indicators
- Casing Design- Well construction- Drilling methodology- Ability to detect well problems early- Time with non-shearables in BOP- BOP shear ram performance- Drilling program: Seismic surveys, Drilling fluid program, Cement pro-gram and Operation program
P06: Maintenance Strategy and SystemDescription Conditions related to the local strategy for maintenance, spare part man-
agement, inspection and the type of maintenance system on the rig and on3rd party equipment
Critical elements Maintenance strategy and system should be fully implemented and up-dated and should cover all systems with potential for major accidents. Thestrategy should include all relevant issues for safe operation. The mainte-nance system should be fully implemented, electronic and user friendly.
Input factors- Reservoir Conditions- Maintenance Philosophy
Output factors - Maintenance Planning
Indicators
- Maintenance budget- Maintenance history- Functionality of maintenance system- Maintenance system of 3rd party equipmentP07: Organization, Management and Control - Local
Description Local system for organization, management and control of tasks, responsi-bility and human resources
Critical elements Clear roles and responsibilities with clear communication and interactionstrategies. This should include good overview of roles and responsibilities,clear communication and interaction strategies and HR strategies.
Input factors - Organization, management and control - Corporate
Output factors- Operation planning- Maintenance planning
Indicators - Organization capacity and quality - offshore
Table B.3: Information-Module for Probability Influencing Factors in the Local PreconditionsLayer
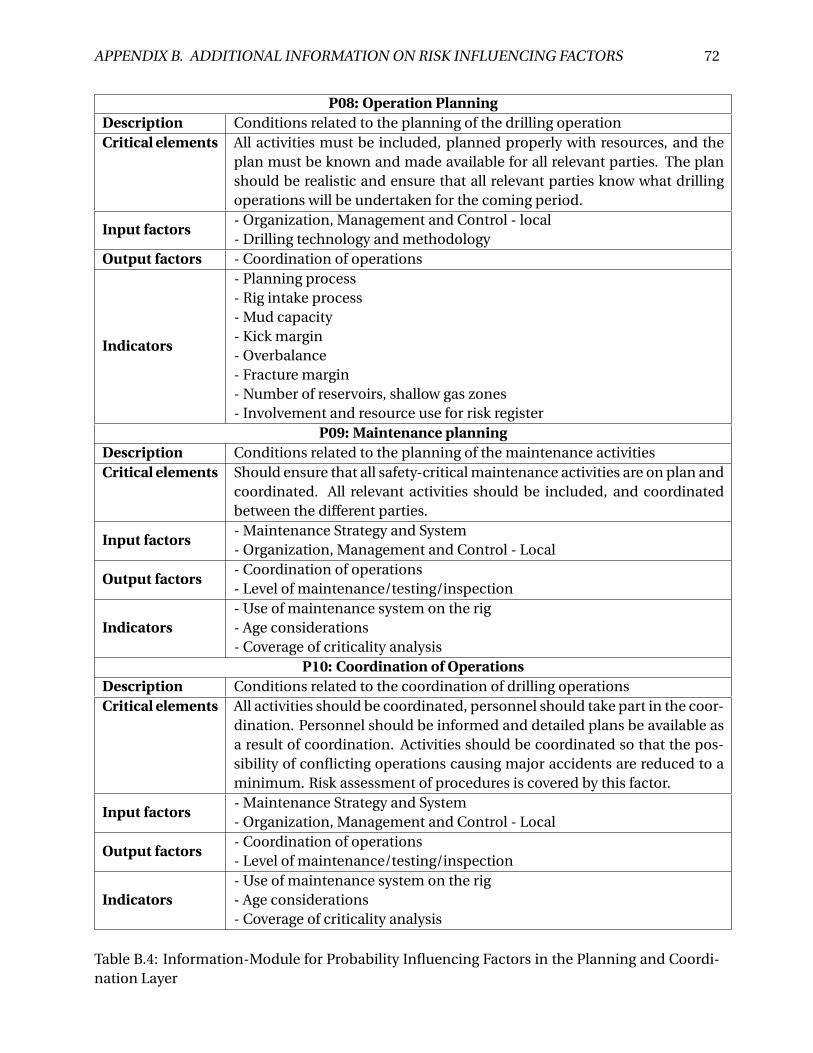
APPENDIX B. ADDITIONAL INFORMATION ON RISK INFLUENCING FACTORS 72
P08: Operation PlanningDescription Conditions related to the planning of the drilling operationCritical elements All activities must be included, planned properly with resources, and the
plan must be known and made available for all relevant parties. The planshould be realistic and ensure that all relevant parties know what drillingoperations will be undertaken for the coming period.
Input factors- Organization, Management and Control - local- Drilling technology and methodology
Output factors - Coordination of operations
Indicators
- Planning process- Rig intake process- Mud capacity- Kick margin- Overbalance- Fracture margin- Number of reservoirs, shallow gas zones- Involvement and resource use for risk register
P09: Maintenance planningDescription Conditions related to the planning of the maintenance activitiesCritical elements Should ensure that all safety-critical maintenance activities are on plan and
coordinated. All relevant activities should be included, and coordinatedbetween the different parties.
Input factors- Maintenance Strategy and System- Organization, Management and Control - Local
Output factors- Coordination of operations- Level of maintenance/testing/inspection
Indicators- Use of maintenance system on the rig- Age considerations- Coverage of criticality analysis
P10: Coordination of OperationsDescription Conditions related to the coordination of drilling operationsCritical elements All activities should be coordinated, personnel should take part in the coor-
dination. Personnel should be informed and detailed plans be available asa result of coordination. Activities should be coordinated so that the pos-sibility of conflicting operations causing major accidents are reduced to aminimum. Risk assessment of procedures is covered by this factor.
Input factors- Maintenance Strategy and System- Organization, Management and Control - Local
Output factors- Coordination of operations- Level of maintenance/testing/inspection
Indicators- Use of maintenance system on the rig- Age considerations- Coverage of criticality analysis
Table B.4: Information-Module for Probability Influencing Factors in the Planning and Coordi-nation Layer
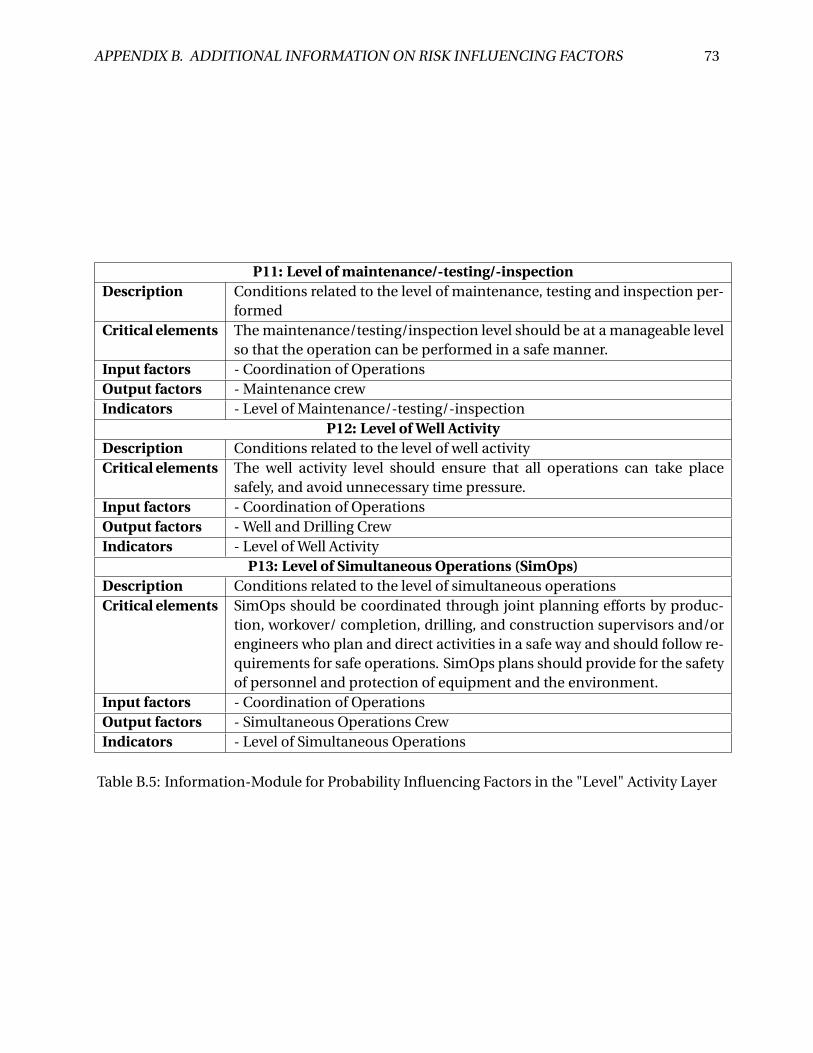
APPENDIX B. ADDITIONAL INFORMATION ON RISK INFLUENCING FACTORS 73
P11: Level of maintenance/-testing/-inspectionDescription Conditions related to the level of maintenance, testing and inspection per-
formedCritical elements The maintenance/testing/inspection level should be at a manageable level
so that the operation can be performed in a safe manner.Input factors - Coordination of OperationsOutput factors - Maintenance crewIndicators - Level of Maintenance/-testing/-inspection
P12: Level of Well ActivityDescription Conditions related to the level of well activityCritical elements The well activity level should ensure that all operations can take place
safely, and avoid unnecessary time pressure.Input factors - Coordination of OperationsOutput factors - Well and Drilling CrewIndicators - Level of Well Activity
P13: Level of Simultaneous Operations (SimOps)Description Conditions related to the level of simultaneous operationsCritical elements SimOps should be coordinated through joint planning efforts by produc-
tion, workover/ completion, drilling, and construction supervisors and/orengineers who plan and direct activities in a safe way and should follow re-quirements for safe operations. SimOps plans should provide for the safetyof personnel and protection of equipment and the environment.
Input factors - Coordination of OperationsOutput factors - Simultaneous Operations CrewIndicators - Level of Simultaneous Operations
Table B.5: Information-Module for Probability Influencing Factors in the "Level" Activity Layer
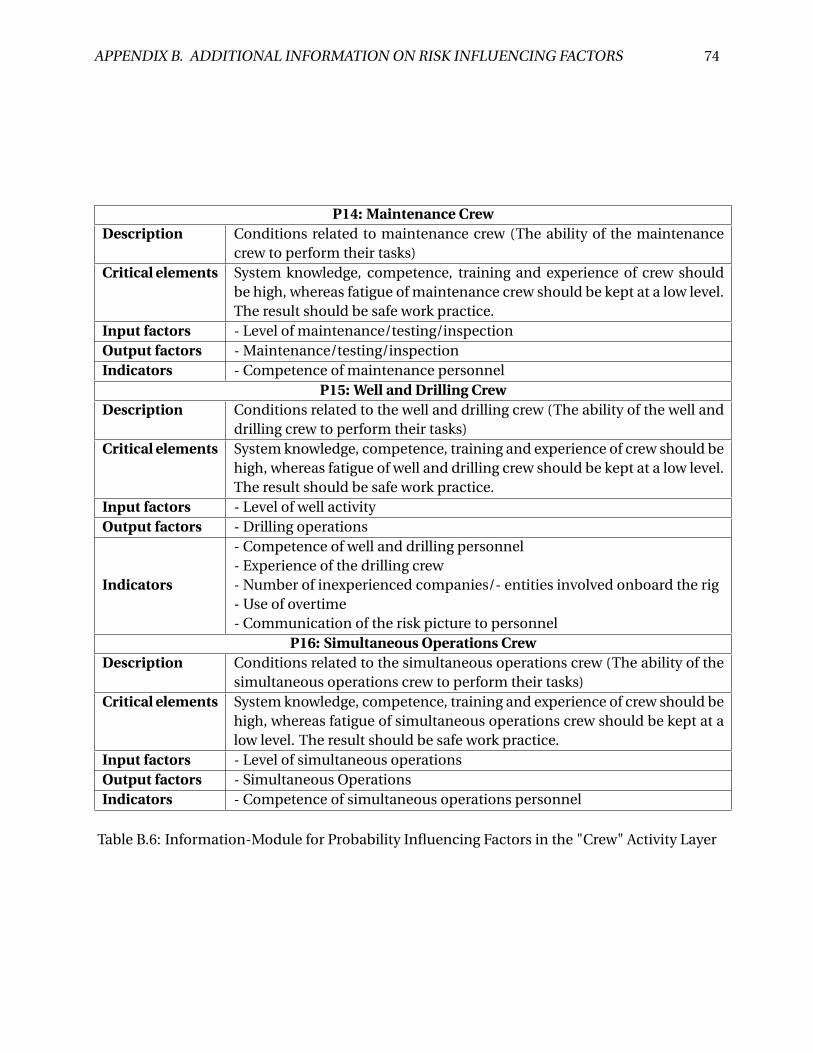
APPENDIX B. ADDITIONAL INFORMATION ON RISK INFLUENCING FACTORS 74
P14: Maintenance CrewDescription Conditions related to maintenance crew (The ability of the maintenance
crew to perform their tasks)Critical elements System knowledge, competence, training and experience of crew should
be high, whereas fatigue of maintenance crew should be kept at a low level.The result should be safe work practice.
Input factors - Level of maintenance/testing/inspectionOutput factors - Maintenance/testing/inspectionIndicators - Competence of maintenance personnel
P15: Well and Drilling CrewDescription Conditions related to the well and drilling crew (The ability of the well and
drilling crew to perform their tasks)Critical elements System knowledge, competence, training and experience of crew should be
high, whereas fatigue of well and drilling crew should be kept at a low level.The result should be safe work practice.
Input factors - Level of well activityOutput factors - Drilling operations
Indicators
- Competence of well and drilling personnel- Experience of the drilling crew- Number of inexperienced companies/- entities involved onboard the rig- Use of overtime- Communication of the risk picture to personnel
P16: Simultaneous Operations CrewDescription Conditions related to the simultaneous operations crew (The ability of the
simultaneous operations crew to perform their tasks)Critical elements System knowledge, competence, training and experience of crew should be
high, whereas fatigue of simultaneous operations crew should be kept at alow level. The result should be safe work practice.
Input factors - Level of simultaneous operationsOutput factors - Simultaneous OperationsIndicators - Competence of simultaneous operations personnel
Table B.6: Information-Module for Probability Influencing Factors in the "Crew" Activity Layer
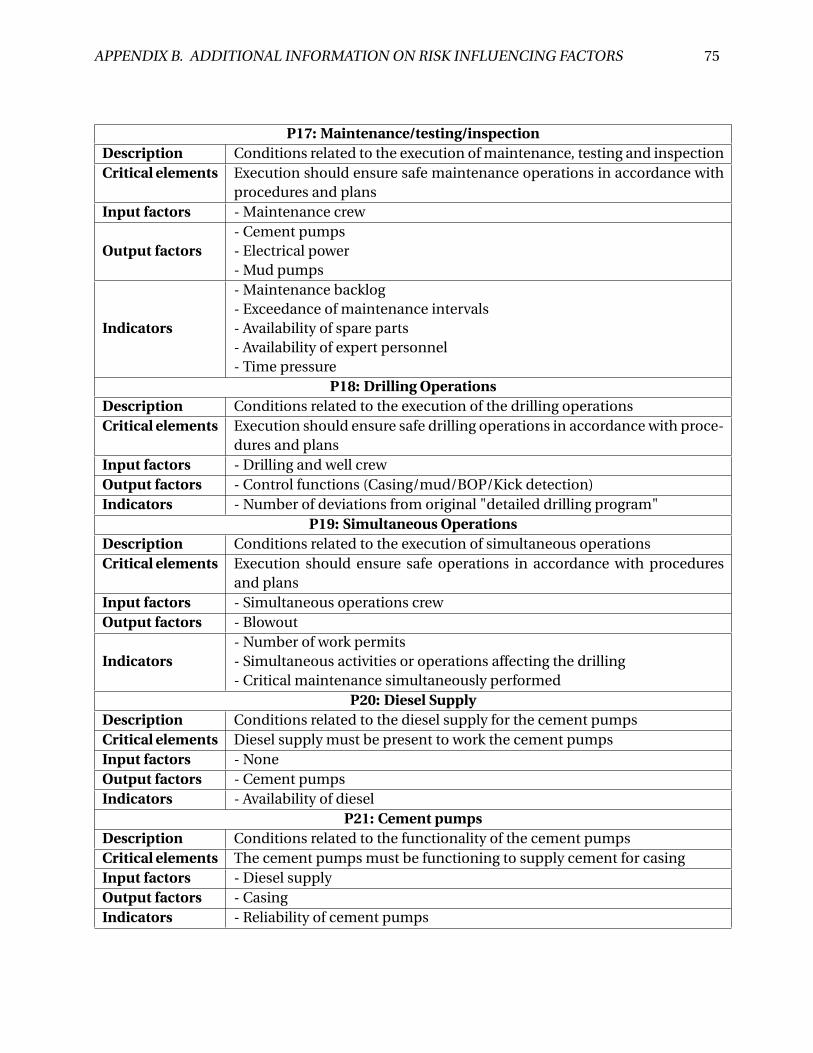
APPENDIX B. ADDITIONAL INFORMATION ON RISK INFLUENCING FACTORS 75
P17: Maintenance/testing/inspectionDescription Conditions related to the execution of maintenance, testing and inspectionCritical elements Execution should ensure safe maintenance operations in accordance with
procedures and plansInput factors - Maintenance crew
Output factors- Cement pumps- Electrical power- Mud pumps
Indicators
- Maintenance backlog- Exceedance of maintenance intervals- Availability of spare parts- Availability of expert personnel- Time pressure
P18: Drilling OperationsDescription Conditions related to the execution of the drilling operationsCritical elements Execution should ensure safe drilling operations in accordance with proce-
dures and plansInput factors - Drilling and well crewOutput factors - Control functions (Casing/mud/BOP/Kick detection)Indicators - Number of deviations from original "detailed drilling program"
P19: Simultaneous OperationsDescription Conditions related to the execution of simultaneous operationsCritical elements Execution should ensure safe operations in accordance with procedures
and plansInput factors - Simultaneous operations crewOutput factors - Blowout
Indicators- Number of work permits- Simultaneous activities or operations affecting the drilling- Critical maintenance simultaneously performed
P20: Diesel SupplyDescription Conditions related to the diesel supply for the cement pumpsCritical elements Diesel supply must be present to work the cement pumpsInput factors - NoneOutput factors - Cement pumpsIndicators - Availability of diesel
P21: Cement pumpsDescription Conditions related to the functionality of the cement pumpsCritical elements The cement pumps must be functioning to supply cement for casingInput factors - Diesel supplyOutput factors - CasingIndicators - Reliability of cement pumps
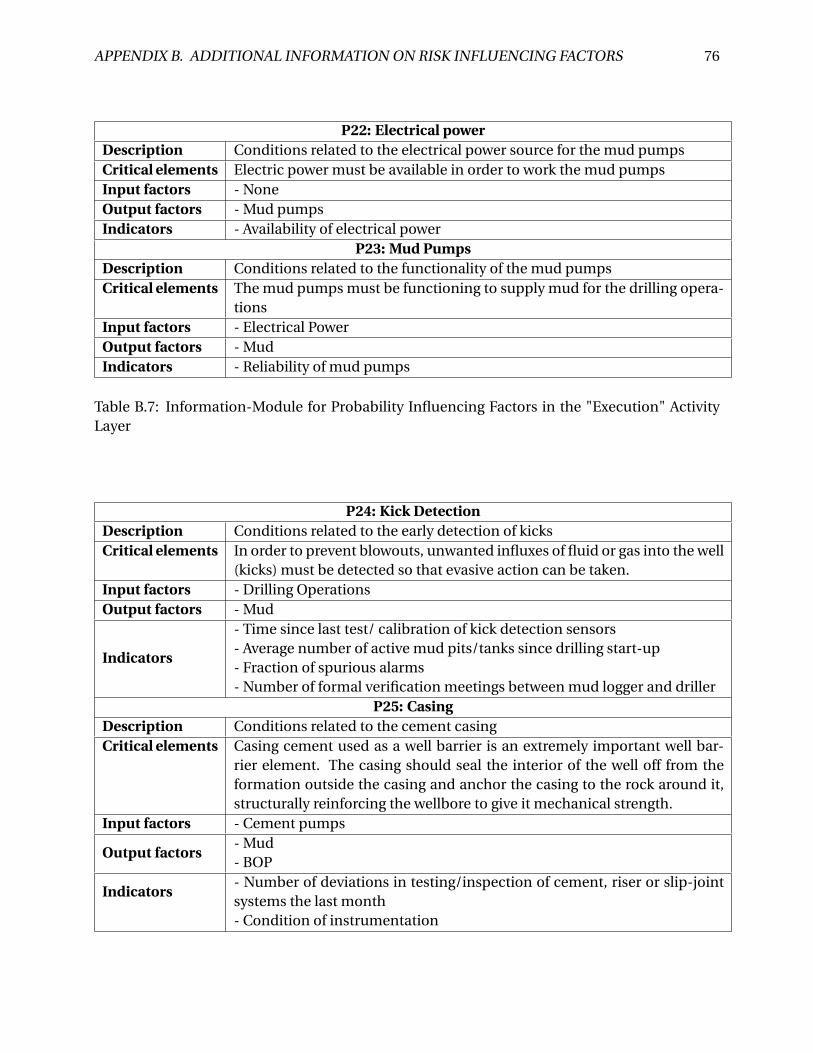
APPENDIX B. ADDITIONAL INFORMATION ON RISK INFLUENCING FACTORS 76
P22: Electrical powerDescription Conditions related to the electrical power source for the mud pumpsCritical elements Electric power must be available in order to work the mud pumpsInput factors - NoneOutput factors - Mud pumpsIndicators - Availability of electrical power
P23: Mud PumpsDescription Conditions related to the functionality of the mud pumpsCritical elements The mud pumps must be functioning to supply mud for the drilling opera-
tionsInput factors - Electrical PowerOutput factors - MudIndicators - Reliability of mud pumps
Table B.7: Information-Module for Probability Influencing Factors in the "Execution" ActivityLayer
P24: Kick DetectionDescription Conditions related to the early detection of kicksCritical elements In order to prevent blowouts, unwanted influxes of fluid or gas into the well
(kicks) must be detected so that evasive action can be taken.Input factors - Drilling OperationsOutput factors - Mud
Indicators
- Time since last test/ calibration of kick detection sensors- Average number of active mud pits/tanks since drilling start-up- Fraction of spurious alarms- Number of formal verification meetings between mud logger and driller
P25: CasingDescription Conditions related to the cement casingCritical elements Casing cement used as a well barrier is an extremely important well bar-
rier element. The casing should seal the interior of the well off from theformation outside the casing and anchor the casing to the rock around it,structurally reinforcing the wellbore to give it mechanical strength.
Input factors - Cement pumps
Output factors- Mud- BOP
Indicators- Number of deviations in testing/inspection of cement, riser or slip-jointsystems the last month- Condition of instrumentation
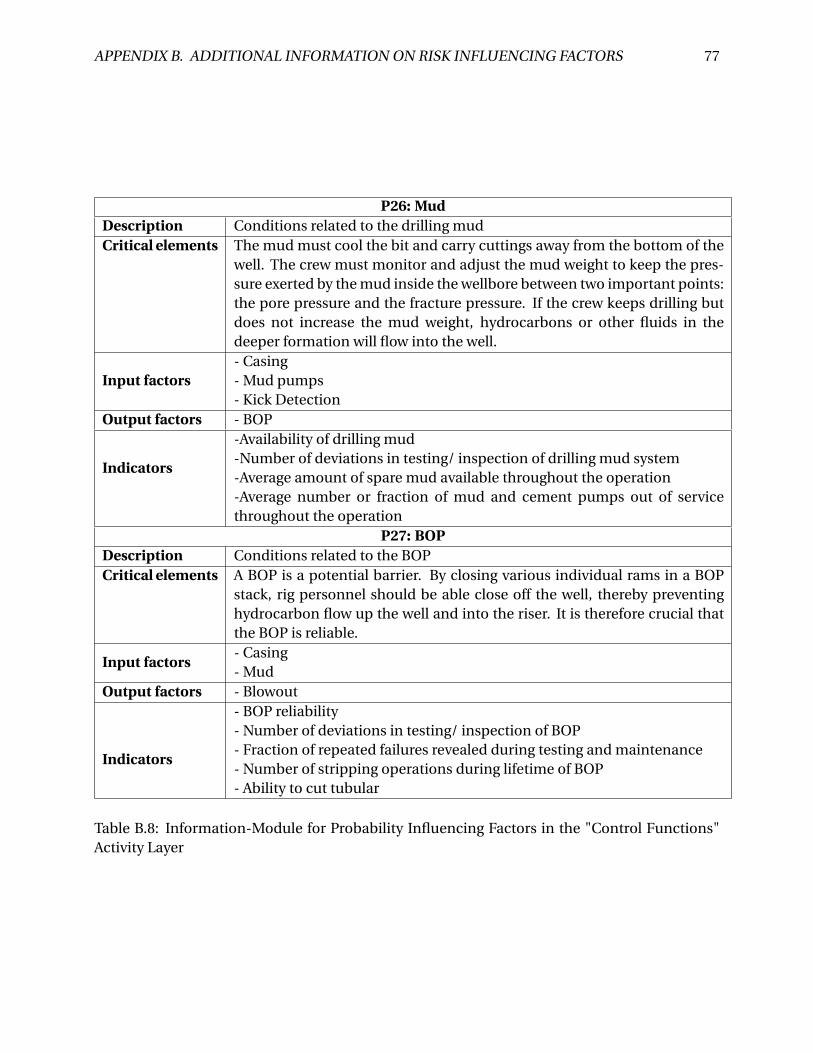
APPENDIX B. ADDITIONAL INFORMATION ON RISK INFLUENCING FACTORS 77
P26: MudDescription Conditions related to the drilling mudCritical elements The mud must cool the bit and carry cuttings away from the bottom of the
well. The crew must monitor and adjust the mud weight to keep the pres-sure exerted by the mud inside the wellbore between two important points:the pore pressure and the fracture pressure. If the crew keeps drilling butdoes not increase the mud weight, hydrocarbons or other fluids in thedeeper formation will flow into the well.
Input factors- Casing- Mud pumps- Kick Detection
Output factors - BOP
Indicators
-Availability of drilling mud-Number of deviations in testing/ inspection of drilling mud system-Average amount of spare mud available throughout the operation-Average number or fraction of mud and cement pumps out of servicethroughout the operation
P27: BOPDescription Conditions related to the BOPCritical elements A BOP is a potential barrier. By closing various individual rams in a BOP
stack, rig personnel should be able close off the well, thereby preventinghydrocarbon flow up the well and into the riser. It is therefore crucial thatthe BOP is reliable.
Input factors- Casing- Mud
Output factors - Blowout
Indicators
- BOP reliability- Number of deviations in testing/ inspection of BOP- Fraction of repeated failures revealed during testing and maintenance- Number of stripping operations during lifetime of BOP- Ability to cut tubular
Table B.8: Information-Module for Probability Influencing Factors in the "Control Functions"Activity Layer
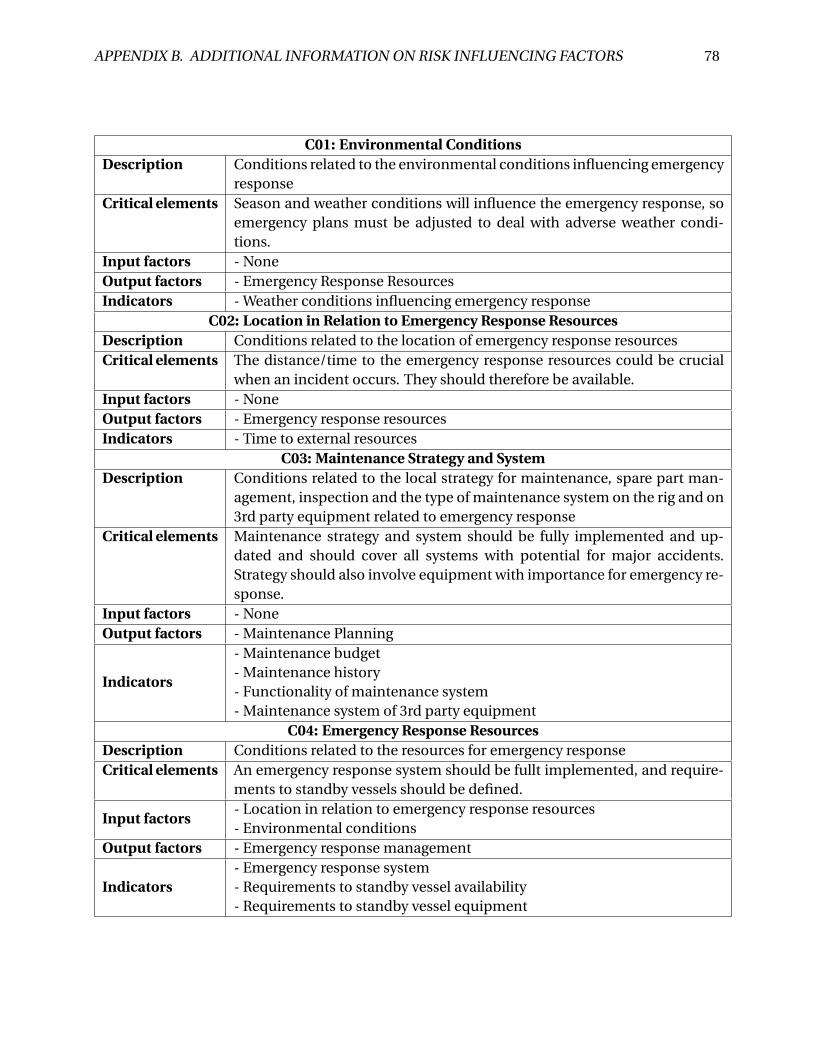
APPENDIX B. ADDITIONAL INFORMATION ON RISK INFLUENCING FACTORS 78
C01: Environmental ConditionsDescription Conditions related to the environmental conditions influencing emergency
responseCritical elements Season and weather conditions will influence the emergency response, so
emergency plans must be adjusted to deal with adverse weather condi-tions.
Input factors - NoneOutput factors - Emergency Response ResourcesIndicators - Weather conditions influencing emergency response
C02: Location in Relation to Emergency Response ResourcesDescription Conditions related to the location of emergency response resourcesCritical elements The distance/time to the emergency response resources could be crucial
when an incident occurs. They should therefore be available.Input factors - NoneOutput factors - Emergency response resourcesIndicators - Time to external resources
C03: Maintenance Strategy and SystemDescription Conditions related to the local strategy for maintenance, spare part man-
agement, inspection and the type of maintenance system on the rig and on3rd party equipment related to emergency response
Critical elements Maintenance strategy and system should be fully implemented and up-dated and should cover all systems with potential for major accidents.Strategy should also involve equipment with importance for emergency re-sponse.
Input factors - NoneOutput factors - Maintenance Planning
Indicators
- Maintenance budget- Maintenance history- Functionality of maintenance system- Maintenance system of 3rd party equipment
C04: Emergency Response ResourcesDescription Conditions related to the resources for emergency responseCritical elements An emergency response system should be fullt implemented, and require-
ments to standby vessels should be defined.
Input factors- Location in relation to emergency response resources- Environmental conditions
Output factors - Emergency response management
Indicators- Emergency response system- Requirements to standby vessel availability- Requirements to standby vessel equipment
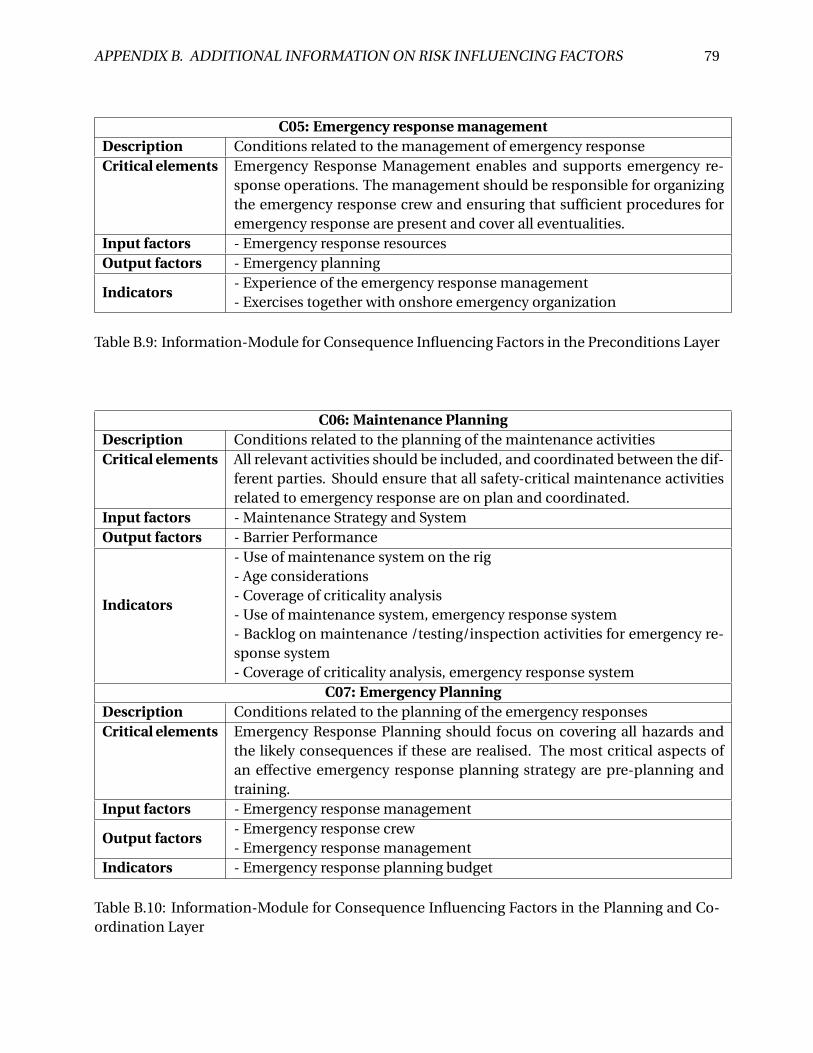
APPENDIX B. ADDITIONAL INFORMATION ON RISK INFLUENCING FACTORS 79
C05: Emergency response managementDescription Conditions related to the management of emergency responseCritical elements Emergency Response Management enables and supports emergency re-
sponse operations. The management should be responsible for organizingthe emergency response crew and ensuring that sufficient procedures foremergency response are present and cover all eventualities.
Input factors - Emergency response resourcesOutput factors - Emergency planning
Indicators- Experience of the emergency response management- Exercises together with onshore emergency organization
Table B.9: Information-Module for Consequence Influencing Factors in the Preconditions Layer
C06: Maintenance PlanningDescription Conditions related to the planning of the maintenance activitiesCritical elements All relevant activities should be included, and coordinated between the dif-
ferent parties. Should ensure that all safety-critical maintenance activitiesrelated to emergency response are on plan and coordinated.
Input factors - Maintenance Strategy and SystemOutput factors - Barrier Performance
Indicators
- Use of maintenance system on the rig- Age considerations- Coverage of criticality analysis- Use of maintenance system, emergency response system- Backlog on maintenance /testing/inspection activities for emergency re-sponse system- Coverage of criticality analysis, emergency response system
C07: Emergency PlanningDescription Conditions related to the planning of the emergency responsesCritical elements Emergency Response Planning should focus on covering all hazards and
the likely consequences if these are realised. The most critical aspects ofan effective emergency response planning strategy are pre-planning andtraining.
Input factors - Emergency response management
Output factors- Emergency response crew- Emergency response management
Indicators - Emergency response planning budget
Table B.10: Information-Module for Consequence Influencing Factors in the Planning and Co-ordination Layer
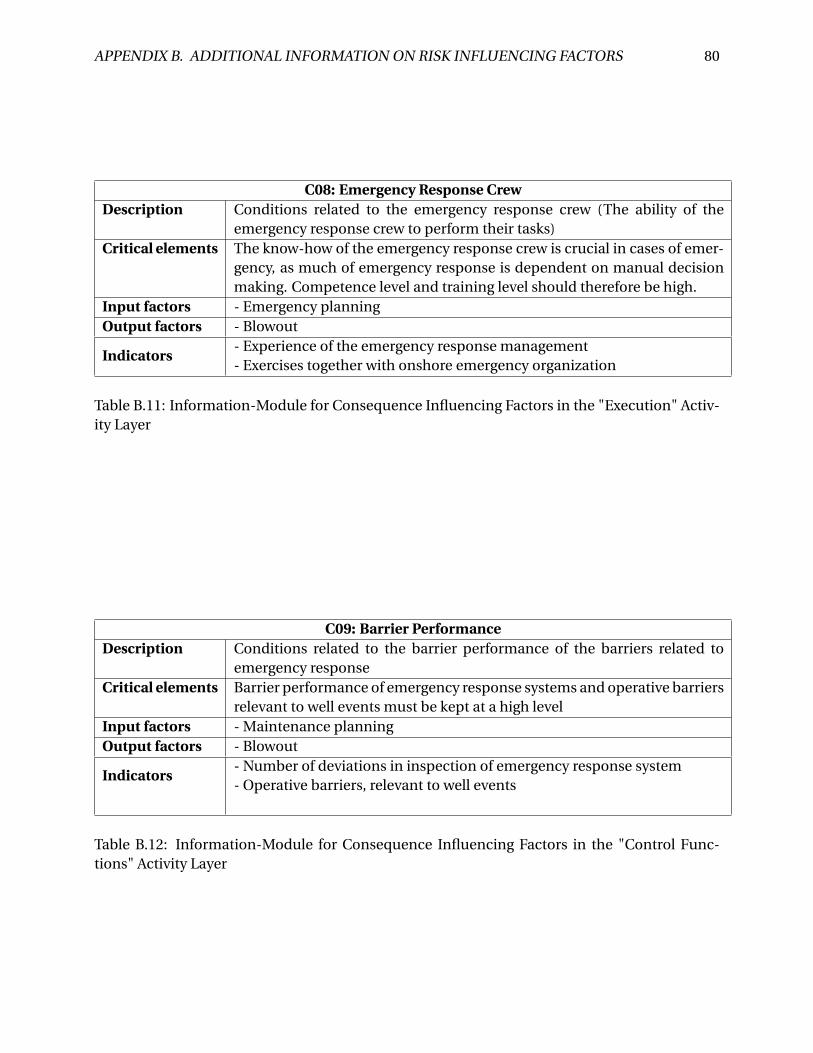
APPENDIX B. ADDITIONAL INFORMATION ON RISK INFLUENCING FACTORS 80
C08: Emergency Response CrewDescription Conditions related to the emergency response crew (The ability of the
emergency response crew to perform their tasks)Critical elements The know-how of the emergency response crew is crucial in cases of emer-
gency, as much of emergency response is dependent on manual decisionmaking. Competence level and training level should therefore be high.
Input factors - Emergency planningOutput factors - Blowout
Indicators- Experience of the emergency response management- Exercises together with onshore emergency organization
Table B.11: Information-Module for Consequence Influencing Factors in the "Execution" Activ-ity Layer
C09: Barrier PerformanceDescription Conditions related to the barrier performance of the barriers related to
emergency responseCritical elements Barrier performance of emergency response systems and operative barriers
relevant to well events must be kept at a high levelInput factors - Maintenance planningOutput factors - Blowout
Indicators- Number of deviations in inspection of emergency response system- Operative barriers, relevant to well events
Table B.12: Information-Module for Consequence Influencing Factors in the "Control Func-tions" Activity Layer
Appendix C
Additional Information from Investigations
This appendix will present the reasoning behind the classification of factor statuses from inves-
tigations used in section 5.3. These classifications have previously been presented in Figure 5.4.
Statements and the author’s arguments as to why a certain classification is implied based on the
statement is provided in this appendix.
The accidents which have been included in this appendix are:
Section C.1: Blowout at Deepwater Horizon/Macondo - 2010
Section C.2: Blowout at Snorre A - 2004
Section C.3: Well Kick at Gullfaks C - 2010
Section C.4: Blowout at Montara - 2009
Section C.5: Well Kick at Valhall - 2003
81
APPENDIX C. ADDITIONAL INFORMATION FROM INVESTIGATIONS 82
C.1 Blowout at Deepwater Horizon/Macondo - 2010
A description of this accident can be found in section 5.3.1.
Reservoir Conditions - Yellow
BP encountered a series of complications while drilling the Macondo well. This included two
previous kicks, a ballooning event, lost circulation events, and trouble determining pore pressures.
Together, these issues made Macondo “a difficult well.” (Chief Counsel, 2011, p. 58).
However, there were no conditions at Macondo, related to the underground, water-depth or the
environment that were too exceptional to manage. Well qualified and internationally leading
companies were involved and had previous experience from similar prospects. Therefore, the
drilling and well operations should have been carried out safely (Tinmannsvik et al., 2011, p. 7).
The reservoir conditions can therefore be said to be challenging, but far from impossible to han-
dle. It also seems, from the many incidents which occured, that the knowledge of the reservoir
conditions was lacking. The status of the reservoir conditions is therefore classified as yellow.
Maintenance Philosophy - Yellow
It was well known by the rig crew and BP shore-based leadership that the Deepwater Horizon
blowout preventer was not in compliance with certification requirements . Transocean did not re-
certify the BOP because it instead applied condition-based maintenance. According to Transocean‘s
Subsea Maintenance Philosophy, [t]he condition of the equipment shall define the necessary re-
pair work, if any (Chief Counsel, 2011, p. 216).
This statement implies that the maintenance philosophy did not ensure good technical condi-
tions. The maintenance philosophy can therefore be said to be a contributing factor and it is
assigned a yellow status.
APPENDIX C. ADDITIONAL INFORMATION FROM INVESTIGATIONS 83
Organization, Management and Control – Corporate - Red
The Macondo disaster was not, as some have suggested the result of a coincidental alignment of
disparate technical failures. While many technical failures contributed to the blowout, the Chief
Counsel‘s team traces each of them back to an overarching failure of management (Chief Counsel,
2011, p. 225).
Findings that the technical failures can all be traced back to overarching failures in management
implies a red status for corporate organization, management and control.
Drilling Equipment, Green
Deepwater operators employ exceedingly sophisticated technology to drill wells (Chief Counsel,
2011, p. 240).
This suggests that the drilling equipment which was used did not contribute to the accident.
Drilling equipment therefore has a green status.
Well Construction and Drilling Methodology - Red
BP’s design decisions had significant consequences and increased the risks associated with the
temporary abandonment at Macondo in several important ways. (Chief Counsel, 2011, p. 53).
The Chief Counsel’s team finds that these decisions (engineers (1) decided to use a long string pro-
duction casing, (2) installed rupture disks in the well, and (3) decided to avoid creating trapped
annular spaces by omitting a protective casing and leaving annular spaces open to the surround-
ing formation) complicated pre-blowout cementing operations and post-blowout containment
efforts (Chief Counsel, 2011, p. 53).
These statements concerning well construction and drilling methodology suggest a red status,
as mistakes made in well construction directly contributed to the accident.
APPENDIX C. ADDITIONAL INFORMATION FROM INVESTIGATIONS 84
Maintenance strategy and system (both Probability- and Consequence Influencing) - Yellow
While the Chief Counsel‘s team interviewed Deepwater Horizon crew members who found the
RMS (maintenance system) useful (despite the fact that it definitely had some bugs in it) and
who used it daily, the team also found evidence to suggest that the system had problems (Chief
Counsel, 2011, p. 221).
With a problematic maintenance system, this warrants a yellow status for the factor.
Organization, management and control – local - Yellow
The fact that experienced well site leaders and members of the rig crew believed that the Macondo
negative pressure test established well integrity demonstrates serious management failures (Chief
Counsel, 2011, p. 161).
The Chief Counsel‘s team observed at least the following management failures: (1) ineffective
leadership at critical times; (2) ineffective communication and siloing of information; (3) fail-
ure to provide timely procedures; (4) poor training and supervision of employees; (5) ineffective
management and oversight of contractors; (6) inadequate use of technology; and (7) failure to
appropriately analyze and appreciate risk (Chief Counsel, 2011, p. 225).
With clear difficulties in conditions related to the local organization, management and control,
this factor is classified as yellow, as it seems that the corporate aspect of this was the most prob-
lematic.
Operation planning - Yellow
BP’s decision to use a long string at Macondo triggered a series of potential problems, particularly
with the bottomhole cement job (Chief Counsel, 2011, p. 62).
The above statement is just an example of the many problems created by a problematic opera-
tion planning. Conditions related to operation planning is therefore said to have a yellow status.
APPENDIX C. ADDITIONAL INFORMATION FROM INVESTIGATIONS 85
Coordination of operations - Red
BP did not adequately identify or address risks created by last-minute changes to well design and
procedures. BP changed its plans repeatedly and up to the very last minute, sometimes causing
confusion and frustration among BP employees and rig personnel (Chief Counsel, 2011, p. xi).
With many last minute changes and lacking risk evaluation, the coordination of operations fac-
tor is severly affected and is therefore marked as red.
Level of Maintenance/testing/inspection - Yellow
The fact that the Deepwater Horizon had never been in dry dock may have delayed or prevented
certain repairs that could only have been done onshore. (Chief Counsel, 2011, p. 224).
Through many findings in the investigations, it was found that maintenance had been given a
low priority in general and the statement above confirms this. Level of maintenance/testing/inspection
is therefore labelled as yellow.
Maintenance crew - Yellow
The Chief Counsel’s team finds that the failure to properly conduct and interpret the negative
pressure test was a major contributing factor to the blowout (Chief Counsel, 2011, p. 143).
This statement illustrates the lack of competence and training of the maintenance personnel.
Maintenance crew therefore has a yellow status.
Well and drilling crew - Red
Transocean and Sperry Drilling rig personnel then missed a number of further signals that hy-
drocarbons had entered the well and were rising to the surface during the final hour before the
blowout actually occurred (Chief Counsel, 2011, p. x).
The test clearly showed that hydrocarbons were leaking into the well, but BP‘s well site leaders
misinterpreted the result. It appears they did so in part because they accepted a facially implau-
APPENDIX C. ADDITIONAL INFORMATION FROM INVESTIGATIONS 86
sible theory suggested by certain experienced members of the Transocean rig crew (Chief Counsel,
2011, p. x).
The Chief Counsel‘s team finds that rig personnel missed signs of a kick during displacement of
the riser with seawater. If noticed, those signs would have allowed the rig crew to shut in the
well before hydrocarbons entered the riser and thereby prevent the blowout (Chief Counsel, 2011,
p. 165).
It is clear from investigations that there were serious lacks in the training and competence of
the well and drilling personnel. In addition to this, the personnel was given much responsibility
in the detection of kicks and the enabling of the emergency barriers, which they also failed to
achieve. Well and drilling crew is therefore classified as red, and a primary causal factor of the
accident.
Maintenance/testing/inspection - Yellow
It is nevertheless possible that poor maintenance contributed to technical failures. According to
pre-explosion BP emails: the rig was getting old and maintenance has not been good enough
(Chief Counsel, 2011, p. 221).
Halliburton appears to have done little to supervise the work of its key cementing personnel and
does not appear to have meaningfully reviewed data that should have prompted it to redesign the
Macondo cement slurry (Chief Counsel, 2011, p. xi).
The statements above, together with previously mentioned statements concerning poorly exe-
cuted maintenance and testing implies that this factor had a yellow status. The factor cannot be
said to be a direct cause of the accident, but its status has certainly contributed. Especially the
negative pressure tests, and the failure in interpretation of these was an important causal factor.
Kick detection - Red
Transocean did not adequately train its employees in emergency procedures and kick detection,
and did not inform them of crucial lessons learned from a similar and recent near-miss drilling

APPENDIX C. ADDITIONAL INFORMATION FROM INVESTIGATIONS 87
incident (Chief Counsel, 2011, p. xi).
It is clear from the investigation, through statements like the one above and several mentioned
earlier, that kick detection was much too dependent on poorly trained personnel to recognize
the signs. Since a kick was not discovered until it was far too late, this warrants a red status.
Casing - Red
The root technical cause of the blowout is now clear: The cement that BP and Halliburton pumped
to the bottom of the well did not seal off hydrocarbons in the formation (Chief Counsel, 2011, p. x).
The investigation team concluded that there were weaknesses in cement design and testing , qual-
ity assurance and risk assessment. (BP, 2010, p. 10).
The casing is given a red status, as it was clearly unsatisfactory and it did not function as it was
supposed to. Failure of the cement is the root technical cause of the blowout.
BOP - Yellow
It was well known by the rig crew and BP shore-based leadership that the Deepwater Horizon
blowout preventer was not in compliance with certification requirements (Chief Counsel, 2011,
p. 216).
The failure of the BOP cannot be said with certainty to be a main cause of the accident, but it is
well known that it was not in compliance with requirements. It is therefore labelled as yellow.
Emergency response resources - Red
The fire and gas system did not prevent hydrocarbon ignition. The BOP emergency mode did not
seal the well (BP, 2010, p. 11).
The emergency response resources are labelled as red, as they did not prevent ignition and did
not prevent the loss of eleven lives.
APPENDIX C. ADDITIONAL INFORMATION FROM INVESTIGATIONS 88
Emergency response management, Emergency planning and Emergency response crew - Red
Transocean did not adequately train its employees in emergency procedures and kick detection,
and did not inform them of crucial lessons learned from a similar and recent near-miss drilling
incident (Chief Counsel, 2011, p. xi).
The crew appears to have followed standard Transocean procedures for dealing with hydrocarbon
kicks. But those procedures were written to guide the crew‘s response to routine hydrocarbon kicks.
They did not address extreme emergencies like the one the Deepwater Horizon crew faced on the
evening of April 20 (Chief Counsel, 2011, p. 193).
Clear lacks in emergency planning, crew and management made this accident unavoidable by
the time the kick was detected. It also could not prevent serious injury and loss of lives. These
emergency factors are therefore labelled as red.
Barrier performance - Red
Deepwater operators employ exceedingly sophisticated technology to drill wells. But BP and its
contractors had neither developed nor installed similarly sophisticated technology to guard against
a blowout (Chief Counsel, 2011, p. 240).
The emergency barriers did not prevent a blowout and did not perform as planned. This is
therefore labelled red. More reliable emergency barriers should have prevented the blowout.
C.2 Blowout at Snorre A - 2004
A description of this accident can be found in section 5.3.1. In this section, some of the state-
ments are translated from Norwegian to English to the best of the author’s ability.
APPENDIX C. ADDITIONAL INFORMATION FROM INVESTIGATIONS 89
Reservoir conditions - Red
At the same time, the field has a complex geological structure , and a need for ongoing well in-
tervention and drilling operations to maintain production levels. (Schiefloe and Vikland, 2007,
p. 8).
The well was considered "complex". This was related to: Conditions which result in reduced well
integrity (corrosion, leaks), unconventional well completions with many small completion ele-
ments, additional completion items that were installed in the well in connection with repairs
(scab-liner and straddle) and downhole well control valves (Brattbakk et al., 2005, p. 11).
The investigations states that the field was considered complex. The factor is therefore labelled
red.
Maintenance philosophy - Red
The technical standard of the platform had gradually deteriorated over the years due to wear,
limited investment in long-term maintenance and little redundancy in the system (Schiefloe and
Vikland, 2007, p. 9).
It is clear from the investigations that there was not enough focus on maintenance on a corpo-
rate level. Maintenance philosophy is therefore labelled red.
Organization, management and control – corporate - Red
The first organizational change has to do with change of operator, from Saga to Hydro and then to
Statoil. The second group of changes took place in the subsea departments on land. For employees
in the land organization of Snorre this meant new work forms and other coordination mecha-
nisms, while having to deal with a new set of governing documents. The third group of changes
took place in the drilling department on Snorre A. The responsibility for drilling on Snorre A was
from 1 November 2004 acquired by Odfjell Drilling. (Schiefloe and Vikland, 2007, p. 9).
APPENDIX C. ADDITIONAL INFORMATION FROM INVESTIGATIONS 90
High change rate of the organization gives a red status for the corporate organization, manage-
ment and control factor.
Well Construction and Drilling Methodology - Red
In retrospect, it is clear that this procedure, by first removing the plug, and then pull the scab-liner,
had broken the most important and most absolute of all safety rules during well operations: there
should always be two tested, intact well barriers present. (Schiefloe and Vikland, 2007, p. 7).
Clear deficiencies in the well construction and drilling methodology gives a red classification.
Organization, management and control – local - Red
The investigation report notes the lack of information and lack of management involvement as
some of the violations. It also shows how the work processes related to planning and decision-
making came to be significant. (Schiefloe and Vikland, 2007, p. 6).
Gradually and unnoticeably, (Snorre A) had developed a practice that involved increasing risk
(“practical drift”) (Schiefloe and Vikland, 2007, p. 8).
Practical drift in the local organization warrants a red status of this factor.
Operation planning - Red
The investigation (...) revealed several weaknesses in the planning of the relevant well operation,
including a number of violations of the governing documents (Schiefloe and Vikland, 2007, p. 1).
Serious failures and deficiencies have been uncovered in all phases of Statoil’s planning and im-
plementation on well P-31A. (Brattbakk et al., 2005, p. 3).
The investigations indicate that deficiencies during planning of the operation was a large con-
tributing factor. It is therefore labelled red.
APPENDIX C. ADDITIONAL INFORMATION FROM INVESTIGATIONS 91
Coordination of operations - Red
Inadequate understanding and implementation of risk assessments. This largely occurs in the
planning phase, but also in the execution phase. The investigation shows both downgrading of
priority for risk reviews, lack of understanding for comprehensive risk and in one case, risk con-
tributions were removed from the detailed program (Brattbakk et al., 2005, p. 25).
As a proper risk assessment would probably had uncovered the problem of having only one well
barrier, coordination of operations is labelled red.
Level of Maintenance/testing/inspection - Red
Level of Well Activity and Simultaneous Operations - Yellow
(...) they experienced that the organization through a number of years had abandoned preventive
maintenance and technical upgrades , while there had been high production, extensive activities
and many new projects simultaneously. (Schiefloe and Vikland, 2007, p. 7-8).
The level of activity on Snorre A has been high for several years. When the incident took place,
both drilling and well intervention were underway, as well as rigging of a new well intervention
derrick. (Brattbakk et al., 2005, p. 9)
The level of maintenance on Snorre A was clearly low. This is therefore labelled as red. There
was clearly also too much well activity and simultaneous operations for this to be labelled as
safe. These two levels are therefore labelled yellow.
Well and drilling crew - Yellow
Working pressure for those responsible for drilling activities were generally high, because opera-
tions can be extensive and complex, and there are very large sums of money involved (Schiefloe
and Vikland, 2007, p. 10).
Those who worked out on the platform (had) little involvement in the planning and preparation
of well operations (Schiefloe and Vikland, 2007, p. 11).
APPENDIX C. ADDITIONAL INFORMATION FROM INVESTIGATIONS 92
Though the investigation reports do not claim that competence level is low in the well and
drilling crew, the crew experienced a high working pressure and were not involved in planning.
This warrants a yellow level.
Drilling operations - Yellow
Several of the non-conformities are repeated in the planning and execution phases (Brattbakk
et al., 2005, p. 25).
Due to several lacks during drilling operations, this factor is labelled as yellow.
Mud - Red
Failure of the primary barrier (drilling mud) after swabbing is one of the main triggering causes
of the event on P-31A. They were unable to restore the primary barrier for swabbing (Brattbakk
et al., 2005, p. 35).
As failure of the drilling mud is a triggering cause of the event, this is labelled as red.
Environmental conditions, Location in relation to emergency response resources, Emergency
response resources, Emergency response management, Emergency planning and Emergency
response crew - Green
Emergency preparedness and evacuation: Manning of the emergency response center and mus-
tering on board proceeded according to plan. The handling of the situation, with the assessments
that were made during the course of the night seem to have averted a negative development of the
situation (Brattbakk et al., 2005, p. 39).
The handling of the incident (...) demonstrates the importance of practical skills, local expertise,
ability to improvise, personal trust, courage and extensive training in handling emergency situa-
tions (Schiefloe and Vikland, 2007, p. 7).
If the weather conditions had been unfavorable, or if there were only very small changes in the
APPENDIX C. ADDITIONAL INFORMATION FROM INVESTIGATIONS 93
way the well developed, the personnel on Snorre A would not have been able to gain control over
the situation. (Brattbakk et al., 2005, p. 24).
Qualities of the relationships between colleagues and between managers and subordinates on
Snorre A, proved to be crucial in dealing with the situation after the gas leak (Schiefloe and
Vikland, 2007, p. 5).
It is clear from the statements and from the consequences of the accident that the factors on the
consequence-influencing side all had a green status, as they were able to prevent the situation
from worsening.
C.3 Well Kick during Drilling Activities on Gullfaks C - 2010
A description of this incident can be found in section 5.3.1. In this section, the statements are
translated from Norwegian to English to the best of the author’s ability.
Reservoir conditions - Yellow
The Gullfaks field has small margins between pore pressure and fracture pressure, which makes
drilling on the field difficult. Accidental injection of water in the upper Shetland lime and leakage
from the reservoir through poorly cemented casings and fracture systems outside wells drilling has
increased the complexity further. There have been few measurements of the minimum horizontal
stress over the reservoir on the Gullfaks field which causes uncertainty related to calculate the
safe mud weight and secure setting depth of casing. Today LOT is used to estimate the maximum
allowable ECD (Talberg et al., 2010, p. 16).
As there were several uncertainties concerning the reservoir, this factor is labelled yellow.
Organization, management and control – corporate - Yellow
The merger between Statoil and Hydro (oil part) in October 2007 led to major changes in the
organizational context (Austnes-Underhaug et al., 2011, p. 21).
APPENDIX C. ADDITIONAL INFORMATION FROM INVESTIGATIONS 94
High change rate of the organization gives a yellow status for the corporate organization, man-
agement and control factor.
Well Construction and Drilling Methodology - Yellow
C-06 is a well without gastight threads in the 13 3/8 "casing and it has poor cement the 20" casing.
(Talberg et al., 2010, p. 21).
The well clearly has some lacks in construction, and is therefore labelled yellow.
Organization, management and control – local - Yellow
From the management’s perspective, the Gullfaks culture is perceived as rigid and difficult to con-
trol. Gullfaks is partly characterized by conflicts and poor climate of cooperation between the
unions and management (Austnes-Underhaug et al., 2011, p. 23).
Information related to leadership and decision-making in the interviews, especially related to
inadequate management involvement and use of competence, can be seen largely as unfortu-
nate consequences of reorganization following the merger between Statoil and Hydro. (Austnes-
Underhaug et al., 2011, p. 25).
These statements illustrate some difficulties in the local organization, management and control
on gullfaks. This is therefore given a yellow status.
Operation planning - Red
One reason for the MPD operation carried out with insufficient margin against pore pressure and
fracture pressure is that risk assessments carried out both prior to deciding to implement MPD
operation and during the execution of MPD operation are inadequate (Talberg et al., 2010, p. 35).
According to informants typical MPD operation requires at least six months of planning, but in
this case considerably less time was used (3 months) (Austnes-Underhaug et al., 2011, p. 26).
It is clear that the operation planning had many deficiencies, and it is therefore labelled as red.
APPENDIX C. ADDITIONAL INFORMATION FROM INVESTIGATIONS 95
Coordination of operations - Red
At the time it was decided to move from a conventional drilling operation to an MPD opera-
tion, both the number of changes and the extent should have resulted in a signed addition to the
drilling program and an updated and signed risk register. Still, it was decided to move from con-
ventional drilling to MPD operation, without changes to the drilling program and risk registers
(Talberg et al., 2010, p. 36).
Similar to operation planning, the coordination of these activities was also lacking the necces-
sary risk assessment. Coordination of operations is therefore also labelled red, as improvements
here could have prevented the accident.
Well and drilling crew - Yellow
At 1:46 p.m. (19.5.2010), an event with the potential to underground blowout occurs which the
crew and land organization has difficulty understanding. From 1:57 p.m. the rig-BOP is closed
with the annular preventer and work is executed with a demanding well control situation (loss
of joint barrier element, influx and loss of sludge), with underbalanced mud weight in the hole,
which the crew are not prepared to handle. (Talberg et al., 2010, p. 26).
The crew were clearly not trained for such an event. Well and drilling crew is therefore labelled
as yellow.
Drilling operations - Red
An MPD-operation with insufficient margin between pore pressure and fracture pressure is exe-
cuted (Talberg et al., 2010, p. 33).
The wrong execution of this task is one of the main causes of the incident. It is therefore labelled
as red.
APPENDIX C. ADDITIONAL INFORMATION FROM INVESTIGATIONS 96
Casing - Red
One reason there is a hole in the 13 3/8" casing, and there is a loss of the common barrier element
is that the casing has insufficient technical integrity. (Talberg et al., 2010, p. 34).
The casing clearly has deficiencies, and is therefore labelled red.
Emergency planning - Yellow
In cases where there is a well event that results in an uncontrolled blowout, plans to drill a re-
lief well should be a possible consequence reducing measures. However, there were no prepared
contingency plans for drilling such a relief well for C-06A (Talberg et al., 2010, p. 44).
There were no plans to drill a relief well if an uncontrolled blowout did occur. It was considered
a coincidence that it did not occur, so this is labelled yellow. Otherwise, since the situation did
not escalate, it seems the emergency response was generally good.
C.4 Blowout at Montara - 2009
A description of this accident can be found in section 5.3.1.
Organization, Management and Control – Corporate - Red,
Organization, management and control - Local - Yellow
A number of aspects of PTTEPAA’s Well Construction Standards were at best ambiguous and open
to different interpretations. (Borthwick et al., 2010, p. 9).
PTTEPAA’s records and communication management were defective , particularly the exchange
of information between rig and shore, between night and day shifts, between offline and online
operations and in relation to milestones such as the installation of secondary barriers (Borthwick
et al., 2010, p. 10).
APPENDIX C. ADDITIONAL INFORMATION FROM INVESTIGATIONS 97
A contributing factor to PTTEPAA’s systemic errors extends to its onshore management and gover-
nance structure (Borthwick et al., 2010, p. 10).
These statements illustrate serious deficiencies in the corporate organization, management and
control. This factor is therefore given a red status, as it seems that this factor was a major con-
tributing cause of the event. The local aspect of this seems also to be somewhat deficient, so the
local organization, management and control factor is given a yellow status.
Well Construction and Drilling Methodology - Yellow
The Inquiry has found that at the time the H1 Well was suspended in March 2009, not one well
control barrier complied with PTTEPAA’s own Well Construction Standards (Borthwick et al.,
2010, p. 7).
The inquiry identified problematic well construction. This factor is therefore labelled as yellow.
Operation planning - Yellow
PTTEPAA’s Well Operations Management Plan for the H1 Well and Well Construction Standards
were themselves inadequate (Borthwick et al., 2010, p. 9).
According to PTTEPAA’s operational forecast and drilling program, the H1 Well would have been
exposed to the air without any secondary well control barrier in place for some 4 to 5 days , with
sole reliance on an untested primary barrier (the cemented 9 5/8” casing shoe) that had been the
subject of significant problems during its installation (Borthwick et al., 2010, p. 8).
Since operations planning on purpose planned the well to be left without known functioning
barriers, this is given a red status, as it is a contributing factor to the accident. Better operations
management could have avoided the accident.
APPENDIX C. ADDITIONAL INFORMATION FROM INVESTIGATIONS 98
Coordination of operations - Yellow
The evidence before the Inquiry repeatedly showed that risks were not recognized when they should
have been, and not assessed properly when recognized (Borthwick et al., 2010, p. 11).
Coordination of operations is given a yellow status due to lacks in risk assessment.
Level of Maintenance/testing/inspection - Yellow
The 9 5/8” cemented casing shoe had not been pressure tested in accordance with the company’s
Well Construction Standards, despite major problems having been experienced with the cement-
ing job. (Borthwick et al., 2010, p. 7).
Unfortunately, in the H1 Well there were no tested and verified barriers in place at the time of the
Blowout (Borthwick et al., 2010, p. 8).
A higher level of testing should have revealed the status of the barriers and should have pre-
vented the accident. This is therefore given a yellow status.
Well and drilling crew - Yellow
None of this was understood by senior PTTEPAA personnel at the time, even though the company’s
contemporaneous records, such as the Daily Drilling Report (DDR), clearly indicated what had
happened (Borthwick et al., 2010, p. 7).
Furthermore, key personnel working for PTTEPAA, both on the rig and onshore, were under the
mistaken impression that the fluid left in the casing string was overbalanced to pore pressure and
would therefore act as an additional barrier. (Borthwick et al., 2010, p. 8).
The well and drilling crew clearly lacked experience with these procedures and did not have
enough competence to perform such tasks. This is therefore labelled as yellow.
APPENDIX C. ADDITIONAL INFORMATION FROM INVESTIGATIONS 99
Casing - Red
The Inquiry finds that the primary well control barrier – the 9 5/8” cemented casing shoe – failed
(Borthwick et al., 2010, p. 7).
Since part of the casing was the immediate cause of the accident, this is given a red status.
Emergency response resources, Emergency planning, Emergency response crew and Emer-
gency response management - Green
The Inquiry is of the view that the actions of Atlas and PTTEPAA personnel on board the West
Atlas on 21 August 2009 in the immediate aftermath of the Blowout are to be commended. The
safe evacuation of 69 personnel from a highly flammable environment without notable incident
is testament to the effective emergency response procedures developed by Atlas for use on board
the West Atlas and to their smooth execution (Borthwick et al., 2010, p. 240).
As stated above, all factors related to emergency response seems to have worked well, and are
therefore given green statuses.
C.5 Well Kick at Valhall - 2003
A description of this incident can be found in section 5.3.1. In this section, the statements are
translated from Norwegian to English to the best of the author’s ability.
Reservoir conditions - Yellow
The reservoir that was drilled into, there are several hard rock types . These are fractured and can
be filled with free gas. A combination of these were still not expected and taken into account (PSA,
2004, p. 5).
The reservoir conditions created difficulties for the drilling, and are therefore labelled as yellow.
APPENDIX C. ADDITIONAL INFORMATION FROM INVESTIGATIONS 100
Well Construction and Drilling Methodology - Yellow
The well is designed on the basis of small volume flow well and not gas filled casing or annulus
(PSA, 2004, p. 7).
Lacks in well construction was a contributing factor to the incident, and is labelled as yellow.
Organization, management and control – local - Yellow
There was at times inadequate control of management and monitoring of the event (PSA, 2004,
p. 8).
This factor is labelled yellow, as inadequate control of management was uncovered.
Coordination of operations - Yellow
There was also lack of clarity in communications and coordination between the various groups re-
garding the necessary tasks. This applies to communication between the drilling team and land-
based downhole team for various changes in the well planning and risk assessment during the
drilling activity (PSA, 2004, p. 8).
Since there was a lack of coordination, this factor is given a yellow status.
Well and drilling crew - Yellow
For an unknown reason it is chosen to continue to circulate well without closing the BOP. This is
not in accordance with BP procedures and not according to regulatory requirements for barriers
(PSA, 2004, p. 6).
Since the well and drilling crew did not act according to BP procedures, this is given a yellow
status.

APPENDIX C. ADDITIONAL INFORMATION FROM INVESTIGATIONS 101
Mud - Yellow
When drilling the reservoir to the well-8B A, all mud was lost unexpectedly to the reservoir forma-
tion (PSA, 2004, p. 6).
Loss of mud was not expected. This is therefore given a yellow status.

Appendix D
Additional Information on Risk Indicators
This appendix will present additional information regarding the risk indicators developed in
section 5.4. The indicators will be presented in a two-column table, where one column con-
tains the name of the indicator, whereas the other column will contain additional information
in the form of questions that are related to the classification of the indicator status. If an indi-
cator can be particularly difficult to measure, this is commented on in the description column.
Data sources, measuring frequency and specific classification dimensions will not be presented,
because this falls beyond the scope of the master thesis.
103
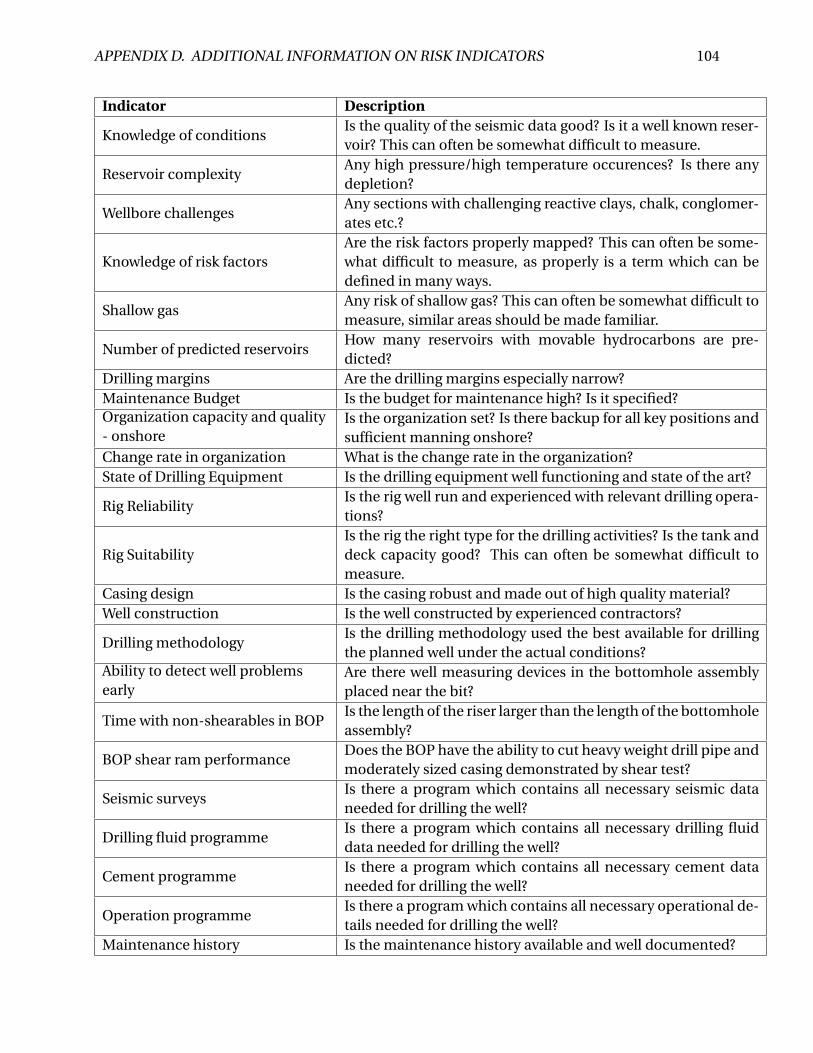
APPENDIX D. ADDITIONAL INFORMATION ON RISK INDICATORS 104
Indicator Description
Knowledge of conditionsIs the quality of the seismic data good? Is it a well known reser-voir? This can often be somewhat difficult to measure.
Reservoir complexityAny high pressure/high temperature occurences? Is there anydepletion?
Wellbore challengesAny sections with challenging reactive clays, chalk, conglomer-ates etc.?
Knowledge of risk factorsAre the risk factors properly mapped? This can often be some-what difficult to measure, as properly is a term which can bedefined in many ways.
Shallow gasAny risk of shallow gas? This can often be somewhat difficult tomeasure, similar areas should be made familiar.
Number of predicted reservoirsHow many reservoirs with movable hydrocarbons are pre-dicted?
Drilling margins Are the drilling margins especially narrow?Maintenance Budget Is the budget for maintenance high? Is it specified?Organization capacity and quality- onshore
Is the organization set? Is there backup for all key positions andsufficient manning onshore?
Change rate in organization What is the change rate in the organization?State of Drilling Equipment Is the drilling equipment well functioning and state of the art?
Rig ReliabilityIs the rig well run and experienced with relevant drilling opera-tions?
Rig SuitabilityIs the rig the right type for the drilling activities? Is the tank anddeck capacity good? This can often be somewhat difficult tomeasure.
Casing design Is the casing robust and made out of high quality material?Well construction Is the well constructed by experienced contractors?
Drilling methodologyIs the drilling methodology used the best available for drillingthe planned well under the actual conditions?
Ability to detect well problemsearly
Are there well measuring devices in the bottomhole assemblyplaced near the bit?
Time with non-shearables in BOPIs the length of the riser larger than the length of the bottomholeassembly?
BOP shear ram performanceDoes the BOP have the ability to cut heavy weight drill pipe andmoderately sized casing demonstrated by shear test?
Seismic surveysIs there a program which contains all necessary seismic dataneeded for drilling the well?
Drilling fluid programmeIs there a program which contains all necessary drilling fluiddata needed for drilling the well?
Cement programmeIs there a program which contains all necessary cement dataneeded for drilling the well?
Operation programmeIs there a program which contains all necessary operational de-tails needed for drilling the well?
Maintenance history Is the maintenance history available and well documented?
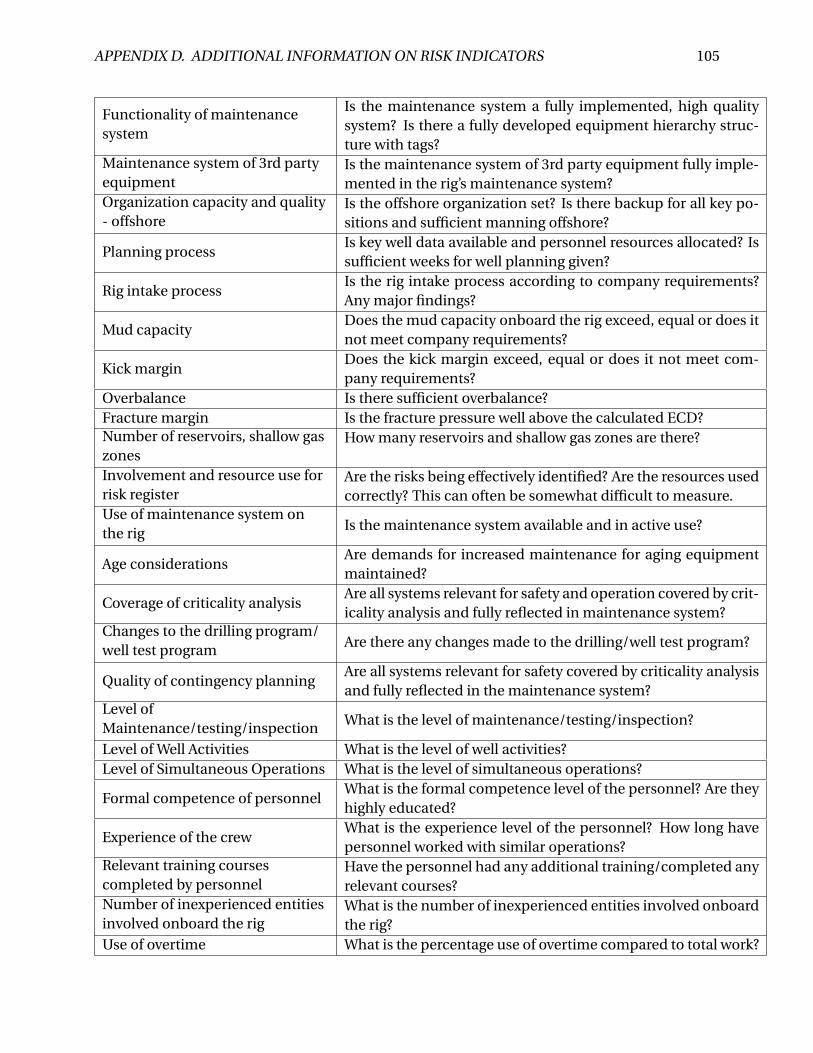
APPENDIX D. ADDITIONAL INFORMATION ON RISK INDICATORS 105
Functionality of maintenancesystem
Is the maintenance system a fully implemented, high qualitysystem? Is there a fully developed equipment hierarchy struc-ture with tags?
Maintenance system of 3rd partyequipment
Is the maintenance system of 3rd party equipment fully imple-mented in the rig’s maintenance system?
Organization capacity and quality- offshore
Is the offshore organization set? Is there backup for all key po-sitions and sufficient manning offshore?
Planning processIs key well data available and personnel resources allocated? Issufficient weeks for well planning given?
Rig intake processIs the rig intake process according to company requirements?Any major findings?
Mud capacityDoes the mud capacity onboard the rig exceed, equal or does itnot meet company requirements?
Kick marginDoes the kick margin exceed, equal or does it not meet com-pany requirements?
Overbalance Is there sufficient overbalance?Fracture margin Is the fracture pressure well above the calculated ECD?Number of reservoirs, shallow gaszones
How many reservoirs and shallow gas zones are there?
Involvement and resource use forrisk register
Are the risks being effectively identified? Are the resources usedcorrectly? This can often be somewhat difficult to measure.
Use of maintenance system onthe rig Is the maintenance system available and in active use?
Age considerationsAre demands for increased maintenance for aging equipmentmaintained?
Coverage of criticality analysisAre all systems relevant for safety and operation covered by crit-icality analysis and fully reflected in maintenance system?
Changes to the drilling program/well test program Are there any changes made to the drilling/well test program?
Quality of contingency planningAre all systems relevant for safety covered by criticality analysisand fully reflected in the maintenance system?
Level ofMaintenance/testing/inspection What is the level of maintenance/testing/inspection?
Level of Well Activities What is the level of well activities?Level of Simultaneous Operations What is the level of simultaneous operations?
Formal competence of personnelWhat is the formal competence level of the personnel? Are theyhighly educated?
Experience of the crewWhat is the experience level of the personnel? How long havepersonnel worked with similar operations?
Relevant training coursescompleted by personnel
Have the personnel had any additional training/completed anyrelevant courses?
Number of inexperienced entitiesinvolved onboard the rig
What is the number of inexperienced entities involved onboardthe rig?
Use of overtime What is the percentage use of overtime compared to total work?
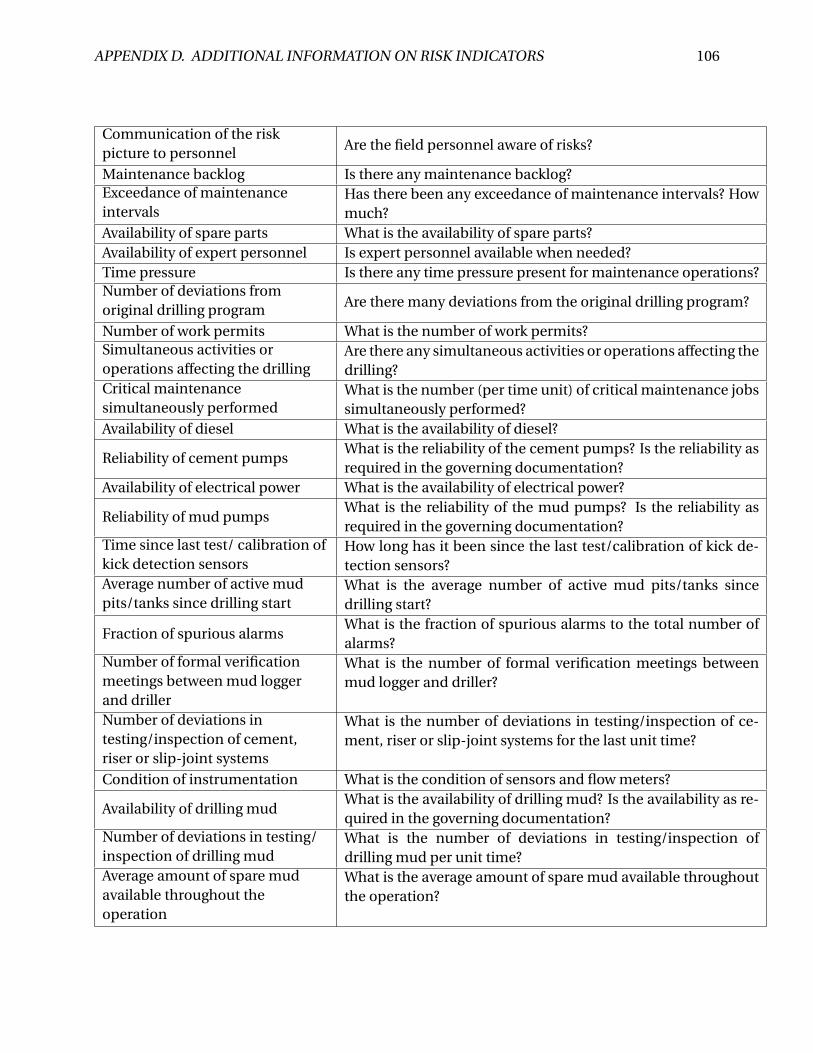
APPENDIX D. ADDITIONAL INFORMATION ON RISK INDICATORS 106
Communication of the riskpicture to personnel Are the field personnel aware of risks?
Maintenance backlog Is there any maintenance backlog?Exceedance of maintenanceintervals
Has there been any exceedance of maintenance intervals? Howmuch?
Availability of spare parts What is the availability of spare parts?Availability of expert personnel Is expert personnel available when needed?Time pressure Is there any time pressure present for maintenance operations?Number of deviations fromoriginal drilling program Are there many deviations from the original drilling program?
Number of work permits What is the number of work permits?Simultaneous activities oroperations affecting the drilling
Are there any simultaneous activities or operations affecting thedrilling?
Critical maintenancesimultaneously performed
What is the number (per time unit) of critical maintenance jobssimultaneously performed?
Availability of diesel What is the availability of diesel?
Reliability of cement pumpsWhat is the reliability of the cement pumps? Is the reliability asrequired in the governing documentation?
Availability of electrical power What is the availability of electrical power?
Reliability of mud pumpsWhat is the reliability of the mud pumps? Is the reliability asrequired in the governing documentation?
Time since last test/ calibration ofkick detection sensors
How long has it been since the last test/calibration of kick de-tection sensors?
Average number of active mudpits/tanks since drilling start
What is the average number of active mud pits/tanks sincedrilling start?
Fraction of spurious alarmsWhat is the fraction of spurious alarms to the total number ofalarms?
Number of formal verificationmeetings between mud loggerand driller
What is the number of formal verification meetings betweenmud logger and driller?
Number of deviations intesting/inspection of cement,riser or slip-joint systems
What is the number of deviations in testing/inspection of ce-ment, riser or slip-joint systems for the last unit time?
Condition of instrumentation What is the condition of sensors and flow meters?
Availability of drilling mudWhat is the availability of drilling mud? Is the availability as re-quired in the governing documentation?
Number of deviations in testing/inspection of drilling mud
What is the number of deviations in testing/inspection ofdrilling mud per unit time?
Average amount of spare mudavailable throughout theoperation
What is the average amount of spare mud available throughoutthe operation?
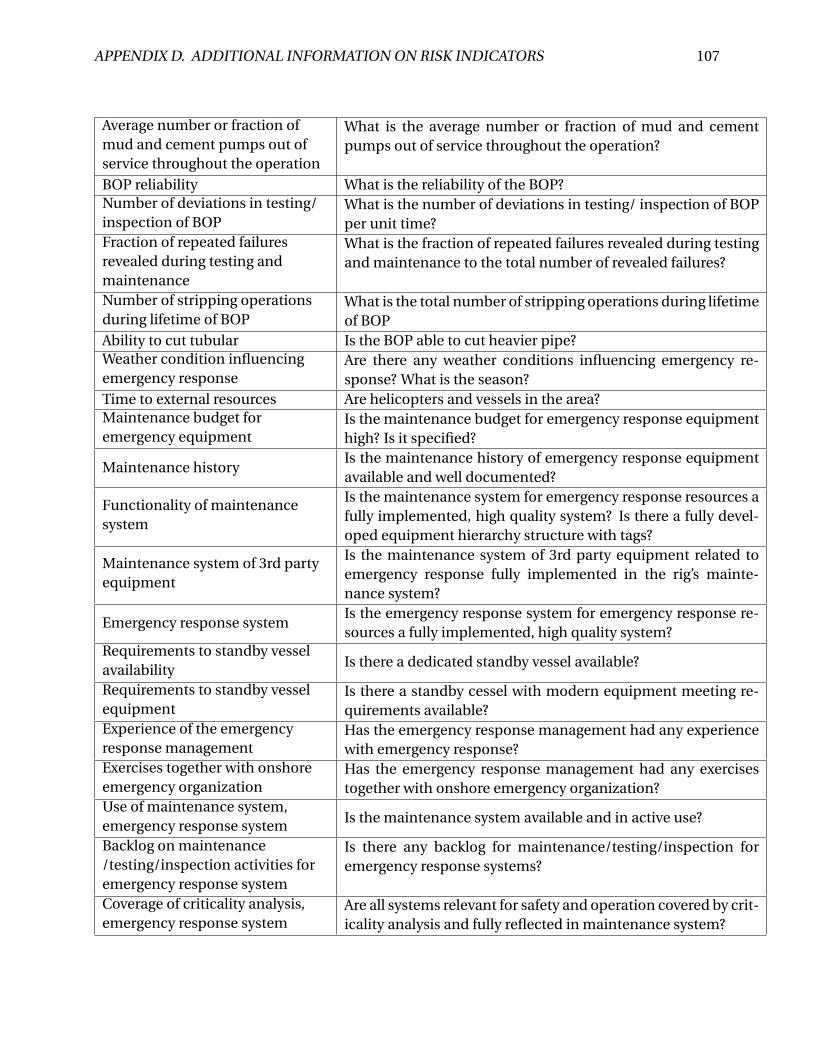
APPENDIX D. ADDITIONAL INFORMATION ON RISK INDICATORS 107
Average number or fraction ofmud and cement pumps out ofservice throughout the operation
What is the average number or fraction of mud and cementpumps out of service throughout the operation?
BOP reliability What is the reliability of the BOP?Number of deviations in testing/inspection of BOP
What is the number of deviations in testing/ inspection of BOPper unit time?
Fraction of repeated failuresrevealed during testing andmaintenance
What is the fraction of repeated failures revealed during testingand maintenance to the total number of revealed failures?
Number of stripping operationsduring lifetime of BOP
What is the total number of stripping operations during lifetimeof BOP
Ability to cut tubular Is the BOP able to cut heavier pipe?Weather condition influencingemergency response
Are there any weather conditions influencing emergency re-sponse? What is the season?
Time to external resources Are helicopters and vessels in the area?Maintenance budget foremergency equipment
Is the maintenance budget for emergency response equipmenthigh? Is it specified?
Maintenance historyIs the maintenance history of emergency response equipmentavailable and well documented?
Functionality of maintenancesystem
Is the maintenance system for emergency response resources afully implemented, high quality system? Is there a fully devel-oped equipment hierarchy structure with tags?
Maintenance system of 3rd partyequipment
Is the maintenance system of 3rd party equipment related toemergency response fully implemented in the rig’s mainte-nance system?
Emergency response systemIs the emergency response system for emergency response re-sources a fully implemented, high quality system?
Requirements to standby vesselavailability Is there a dedicated standby vessel available?
Requirements to standby vesselequipment
Is there a standby cessel with modern equipment meeting re-quirements available?
Experience of the emergencyresponse management
Has the emergency response management had any experiencewith emergency response?
Exercises together with onshoreemergency organization
Has the emergency response management had any exercisestogether with onshore emergency organization?
Use of maintenance system,emergency response system Is the maintenance system available and in active use?
Backlog on maintenance/testing/inspection activities foremergency response system
Is there any backlog for maintenance/testing/inspection foremergency response systems?
Coverage of criticality analysis,emergency response system
Are all systems relevant for safety and operation covered by crit-icality analysis and fully reflected in maintenance system?
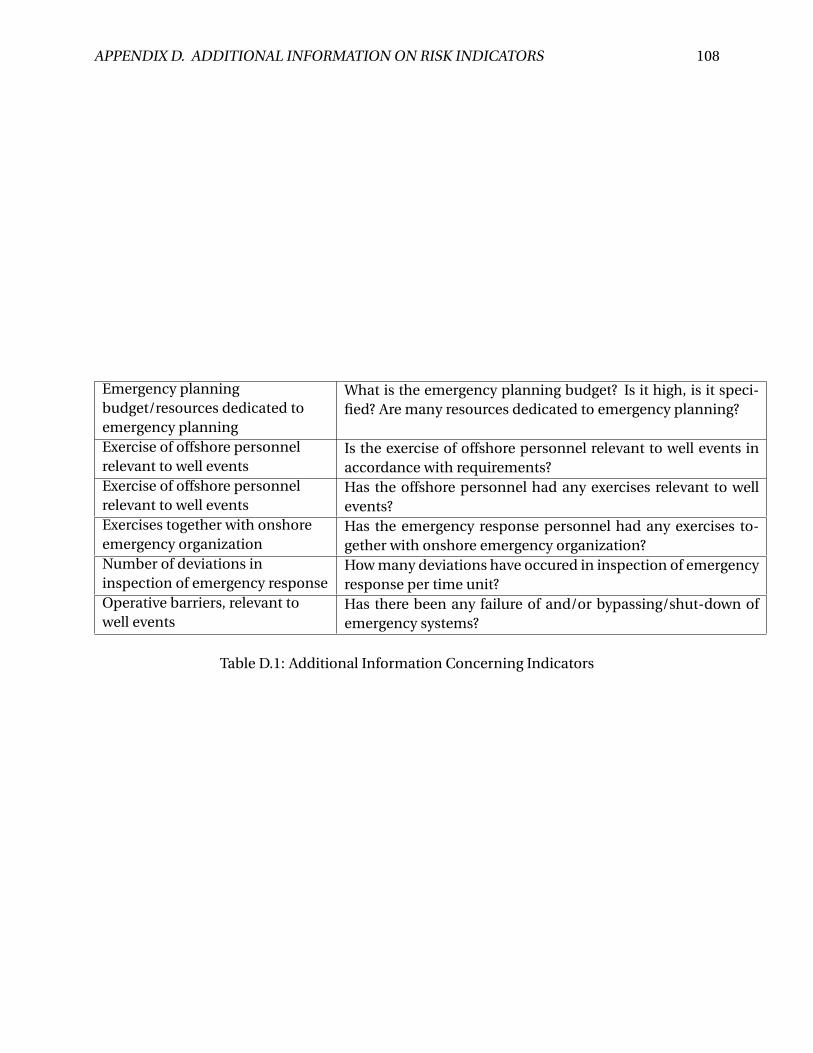
APPENDIX D. ADDITIONAL INFORMATION ON RISK INDICATORS 108
Emergency planningbudget/resources dedicated toemergency planning
What is the emergency planning budget? Is it high, is it speci-fied? Are many resources dedicated to emergency planning?
Exercise of offshore personnelrelevant to well events
Is the exercise of offshore personnel relevant to well events inaccordance with requirements?
Exercise of offshore personnelrelevant to well events
Has the offshore personnel had any exercises relevant to wellevents?
Exercises together with onshoreemergency organization
Has the emergency response personnel had any exercises to-gether with onshore emergency organization?
Number of deviations ininspection of emergency response
How many deviations have occured in inspection of emergencyresponse per time unit?
Operative barriers, relevant towell events
Has there been any failure of and/or bypassing/shut-down ofemergency systems?
Table D.1: Additional Information Concerning Indicators

Bibliography
Arbeidsdepartementet (2006). Stortingsmelding nr. 12 (2005-2006). Helse, Miljø og Sikkerhet i
Petroleumsvirksomheten.
Austnes-Underhaug, R. et al. (2011). Læring av hendelser i Statoil - En studie av baken-
forliggende årsaker til hendelsen på Gullfaks C og av Statoils læringsevne.
Borthwick, D. et al. (2010). Report of the Montara Commission of Inquiry.
BP (2010). Deepwater Horizon Accident Investigation Report.
Brattbakk, M., Østvold, L., van der Zwaag, and Hiim, H. (2005). Gransking av Gassutblåsning på
Snorre A, brønn 34/7-P31 A 28.11.2004.
Chief Counsel (2011). Macondo: The Gulf Oil Disaster, Investigation Report.
Close, F., McCavitt, B., and Smith, B. (2008). Deepwater Gulf of Mexico Development Challenges
Overview. In SPE North Africa Technical Conference and Exhibition, Marrakech, Morocco, 12-
14 March 2008.
Corneliussen, K. (2006). Well Safety. PhD thesis, Norwegian University of Science and Technol-
ogy.
DoD, U. S. A. (2000). MIL-STD-882D - Standard Practice for System Safety.
Hauge, S., Haabrekke, S., Kraakenes, T., Lundeteigen, M. A., and Merz, M. (2012). Barriers to
prevent and limit acute releases to sea.
109
BIBLIOGRAPHY 110
Haugen, S., Seljelid, J., Mo, K., and Nyheim, O. M. (2011). Major Accident Indicators for Monitor-
ing and Predicting Risk Levels. In SPE European Health, Safety and Environmental Conference
in Oil and Gas Exploration and Production held in Vienna, Austria, 22-24. February 2011.
Haugen, S., Seljelid, J., Nyheim, O. M., Sklet, S., and Jahnsen, E. (2012). A Generic Method for
Identifying Major Accident Risk Indicators. In 11th International Probabilistic Safety Assess-
ment and Management Conference and the Annual European Safety and Reliability Conference
2012, Helsinki, Finland, 25-29 June 2012.
Haugen, S., Seljelid, J., Sklet, S., Vinnem, J., and Aven, T. (2007). Operational Risk Analysis: Total
Analysis of Physical and Non-physical Barriers, H3.1, Generalisation Report, Rev. 1 edition.
Holand, P. (1997). Offshore Blowouts - Causes and Control. Gulf Publishing Company.
Holand, P. (2011). Blowout and Well Release Characteristics and Frequencies, 2011. Technical
report, SINTEF.
Hopkins, A. (2009). Thinking about Process Safety Indicators. Safety Science, 47:460–465.
HSE (2006). Developing Process Safety Indicators: A step-by-step guide for Chemical and Major
Hazard Industries. HSE, 1. edition.
ISO (2009). ISO guide 73:2009 - Risk Management - Vocabulary.
ISO (2010). ISO 12100:2010 - Safety of Machinery - General Principles for Design - Risk Assess-
ment and Risk Reduction.
Johansen, T. S., Pettersen, E. R., Nyheim, O. M., Haugen, S., Seljelid, J., and Kvalheim, S. A. (2012).
Validation and Testing of a Multi Layer Risk Model for Hydrocarbon Leaks in the Offshore
Petroleum Industry. In 11th International Probabilistic Safety Assessment and Management
Conference and the Annual European Safety and Reliability Conference 2012, Helsinki, Fin-
land, 25-29 June 2012.
Luning, X., Fan, J., Rausand, M., and Zhang, L. (2013). A Safety Barrier-Based Accident Model for
Offshore Drilling Blowouts. Journal of Loss Prevention in the Process Industries, 26:164–171.
BIBLIOGRAPHY 111
NORSOK (2004). NORSOK Standard D-10: Well Integrity in Drilling and Well Operations.
NPC (2011). Paper nr. 2-11: Subsea Drilling, Well Operations and Completions.
Øien, K. (2001a). Risk Control of Offshore Installations: A Framework for the Establishment of
Risk Indicators. PhD thesis, Norwegian University of Science and Technology.
Øien, K. (2001b). Risk Indicators as a tool for risk control. Reliability Engineering and System
Safety, 74:129–145.
Øien, K. and Sklet (2001). Risk Analyses During Operation (The Indicator Project) Executive
Summary.
Øien, K., Utne, I. B., and Herrera, I. A. (2011a). Building safety indicators: Part 1 - theoretical
foundation. Safety Science, 49:148–161.
Øien, K., Utne, I. B., Herrera, I. A., and Massaiu, S. (2011b). Building safety indicators: Part 2 -
application, practices and results. Safety Science, 49:162–171.
PSA (2004). Gransking av Brønnspark i Brønn 2/8-A08B Valhall DP i desember 2003 (utdrag).
PSA (2008). Well Control and Well Integrity (web article, accessed 04.06.2013 on
http://www.ptil.no/well-integrity/well-control-and-well-integrity-article4156-145.html).
Rathnayaka, S., Khan, F., and Amyotte, P. (2011). SHIPP methodology: Predictive Accident Mod-
eling Approach. Part I: Methodology and Model Description. Process Safety and Environmen-
tal Protection, 89:151–164.
Rausand, M. (2011). Risk Assessment - Theory, Methods, and Applications. John Wiley & Sons,
Inc.
Rosness, R., Grøtan, T. O., Guttormsen, G., Herrera, I. A., I., Steiro, T., Størseth, F., Tinmannsvik,
R., and Waerø, I. (2010). Organisational Accidents and Resilient Organisations: Six Perspec-
tives. Revision 2.
Schiefloe, P. M. and Vikland, K. M. (2007). Når Barrierene Svikter: Gassutblåsningen på Snorre
A, 28.11.2004. Søkelys på arbeidslivet, 2:207–226.
BIBLIOGRAPHY 112
Sklet, S. (2006). Safety Barriers: Definition, Classification, and Performance. Journal of Loss
Prevention in the Process Industries, 19:494–506.
Sklet, S., Ringstad, A., Steen, S., Tronstad, L., Haugen, S., Seljelid, J., Kongsvik, T., and Wærø,
I. (2010). Monitoring of Human and Organizational Factors Influencing the Risk of Major
Accidents. In SPE International Conference on Health, Safety and Environment in Oil and Gas
Exploration and Production. Rio de Janeiro, Brazil.
Skogdalen, J. E., Utne, I. B., and Vinnem, J. E. (2011). Developing Safety Indicators for Preventing
Offshore Oil and Gas Deepwater Drilling Blowouts. Safety Science, 49:1187–1199.
Skogdalen, J. E. and Vinnem, J. E. (2012). Qualitative Risk Analysis of Oil and Gas Drilling, using
Deepwater Horizon as Case Study. Reliability Engineering and System Safety, 100:58–66.
Talberg, O. et al. (2010). Brønnhendelse på Gullfaks C, Granskningsrapport, PSA.
Tinmannsvik, R. et al. (2011). The Deepwater Horizon Accident: Causes, Lessons Learned and
Recommendations for the Norwegain Petroleum Activity (Executive Summary).
Torbergsen, H. B., Haga, H, B., Sangesland, S., Aadnøy, B. S., Saeby, J., Johnsen, S., Rausand, M.,
and Lundeteigen, M. A. (2012). An Introduction to Well Integrity.
Tranberg, A. R. (2012). Risk Assessment, Project Thesis.
Vinnem, J., Bye, R., Gran, B., Kongsvik, T., Nyheim, O., Okstad, E., Seljelid, J., and Vatn, J. (2012).
Risk Modelling of Maintenance Work on Major Process Equipment on Offshore Petroleum
Installations. Journal of Loss Prevention in the Process Industries, 25:274–292.