Embed Size (px)
Citation preview

Master Thesis for Erasmus Mundus Master’s Course in the age of Globalisation
Removing the Veil for Shadow Banking System in China
Author: Nuoya Chen
Program: EPOG Master – Option C2
University Paris XIII Student NO. 11318561 University of Witwatersand Student NO. 969139
Supervisors:
University of Paris XIII Professor Robert Guttmann University of Witswaterand Professor Lotta Takala- Greenish Berlin School of Economics and Law Professor Hansjoerg Herr
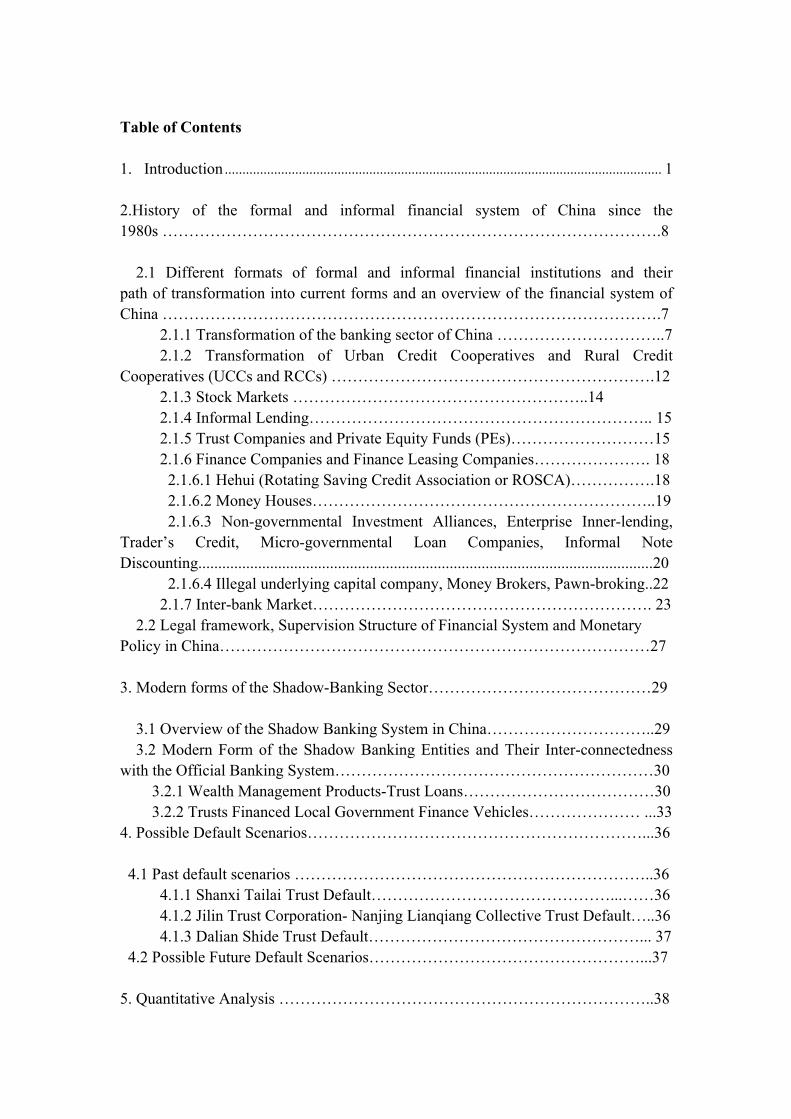
Table of Contents 1. Introduction ............................................................................................................................ 1
2.History of the formal and informal financial system of China since the 1980s ………………………………………………………………………………….8 2.1 Different formats of formal and informal financial institutions and their path of transformation into current forms and an overview of the financial system of China ………………………………………………………………………………….7 2.1.1 Transformation of the banking sector of China …………………………..7 2.1.2 Transformation of Urban Credit Cooperatives and Rural Credit Cooperatives (UCCs and RCCs) …………………………………………………….12
2.1.3 Stock Markets ………………………………………………..14 2.1.4 Informal Lending……………………………………………………….. 15
2.1.5 Trust Companies and Private Equity Funds (PEs)………………………15 2.1.6 Finance Companies and Finance Leasing Companies…………………. 18
2.1.6.1 Hehui (Rotating Saving Credit Association or ROSCA)…………….18 2.1.6.2 Money Houses………………………………………………………..19 2.1.6.3 Non-governmental Investment Alliances, Enterprise Inner-lending, Trader’s Credit, Micro-governmental Loan Companies, Informal Note Discounting..................................................................................................................20 2.1.6.4 Illegal underlying capital company, Money Brokers, Pawn-broking..22
2.1.7 Inter-bank Market………………………………………………………. 23 2.2 Legal framework, Supervision Structure of Financial System and Monetary Policy in China………………………………………………………………………27 3. Modern forms of the Shadow-Banking Sector……………………………………29 3.1 Overview of the Shadow Banking System in China…………………………..29 3.2 Modern Form of the Shadow Banking Entities and Their Inter-connectedness with the Official Banking System……………………………………………………30 3.2.1 Wealth Management Products-Trust Loans………………………………30
3.2.2 Trusts Financed Local Government Finance Vehicles………………… ...33 4. Possible Default Scenarios………………………………………………………...36 4.1 Past default scenarios …………………………………………………………..36 4.1.1 Shanxi Tailai Trust Default………………………………………...……36 4.1.2 Jilin Trust Corporation- Nanjing Lianqiang Collective Trust Default…..36 4.1.3 Dalian Shide Trust Default……………………………………………... 37 4.2 Possible Future Default Scenarios……………………………………………...37 5. Quantitative Analysis ……………………………………………………………..38

6. Conclusion…………………………………………………………………………40 List of References…………………………………………………………………….45 Appendix I....................................................................................................................47 Appendix II...................................................................................................................47 Appendix III.................................................................................................................49

Statutory Declaration I hereby formally declare that I have written the submitted dissertation entirely by myself without anyone else’s assistance. Wherever I have drawn on literature or other sources, either in direct quotes, or in paraphrasing such material, I have given the reference to the original author or authors and to the source where it appeared. I am aware that the use of quotations, or of close paraphrasing, from books, magazines, newspapers, the internet or other sources, which are not marked as such, will be considered as an attempt at deception, and that the thesis will be graded with a fail. I have informed the examiners and the board of examiners in the case that I have submitted the dissertation, entirely or partly, for other purposes of examination. Berlin, Germany, 26-06-2015 (Signature)
List of Figures Figure 1. Shadow Banking System Risks in General ………….…………………...................2 Figure 2. Evaluation Category of the Shadow Banking System ...............................................4 Figure 3. Estimation for Financial Institution Assets in China, YOY, 2002-2013....................7 Figure 4. Non-Performing Loan Assets for Banks in China, From 03.2004 to 05.2015, MOM ..................................................................................................................................................11Figure 5. NPL Ratio of Five Banking Groups in China, From 03-2004 to 03-2015, MOM ..................................................................................................................................................12 Figure 6. P/E Ratios of SOBs, SMEs and Start-Ups, YOY, 2010-2015...............................14 Figure 7. Microfinance Companies in Different Provinces.....................................................22 Figure 8. China: Interbank Market Assets Repurchase Agreements (IMARA) Transaction Volume, in RMB 100 million, Nov. 2000-Mar. 2015, MOM..................................................23 Figure 9. IMARA Transaction Volume, MOM, 01/2000-03/2015, in RMB 100 million.......24 Figure 10. The Overview of the Financial System in China, until March. 2015.....................26 Figure 11. The Inflation Cycles in China in the Post-Reform Era, YOY, PPI as Proxy for Inflation....................................................................................................................................28 Figure 12. The Supervision System of the Financial System in China....................................28 Figure13. Total Social Financing Composition, 2002 – 2014, YOY, Unit, in RMB 100 million......................................................................................................................................29 Figure 14. Total Social Financing Composition, 2002-2014, YOY, in RMB 100 million, with underlying Shadow Banking datasets......................................................................................30 Figure 15. TIC Funds Sorted by Function, Q1 in 2015, in RMB 100 million.........................32 Figure 16. TIC Funds For Securities Investments, Q1 in 2015, in RMB 100 million.............32 Figure 17. TIC Due Project Clearing in Q1, 2015, in RMB 100 million.................................32 Figure 18.Trust Assets Sorted by Industries, in 2015 Q1........................................................33 Figure 19. Trust Fund Flows-LGFVs-TBR Relationship Structure I......................................34 Figure 20. Trust Fund Flows-LGFVs-TBR Relationship Structure II.....................................35 Figure 21. Trust Fund Flows-LGFVs-TBR Relationship Structure III....................................36 Figure 22. SBF/TSF1, MoM, 2002-2014..................................................................................38 Figure 23. SBI/ FAI, MoM, 2002-2014...................................................................................39 Figure 24. Quantile Regression Results-Shadow Banking Indicator with Interest Rate Indicator...................................................................................................................................40
1 Total Social Financing: PBOC use TSF as an overall estimation indicator of all social financing activities
List of Abbreviations ABC ADB
Agriculture Bank of China Asia Development Bank
ADBC Agricultural Development Bank of China AMC Asset Management Corporation A-Share Shares trading on Shanghai Stock Exchange BADs Bank Acceptance Draft BCBS Basel Committee for Banking Supervision BOC Bank of China
Big Four Bank of China, People's Construction Bank of China, Industrial and Construction Bank of China
CAD C_Bond
Commerical Acceptance Drafts/Bills/Notes Corporate Bonds/Bills
CBRC China Banking Regulation Committee CCP China's Communist Party
CADTIC China Agriculture Development Trust Investment Corporation
CDBC China Developer Bank Corporation CIEC China Industrial Economic Database CITIC China International Investment Trust Corporation CIRC China Insurance Regulation Committee CMB China Merchants Banks CSRC China Securities Regulation Committee CVCA China Venture Capital and Private Equity Association CSSA D_Loan D_SIss
China Social Science Academy Domestic Loans allocated in RMB Securities of Non-Financial enterprises
DLR Deposit-Loan Ratio DR Deposit Interest Rate EIBC Export-Import Bank of China EMPEA Emerging Markets Private Equity Association E&Y Ernst and Young FAHURA FC_Loan
Financial Assets Held under Repurchase Agreements Fixed Asset Investments made from Loans allocated in Foreign Currency
FSB Financial Stability Board GIC Private Limited Government of Singapore Investment Corporation GFC Global Financial Crisis GP General Partnership H-Share HKD
Shares Trading on Hong Kong Stock Exchange Hong Kong Dollar
HKSE Hong Kong Stock Exchange
ICALAR Investments Classified as Loans and Accounts Receivable
ICBC I_RE
Industrial and Construction Bank of China Investments made from Firms’ Retained Earnings
IMARA Interbank Market Assets Repurchase Agreements IMF International Monetary Fund JOB Joint Stock Bank LIC Local Investment Companies LGFPs Local Government Finance Platforms LGFVs Local Government Financial Vehicles LP Limited Partnership
LR_SPD The difference between 1 year loan interest rate and market interest rate
MMFs Money Market Funds MOM Month to Month NAO National Audit Office NPL Non-Performing Loan
OECD Organization for Economic Cooperation and Development
OTC Over-The-Counter Market OFIs Other financial institutions PBOC People’s Bank of China PC People's Commune System PCBC People’s Construction Bank of China P/E Price/Earning PE Private Equity Funds PPL Private Placement Lending Q1 Quarter 1 QFIIs Qualified Foreign Institutional Investors RCB Rural Commercial Bank RCC Rural Credit Cooperative RCF Rural Cooperative Funds RDR 1 year-Deposit Interest Rate RFS Rural Financial Services RMAA Rural Mutual Aid Associations
RMB Ren Min Bi, Currency used in People's Republic of China
ROA Return on Assets ROSCA Rotating Savings and Credit Association ROW Rest of the World SBF Shadow Banking Indicator from the Credit Supply Side
SBI Shadow Banking Indicator from the Credit Demand Side
SIFIs Systemic Important Financial Institutions
SMEs Small, Medium-sized Enterprises SOB State Owned Banks SOEs State-Owned Enterprises SHSE Shanghai Stock Exchange SZSE Shenzhen Stock Exchange SFCs Structured Finance Vehicles TBTF Too-Big-To-Fail TBR Trust-Beneficiary Rights TICs Trust Investment Corporations TSF Total Social Financing TVE Township UK United Kingdom US United States UCC Urban Credit Cooperative USD United States Dollar VC Venture Capital WMP Wealth Management Products WTO Yuan_Loan
World Trade Organization Loans Allocated in RMB
YOY Year to Year

1
1. Introduction
Globally, shadow banking became the focus of academic discussion after the global financial crisis (GFC) of 2007. The Financial Stability Board (FSB) defines shadow banking as “credit intermediation activities and entities (partially or fully) outside of official financial system” (2011) or more succinctly “non-banking credit intermediation” (ibid. 1, Zheng, 2015). The shadow banking entities can easily evaporate the liquidity in the whole credit-chain, creating systemic risks, as they do not get any advances from the central banks. Meanwhile, the systemic important financial institutions (SIFIs), hence major commercial banks, are involved in the financial services and credit chains the shadow banking entities created. The commercial banks either directly own or act as the parent company for the shadow banking entities; or they are indirectly involved by cooperating with shadow banking entities in creating new financial products. In the US, the UK and the Eurozone, the shadow banking institutions were used by major commercial banks to circumvent liquidity and leverage requirements. The Over-The-Counter (OTC) markets function as the major market for the shadow banking transactions, the scale of OTC markets expanded beyond that of the traditional commercial banking sector (BIS, 2015). The major financial entities operating in the shadow banking system involves money market funds (MMFs), structured finance vehicles (SFCs), hedge funds, investment funds (equity funds and fixed income/bond funds), broker dealers, etc (FSB, 2011). The FSB has identified maturity transformation, liquidity transformation, credit leverage and risk transfer as the primary features of the shadow banking system (FSB, 2011). In the Chinese financial system, the immature shadow banking entities only consist of short credit chains. The linkages between the official financial system and the shadow banking entities made the latter the weak links within the whole credit chain. The inter-linkages between the shadow banking entities and the regular banking system can lead to spill over risks once default happen. The FSB (2011) has identified the inter-connectedness between the shadow banking sector and the regular banking system as the top risk associated with the shadow banking businesses. The Basel Committee for Banking Supervision (BCBS) has developed a set of proposals to make sure risks created from the shadow banking system are properly managed and do not spill over to the regular banking system with a prudential view. The BCBS also limited regular banks’ risk exposure by identifying their connections with individual shadow banking entities to restrict risks created by imperfect credit transfer (BCBS, 2014; FSB, 2014; Zheng, 2015). The G20 Leader Summit in Brisbane, Australia came with a Roadmap over international coordination in regulating the shadow banking system, whereby the priority is to prevent risk contagion between the shadow banking system and the regular banking system. The shadow banking activities also add to the leverage risks for financial markets. The shadow banking activities amplify financial cycles, as the assets of shadow banking entities tend to grow during booms and contract during busts (FSB, 2011; BIS, 2014; Sheng, Edelmann, Sheng and Hu, 2015). Other risks linked the shadow banking developments include susceptibility for MMFs to runs, and maturity mismatches buildup by the financialization process etc. To summarize, the shadow banking activities can easily cause systemic risks. The World Bank and the International Monetary Fund (IMF) have warned about the build-up of assets in the opaque financial sector in China at high speed (Xiao, 2014). The shadow banking institutions and products are often associated with risks like credit defaults, moral hazards and liquidity risks resulting from maturity mismatch, information asymmetry and rate of return mismatch (Zheng, 2015). The shadow banking entities in emerging economies are also easily subject to risks like lack of expertise in fund management, maturity mismatch risks like failure to pay promised high interest rate, misuse and appropriation of funding sources and easy drainage of liquidity and solvency (Hsu and Li, 2009). The FSB used a system-wide approach in evaluating the shadow banking system in different economies. The regulatory coverage spread through 25
2
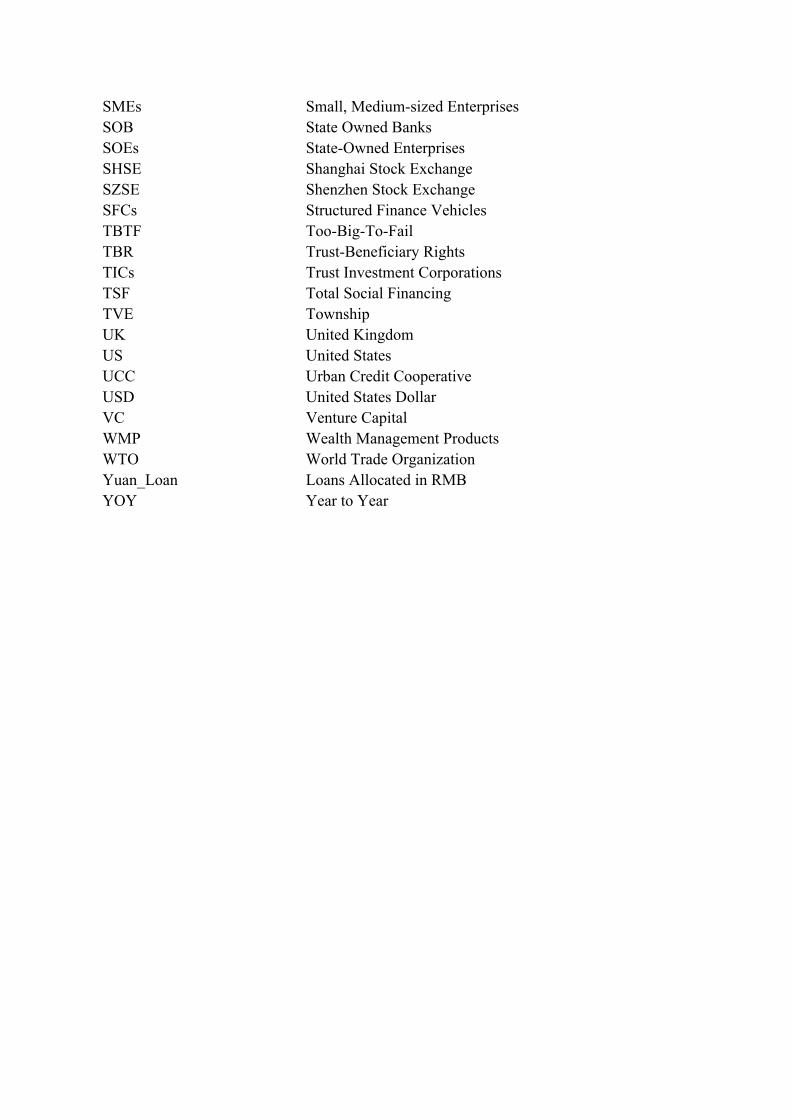
jurisdictions, representing 80 percent of the global GDP and 90 percent of shadow banking assets (FSB, 2014). The shadow banking defined by the FSB might not apply to all economics and policy frameworks (Sinha, 2013; Zheng, 2015). Figure 1. The Shadow Banking System Risks in General
Source: Zheng, the China Social Science Academy (CSSA), 2015; Li, Central University of Finance and
Economics, 2013; Author’s Illustration
The shadow banking earned its reputation by acting more flexibly than regular financial institutions. They are credited for meeting the financing needs of entrepreneurs and individuals in time. The shadow banking system in China emerged and boomed with the increasing financing needs from the private sector, particularly from the small-medium sized enterprises (SMEs). For investors, the shadow banking system offered financial products with implicit guarantee from the state-owned banking system, and often come with higher returns than investments made in the bond market and stock markets. Thus, the shadow banking products became a popular choice for investments. The shadow banking entities and their products sprung over the last 20 years in China. Not all the shadow banking institutions and products are properly registered or fall under the fragmented formal regulatory framework. The Chinese regulators and legislators usually take an ex-post view towards shadow banking regulation arbitrage and financial markets reforms. The legislation process came along with reforms in the financial system. Therefore, some of the products offered by the shadow banking institution are legal, others are quasi-legal; there are illegal financial products and platforms involved in the shadow banking system. The credit intermediation involving in shadow banking transactions are not limited to “grey” institutions; commercial banks, trust companies, mutual funds, credit rating agency, local government, qualified foreign institutional investors (QFIIs) are all active part of the shadow banking system. Traditional formats of informal financing intermediations in China involve underground banks, associations for mutual assistance, rotating savings and credit corporations, unregulated pawnshops, trust companies, wealth management organizations, leasing companies, regulated pawnshops, loan guarantee companies, small loan companies, microfinance organizations, private equity corporations, etc. (Hsu and Li, 2009).
3
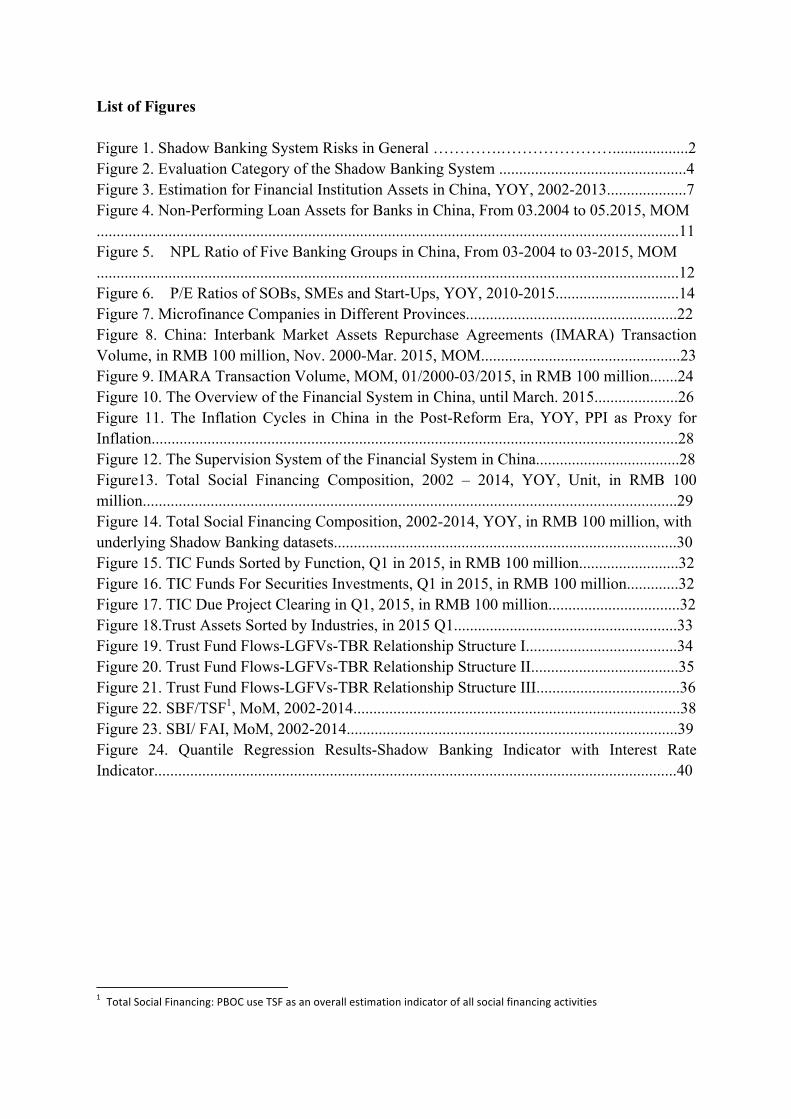
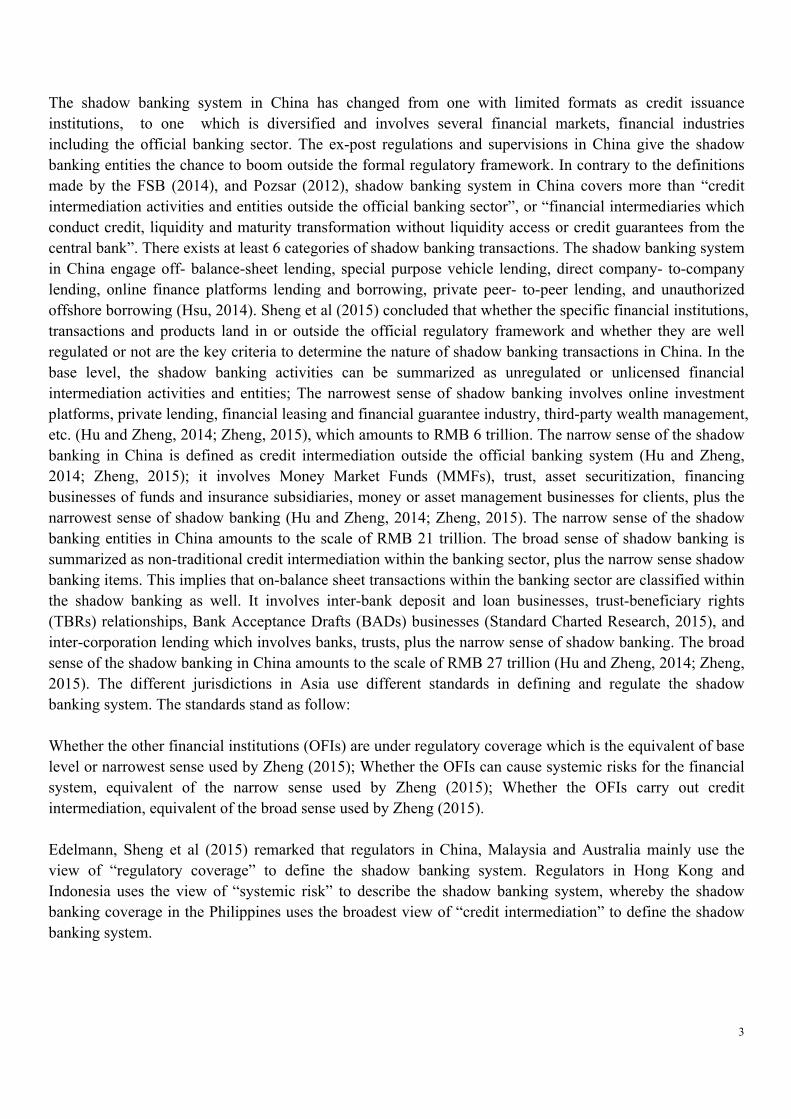
The shadow banking system in China has changed from one with limited formats as credit issuance institutions, to one which is diversified and involves several financial markets, financial industries including the official banking sector. The ex-post regulations and supervisions in China give the shadow banking entities the chance to boom outside the formal regulatory framework. In contrary to the definitions made by the FSB (2014), and Pozsar (2012), shadow banking system in China covers more than “credit intermediation activities and entities outside the official banking sector”, or “financial intermediaries which conduct credit, liquidity and maturity transformation without liquidity access or credit guarantees from the central bank”. There exists at least 6 categories of shadow banking transactions. The shadow banking system in China engage off- balance-sheet lending, special purpose vehicle lending, direct company- to-company lending, online finance platforms lending and borrowing, private peer- to-peer lending, and unauthorized offshore borrowing (Hsu, 2014). Sheng et al (2015) concluded that whether the specific financial institutions, transactions and products land in or outside the official regulatory framework and whether they are well regulated or not are the key criteria to determine the nature of shadow banking transactions in China. In the base level, the shadow banking activities can be summarized as unregulated or unlicensed financial intermediation activities and entities; The narrowest sense of shadow banking involves online investment platforms, private lending, financial leasing and financial guarantee industry, third-party wealth management, etc. (Hu and Zheng, 2014; Zheng, 2015), which amounts to RMB 6 trillion. The narrow sense of the shadow banking in China is defined as credit intermediation outside the official banking system (Hu and Zheng, 2014; Zheng, 2015); it involves Money Market Funds (MMFs), trust, asset securitization, financing businesses of funds and insurance subsidiaries, money or asset management businesses for clients, plus the narrowest sense of shadow banking (Hu and Zheng, 2014; Zheng, 2015). The narrow sense of the shadow banking entities in China amounts to the scale of RMB 21 trillion. The broad sense of shadow banking is summarized as non-traditional credit intermediation within the banking sector, plus the narrow sense shadow banking items. This implies that on-balance sheet transactions within the banking sector are classified within the shadow banking as well. It involves inter-bank deposit and loan businesses, trust-beneficiary rights (TBRs) relationships, Bank Acceptance Drafts (BADs) businesses (Standard Charted Research, 2015), and inter-corporation lending which involves banks, trusts, plus the narrow sense of shadow banking. The broad sense of the shadow banking in China amounts to the scale of RMB 27 trillion (Hu and Zheng, 2014; Zheng, 2015). The different jurisdictions in Asia use different standards in defining and regulate the shadow banking system. The standards stand as follow: Whether the other financial institutions (OFIs) are under regulatory coverage which is the equivalent of base level or narrowest sense used by Zheng (2015); Whether the OFIs can cause systemic risks for the financial system, equivalent of the narrow sense used by Zheng (2015); Whether the OFIs carry out credit intermediation, equivalent of the broad sense used by Zheng (2015). Edelmann, Sheng et al (2015) remarked that regulators in China, Malaysia and Australia mainly use the view of “regulatory coverage” to define the shadow banking system. Regulators in Hong Kong and Indonesia uses the view of “systemic risk” to describe the shadow banking system, whereby the shadow banking coverage in the Philippines uses the broadest view of “credit intermediation” to define the shadow banking system.
4
Figure 2. Evaluation Category of the Shadow Banking System
In summary, there are several financial markets relate to the shadow banking credit intermediation. These include but are not limited to the fast expanding inter-bank market, second-tier stock exchange market and third-tier stock exchange market designed for SMEs and high-tech firms, and corporate bonds market. The shadow-banking sector in China is a summary of alternative financing channels, governance mechanisms and institutions (AQQ, 2014). There have been a lot of speculations about risks related to the shadow banking and related debt issues with the ongoing credit expansion in China. The shadow banking system was associated with the sustainability of China’s strong and continuing economic growth. Economists started to question: whether “hidden lending in China will trigger economic crisis in the world’s third largest economy”(Shih, INTE, 2010). Similarly, Rogoff (2013) commented as: “debt-fueled bubble in China may trigger a regional recession within a decade”. (WSJ, 2013) Singh (2010) pointed out that, the debt inflicted by the local governments or the local government supported investment facilities has reached RMB39.8 trillion and 96% of GDP at the end of 2011. The financial stability report issued by the IMF (2011) concluded that China made significant progress in transforming into a commercially oriented, financially sound economy. Meanwhile, the financial system in China has become more complex, and faces a steady build- up of financial vulnerabilities (IMF, 2011). The inter-linkages between different financial institutions and markets in China are growing. China is planning on liberalizing interest rate within 2 years agenda and opening up the financial account by the end of 2015 (Zhou, PBoC, 2015). The probability by which the defaults in the shadow banking system leads to financial market instability, financial crisis, even real economy recession grows. The IMF (2011) made estimation over the current growth model in the Financial Stability Report in China. The IMF points out that the inflexible macroeconomic structure, referring to low- performance state-owned enterprises (SOEs) dominated industries, and government’s ruling role in credit allocation system are adding up to the
5
contingent fragility of the financial system. The IMF (2011) made a valid point in stating that the increasing off-balance sheet transactions outside the formal financial system in China are threatening the financial stability. The FSB issued the Global Financial Stability Report in 2014. The estimation made by the FSB in the narrow measure of the shadow banking system states that the shadow banking sector in China ranks as the third largest among the participating 23 jurisdictions, following the US and the UK. The scale of which amounts to USD 3 trillion. The financial risks also build up within the banking sector as the current quick credit expansion increase the leverage ratio and deteriorates capital basement for the commercial banks (IMF, 2011). The commercial banks use off-balance sheet transactions to circumvent regulations on credit allocation, deposit-debt ratio, leverage ratio, etc. The banks lose competitiveness and profitability, as they need to follow orders from central and local governments to subsidize industrial development. To consolidate the assets of commercial banks, the current reform agenda offered by the PBoC is planning to build universal banks, pushing commercial banks to diversify operations and functions. The scale of inter-bank market sprung since 2009. The way whereby “too-big-to-fail” (TBTF) banks and financial institutions burdened central banks and governments around the globe after the GFC, was ignored by the PBoC. The financial regulation framework in China is fragmented. The responsibility to supervise the shadow-banking institutions in China is shared by several institutions. For instance, the regulatory parties involve the People’s Bank of China (PBoC) for monetary policy making, the China Banking Regulatory Commission (CBRC) for off-balance sheet activities made by the commercial banks, the National Audit Office (NAO) for local government finance vehicles (LGFVs), the China Insurance Regulatory Commission (CIRC) for insurance companies and the China Securities Regulatory Commission (CSRC) for stock market, private funds and private equity investment firms. This is similar to the regulatory framework used by the US before the global financial crisis (GFC). The fragmented regulation system can result in inefficient actions due to lack of coordination, regulatory coverage gaps or overlaps. The current quarterly meeting system coordinated by the PBoC between the CIRC, the CBRC, the CSRC and the PBoC was set up in 2008. The State Council issued Document “Guidance over PBoC Functions, Organization and Employment Mechanism” in 2003. As reported by Sina (2013), the coordinated meeting mechanism did not come into effect until 2013. The former two meetings in 2003 ended with no formal coordination mechanism formed. The current regulatory framework can only function temporarily during the financial transformation and reform era. The current trend of mixed operation and increasing role of finance in the Chinese economy could possibly force the State Council to establish a regulatory framework consisting of the central bank, a financial policy advisory board, a prudential regulation committee and a panel for financial conduct supervision following the UK’s regulatory framework. The current regulation framework accommodates to the old separate operation financial institutions, but can hardly meet the needs to an evolving financial system in expansion. Other researches (The Brookings Institution, 2015; the Fung Global Institute, 2015; the FSB, 2014; the Manulife Asset Management, 2014) on the subject of shadow banking also point out that the ratio of the shadow banking system in China compared to GDP is small compared to that of other developed economies and their financial markets such as the Netherlands, Switzerland, the UK and the US (Elliott et al, Brookings Institution, 2015, p.17). The analysis made from the underlying datasets from the FSB Global Financial Stability Report (2014) showed OFIs scale is small compared to banking sector assets. Meanwhile, Wyman et al (2015) also conclude that the shadow banking system in China could only cause limited risks as the collateral used by the shadow banking products largely exceed the outstanding loans.
6
They analyzed the household debt composition, the corporate debt composition, the balance sheets of the central government and local governments in China and China’s financial position to the rest of the world (ROW). They concluded that the central government and the local governments both hold net assets position (Wyman, 2015); Meanwhile, Wyman et al stated that China’s household debt level is low; the concerns over the corporate debt level are also inflated. Loans are allocated in China according to the collateral offered. For instance, the PBoC issued regulations over debt leverage ratio, specifically instructing that: the leverage ratio of loans should not exceed 50 percent with land collateral; for those use transportation equipment as collateral, the leverage ratio should not exceed 60 percent, while the leverage ratio should not exceed 70 percent with real-estate equities as collateral. The unique practice of deposit used as collateral (Wyman et al, 2015, p. 4) in China was ignored. China remains a net lender to ROW and therefore any debt problem inflicted will be a domestic one without any global systemic implications (Wyman et al, 2015, p.4). Elliot et al (2015) estimated the possible default scenarios of the shadow banking products, stating that the contingent risks from the shadow banking sector to the official banking sector is limited between RMB 4.3 trillion and RMB 8.4 trillion. The quasi credit relationships were created between banks and high-risk industries such as coal mining, real estate industry, LGFVs (Local Government Financial Vehicles) with TBRs (Trust Beneficiary Rights).
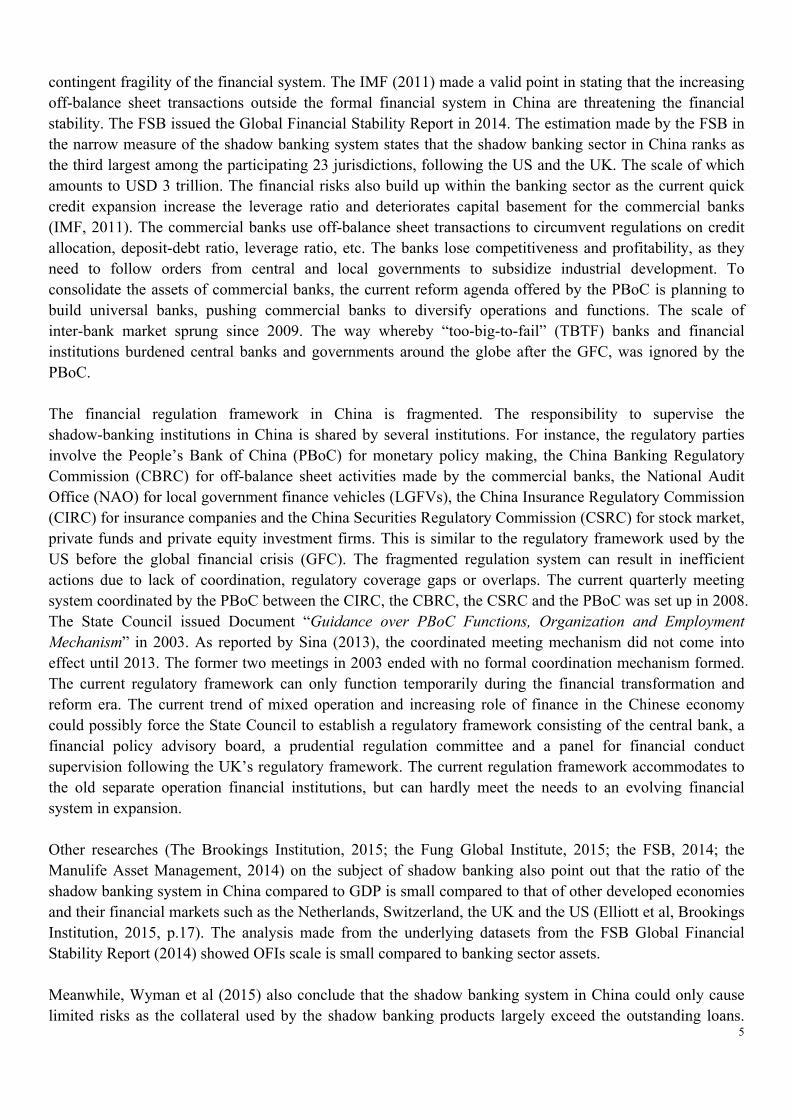
Figure 3. Estimation for Financial Institution Assets in China, YOY, 2002-2013
Source: The FSB Global Shadow Banking Monitoring Report 2014- Underlying Datasets
Author’s Illustration The TBRs contain the highest risks, as banks are 100 percent exposed to their possible defaults (Elliot et al, 2015). The risk profile for WMPs (Wealth Management Products) are still high, but banks only hold implicit guarantees over WMPs. The estimated NPL formation stands between 10 and 15 percent. The BADs (Bank Acceptance Drafts or Notes) only create contingent liabilities once they are discounted. The BADs operate with duration between 3 and 6 months; they have historically low default records. Despite this, banks have to take 100 percent of risks once the BADs are discounted and consolidated on their balance sheets. Elliott
7
(2015) estimated that the NPL formation from the BADs are roughly 0-0.5%. These reports made a thorough analysis of the shadow banking system in China. The past reports mainly focus on the direct risks posed by the default of the shadow banking products. Indirect damages such as the inflated credit ratings created by finance guarantee companies can distort the credit allocations by distorting risk analysis. The commercial banks serve as the portal for WMPs sales and therefore suffer from reputation damage once investors blame them for trust defaults. The practice of “Ring-Fencing” already pushes banks to separate the WMP operation department from the parent bank. This does not prevent investors from questioning the credibility of the banks with WMPs default. The past 24 default cases of trust products have already shaken public confidence over the LGFVs and related local government debts. The possible default risk delayed the swap of the local government debts in Jiangsu Province for a month and downgraded the borrowing scale as reported by Reuters (2015). Following the event, the PBoC and the Ministry of Finance in China announced that it allows banks and local governments to use municipal bonds as collateral for borrowing at the central bank with possible central bank repurchase agreements and treasury operations. This move was made to boost the market confidence on trust products with local government funded infrastructure projects as collateral. Following the debates over risks of the shadow banking sector in China, the thesis focuses on discussing the following issues. How to describe the shadow banking system in China? What are the major risks of the shadow banking system in China? How does interest rate control affect the shadow banking scale in China? The thesis will spread out in the following five sections. Section two summarizes the history of formal and informal financial system in China. It gives a discussion on the forces shaping the financial system in China in both the formal and informal financial sector; it also describes how the legal system evolved as regulators legalized part of the shadow banking system in China and tried to contain the rapid credit expansion. Section three comprises the overview about the shadow banking system in China, followed by how the modern forms of the shadow banking entities support the real economy in China; A description over the interconnectedness between the shadow banking sector and the formal banking sector in China is given also in section 3.2. Elaborations about possible default scenarios of the shadow banking sector in China are offered in section four. The analysis over risks associated with the shadow banking activities is followed by policy discussions over the government should let the shadow banking products default. Section five is about quantitative analysis over how interest rate control in China affects the size shadow banking activities and how shadow banking and business cycle in China interacted in both ways. Section six concludes the main findings of the thesis. 2. History of the Formal Banking Sector and Informal Financial System in China since the 1980s 2.1 Different formats of formal and informal financial institutions and their transformation into current forms 2.1.1 Transformation of the banking sector in China

8
China’s formal financial system went through three stages of major reforms, which spread from December, 1979 to September, 1984, from October, 1984 to December, 1991 and from January 1992 to present (Gao, 1999). The People’s Bank of China (PBoC) separated from the Ministry of Finance and started to operate as the central bank of China in the end of 1979. Three commercial banks were given the mandate to take over the commercial banking businesses previously belonging to the PBoC (AQQ, 2014). The People’s Construction Bank of China (PCBC) was set up in 1954 and focused on dealing with the transactions related to fixed-assets investments, mainly in the manufacturing sector. The Agriculture Bank of China (ABC) was created in 1979 and mainly focused on the businesses in rural areas. The Bank of China (BOC) specializes in the transactions related to foreign trade and investment. The Industrial and Commercial Bank of China (ICBC) was set up in 1984, and took over the rest of commercial banking transactions (AQQ, 2014). The “Big Four” are all joint-stock enterprises now with open share trading in both Shanghai Stock Exchange (A-Share) and Hong Kong Stock Exchange (H-Share). Foreign shareholders of the “Big Four” in 2015 include Temasek Holdings from Singapore for the PCBC in A share, the GIC Private Limited (Government of Singapore Investment Corporation) for the ICBC in A Share, the Bank of Tokyo – Mitsubishi UFJ Banking Ltd for BOC in H Share, Standard Charted Bank for the ABC in H Share (Sina, 2015). Foreign shareholders generally hold no more than 1 percent of stock of the “Big Four” with the exception of Temasek holding 5.77 percent shares for the PCBC. The three policy banks, namely the China Developer Bank Corporation (CDBC), the Agricultural Development Bank of China (ADBC) and the Export-Import Bank of China (EIBC), were set up to oversee professional bank performance in China and to promote industrial developments in China in 1994. The policy banks were established following the State Council’s decision to establish an independent, state-bank dominated financial system. They were parts of the reform scheme in dealing with large scale of non-performing loans (NPLs) for the “Big Four”. They took over the function of the “Big Four” to support industrial developments. The CDBC functions to support long-term industrial projects related to bottleneck industries. The CDBC also facilitates inter-regional cooperation and large-scale infrastructure projects. For instance, the CDBC belongs to the financing team for the “Three Gorge” project and the “South-North-Water Diversion” project. The CDBC also serves to fund high-technology industries and infrastructure projects related to industrial competitiveness in China. The ADBC was designed to resolve funding constrains in the agriculture industry. For instance, the ADBC can offer loans for agricultural businesses to buy wheat and rice from farmers at the fixed price set by the Ministry of Agriculture, securing wheat and rice storage after the harvest season. The ADBC mainly functions to settle payments and financing needs of agriculture firms to implement agriculture policy decisions made by the State Council and the Ministry of Agriculture. The EIBC conducts businesses by providing credit to export and import firms, settle international payments between domestic and foreign firms, and participate in OTC transactions such as RMB and foreign currency SWAP, Options buying and selling in the inter-bank market, other non-financial firms financing tools such as short-term and mid-term corporation notes, oriental offer bonds and asset-based bonds, etc. The banking sector was initially fully state owned, but later went through market-based reforms. The first bank charted as the limited legal responsibility corporation is the China Bank of Communications. The first partially privately owned joint stock bank, the China Merchants Banks (CMB) was set up in 1987; It was not until 2002 that the PBoC started to encourage joint-stock banks (JSBs) to complement capital by allowing them to be listed domestically (Calomiris, 2007). The CMB was public listed in Shanghai Stock Exchange (SHSE) in 2002. The HSBC became the second largest shareholder of the Bank of Communications in 2004. The Zhengjiang Commercial Bank was re-capitalized in 2004 as a joint-stock bank wherein domestic capital
9
account for the majority of capital. It became the 12th joint-stock bank in China. Over half of the JSBs in China have foreign capital shares by the end of 2004. The PBoC allowed 7 JSBs to issue subordinated capital to complement capital. Joint - stock and foreign banks usually have better performances than SOBs. The SOBs, on the other hand, was not prepared to satisfy the expanding financing demands from the private sector and the falling returns from their major customer group-SOEs. The fiscalization of major commercial banks leads to large scale of NPLs in the “Big Four”. These major commercial banks focused on supporting industrial development. Their transformations were not initiated until 1999, when four asset management companies (AMCs) were set up to dispose and manage the NPLs in the commercial banks and facilitate debt-equity SWAPs in SOEs (Calomiris, 2007, p.107). The four AMCs are the China Cinda AMC, the China Orient AMC, the China Huarong AMC, and the China Great Wall AMC. They are all state-owned AMCs with independent legal person status (Tong, 2005, p.52). Each of the AMCs was designated with dealing with the NPLs owned by one or more commercial banks. The China Cinda AMC was designed to facilitate NPL transformation in the CBC and the CDBC. The largest AMC, the China Huarong AMC aims for the NPLs in the ICBC. The China Orient AMC was designated with the responsibility of dealing with the NPLs associated with the BOC. The China Great Wall AMC was ordered to facilitate the NPLs transformation in the ABC. The four AMCs were established with funding of RMB 10 billion from the Ministry of Finance in the beginning, and were designed to function for 10 years. In 2004, market based reforms of AMCs were initiated with AMCs transforming from state-owned-policy dominated institutions to market-based investment banks. The reason behind is that their financial situation deteriorated over the years, whereas cash flows on AMCs accounting books were not sufficient to pay back interests incurred by outstanding loans. The reform agenda whereby AMCs merge with major commercial banks were proposed. However, the plan was not initiated, as the Ministry of Finance intervene on injecting liquidity into AMCs. Meanwhile, PBoC grants AMCs the privileges over the liabilities over policy loan bundles they took from the “Big Four” and other policy banks. Later AMCs started to diversify their operations. For instance, the Cinda AMC obtained the license to operate in securities, ETFs, life and assets insurance, trust and futures related transactions. The Cinda AMC also acts as the largest shareholder for public listed Cinda Real Estate Corporation. The Cinda AMC benefited from diversified operations as they achieved net benefits of RMB 1.4 trillion in the first quarter of 2010 as reported by Sina (2010). The Cinda AMC decided to get public listed by implementing the reforms in the ownership structure. The other three AMCs also submit similar reform schemes to the State Council. The Great Wall AMC set up the first domestic financial assets transactions exchange market in Tian Jin; the Oriental AMC aims for establishing a financial industrial chain by involving in securities related transactions and offering credit rating related services; the financial leasing company held by the Huarong AMC started to issue securities with financial assets as collateral. It marks the beginning of financial-assets-based-securitization in China. The Ministry of Finance and the China Social Security Funds are the largest shareholders of the Cinda AMC, holding 67.84 percent and 8.04 percent of shares respectively. The AMCs have expanded into trust industry, with Hua Rong Trust operating under the Parent Company. Foreign banks only entered the financial markets in China in 2001. The entry of foreign banks was assumed to bring shocks to the financial system in China, given the fact that non-state-owned firms or firms in the hybrid sector are generally disadvantaged in competing for support from domestic bank credit. In the end, Lin (IMF. 2011) concluded that no significant change on average in either the ratio or the amount of long-term bank loans made by listed non-financial firms in China following the entry of foreign banks. It appears that foreign bank credit access varies geographically. The opening up pace of the financial markets in China differentiated geographically, whereby the variation constrained foreign banks from conduct RMB/Yuan related business with domestic firms. The opening up of RMB related business for foreign banks
10
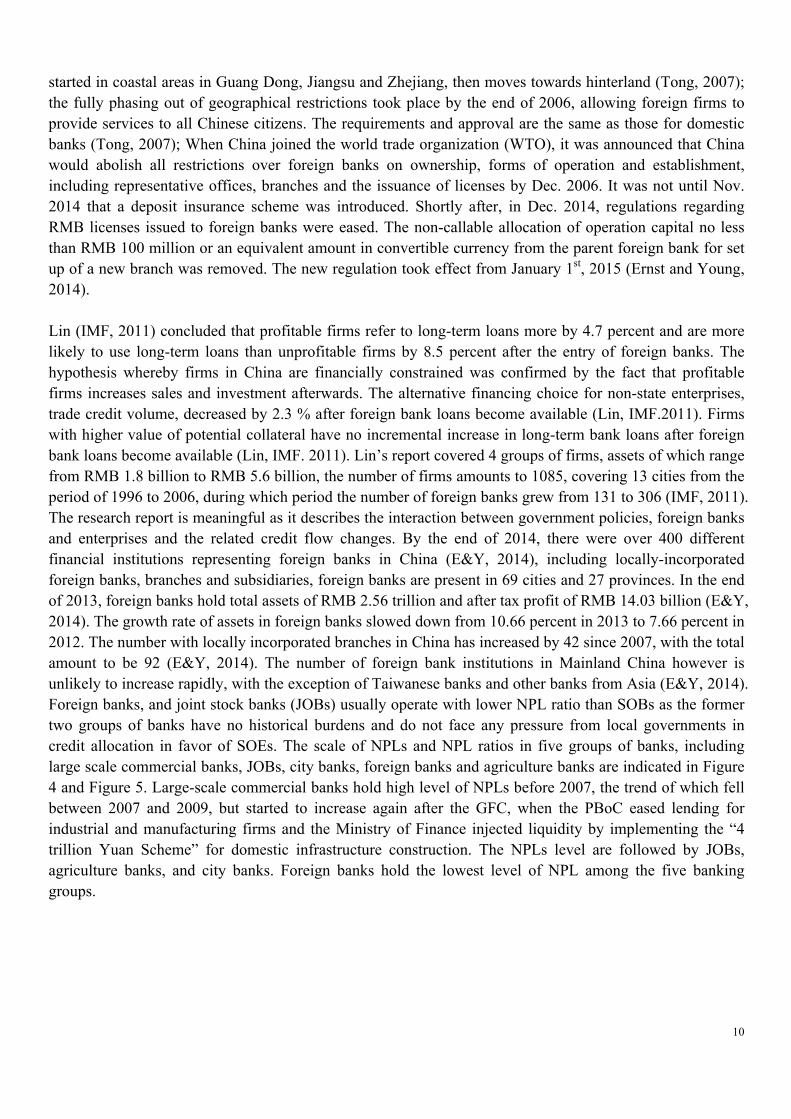
started in coastal areas in Guang Dong, Jiangsu and Zhejiang, then moves towards hinterland (Tong, 2007); the fully phasing out of geographical restrictions took place by the end of 2006, allowing foreign firms to provide services to all Chinese citizens. The requirements and approval are the same as those for domestic banks (Tong, 2007); When China joined the world trade organization (WTO), it was announced that China would abolish all restrictions over foreign banks on ownership, forms of operation and establishment, including representative offices, branches and the issuance of licenses by Dec. 2006. It was not until Nov. 2014 that a deposit insurance scheme was introduced. Shortly after, in Dec. 2014, regulations regarding RMB licenses issued to foreign banks were eased. The non-callable allocation of operation capital no less than RMB 100 million or an equivalent amount in convertible currency from the parent foreign bank for set up of a new branch was removed. The new regulation took effect from January 1st, 2015 (Ernst and Young, 2014). Lin (IMF, 2011) concluded that profitable firms refer to long-term loans more by 4.7 percent and are more likely to use long-term loans than unprofitable firms by 8.5 percent after the entry of foreign banks. The hypothesis whereby firms in China are financially constrained was confirmed by the fact that profitable firms increases sales and investment afterwards. The alternative financing choice for non-state enterprises, trade credit volume, decreased by 2.3 % after foreign bank loans become available (Lin, IMF.2011). Firms with higher value of potential collateral have no incremental increase in long-term bank loans after foreign bank loans become available (Lin, IMF. 2011). Lin’s report covered 4 groups of firms, assets of which range from RMB 1.8 billion to RMB 5.6 billion, the number of firms amounts to 1085, covering 13 cities from the period of 1996 to 2006, during which period the number of foreign banks grew from 131 to 306 (IMF, 2011). The research report is meaningful as it describes the interaction between government policies, foreign banks and enterprises and the related credit flow changes. By the end of 2014, there were over 400 different financial institutions representing foreign banks in China (E&Y, 2014), including locally-incorporated foreign banks, branches and subsidiaries, foreign banks are present in 69 cities and 27 provinces. In the end of 2013, foreign banks hold total assets of RMB 2.56 trillion and after tax profit of RMB 14.03 billion (E&Y, 2014). The growth rate of assets in foreign banks slowed down from 10.66 percent in 2013 to 7.66 percent in 2012. The number with locally incorporated branches in China has increased by 42 since 2007, with the total amount to be 92 (E&Y, 2014). The number of foreign bank institutions in Mainland China however is unlikely to increase rapidly, with the exception of Taiwanese banks and other banks from Asia (E&Y, 2014). Foreign banks, and joint stock banks (JOBs) usually operate with lower NPL ratio than SOBs as the former two groups of banks have no historical burdens and do not face any pressure from local governments in credit allocation in favor of SOEs. The scale of NPLs and NPL ratios in five groups of banks, including large scale commercial banks, JOBs, city banks, foreign banks and agriculture banks are indicated in Figure 4 and Figure 5. Large-scale commercial banks hold high level of NPLs before 2007, the trend of which fell between 2007 and 2009, but started to increase again after the GFC, when the PBoC eased lending for industrial and manufacturing firms and the Ministry of Finance injected liquidity by implementing the “4 trillion Yuan Scheme” for domestic infrastructure construction. The NPLs level are followed by JOBs, agriculture banks, and city banks. Foreign banks hold the lowest level of NPL among the five banking groups.

11
Figure 4. Non-Performing Loan Assets for Banks in China, From 03.2004 to 05.2015, MOM (Month to Month)
Source: PBoC, China Industrial Economic Database, Author’s Illustration
The PBoC still maintains the 75 percent deposit-loan ratio (DLR) for all banks in China, with the DLR of the “Big Four” remains at 65 percent, with small scale banks such as city banks, agriculture banks usually maintains nearly 75 percent of the DLR as reported by Financial Times (2015). The PBoC is planning on abolishing the DLR for small and medium sized banks to boost their lending to SMEs and agriculture industries (Financial Times, 2015). As indicated by Figure 5, the PBoC pushes all commercial banks in China in following Basel I, Basel II and Basel III to lower NPL ratios. The large-scale commercial banking group has the highest level of NPL ratio in 2003, reaching nearly 20 percent with other sources indicating the NPL ratio may reach 70 percent (Shih, 2008). NPL ratio for all five banking groups declined over the years, with agriculture banks hold the highest NPLs ratio. After the state council ordered the Ministry of Finance to inject liquidity by promoting the “4 trillion Yuan Scheme” for domestic infrastructure construction, the NPL ratio of all banking groups showed fluctuations and slight increases.
12
Figure 5. NPL Ratio of Five Banking Groups in China, From 03-2004 to 03-2015, MOM
Source: PBoC, China Industrial Economic Database, Author’s Illustration
2.1.2 Transformation of Urban Credit Cooperatives and Rural Credit Cooperatives (UCCs and RCCs) The second period of transformation marks the development outside the “Big Four” banks. The regional banks (partially owned by the local government) were created in coastal areas, especially in Special Economic Zones to support exports and local economic development. The urban credit cooperatives (UCCs), later evolving into small-scale city banks, started to operate as an addition to the banking system in the mid-1980s. They later started to spread widely as there are urging needs of credit from individuals and collective enterprises. These enterprises and individuals tried to adapt to the dissipation of unified planned economy and people’s commune system. Township and village enterprises (TVEs) and private enterprises developed quickly since 1979. As large-scale commercial banks mainly serve the needs of state-owned enterprises (SOEs)(OECD, 1997; Shih, 2008; Hsu and Li, 2009; AQQ, 2015). Therefore, TVEs, private firms and individual businessman struggled with opening accounts, getting loans and settling businesses through banks. The first UCC was set up in Luohe, Henan Province in 1979. In 1986 more than 1,100 urban credit cooperatives were charted. They hold a total of RMB 3.7 billion in deposits and made loans worth of RMB 1.9 billion (OECD, 1997). The UCCs were under supervision of PBoC; they are collectively owned, enjoyed separate accounting, self-decision for management, but also are self-responsible for losses and profits (OECD, 1997). There are mainly two types of UCCs; the first type describes UCCs, which operate in medium and large-scale cities; these UCCs have no branches and mainly take deposits, grant loans and undertake remittances and settlements from urban collective enterprises, commercial households and private firms. The second type of UCCs is largely affiliates attached to urban credit cooperatives. The affiliates are legal entities with separate accounting book, operating independently with sole responsibility for profits or losses and taxes. Girardin and Bazen (1997) conduct surveys over 57 UCCs in 8 cities from three regions and concluded that they operate in much healthier financial positions than large-scale state-owned banks (SOBs). For instance, Girardin and Bazen (1997) used earnings over assets (EOA) ratio as one indicator whereby EOA of UCCs are 10 times that of SOBs. Meanwhile non-performing loan (NPL) ratio of UCCs is a quarter compared to that of SOBs (Girardin and Bazen, 1997). The NPLs are a serious issue for the SOBs
0
5
10
15
20
25
2004-‐03
2004-‐12
2005-‐09
2006-‐06
2007-‐03
2007-‐12
2008-‐09
2009-‐06
2010-‐03
2010-‐12
2011-‐09
2012-‐06
2013-‐03
2013-‐12
2014-‐09
Large-‐ Scale Commercial Banks NPL RaJo Joint-‐Stock Commercial Banks NPL RaJo
City Banks NPL RaJo
Agriculture Banks NPL RaJo
Foreign Banks NPL RaJo
13
(Fung and Zhang, 2002; Shih, 2008), whereas official data source indicates the SOBs on average hold 20 percent of NPLs (Hovey and Naughton, 2000) while surveys indicate the NPLs can reach the level of 70 percent for the SOBs (Shih, 2008). The profitability of the UCCs can be explained by the fact that the UCCs do not have the burden of funding the SOEs with low performance and long-term infrastructure projects. The UCCs were smaller and therefore were more flexible than the SOBs as the UCCs had thousands of communication and representative offices in virtually every community. The UCCs were also able to communicate with their customers directly and monitor their operation closely (Fung and Zhang, 2002). In 1997, the PBoC promulgated the “Guidance on Establishment of Urban Commercial Banks” (Calomiris, 2007). In the following year, the PBoC issued “Measures About Rectifying Urban Credit Cooperatives”. Twenty-one UCCs were shut down by the end of 1998. A large number of the UCCs were later consolidated into urban commercial banks. In 1999, over 1,600 insolvent and high risk UCCs and RCCs were shut down. The cleanup of UCCs continued in 2001 and 2002, when 776 and 115 UCCs were transformed into urban commercial banks in the respective year through closure, consolidation and re-establishment. In 2003 and 2004, the reforms of UCCs spread to 21 provinces. In rural areas, the counterparts of UCCs- rural credit cooperatives were established in 1957. Their activities diminished during the Cultural Revolution but re-emerged in the middle 1980s. The network of Rural Credit Cooperatives (RCCs), including Rural Cooperative Funds (RCFs), Rural Mutual Aid Associations (RMAA) and Rural Financial Services (RFS) were formed to help farmers to escape from high-interest rate lending after the dissimilation of traditional rural credit cooperative association under the people’s commune (PC) system. The RCCs also function to support “san nong”, namely three agriculture problems: nongcun (rural areas), nongye (agriculture) and nonghu (rural households). The ownership structure of the RCCs evolved over time. They have always been very controversial as the RCCs were initially formed as cooperative financial organizations that are democratic and flexible (Jiang, 2009). After 1958, the RCCs became semi-state-owned financial organizations, whose ownership and risk all belonged to the central government instead of to an informal financial organization. Since 1979, the central management system of newly collective funds under PCs stopped working. Therein, the RCFs started to take over the role of financing rural households and agriculture developments (Jiang, 2009). The RFS provided financial services to nonagricultural departments. By the end of 1996, 21, 000 townships and 25,000 villages in China, which accounted for 47.6 percent of all townships and 3.4 percent of all villages have established RCFs. The RCFs raised RMB 108.28 billion. Cumulative fund lending from the RCCs reached RMB 152.73 billion (Jiang, 2009). RCFs suffer from occasional payment crises from time to time without a proper monitoring framework. The State Council issued several documents to strengthen the management of the RCFs. In 1996, the State Council issued the “Decision on the Reform of the Rural Financial System” (Jiang, 2009). Thereafter, a through cleanup of RCFs was announced and actions were taken. The administration ties between the ABC and the RCCs started to be severed in 1996 (Calomiris, 2007); the process was completed in 1999. In 1997, the PBoC established the Bureau of Rural Cooperative Finance (Calomiris, 2007). In 1999, over 1600 insolvent and high risk RCCs and UCCs were shut down. The first experiment over reforms of the RCCs was carried out in Jiangsu Province in 2000. The Jiangsu Province Rural Credit Cooperative Union was founded in 2001, with the first joint-stock Rural Commercial Banks (RCBs) were established in three cities in Jiangsu. By the end of 2004, there are already seven RCBs operating in several cities (Calomiris, 2007). The RCCs still account for a large share of credit flows in China after the reform. By the end of April 2001, the RCCs owned over RMB 158 trillion deposits and over RMB 105 trillion loans. The respective share of RCCs among total deposits and total loans owned by all financial agencies are 12 percent and 10 percent. The RCCs has become too important in China to go through large-scale defaults.
14
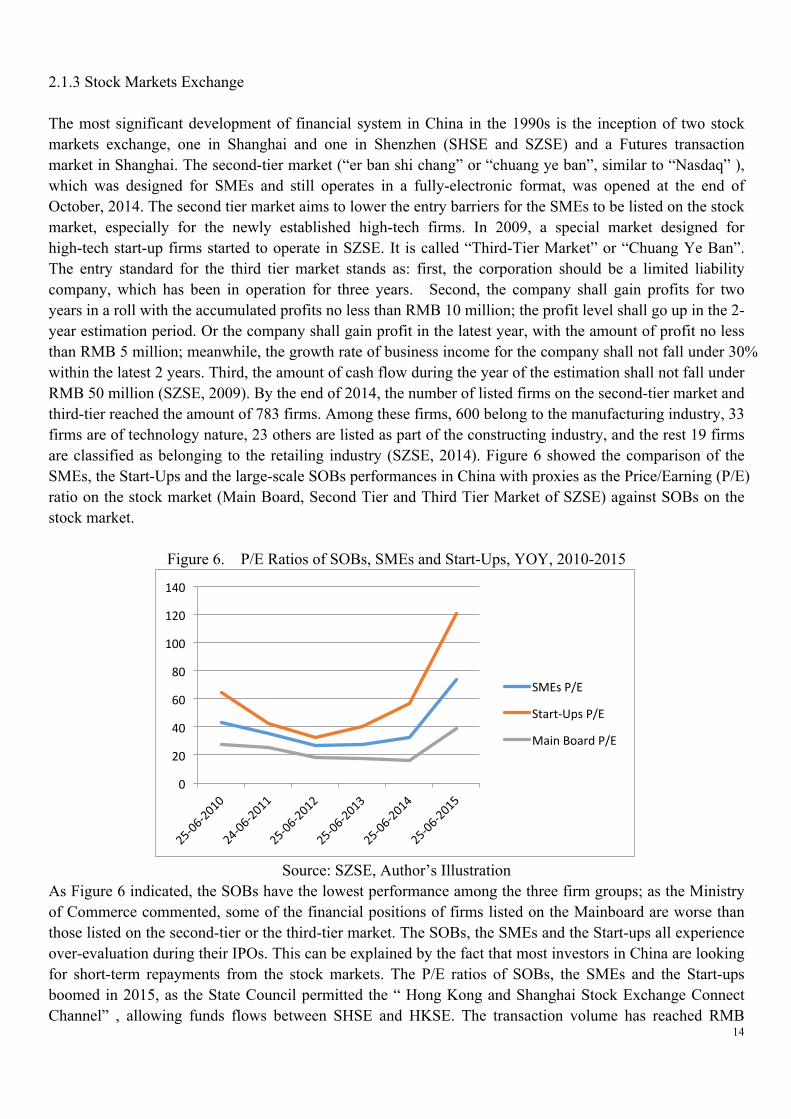
2.1.3 Stock Markets Exchange The most significant development of financial system in China in the 1990s is the inception of two stock markets exchange, one in Shanghai and one in Shenzhen (SHSE and SZSE) and a Futures transaction market in Shanghai. The second-tier market (“er ban shi chang” or “chuang ye ban”, similar to “Nasdaq” ), which was designed for SMEs and still operates in a fully-electronic format, was opened at the end of October, 2014. The second tier market aims to lower the entry barriers for the SMEs to be listed on the stock market, especially for the newly established high-tech firms. In 2009, a special market designed for high-tech start-up firms started to operate in SZSE. It is called “Third-Tier Market” or “Chuang Ye Ban”. The entry standard for the third tier market stands as: first, the corporation should be a limited liability company, which has been in operation for three years. Second, the company shall gain profits for two years in a roll with the accumulated profits no less than RMB 10 million; the profit level shall go up in the 2- year estimation period. Or the company shall gain profit in the latest year, with the amount of profit no less than RMB 5 million; meanwhile, the growth rate of business income for the company shall not fall under 30% within the latest 2 years. Third, the amount of cash flow during the year of the estimation shall not fall under RMB 50 million (SZSE, 2009). By the end of 2014, the number of listed firms on the second-tier market and third-tier reached the amount of 783 firms. Among these firms, 600 belong to the manufacturing industry, 33 firms are of technology nature, 23 others are listed as part of the constructing industry, and the rest 19 firms are classified as belonging to the retailing industry (SZSE, 2014). Figure 6 showed the comparison of the SMEs, the Start-Ups and the large-scale SOBs performances in China with proxies as the Price/Earning (P/E) ratio on the stock market (Main Board, Second Tier and Third Tier Market of SZSE) against SOBs on the stock market.
Figure 6. P/E Ratios of SOBs, SMEs and Start-Ups, YOY, 2010-2015
Source: SZSE, Author’s Illustration
As Figure 6 indicated, the SOBs have the lowest performance among the three firm groups; as the Ministry of Commerce commented, some of the financial positions of firms listed on the Mainboard are worse than those listed on the second-tier or the third-tier market. The SOBs, the SMEs and the Start-ups all experience over-evaluation during their IPOs. This can be explained by the fact that most investors in China are looking for short-term repayments from the stock markets. The P/E ratios of SOBs, the SMEs and the Start-ups boomed in 2015, as the State Council permitted the “ Hong Kong and Shanghai Stock Exchange Connect Channel” , allowing funds flows between SHSE and HKSE. The transaction volume has reached RMB
0
20
40
60
80
100
120
140
SMEs P/E
Start-‐Ups P/E
Main Board P/E
15
137,368 million per day (HKSE, 2015). This promoted the overseas funds flows into the SHSE, and increases the domestic confidence in the stock market. Also, the hypothesis whereby the SMEs and the Start-ups are financially constrained was confirmed. Their performance far exceeds those of the SOEs, while the majority of loans go to the SOEs in the manufacturing industries (Shih, 2008; AQQ, 2015). 2.1.4 Informal Lending China is a society with traditional high social trust. Informal finance dates back to Xi Zhou Dynasty, when the private lending contracts first emerged (Jiang, 2009). The informal lending behavior such as lending between familial partners and friends has helped to fund 60 percent of household debt in rural areas, helping to alleviate poverty. The total sum of private lending among farmers in 2000 exceeds RMB 140 billion, accounting for 68.8 percent of the sum of all loans (Cao, Research Center of Rural Economy, 2001). About 47.7 percent of private lending was in the form of interest-bearing loans (Jiang, 2009). Private lending falls into four categories: borrowing money and paying back money, borrowing money and paying back goods, borrowing goods and paying back money, borrowing goods and paying back goods. The first type is the most common one (Jiang, 2009). Private lending is also classified in terms of the amount of interest repaid. No interest loans, low interest loans and high interest loans are defined as “ white”, “ gray” and “black” finance respectively (Jiang, 2006). 2.1.5 Trust Companies and Private Equity Funds (PEs) Non-bank financial intermediaries, such as Trust Investment Corporations (TICs) emerged and proliferated in the second half of 1980s. TICs operate in selected banking and non-banking services, with restrictions on both deposits and loans. The first trust company, the China International Investment Trust Corporation (CITIC), was set up under the direct supervision of the State Council in October 1979. The first chairman, Mr. Rong Yiren, later became the vice President of China, successfully attracted high volumes of cash flows. Before the set up of TICs, a lot of valuable projects were foregone due to the lack of credit support from the SOBs. As part of the re-structuring of the financial system in China, the separation between securities, trusts and banking were imposed during 1995 to 1997. The Trust Investment Corporations (TICs) were detached from their affiliated SOBs; the PBoC branched owned security firms were separated from the PBoC branches. The security companies are set up by commercial banks. The credit cooperatives, finance companies, insurance companies, TICs, leasing companies were separated from their owners, and started to operate as independently registered companies. The trust companies received widespread civil investments, digging into the disposable income of , as the deposits offered by the SOBs were too low (Hong and Yan, 1997). Their assets grew with an astonishing speed. The TICs operated without too restrictions over operations; therefore TICs were able to offer all the services the SOBs can offer, at a lower cost (Hong and Yan, 1997). The TICs helped to facilitate the private investments from the firms which cannot credit from the SOBs (Hong and Yan, 1997). They also carry out foreign exchange related transactions, whereby the SOBs cannot at the time. The China Agriculture Development Trust Investment Corporation (CADTIC), was initially formed to accept agriculture loans from the World Bank, when the ABC cannot conduct foreign exchange related businesses in the 1980s. The TICs meet the social financing needs from both firms and investors during the period when the People’ Commune system (PC) transformed into a more market-based economy. The TICs’ rapid development however, posed a threat to the commercial banks at the time, which were under strict tight central bank controls and unable to compete with the TICs. The State Council, eased
16
restrictions over the commercial banks conducting trust business on July 10th, 1980 (Hong and Yan, 1997). Hence many commercial banks started to operate their own trust business as a subsidiary branch (Hong and Yan, 1997). Banks operated 186 out of 191 charted TICs by the end of 1995 as reported by the People’s Daily on January 4th, 1997 (Hong and Yan, 1997). Hong and Yan also identified five different types of TICs, which are part of the finance hierarchy of the financial system in China. The first type of TICs on the top of the hierarchy is under direct supervision from the State Council (e.g. CITIC, CADTIC) and operates with significant ties and subsidies with the central government (Hong and Yan, 1997). They have numerous branches and subsidiaries, with some even have foreign offices. The CITIC Group, which was developed from the first and largest TIC in China, owns its own commercial bank, which has 1073 branches in mainland China and 36 branches in Hong Kong, with oversea branches in Macao, Singapore and New York (CITIC, 2015). The CITIC Group covers 6 categories of businesses including finance, energy, manufacturing, construction contracting, real estate & infrastructure, and other businesses (CITIC, 2015). The CITIC finance sector involves in securities, banking, trust and insurance related businesses and owns a security transaction market in Lyon (CITIC, 2015). Profits from its bank subsidiaries remain CITIC’s main income source in 1996, when 73 percent of CITIC’s total profits are from the banking related businesses as reported by the People’ Daily on April 8th, 1996. The banking related businesses of the CITIC accounted for 78 percent of all profits of the CITIC group while the rest of the finance related businesses accounted for 2 percent of the profits (Tencent Finance, 2014). The wealth management businesses owned by the CITIC Banking Limited Corporation managed assets over RMB 900 billion (Tencent Finance, 2014). Currently, the CITIC Group holds 30 percent of financial assets and 70 percent of non-financial assets, while 80 percent of profits came from the financial assets with the rest 20 percent coming from the non-financial assets. The second TIC group on the hierarchy are those who are sponsored by local governments, e.g. Shanghai International TIC, Chong Qing International TIC, etc. (Hong and Yan, 1997) The third category are TICs supported by firms in other industries, such as insurance and real estate, e.g. Beijing Real Estate TIC. The fourth category stands as the affiliates of joint venture and foreign banks. The fifth category consists of TICs that are formerly the subsidiaries to the commercial banks. For instance, Xinhua Trust Corporation used to the subsidiary of the ICBC, with the shares of the Xinhua TIC later transferred to Shen Zhen New Investment Corporation. The separation between TICs and the “Big Four” was completed in November 1995 (Hong and Yan, 1997). Hence, the number of TICs owned or partially owned by commercial banks in China dropped from 186 to 38 by the end of 1995, as reported by the People’s Daily on Jan. 4th, 1996 (Hong and Yan, 1997). In 1999, the State Council promulgated the “Measures on Rectifying Trust and Investment Companies”. In the following year, 219 TICs began to be rectified by the PBoC. The rectification process shut down 96 TICs, restructured 18, and consolidated 67 while 58 stayed (Calomiris, 2008). In 2001, the Trust Law was enacted, with the State Council (SC) and the PBoC promulgated “Management Measures on Trust and Investment Companies”. In 2004, three automobile finance companies were established, while the PBoC promulgated “Management Measures on Automobile Finance Companies and Auto Loans Management Companies”(Calomiris, 1997). The Private Equity Fund refers to the type of unauthorized collective investments that are not publicly advertised and are recruited from particular investors. The term, “ Private Equity Fund” (PE) was created in the late 1990s, where “private” imply the way funds are raised. There are two types of PEs, the one where contract-based collective investment fund are formed through contract agreements; the other one being the company-based investment funds formed by setting up of a joint-stock company (Jiang, 2009). More and more companies get involved with private equity business with the development of financial system in China.
17
To summarize the history of the TICs, they are mostly set up by commercial banks, provincial governments, and the SOEs. They normally have close connections with local governments, as the TICs were established to support industrial developments and real estate investments. The NPL ratios for TICs are highest among all financial institutions, reaching 42.5 percent as of September 2003. The TIC industry went through 5 times of restructuring, capital consolidation and rectification since they first emerged in the beginning of 1980s. Till the end of 2014, there have already been 24 cases of default among trust products provided by TICs (Manulife Asset Management, 2014). The security firm usually credit investors with a 1:2 leverage ratio over collateral (cash or stock) more than RMB half a million for their investments in the stock market. The institutional investors with trust tools from TICs or financial consultancy firms usually have 1:5 or even higher leverage for credit guaranteed to invest in the stock market as reported by Financial Times (2015) .The amount of trust-loan-investments into SZSE and SHZE has reached approximately RMB 500 billion and 1000 billion. Institutional investors, individual investors, and other types of investors, including the security exchange company, all participate in the orgy of at the stock market. After the PBoC prohibited umbrella trusts with high leverages and security firms to conduct proprietary trading, both SZSE and SHSE experienced the largest scale of losses within 5 months. In chapter 3, there will be more description over the trust beneficiary relationships were formed and how they function to transfer funds from individual investors, firms to risky industries. With the establishment of the two stock markets and a futures market, private equity funds have experienced a period of expansion (Jiang, 2009). Xia Bin(2014) conducted a survey over PEs in 2001 and concluded that 52 percent of all financial management firms, financial consultancy companies, investment management corporations and investment consultancy firms participating in the survey are performing “financial planning”, which is in fact PE related businesses even when they were not authorized. The kind of financial planning conducted was given the name of “Private Placement Lending”. The government did not permit this type of “Private Placement Lending (PPL)”. It usually promises the investor a higher rate than the banks, thereby attracting loads of disposable income. It is unstable and the scale of which fluctuates with the financial markets. The Central University of Finance and Economics (2004) made a survey over the flows of PPL. It was estimated that the money flows from PPL to the security market occupy 30 to 35 percent of the total cash flows in the security market. The PPLs largely existed in Beijing, Shanghai, Guangzhou and Jiangsu where there is plenty of disposable capital with more potential investor (Jiang, 2009). The survey estimated that individual firms absorbed around RMB 1.5 billion (Xia, 2014). In Beijing, Shanghai, and Shen Zhen, the amount of the PE assets was estimated by Xia (2014) to be around RMB 544.35 billion. According to the CSRC, the financial planning subsidiary of a Nanjing based security company recruited funds over RMB 10 billion. The total funding collected in this type was estimated to over RMB 200 billion. Plus TIC funding, the scale of PE amounts to more than RMB 700 billon, according to Xia’s survey (2014). The Zero2IPO Group issued a report over the China Private Equity market. The report stated that more than USD 19.99 billion was recruited by 16 PEs in China during the first quarter (Q1) of 2008. The scale of which has increased by 163.3 percent compared to that of 2007 (Jiang, 2009). According to Ernst and Young (E&Y, 2013), the market in China remains one of the most attractive venues for PE investment (IMF, 2011). Fund raising for finance vehicles targeting the China venue has achieved USD 8.3 billion in new commitments during the Q1 2012, almost doubling the amount reached in the fourth quarter (Q4) of 2011 (E&Y, 2013). The Emerging Markets Private Equity Association (EMPEA) found that China remains one of the top three markets for PE deals making (E&Y, 2013). The EMPEA also estimated that Chinese PEs would generate the highest returns during 2013/2015.
18
However, according to the China Venture Capital and Private Equity Association (CVCA), the PE industry has experienced declines in returns, with over 80 percent of PEs in Limited Partnership (LP) got less than 25 percent of returns in 2012. The amount of investments made in General Partnership (GP) reduced significantly, while over 20 percent of PEs in GP received funds transferred from PEs in LP (CVCA, 2014). The ratio of fund defaults from PEs has reached 30 percent, while the amount of quitting funds for Merger and Acquisition (M&A) deals have reached historically high level. The E&Y also made the conclusion that policy regulations have a strong impact on the amount and types of funds being raised. The focus of many foreign firms in 2011 and 2012 remained to be RMB funds. The recent pronunciation made by one of the industry leader might shift the focus of investments to products made in USD. While the amount fund raised has increased substantially from the Q1 to the Q4 in 2012, the amount of deals reached has declined in the Q1, 2012. The PEs announced 86 new acquisitions with an aggregate value of USD 1.9 billion, declining by 72 percent from 143 deals amounting to USD 6.8 billion reached in the Q4 of 2011 (E&Y, 2013). In the Q2 of 2012, the deals made by the PE rebounded as CVC China made investments in HK Broadband Network reached the amount of USD 664 million. The CVCPEA made an industry based report, evaluating the developments of PE/Venture Capital (VC) in 2013. The PE/VC industry is still subject of restructuring and reshuffling (CVCA, 2014), while policy restrictions diminished with restrictions over the set up of PEs eased significantly. The PEs in LPs realized Internal Rate of Return (IRR) in book value between 10 to 25 percent on portfolio investments (CVCA, 2014). There is also rising demand for PE/VC funds on the secondary market. Sixty percent of PEs in LP received special preferential deals not listed in the fund agreements. The valuation of the invested projects made by PEs in GPs became more reasonable in 2013 (CVCA, 2014). The default ratio of capital commitments of PEs in LP increased significantly from 2012 (CVCA, 2014). Over 40 percent of PEs in GP hold stakes transferred from PEs in LPs which the PEs in GP managed. The number of funds flowing from PEs to M&A deals (CVCA, 2014). With the Shanghai and Qianhai Free Trade Zone established, it was estimated that funding from PEs/VCs would flow to the two free trade zones. It turns out that over 60 percent of PEs in GPs did not invest in Qianhai and Shanghai Free Trade Zone, while most PEs prefer to invest in Shanghai Free Trade Zone than in Qianhai Free Trade Zone (CVCA, 2014). The SOE reform projects and financing start-ups represent the most valuable investments made by PEs (CVCA, 2014). Meanwhile, biomedical industries remain “in the spotlight” for PE investments (CVCA, 2014). PE funding flowing to IPOs in HKSE (Main Board) became the preference for PE funding exits (CVCA, 2014). The estimation made by the CVCA (2014) indicated that PEs and VCs are going to continue in diversifying their investment portfolios. 2.1.6 Finance Companies and Finance Leasing Companies Finance companies were set up in the 1980s to meet the financing and liquidity needs within businesses groups. There are several traditional formats of financing firms. It involves He Hui (ROSCAs), money houses, non-governmental investment alliances, enterprise inter-lending between firms within the same business union, trader’s credit, nongovernmental loans, rural mutual saving funds, usury, underlying capital companies, informal note discounting, etc. In Sep. 2004, the CBRC issued Rules governing finance companies affiliated to business groups, lowering the standard for market entry and neatening their business scope (Tong, 2008). The new rules also allows eligible foreign investors to establish their own finance companies, or acquire equity in the Chinese finance companies, with each investor holds no more than 20 percent of the equity (Tong, 2008). 2.1.6.1 Hehui (Rotating Saving Credit Association or ROSCA) Hehui are the type of informal financing organization very active in Zhejiang, Fujian and Guangdong. Hehui
19
is a lower type of informal financial organization, with a history of over thousands of years before the appearance of RCCs. It adopts from a form of cooperation and mutual aid based on regional and familial relationships. Hehui mainly existed in rural areas. Hehui were easily formed when farmers living in the same village know each other for generations establish regional and consanguinity relationships (Jiang, 2009). The general rules of Hehui are as follows: The “head” of Hehui organizes a certain number of persons who comprise the “foot” of Hehui. Every person supplies promissory money regularly, usually maybe every month, every quarter, every half a year or every year (Jiang, 2009). In each period, the collected money from all the members can finance one of the rural rotating savings and credit association (ROSCA) members. The ways to determine the amount of credit allocated are drawing cuts and bidding on the interest rate (Jiang, 2009). The member who uses the credit from Hehui in the first several rounds needs to pay back the same amount of money needs to pay back the same amount of money to one member each time in subsequent rounds. These are the “installments” and for the person who uses the money later. The borrower can get an amount of money that nearly equals the total number of “installments” he or she lent out in the previous rounds; this is similar to small savings for a lump-sum withdraw later (Jiang, 2009). Hehui is usually a temporary organization and after every member is financed by the ROSCA, the Hehui ended. There are many types of Hehui, such as Biaohui, Bahui, Lunhui, Yaohui, Taihui, etc. In a Biaohui or Bahui, the person who can obtain the money in each round is decided by bidding on the interest rate after the first period (Jiang, 2009). The first withdraw is usually made by the “head” of the Biaohui. The person with the highest withdraw will get the right to use the money in the following rounds(Jiang, 2009). In the following rounds, members stopped from supplying the money as the “head” promised to pay back the principle and the interest to members involved in the Biaohui or Bahui. The Biaohui or Bahui are usually formed between family and friends as it takes a lot trust between members to form such an organization (Jiang, 2009). In a Lunhui, the members decide the sequence of credit allocations in advance. There are usually 6 to 10 members in a Lunhui, with the sustaining period between 6 and 12 months (Jiang, 2009). In a Yaohui, the sequence of credit allocation is determined by drawing cuts after the first round. In a Shouyuanhui, members save money every period and if a member dies, the Shouyuanhui pays his or her funeral back (Jiang, 2009). The members of Shouyuanhui are usually elderly or the elderly individuals’ relatives. Shouyuanhui functions like life insurance. The Taihui is larger organization, which consists of smaller hehui as feet of the big Taihui (Jiang, 2009). The small Hehui functions to support the big Taihui. The structure of Taihui looks like a pyramid (Jiang, 2009). In recent years, the aim of Hehui changes from serving as a mutual aid organization to a profit based one (Jiang, 2009). The farmers with disposable income prefer to invest in projects, which were directly related to people they know or were indirectly introduced by their relatives, friends or neighbors. Therefore, Hehui in rural areas are quite popular. 2.1.6.2 Money Houses The money house is also one of the oldest types of informal financing in China. Money houses were called “Yin Hao” in the southern part of China and “Qianzhuang” in the northern part of China before 1919 (Jiang, 2009). The function of money houses changed from currency exchange to credit business, such as loan making and taking deposits (Jiang, 2009). Money houses are getting restructured after Deng’s opening up policy. The PBoC then issued the “Provisional Regulations of Banking Administration” and forbids money houses (Baidu Wenku, 2015; Jiang, 2009). The PBoC has allowed three money houses to run in Wen Zhou on the condition that they operate without default., the money houses were closed by the PBoC once settlement issues appeared (Jiang, 2009). Compared with Hehui and private lending, money houses have the following advantages: the money house can supply much more credit than Hehui and private lending because it absorbs deposits from the public
20
(Jiang, 2009). They also do not have any time restrictions, as Hehui has. The money house is a for profit organization, therefore it has a business scope and extends business extension from credit transformation to foreign exchange or money laundering (Jiang, 2009). Money houses are popular in southern provinces in China, such as Jiangsu, Zhejiang, Fujian and Guangzhou, whereas the market economy is more developed. Therefore, there exist more private enterprises in these provinces, with these firms in these provinces usually have much stronger needs for credit. Investors in these provinces are usually cash rich and have more disposable income. When money houses carry out businesses related to foreign exchange or money laundering, it needs to be settled with money houses abroad (Jiang, 2009). Hence, coastal areas, which have easy access to international markets, are best for these money houses. Money houses are popular in Fujian Province, Yunnan Province and especially in the Shenzhen special economic zone (Jiang, 2009). The large volumes of RMB and foreign exchange (especially HKD) are exchanged through the money houses, loosening China’s restriction over the capital account (Jiang, 2009). Every year, there are more than RMB 100 million in exchange or capital flows (Xi Xiumei, Lin Wang, 2004; Jiang, 2009) 2.1.6.3 Non-governmental Investment Alliances, Enterprise Inner-lending, Trader’s Credit, Micro-governmental Loan Companies, Informal Note Discounting Since 2003, some nongovernmental investment alliances have appeared in Jiangsu and Zhejiang Province (Jiang, 2009). Several money suppliers formed an alliance to collect money and invest together. The profit or the loss is distributed according to the rules on the alliance contract. Industrial and commercial administrative departments did not authorize most of the investment alliances, except the well-known Wenzhou Real Estate Speculation Group (Jiang, 2009). Wen Zhou Speculations also spread to Water and Electricity, Car, Cotton, Coal, etc. The privately owned investment alliances developed fast, and the investment directions are turned to petroleum, finance and pubic utilities (Jiang, 2009). Non-government alliances have become an increasingly important way to enlarge private capital. All of the investment alliances have restricted access. They only accept their relatives, friends or fellow villagers (Jiang, 2009). Non-governmental credit alliances seldom accept members whom they are not familiar with. The investment alliance has been a rather modern form of informal finance. They evolved from family workshop to a limited company, to a joint stock limited corporation, then to a non-governmental investment alliance (Jiang, 2009). Residents in Jiangsu and Zhejiang have higher risk preferences than those of other provinces. Enterprise inner lending relationships is usually formed between firms belonging to the same commerce association or union of enterprises, in which the enterprises can borrow money from other provinces in the same association, avoiding information asymmetry between different firms (Jiang, 2009). Credit guarantee companies might act as the guarantor if the lender is not familiar with the borrower, with mortgages and securities as collateral. In 2004, there were more than 1000 guaranty companies in Zhe Jiang Province alone (Jiang, 2009). Informal note discounting means that a nonfinancial unit (the supplier of the note discounting service), buys the un-due commercial notes from enterprises and collects money from the discounter when the notes matures. Both an individual and an organization can offer informal note discounting services (Jiang, 2009). There are two reasons by which informal finance developed. First of all, the formal finance system do not offer sufficient note discounting services. The PBoC does not supply rediscount on banker’s acceptance drafts/notes (BADs) or commercial acceptance drafts/notes (CADs), while some of the SOBs prefer discount
21
within their system, making it difficult for small and medium sized banks to discount notes from them (Jiang, 2009). Also, getting credit by discounting BADs from the commercial banks is slow with loads of trivial procedures to go through (Jiang, 2009). The supplier of informal note discounting will provide cash to the discounter as long as the BADs or the CADs are true. The supplier of informal note discounting service does not require the enterprise to supply supporting documents. In 2002, there were 300 out of 4701 non-bank financial institution (NBFIs) which owned accounts at financial institutions, participated in informal note discounting (Jiang, 2009). The suppliers of informal note discounting service do not need to know much about the borrower or the discounter. What matters is the credit qualification of the payer or the acceptance institution (Jiang, 2009). The BADs rarely default, making the lending behavior between the supplier and the discounter much safer. The CADs are more risky, the risks of CADs depend on whether the acceptance enterprise is well-known or financially consolidated or not (Jiang, 2009). Informal note discounting mainly existed in Shandong, Jiangxi in the past. It has become widespread in southern provinces such as Zhejiang, Jiangsu, Fujian, Guangdong, Hubei, etc. (Jiang, 2009). Trader’s credit means business enterprises offer loans to their customers, and the customer repay the loan with products. Traders’ credit combines the credit and the business relationship (Jiang, 2009). The large SOEs are willing to do so since by doing this, they feel they know their customers’ financial situation, therefore lowering the borrowing risks. Trader’s credit exists in Southeast Asian countries, and other developing countries (Jiang, 2009). The Chinese government tried to benefit farmers and alleviate poverty by pushing “contract farming” (Jiang, Li, 2009). This model allows farmers to sign a contract with the company, allowing farmers to obtain seeds, instructions on technology, loans or guarantee support, with the farmer pay back the principal and interest with products in the future (Jiang, Li, 2009). This is important for farming with high costs and risks at the set ups stages. For instance, the cattle raising business supported by Meng Niu used this model to support farmers in Inner Monglia with farmers paying back the loan with milk (Jiang, Li, 2009). This business model is beneficial for both farmers to secure their income and for the agriculture firms, to secure their supply chain. However, there is no legal support for this type of business model. Hence when disputes occur, there is no official resolving mechanism (Jiang, Li, 2009). The PBoC tries to promote micro nongovernmental loan trial programs in Shanxi, Shannxi, Guizhou, and Sichuan provinces (Middle and West China). The main sources of informal lending come from rich local individuals or private entrepreneurs (Jiang, 2009). Most microcredit operate in the model of lending without taking any deposits. Microcredit mainly aimed at supporting farmers’ credit demand, and inducting financial innovation in the countryside, increasing the supply of rural finance, and promoting social harmony in the countryside. The challenge comes along with the microcredit model as formal rural credit institutions lack the impetus and experience in managing microloan companies. The private investors for the microcredit companies want to find a way to participate in the formal financial system. The transformation, however, cannot be easily done; as a few years earlier, RCCs have caused tremendous financial risks and social damages. Microloan companies still experienced significant expansion in their scale, amount, employees and funds managed, as indicated in Figure 7.
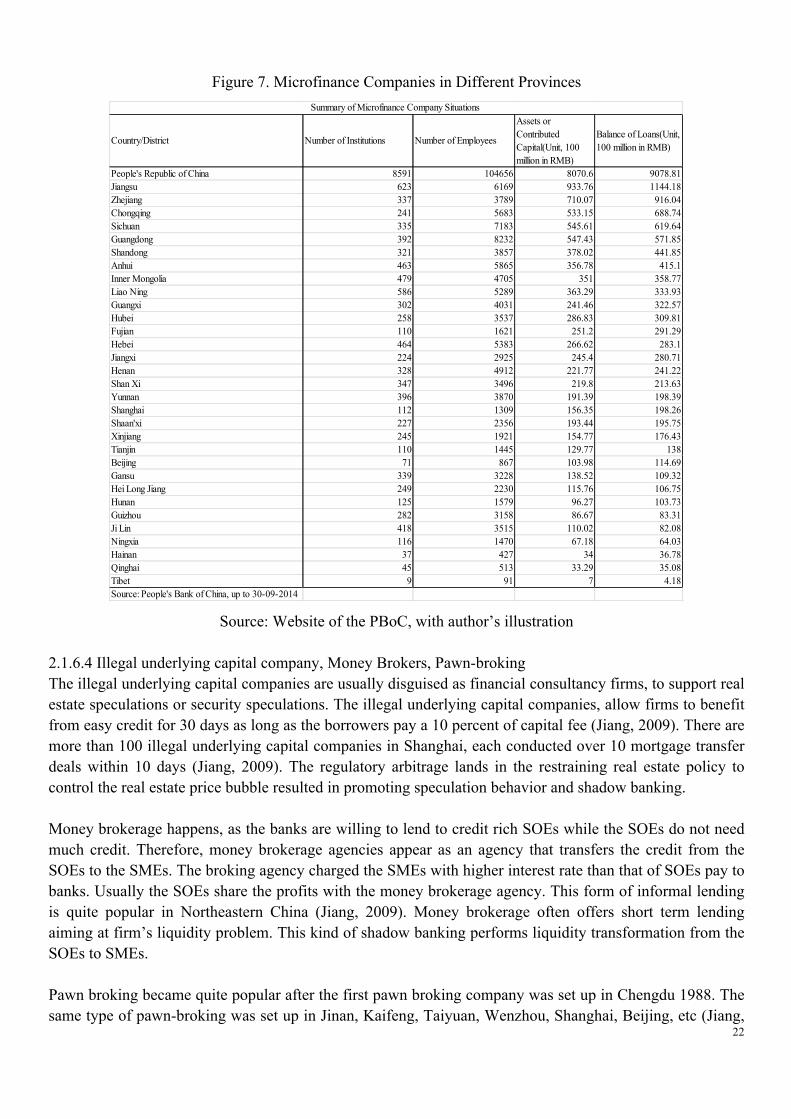
22
Figure 7. Microfinance Companies in Different Provinces
Source: Website of the PBoC, with author’s illustration
2.1.6.4 Illegal underlying capital company, Money Brokers, Pawn-broking The illegal underlying capital companies are usually disguised as financial consultancy firms, to support real estate speculations or security speculations. The illegal underlying capital companies, allow firms to benefit from easy credit for 30 days as long as the borrowers pay a 10 percent of capital fee (Jiang, 2009). There are more than 100 illegal underlying capital companies in Shanghai, each conducted over 10 mortgage transfer deals within 10 days (Jiang, 2009). The regulatory arbitrage lands in the restraining real estate policy to control the real estate price bubble resulted in promoting speculation behavior and shadow banking. Money brokerage happens, as the banks are willing to lend to credit rich SOEs while the SOEs do not need much credit. Therefore, money brokerage agencies appear as an agency that transfers the credit from the SOEs to the SMEs. The broking agency charged the SMEs with higher interest rate than that of SOEs pay to banks. Usually the SOEs share the profits with the money brokerage agency. This form of informal lending is quite popular in Northeastern China (Jiang, 2009). Money brokerage often offers short term lending aiming at firm’s liquidity problem. This kind of shadow banking performs liquidity transformation from the SOEs to SMEs. Pawn broking became quite popular after the first pawn broking company was set up in Chengdu 1988. The same type of pawn-broking was set up in Jinan, Kaifeng, Taiyuan, Wenzhou, Shanghai, Beijing, etc (Jiang,
Country/District Number of Institutions Number of Employees
Assets orContributedCapital(Unit, 100million in RMB)
Balance of Loans(Unit,100 million in RMB)
People's Republic of China 8591 104656 8070.6 9078.81Jiangsu 623 6169 933.76 1144.18Zhejiang 337 3789 710.07 916.04Chongqing 241 5683 533.15 688.74Sichuan 335 7183 545.61 619.64Guangdong 392 8232 547.43 571.85Shandong 321 3857 378.02 441.85Anhui 463 5865 356.78 415.1Inner Mongolia 479 4705 351 358.77Liao Ning 586 5289 363.29 333.93Guangxi 302 4031 241.46 322.57Hubei 258 3537 286.83 309.81Fujian 110 1621 251.2 291.29Hebei 464 5383 266.62 283.1Jiangxi 224 2925 245.4 280.71Henan 328 4912 221.77 241.22Shan Xi 347 3496 219.8 213.63Yunnan 396 3870 191.39 198.39Shanghai 112 1309 156.35 198.26Shaan'xi 227 2356 193.44 195.75Xinjiang 245 1921 154.77 176.43Tianjin 110 1445 129.77 138Beijing 71 867 103.98 114.69Gansu 339 3228 138.52 109.32Hei Long Jiang 249 2230 115.76 106.75Hunan 125 1579 96.27 103.73Guizhou 282 3158 86.67 83.31Ji Lin 418 3515 110.02 82.08Ningxia 116 1470 67.18 64.03Hainan 37 427 34 36.78Qinghai 45 513 33.29 35.08Tibet 9 91 7 4.18Source: People's Bank of China, up to 30-09-2014
Summary of Microfinance Company Situations
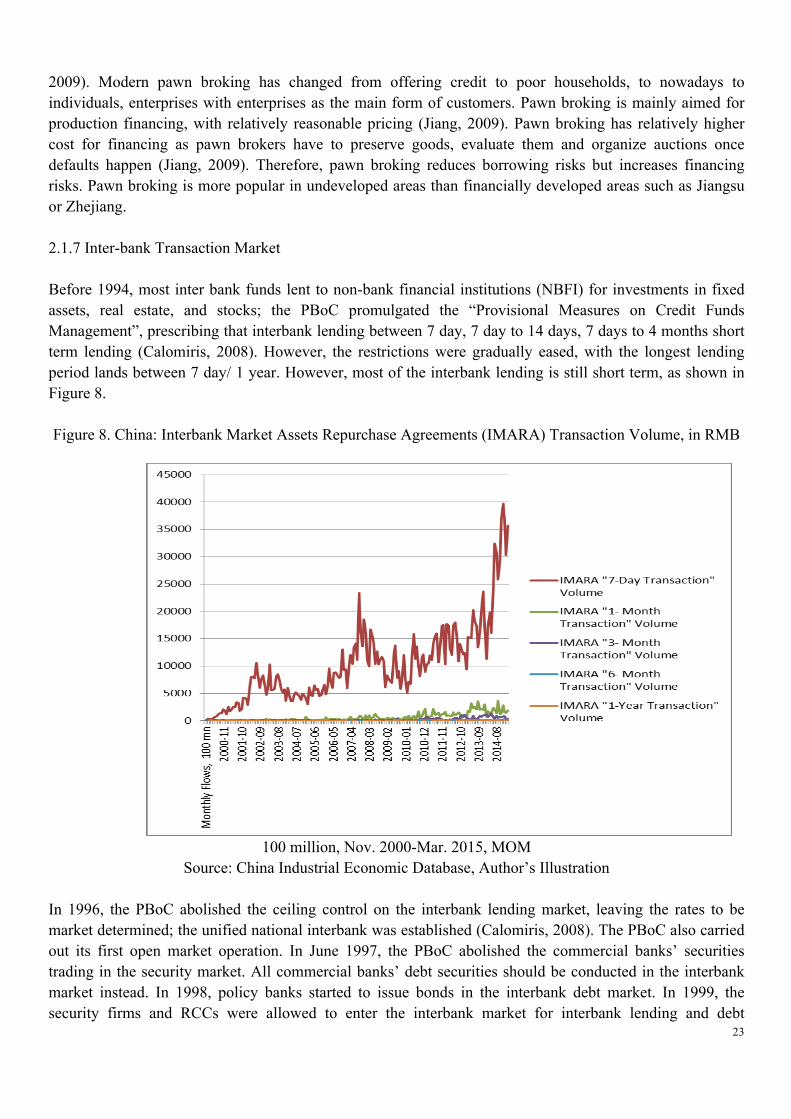
23
2009). Modern pawn broking has changed from offering credit to poor households, to nowadays to individuals, enterprises with enterprises as the main form of customers. Pawn broking is mainly aimed for production financing, with relatively reasonable pricing (Jiang, 2009). Pawn broking has relatively higher cost for financing as pawn brokers have to preserve goods, evaluate them and organize auctions once defaults happen (Jiang, 2009). Therefore, pawn broking reduces borrowing risks but increases financing risks. Pawn broking is more popular in undeveloped areas than financially developed areas such as Jiangsu or Zhejiang. 2.1.7 Inter-bank Transaction Market Before 1994, most inter bank funds lent to non-bank financial institutions (NBFI) for investments in fixed assets, real estate, and stocks; the PBoC promulgated the “Provisional Measures on Credit Funds Management”, prescribing that interbank lending between 7 day, 7 day to 14 days, 7 days to 4 months short term lending (Calomiris, 2008). However, the restrictions were gradually eased, with the longest lending period lands between 7 day/ 1 year. However, most of the interbank lending is still short term, as shown in Figure 8. Figure 8. China: Interbank Market Assets Repurchase Agreements (IMARA) Transaction Volume, in RMB
100 million, Nov. 2000-Mar. 2015, MOM Source: China Industrial Economic Database, Author’s Illustration
In 1996, the PBoC abolished the ceiling control on the interbank lending market, leaving the rates to be market determined; the unified national interbank was established (Calomiris, 2008). The PBoC also carried out its first open market operation. In June 1997, the PBoC abolished the commercial banks’ securities trading in the security market. All commercial banks’ debt securities should be conducted in the interbank market instead. In 1998, policy banks started to issue bonds in the interbank debt market. In 1999, the security firms and RCCs were allowed to enter the interbank market for interbank lending and debt

24
securities trading. The mutual fund companies were allowed access to the interbank market for debt security trading. In 2002, the entry standard in the inter-bank lending market has been lowered, with the registration system abolished with the records system set up. The number of participants increased from 245 to 945 (Calomiris, 2008). In 2004, the PBoC promulgated “Measures for Administration of the Issuance of Sub-ordinated Bond by Commercial Banks”; the BOC and the CCB were allowed to issue RMB 100 billion RMB bonds; in 2004, the banks issued RMB 66.07 billion worth of bonds. Over the years, the transactions volume in the interbank lending transaction market soared as indicated in Figure 9. The interbank OTC market has become one of the most popular financial markets for transactions involved shadow banking products, including the Banker’s acceptance notes.
Figure 9. IMARA Transaction Volume, MOM, 01/2000-03/2015, in RMB 100 million
Source: China Industrial Economic Database, Author’s Illustration
To summarize, the informal finance system supports individuals and private firms liberated from the People’s Commune system. Their urgent financing needs, plus the loosened market regulations over the financial markets, financial entities gave the shadow banking system a chance to boom during the period from 1990 till now. The complexity of the financial markets in China has increased with the inter-connectedness between different financial markets and financial institutions increased significantly as indicated in Figure 10. The credit chains created by the shadow banking entities are becoming longer, leverage ratio higher, with the shadow banking products representing more complex lending relationships. The financial risks embodied in the shadow banking system also increased. It is therefore necessary to identify the types of the modern types of the shadow banking and the risks attached to promote financial stability in China. Developing economies usually have a large share of informal economy. Traditional shadow banking or informal financing channels mainly support the informal economy. Their functions shifted from supporting

25
rural economic development to supporting firms, mostly privately owned, through credit arrangements and contracts with a higher interest than bank loans. Informal lending has been popular for SMEs, particularly in their initial setting up period (Li and Hsu, 2009). The informal banking sector is one that consists of alternative financing channels, governance mechanisms, and institutions (AQQ, 2015). It would be interesting to explore the ever-expanding shadow banking system in China.
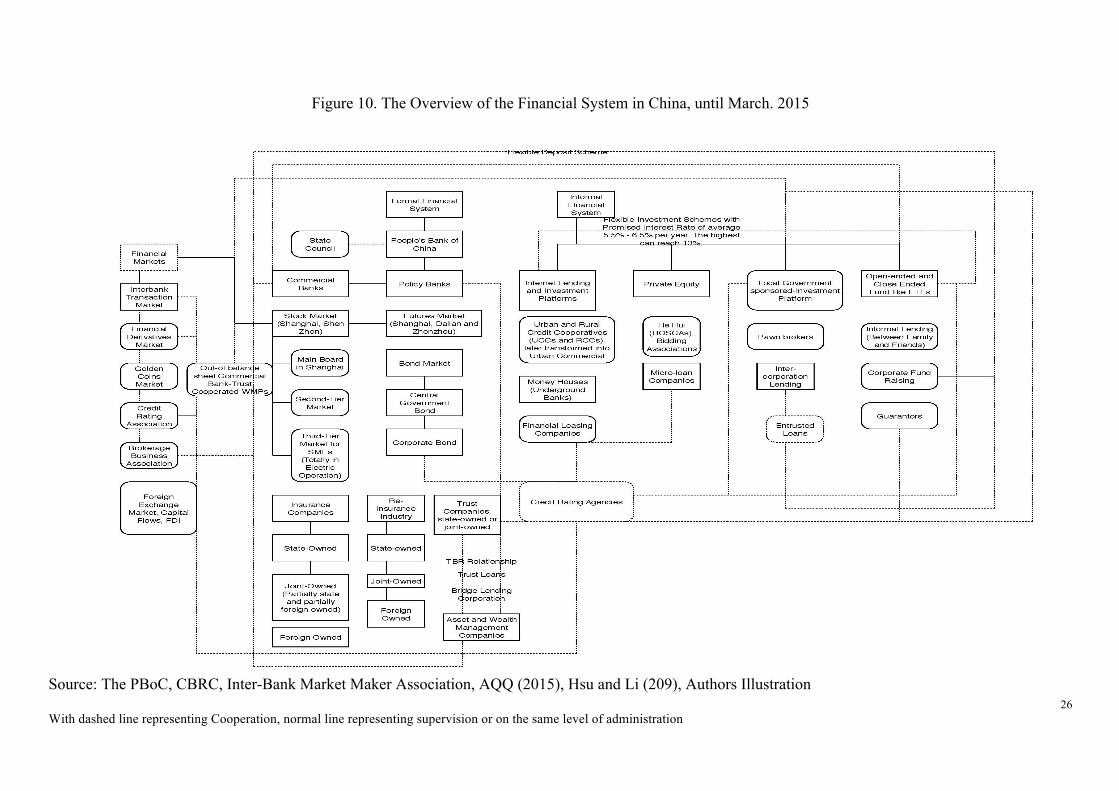
26 With dashed line representing Cooperation, normal line representing supervision or on the same level of administration
Figure 10. The Overview of the Financial System in China, until March. 2015
Source: The PBoC, CBRC, Inter-Bank Market Maker Association, AQQ (2015), Hsu and Li (209), Authors Illustration
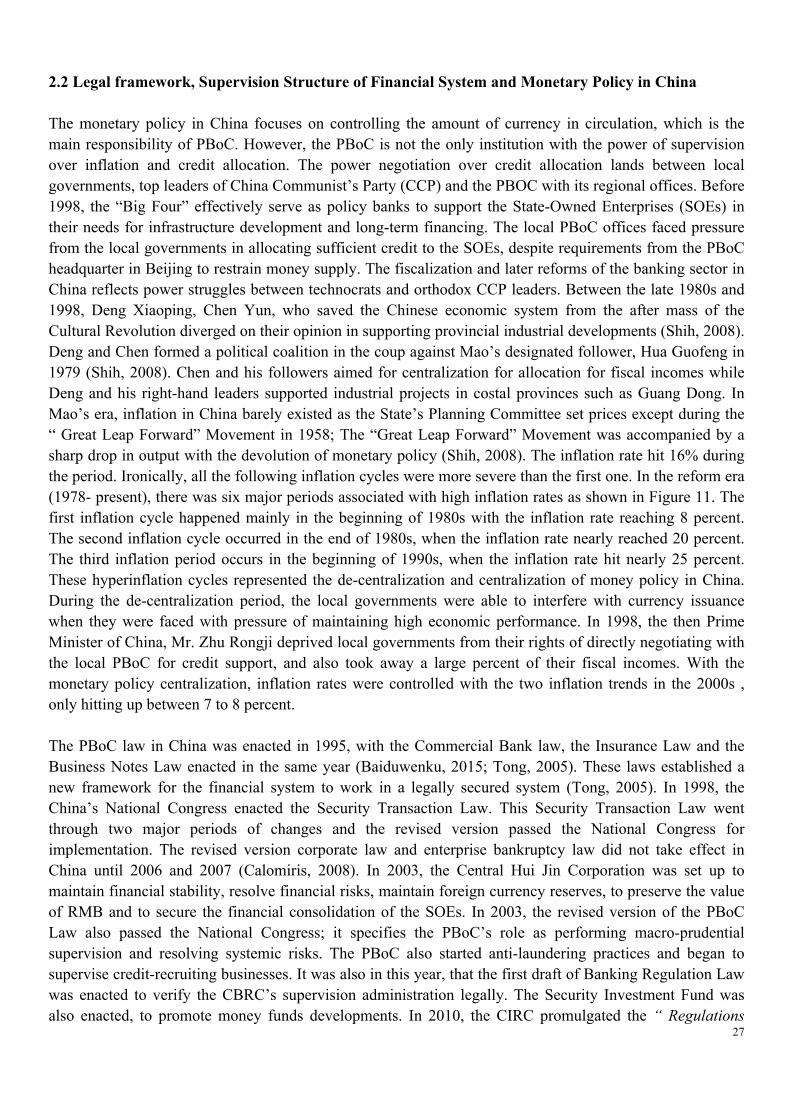
27
2.2 Legal framework, Supervision Structure of Financial System and Monetary Policy in China The monetary policy in China focuses on controlling the amount of currency in circulation, which is the main responsibility of PBoC. However, the PBoC is not the only institution with the power of supervision over inflation and credit allocation. The power negotiation over credit allocation lands between local governments, top leaders of China Communist’s Party (CCP) and the PBOC with its regional offices. Before 1998, the “Big Four” effectively serve as policy banks to support the State-Owned Enterprises (SOEs) in their needs for infrastructure development and long-term financing. The local PBoC offices faced pressure from the local governments in allocating sufficient credit to the SOEs, despite requirements from the PBoC headquarter in Beijing to restrain money supply. The fiscalization and later reforms of the banking sector in China reflects power struggles between technocrats and orthodox CCP leaders. Between the late 1980s and 1998, Deng Xiaoping, Chen Yun, who saved the Chinese economic system from the after mass of the Cultural Revolution diverged on their opinion in supporting provincial industrial developments (Shih, 2008). Deng and Chen formed a political coalition in the coup against Mao’s designated follower, Hua Guofeng in 1979 (Shih, 2008). Chen and his followers aimed for centralization for allocation for fiscal incomes while Deng and his right-hand leaders supported industrial projects in costal provinces such as Guang Dong. In Mao’s era, inflation in China barely existed as the State’s Planning Committee set prices except during the “ Great Leap Forward” Movement in 1958; The “Great Leap Forward” Movement was accompanied by a sharp drop in output with the devolution of monetary policy (Shih, 2008). The inflation rate hit 16% during the period. Ironically, all the following inflation cycles were more severe than the first one. In the reform era (1978- present), there was six major periods associated with high inflation rates as shown in Figure 11. The first inflation cycle happened mainly in the beginning of 1980s with the inflation rate reaching 8 percent. The second inflation cycle occurred in the end of 1980s, when the inflation rate nearly reached 20 percent. The third inflation period occurs in the beginning of 1990s, when the inflation rate hit nearly 25 percent. These hyperinflation cycles represented the de-centralization and centralization of money policy in China. During the de-centralization period, the local governments were able to interfere with currency issuance when they were faced with pressure of maintaining high economic performance. In 1998, the then Prime Minister of China, Mr. Zhu Rongji deprived local governments from their rights of directly negotiating with the local PBoC for credit support, and also took away a large percent of their fiscal incomes. With the monetary policy centralization, inflation rates were controlled with the two inflation trends in the 2000s , only hitting up between 7 to 8 percent. The PBoC law in China was enacted in 1995, with the Commercial Bank law, the Insurance Law and the Business Notes Law enacted in the same year (Baiduwenku, 2015; Tong, 2005). These laws established a new framework for the financial system to work in a legally secured system (Tong, 2005). In 1998, the China’s National Congress enacted the Security Transaction Law. This Security Transaction Law went through two major periods of changes and the revised version passed the National Congress for implementation. The revised version corporate law and enterprise bankruptcy law did not take effect in China until 2006 and 2007 (Calomiris, 2008). In 2003, the Central Hui Jin Corporation was set up to maintain financial stability, resolve financial risks, maintain foreign currency reserves, to preserve the value of RMB and to secure the financial consolidation of the SOEs. In 2003, the revised version of the PBoC Law also passed the National Congress; it specifies the PBoC’s role as performing macro-prudential supervision and resolving systemic risks. The PBoC also started anti-laundering practices and began to supervise credit-recruiting businesses. It was also in this year, that the first draft of Banking Regulation Law was enacted to verify the CBRC’s supervision administration legally. The Security Investment Fund was also enacted, to promote money funds developments. In 2010, the CIRC promulgated the “ Regulations
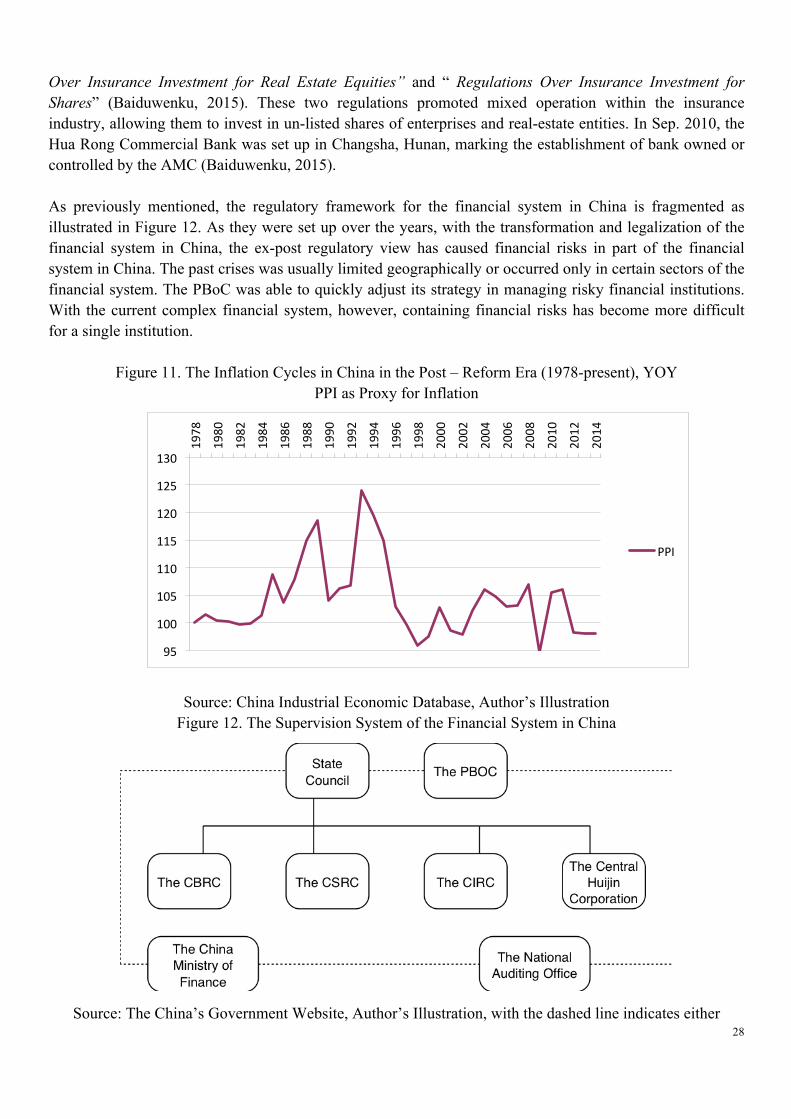
28
Over Insurance Investment for Real Estate Equities” and “ Regulations Over Insurance Investment for Shares” (Baiduwenku, 2015). These two regulations promoted mixed operation within the insurance industry, allowing them to invest in un-listed shares of enterprises and real-estate entities. In Sep. 2010, the Hua Rong Commercial Bank was set up in Changsha, Hunan, marking the establishment of bank owned or controlled by the AMC (Baiduwenku, 2015). As previously mentioned, the regulatory framework for the financial system in China is fragmented as illustrated in Figure 12. As they were set up over the years, with the transformation and legalization of the financial system in China, the ex-post regulatory view has caused financial risks in part of the financial system in China. The past crises was usually limited geographically or occurred only in certain sectors of the financial system. The PBoC was able to quickly adjust its strategy in managing risky financial institutions. With the current complex financial system, however, containing financial risks has become more difficult for a single institution.
Figure 11. The Inflation Cycles in China in the Post – Reform Era (1978-present), YOY PPI as Proxy for Inflation
Source: China Industrial Economic Database, Author’s Illustration
Figure 12. The Supervision System of the Financial System in China
Source: The China’s Government Website, Author’s Illustration, with the dashed line indicates either
95
100
105
110
115
120
125
130
1978
1980
1982
1984
1986
1988
1990
1992
1994
1996
1998
2000
2002
2004
2006
2008
2010
2012
2014
PPI
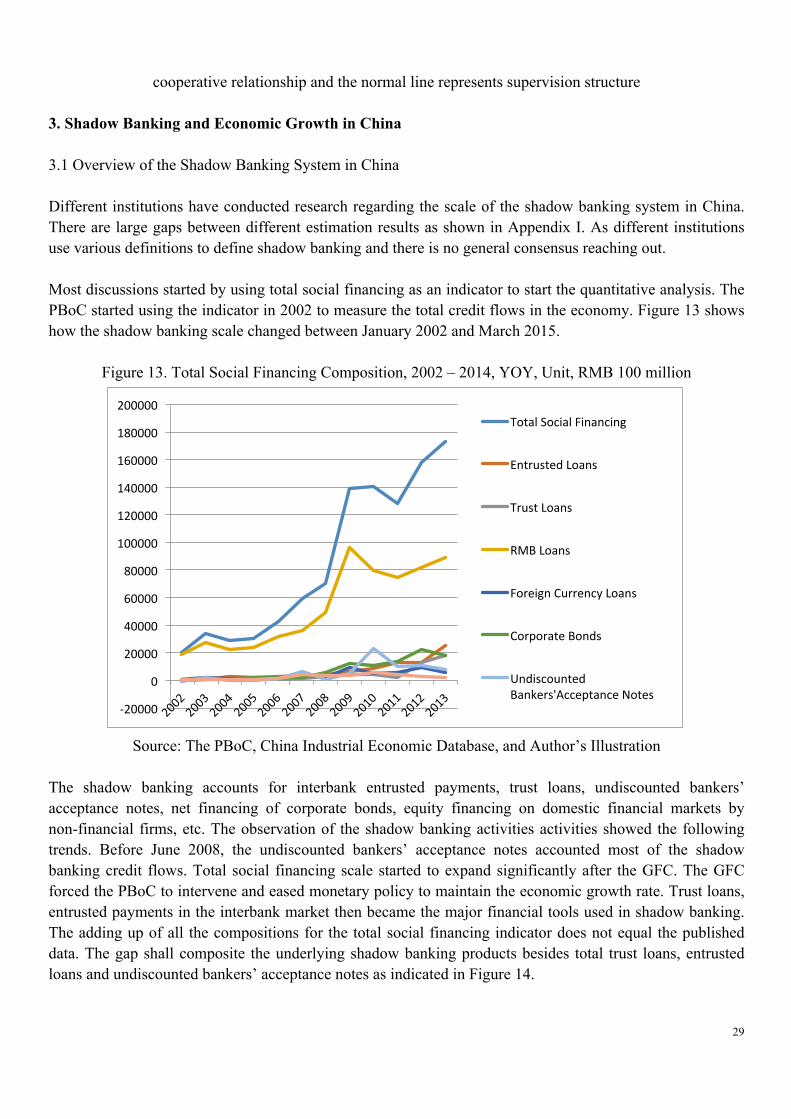
29
cooperative relationship and the normal line represents supervision structure
3. Shadow Banking and Economic Growth in China
3.1 Overview of the Shadow Banking System in China Different institutions have conducted research regarding the scale of the shadow banking system in China. There are large gaps between different estimation results as shown in Appendix I. As different institutions use various definitions to define shadow banking and there is no general consensus reaching out. Most discussions started by using total social financing as an indicator to start the quantitative analysis. The PBoC started using the indicator in 2002 to measure the total credit flows in the economy. Figure 13 shows how the shadow banking scale changed between January 2002 and March 2015.
Figure 13. Total Social Financing Composition, 2002 – 2014, YOY, Unit, RMB 100 million
Source: The PBoC, China Industrial Economic Database, and Author’s Illustration
The shadow banking accounts for interbank entrusted payments, trust loans, undiscounted bankers’ acceptance notes, net financing of corporate bonds, equity financing on domestic financial markets by non-financial firms, etc. The observation of the shadow banking activities activities showed the following trends. Before June 2008, the undiscounted bankers’ acceptance notes accounted most of the shadow banking credit flows. Total social financing scale started to expand significantly after the GFC. The GFC forced the PBoC to intervene and eased monetary policy to maintain the economic growth rate. Trust loans, entrusted payments in the interbank market then became the major financial tools used in shadow banking. The adding up of all the compositions for the total social financing indicator does not equal the published data. The gap shall composite the underlying shadow banking products besides total trust loans, entrusted loans and undiscounted bankers’ acceptance notes as indicated in Figure 14.
-‐20000
0
20000
40000
60000
80000
100000
120000
140000
160000
180000
200000 Total Social Financing
Entrusted Loans
Trust Loans
RMB Loans
Foreign Currency Loans
Corporate Bonds
Undiscounted Bankers'Acceptance Notes
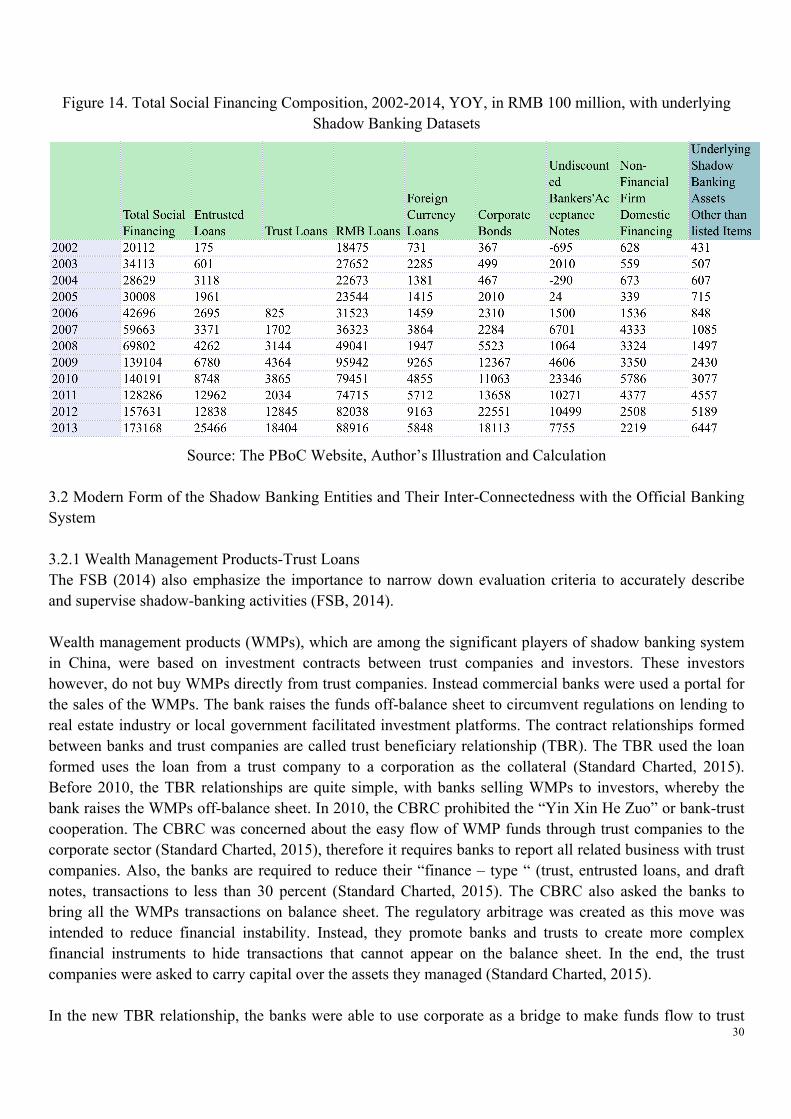
30
Figure 14. Total Social Financing Composition, 2002-2014, YOY, in RMB 100 million, with underlying
Shadow Banking Datasets
Source: The PBoC Website, Author’s Illustration and Calculation
3.2 Modern Form of the Shadow Banking Entities and Their Inter-Connectedness with the Official Banking System 3.2.1 Wealth Management Products-Trust Loans The FSB (2014) also emphasize the importance to narrow down evaluation criteria to accurately describe and supervise shadow-banking activities (FSB, 2014). Wealth management products (WMPs), which are among the significant players of shadow banking system in China, were based on investment contracts between trust companies and investors. These investors however, do not buy WMPs directly from trust companies. Instead commercial banks were used a portal for the sales of the WMPs. The bank raises the funds off-balance sheet to circumvent regulations on lending to real estate industry or local government facilitated investment platforms. The contract relationships formed between banks and trust companies are called trust beneficiary relationship (TBR). The TBR used the loan formed uses the loan from a trust company to a corporation as the collateral (Standard Charted, 2015). Before 2010, the TBR relationships are quite simple, with banks selling WMPs to investors, whereby the bank raises the WMPs off-balance sheet. In 2010, the CBRC prohibited the “Yin Xin He Zuo” or bank-trust cooperation. The CBRC was concerned about the easy flow of WMP funds through trust companies to the corporate sector (Standard Charted, 2015), therefore it requires banks to report all related business with trust companies. Also, the banks are required to reduce their “finance – type “ (trust, entrusted loans, and draft notes, transactions to less than 30 percent (Standard Charted, 2015). The CBRC also asked the banks to bring all the WMPs transactions on balance sheet. The regulatory arbitrage was created as this move was intended to reduce financial instability. Instead, they promote banks and trusts to create more complex financial instruments to hide transactions that cannot appear on the balance sheet. In the end, the trust companies were asked to carry capital over the assets they managed (Standard Charted, 2015). In the new TBR relationship, the banks were able to use corporate as a bridge to make funds flow to trust
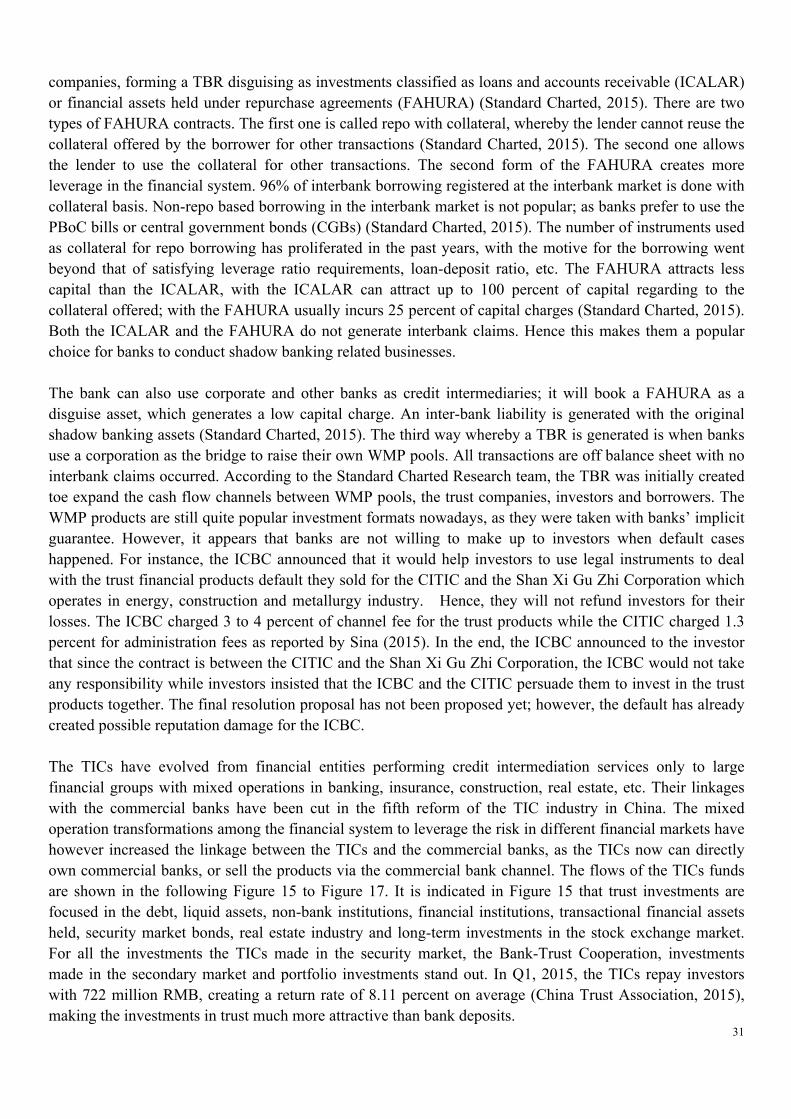
31
companies, forming a TBR disguising as investments classified as loans and accounts receivable (ICALAR) or financial assets held under repurchase agreements (FAHURA) (Standard Charted, 2015). There are two types of FAHURA contracts. The first one is called repo with collateral, whereby the lender cannot reuse the collateral offered by the borrower for other transactions (Standard Charted, 2015). The second one allows the lender to use the collateral for other transactions. The second form of the FAHURA creates more leverage in the financial system. 96% of interbank borrowing registered at the interbank market is done with collateral basis. Non-repo based borrowing in the interbank market is not popular; as banks prefer to use the PBoC bills or central government bonds (CGBs) (Standard Charted, 2015). The number of instruments used as collateral for repo borrowing has proliferated in the past years, with the motive for the borrowing went beyond that of satisfying leverage ratio requirements, loan-deposit ratio, etc. The FAHURA attracts less capital than the ICALAR, with the ICALAR can attract up to 100 percent of capital regarding to the collateral offered; with the FAHURA usually incurs 25 percent of capital charges (Standard Charted, 2015). Both the ICALAR and the FAHURA do not generate interbank claims. Hence this makes them a popular choice for banks to conduct shadow banking related businesses. The bank can also use corporate and other banks as credit intermediaries; it will book a FAHURA as a disguise asset, which generates a low capital charge. An inter-bank liability is generated with the original shadow banking assets (Standard Charted, 2015). The third way whereby a TBR is generated is when banks use a corporation as the bridge to raise their own WMP pools. All transactions are off balance sheet with no interbank claims occurred. According to the Standard Charted Research team, the TBR was initially created toe expand the cash flow channels between WMP pools, the trust companies, investors and borrowers. The WMP products are still quite popular investment formats nowadays, as they were taken with banks’ implicit guarantee. However, it appears that banks are not willing to make up to investors when default cases happened. For instance, the ICBC announced that it would help investors to use legal instruments to deal with the trust financial products default they sold for the CITIC and the Shan Xi Gu Zhi Corporation which operates in energy, construction and metallurgy industry. Hence, they will not refund investors for their losses. The ICBC charged 3 to 4 percent of channel fee for the trust products while the CITIC charged 1.3 percent for administration fees as reported by Sina (2015). In the end, the ICBC announced to the investor that since the contract is between the CITIC and the Shan Xi Gu Zhi Corporation, the ICBC would not take any responsibility while investors insisted that the ICBC and the CITIC persuade them to invest in the trust products together. The final resolution proposal has not been proposed yet; however, the default has already created possible reputation damage for the ICBC. The TICs have evolved from financial entities performing credit intermediation services only to large financial groups with mixed operations in banking, insurance, construction, real estate, etc. Their linkages with the commercial banks have been cut in the fifth reform of the TIC industry in China. The mixed operation transformations among the financial system to leverage the risk in different financial markets have however increased the linkage between the TICs and the commercial banks, as the TICs now can directly own commercial banks, or sell the products via the commercial bank channel. The flows of the TICs funds are shown in the following Figure 15 to Figure 17. It is indicated in Figure 15 that trust investments are focused in the debt, liquid assets, non-bank institutions, financial institutions, transactional financial assets held, security market bonds, real estate industry and long-term investments in the stock exchange market. For all the investments the TICs made in the security market, the Bank-Trust Cooperation, investments made in the secondary market and portfolio investments stand out. In Q1, 2015, the TICs repay investors with 722 million RMB, creating a return rate of 8.11 percent on average (China Trust Association, 2015), making the investments in trust much more attractive than bank deposits.
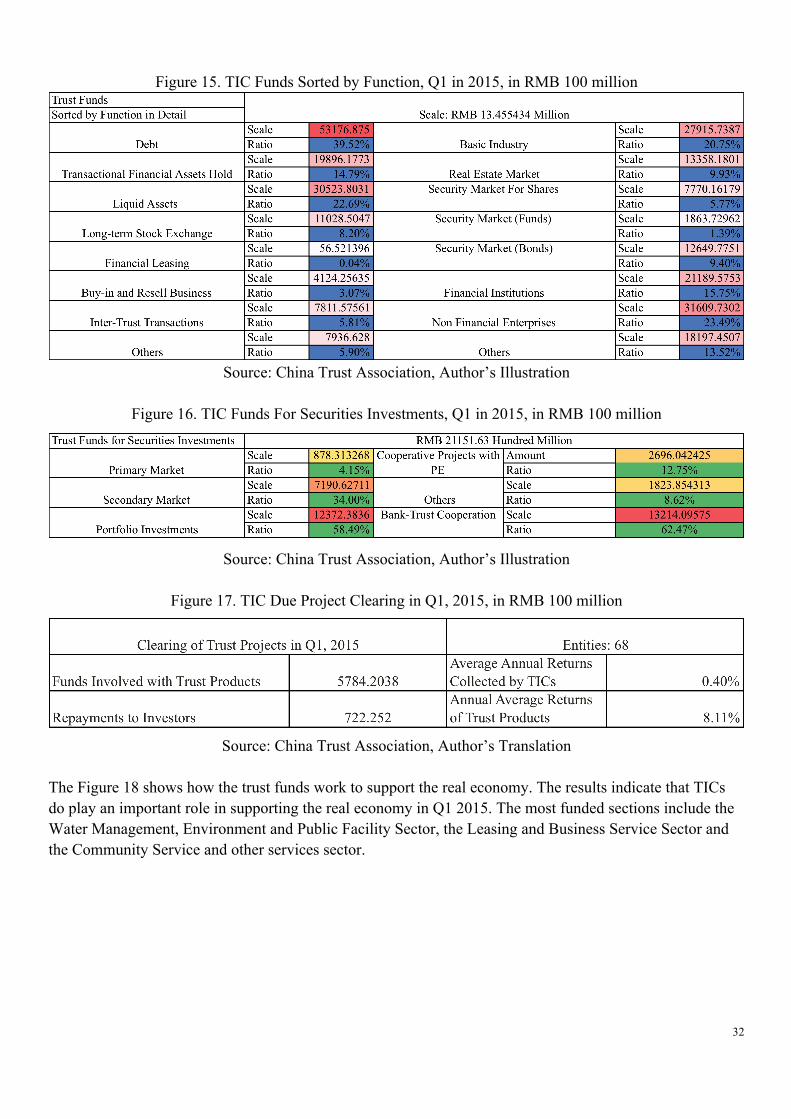
32
Figure 15. TIC Funds Sorted by Function, Q1 in 2015, in RMB 100 million
Source: China Trust Association, Author’s Illustration
Figure 16. TIC Funds For Securities Investments, Q1 in 2015, in RMB 100 million
Source: China Trust Association, Author’s Illustration
Figure 17. TIC Due Project Clearing in Q1, 2015, in RMB 100 million
Source: China Trust Association, Author’s Translation
The Figure 18 shows how the trust funds work to support the real economy. The results indicate that TICs do play an important role in supporting the real economy in Q1 2015. The most funded sections include the Water Management, Environment and Public Facility Sector, the Leasing and Business Service Sector and the Community Service and other services sector.
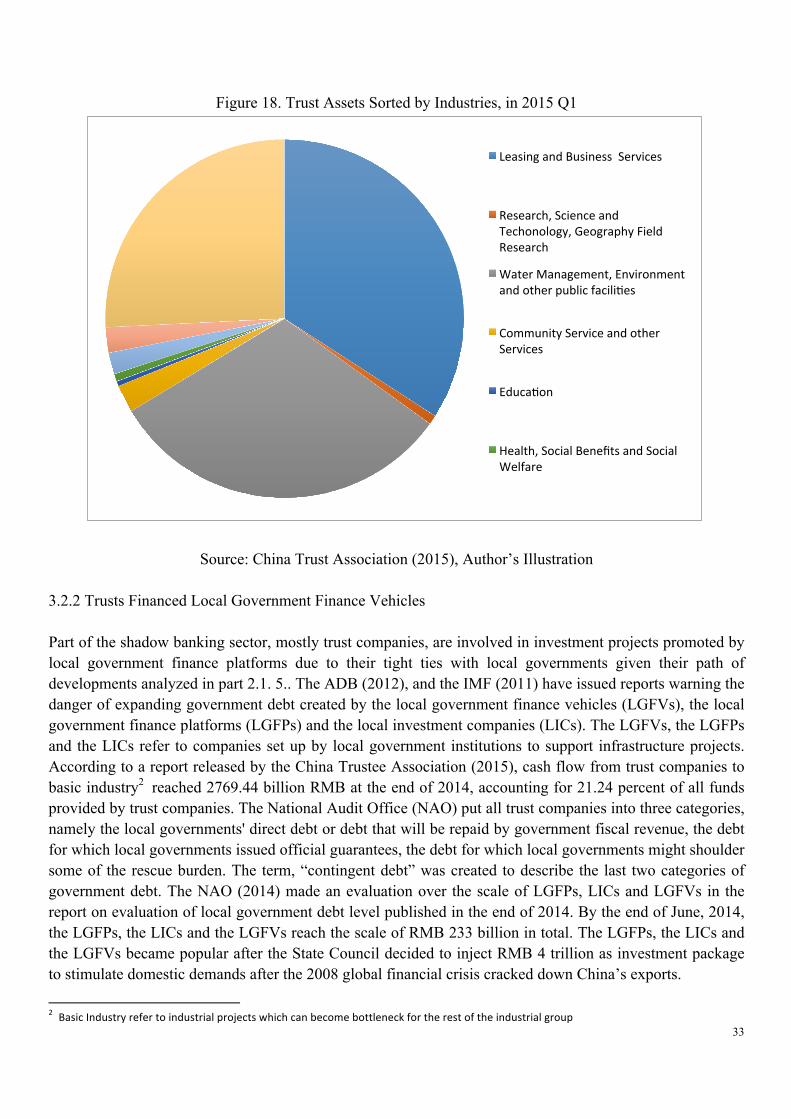
33
Figure 18. Trust Assets Sorted by Industries, in 2015 Q1
Source: China Trust Association (2015), Author’s Illustration
3.2.2 Trusts Financed Local Government Finance Vehicles Part of the shadow banking sector, mostly trust companies, are involved in investment projects promoted by local government finance platforms due to their tight ties with local governments given their path of developments analyzed in part 2.1. 5.. The ADB (2012), and the IMF (2011) have issued reports warning the danger of expanding government debt created by the local government finance vehicles (LGFVs), the local government finance platforms (LGFPs) and the local investment companies (LICs). The LGFVs, the LGFPs and the LICs refer to companies set up by local government institutions to support infrastructure projects. According to a report released by the China Trustee Association (2015), cash flow from trust companies to basic industry2 reached 2769.44 billion RMB at the end of 2014, accounting for 21.24 percent of all funds provided by trust companies. The National Audit Office (NAO) put all trust companies into three categories, namely the local governments' direct debt or debt that will be repaid by government fiscal revenue, the debt for which local governments issued official guarantees, the debt for which local governments might shoulder some of the rescue burden. The term, “contingent debt” was created to describe the last two categories of government debt. The NAO (2014) made an evaluation over the scale of LGFPs, LICs and LGFVs in the report on evaluation of local government debt level published in the end of 2014. By the end of June, 2014, the LGFPs, the LICs and the LGFVs reach the scale of RMB 233 billion in total. The LGFPs, the LICs and the LGFVs became popular after the State Council decided to inject RMB 4 trillion as investment package to stimulate domestic demands after the 2008 global financial crisis cracked down China’s exports.
2 Basic Industry refer to industrial projects which can become bottleneck for the rest of the industrial group
Leasing and Business Services
Research, Science and Techonology, Geography Field Research
Water Management, Environment and other public faciliVes
Community Service and other Services
EducaVon
Health, Social Benefits and Social Welfare
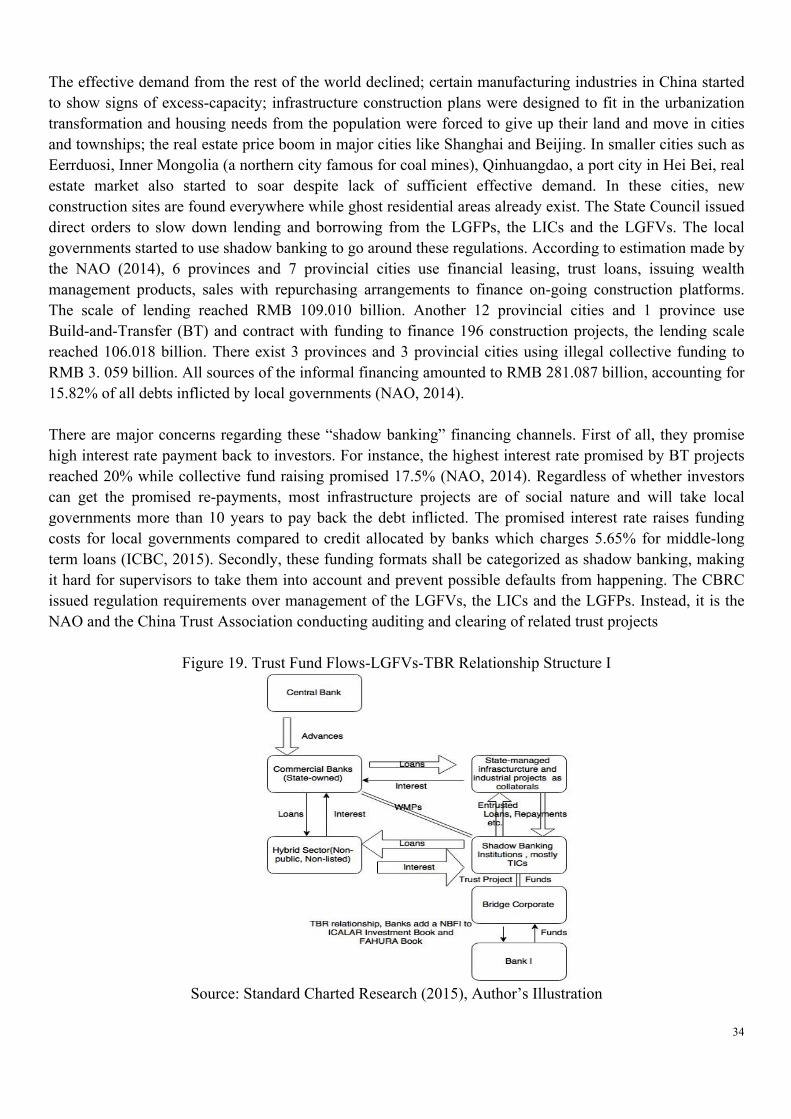
34
The effective demand from the rest of the world declined; certain manufacturing industries in China started to show signs of excess-capacity; infrastructure construction plans were designed to fit in the urbanization transformation and housing needs from the population were forced to give up their land and move in cities and townships; the real estate price boom in major cities like Shanghai and Beijing. In smaller cities such as Eerrduosi, Inner Mongolia (a northern city famous for coal mines), Qinhuangdao, a port city in Hei Bei, real estate market also started to soar despite lack of sufficient effective demand. In these cities, new construction sites are found everywhere while ghost residential areas already exist. The State Council issued direct orders to slow down lending and borrowing from the LGFPs, the LICs and the LGFVs. The local governments started to use shadow banking to go around these regulations. According to estimation made by the NAO (2014), 6 provinces and 7 provincial cities use financial leasing, trust loans, issuing wealth management products, sales with repurchasing arrangements to finance on-going construction platforms. The scale of lending reached RMB 109.010 billion. Another 12 provincial cities and 1 province use Build-and-Transfer (BT) and contract with funding to finance 196 construction projects, the lending scale reached 106.018 billion. There exist 3 provinces and 3 provincial cities using illegal collective funding to RMB 3. 059 billion. All sources of the informal financing amounted to RMB 281.087 billion, accounting for 15.82% of all debts inflicted by local governments (NAO, 2014). There are major concerns regarding these “shadow banking” financing channels. First of all, they promise high interest rate payment back to investors. For instance, the highest interest rate promised by BT projects reached 20% while collective fund raising promised 17.5% (NAO, 2014). Regardless of whether investors can get the promised re-payments, most infrastructure projects are of social nature and will take local governments more than 10 years to pay back the debt inflicted. The promised interest rate raises funding costs for local governments compared to credit allocated by banks which charges 5.65% for middle-long term loans (ICBC, 2015). Secondly, these funding formats shall be categorized as shadow banking, making it hard for supervisors to take them into account and prevent possible defaults from happening. The CBRC issued regulation requirements over management of the LGFVs, the LICs and the LGFPs. Instead, it is the NAO and the China Trust Association conducting auditing and clearing of related trust projects
Figure 19. Trust Fund Flows-LGFVs-TBR Relationship Structure I
Source: Standard Charted Research (2015), Author’s Illustration

35
Figure 19. 20, 21 indicates the ways by which trust loans help to facilitate the LGFVs and trust loans form a fund pool from the customers.
Figure 20. Trust Fund Flows-LGFVs-TBR Relationship Structure II
Source: Standard Charted Research, Author’s Presentation
Figure 19, 20, and 21 indicate that the TBR relationships formed between the TICs, the bridge-corporation and Bank I and Bank II created a short credit chain between TICs and the commercial banking sector. The bridge corporation functions as the intermediate for loans offered by banks to TICs, which was forbidden by the PBOC in 2010. The bank acted as the source for the credit chain, with the loans to TICs hiding as the FAHURA, the ICALAR in their accounting book or interbank liabilities. The credit expansion in the interbank market presented by Figure 8 and Figure 9 showed that most transactions in the interbank

36
repurchase markets are short-term, usually between 7 and 14 days. This raises the concern by which the default of the TICs might bring liquidity or insolvency risks for small and medium sized banks, which usually refer to the interbank market for credit to meet the requirements from the PBoC for loan-deposit ratio (LDR). The PBoC is planning on abolishing the DLR by the end of 2015 as reported by the Financial
Figure 21. Trust Fund Flows-LGFVs-TBR Relationship Structure III
Source: Standard Charted Research, Author’s Illustration
Times (2015). This DLR requirement for commercial did create a regulatory arbitrage for banks to lend in the interbank market with interbank liabilities created. The capital requirements from Basel III were implemented, as NPL ratio of all banking groups fell under 2 percent, as indicated in Figure 9. The qualities of weighted assets banks use to estimate the capital adequacy ratio (CAR or CRAR) are with a question mark. The reason is that the ICALAR, FAHURA and interbank liability assets were used to disguise with low risk equities, whereas they come with high risks, as trust funds were used to create turbulences in the stock market, the real estate market. The trust funds were also used to make investments in high-risk industries like coal mining, etc. The high risks are also associated with trust liabilities banks hold. The investments made in the financial market composite the major profit source for trust companies, with only 30 percent of profits from the investments made in the real economy. Therefore, the trusts and banks effectively act as competitors in that the financial market by offering similar financial services. This made the commercial banks are highly unlikely to resolve trust products related defaults even they serve as the sale portal for the WMPs. 4. Possible Default Scenarios 4.1 Past default scenarios 4.1.1 Shanxi Tailai Trust Default The China Trust Network reported about the default cases of trust products since 2002. As reported, investigations after the default happed showed the Shanxi Tailai Energy Investment Corporation has been using trust funds to create longer credit chains in the illegal private lending market. In order to fulfill the capital requirements from the trust company, the Shanxi Tailai Corporation consolidated its financial
37
position by borrowing funds from other companies and promised them to pay back loans after the trust funds were granted (China Trust Networks). The assets Tailai used as collateral for trust loans are coalmines, which do not have proper operation permits. The trust products Tailai involved in are of private equity nature, which leaves the chance for the trust products offered by Tailai and China SDIC Trust Co,ltd to survive(China Trust Network, 2013). 4.1.2 Jilin Trust Corporation- Nanjing Lianqiang Collective Trust Default The default case for “ Chang Bai Shan NO. 11” trust project happens as Ji Lin Xin Tuo delayed interest payments for 23 days (China Trust Network, 2013). The collateral “Chang Bai Shan NO. 11”used is the project in construction, the Nanjing Lianqinang International Mansion. The construction project experienced lack of funding in the beginning, when trust funds saved it from being transferred to other companies. The sale of the Mansion got detained due to the fluctuations in the real estate market, delaying the repayment of interest for investors. The Huarong Asset Management Corporation then intervened to save the trust from defaults (China Trust Network, 2013). 4.1.3 Dalian Shide Trust Default The entrusted loans created by Dalian Shide Trusts were used to fund real estate development projects. After half a year, the trust products default as Da Lian Shide Corporation, the parent company for Dalian Shide Materials Corporation are involved in legal disputes. The collateral of trust product “Chang Ying NO. 11” were frozen by court (China Trust Network, 2013). This leads to Hua Ao Trust to sue Da Lian Shide Corporation and request the ownership of the collateral assets and repayments of trust products (China Trust Network, 2013). To summarize, most default trust projects are related to appropriation for trust funds for investments in risky industries such as coal mining and real estate. The trust loans were offered to projects without detailed background and qualification check. Therefore, the assumption whereby trust loans and trust liabilities held by banks are associated with high risks is confirmed. 4.2 Possible Future Default Scenarios There are two possible default scenarios for the shadow banking products. First, the orderly default scenarios (Manulife Asset Management, 2014), whereby the PBoC allows occasional shadow banking projects and related financial assets to default without intervention. Most policy makers take this as the scenario with the highest possibility of happening. Second, the large-scale default scenario, which is destructive and can cause systemic risk for the whole financial system. This is what the regulators in China tried to prevent. The mixed operation financial institutions are creating longer credit chains, and increase the interconnectedness between different sectors in the financial market. The increased inter-connectedness represents higher risks and less financial stability. Therefore, the financial regulators in China need to focus more on prudential regulations and improve the weighted assets quality for the banking sector particularly to prevent contingent risks from spreading. The NPL ratio increases from the trust defaults are estimated to be between 5 percent to 30 percent for the banks assets. The losses created are estimated to land within the range of 4 percent to 24 percent. The range of losses for bank assets deriving from WMPs is within 0.1 percent and 5 percent (Elliott et al, Brookings Institution, 2015). Among all the risky assets, the assets associated with TBR relationships are classified as
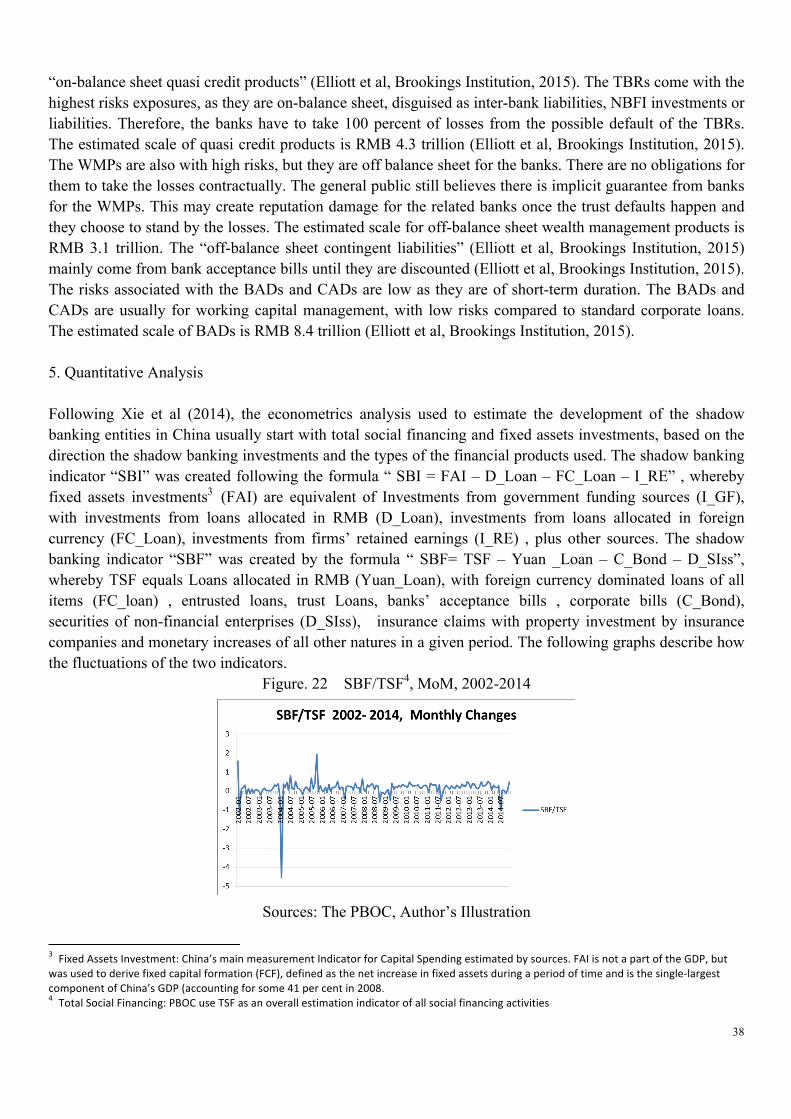
38
“on-balance sheet quasi credit products” (Elliott et al, Brookings Institution, 2015). The TBRs come with the highest risks exposures, as they are on-balance sheet, disguised as inter-bank liabilities, NBFI investments or liabilities. Therefore, the banks have to take 100 percent of losses from the possible default of the TBRs. The estimated scale of quasi credit products is RMB 4.3 trillion (Elliott et al, Brookings Institution, 2015). The WMPs are also with high risks, but they are off balance sheet for the banks. There are no obligations for them to take the losses contractually. The general public still believes there is implicit guarantee from banks for the WMPs. This may create reputation damage for the related banks once the trust defaults happen and they choose to stand by the losses. The estimated scale for off-balance sheet wealth management products is RMB 3.1 trillion. The “off-balance sheet contingent liabilities” (Elliott et al, Brookings Institution, 2015) mainly come from bank acceptance bills until they are discounted (Elliott et al, Brookings Institution, 2015). The risks associated with the BADs and CADs are low as they are of short-term duration. The BADs and CADs are usually for working capital management, with low risks compared to standard corporate loans. The estimated scale of BADs is RMB 8.4 trillion (Elliott et al, Brookings Institution, 2015). 5. Quantitative Analysis Following Xie et al (2014), the econometrics analysis used to estimate the development of the shadow banking entities in China usually start with total social financing and fixed assets investments, based on the direction the shadow banking investments and the types of the financial products used. The shadow banking indicator “SBI” was created following the formula “ SBI = FAI – D_Loan – FC_Loan – I_RE” , whereby fixed assets investments3 (FAI) are equivalent of Investments from government funding sources (I_GF), with investments from loans allocated in RMB (D_Loan), investments from loans allocated in foreign currency (FC_Loan), investments from firms’ retained earnings (I_RE) , plus other sources. The shadow banking indicator “SBF” was created by the formula “ SBF= TSF – Yuan _Loan – C_Bond – D_SIss”, whereby TSF equals Loans allocated in RMB (Yuan_Loan), with foreign currency dominated loans of all items (FC_loan) , entrusted loans, trust Loans, banks’ acceptance bills , corporate bills (C_Bond), securities of non-financial enterprises (D_SIss), insurance claims with property investment by insurance companies and monetary increases of all other natures in a given period. The following graphs describe how the fluctuations of the two indicators.
Figure. 22 SBF/TSF4, MoM, 2002-2014
Sources: The PBOC, Author’s Illustration
3 Fixed Assets Investment: China’s main measurement Indicator for Capital Spending estimated by sources. FAI is not a part of the GDP, but was used to derive fixed capital formation (FCF), defined as the net increase in fixed assets during a period of time and is the single-‐largest component of China’s GDP (accounting for some 41 per cent in 2008. 4 Total Social Financing: PBOC use TSF as an overall estimation indicator of all social financing activities
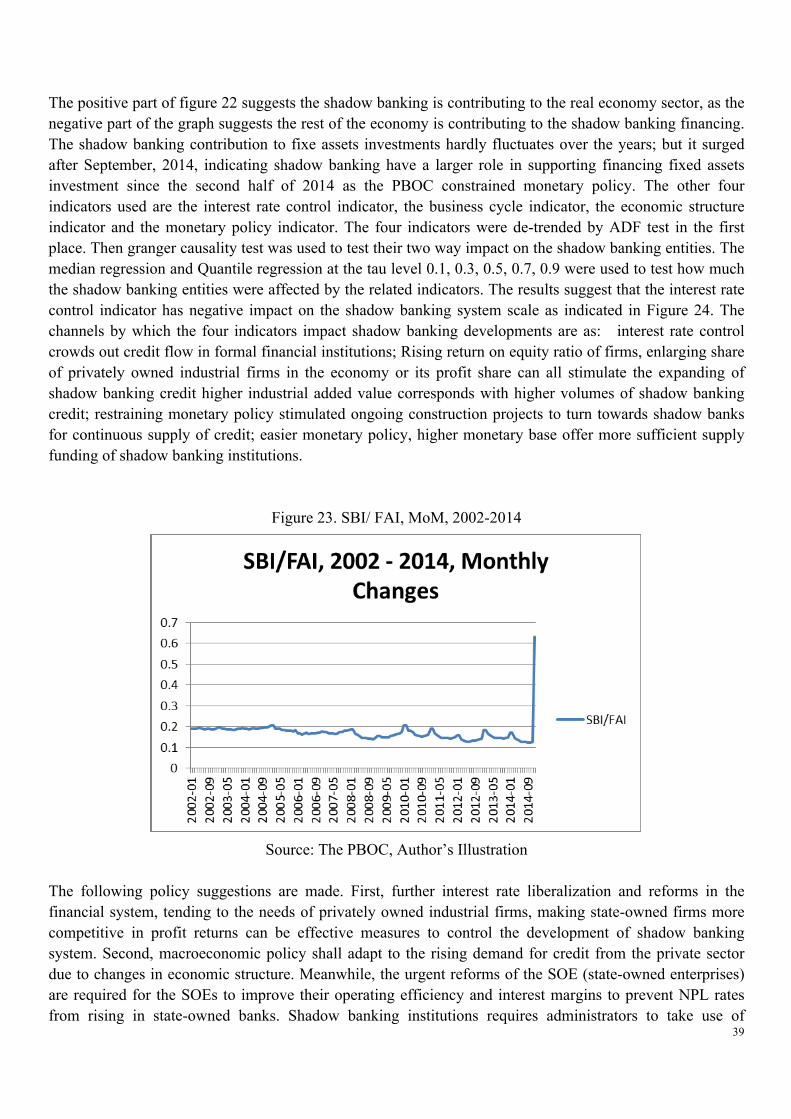
39
The positive part of figure 22 suggests the shadow banking is contributing to the real economy sector, as the negative part of the graph suggests the rest of the economy is contributing to the shadow banking financing. The shadow banking contribution to fixe assets investments hardly fluctuates over the years; but it surged after September, 2014, indicating shadow banking have a larger role in supporting financing fixed assets investment since the second half of 2014 as the PBOC constrained monetary policy. The other four indicators used are the interest rate control indicator, the business cycle indicator, the economic structure indicator and the monetary policy indicator. The four indicators were de-trended by ADF test in the first place. Then granger causality test was used to test their two way impact on the shadow banking entities. The median regression and Quantile regression at the tau level 0.1, 0.3, 0.5, 0.7, 0.9 were used to test how much the shadow banking entities were affected by the related indicators. The results suggest that the interest rate control indicator has negative impact on the shadow banking system scale as indicated in Figure 24. The channels by which the four indicators impact shadow banking developments are as: interest rate control crowds out credit flow in formal financial institutions; Rising return on equity ratio of firms, enlarging share of privately owned industrial firms in the economy or its profit share can all stimulate the expanding of shadow banking credit higher industrial added value corresponds with higher volumes of shadow banking credit; restraining monetary policy stimulated ongoing construction projects to turn towards shadow banks for continuous supply of credit; easier monetary policy, higher monetary base offer more sufficient supply funding of shadow banking institutions.
Figure 23. SBI/ FAI, MoM, 2002-2014
Source: The PBOC, Author’s Illustration
The following policy suggestions are made. First, further interest rate liberalization and reforms in the financial system, tending to the needs of privately owned industrial firms, making state-owned firms more competitive in profit returns can be effective measures to control the development of shadow banking system. Second, macroeconomic policy shall adapt to the rising demand for credit from the private sector due to changes in economic structure. Meanwhile, the urgent reforms of the SOE (state-owned enterprises) are required for the SOEs to improve their operating efficiency and interest margins to prevent NPL rates from rising in state-owned banks. Shadow banking institutions requires administrators to take use of
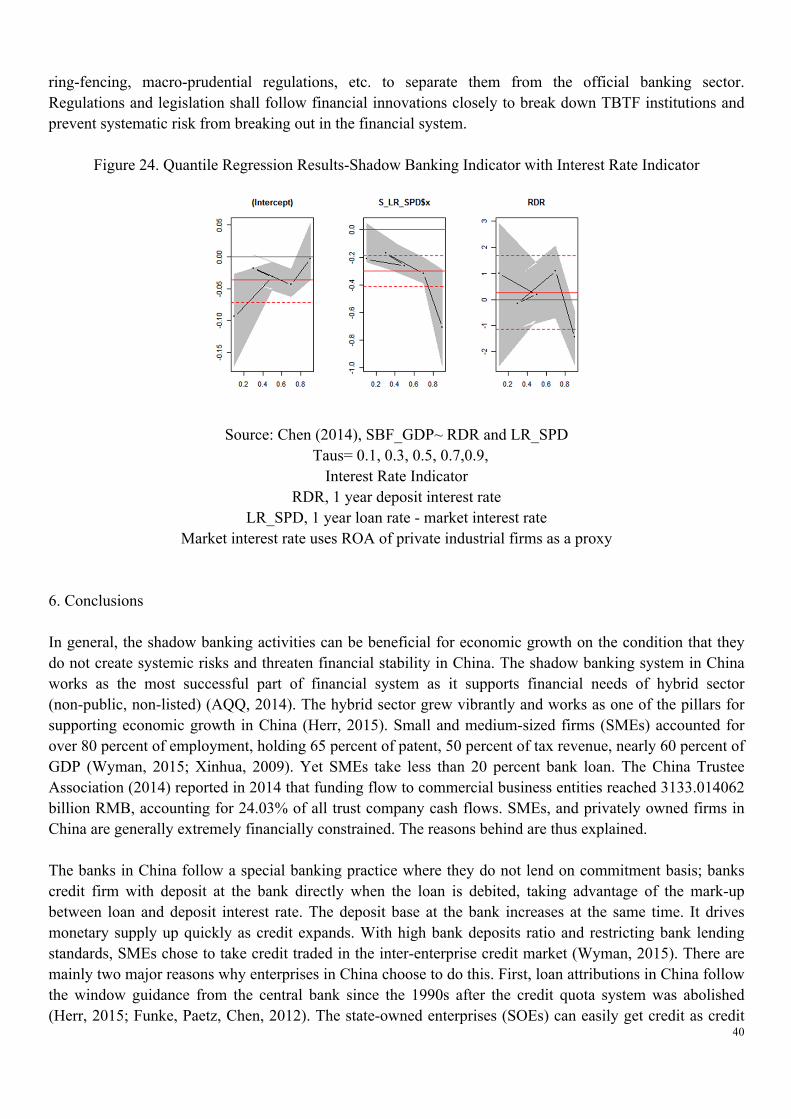
40
ring-fencing, macro-prudential regulations, etc. to separate them from the official banking sector. Regulations and legislation shall follow financial innovations closely to break down TBTF institutions and prevent systematic risk from breaking out in the financial system.
Figure 24. Quantile Regression Results-Shadow Banking Indicator with Interest Rate Indicator
Source: Chen (2014), SBF_GDP~ RDR and LR_SPD
Taus= 0.1, 0.3, 0.5, 0.7,0.9, Interest Rate Indicator
RDR, 1 year deposit interest rate LR_SPD, 1 year loan rate - market interest rate
Market interest rate uses ROA of private industrial firms as a proxy
6. Conclusions In general, the shadow banking activities can be beneficial for economic growth on the condition that they do not create systemic risks and threaten financial stability in China. The shadow banking system in China works as the most successful part of financial system as it supports financial needs of hybrid sector (non-public, non-listed) (AQQ, 2014). The hybrid sector grew vibrantly and works as one of the pillars for supporting economic growth in China (Herr, 2015). Small and medium-sized firms (SMEs) accounted for over 80 percent of employment, holding 65 percent of patent, 50 percent of tax revenue, nearly 60 percent of GDP (Wyman, 2015; Xinhua, 2009). Yet SMEs take less than 20 percent bank loan. The China Trustee Association (2014) reported in 2014 that funding flow to commercial business entities reached 3133.014062 billion RMB, accounting for 24.03% of all trust company cash flows. SMEs, and privately owned firms in China are generally extremely financially constrained. The reasons behind are thus explained. The banks in China follow a special banking practice where they do not lend on commitment basis; banks credit firm with deposit at the bank directly when the loan is debited, taking advantage of the mark-up between loan and deposit interest rate. The deposit base at the bank increases at the same time. It drives monetary supply up quickly as credit expands. With high bank deposits ratio and restricting bank lending standards, SMEs chose to take credit traded in the inter-enterprise credit market (Wyman, 2015). There are mainly two major reasons why enterprises in China choose to do this. First, loan attributions in China follow the window guidance from the central bank since the 1990s after the credit quota system was abolished (Herr, 2015; Funke, Paetz, Chen, 2012). The state-owned enterprises (SOEs) can easily get credit as credit
41
allocations were made through negotiation between commercial bank, local government and state-owned enterprises.. The SOEs customers can rely on trading credit with low or interest rate free loans for short-term credit needs. The aged SMEs from the manufacturing sector can take advantage of the trust relationship built (Wyman, 2015). Other SMEs still refer to shadow banking channels as their main sources of financing. The shadow banking entities increase the complexity of the financial system by adding to the inter-linkages between different financial markets. The short credit chains described in Section 2, 3 and 4 indicate that the shadow banking entities are not strong enough to create systemic risks. Their risks have been limited to specific sectors and financial industries. The current mixed operation transformations for the financial institutions are challenging the financial stability in China. Preventing the formation of the TBTFs, consolidating the weighted assets maintained by the commercial banks is the key to increase financial stability in China. Compared with the shadow banking system in developed economies, the shadow banking system in China are less mature, with shorter credit chains, less financial markets involved and less groups of financial products involved. The shadow banking system in China develop out of the same reason as that of the developed markets, to escape regulations over leverage ratio, capital adequacy. The shadow banking was given more credit in the financial system in China for supporting economic development than that of the developed economies. How the universal banks and TBTF institutions are getting established followed the same route as those in the US, the UK and in the Euro Zone. The commercial banks were threatened by competition from the shadow banking institutions; the regulations over separate operations between the investment banking sector and the investment banking sector were loosened; then commercial banks and the shadow banking entities compete for innovational products to circumvent regulations, higher leverage ratios and larger returns. It is hard to say right now whether the securitization of government assets, corporate bonds can spill the risks in the financial system over to the real economy. Due to limitations in the size of the thesis, more detailed discussions for the comparison of the shadow banking system in China and that of the developed economies are not possible. The conclusion is that more close observations need to be made over the financial system and the shadow banking entities in China. Only by establishing a supervision structure focusing more on macro-prudential regulations, ring-fencing and cracking down TBTF financial institutions, can financial stability be maintained in China.
42
List of References Asia Development Bank (2012) , Public Debt Sustainability in Asia, ADB Publications, available at: http://www.adb.org/publications/public-debt-sustainability-developing-asia AQQ, F. Allen, J. Qian, China’s Financial System and the Law, Cornell International Law Journal Vol. 47 (2014) , pp 499. Baidu Wenku (2012), on the Financial Reform History (1979-2013), available at http://www.reformdata.org/content/20121105/1296.html Bank of Finland, Q. Chen, M. Funke , M. Paetz (2012), Market and non-market monetary policy tools in a calibrated DSGE model for mainland China, BOFIT Discussion Papers, NO. 16, 2012, available online: http://www.uni-hamburg.de/fachbereiche-einrichtungen/fb03/iwwt/makro/ChinaDSGE.pdf BIS (2015), Statistics on OTC Derivatives, available at http://www.bis.org/statistics/derstats.htm BIS(2014), Muhamad Amar MOHD FARID1, Monitoring shadow banking and its challenges: the Malaysian experience; Available from: https://www.bis.org/ifc/events/6ifcconf/mohdfarid.pdf C. W. Calomiris (2007), China’s Financial Transition at a Crossroad, Columbia Press, 2007,United States, pp. 105-109, online available at: https://books.google.de/books?id=Tb85ee5BVfwC&pg=PA109&lpg=PA109&dq=urban+credit+cooperative+PBOC&source=bl&ots=jkfHy7m_So&sig=Z_ull5t8JkJs2sKbM8LoAonKSrI&hl=en&sa=X&ei=aCSKVaKzHajW7QaQs7noDQ&ved=0CDYQ6AEwBQ#v=onepage&q=urban%20credit%20cooperative%20PBOC&f=false Central University of Finance of Economics. 2004, The legalization of private placement fund -the Direction of market development Online. Available from: http://finance.sina.com.cn/jjzj/20040729/0957909556, June 25th, 2015. CVCA Releases (2014), China VC/PE Industry Survey Report 2013-2014, (4rd Annual Edition), available online at: http://www.cvca.org.cn/mail2014/publications/VCPE2014_en_n.htm China Trust Association, 2015, Report on Trust Industry in China, available at http://finance.sina.com.cn/g/20040302/0751652154.shtml, last access: June 28th, 2015 China Trust Network, 2013, Report on 24 Default Trust Cases in China, available in Chinese at: http://www.zhongguoxintuo.com/xtgsda/4475.html Chen Nuoya (2014), Evaluating shadow banking scale in China with empirical study of Year, 2002-2014, Universite Paris XIII, 2014 D. Eliott, Q. Yu (2015), Reforming the Shadow Banking System in China, The Brookings Institution, May
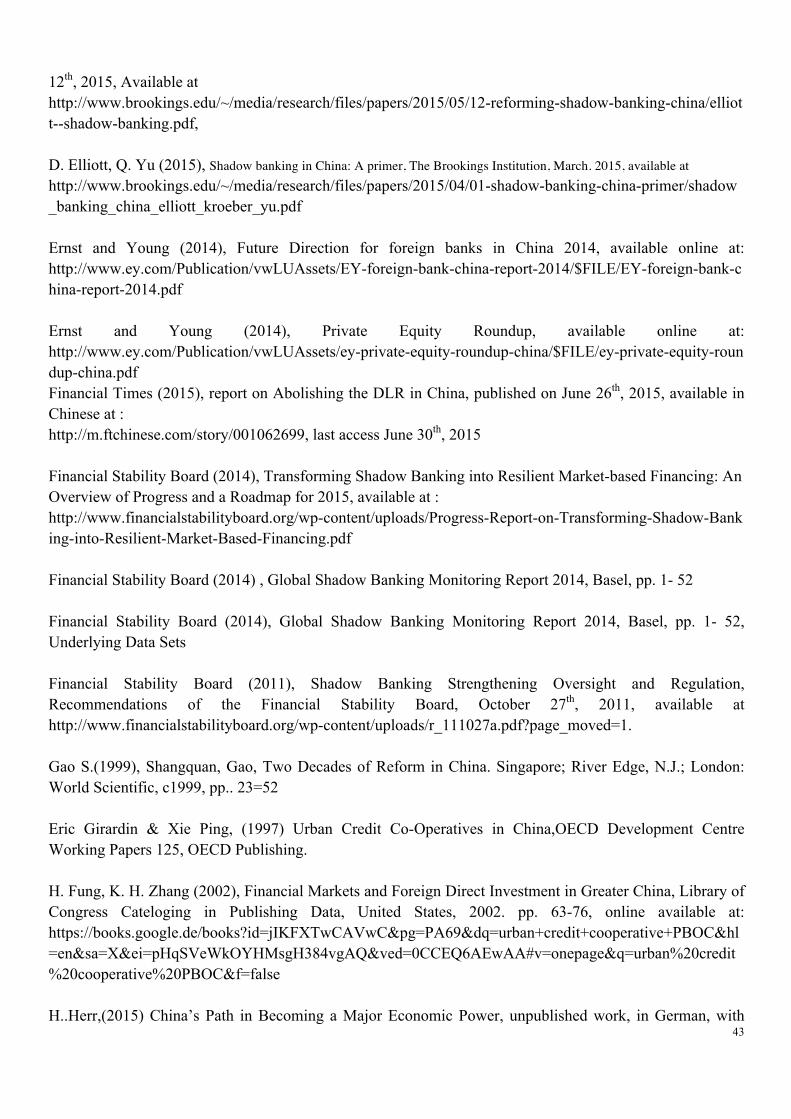
43
12th, 2015, Available at http://www.brookings.edu/~/media/research/files/papers/2015/05/12-reforming-shadow-banking-china/elliott--shadow-banking.pdf, D. Elliott, Q. Yu (2015), Shadow banking in China: A primer, The Brookings Institution, March. 2015, available at http://www.brookings.edu/~/media/research/files/papers/2015/04/01-shadow-banking-china-primer/shadow_banking_china_elliott_kroeber_yu.pdf Ernst and Young (2014), Future Direction for foreign banks in China 2014, available online at: http://www.ey.com/Publication/vwLUAssets/EY-foreign-bank-china-report-2014/$FILE/EY-foreign-bank-china-report-2014.pdf Ernst and Young (2014), Private Equity Roundup, available online at: http://www.ey.com/Publication/vwLUAssets/ey-private-equity-roundup-china/$FILE/ey-private-equity-roundup-china.pdf Financial Times (2015), report on Abolishing the DLR in China, published on June 26th, 2015, available in Chinese at : http://m.ftchinese.com/story/001062699, last access June 30th, 2015 Financial Stability Board (2014), Transforming Shadow Banking into Resilient Market-based Financing: An Overview of Progress and a Roadmap for 2015, available at : http://www.financialstabilityboard.org/wp-content/uploads/Progress-Report-on-Transforming-Shadow-Banking-into-Resilient-Market-Based-Financing.pdf Financial Stability Board (2014) , Global Shadow Banking Monitoring Report 2014, Basel, pp. 1- 52 Financial Stability Board (2014), Global Shadow Banking Monitoring Report 2014, Basel, pp. 1- 52, Underlying Data Sets Financial Stability Board (2011), Shadow Banking Strengthening Oversight and Regulation, Recommendations of the Financial Stability Board, October 27th, 2011, available at http://www.financialstabilityboard.org/wp-content/uploads/r_111027a.pdf?page_moved=1. Gao S.(1999), Shangquan, Gao, Two Decades of Reform in China. Singapore; River Edge, N.J.; London: World Scientific, c1999, pp.. 23=52 Eric Girardin & Xie Ping, (1997) Urban Credit Co-Operatives in China,OECD Development Centre Working Papers 125, OECD Publishing. H. Fung, K. H. Zhang (2002), Financial Markets and Foreign Direct Investment in Greater China, Library of Congress Cateloging in Publishing Data, United States, 2002. pp. 63-76, online available at: https://books.google.de/books?id=jIKFXTwCAVwC&pg=PA69&dq=urban+credit+cooperative+PBOC&hl=en&sa=X&ei=pHqSVeWkOYHMsgH384vgAQ&ved=0CCEQ6AEwAA#v=onepage&q=urban%20credit%20cooperative%20PBOC&f=false H..Herr,(2015) China’s Path in Becoming a Major Economic Power, unpublished work, in German, with
44
translated version from Daniel Gillard, Feb. 2015 Hong Kong Stock Exchange (2015), Report on Shanghai-Hong Kong Stock Exchange, last update on June 30th, 2015 http://www.hkex.com.hk/chi/csm/chinaConnect.asp?LangCode=tc, last access 30/06/2015 Hong, Zhaohui, and Ying Yan (1997). Trust and investment corporations in China. No. 9706. Federal Reserve Bank of Cleveland. Hu, Bin and Zheng Liansheng. (2014). The Shadow Banking System: In a Non-traditional Credit Intermediation Perspective. [In Chinese.] In China Annual Financial Regulation and Supervision Report. Social Sciences Academic Press, May. Jiang, Xuzhao (2009). A comparative analysis of regional informal financial organizations in China. Chapter 4 of Informal Finance in China: American and Chinese Perspective, Oxford Press. IMF (2011), People’s Republic of China: Financial System Stability Assessment, IMF Country Report No. 11/321, Available at: http://www.imf.org/external/pubs/ft/scr/2011/cr11321.pdf, Nov. 2011 International Monetary Fund. (2014a), Global Financial Stability Report 2014. Washington, D.C.: IMF Publication Services, April 2014. Li, Jianjun & Hsu, Sara (ed.), (2009). "Informal Finance in China: American and Chinese Perspectives," OUP Catalogue, Oxford University Press, number 9780195380644, March. 2009 Lin (2011), "Foreign bank entry and firms’ access to bank credit: Evidence from China", 2011, Journal of Banking and Finance 35, 1000-1010 Manulife Asset Management (2014), China’s shadow banking system: Orderly defaults ahead, MAM-14/012B, published by Manulife Asset Management Co, ltd, 2014/04/02 People’s Bank of China. All-System Financing Aggregate Statistics in 2014. People’s Bank of China News, January, 29, 2015. National Audit Office (2014), Audition over Local Government Debt in 36 cities, available on NAO website in Chinese at: http://www.audit.gov.cn/n1992130/n1992150/n1992500/3291665.html, last access, June 30th, 2015 Xia. B (2014), Xia, Bin, et al. Private Equity Funds In China : a 20-year Overview, Green Library, pp. 17-63 Reuters (2015), Report on Local Government Debt Transformation Schedule at June 29th, 2015, Available at: http://cn.reuters.com/article/2015/06/29/idCNL4S0ZF1K420150629 Reuters (2015), Report on Government Bonds used as collateral for YSL at 12/05/2015, in Chinese, Available at: http://cn.reuters.com/article/2015/05/12/cn-dbt-idCNKBS0NX2PF20150512, last access 30/06/2015 Sina Finance (2015), Report on Financial Regulatory System in China on 20/08/2013, in Chinese, Available at: http://finance.sina.com.cn/zl/china/20130820/234316508853.shtml, last access 30/06/2015
45
Sina Finance (2015), Shareholder Structure on the BOC, the ICBC, the PCBC and the ABC in China, last update June 30th, 2015, available in Chinese at: http://money.finance.sina.com.cn/corp/view/vCI_HoldStockState.php?stockid=601988&stockholderid=80155513, last access 30/06/2015 Sina Finance (2015), Report on AMCs reform in China, report on March 2nd, 2004, available in Chinese at http://finance.sina.com.cn/g/20040302/0751652154.shtml, last access 30/06/2015 A. Sheng, C. Edelmann, C. Sheng, J. Hu (2015), Bringing light upon the shadow, a review of the Chinese
shadow banking sector, Oliver Wyman and Fung Global Institute
Shih. V. (2010), Interview by Institute of New Economic Thinking on Dangers of Capital Fleeting in China in Video, INET, 2010. Available online at: http://ineteconomics.org/video/interview/victor-shih-dangers-capital-fleeing-china Shih, V. (2008), Factions and Finance in China, Elite Conflict and Inflation, Cambridge Press. 2008. pp. 47-62 Sinha, Anand. 2013. “Regulation of Shadow Banking—Issues and Challenges.” Paper presented at an event organized by the Indian Merchants’ Chamber, Mumbai, January 7 Standard Charted Research (2015), W. Li, S. Wen, D. Yin, Shen, The expanding Interbank Universe, March 22nd, 2015, available at: research.standardchartered.com
Wall Street Journal (2013), “ Report on China's 'Shadow Banks' Fan Debt-Bubble Fears” , 25/06/2015, Available at: http://www.wsj.com/articles/SB10001424127887324637504578563570021019506 Xiaoqi (2014), beyongbrics, Nov. 20, 2014. Xiaoqi: Blog. Available from: http://blogs.ft.com/beyond-brics/2014/11/20/guest-post-chinas-shadow-finance-risks-start-to-ebb/ Xi, Xiumei and Lin Wang, (2004). The way for Fnformal Finance and Macro-economy in China. Beijing: China Financial Publishing House. Xie Fengmin, He Ling yun and Zhou Ying (2014), Evaluating Shadow Banking system in China with empirical evidence from 2002 to 20142 China University of Mining and Technology, The Theory and Practice of Finance and Economics (Volume 35, NO.187, Jan. 2014). National Statistics Science Fund Project. X. Tong (2005), Financial Services in China: The Past, Present and Future of a Changing Industry, China Knowledge Press, 2005. pp. 52-55 Zhou Xiaochuan, PBOC (2015), Opening up on Financial Accounts in China, Interview at the PBOC News Conference, reported by WallStreeNews on March 22nd. 2015, available in Chinese at: http://wallstreetcn.com/node/215562

46
Zheng (2015), The shadow banking system of China and International Cooperation, New Thinking and the New G20: Paper NO. 6, the Center for International Governance Innovation, available at: www.cigionline.org. Zoltan Pozsar, Tobias Adrian, Adam Ashcraft, Hayley Boesky (2010), Shadow Banking, Federal Reserve Bank of New York, Staff Report, NO. 458, July 2010
47
Appendix I
Figure 1. Evaluation Results of the Shadow Banking System in China
FSB(2014) USD 3 trillion, about RMB 12.8 trillion
Non-Banking Credit Intermediation
22% of GDP
Hu and Zheng (2014) RMB 27 trillion Broad Sense 47% of GDP
Li (2013) RMB 23.98 trillion, USD 3.9 trillion, until May, 2013
Shadow Banking Instrument View
44% of GDP
Wyman (2015)
31.2 trillion Systemic Risk View 53% of GDP
39.1 trillion Credit Intermediation View 67.7% of GDP
57.2 trillion Regulatory View 98.3% of GDP
Source: FSB (2014), Hu and Zheng (2014), Li (2013), Wyman (2015), Author’s Calculation Appendix II Econometrics Estimation Methods and Results List of factors and variables used Shadow Banking Indicator: SBF_GDP, demand side of shadow banking credit SBI_GDP, supply side of shadow banking credit SBF = social financing volume - loans provided in RMB - loans provided in foreign currency - securities by firms - bonds provided by non-financial firms SBI= Fixed Asset Investment - funding from national inverstment - domestic loans - foreign loans - retained earnings SBF_GDP= SBF/GDP SBI_GDP= SBI / GDP Interest Rate Indicator RDR, 1 year deposit rate LR_SPD, 1 year loan rate - market interest rate Market interest rate is presented as ROA of private industrial firms Economic structure Indicator PEAV_C , Hodrick-Prescott Filter of Private Enterprise Assets / National Enterprise Assets ROASPD= ROA from private owned firms - ROA of all enterprises
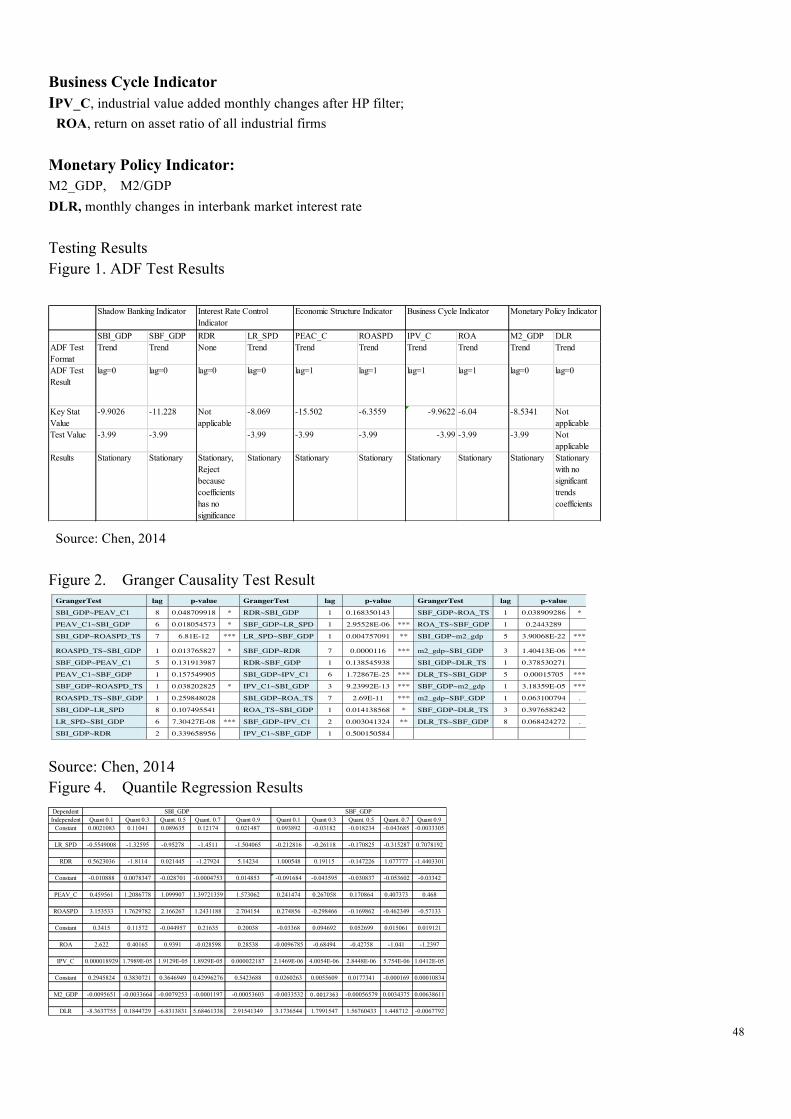
48
Business Cycle Indicator IPV_C, industrial value added monthly changes after HP filter; ROA, return on asset ratio of all industrial firms Monetary Policy Indicator: M2_GDP, M2/GDP DLR, monthly changes in interbank market interest rate Testing Results Figure 1. ADF Test Results
Source: Chen, 2014 Figure 2. Granger Causality Test Result
Source: Chen, 2014 Figure 4. Quantile Regression Results
SBI_GDP SBF_GDP RDR LR_SPD PEAC_C ROASPD IPV_C ROA M2_GDP DLRADF TestFormat
Trend Trend None Trend Trend Trend Trend Trend Trend Trend
ADF TestResult
lag=0 lag=0 lag=0 lag=0 lag=1 lag=1 lag=1 lag=1 lag=0 lag=0
Key StatValue
-9.9026 -11.228 -8.069 -15.502 -6.3559 -9.9622 -6.04 -8.5341 Notapplicable
Test Value -3.99 -3.99 -3.99 -3.99 -3.99 -3.99 -3.99 -3.99 Notapplicable
Results Stationary Stationary Stationary,Rejectbecausecoefficientshas nosignificance
Stationary Stationary Stationary Stationary Stationary Stationary Stationarywith nosignificanttrendscoefficients
Shadow Banking Indicator Interest Rate ControlIndicator
Economic Structure Indicator Business Cycle Indicator Monetary Policy Indicator
Notapplicable
GrangerTest lag p-value GrangerTest lag p-value GrangerTest lag p-value
SBI_GDP~PEAV_C1 8 0.048709918 * RDR~SBI_GDP 1 0.168350143 SBF_GDP~ROA_TS 1 0.038909286 *
PEAV_C1~SBI_GDP 6 0.018054573 * SBF_GDP~LR_SPD 1 2.95528E-06 *** ROA_TS~SBF_GDP 1 0.2443289
SBI_GDP~ROASPD_TS 7 6.81E-12 *** LR_SPD~SBF_GDP 1 0.004757091 ** SBI_GDP~m2_gdp 5 3.90068E-22 ***
ROASPD_TS~SBI_GDP 1 0.013765827 * SBF_GDP~RDR 7 0.0000116 *** m2_gdp~SBI_GDP 3 1.40413E-06 ***
SBF_GDP~PEAV_C1 5 0.131913987 RDR~SBF_GDP 1 0.138545938 SBI_GDP~DLR_TS 1 0.378530271
PEAV_C1~SBF_GDP 1 0.157549905 SBI_GDP~IPV_C1 6 1.72867E-25 *** DLR_TS~SBI_GDP 5 0.00015705 ***
SBF_GDP~ROASPD_TS 1 0.038202825 * IPV_C1~SBI_GDP 3 9.23992E-13 *** SBF_GDP~m2_gdp 1 3.18359E-05 ***
ROASPD_TS~SBF_GDP 1 0.259848028 SBI_GDP~ROA_TS 7 2.69E-11 *** m2_gdp~SBF_GDP 1 0.063100794 .
SBI_GDP~LR_SPD 8 0.107495541 ROA_TS~SBI_GDP 1 0.014138568 * SBF_GDP~DLR_TS 3 0.397658242
LR_SPD~SBI_GDP 6 7.30427E-08 *** SBF_GDP~IPV_C1 2 0.003041324 ** DLR_TS~SBF_GDP 8 0.068424272 .
SBI_GDP~RDR 2 0.339658956 IPV_C1~SBF_GDP 1 0.500150584
DependentIndependent Quant 0.1 Quant 0.3 Quant. 0.5 Quant. 0.7 Quant 0.9 Quant 0.1 Quant 0.3 Quant. 0.5 Quant. 0.7 Quant 0.9
Constant 0.0021083 0.11041 0.089635 0.12174 0.021487 0.093892 -0.03182 -0.018234 -0.043685 -0.0033305
LR_SPD -0.5549008 -1.32595 -0.95278 -1.4511 -1.504065 -0.212816 -0.26118 -0.170825 -0.315287 0.7078192
RDR 0.5623036 -1.8114 0.021445 -1.27924 5.14234 1.000548 0.19115 -0.147226 1.077777 -1.4403301
Constant -0.010888 0.0078347 -0.028701 -0.0004753 0.014853 -0.091684 -0.043595 -0.030837 -0.053602 -0.03342
PEAV_C 0.459561 1.2086778 1.099907 1.39721359 1.573062 0.241474 0.267058 0.170864 0.407373 0.468
ROASPD 3.153533 1.7629782 2.166267 1.2431188 2.704154 0.274856 -0.298466 -0.169862 -0.462349 -0.57133
Constant 0.3415 0.11572 -0.044957 0.21635 0.20038 -0.03368 0.094692 0.052699 0.015061 0.019121
ROA 2.622 0.40165 0.9391 -0.028598 0.28538 -0.0096785 -0.68494 -0.42758 -1.041 -1.2397
IPV_C 0.000018929 1.7989E-05 1.9129E-05 1.8929E-05 0.000022187 2.1469E-06 4.0054E-06 2.8448E-06 5.754E-06 1.0412E-05
Constant 0.2945824 0.3830721 0.3646949 0.42996276 0.5423688 0.0260263 0.0055609 0.0177341 -0.000169 0.00010834
M2_GDP -0.0095651 -0.0033664 -0.0079253 -0.0001197 -0.00053603 -0.0033532 0.0017363 -0.00056579 0.0034375 0.00638611
DLR -8.3637755 0.1844729 -6.8313831 5.68461338 2.91541349 3.1736544 1.7991547 1.56760433 1.448712 -0.0067792
SBI_GDP SBF_GDP

49
Soource: Chen, 2014 Research Methods Fixed assets investment are sorted by sources, as are from state budget, domestic loans, foreign investment, self-financing, bonds, and other sources. From credit demand side, for industrial firms, sources of fixed assets investment are either from state-budget, domestic loans, foreign investment, self-financing or from shadow banking sector. Another factor of shadow banking indicator is calculated, SBI, SBI_GDP, by excluding funds from state budget, domestic loans, foreign investment and self-financing.
From credit supply side, firms either get loans in RMB and loans in foreign currency commercial banks; or they issue bonds and stocks in the stock market. The rest of the overall credit supply volume or social investment volume is treated as investments to and from shadow banking sector.
ADF Test was used to make sure all the variables are stationary, then Granger Causality Test , Median Regression and quantile Regression at different percentiles of different Indicator was used to test how the four indicators impact the shadow banking scales from year 2002 to 2014. The main software used is R, with original test code in Appendix III. Appendix III rm(list=ls() library("doBy", lib.loc="E:/Program Files/R/R-3.1.2/library") library("forecast", lib.loc="E:/Program Files/R/R-3.1.2/library") library("foreign", lib.loc="E:/Program Files/R/R-3.1.2/library") library("gamlss", lib.loc="E:/Program Files/R/R-3.1.2/library") library("gamlss.data", lib.loc="E:/Program Files/R/R-3.1.2/library") library("gamlss.dist", lib.loc="E:/Program Files/R/R-3.1.2/library") library("plyr", lib.loc="E:/Program Files/R/R-3.1.2/library") library("sandwich", lib.loc="E:/Program Files/R/R-3.1.2/library") library("zoo", lib.loc="E:/Program Files/R/R-3.1.2/library") library("x12", lib.loc="E:/Program Files/R/R-3.1.2/library") library("vars", lib.loc="E:/Program Files/R/R-3.1.2/library") library("urca", lib.loc="E:/Program Files/R/R-3.1.2/library") library("tseries", lib.loc="E:/Program Files/R/R-3.1.2/library") library("timeSeries", lib.loc="E:/Program Files/R/R-3.1.2/library") library("timeDate", lib.loc="E:/Program Files/R/R-3.1.2/library") library("tempdisagg", lib.loc="E:/Program Files/R/R-3.1.2/library") Sys.setenv(X13_PATH = "/Desktop/Econometrics/project/winx13) set.seed(999) # 1.read data from csv file
( )/ Fixedassetinvestmentvolume Statebudgetfunding Foreigndirectinvestment Selffinancingfromretainedearnings DomesticloansSBI GDPMonthlyGDPdisaggregatevalue
− − − −=
( sin sin )/ SocialInvestmentVolume Loan RMB Loan foreigncurrency Bondsissuedbynonfinancialfirms FinancingfromstockmarketSBF GDPMonthlyGDPdisaggregatevalue
− − − −=

50
year <- read.csv("/Desktop/data/year.csv", sep=";",dec=".") month <- read.csv("/Desktop/data/month.csv", sep=";",dec=".") qrt <- read.csv("/Desktop/data/qrt.csv", sep=";",dec=".") gr_niva <- read.csv("/Desktop/data/gr_niva.csv", sep=";",dec=".") ppi <- read.csv("/Desktop/data/ppi.csv", sep=";",dec=".") gdpD <- read.csv("/Desktop/data/gdpD.csv", sep=";",dec=".") gr2p <- read.csv("/Desktop/data/gr2p.csv",sep=";", dec=".") month2 <- read.csv("E:/desktop/data/month2.csv") # 2.1 convert objects to TimeSeries and assign names year<- lapply(year, ts, start = c(2002),freq=1) qrt<- lapply(qrt, ts, start = c(2002,01), frequency=4) month2<- lapply(month2, ts, start = c(2002,01), frequency=12) gr_niva<- lapply(gr_niva, ts, start = c(1991,01),freq=12) ppi<- lapply(ppi,ts, start = c(2001,01), frequency=12) gdpD<- lapply(gdpD, ts, start = c(1991,01), frequency=12) # 2.2 GDP temporal disaggregation (quarterly --> monthly) # 2.2.1 linear regression of Industrial Value Added Growth Rate {official iva (current value) ---> growth rate of official iva (gr_c_niva) ---> gr_r ~ gr_c_niva linear regression } plot(gr_niva$gr_r) lines(gr2p$gr_c_niva, col="red") lm<- lm(gr_c_niva~gr_niva$gr_r, data= gr_niva) gr_p<-predict(lm,newdata=gr2p,interval="prediction", level=0.95) gr_p<- ts(gr_p, start=c(2002,01), freq=12) write.table(gr_p,"gr_p.csv", sep=";",dec=".") summary(lm) step(lm) par(mfrow=c(2,2)) plot(lm) anova(lm) par(mfrow=c(1,1)) plot(month$gr_m,col="red") lines(gr_p, col="blue") confint(lm) plot(gr_c_niva ~ gr_r) abline(lm(gr_c_niva ~ gr_r)) # x-13 ARIMA Sys.setenv(X13_PATH = "/Desktop/Econometrics/project/winx13") checkX13()? gdp_q <- ts(qrt$gdp_q, start = c(2002,01), freq=4) gdp_x13 <- seas(gdp_q) final(gdp_x13)
51
plot(gdp_x13) summary(gdp_x13) ?colnames(year)<- gdp_x13 #2.2.1.2 GDP temporal disaggregation (quarterly --> monthly) gdp_q <- ts(qrt$gdp_q, start = c(2002,01), freq=4) gr_m <- ts(month2$gr_m, start = c(2002,01), freq=12) gdp_m <- td(gdp_q ~ gr_m, conversion = "sum", to = "monthly", method = "chow-lin-maxlog") gdp_m2 <- td(gdp_q ~ 1,conversion = "sum", to = "monthly", method= "denton-cholette") gdp_m3 <- predict(gdp_m) plot(gdp_q, col="blue") lines(predict(gdp_m), col="red") lines(predict(gdp_m2), col="green") summary(gdp_m) summary(gdp_m2) #write.table(gdp_m$values, "gdp_m.csv", sep=";") #2.2.1.3 GAMLSS # gamlss############################ ############################ options(digits=5) data <- read.csv("/Desktop/data/gr_niva.csv", sep=";", dec=".") fix(data) names(data) attach(data) as.numeric(gr_r) #or is.numeric() to comfirm as.numeric(gr_c_niva) class(gr_r) #par(mfrow=c(1,1)) plot(gr_r, type="l") lines(gr_c_niva, type="l", col="red") plot(gr_r~gr_c_niva) #all laws loisProba<-c('BE', 'BCCG', 'BCPE', 'BCT','BEOI', 'BEINF','BEZI','EXP', 'exGAUS', 'EGB2', 'GA','GB1', 'GB2', 'GG', 'GIG', 'GT', 'GU', 'IG', 'JSU', 'JSUo', 'LO','LOGNO', 'LNO','NET','NO','NOF','PARETO2', 'PARETO2o', 'PE','PE2','RG','SEP1','SEP2','SEP3','SEP4', 'SHASH','ST1','ST2','ST3','ST4','ST5','SST', 'TF','WEI','WEI2','WEI3','ZAIG') #testing laws #laws<-c('BE', 'BCCG', 'BCPE', 'BCT','BEOI')
52
#laws<-c('BEINF','BEZI','EXP', 'exGAUS', 'EGB2') #laws<-c('GA','GB1', 'GB2', 'GIG', 'GT', 'GG') #laws<-c('GU', 'IG', 'JSU', 'JSUo', 'LO','LOGNO') #laws<-c('LNO','NET','NO','PARETO2', 'PARETO2o','NOF') #laws<-c('SEP1','SEP3','SEP4','RG','SEP2','PE','PE2') #laws<-c('SHASH','ST2','ST3','ST4','ST5','SST','ST1') #laws<-c('TF','WEI','WEI2','WEI3','ZAIG') laws<- c('GB2','JSU','SEP1') #estimation listModel<-c() listGaic<-c() for(j in laws){ for(i in 1:2) { for(k in 1:2){ for(l in 1:1){ for(m in 1:1){ mod<-gamlss(gr_c_niva ~ poly(gr_r, i, raw=TRUE), sigma.formula=~poly(gr_r, k, raw=TRUE), nu.formula=~poly(gr_r, l, raw=TRUE), tau.formula=~poly(gr_r, m, raw=TRUE),gd.tol=Inf, family = j, data=data) listGaic<-c(listGaic,GAIC(mod,k=3)) nam <- paste(j,i,k,l,m, sep=".") assign(nam, mod) listModel<-c(listModel,nam) } } } } } resultModel<- data.frame(modeles=listModel,gaic=listGaic) test <- resultModel[order(resultModel$gaic),] test[c(seq(from=1, to=10, by=1)),] length(listModel) min(resultModel[,2]) # best model analysis best= JSU.1.2.1.1 best2= SEP1.2.1.1.1 best3= GB2.2.1.1.1 summary(best) wp(best) plot(best) ## Centile plot
53
centiles(best, gr_r) centiles.fan(best, gr_r) # predict result with reasonable model gr_m<-as.data.frame(month$gr_m) gr_p<- predict(best, type="response", data=gr_m) #gr_p<- predict(best, type="response", data=gr_m) plot(gr_p) length(gr_p) length(month$gr_m) plot(gr_p, type="l") lines(month$gr_m, col="blue") lines(gr_c_niva, col="red") lines(gr_r, col="green") write.csv(gr_p, "gr_p.csv",sep=";") # 2.2.3 use GDP deflator to calculate real industrial added value {GDP deflator (gdpD) --> real industrial value added (riva_gdpD) --> computed growth rate of real industrial value added (gr_c_riva_gdpD) --> linear regression to official growth rate of iva (gr_r) in order to forcast the most accurate growth rate} # 2.2.3.1 computing GDP deflator as indicator iva_c <-read.csv("/Desktop/data/iva_c.csv",sep=";", dec=".") iva_c <-ts(iva_c, start=c(2002,01), freq=12) gdp_q <- ts(qrt$gdp_q, start = c(2002,01), freq=4) par(mfrow=c(1,1)) plot(gdp_q) plot(iva_c, col="red") gdp_m <- td(gdp_q ~ iva_c, conversion = "sum", to = "monthly", method = "chow-lin-maxlog") gdp_m2 <- td(gdp_q ~ 1,conversion = "sum", to = "monthly", method= "denton-cholette") plot(gdp_q, col="blue") lines(predict(gdp_m), col="red") lines(predict(gdp_m2), col="green") #compare 2 models of deisaggregation summary(gdp_m) summary(gdp_m2) gdp.m <- predict(gdp_m) write.table(gdp.m,"gdpM.csv",sep=";", dec=".") # Seasonal decomposition
54
Dgdp1<- decompose(qrt$gdp_q) plot(Dgdp1) #plot(fitted(Dgdp1) xlim=) # ARIMA gdp_arima <- auto.arima(qrt$gdp_q) plot(forecast(gdp_arima, h=20)) fgdp <- forecast.Arima(gdp_arima,h=20, level=c(99.5)) plot(fgdp) summary(fgdp) # x-13 ARIMA Sys.setenv(X13_PATH = "/Desktop/Econometrics/project/") checkX13() gdp_q <- ts(qrt$gdp_q, start = c(2002,01), freq=4) gdp_x13 <- seas(gdp_q) final(gdp_x13) plot(gdp_x13) summary(gdp_x13) decompose(gdp_x13) monthplot(gdp_x13) ?colnames(year) #3. Calculation of 3 groups of indicators #3.1 Shadow Banking Scale: SBF & SBI # SBF, evaluate shadow banking from credit supply side # SBI, evaluate shadow banking from credit demand side # SBF_GDP, Ratio between SBF monthly data and gdp monthly disaggregation # SBI_GDP, Ratio between SBI monthly data and gdp monthly disaggregation gdp_m <- read.csv("/Desktop/data/gdpM.csv",sep=";", dec=".") SBF = month2$TSF - month2$yuan_loan - month2$FC_loan - month2$C_bond - month2$D_SIss SBI = month2$FA_Inv - month2$N_Inv - month2$D_loan - month2$F_loan - month2$Auto_F SBI1 <- as.numeric(SBI) SBF1 <- as.numeric(SBF) SBI_GDP=SBI1/gdp_m$gdpM SBF_GDP=SBF1/gdp_m$gdpM SBF_GDP<- ts(SBF_GDP, start = c(2002,1,1), freq=12) SBI_GDP<- ts(SBI_GDP, start = c(2002,1,1), freq=12) factor1 <- cbind(SBI_GDP,SBF_GDP) write.table(factor1, "/Desktop/data/factor1.csv", sep=";",dec=".") plot(SBI_GDP, col= "blue", xlab='time', ylab='SBI_GDP') plot(SBI, col="black") plot(SBF_GDP,col="yellow",xlab='time', ylab='SBF_GDP') lines(SBF, col= "red",xlab="time",ylab="SBF" ) summary(factor1)
55
# 3.2 Interest Rate Variable #RDR (1 year deposit rate); LR_SPD( 1 year loan rate - market interest rate ) # LR1 (1 year loan rate represent how official interest rate control works in the market), # SPD (market interest rate is interpreted as ROA from private owned firms) RDR <- month2$r_dp RDR<- ts(RDR, start=c(2002,01), freq=12) LR<- ts(month2$rl_m, start=c(2002,01), freq=12) LR1<- as.numeric(month2$rl_m) SPD <- lapply(month2$r_asset_p, ts, start=c(2002,01), freq=12) SPD1 <- as.numeric(month2$r_asset_p) # SPD=profit/capital owned by private owned company LR_SPD <- LR1-SPD1 LR_SPD<- ts(LR_SPD, start=c(2002,01), freq=12) factor2 <- cbind(RDR, LR_SPD) write.table(factor2, "/Desktop/data/factor2.csv", sep=";") plot.ts(month2$month, month2$r_dp, col= "blue") plot(LR_SPD, col="red") lines(LR_SPD, col= "red") summary(month2$r_dp, LR_SPD) #3.3 Economic Structure Variable #PEAV (Ratio of Private owned industrial firms assets over all firms) # PEAV_C is PEAV_TS after hp filter adjustment #ROASPD (Difference of ROA between private owned firms over ROA of all firms) library(help="mFilter") PEAV_TS <- ts(month2$r_asset_p, start=c(2002,01), freq= 12) ROASPD_TS <- ts (month2$D_P_A.P, start=c(2002,01),freq=12) PEAV_C <- hpfilter(PEAV_TS,freq=12,type=c("lambda","frequency"),drift=FALSE) PEAV_C1<- ts(PEAV_C, start=c(2002,01),freq=12) plot (PEAV_C) plot(ROASPD_TS, col="green") #3.4 Business Cycle Variable and Macroeconomic Policy Variable #3.4.1 Business Cycle Variable (ROA of all firms, indusrial value added per month) ROA <- month2$roa ROA_TS <- ts(ROA, start=c(2002,01), freq=12) IVA <- read.csv("/Desktop/data/iva_c.csv",sep=";") iva_ts <- lapply(IVA, ts, start=c(2002,01), freq=12) IPV_C <- hpfilter(iva_ts$niva ,freq=12, type=c("lambda","frequency"),drift=FALSE) IPV_C1 <- ts(IPV_C, start=c(2002,01),freq=12) plot(IPV_C, col="blue")
56
# 3.4.2 Monetary Policy Variable (M2_GDP as identified as M2 over GDP ratio # (DLR as monthly changes in interbank lending interest rate) gdp_m <- read.csv("/Desktop/data/gdpM.csv",sep=";") gdp_m <- gdp_m$x M2<- month2$M2 M2<- as.numeric(M2) gdp_m<- as.numeric(gdp_m) m2_gdp <- M2/gdp_m m2_gdp<- ts(m2_gdp, start=c(2002,1),freq=12) write.table (m2_gdp,"/Desktop/data/M2_GDP.csv", sep=";",dec=".") DLR <- month2$Inbk_c DLR_TS <- ts(DLR, start=c(2002,01), freq=12) plot(m2_gdp, col='grey') plot(DLR_TS, col="blue") #3.5 Seasonal Adjustment for all the variables plot.ts(SBI_GDP) plot.ts(SBF_GDP) #RDR plot.ts(RDR, col= "blue") plot.ts(LR_SPD) plot (PEAV_C) plot.ts(ROASPD_TS) plot.ts (m2_gdp) plot.ts(ROA_TS) plot.ts(DLR_TS) plot(IPV_C) S_SBI_GDP <- decompose (SBI_GDP) SBIGDP <- seas(SBI_GDP) S_SBF_GDP <- decompose (SBF_GDP) SBFGDP <- seas(SBF_GDP) S_LR_SPD <- decompose (LR_SPD) ?auto.arima SLRSPD<- auto.arima(LR_SPD,stationary=TRUE,seasonal=FALSE,test="adf") summary(SLRSPD) plot(forecast(SLRSPD,h=20)) summary(SLRSPD) lrspd <- forecast.Arima(SLRSPD,h=20, level=c(99.5)) plot(lrspd) S_ROA_SPD <- decompose (ROASPD_TS) ROASPD<- seas(ROASPD_TS) Sroaspd<- auto.arima(ROASPD_TS,stationary=TRUE,seasonal=FALSE,test="adf") summary(Sroaspd) plot(forecast(Sroaspd,h=20)) summary(Sroaspd) roaspd <- forecast.Arima(Sroaspd,h=20, level=c(99.5))

57
plot(roaspd) S_M2GDP <- decompose (m2_gdp) Sm2gdp<- auto.arima(m2_gdp,stationary=TRUE,seasonal=FALSE,test="adf") summary(Sm2gdp) plot(forecast(Sm2gdp,h=20)) m2gdp<- forecast.Arima(Sm2gdp,h=20, level=c(99.5)) M2gdp<-seas(m2_gdp) S_DLR <- decompose(DLR_TS) SDLR <- seas(DLR_TS) S_ROA <- decompose(ROA_TS) SROA<- seas(ROA_TS) plot(S_SBI_GDP) plot(S_SBF_GDP) plot(SBIGDP) plot(SBFGDP) plot(S_LR_SPD) plot(S_DLR) plot(S_ROA_SPD) plot(S_M2GDP) plot(S_ROA) plot(SBFGDP) plot (ROASPD) plot(SDLR) plot(M2gdp) plot(SROA) #4. ADF Test for four groups of variables #adf= augmented Dickey-Fuller test library('urca') ?ur.df test1<- ur.df(S_SBI_GDP$x, lag=5, type='trend') summary(test1) #result shows only lag =1 as stationary results, initiate test 2 test2<- ur.df(S_SBI_GDP$x, lag=1, type='drift') summary(test2) test3<- ur.df(S_SBI_GDP$x, lag=0, type='drift') summary(test3) #take S_SBI_GDP as stationary ?adf.test test4<- ur.df(S_SBF_GDP$x, lag=5, type='trend') summary(test4) test5<- ur.df(S_SBF_GDP$x, lag=1, type='trend') summary(test5) test6<- ur.df(S_SBF_GDP$x, lag=0, type='trend') summary(test6)
58
#take SBI_GDP stationary test7<- ur.df(S_LR_SPD$x, lag=5, type='trend') summary(test7) test8<- ur.df(S_LR_SPD$x, lag=1, type='trend') summary(test8) test9<- ur.df(S_LR_SPD$x, lag=0, type='trend') summary(test9) #take SBF_GDP as stationary results test10<- ur.df(RDR, lag=5, type='none') summary(test10) test11<- ur.df(RDR, lag=1, type='none') summary(test11) test11<- ur.df(RDR, lag=0, type='none') summary(test11) #take RDR as stationary results as coefficients results are not significant test12<- ur.df(S_ROA_SPD$x, lag=5, type='trend') summary(test12) test13<- ur.df(S_ROA_SPD$x, lag=1, type='trend') summary(test13) #take ROA as stationary results test14<- ur.df(PEAV_C$trend, lag=5, type='trend') summary(test14) test15<- ur.df(PEAV_C$trend, lag=1, type='trend') summary(test15) #take PEAV_C as stationary test16<- ur.df(S_ROA$x, lag=5, type='trend') summary(test16) test17<- ur.df(S_ROA$x, lag=3, type='trend') summary(test17) test18<- ur.df(S_ROA$x, lag=2, type='trend') summary(test18) test19<- ur.df(S_ROA$x, lag=0, type='trend') summary(test19) #take S_ROA as stationary results test20<- ur.df(IPV_C$trend, lag=5, type='trend') summary(test20) test21<- ur.df(IPV_C$trend, lag=1, type='trend') summary(test21) #take IPV_c as stationary test23<- ur.df(M2gdp$x, lag=5, type='trend') summary(test23) test24<- ur.df(M2gdp$x, lag=0, type='trend') summary(test24) #take M2gdp as stationary results sdlr <-removeNA(SDLR) sdlr<-rnorm(sdlr)
59
test25<- ur.df(sdlr, lag=5, type='trend') summary(test25) test26<- ur.df(sdlr, lag=2, type='trend') summary(test26) test27<- ur.df(sdlr, lag=0, type='trend') summary(test27) #take DLR for stationary as there exisit no significant coefficients test28<- ur.df(RDR, lag=5, type='drift') summary(test28) test29<- ur.df(RDR, lag=0, type='drift') summary(test29) # Values used for detrending, Shadow Banking Factors: S_SBI_GDP, SBFGDP; #Interet Control Variable: SLRSPD, RDR; #Economic Structure Variable: Sroaspd, PEAV_C; #Business Cycle Variable : IPV_C, SROA #Monetary Policy Variable: Sm2gdp, SDLR factor1s<- data.frame(SLRSPD$x, RDR) factor2s<- data.frame(S_ROA_SPD$x, PEAV_C$trend) factor3s<- data.frame(IPV_C$x, S_ROA$x) factor4s<- data.frame(M2gdp$x, SDLR$x) summary(factor1s) summary(factor2s) summary(factor3s) summary(factor4s) #5. Granger Causiality Test for four groups of factors on Shadow Banking factor S_SBI_GDP, SBFGDP # 6. Quantile Regression,for 4 groups of variables on Shadow Banking Factor install.packages("quantreg") help(package = "quantreg") help(rq) library(SparseM) library(quantreg) library(MatrixModels) library(quantreg) a <- capture.output(dput(plot.summary.rqs)) b <- gsub("^\\s*par\\(", "nop(", a) nop <- function(...) {} my.plot.summary.rqs <- eval(parse(text=b)) # Median Regression summary(rqss(S_SBF_GDP$x~S_LR_SPD$x+RDR,.5)) summary(rqss(S_SBI_GDP$x~S_LR_SPD$x+RDR,.5)) summary(rqss(S_SBF_GDP$x~PEAV_C1$trend+S_ROA_SPD$x,.5)) summary(rqss(S_SBI_GDP$x~PEAV_C1$trend+S_ROA_SPD$x,.5))
60
summary(rqss(S_SBF_GDP$x~IPV_C1$trend+S_ROA$x,.5)) summary(rqss(S_SBI_GDP$x~IPV_C1$trend+S_ROA$x,.5)) summary(rqss(S_SBF_GDP$x~M2gdp$x+SDLR$x,.5)) summary(rqss(S_SBI_GDP$x~M2gdp$x+SDLR$x,.5)) # Quantile Regreesion for taus equal 0.1, 0.3, 0.5, 0.7, 0.9 taus <- c(.1,.5,.3,.7,.9) rq(S_SBF_GDP$x~S_LR_SPD$x+RDR,tau=taus) rq(S_SBI_GDP$x~S_LR_SPD$x+RDR,tau=taus) summary(rq(S_SBF_GDP$x~S_LR_SPD$x+RDR,tau=taus)) summary(rq(S_SBI_GDP$x~S_LR_SPD$x+RDR,tau=taus)) rq(S_SBF_GDP$x~PEAV_C1$trend+S_ROA_SPD$x,tau=taus) rq(S_SBI_GDP$x~PEAV_C1$trend+S_ROA_SPD$x,tau=taus) summary(rq(S_SBF_GDP$x~PEAV_C1$trend+S_ROA_SPD$x,tau=taus)) summary(rq(S_SBI_GDP$x~PEAV_C1$trend+S_ROA_SPD$x,tau=taus)) rq(S_SBF_GDP$x~IPV_C1$trend+S_ROA$x,tau=taus) rq(S_SBI_GDP$x~IPV_C1$trend+S_ROA$x,tau=taus) summary(rq(S_SBF_GDP$x~IPV_C1$trend+S_ROA$x,tau=taus)) summary(rq(S_SBI_GDP$x~IPV_C1$trend+S_ROA$x,tau=taus)) rq(S_SBF_GDP$x~M2gdp$x+SDLR$x,tau=taus) rq(S_SBI_GDP$x~M2gdp$x+SDLR$x,tau=taus) summary(rq(S_SBF_GDP$x~M2gdp$x+SDLR$x,tau=taus)) summary(rq(S_SBI_GDP$x~M2gdp$x+SDLR$x,tau=taus)) #visualize quantile regression results par(mfrow=c(1,3)) qr1<-summary(rq(S_SBF_GDP$x~S_LR_SPD$x+RDR,tau=taus)) qr2<-summary(rq(S_SBI_GDP$x~S_LR_SPD$x+RDR,tau=taus)) qr3<-summary(rq(S_SBF_GDP$x~PEAV_C1$trend+S_ROA_SPD$x,tau=taus)) qr4<-summary(rq(S_SBI_GDP$x~PEAV_C1$trend+S_ROA_SPD$x,tau=taus)) qr5<-summary(rq(S_SBF_GDP$x~IPV_C1$trend+S_ROA$x,tau=taus)) qr6<-summary(rq(S_SBI_GDP$x~IPV_C1$trend+S_ROA$x,tau=taus)) qr7<-summary(rq(S_SBF_GDP$x~M2gdp$x+SDLR$x,tau=taus)) qr8<-summary(rq(S_SBI_GDP$x~M2gdp$x+SDLR$x,tau=taus)) my.plot.summary.rqs(qr1) my.plot.summary.rqs(qr2) my.plot.summary.rqs(qr3) my.plot.summary.rqs(qr4) my.plot.summary.rqs(qr5) my.plot.summary.rqs(qr6) my.plot.summary.rqs(qr7) my.plot.summary.rqs(qr8)

61
#qr1<- rqss(SBI_GDP~m2_gdp+DLR_TS,.5) #plot(lm(SBI_GDP~m2_gdp+DLR_TS)) #s1<-summary(qr1) #sqr1<- predict(qr1) #p1<-ts(sqr1, start=c(2002,01),freq=12) #plot(sqr1, mar = c(5.1, 4.1, 2.1, 2.1),col="green", main = "", cex = 1, pch = 19) #qr2<-rqss(SBF_GDP~m2_gdp+DLR_TS,.5) #sqr2<- predict(qr2) #plot(sqr2, mar = c(5.1, 4.1, 2.1, 2.1),col="blue", main = "",ylab = "shadow baning variable", cex = 1, pch = 19)