Embed Size (px)
Citation preview

7/21/2019 masterthesis_uelicamathias
http://slidepdf.com/reader/full/masterthesisuelicamathias 1/137
___________________________________________________________________
Seismic Performance Evaluation of a HistoricUnreinforced Masonry Building Structure
Master Thesis
Swiss Federal Institute of Technology
Institute of Structural Engineering
Student: Ueli Camathias
Supervisor: Prof. Dr. Bozidar Stojadinovi!
Advisor: Dr. Neboj"a Mojsilovi!
University of Ljubljana
Faculty of Civil and Geodetic Engineering
Advisor: Prof. Dr. Vlatko Bosiljkov
Ljubljana, 01.07.2013

7/21/2019 masterthesis_uelicamathias
http://slidepdf.com/reader/full/masterthesisuelicamathias 2/137

7/21/2019 masterthesis_uelicamathias
http://slidepdf.com/reader/full/masterthesisuelicamathias 3/137

7/21/2019 masterthesis_uelicamathias
http://slidepdf.com/reader/full/masterthesisuelicamathias 4/137

7/21/2019 masterthesis_uelicamathias
http://slidepdf.com/reader/full/masterthesisuelicamathias 5/137
Acknowledgments
I would like to express my deepest gratitude to my supervisor Prof. Dr. BozidarStojadinovic and my advisor Dr. Nebojsa Mojsilovic, representing the ETH Zürich,and to my advisor Prof. Dr. Vlatko Bosiljkov , representing the University of Ljubljana,for their continuous guidance and excellent cooperation during the completion of thismaster thesis.

7/21/2019 masterthesis_uelicamathias
http://slidepdf.com/reader/full/masterthesisuelicamathias 6/137

7/21/2019 masterthesis_uelicamathias
http://slidepdf.com/reader/full/masterthesisuelicamathias 7/137
Abstract
This thesis deals with an evaluation of the seismic performance of an oldunreinforced masonry building structure. For this purpose the Bundeshaus Ost inBern is selected. The structure is already used in SIA D0237 as a reference buildingfor seismic analysis. After a survey of the building, where publicly availableinformation about the structure was collected, a deformation-based analysis wasperformed using 3Muri software and two building models, one with in-plane flexibleand the other with in-plane rigid floor diaphragms. 3Muri was used to model thestructure and then to compute a pushover force-deformation response curve for the
structure. Subsequently, the available capacities are compared to the correspondentdemands to demonstrate that the building pushover response is satisfactory. Finally,an evaluation procedure for analyzing the seismic performance of old masonrystructures was formulated and proposed.
1st of July 2013 Ueli Camathias

7/21/2019 masterthesis_uelicamathias
http://slidepdf.com/reader/full/masterthesisuelicamathias 8/137

7/21/2019 masterthesis_uelicamathias
http://slidepdf.com/reader/full/masterthesisuelicamathias 9/137
Table of content
1
Introduction 1
2 Masonry Structures 3
2.1 Old Masonry Structures 3
2.2 Methods of Evaluation 4
2.3 Swisscode 5
2.4 Eurocode 7
2.5 FEMA 8
2.6 Comparison of Eurocode 8 and FEMA 310 10
3 Survey of the Bundeshaus Ost Building 11
3.1 Seismic Parameters 11
3.2 Geometrical Properties 12
3.3 Structural Properties 15
3.3.1 General 15
3.3.2 Floors 15
3.3.3 Walls 15
3.4
Rigid and Flexible Floors 16
3.5 Masonry Properties 18
3.6 Site Visit 20
3.6.1 Basics 20
3.6.2 BHO-Structure 21
4 Seismic Analysis Procedures 22
4.1 Linear Static Procedures 22
4.2 Linear Dynamic Procedures 22
4.3
Nonlinear Static Procedures 23
4.4 Nonlinear Dynamic Procedures 23
5 Numerical Simulation 25
5.1 3Muri 25
5.1.1 General Description 25
5.1.2 Masonry Macro-elements 26
5.1.3 Influence of Rigid and Flexible Floors 27
5.1.4 Computation Phase 28
5.2
Verification of 3Muri 30
5.2.1 Geometry 30
5.2.2 Masonry Wall Characteristics 31

7/21/2019 masterthesis_uelicamathias
http://slidepdf.com/reader/full/masterthesisuelicamathias 10/137
5.2.3 Load Carrying System and Vertical Loads 31
5.2.4 Equivalent Lateral Force Analysis 32
5.2.5 Response Spectrum Analysis 33
5.2.6 Hand-Calculated Capacity Curve 34
5.2.7 3Muri Computation 40
5.2.8 Discussion 41
5.3 Development of the 3Muri-model of the BHO-structure 43
6 Evaluation 48
6.1 Seismic Hazard 48
6.2 Equivalent Static Loading 50
6.3 Global Evaluation 52
6.3.1 Flexible Floors Model 52
6.3.2
Rigid Floors Model 57
6.3.3 Story Drifts 62
6.4 Local Performance 64
6.5 Conclusion 67
6.6 Strengthening of Masonry Structures 68
6.6.1 Methods of Strengthening of Masonry Walls 68
6.6.2 Methods of Improving Structural Integrity 72
6.6.3 Foundation 75
6.6.4 Non-Structural Elements 75
7
Pilot Guideline for Seismic Evaluation of Historic Masonry Building
Structures 76
7.1 Proposed Evaluation Procedure 76
7.2 Alternatives 82
8 Conclusion 83
9 References 86
Appendix 88
A Site Visit 88
B BHO-structure 94
C Mass Center Calculation 108
D Test Building Structure 110
E Evaluation 116

7/21/2019 masterthesis_uelicamathias
http://slidepdf.com/reader/full/masterthesisuelicamathias 11/137

7/21/2019 masterthesis_uelicamathias
http://slidepdf.com/reader/full/masterthesisuelicamathias 12/137
List of Figures
Figure 2.1 General structure of evaluation procedures [5]...........................................4
Figure 2.2 Evaluation procedure according to SIA D0237 [1]......................................6
Figure 2.3 Evaluation procedure according to Eurocode 8 [5].....................................8
Figure 2.4 Evaluation procedure according to FEMA 310 [5] ......................................9
Figure 3.1 Top view of the whole BHO-building pointing out the middle part. ...........11
Figure 3.2 North façade of the BHO-structure ...........................................................12
Figure 3.3 Plan view of the ground floor ....................................................................13
Figure 3.4 Cross section of the middle part of the BHO-structure .............................14
Figure 3.5 Load carrying structural walls (blue = x-direction, green = y-direction).....16
Figure 3.6 diaphragm is connected to walls B [1] ......................................................17
Figure 3.7 diaphragm is connected to walls A [1] ......................................................17
Figure 3.8 Diaphragm and wall deformation [16] .......................................................18
Figure 5.1 Types of macro-elements .........................................................................26
Figure 5.2 Computation steps [24].............................................................................28
Figure 5.3 Test building structure...............................................................................30
Figure 5.4 Ratio of h0/hst as a function of the ration of the flexural stiffness of thespandrels to the flexural stiffness of the piers [22]..............................................35
Figure 5.5 Geometry of the piers and interacting forces [2].......................................36
Figure 5.6 Compression strength as a function of the inclination of the angle # [2] ..36
Figure 5.7 Capacity curve of the test structure computed with a 0.7 stiffnessreduction. ............................................................................................................39
Figure 5.8 Pushover curve of the test structure computed with 3Muri.......................41
Figure 5.9 Assignment of the point loads of the roof structure...................................44
Figure 5.10 Staircase model ......................................................................................45
Figure 5.11 3D-model of the BHO-structure ..............................................................46
Figure 5.12 3D-mesh of the BHO-structure ...............................................................46
Figure 5.13 Mesh of the south wall ............................................................................47
Figure 6.1 Uniform hazard spectra (UHS) for Bern....................................................48
Figure 6.2 Performance goals for design...................................................................50
Figure 6.3 Structural performance model...................................................................50
Figure 6.4: Reference nodes, used for the global evaluation and the mass center...51
Figure 6.5 Pushover curve with flexible floors and loading in the x-direction (analysisnr.12)...................................................................................................................52
Figure 6.6 Collapse mechanism of Wall 2 in Figure 6.5.............................................52
Figure 6.7 Collapse mechanism of the Wall 4 in Figure 6.8.......................................53
Figure 6.8 Floor plan of the deformed third floor........................................................53
Figure 6.9 Average pushover curve with flexible floors and loading in the x-direction(analysis nr. 18) ..................................................................................................54
Figure 6.10 Pushover curve with flexible floors and loading in the y-direction (analysisnr.18)...................................................................................................................55
Figure 6.11 Collapse mechanism of the red-marked wall in Figure 6.12...................55

7/21/2019 masterthesis_uelicamathias
http://slidepdf.com/reader/full/masterthesisuelicamathias 13/137
Figure 6.12 Floor plan of the collapse mechanism of the ground floor ......................55
Figure 6.14 Average pushover curve with flexible floors and loading in y-direction ..56
Figure 6.13 Floor plan of the deformation behavior of the third story ........................56
Figure 6.15 Pushover curve with rigid floors and loading in the x-direction (analysisnr.16)...................................................................................................................57
Figure 6.18 Pushover curve with rigid floors and loading in y-direction (analysis nr.20)............................................................................................................................58
Figure 6.16 Floor plan of the collapse mechanism ....................................................58
Figure 6.17 Collapse mechanism of the red-marked wall in Figure 6.16...................58
Figure 6.19 Floor plan of the collapse mechanism ....................................................59
Figure 6.20 Collapse mechanism of the red-marked wall in Figure 6.19...................59
Figure 6.21 Comparison of the pushover curve in the x-direction for the flexible andrigid model ..........................................................................................................60
Figure 6.22 Comparison of the pushover curve in the y-direction for the flexible and
rigid model ..........................................................................................................61
Figure 6.23 Design response spectra for the BHO-structure in Bern.........................62
Figure 6.24 Story drifts of the BHO-structure.............................................................63
Figure 6.25: 3D-model of local mechanism................................................................65
Figure 6.26: Ground plan pointing out Wall 1 and 4...................................................65
Figure 6.27 Front view of the wall showing the analyzed section..............................67
Figure 6.28: Floor plan showing the analyzed section...............................................67
Figure 6.29 Local collapse mechanism for section on the third floor .........................67
Figure 6.30 Reconstruction of the central part of a heavily cracked stone-masonry
wall [21]...............................................................................................................69 Figure 6.31 Repointing of a brick-masonry wall [21]..................................................70
Figure 6.32 Application of r.c. coating to brick-masonry walls [21] ............................70
Figure 6.33 Reconstruction of a bulged stone-masonry wall [21] ..............................71
Figure 6.34 Position of steel ties in plan of a rural stone-masonry house [21]...........72
Figure 6.35 Position of steel ties in elevation of a rural stone-masonry house [21]...72
Figure 6.36 Bracing of a large-span wooden floor with metallic truss [21].................73
Figure 6.37 Detail of anchoring of a wooden floor into a stone-masonry wall [21].....73
Figure 6.38 Strengthening of the corner zone of a stone-masonry wall with stonestitching [21]........................................................................................................74
Figure 6.39 Strengthening of the corner zone of a stone-masonry wall with metalstitching [21]........................................................................................................74
Figure 6.40 Placement of new tie-columns in a brick-masonry wall [21] ...................75

7/21/2019 masterthesis_uelicamathias
http://slidepdf.com/reader/full/masterthesisuelicamathias 14/137
List of Tables
Table 3.1 Seismic parameters of the BHO-structure .................................................12
Table 3.2 Dimensions of the middle part of the BHO-structure..................................13
Table 3.3 Floor heights ..............................................................................................13
Table 3.4 Characteristic parameters of the BHO masonry ........................................20
Table 5.1 The 24 analyses combinations for the 3Muri evaluation............................29
Table 5.2 Dimensions of test building ........................................................................30
Table 5.3 Material characteristics of the test building structure .................................31
Table 5.4 Parameters for effective stiffness...............................................................33
Table 5.5 Capacity demand of the test structure with a stiffness reduction of 0.7.....40
Table 5.6 Displacement response of the test building for different stiffnesses ..........41
Table 5.8 Displacement response of the equivalent SDOF with 3Muri......................42
Table 5.7 First period of vibration and capacity demands for two performance levels............................................................................................................................42
Table 5.9 Interacting vertical loads on the different floor types according to theirlocation................................................................................................................44
Table 5.10 Load assignments of the roof structure....................................................45
Table 6.1 Displacements of the corner nodes in relation to the reference node 259 forthe flexible model................................................................................................54
Table 6.2 Diaphragm displacement ...........................................................................56
Table 6.3 Displacements of the corner nodes in relation to the reference node 259 forthe rigid model ....................................................................................................59
Table 6.4 Demands and Capacities of the BHO-structure.........................................62
Table 6.5 Story drifts of the BHO-structure with flexible floors (nodes 60-64) ...........63
Table 6.6 Story drifts of the BHO-structure with rigid floors (nodes 60-64)................64
Table 6.7 Results for the investigated Walls 1 and 4 of the BHO-structure concerningout-of-plane failure..............................................................................................66

7/21/2019 masterthesis_uelicamathias
http://slidepdf.com/reader/full/masterthesisuelicamathias 15/137

7/21/2019 masterthesis_uelicamathias
http://slidepdf.com/reader/full/masterthesisuelicamathias 16/137

7/21/2019 masterthesis_uelicamathias
http://slidepdf.com/reader/full/masterthesisuelicamathias 17/137
Introduction 1
1
1 Introduction
The purpose of this thesis is to conduct a seismic performance evaluation of an oldunreinforced masonry building structure. Therefore the Bundeshaus Ost building inBern is selected. This structure is already used in SIA D0237 [1] as a referencebuilding for seismic analysis.
Before starting the evaluation, different existing evaluation procedures areinvestigated. In general, the evaluation procedures can be divided into two groups,namely configuration based checks and strength checks. Configuration based checksserve to figure out quickly the general behavior of a structure based on its
configuration, while strength checks serve to compute the load carrying capacity ofthe structure. The methods described in Eurocode 8, Swisscode and FEMA 310 arecompared. Conclusively it can be said, that FEMA includes the most advancedevaluation procedure for the evaluation of existent building structures.
The first phase of the evaluation of the Bundeshaus Ost in Bern is the survey of thebuilding. In this phase, the first step concerns the seismic properties of the building.Bern lies in the lowest seismic zone Z1 of Switzerland. Therefore the seismic impactloads are relatively low. Further the structure is assigned to the soil class B and tothe importance class II. In the second step, the geometry of the building is studied.
For this purpose, the federal office for property, construction and logistics (BBL)provided the plans created for the building permit of the ongoing renovation. In thethird step, the structural properties are investigated. It is important to understand thestructural system in order to analyze the resistance of the building. In the forth step,the influence of flexible and rigid floor compositions is discussed. Then, in the fifthstep, the masonry characteristics are defined. Unfortunately no values out of amaterials’ survey were available. Therefore, these values were estimated usingprovisions described in codes. The last step of this phase is the site visit. During thesite visit, the collected data is verified. Remaining questions may be answered and
additional information collected.
The second phase of the evaluation concerns the development of the numericalsimulation. For this purpose the 3Muri software is selected, which is a numericalcomputation program created for the seismic analysis of masonry structures. In thefirst step, a simple test structure is defined and modeled. This structure is analyzedusing the equivalent lateral force method, the response spectra method. Further ahand-calculated pushover curve is computed using the method developed byBachmann und Lang [2]. Then, the results of these hand calculations are comparedwith the results from the 3Muri computation. This comparison shows almost equal
values for the hand-calculated pushover curve and the 3Muri-computed pushovercurve. After the verification, a model of the Bundeshaus Ost structure is developed in3Muri.

7/21/2019 masterthesis_uelicamathias
http://slidepdf.com/reader/full/masterthesisuelicamathias 18/137
1 Introduction
2
The third phase discusses the results. In order to compare the results, the demandsfor the Bundeshaus Ost structure are computed using a UHS for Bern and by usingthe equations for the design response spectra of SIA 261. By applying theparticipation factor, the demands are transformed into the values that can becompared with the delivered values of the 3Muri computation. The Bundeshaus Ost structure satisfies all the required demands for the three performance levels,operational (72y), limited damage (475y) and collapse prevention (2475y). An in-plane deflection of the flexible-floor model of the third floor diaphragm was foundunder loading in the NS-direction.
After the structure with flexible diaphragms was analyzed, a second model wasdeveloped by making the flexible floor diaphragms rigid in their own planes. This waya flexible-floor structure can be compared with a rigid-floor structure. The resultsshow, that the performance of the structure is better with rigid floors. However, it is
difficult to compare the values for the loading in NS-direction, since the referencenode, used for the computation, lies in the diaphragm deflection in the third floor ofthe flexible floor model. Therefore, this pushover curve shows a large elasticdeformation, which is not representative of the general behavior of the structure.
Next, the story drifts are computed for the flexible-floor and the rigid-floor models.The drifts are computed on a conservative way. However, the largest drift is 0.5% inthe ground floor in the NS-direction for the rigid-floor model. This value lies in theexpected range of 0.4% to 0.6%. It can be observed that the rigid-floor model has alarger story-drift capacity then the flexible-floor model.
Finally, a local evaluation is performed in order to confirm the results obtained bycomparing the resisting accelerations. The resistant accelerations obtained out of theout-of-plane mechanisms are expected to be smaller then those of the globalevaluation. This expectation can be confirmed.
The last part of this dissertation is a proposal for an evaluation procedure for historicmasonry buildings. This proposal is built upon the methods discussed in the first partof the dissertation and the experience gained through the data collection, modelingand static pushover evaluation of the Bundeshaus Ost building.

7/21/2019 masterthesis_uelicamathias
http://slidepdf.com/reader/full/masterthesisuelicamathias 19/137
Masonry Structures 2
3
2 Masonry Structures
2.1 Old Masonry Structures
The investigation of an old masonry structure is often combined with severaldifficulties. One aspect of difficulty is to find the original design plans of the structure.Over time, changes may have occurred to the structure. These might be structuralmodifications due to changes of use or combined with renovations. Another reasonmay be the purchase of new technical installations such as a heating system. Not allmodifications concern the structural system, but they often do. If modifications tookplace, they should be notified in the building chronology. Unfortunately,
documentation on modifications of the structure is often not available either. Theengineer, who is investigating the structure, needs to find the required information bycollecting all the data he can find on the structure. In case of an earthquake analysis,it may also be useful to find old records reporting of historical earthquakes in theregion. They may tell the engineer if the structure already underwent some seismicactivity. The masonry characteristics of an old structure are also difficult to estimate,since there were no codes existing at the time of the construction, which wouldprovide information on minimal requirements. If a material survey of the structure istoo excessive, the engineer has to define the parameters using the provisions in thecodes or by using reference values of similar structures.
In any case, a site visit of the structure is recommended. Under proper preparation,several questions may be answered during this inspection. Dependent on howdeeply the analysis should be performed, it may be necessary to drill some holes intothe walls or to open some floors to see their construction. Similarly, connections anddetails are often hidden from the eye, which makes it difficult to discover them. Anexperienced engineer might eventually be able to suggest their existence andlocation. In this case an investigation at the expected location may give confirmation.
Analyzing an old building means that a structure is investigated, which exists ofmaterials that have been exposed to several influences. Hence, it would be wrong toexpect from an old building to satisfy the latest design criteria. An old, intact buildingmay already have reached its original live expectancy. If the structure presents itselfstill in a good shape, it could be economical to upgrade it in order to extend its lifeduration. On the other side, if the structure is in a bad shape, it might beuneconomical to renovate it and thus it would be better to demolish it and buildsomething new.
Most existing buildings in Switzerland are not designed for earthquake loads. If they
are investigated, they often fail to satisfy the seismic requirements for new buildings. According to the existing codes, existing buildings have to be assigned to the non-ductile structural behavior class meaning that a q-factor as low as 1.5 has to be

7/21/2019 masterthesis_uelicamathias
http://slidepdf.com/reader/full/masterthesisuelicamathias 20/137
2 Masonry Structures
4
assumed which leads to high seismic action effects. It may be rather uneconomic toupgrade existing buildings so that they satisfy the requirements of the new codes.Therefore a separate Standard SIA 2018 [3] was introduced in 2004 in order to offera standard with lower seismic requirements for existing buildings [4].
The lower requirements for existing buildings are justified because first, the actualstrength of the components is greater than the one used in the evaluation and sec-ond, because an existing building has left a reduced life expectancy [5].
2.2 Methods of Evaluation
This chapter presents an overview of the seismic evaluation procedures. They canbe divided into two main groups: configuration-based checks and strength checks.The configuration-based checks serve as a tool to figure out unfavorable building
characteristics, while the strength checks serve to assess the load carrying capacityof the structure. If the configuration is unfavorable, the building is not performing aswell during an earthquake as a regular building. Deficiencies are found in irregulargeometry, a weakness in a given story, concentration of mass, or in discontinuity inthe lateral force resisting system. Strength, stiffness, geometry and mass are foundto involve irregularities, while horizontal distribution of lateral forces to the resistingframes or shear walls involve horizontal irregularities. [5] As seen in Figure 2.1, thechecks include an investigation of the load path, weak story, soft story, geometry andeffective mass as well as torsion and pounding.
Figure 2.1 General structure of evaluation procedures [5]
The strength checks include a more in-depth investigation. In this category twogroups of investigation can be found, namely the global level and the componentlevel checks. In general, global level checks include the estimation of the shearstress and axial stress. With the shear stress check, a quick assessment of theoverall level of demand of the structure is provided. The axial stress checkinvestigates columns that carry substantial amounts of gravity loads and that maytherefore have limited additional capacity resistance against seismic forces. Columns

7/21/2019 masterthesis_uelicamathias
http://slidepdf.com/reader/full/masterthesisuelicamathias 21/137
Masonry Structures 2
5
with high gravity loads may fail in a non-ductile manner because of excessive axialcompression and especially under horizontal displacement [5].
The component level analysis gives a more detailed assessment of the building. Ithelps identifying the weak links of a building. These checks exist out of two types of
analysis, the force-based methods and the displacement-based methods. Adeformation-controlled action can be defined as an action where a deformation isallowed to exceed the yield value. The maximum deformation is limited by theductility capacity of a component. A force-controlled action is in contrast defined asan action where the deformation is not allowed to exceed the yield point value [5].
2.3 Swisscode
Until the year of 1970, no regulations concerning the seismic design of structures
were existent. The first one was mentioned in SIA 160 [6]. Only five years later, therecommendation SIA 160/2 [7] dealing with the seismic design, was released. In1989 three importance classes, as well as the first response spectra, wereimplemented in the new SIA 160 [8]. By 1999, the development of the so-calledSwisscodes, a new generation of codes, was initialized. The new codes are generallybased on the Eurocodes with some adaptations. Within four years, the new codeswere published. Concerning the earthquake design it seemed somewhatexaggerated to develop a self-standing document for the seismic regulations. Henceit was decided to spread the seismic information in different design codes. Theregulations concerning the earthquake loads were added to the action code
SIA 261 [9], while the specific material characteristics concerning seismic designwere integrated into the corresponding design codes for the different materials. Thisway, an improved user-friendliness of the code could be achieved [4].
Because most of the existing buildings in Switzerland are not designed underearthquake considerations, Standard SIA 2018 [3] was released in the year 2004. Inthis document an evaluation procedure for existing buildings is explained. Theprocess is apparent from Figure 2.2.

7/21/2019 masterthesis_uelicamathias
http://slidepdf.com/reader/full/masterthesisuelicamathias 22/137
2 Masonry Structures
6
Figure 2.2 Evaluation procedure according to SIA D0237 [1]
According to standard SIA 2018, the investigation is divided into three main steps asexplained below.
The first step consists of a survey of the building. In this phase, the basic material iscollected and evaluated. The structure is assigned to an importance class. Furtherthe structural properties are analyzed. The material characteristics need to beinvestigated and defined for the following analysis of the building’s resistance. In the
second step the factor of compliance is estimated and then compared with thereduction factors and . Further the evaluation of the non-structural elements
7/21/2019 masterthesis_uelicamathias
http://slidepdf.com/reader/full/masterthesisuelicamathias 23/137
Masonry Structures 2
7
follows. Eventually an evaluation of commensurability in order to insure a proper useof mediums to reduce the general risk and reasonableness is committed.
In the third and last step, improvement recommendations follow. Theserecommendations concern rather general principles then detailed, practical solutions.
Standard SIA 2018 states that masonry structures are usually investigated usingforce-based design methods. If deformation-based design methods are selected toanalyze masonry structures, which are generally preferred for existing buildings, thefloor displacements are compared. The required assumptions may be taken usingSIA 266 [10] and EC8-3 [11]. Further it is explained that the out-of-plane resistance ischecked by comparing the wall’s slenderness with the corresponding values inTable 1 of standard SIA 2018.
In order to examine the seismic resistance of existing buildings, the Federal Office forWater and Geology (FOWG) developed an evaluation procedure [12] based on theFEMA 310 [13] and the standard SIA 2018. In order to discover the deficiencies of abuilding as quickly as possible, it includes evaluation steps based on checklistssimilar to FEMA 310. Once deficiencies are discovered, standard SIA 2018 is appliedfor a more in-depth analysis.
2.4 Eurocode
Unlike the Swisscode, Eurocode 8 exists out of six parts concerning seismic rules
written on not less then 638 pages. The EC8-1 [14] provides general seismicrequirements for analysis and the EC8-3 [11] deals with more specific requirementsand devotes a chapter to existing masonry structures. By contrast, Swisscode hasonly 26 pages dealing with seismic design [4].
Because Swisscode is in many issues based on Eurocode, Eurocode has a similarevaluation procedure for old masonry structures. The procedure can also be dividedinto three steps as shown in Figure 2.3.
The first step describes the survey of the building. It includes the same tasks as
described above in Chapter 2.3. In addition to the Swisscode, the Eurocode definesthree knowledge levels. A confidence factor belongs to each level. This factor is usedto regard the uncertainties related to the analysis of the relevant structure. With thislevel, Table 3.1 of EC8-3 explains which analysis methods can be applied. Theconfidence factors are defined as follows:
Limited knowledge CFKL1 = 1.35
Normal knowledge CFKL2 = 1.20
Full knowledge CFKL3 = 1.00

7/21/2019 masterthesis_uelicamathias
http://slidepdf.com/reader/full/masterthesisuelicamathias 24/137
2 Masonry Structures
8
In the second step the verification of the analysis is held. For plain masonrybuildings, static non-linear methods are adopted. After the analysis is performed, acomputational verification is made at the component level. It is based on theverification of all cross-sections. If a time domain method is used, the post yielddeformations should be higher than the corresponding demand values. Further thepredicted level of damage has to be kept within acceptable limits. In case that therequirements are not satisfied, the third step is required, in which structuralinterventions are described conceptually. In contrast to the Swisscode, they are moredetailed. But Eurocode also fails to describe practical solutions in detail [5].
Figure 2.3 Evaluation procedure according to Eurocode 8 [5]
2.5 FEMA
The Federal Emergency Management Agency (FEMA) developed an own evaluationprocedure. It contains a rigorous approach to determine existing structural conditions.Like the Eurocode, it knows performance levels of design, which describe the level ofdamage. The performance levels are determined by the importance of the building
and the consequences of damage. In the Swisscode, for instance, are noperformance levels defined yet. Before beginning the seismic evaluation the data of

7/21/2019 masterthesis_uelicamathias
http://slidepdf.com/reader/full/masterthesisuelicamathias 25/137
Masonry Structures 2
9
the building needs to be collected. Then the evaluation starts, consisting out of threetiers, as presented in Figure 2.4.
In the first tier, the screening phase, the building is briefly analyzed. The intention isto realize as quickly as possible if the structure complies with the provisions of the
FEMA 310. The investigation follows a checklist. After its evaluation it should becomeclear which parts of the structure do not meet the requirements of the building codes.Where the requirements are not satisfied a deeper evaluation is required.
With tier 2, two options are available. Either a complete analysis of the building isperformed concerning the deficiencies identified in tier 1 or only the deficient partsare analyzed in detail. Generally simplified linear analysis methods are applied, suchas linear static or dynamic analysis methods. For unreinforced masonry buildingswith flexible diaphragms, a displacement-based lateral force procedure is required. If
the structure does still not satisfy the criteria, a detailed evaluation follows with tier 3.In this step, conservative assumptions should be minimized. To justify such adetailed evaluation, a significant economic or other advantage is required. If an
Figure 2.4 Evaluation procedure according to FEMA 310 [5]

7/21/2019 masterthesis_uelicamathias
http://slidepdf.com/reader/full/masterthesisuelicamathias 26/137
2 Masonry Structures
10
existing building is analyzed, a factor of 0.75 is multiplied to the conservative levelused in design for new buildings [5].
2.6 Comparison of Eurocode 8 and FEMA 310
According to Dr. Durgesh C. Rai [5], the seismic evaluation procedure of FEMA 310is a better option than Eurocode 8. In his comparison of analysis procedures, henotices that Eurocode 8 describes mostly the principles of evaluation but is missingspecific steps of assessment and leaves a lot to the judgment of the designprofessional, which makes it difficult to use. Some parameters are lacking guidanceprovision and are therefore inquire a higher degree of understanding by the designprofessional. What the codes have in common is that they suggest a reduction in theforce level for the analysis of existing buildings compared to new buildings. In thetier 3 of the evaluation procedure according to FEMA 310, a reduction factor of 0.75
is applied to seismic forces. Eurocode 8 mentions that considering the smallerremaining lifetime of an existing structure, the effective peak ground accelerationshould be reduced for redesign purposes. However, it gives no quantitativecriterion [5].
7/21/2019 masterthesis_uelicamathias
http://slidepdf.com/reader/full/masterthesisuelicamathias 27/137
Survey of the Bundeshaus Ost Building 3
11
3 Survey of the Bundeshaus Ost Building
The so-called Bundeshaus Ost (from now on referred to as BHO) in Bern is part ofthe parliament-building complex. It has already been used in example two of theSIA D0237 as a reference building. Since the establishment of the building it hasbeen used as an administration building. This chapter deals with the survey of thebuilding. The goal of a survey of the building is to collect information about the objectof interest. To conduct a seismic analysis of a masonry structure, it is essential tocollect as much information about the structure as possible. With each lack ofinformation, the significance of the analysis declines. The definition of the expectedperformance criteria requires the knowledge of the seismic situation of the location of
the building. These parameters are described in Chapter 3.1. In respect of theanalysis of the response of the structure, it is necessary to know the geometricproperties of the structure but also to understand which elements form the load-carrying system. This part is often considered to be rather difficult for old masonrystructures and is treated in Chapter 3.2 and Chapter 3.3. In Chapter 3.4 the issue offlexible and rigid floors is explained. Following, Chapter 3.5 discusses the mechanicalproperties of the masonry walls will be discussed. Then, Chapter 3.6 reports of thesite visit of the structure, which completes the survey of the building.
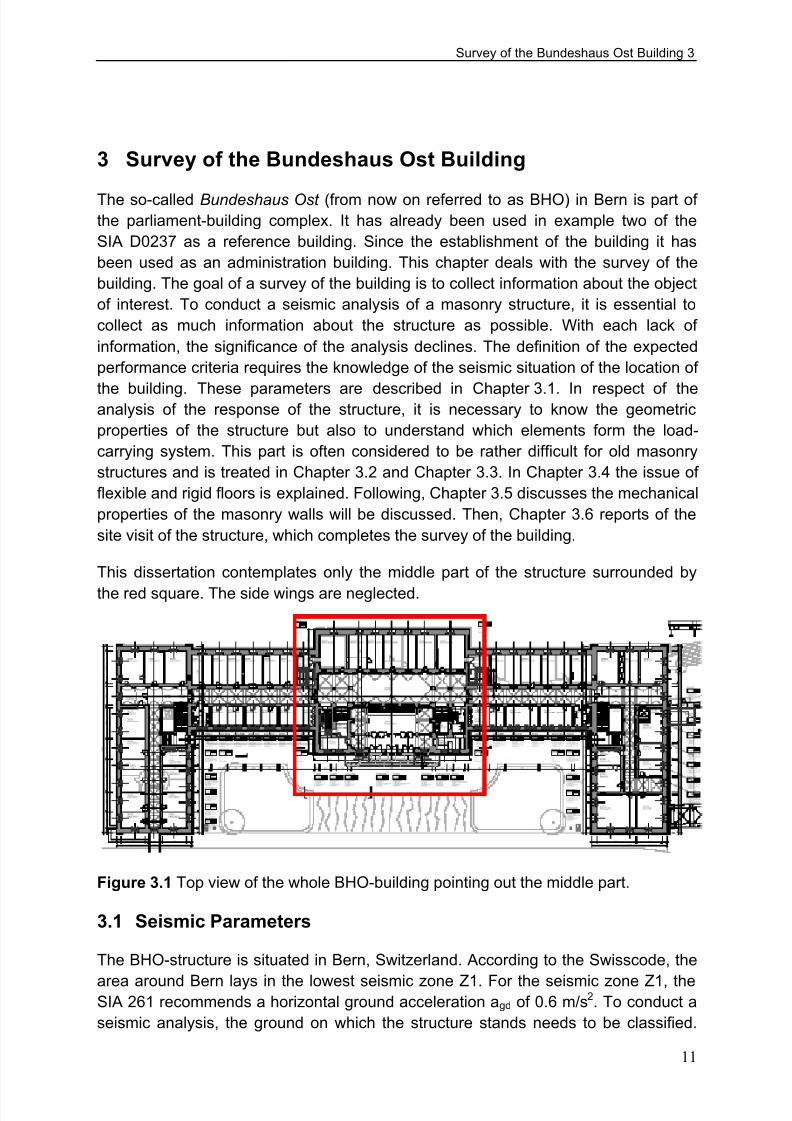
This dissertation contemplates only the middle part of the structure surrounded by
the red square. The side wings are neglected.
Figure 3.1 Top view of the whole BHO-building pointing out the middle part.
3.1 Seismic Parameters
The BHO-structure is situated in Bern, Switzerland. According to the Swisscode, the
area around Bern lays in the lowest seismic zone Z1. For the seismic zone Z1, theSIA 261 recommends a horizontal ground acceleration agd of 0.6 m/s2. To conduct aseismic analysis, the ground on which the structure stands needs to be classified.
7/21/2019 masterthesis_uelicamathias
http://slidepdf.com/reader/full/masterthesisuelicamathias 28/137
3 Survey of the Bundeshaus Ost Building
12
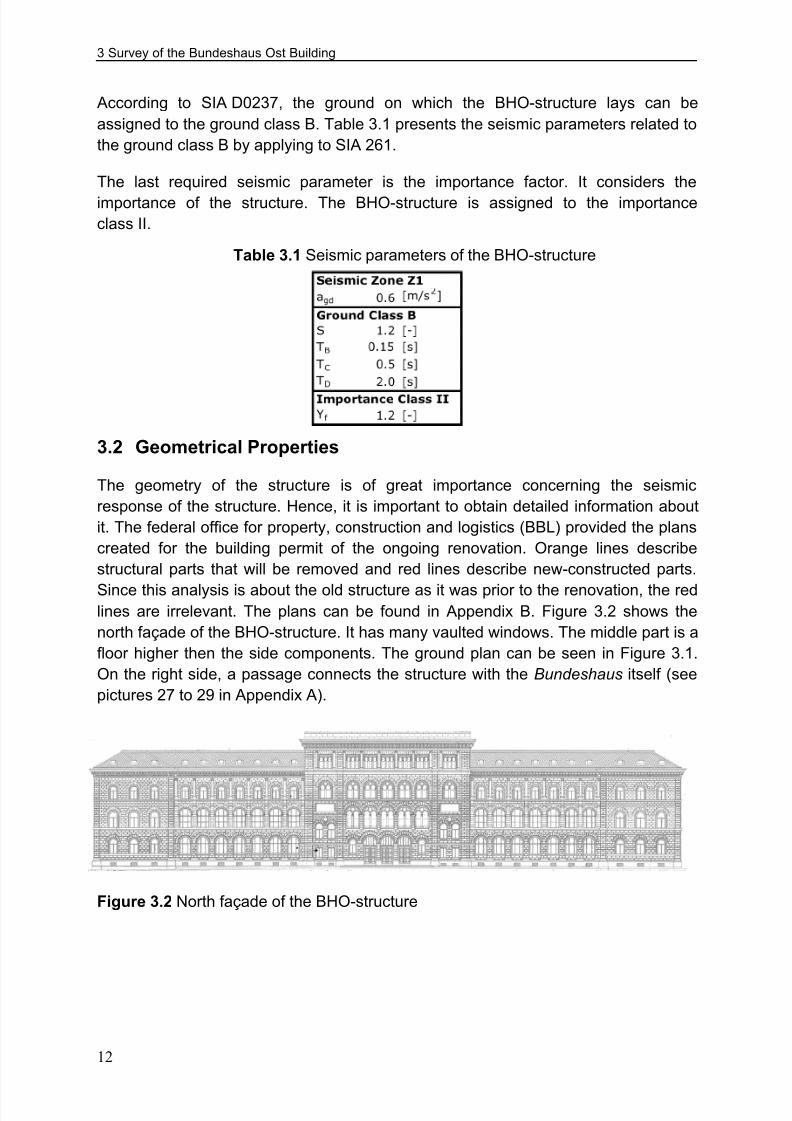
According to SIA D0237, the ground on which the BHO-structure lays can beassigned to the ground class B. Table 3.1 presents the seismic parameters related tothe ground class B by applying to SIA 261.
The last required seismic parameter is the importance factor. It considers the
importance of the structure. The BHO-structure is assigned to the importanceclass II.
3.2 Geometrical Properties
The geometry of the structure is of great importance concerning the seismicresponse of the structure. Hence, it is important to obtain detailed information aboutit. The federal office for property, construction and logistics (BBL) provided the planscreated for the building permit of the ongoing renovation. Orange lines describestructural parts that will be removed and red lines describe new-constructed parts.
Since this analysis is about the old structure as it was prior to the renovation, the redlines are irrelevant. The plans can be found in Appendix B. Figure 3.2 shows thenorth façade of the BHO-structure. It has many vaulted windows. The middle part is afloor higher then the side components. The ground plan can be seen in Figure 3.1.On the right side, a passage connects the structure with the Bundeshaus itself (seepictures 27 to 29 in Appendix A).
Figure 3.2 North façade of the BHO-structure
Table 3.1 Seismic parameters of the BHO-structure
7/21/2019 masterthesis_uelicamathias
http://slidepdf.com/reader/full/masterthesisuelicamathias 29/137

7/21/2019 masterthesis_uelicamathias
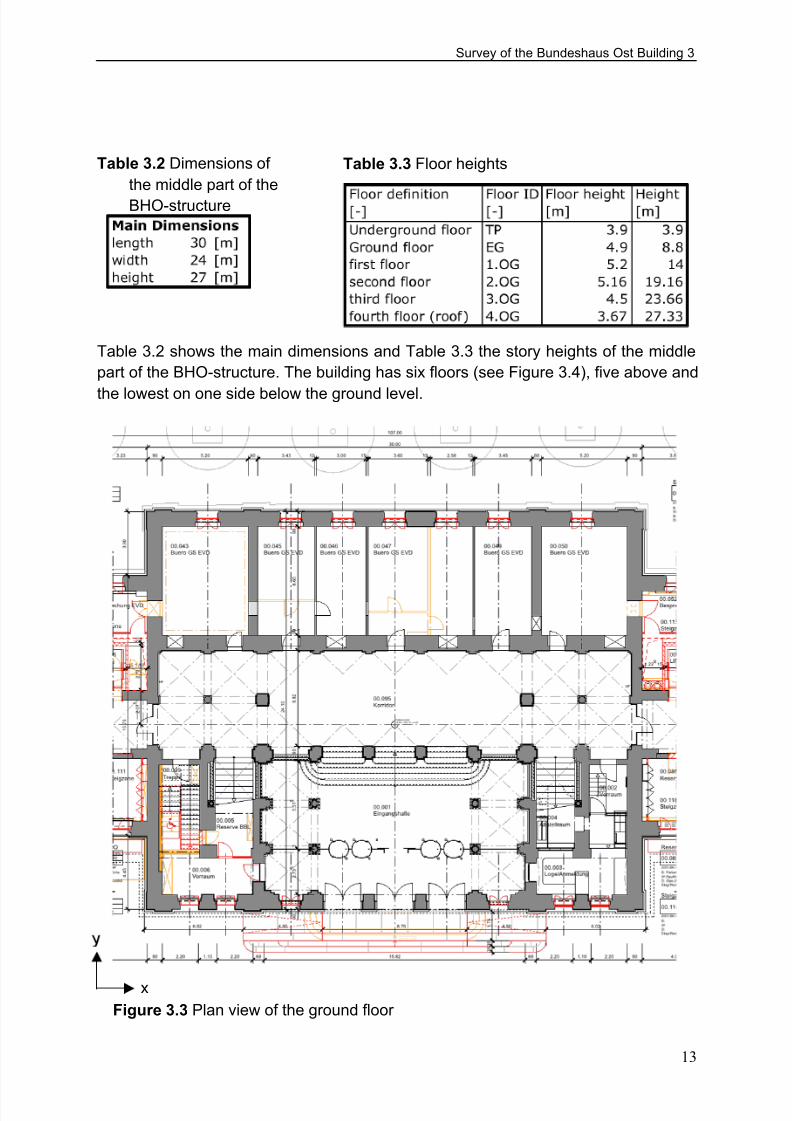
http://slidepdf.com/reader/full/masterthesisuelicamathias 30/137
3 Survey of the Bundeshaus Ost Building
14
Considering Figure 3.3 it becomes clear that the building has a symmetric layout.There are two staircases in both bottom corners of the plan. The horizontal space inthe center of the plan forms the corridor, combining the two side wings of the wholebuilding. This corridor is found in every floor. Across the upper part of the plan, theoffice facilities are found. They are situated on this side of the building in each floor. Additional office and meeting rooms can be found over the entrance hall, from thesecond floor upwards. On the fourth floor a roof building with office facilities situated.
The story height varies between 3.9 m in the basement to 5.2 m on the first floor. The
entrance hall is visible in Figure 3.3. In the entrance hall there is no ceiling separatingthe entrance floor from the first floor, which is why the entrance hall has a height of10 m.
Figure 3.4 Cross section of the middle part of the BHO-structure
x
z
7/21/2019 masterthesis_uelicamathias
http://slidepdf.com/reader/full/masterthesisuelicamathias 31/137
Survey of the Bundeshaus Ost Building 3
15
3.3 Structural Properties
3.3.1 General
The construction of the BHO building was completed in 1892 as a masonry structure. As already mentioned above, it has been used as an administration building sincethen. Over the years some modifications were performed. However, thesemodifications did not change the original load-carrying system. There are neitherstatically relevant corner connections nor statically significant supplements known.The opening-overlaps are constructed using vaults according to the constructionmethod of that time. No ring anchors are used. So far there are no lined openingsknown [1].
3.3.2 Floors
Several different floor types can be found. At the entrance, the floors consist out ofpressure vaults with steel beams. Then the middle corridor lies on barrel vaults. Fromthe first floor to the fourth floor, the offices floors are composed out of one-waytimber. In the middle corridor pressure vaults can still be found, while the gallery inthe entrance hall lays on cross vaults. On the second floor the corridor floor consistsagain out of pressure vaults, while the other floor parts are made of one-way timber.The floor over the entrance hall is also out of one-way timber supplemented by fewiron girders. Then, on the third and fourth floor only one-way timber floors can be
found. Later, the in-plane rigidity of the third floor diaphragm is investigated in detail.In Appendix B the different floor types and their load-carrying directions arevisualized.
3.3.3 Walls
Figure 3.5 shows the main walls, which are responsible for the horizontal resistanceof the structure. This figure presents the ground floor. The colored walls continueover the height of the building, except the ones between the stairs. Because the
staircases only lead until the second floor, these walls end there. Therefore, thesewalls cause an additional stiffness in the lower floors. The staircases between thesecond and third floor are situated outside the middle part of the building in the side-wing-structures.
The masonry wall has a varying thickness. In the basement there are sections with athickness of 1.2 m. Since the loads are smaller in higher floors, the wall thicknessbecomes smaller. On top of the building, the roof-surrounding wall has left athickness of 0.5 m. The inside walls, pointing in y-direction are reduced to 30 cm onthe third floor.

7/21/2019 masterthesis_uelicamathias
http://slidepdf.com/reader/full/masterthesisuelicamathias 32/137
3 Survey of the Bundeshaus Ost Building
16
3.4 Rigid and Flexible Floors
In case of an earthquake, a floor is supposed to transfer the acting loads, vertical ashorizontal, to the walls. Then, the walls forward the loads to the foundation and intothe ground. The floors may enables an interaction between single walls and therebyprovide a global response behavior of the structure. The degree of interference is
dependant on the composition of the floors and the connections from walls to floorsand between the walls themselves. The load-carrying direction of the floors is also ofgreat importance. In older buildings, these connections need to be examined. Next,the stiffness of the ceilings is relevant. If a floor is rigid, load redistribution can occuras single components reach their capacity. The resistance of walls and thecomposition of the floors define how the loads can be distributed. The floor-surrounding walls can only reach their capacity if the walls possess enoughdeformation capacity. This is important for displacement-related analyses. Incontrast, more flexible floor-systems do not distribute the loads to the surrounding
walls so well and therefore these walls have more the character of a singlestructure [1].
A study conducted by Tena-Colunga and Abrams [15] on three buildings showed thatthe diaphragm and shear-wall accelerations might increase as the diaphragmflexibility increases. They also determined that flexible in-plane shear walls vibrate athigher accelerations than stiffer walls in a flexible-diaphragm system. Further, theymention that by considering the flexibility of the diaphragms torsional effects can bereduced considerably. Another interesting observation is that in comparison to thefundamental period estimated with simplified methods, the fundamental period with
flexible diaphragms appears to be longer. Moreover it is important to understand that
Figure 3.5 Load carrying structural walls (blue = x-direction, green = y-direction)

7/21/2019 masterthesis_uelicamathias
http://slidepdf.com/reader/full/masterthesisuelicamathias 33/137
Survey of the Bundeshaus Ost Building 3
17
a design criterion, which is based on a rigid-diaphragm behavior, is not alwaysconservative for systems based on flexible-diaphragm [15].
In Figure 3.7 the behavior of a system is presented, in which the floor is onlyconnected to the walls A that point in the same direction as the lateral load acts.
These two walls A carry the whole weight of the floor and they forward these loadsinto the ground. Because of that, they deform in the lateral load-acting direction,while the two perpendicular walls B, which have no connection to the wall, show noeffects originating from the floor. In Figure 3.6, the opposite situation is explained.Only B-walls, which are perpendicular to the load impact, are connected to the floorand therefore carry the entire load. Because they are perpendicular to the horizontalload, it shows an out-of-plane behavior.
Most of the floors of the BHO-structure consist out of one-way timber floors. In thelower elevations are also some pressure vaults with steel beams that carry the loadsunidirectional as well. The only bi-directional elements of the structure are the crossvaults and the barrel vaults. For this reason, the floors affect mainly the walls the wayit is described above.
According to FEMA 356 [16] classifies diaphragms according to their stiffness asflexible, rigid or stiff. It states that if the maximum horizontal deformation of the
diaphragm along its length is more then twice the average interstory drift of thevertical lateral-force-resisting elements of the story immediately below the diaphragmit shall be classified as flexible. Further it says that diaphragms shall be classified asrigid when the maximum lateral deformation of the diaphragm is less than half theaverage interstory drift of the vertical lateral-force-resisting elements of theassociated story. If a diaphragm can neither be classified as flexible nor as rigid it isclassified as stiff [16].
In Figure 3.8 a diaphragm deflection is shown. The deformation $W stands for thedisplacement of the diaphragm-wall-system. If a flexible floor is loaded horizontallywith a load pointing in the same direction as the diaphragm is connected to, an
Figure 3.7 diaphragm is connected towalls A [1]
Figure 3.6 diaphragm is connected towalls B [1]

7/21/2019 masterthesis_uelicamathias
http://slidepdf.com/reader/full/masterthesisuelicamathias 34/137
3 Survey of the Bundeshaus Ost Building
18
additional deflection $d can be caused. This way, the diaphragm experiences in themiddle a larger horizontal deformation as at the sides, where it is fixed.
3.5 Masonry Properties
The definition of the mechanical properties of the masonry of an old masonry buildingis rather difficult. If a detailed seismic analysis is requested, it is necessary to gainthe required parameters experimentally. If such a detailed investigation is too
excessive the values can be defined using reference values that describe thecharacteristics of the masonry as precisely as possible. Another way to obtain therequired values is to use the provisions in the codes or by applying empiricalformulations.
The BHO-structure masonry exists out of Bernese sandstone from the 19th century.Within the scope of the ongoing renovation of the BHO-structure, a material propertysurvey is included. Unfortunately the results are not available yet. Hence, themasonry parameters are estimated as explained below.
According to EC6 [17], the characteristic compressive strength of the masonry canbe obtained from the normalized mean compressive strength of the unit and the
compressive strength of the mortar using:
(3.1)
The value of is found in Table 3.3 of EC6. For dimensioned natural stone it is 0.45.Since the mortar joints are quite thick and because the quality of the used mortar isunknown, the compressive strength of the mortar is selected conservatively as
2 N/mm2
. In Appendix 3 of SIA V178 [18], the characteristic compressive strength ofBernese sandstone is recommended to be between 25 N/mm2 and 40 N/mm2. For
Figure 3.8 Diaphragm and wall deformation [16]

7/21/2019 masterthesis_uelicamathias
http://slidepdf.com/reader/full/masterthesisuelicamathias 35/137
Survey of the Bundeshaus Ost Building 3
19
the BHO-structure a value of 30 N/mm2 is chosen. With this values a characteristiccompressive strength of the masonry of the BHO-structure of 6 N/mm2 results.
Applying SIA 266 [10], the design values follow out of equations (3.2) and (3.3).
(3.2)
(3.3)
Where and are equal to 1 and is selected as 1.5 since the masonry has filled
joints. In SIA 266 the partial factor is defined as 2. Compared with the Eurocode,
this value may be a little confusing. According to the Eurocode, depends on the
quality of the unit and on the quality of the brick laying. The quality of the brick layingcan only be judged during the construction. For old masonry structures as this onehere, it is rather impossible to make a statement about the laying quality of more then100 years ago. As already mentioned in Chapter 2, the Eurocode defines aknowledge level, which includes all kind of uncertainties for the analysis of oldstructures. In the Swisscode such knowledge level factors do not exist yet. Thereforethe factor , which is actually a material uncertainty factor, is here used to cover the
general uncertainties.
The values of the coefficient of the inner friction of the bed joints and the specific
weight of the masonry are chosen from the table in the second example ofSIA D0237.
The estimation of the modulus of elasticity of the masonry is based on theapproximation presented in SIA 266/2 [19].
(3.4)
The code recommends a value between 3000 N/mm2 and 4000 N/mm2. For the
BHO-structure the middle value of 3500 N/mm2 is used. Knowing the elastic
modulus of the masonry the shear modulus can easily be estimated using thefollowing equation (3.5).
(3.5)
For the numerical analysis, which follows later, the average compression strength
of the masonry is required. The acronym should not be confused with the
compression strength of the mortar as in SIA 266. Like 3Muri, this dissertation
defines as the mean compression strength of the masonry. According toEN 1052-1 [20] three identical specimens are tested in order to evaluate thecompression strength of masonry. If the compression strength of masonry units and

7/21/2019 masterthesis_uelicamathias
http://slidepdf.com/reader/full/masterthesisuelicamathias 36/137
3 Survey of the Bundeshaus Ost Building
20
mortar differ within ± 25% of the specified strength, the mean compression strengthis adjusted. With this in mind, the compression strength of the BHO-masonry
is approximated using equation (3.6) [21].
(3.6)
Table 3.4 summarizes the mechanical properties of the masonry of the BHO-structure.
3.6 Site Visit
3.6.1 Basics
The site visit is an important part of the survey of the building. Its main goal is toverify the collected data on its actuality. During the inspection, measurements ofsome elements should help to verify the accuracy of the dimensions on the plans.Before the site visit is performed, it is recommended to study the collected data andto prepare for the site inspection. A useful tool is to write down all the lackinginformation, which the site visit should clarify. This way the site visit can proceedmost effectively.
As mentioned in Chapter 2, existing buildings have often experienced modificationsover time. Bigger modifications are probably recorded somewhere but also smallerones may have occurred, which are not always recorded. Therefore smallmodifications are often very difficult to discover. For a seismic analysis they might berelevant if they affect the original load-carrying system. If a detailed analysis isrequested, it may be necessary to take a detailed look at some walls or floors, whichmeans that they need to be opened. Connections are often hidden from the normaleye.
Table 3.4 Characteristic parameters of the BHO masonry

7/21/2019 masterthesis_uelicamathias
http://slidepdf.com/reader/full/masterthesisuelicamathias 37/137
Survey of the Bundeshaus Ost Building 3
21
3.6.2 BHO-Structure
The use of photographs is a powerful tool for site visits. Unfortunately it was notpermitted to take pictures inside the building. Hence, the pictures of the siteinvestigation in Appendix A show only the outside of the building.
In general there are several questions about the structure of this building. Thesequestions concern the detailed composition of floors and walls as well as possiblehidden reinforcements. Some of them could be answered by the site visit, whileothers remain unanswered. If an old masonry structure is analyzed, anotherimportant question concerns the properties of the used masonry. During theinspection, masonry wall sections were studied in terms of its composition. The head joints are about 5 cm thick while the bed joints show a thickness of about 2-3 cm.Thus, the shear modulus of the structure depends probably mostly on the quality of
the mortar. The masonry stones are 60 cm high and over 1 m long in general. Thestones could be identified to be sandstones as mentioned in SIA D0237. During theinspection it became clear that the foundation of the BHO-structure is build on someold masonry walls of the previous hospital, called Inselspital. While the foundation ofthe BHO-structure was built, some openings of these old walls were lined with usualclay-brick masonry of that time. On the plan shown in Figure 3.3, the wall betweenthe stairs appears to be solid. During the site visit these walls turned out to consistout of vaulted openings. For this reason, they will later be modeled with openings. Onthe third floor, some investigation holes conducted in the walls pointing in the x-direction showed clay-brick masonry. This information is confusing since the mainstructural walls were assumed to consist out of sandstone masonry. For the followinganalysis, these walls will be assumed to consist out of sandstone masonry as the restof the structural walls. The steel beams between the compression vaults in thebasement ceiling could be found, as they are showed in the plans. Moving up thebuilding, the declination of the wall thickness over the height of the building can beconfirmed as well. The one-way timber floors were found to be as they are describedin the example of SIA D0237. One floor differs from the original composition and was,according to the site engineer, modified some time ago due to a heating systemreplacement. However, this floor is irrelevant for the analysis since it is situated in a
side corridor of the building. Another modified ceiling could be found on the thirdfloor. This modification is connected with the renovation of the roof, which took placeseveral years ago. During this renovation, the “roof-house” was built. In order toincrease the floor strength for the roof-house, steel beams were inserted.
In accordance to Chapter 3.6.1, some walls of the building were measured during theinspection and they confirmed the dimensions presented on the plans.
7/21/2019 masterthesis_uelicamathias
http://slidepdf.com/reader/full/masterthesisuelicamathias 38/137
4 Seismic Analysis Procedures
22
4 Seismic Analysis Procedures
In this chapter, the existing analysis procedures that serve for evaluation of individualbuildings are briefly described according to Lang [22]. They can be divided into linearand nonlinear procedures.
4.1 Linear Static Procedures
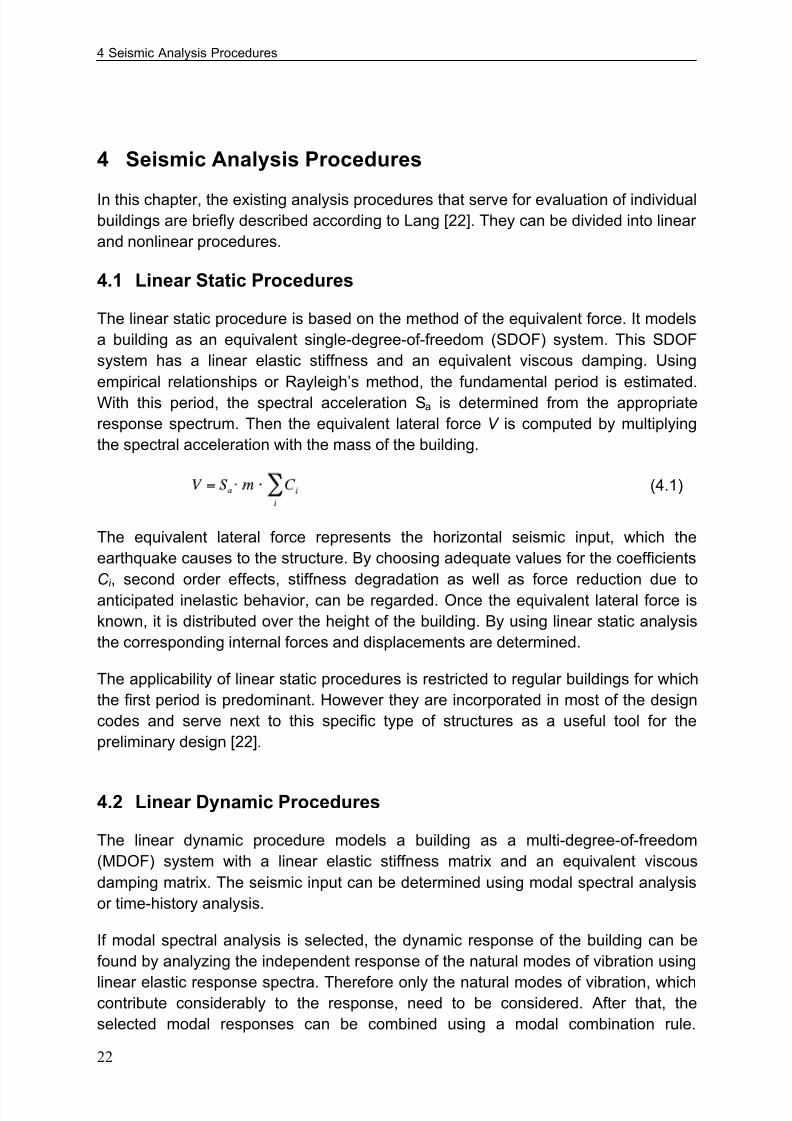
The linear static procedure is based on the method of the equivalent force. It modelsa building as an equivalent single-degree-of-freedom (SDOF) system. This SDOFsystem has a linear elastic stiffness and an equivalent viscous damping. Usingempirical relationships or Rayleigh’s method, the fundamental period is estimated.With this period, the spectral acceleration Sa is determined from the appropriateresponse spectrum. Then the equivalent lateral force V is computed by multiplyingthe spectral acceleration with the mass of the building.
(4.1)
The equivalent lateral force represents the horizontal seismic input, which theearthquake causes to the structure. By choosing adequate values for the coefficientsC i , second order effects, stiffness degradation as well as force reduction due toanticipated inelastic behavior, can be regarded. Once the equivalent lateral force isknown, it is distributed over the height of the building. By using linear static analysisthe corresponding internal forces and displacements are determined.
The applicability of linear static procedures is restricted to regular buildings for whichthe first period is predominant. However they are incorporated in most of the designcodes and serve next to this specific type of structures as a useful tool for thepreliminary design [22].
4.2 Linear Dynamic Procedures
The linear dynamic procedure models a building as a multi-degree-of-freedom(MDOF) system with a linear elastic stiffness matrix and an equivalent viscousdamping matrix. The seismic input can be determined using modal spectral analysisor time-history analysis.
If modal spectral analysis is selected, the dynamic response of the building can befound by analyzing the independent response of the natural modes of vibration using
linear elastic response spectra. Therefore only the natural modes of vibration, whichcontribute considerably to the response, need to be considered. After that, theselected modal responses can be combined using a modal combination rule.

7/21/2019 masterthesis_uelicamathias
http://slidepdf.com/reader/full/masterthesisuelicamathias 39/137
Seismic Analysis Procedures 4
23
Chopra [23] describes such rules in his book Dynamics of Structures. A commoncombination rule is the square-root-of-sum-of-squares (SRSS) rule shown below.
(4.2)
If time-history analysis is selected, a time-step-by-time-step evaluation of the buildingresponse needs to be carried out. As base motion input, recorded or syntheticearthquake records, can be used.
The corresponding internal forces and displacements are again determined usinglinear static analysis.
The main benefit of the linear dynamic procedures in comparison to the linear static
procedures is that higher natural modes can be considered. Hence, this procedure ismore adequate for the seismic analysis of irregular structures. However, they are stillbased on linear elastic response and therefore as the nonlinear behavior increases,the applicability decreases. The nonlinear behavior is estimated using global forcereduction factors [22].
4.3 Nonlinear Static Procedures
The nonlinear static procedure incorporates directly the nonlinear force-deformationcharacteristics of individual components and elements based on inelastic material
response. There are several methods existing. What combines all of them is thenonlinear force-deformation characteristic of the structure, which is represented by apushover curve. A pushover curve is a curve showing the relation between the baseshear and the top displacement of the structure. This relation is obtained byincreasing monotonically the horizontal load impact or the horizontal displacement tothe structure model in correspondence to its first mode of vibration until it collapses.By using either highly damped or inelastic response spectra, the maximumdisplacements are determined, which are likely to be expected during a givenearthquake event.
The main advantage of this procedures in respect to the linear procedures is certainlythe fact, that the effects of nonlinear material response are directly included. Hencethe internal forces and deformations are more realistic approximations of thoseexpected during an earthquake. However, in these procedures usually only the firstmode of vibration is regarded and therefore these procedures are not appropriate forirregular structures, where higher modes obtain greater importance [22].
4.4 Nonlinear Dynamic Procedures
The nonlinear dynamic procedure uses a similar building model as the nonlinearstatic procedure. It incorporates directly the inelastic material response by using ingeneral finite elements. The major difference is the seismic input that is in contrast to

7/21/2019 masterthesis_uelicamathias
http://slidepdf.com/reader/full/masterthesisuelicamathias 40/137
4 Seismic Analysis Procedures
24
the nonlinear static procedure in using a time-history analysis. As mentioned inChapter 4.2, a time-step-by-time-step evaluation needs to be performed in a time-history analysis.
The application of a nonlinear dynamic procedure is rather challenging for predicting
forces and displacements under seismic input. The computed response tends to bequite sensitive to the characteristics of the individual ground motion used as seismicinput. It is necessary to perform several time-history analysis using different groundmotion records in order to obtain satisfying results. Since this analysis procedure isso demanding it serves mainly as a research tool. Especially its objective to simulatethe behavior of a building structure in detail is of great use. Details of interest may bethe exact displacement behavior, the propagation of cracks, the distribution of verticaland shear stresses as well as the shape of the hysteresis curves and other [22].

7/21/2019 masterthesis_uelicamathias
http://slidepdf.com/reader/full/masterthesisuelicamathias 41/137
Numerical Simulation 5
25
5 Numerical Simulation
For the numerical simulation of the seismic behavior of masonry structures the 3Murisoftware is selected. The following subchapters deal with a brief overview of theprogram, followed by a verification calculation using a simple test building structure. Afterwards the development of the BHO-structure will be discussed.
5.1 3Muri
5.1.1 General Description
3Muri is a numerical computation program created for the seismic analysis ofmasonry structures. It uses nonlinear static procedure analysis, where a pushovercurve of the building structure is generated. The nonlinear static analysis procedureis based on the N2 method. N2 methods are simplified procedures where a multi-degree-of-freedom system is investigated by analyzing an equivalent single-degree-of-freedom system, which represents the real structure. The program can examinelarge and small structures composed out of masonry with elements out of othermaterials, such as reinforced concrete, iron or wood. The software is used for thedesign of new structures as well as for the examination of existing structures [24].
As theoretical model the FME method was chosen. FME stands for Frame by MacroElements. This method is considered to be the most advanced method available inthe sector of masonry calculation. It is capable of considering the different failuremechanisms of masonry. Further a wall can be divided into three types of elements:Piers, spandrel beams and rigid elements. Pier elements are located at the sides ofopenings and spandrel beams represent the elements above openings. Theremaining parts of the wall form rigid elements (see Figure 5.1). Profound theoreticalstudies have shown that the behavior of piers and spandrel beams can be expressedas linear elements. By connecting these different elements the equivalent frame is
obtained. This frame simplifies the analysis since it reduces the degrees offreedom [24].

7/21/2019 masterthesis_uelicamathias
http://slidepdf.com/reader/full/masterthesisuelicamathias 42/137
5 Numerical Simulation
26
Figure 5.1 Types of macro-elements
5.1.2 Masonry Macro-elements
To represent masonry piers and spandrels, modeled as masonry macro-elements, anonlinear beam element model is implemented. According to the general descriptionof 3Muri [24], the main characteristics of such a nonlinear beam element are:
1. initial stiffness given by elastic (cracked) properties,
2. bilinear behavior with maximum values of shear and bending moment ascalculated in ultimate limit states,
3. redistribution of the internal forces according to the element equilibrium,
4. detection of damage limit states considering global and local damageparameters,
5. stiffness degradation in plastic range,
6. ductility control by definition of maximum drift based on the failure mechanism,according to the Italian seismic code [26] and EC8,
(5.1)
7. element expiration at ultimate drift without interruption of global analysis.
As soon as one of the nodal generalized forces reaches its maximum value, thenonlinear behavior is activated. The maximum value corresponds to the minimum
strength value obtained by computing the resistance of each failure mechanism [24].
Pier
Rigid element
S andrel beam
Opening
7/21/2019 masterthesis_uelicamathias
http://slidepdf.com/reader/full/masterthesisuelicamathias 43/137
Numerical Simulation 5
27
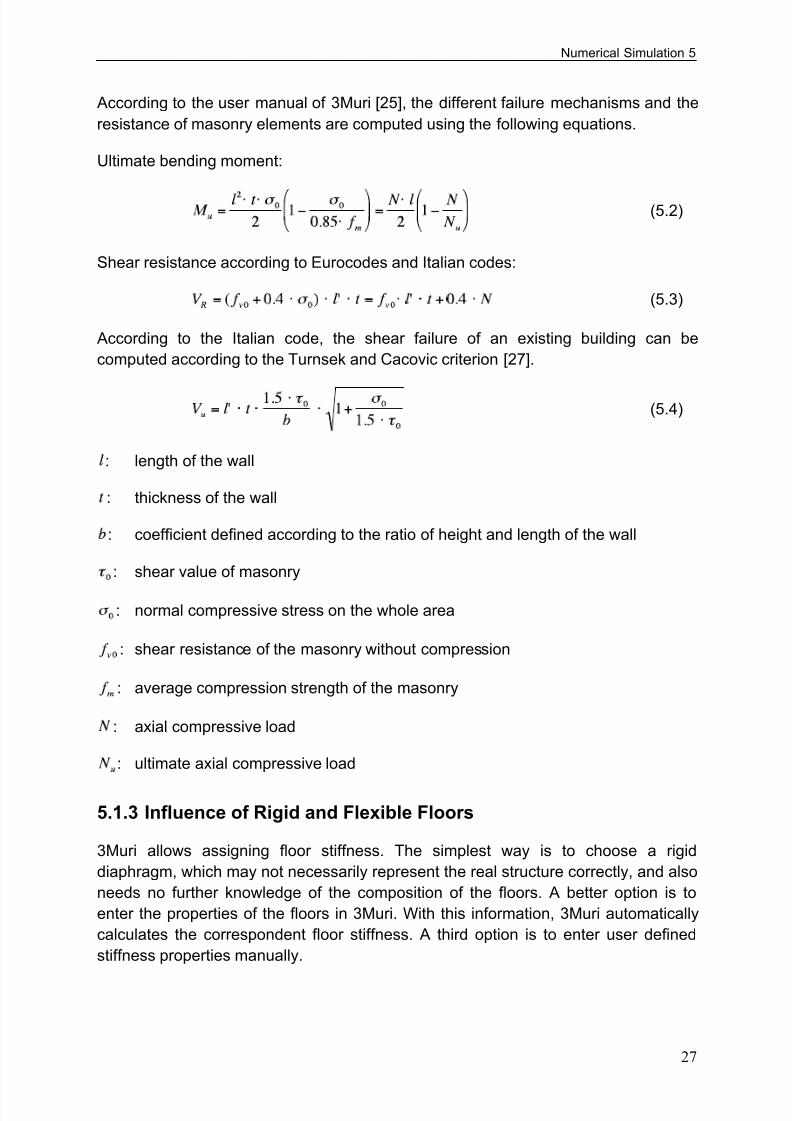
According to the user manual of 3Muri [25], the different failure mechanisms and theresistance of masonry elements are computed using the following equations.
Ultimate bending moment:
(5.2)
Shear resistance according to Eurocodes and Italian codes:
(5.3)
According to the Italian code, the shear failure of an existing building can becomputed according to the Turnsek and Cacovic criterion [27].
(5.4)
: length of the wall
: thickness of the wall
: coefficient defined according to the ratio of height and length of the wall
: shear value of masonry
: normal compressive stress on the whole area
: shear resistance of the masonry without compression
: average compression strength of the masonry
: axial compressive load
: ultimate axial compressive load
5.1.3 Influence of Rigid and Flexible Floors
3Muri allows assigning floor stiffness. The simplest way is to choose a rigiddiaphragm, which may not necessarily represent the real structure correctly, and alsoneeds no further knowledge of the composition of the floors. A better option is toenter the properties of the floors in 3Muri. With this information, 3Muri automaticallycalculates the correspondent floor stiffness. A third option is to enter user definedstiffness properties manually.

7/21/2019 masterthesis_uelicamathias
http://slidepdf.com/reader/full/masterthesisuelicamathias 44/137
5 Numerical Simulation
28
Afterwards the user sets the floor in the building model with defining its death and liveloads and its load-carrying direction. For some types of floors it is possible to choosea ratio for the bi-directional load distribution.
5.1.4 Computation Phase
Figure 5.2 shows the different steps required for a computation. The analysis of abuilding structure can be divided into three computation phases.
Figure 5.2 Computation steps [24]
The first phase stands for the input. Here the geometry of the model is defined,followed by its structural characteristics. Having prepared a dxf- or dwg-file includingthe geometrical properties of the load carrying walls as well as the openings, the firststep can be accomplished without any difficulty. Once the geometry of the walls isdefined, the material properties need to be defined. Meanwhile 3Muri has threedifferent design codes implemented. Those are: Italian code, Eurocode andSwisscode. When it comes to define the material properties, the program offers for
each code some standard materials, from which the user can choose. This is quiteuseful especially for new buildings. However, if an old masonry structure is to beanalyzed, the masonry material properties need to be defined additionally. They canbe added manually or by choosing the corresponding masonry type out of a list. Inthat case the program sets the values according to Eurocode. If the user entersmanually, he needs to select between the two options existing or new building. Inboth cases the masonry parameters such as the modulus of elasticity, the shearmodulus, the characteristic compression strength of the masonry, the meancompression strength etc. need to be entered. After the material properties are set,
they need to be assigned to all the walls of the structure. After that, the openings areadded. If balconies are existent, they are also added at this point. Next, the floors aredefined with their death and live loads and with the corresponding mechanical

7/21/2019 masterthesis_uelicamathias
http://slidepdf.com/reader/full/masterthesisuelicamathias 45/137
Numerical Simulation 5
29
properties. 3Muri includes the most frequently used types of floors. It automaticallycalculates the required values starting from its geometry. Further there are someoptions for taking into account if they are, for example, linked by the masonry or not.Next to the common floor types, it also includes brick vaults such as cross vaults,ribbed vaults and others [24].
The second phase deals with the analysis. In the first step, the three-dimensionalstructure building needs to be transformed into a three-dimensional equivalent framemodel. This happens using the auto-generate function of the program. If the auto-generated mesh is not satisfactory, it can be adjusted manually. In the second stepthe vertical loads of each floor need to be assigned to the equivalent frame model. Afterwards, the model is ready for the evaluation process. There are 24 differentanalysis combinations all together, as shown in Table 5.1. From these 24combinations, 12 are in x- and 12 in y-direction. In each direction four analyses
neglect accidental eccentricity while eight consider it. In accordance with Swisscode,the amount of accidental eccentricity is five per cent of the corresponding buildingside. Further the program offers two different patterns for the horizontal loaddistribution. One is the first-mode load pattern, the second the uniform mass-proportional load pattern. At last the program also considers bi-directional loading foreach combination. After choosing the desired analysis combinations, the programcomputes the horizontal displacements of the structure by monotonically increasingthe horizontal loads. The results are presented in terms of a front view of the selectedwall, a table showing the numeric results, the general deformed plan based on theload steps and a pushover curve.
In the third phase the obtained capacities need to be verified with the demands.Hence the seismic parameters of the analyzed building structure need to be enteredinto the program. Using Swisscode these parameters are the seismic zone, the soiltype with its corresponding parameters S, TB, TC and TD as well as the importancefactor %f . With this information, the program calculates the requested displacement
Table 5.1 The 24 analyses combinations for the 3Muri evaluation

7/21/2019 masterthesis_uelicamathias
http://slidepdf.com/reader/full/masterthesisuelicamathias 46/137
5 Numerical Simulation
30
according to the code. Then it performs a check where it compares this requesteddisplacement with the displacement offered by the structure. If the check is satisfied itmeans that the structure can withstand an earthquake event according to theselected seismic parameters. If the check is not satisfied a step-by-step analysis ofthe damage process helps finding the wall areas which need improvement.
5.2 Verification of 3Muri
This chapter deals with a verification analysis. The intention of this verificationanalysis is to define a fictive test building structure, to model it with 3Muri and then tocompare its results with a hand calculation. The hand calculation analysis containsan equivalent lateral force analysis, a response spectrum analysis and adevelopment of a pushover curve according to the method developed by Lang [22]. Itis expected to show more conservative results than the deformation capacity
achieved with 3Muri. The seismic properties of the test structure are chosen thesame as those of the BHO-structure described in Chapter 3.1.
5.2.1 Geometry
The dimensions of the test buildingpresented in Figure 5.3 can befound in Table 5.2.
The side walls with the surface B times H are necessary for the model in 3Muri.Every ceiling needs an element definition on each side. Because only the front sideof this building is of interest, the sidewalls are defined as very thin masonry walls.With this assumption the influence of these sidewalls can be neglected.
Figure 5.3 Test building structure
H
L
B
L
hp
x
y z
Table 5.2 Dimensions of test
building

7/21/2019 masterthesis_uelicamathias
http://slidepdf.com/reader/full/masterthesisuelicamathias 47/137
Numerical Simulation 5
31
5.2.2 Masonry Wall Characteristics
The test structure is assumed to consist out of masonry with bricks and clay MBaccording to SIA 266. The material characteristics are presented in Table 5.3.
5.2.3 Load Carrying System and Vertical Loads
Since the BHO-structure has many one-way timber floors, the floor of this structure isalso assumed to be a one-way timber floor. Under this assumption, the ceiling carriesits load directly into the front and back walls, which transfer the vertical loads into theground. The vertical loads are calculated with equation (5.5). This formula is based
on formula (40) of SIA 261. is the reduction factor according to Table 2 ofSIA 260. For office floors the reduction factor is 0.3.
(5.5)
The vertical load of the floor is computed as follows:
Death load: gFloor = 2.43 kN/m2
Live load: qNL = 3.00 kN/m2
Using formula (4.5), the total vertical floor loads qd,Floor amount to 3.33 kN/m2.
The masonry wall contribute with its own weight as follows:
Death load: qd,Wall = 13 kN/m3 * tw = 2.60 kN/m2
Table 5.3 Material characteristics of the test building structure

7/21/2019 masterthesis_uelicamathias
http://slidepdf.com/reader/full/masterthesisuelicamathias 48/137
5 Numerical Simulation
32
5.2.4 Equivalent Lateral Force Analysis
In Chapter 4.1 this type of procedure is described. To estimate the first natural periodof vibration the formula (38) of SIA 261 is used.
(5.6)
is set as 0.05. With an idealized building height of 2.625 meters a first natural
period of vibration of = 0.103 s is obtained. The following equation (5.7)
corresponds to formula (25) of SIA 261. By filling in the correspondent parameters,the spectral acceleration of the structure reaches 1.46 m/s2 ( is assumed to
be 1).
(5.7)
For the computation of the equivalent lateral force, the weight of the structure isrequired. To calculate a concentrated weight of the structure, the assumption is madethat the weight of the lower half of the wall height is directly transferred into theground, whereas the upper half is contributing to the center weight point of the SDOFsystem. With this assumption, the concentrated weight is assembled in the followingway:
Floor weight: wFloor = qd,Floor *L*B = 39.96 kN
Walls weight: wWalls =
2*qd,Wall*((L-Lp)*H/2 + Lp*(H-hp)) = 23.40 kN
Total weight: wtot = 63.36 kN
Total mass: mtot = wtot/g = 6336 kg
Dividing the weight of the structure through the gravity g provides the mass of the
structure. Knowing the mass of the structure, the equivalent lateral force is calculatedby multiplying the mass with its spectral acceleration.
(5.8)
This calculation delivers an equivalent lateral force of 9.45 kN. The elastic
displacement uel,ELF of the structure can be estimated by applying the followingequation:
(5.9)

7/21/2019 masterthesis_uelicamathias
http://slidepdf.com/reader/full/masterthesisuelicamathias 49/137
Numerical Simulation 5
33
The natural circular frequency follows out of equation (5.10).
(5.10)
Since the test structure is already a SDOF system, the participation factor inequation (5.9) is equal to 1. This way, equation (5.9) delivers an elastic displacementuel,ELF of 0.4 mm. This value shows that the test structure is rather strong against theassumed loads.
5.2.5 Response Spectrum Analysis
A more advanced procedure for seismic analysis is the response spectrum method. As described in Chapter 4.2 the opportunity to consider higher natural periods of
vibration is one of the major advantages. But since the test structure is only a SDOFsystem, this advantage is of no use for the analysis of the test structure. However, byperforming a modal analysis the first natural period of vibration emerges out of anestimation of the stiffness and the mass of the structure. Hence, the value of the firstnatural period of vibration is expected to be a closer estimation to the one of the realstructure.
According to Tomazevic [21], the effective stiffness of a masonry wall can beobtained by using equation (5.11).
(5.11)
In this formulation #’ represents a coefficient that determines the position of thebending moment’s inflection point along the height of the wall. For cantilever walls,such as those of the test structure, the value of #’ is recommended to be 3.33.
Table 5.4 shows the values used in equation (5.11). With these values the effective
stiffness of one wall element is calculated to 17,466 kN/m.Table 5.4 Parameters for effective stiffness

7/21/2019 masterthesis_uelicamathias
http://slidepdf.com/reader/full/masterthesisuelicamathias 50/137
5 Numerical Simulation
34
Knowing the stiffness and using the structure mass calculated above the natural
circular frequency can be computed using equation (5.12).
(5.12)
In this equation, is equal to four times the stiffness . is the stiffness of one
pier of the test structure and since there are four of them, is four times In thisassumption, the spandrel beam combining the two walls is assumed flexible. Once
is known, the first natural period of vibration is obtained by using the
transformed equation (5.10). This way a of 0.06 s results, which is approximately
40% less than with the equivalent lateral force method. Using equations (5.6) to (5.8)from above, a spectral acceleration of 1.15 m/s2, an equivalent lateral force of
7.3 kN and an elastic displacement uel,RSA of 0.1 mm is obtained.
5.2.6 Hand-Calculated Capacity Curve
Bachmann and Lang [2] describe a procedure, developed for the design of masonrystructures, where the required capacity is compared to the capacity given by theprovisional structure. The developed procedure is only valid for structures withregular geometry. In addition to the models according to SIA V177 [28], the additionalstiffness coming from the coupling between the individual walls through ceilings andspandrel beams is considered. This influence can be considerable.
According to Bachmann and Lang [2], the procedure consists out of the followingsteps:
1. Initial data
2. Identification of the structure
3. Computation of the normal forces and story masses
4. Capacity curve of the walls
5. Capacity curve of the building
6. Equivalent SDOF
7. Capacity demand
8. Verification
Below, the test structure is analyzed following these steps using the explications of
Bachmann and Lang.

7/21/2019 masterthesis_uelicamathias
http://slidepdf.com/reader/full/masterthesisuelicamathias 51/137
Numerical Simulation 5
35
1. Initial Data
The initial data requires the geometrical properties, the material characteristics aswell as the vertical loads. These data is already described in Chapter 5.2.1 andChapter 5.2.3.
2. Identification of the Structure
This step defines the load-carrying walls of the structure. For the test building, theload-carrying walls are the two in the x-direction (see Figure 5.3). As mentionedbefore, the two walls in the y-direction are neglected and the timber floor transfersthe vertical loads two the two walls pointing in the x-direction.
3. Computation of the Normal Forces and Story Masses
The story mass is already computed in Chapter 5.2.4 with a value of 6,336 kg. Theweight is also already known at 63.36 kN. If this weight is distributed over the fourpiers of the structure, each one obtains an axial force of 15.8 kN.
4. Capacity Curve of the Walls (see Appendix D)
Since the test building has only two load-carrying walls and because they areidentical to each other, this procedure needs only to be done once. If there weremore walls with different properties, a capacity curve would need to be done for eachof them.
First, the point of zero moment is requested for the piers. This point is found bycalculating the ratio of the flexural stiffness of the spandrel to the flexural stiffness ofthe piers and by using Figure 5.4. It leads to a hop of 1.92 m.
Figure 5.4 Ratio of h0/hst as a function of the ration of the flexuralstiffness of the spandrels to the flexural stiffness of the piers [22]

7/21/2019 masterthesis_uelicamathias
http://slidepdf.com/reader/full/masterthesisuelicamathias 52/137
5 Numerical Simulation
36
Figure 5.5 Geometry of the piers and interacting forces [2]
Next, the horizontal resistance force V m is determined.If hop is known, M1 and M2 can be expressed in dependence on V m.
(5.13)
(5.14)
The maximum lateral load that a pier can undergo can be calculated by using thelower limit set of the theory of plasticity with a vertical and inclined compressionbrace according to Figure 5.6.
Figure 5.6 Compression strength as a function of the inclination of the angle # [2]
& &

7/21/2019 masterthesis_uelicamathias
http://slidepdf.com/reader/full/masterthesisuelicamathias 53/137
Numerical Simulation 5
37
The angle ratio of the inclined compression brace follows with:
(5.15)
The tensions, which result out of the internal forces in the inclined and verticalcompression brace, ! v and ! n, are not allowed to exceed the compression strength ofthe masonry according to Figure 5.6.
(5.16)
(5.17)
Further, the capability of sliding in the bed joint needs to be checked.
(5.18)
Now, by using equations (5.13) to (5.15) the conditions of equations (5.16) to (5.18)are solved in respect to the horizontal resistance force. Finally, the horizontalresistance force V m follows out of the conditions expressed in equations (5.13) and(5.15):
(5.19)
This way the result of V m is 3.96 kN.
The bending moments M 1 and M 2 follow by using equations (5.13) and (5.14).
M 1 = -1.3 kNm
M 2 = 7.6 kNm
If the pier is rather thin, it is possible that the inclination angle # is limited by itsgeometry. This is the case with the test building.
tan #max = 0.43 ' tan (d = 0.6
With the inclination ratio of 0.43, the axial force N V of the compression brace is9.3 kN. The vertical force of 6.5 kN in the vertical compression brace is obtained outof the vertical equilibrium. Therewith, the vertical compression check of thecompression brace can be performed.
)n = 0.77 N/mm2
' f xd – f yd = 2.45 N/mm2

7/21/2019 masterthesis_uelicamathias
http://slidepdf.com/reader/full/masterthesisuelicamathias 54/137
5 Numerical Simulation
38
Generally, the sliding check should be carried out at the top floor of the structuresince the vertical load is there the lowest. The test building has only one floor andhence, the shear force that needs to be resisted is equal to V m. Dividing V m by N delivers a ratio of 0.25 which is less than the coefficient of the inner friction µ of 0.6and hence satisfies the sliding check.
The next step in the computation of the capacity of the wall is the estimation of theeffective Stiffness. There are different ways to do that, such as by using a finiteelement program, statics or by using Tomazevic’s equation (5.11).
For the test structure, a static analysis is selected (see Appendix D). The staticanalysis delivers a pier stiffness k of 17,081 kN/m. Bachmann and Lang recommendthe use of a stiffness reduction factor of 0.5 to 0.7 to estimate the effective stiffness.These values have been confirmed by experimental results.
(5.20)
Appling the middle factor of 0.6 delivers an effective stiffness of keff of 10,249 kN/m.
The yield displacement $y of 0.386 mm is obtained by dividing the horizontalresistance force Vm through the effective stiffness.
(5.21)
In the last step, the plastic deformation capacity of the wall is estimated. Inequation (5.21) )n represents the axial tension in N/mm2. Factor # serves as a safetyfactor since the formulation in equation (5.21) is derived on a single test series. If theformulation is used for design purpose, # should be selected between 0.5 and 0.7.The test structure serves as a verification model and therefore the value of # isselected equal to 1. This leads to a *u of 0.78.
Equation (5.22) shows how the displacement ductility µ can be found.
(5.22)
Assuming a linear elastic displacement behavior, the ultimate displacement $u follows out of equation (5.23).
(5.23)
With the ultimate displacement $u of 20.1 mm and with the yield displacement $y of0.386 mm the capacity curve of the wall is defined.

7/21/2019 masterthesis_uelicamathias
http://slidepdf.com/reader/full/masterthesisuelicamathias 55/137
Numerical Simulation 5
39
5. Capacity Curve of the Building
The capacity curve of the whole test structure is obtained by overlapping the capacitycurves of single walls. Since the test building has two identical walls, thedisplacement capacity of the structure remains the same, while the horizontal shear
force of the structure grows with each wall. With four piers capable of resisting ashear force of 3.96 kN, the whole structure is capable of resisting 15.8 kN.
The total stiffness is equal to the sum of the single walls stiffness. Thus, k is40,996 kN/m.
(5.24)
Knowing the yielding and ultimate displacement capacity of the structure, an
idealized capacity curve can be drawn. Figure 5.7 shows the capacity response ofthe test structure under the assumption of a 0.7 stiffness reduction.
Figure 5.7 Capacity curve of the test structure computed with a 0.7 stiffness
reduction.
6. Equivalent SDOF
This step of the analysis deals with the development of an equivalent single-degree-of-freedom (SDOF) system. Since the mass of the structure and the total stiffness ofthe structure are known, the natural circular frequency can be estimated usingequation (5.12). Therewith, a value of 80.44 s-1 results for . From this, by using the
transformed equation (5.10), the natural period of vibration of the structure can be
found to be 0.078 s. Because the structure has only one floor, the participation factor
is again equal to 1.

7/21/2019 masterthesis_uelicamathias
http://slidepdf.com/reader/full/masterthesisuelicamathias 56/137
5 Numerical Simulation
40
7. Capacity Demand
The capacity demand is estimated for three performance levels. With the knowledgeof the first period of vibration and by using the corresponding hazard spectra forBern, the capacity demands can be calculated. In the first step the spectral
acceleration is obtained. Then, with the use of equation (5.25) the spectraldisplacement follows.
(5.25)
Once the spectral displacement is known, it only needs to be multiplied with theparticipation factor , which is equal to 1 for this structure, and the displacement
demand results. In Table 5.5, the capacity demand is presented for the different
performance levels.
Table 5.5 Capacity demand of the test structure with a stiffness reduction of 0.7
8. Verification
To verify, if the structure satisfies the expected criteria, the capacity response of thestructure is compared with the corresponding capacity demand.
In Figure 5.7 it is easy to see that the highest capacity demand of 0.84 mm for theperformance level of collapse prevention can easily be satisfied, since the structurehas a capacity response of 20.1 mm.
5.2.7 3Muri Computation
For the 3Muri computation, a model of the test structure is developed according tothe geometrical properties, the masonry characteristics and the loads described inChapter 5.2.1 to 5.2.3. This delivers a structure as shown in Figure 5.3.
The program is set to use Swisscode and as seismic input, the same parameters areselected as known from the BHO-structure, described in Chapter 3.1.
To be able to compare the results with the hand calculations, it is only required to runtwo analysis combinations. The reason is that the eccentricity is neglected in thehand calculations and that the first-mode-load-pattern and uniform-mass-

7/21/2019 masterthesis_uelicamathias
http://slidepdf.com/reader/full/masterthesisuelicamathias 57/137
Numerical Simulation 5
41
proportional-load-pattern deliver identical results for a SDOF structure. Further, theseismic input in x-direction is only investigated. The combinations can be seen in Appendix D.4. The yellow bar shows the decisive combination, which is in this casethe one in minus of the x-direction. Figure 5.8 presents the capacity curve of the teststructure, calculated with 3Muri. The red line shows the idealized bi-linear curve, that3Muri calculates for the equivalent SDOF system. As reference node, node 2 wasselected.
Figure 5.8 Pushover curve of the test structure computed with 3Muri
The shear force loss at a displacement of 12 mm can be explained with the bendingfailure of the spandrel element. When the structure reaches its ultimatedisplacement, the piers fail under bending and the structure collapses. The teststructure has a first period of vibration T1 of 0.082 s. The yield displacement $y of theequivalent SDOF system is 0.31 mm and the ultimate displacement $u is 22.6 mm.
5.2.8 Discussion
To receive more values to compare, the hand calculation of the capacity curve isrepeated for different stiffness ratios. The results are presented in Table 5.6.
Table 5.6 Displacement response of the test building for different stiffnesses

7/21/2019 masterthesis_uelicamathias
http://slidepdf.com/reader/full/masterthesisuelicamathias 58/137
5 Numerical Simulation
42
In the following Table 5.7, the first period of vibration is presented for the differentanalysis. The last two columns show the displacement demands for thecorresponded period of vibration for the two performance levels Limited Damage andCollapse Prevention. These demands are computed using the acceleration spectrafor Bern, showed in Figure 6.23.
The equivalent lateral force analysis and the response spectra analysis are differentfrom the other analyses. Its displacements are computed based on the elasticresponse spectra for the limited damage performance level with a return period of475 years. Therefore the displacement of the structure satisfies automatically itsrequired displacement. However, the knowledge of the ultimate displacementcapacity of the structure is lacking. If the first periods of vibration of the differentanalysis are compared, the period of the response spectra analysis seems almost
identical to the one of the hand calculation with uncracked stiffness. It is alsopractically identical to the period of the 3Muri calculation with uncracked stiffness.This is reasonable since the stiffness was estimated using the structure properties inthe response spectra analysis. In contrast the first period of vibration of theequivalent lateral force analysis is estimated too high with the used empiricalapproach according to SIA.
The two achieved capacity responses of the hand and 3Muri analysis of the structureneed to be checked with the requested capacity demand for the correspondentperformance levels. Therefore, the capacity demand values in Table 5.7 arecompared with the capacity responses in Table 5.8 and Figure 5.8. Consequently, allperformance criteria are satisfied.
Table 5.8 Displacement response of the equivalent SDOF with 3Muri
Table 5.7 First period of vibration and capacity demands for two performance levels

7/21/2019 masterthesis_uelicamathias
http://slidepdf.com/reader/full/masterthesisuelicamathias 59/137
Numerical Simulation 5
43
If Table 5.7 is compared with Table 5.8, the results for the unreduced stiffnessappear to be quite similar. The displacements are almost identical, whereas 3Muricomputes a smaller shear force. Further, the comparison of the two 50% crackedstiffness analyses present higher elastic displacements. This could be expected.However, the elastic displacement values differ from each other. An interestingobservation is that the hand calculation with a stiffness reduction factor of 0.7delivers almost identical displacement values as the 50% reduced stiffness analysisof 3Muri. The first period of vibration of the 50% reduced stiffness analyses are closeto each other. Therefore, the difference in the displacement value is most probablyconnected with the somewhat higher estimated building mass in 3Muri. Anotherreason is probably the more advanced analysis that 3Muri performs during theevaluation. Another fact that needs to be considered while comparing these valuesis that the elastic displacement presented in 3Muri is the value of the idealized bi-linear capacity curve. If the effective pushover curve is analyzed in detail, it becomes
clear that the precise yield point of the structure is difficult to define.
Another interesting observed fact is that if the factor # is selected at 0.6 inequation (5.21), the calculation delivers an ultimate displacement $u of 12.1 mm. InFigure 5.8, the spandrel fails under bending at this value. With this safety factor theultimate displacement capacity could be redefined as the state where the structurestarts to fail partially. At this point it would still satisfy all capacity demands.
In general, the verification analyses show that 3Muri appears to deliver good results. At the same time it shows that Bachmann and Lang method is a useful tool for hand
calculations.
5.3 Development of the 3Muri-model of the BHO-structure
In the first step the received plans of the BHO-structure are studied. Then a dwg-filefor each floor is prepared, containing only the relevant walls and openings. Afterwards, these files are inserted in 3Muri and therewith the walls of the structureare defined. Next, the wall properties need to be defined. Most of the walls are out ofBernese sandstone masonry. The masonry is defined manually using the option of
existing buildings and with the parameters defined in Chapter 3.5. The option toregard the initial cracked stiffness is selected. This means that the initial stiffness isequal to 50% of the entered modulus of elasticity and the shear modulus. On somefloors, there are also steel and wood girders used in the ceilings. Once the wallproperties have been defined, all the openings such as doors and windows can beadded. Unfortunately 3Muri has no option for modeling vaulted windows. Thereforeall vaulted windows are simplified and modeled as rectangular windows with a heightequal to their corresponding real windows maximum vault height. It would beinteresting to know the effect of this simplification on the results.
In the next step the floors are added. Therefore the knowledge of the floor propertiesis required. Since the detailed composition of the floors is uncertain, somecharacteristics were assumed in respect to the general floor composition of that time.

7/21/2019 masterthesis_uelicamathias
http://slidepdf.com/reader/full/masterthesisuelicamathias 60/137
5 Numerical Simulation
44
The composition of the timber floors is selected according to the informationpresented in SIA D0237. It states that the timber floors are unidirectional, with beamsin a distance of 60 cm to each other and with a height of 28 cm and width of 20 cm.The beams are immured 24 cm in the masonry walls. In Appendix B.3 the selectedfloor parameters of the different floor types are shown. The load carrying direction ofeach floor is also visible. With the floors, also the vertical loads are defined. Thevertical loads of the different floors are presented in Table 5.9. The balcony’scomposition on the first floor is rather massive. Therefore it is assumed to have ahigh dead load of 5 kN/m2 overlapped by a 3 kN/m2 live load for balconies, as theSwisscode recommends.
The roof structure is situated on thefourth floor. There is no furtherinformation available about itscomposition. Thus, it is assumed toconsist out of rather light materials,such as timber. One reason is that
the walls of this roof house do notfollow the structural walls of the thirdfloor above. In 3Muri it is onlymodeled in terms of its estimatedgravity loads and introduced aspoint loads on the structuralelements above (see Figure 5.9).The different loads are presented inTable 5.10. The area load is an
assumption including theconstruction of the roof of the roof house as well as the different walls.
Table 5.9 Interacting vertical loads on the different floor types according to theirlocation
Figure 5.9 Assignment of the point loads of theroof structure
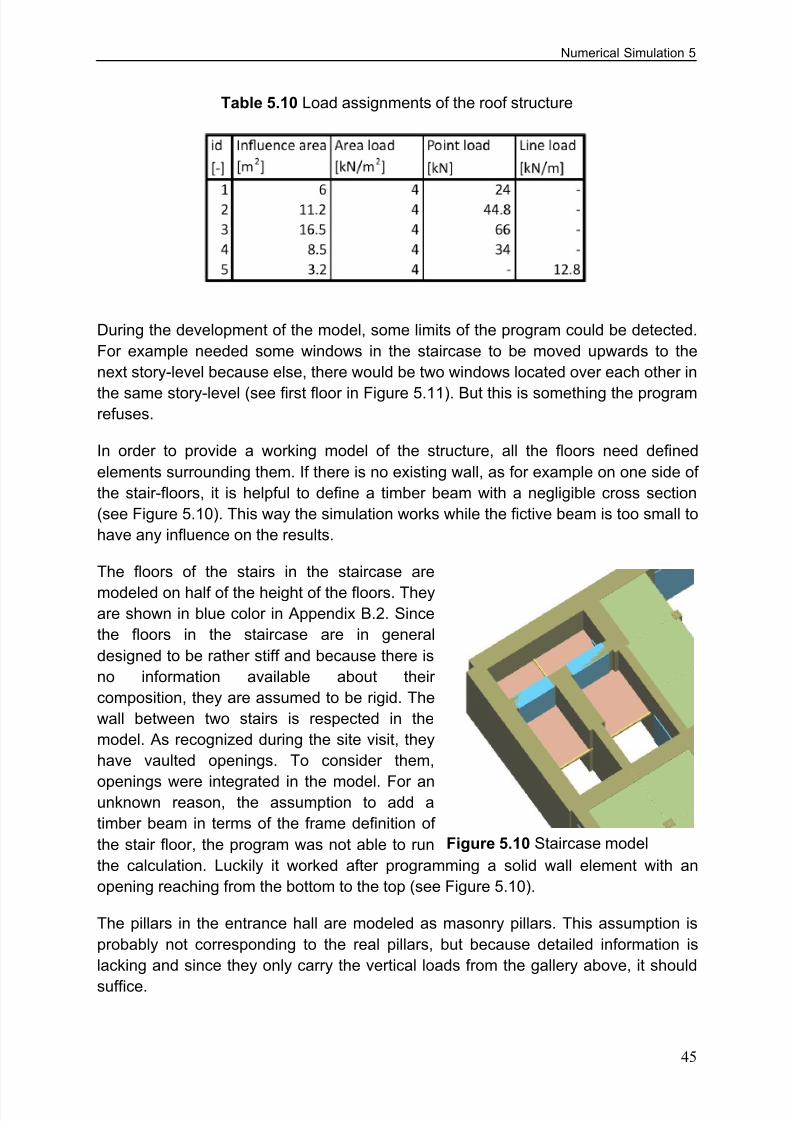
7/21/2019 masterthesis_uelicamathias
http://slidepdf.com/reader/full/masterthesisuelicamathias 61/137
Numerical Simulation 5
45
Table 5.10 Load assignments of the roof structure
During the development of the model, some limits of the program could be detected.For example needed some windows in the staircase to be moved upwards to thenext story-level because else, there would be two windows located over each other in
the same story-level (see first floor in Figure 5.11). But this is something the programrefuses.
In order to provide a working model of the structure, all the floors need definedelements surrounding them. If there is no existing wall, as for example on one side ofthe stair-floors, it is helpful to define a timber beam with a negligible cross section(see Figure 5.10). This way the simulation works while the fictive beam is too small tohave any influence on the results.
The floors of the stairs in the staircase are
modeled on half of the height of the floors. Theyare shown in blue color in Appendix B.2. Sincethe floors in the staircase are in generaldesigned to be rather stiff and because there isno information available about theircomposition, they are assumed to be rigid. Thewall between two stairs is respected in themodel. As recognized during the site visit, theyhave vaulted openings. To consider them,
openings were integrated in the model. For anunknown reason, the assumption to add atimber beam in terms of the frame definition ofthe stair floor, the program was not able to runthe calculation. Luckily it worked after programming a solid wall element with anopening reaching from the bottom to the top (see Figure 5.10).
The pillars in the entrance hall are modeled as masonry pillars. This assumption isprobably not corresponding to the real pillars, but because detailed information islacking and since they only carry the vertical loads from the gallery above, it should
suffice.
Figure 5.10 Staircase model

7/21/2019 masterthesis_uelicamathias
http://slidepdf.com/reader/full/masterthesisuelicamathias 62/137
5 Numerical Simulation
46
In Figure 5.11 the 3D-model of the structure is presented. Figure 5.12 shows the 3D-mesh-model of the structure.
Figure 5.11 3D-model of the BHO-structure
Figure 5.12 3D-mesh of the BHO-structure

7/21/2019 masterthesis_uelicamathias
http://slidepdf.com/reader/full/masterthesisuelicamathias 63/137
Numerical Simulation 5
47
Figure 5.13 Mesh of the south wall
After the mesh of the BHO-structure is generated, it needs to be verified. InFigure 5.13, the wall pointing south is shown representative. The divided linebetween nodes N4 and N56 can be explained with the changing wall thickness
between the upper and lower wall. Further, the thick line found between nodes N5and N57 is created to split the load from the big pier wall over the two smaller piersbelow. Similarly the generated mesh can be studied and understood.
With the generation of the mesh, the development of the structure ends and theevaluation phase starts.

7/21/2019 masterthesis_uelicamathias
http://slidepdf.com/reader/full/masterthesisuelicamathias 64/137
6 Evaluation
48
6 Evaluation
6.1 Seismic Hazard
A seismic hazard is a physical hazard. Wikipedia defines a hazard as an eventposing a threat to life, health, property or environment [29]. When a design engineerneeds to design or evaluate a building on its seismic behavior, he needs to know towhat seismic hazard the structure is exposed. The investigation of the seismichazard for a location is an excessive task. Therefore the codes offer seismic maps,telling which region belongs to what degree of hazard. Further, they offer seismicdesign spectra, which help the design professional to compute the pseudo
acceleration or pseudo displacement, respectively. A seismic hazard is eitheranalyzed in a deterministic or probabilistic way. In the deterministic analysis, aparticular earthquake scenario is assumed, while the probabilistic explicitly considersuncertainties. Either way, the earthquake source needs to be identified. The source isidentified using all possible sources such as fault maps giving geological, tectonicand historic information as well as instrumental records of seismicity of the past.Further, understanding of the wave propagation is necessary. In Figure 6.1 theuniform hazard spectra (UHS) for Bern is shown [30].
Figure 6.1 Uniform hazard spectra (UHS) for Bern
To receive design spectra for the BHO-structure, showing the demands for the threeperformance levels operational (72 years), limited damage (475 years) and collapseprevention (2475 years), the uniform hazard spectra of Bern are used. Theperformance levels are discussed later in this chapter. For the period of one second,
the spectral accelerations are obtained from the UHS for all three performancelevels. These values are used as the constant in SIA 261 in order to compute the

7/21/2019 masterthesis_uelicamathias
http://slidepdf.com/reader/full/masterthesisuelicamathias 65/137
Evaluation 6
49
seismic design spectra for the BHO-structure. This is not totally correct but gives agood approximation. The following equations are from SIA 261.
(6.1)
(6.2)
(6.3)
(6.4)
By applying equations (6.1) to (6.4) for a period range from zero to three seconds,the design response spectra for the BHO-structure in Bern are obtained (seeFigure 6.23). The corresponding seismic parameters of the BHO-structure used inthese equations are described in Chapter 3.1. According to Swisscode the parameter
is equal to 1.5 for unreinforced masonry structures. The acronym stands for the
ordinate value of the design spectral acceleration.
Dependent on the importance of a building, it needs to satisfy different requirements.In Figure 6.2, the different performance goals for design are visualized. For examplea hospital needs to have a greater earthquake resistance then an ordinary building. Ifa rare earthquake occurs, it is most important that hospitals are functional in order totreat the casualties. Figure 6.3 shows the damage progression of a building independence of the structural displacement. As long as a structure withstands anearthquake in its elastic range, there is no remaining structural damage. If the loadsoverpass the structures elastic displacement capacity it starts to deform in itsinelastic range. Under small inelastic deformations the structure may still be usableafter the earthquake. Maybe some specific components need to be exchanged. If theload is larger and the building undergoes large inelastic deformations, it reaches its
ultimate displacement capacity. The point of collapse prevention defines the state,where the building is heavily damaged and any further displacement leads to thecollapse of the structure. According to this performance model, the threeperformance levels are defined with the following return periods:
Operational 72 years
Limited Damage 475 years
Collapse Prevention 2475 years

7/21/2019 masterthesis_uelicamathias
http://slidepdf.com/reader/full/masterthesisuelicamathias 66/137
6 Evaluation
50
6.2 Equivalent Static Loading
The global analysis of the BHO-structure succeeds with a nonlinear static procedure. As described in Chapter 3.3, the result is presented in form of a pushover curveshowing the relation between the base shear and the top displacement of thestructure. To perform the analysis, a reference node needs to be selected on top ofthe structure. Therefore the closest node to the mass center of the structure isselected on the third floor. Since the roof house is only taken into account with theadditional vertical loads, this reference node represents the highest point. Therelation between the base shear and the top displacement is obtained by increasing
monotonically the horizontal load until the building collapses. 3Muri offers two optionsfor the horizontal load distribution. Either the horizontal load is applied according tothe first mode of vibration of the structure or based on a uniform mass-proportionalpattern. In this evaluation both ways are used.
Since the building is practically symmetric in the x-direction, the mass center needsonly to be estimated in y-direction. The computation in Appendix C shows that themass center moves in y-direction about 1 m forwards and backwards, dependent onwhich floor is contemplated. In Figure 6.4, the red point shows the mass center withits moving direction. The node number 259 is the closest node to the mass center
and therefore it is selected as the first reference node. The evaluation considers all24 analysis combinations described in Chapter 5.1.4.
Figure 6.2 Performance goals fordesign
Figure 6.3 Structural performance model
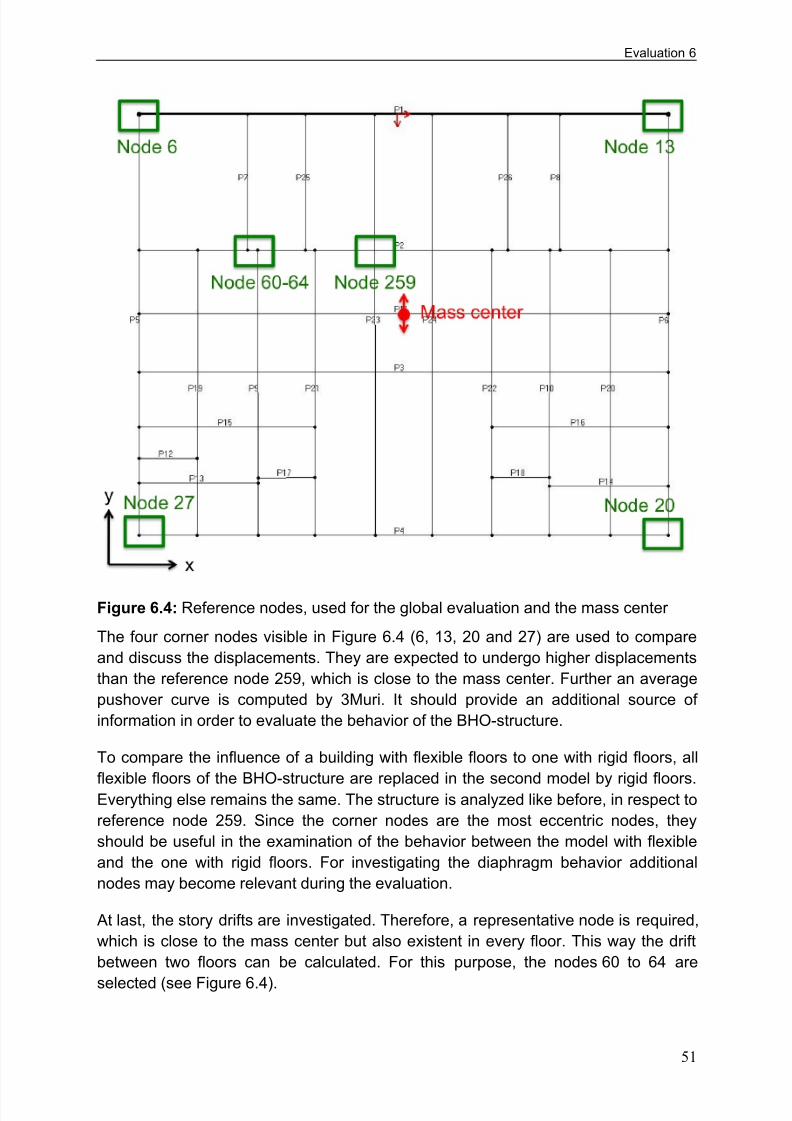
7/21/2019 masterthesis_uelicamathias
http://slidepdf.com/reader/full/masterthesisuelicamathias 67/137
Evaluation 6
51
Figure 6.4: Reference nodes, used for the global evaluation and the mass center
The four corner nodes visible in Figure 6.4 (6, 13, 20 and 27) are used to compareand discuss the displacements. They are expected to undergo higher displacementsthan the reference node 259, which is close to the mass center. Further an averagepushover curve is computed by 3Muri. It should provide an additional source ofinformation in order to evaluate the behavior of the BHO-structure.
To compare the influence of a building with flexible floors to one with rigid floors, all
flexible floors of the BHO-structure are replaced in the second model by rigid floors.Everything else remains the same. The structure is analyzed like before, in respect toreference node 259. Since the corner nodes are the most eccentric nodes, theyshould be useful in the examination of the behavior between the model with flexibleand the one with rigid floors. For investigating the diaphragm behavior additionalnodes may become relevant during the evaluation.
At last, the story drifts are investigated. Therefore, a representative node is required,which is close to the mass center but also existent in every floor. This way the driftbetween two floors can be calculated. For this purpose, the nodes 60 to 64 are
selected (see Figure 6.4).

7/21/2019 masterthesis_uelicamathias
http://slidepdf.com/reader/full/masterthesisuelicamathias 68/137
6 Evaluation
52
6.3 Global Evaluation
6.3.1 Flexible Floors Model
The results of the reference node 259 deliver the general behavior of the structure. InFigure 6.6, the pushover curve of the relevant analysis combination, with loading inthe x-direction, is presented. The relevant analysis combination is based on thehorizontal loading according to the first mode of vibration.
Figure 6.5 Pushover curve with flexible floors and loading in the x-direction (analysisnr.12)
The analysis shows that the structurereaches its ultimate displacement at 35 mm. At this point, the structure collapses undershear failure (orange marked elements) ofthe Wall 2 (see Figure 6.6).
However, at a horizontal displacement of14 mm, the front Wall 1 already starts tocollapse. In Figure 6.8 it becomes clear thatWall 4 is experiencing a large horizontaldeformation. The building starts to collapseon the third floor when the piers fail underbending. As the deformation goes on thepiers on the ground floor show the samefailure and soon the whole wall collapses
long before the shear failure at a deformation of 35 mm of Wall 2 is reached. If thefront wall collapses, a large part of the front side of the BHO-structure collapses as
Figure 6.6 Collapse mechanism ofWall 2 in Figure 6.5

7/21/2019 masterthesis_uelicamathias
http://slidepdf.com/reader/full/masterthesisuelicamathias 69/137
Evaluation 6
53
well. Thus, the ultimate displacement of the structure is redefined manually to15 mm.
Figure 6.7 visualizes the collapse mechanisms of Wall 4 at a horizontal displacementof 14 mm. The walls are numerated based on their numbers in the 3Muri model. In
Figure 6.8, the floor plan of the deformed structure is presented.
The deformations visible in Figure 6.8 show a flexible-floor structure-behavior. Theoutside walls deform stronger in the x-direction than those in the center of thebuilding. This shows that the walls act at least partially as single structural elements,with reduced interaction between each other. This is to be expected by flexiblediaphragms.
The pushover curve presented in Figure 6.9 is based on the average displacement ofall the nodes of the reference node level. In the average of all points, the ultimatedisplacement according to 3Muri amounts to 117 mm. If the same manual redefinitionis performed as for the analysis of the displacement of the reference node 259, anultimate displacement of 43 mm is found. This shows that, in general, the structureundergoes a larger deformation than the reference node. However, the reference
node is selected close to the mass center and is therefore also expected to showsmall deformations in contrast to the corner nodes.
The base shear is found around 6,800 kN for the pushover curve based only on thedisplacement of the reference node as well as for the one based on the averagedisplacements.
Figure 6.8 Floor plan of the deformedthird floor
Figure 6.7 Collapse mechanism of theWall 4 in Figure 6.8

7/21/2019 masterthesis_uelicamathias
http://slidepdf.com/reader/full/masterthesisuelicamathias 70/137
6 Evaluation
54
Figure 6.9 Average pushover curve with flexible floors and loading in the x-direction(analysis nr. 18)
In Table 6.1 the displacement of the corner nodes in relation to the referencenode 259 can be found for the model with flexible floors. The yellow-marked fieldspoint out the deformations in the loading direction. For the nodes 20 and 27 adisplacement of 174 mm in x-direction can be found.
By contemplaiting Figure 6.10, a considerably larger displacement can be noticed in
the y-direction. The ultimate displacement amounts to 256 mm and is caused by thehorizontal loading based on the uniform mass-proportional pattern. However, on thethird floor a diaphragm deflection can be observed as shown in Figure 6.13 and
Table 6.1 Displacements of the corner nodes in relation to the reference node 259 for
the flexible model

7/21/2019 masterthesis_uelicamathias
http://slidepdf.com/reader/full/masterthesisuelicamathias 71/137
Evaluation 6
55
because the reference node is situated in the middle of this deflection, the pushovercurve shows an unexpected large elastic deformation. The structure experiences asoft-story collapse mechanism on the ground floor. Both, shear (orange elements)and bending (red elements) failure can be observed.
Figure 6.10 Pushover curve with flexible floors and loading in the y-direction(analysis nr.18)
In Figure 6.12, the floor plan of the failure mechanism is shown. A torsion-effect canbe observed. Since the structure is rather symmetric it is probably caused by theinitial accidental eccentricity.
Figure 6.12 Floor plan of the collapse
mechanism of the ground floor
Figure 6.11 Collapse mechanism of the
red-marked wall in Figure 6.12

7/21/2019 masterthesis_uelicamathias
http://slidepdf.com/reader/full/masterthesisuelicamathias 72/137
6 Evaluation
56
Through the additional loading of the point loads of the roof structure and theunidirectional load carrying of the steel beams shown in Figure 6.13 with red arrows,a diaphragm deformation results. It is only found on the third floor. With the four wallssupporting these steel beams, a deformation shape results surprisingly close to theone presented in Figure 3.8 of Chapter 3.4. By comparing the displacement in the y-direction of the nodes 259 and 64, the diaphragm deflection results in 184 mm.
Figure 6.14 Average pushover curve with flexible floors and loading in y-direction
The average curve of the flexible model in the y-direction is found to be similar to the
one based only on the reference node. The main difference is the displacementcapacity. Since the reference node is part of the diaphragm deflection, itsdisplacement is larger and not representative for the structure itself. In Figure 6.14 an
Figure 6.13 Floor plan of the deformationbehavior of the third story
Table 6.2 Diaphragm displacement

7/21/2019 masterthesis_uelicamathias
http://slidepdf.com/reader/full/masterthesisuelicamathias 73/137
Evaluation 6
57
average ultimate displacement of 125 mm is found. As before, the displacement atthe mass center is expected to be lesser. The mass center displacement can beestimated with the displacement of node 64, which is relatively close to the masscenter and not part of the deflection of the diaphragm on the third floor. This nodeshows an ultimate displacement of 58 mm in y-direction, which is approximately halfthe average ultimate displacement.
6.3.2 Rigid Floors Model
This chapter presents the results of the structure with rigid floors. Figure 6.15 showsthe pushover curve in the x-direction. The curve is similar to the one of the buildingwith flexible floors shown in Figure 6.9. The major difference is the larger deformationcapacity in the inelastic range. The ultimate deformation is reached at 43 mm. Thebase shear is found at 10,000 kN. This is around 1,000 kN higher than with the
structure with flexible floors. At 22 mm a partial failure can be found. At this point theultimate displacement is reached in analysis 16 of the flexible structure. Even thoughanalysis 16 is not decisive for the flexible structure a possible interpretation is that thesame failure begins at this point in the building with rigid floors, but then the rigidfloors redistribute the loads and therefore the structure can withstand a largerdeformation.
Figure 6.15 Pushover curve with rigid floors and loading in the x-direction (analysisnr.16)
In Figure 6.16 it can be seen that the structure deforms as a global structure. Thedeformations appear to be the same through the whole floor. The building collapses
when the piers of Wall 2, shown in Figure 6.16 in red, collapse under shear failure onthe ground floor (see Figure 6.17). Shear failure is indicated by orange color in 3Muri.
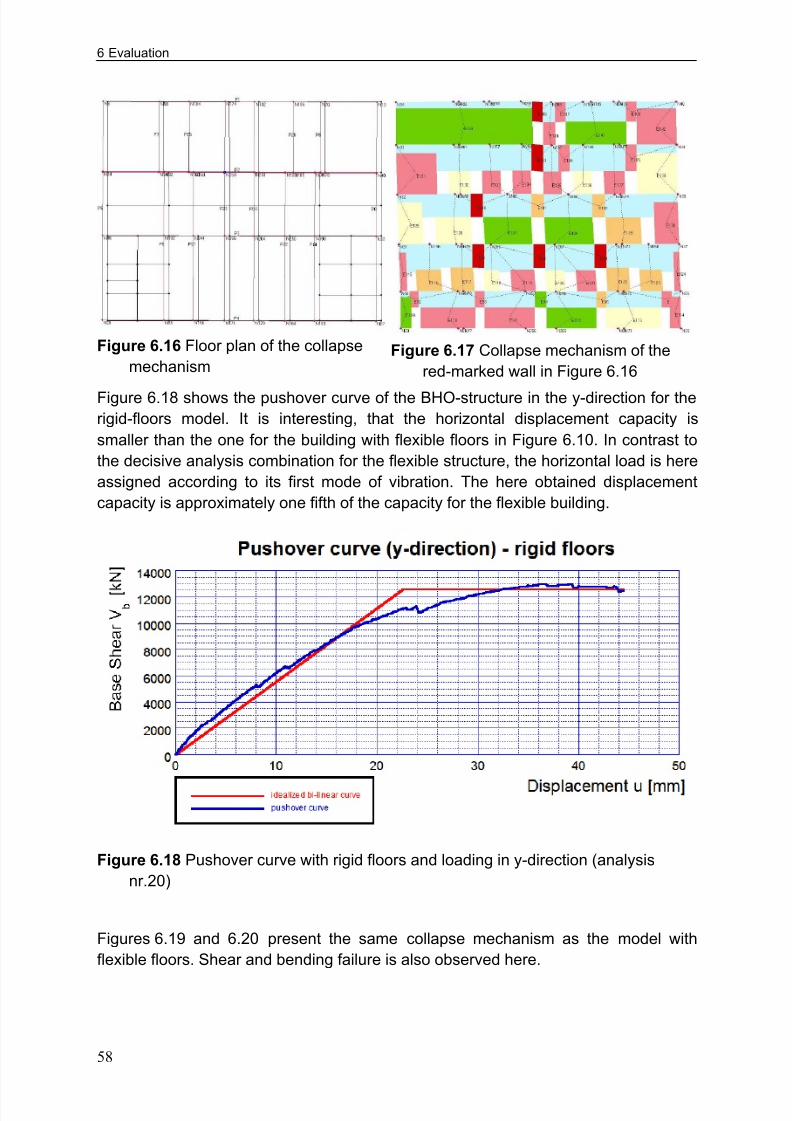
7/21/2019 masterthesis_uelicamathias
http://slidepdf.com/reader/full/masterthesisuelicamathias 74/137
6 Evaluation
58
Figure 6.18 shows the pushover curve of the BHO-structure in the y-direction for therigid-floors model. It is interesting, that the horizontal displacement capacity issmaller than the one for the building with flexible floors in Figure 6.10. In contrast tothe decisive analysis combination for the flexible structure, the horizontal load is hereassigned according to its first mode of vibration. The here obtained displacementcapacity is approximately one fifth of the capacity for the flexible building.
Figure 6.18 Pushover curve with rigid floors and loading in y-direction (analysisnr.20)
Figures 6.19 and 6.20 present the same collapse mechanism as the model withflexible floors. Shear and bending failure is also observed here.
Figure 6.17 Collapse mechanism of thered-marked wall in Figure 6.16
Figure 6.16 Floor plan of the collapsemechanism

7/21/2019 masterthesis_uelicamathias
http://slidepdf.com/reader/full/masterthesisuelicamathias 75/137
Evaluation 6
59
Table 6.3 shows the relations of the displacements between the corner nodes andthe reference node 259 for the rigid model. The yellow-marked fields point out thedeformations in the loading direction. The deformations for the rigid building show amore uniform response then those of the flexible model in Table 6.1. This could beexpected. The corner displacements for the flexible model in y-direction show a quitesmaller deformation than the reference node close to the mass center. But thesevalues are only valid for the third floor. As discussed above, the diaphragm showsdeflection on this floor. The maximum deviations from the reference node 259 to the
corner nodes are for the rigid model in the y-direction 30% and can be found withnode 13 and 27. This confirms again a more uniform building response for a structurewith rigid floors, where loads are redistributed once a component reaches itscapacity.
Figure 6.19 Floor plan of the collapse
mechanism
Figure 6.20 Collapse mechanism of
the red-marked wall in Figure 6.19
Table 6.3 Displacements of the corner nodes in relation to the reference node 259for the rigid model

7/21/2019 masterthesis_uelicamathias
http://slidepdf.com/reader/full/masterthesisuelicamathias 76/137
6 Evaluation
60
Figure 6.21 visualizes the pushover curves between the model with flexible and theone with rigid floors. It becomes clear that the structure with rigid floors can withstanda higher base shear force. The rigid-floors structure can also undergo a largerdisplacement. Unlike the pushover curve of the flexible-floors structure, which showsa partial collapse of the structure already at 14 mm, the rigid-floors structure remainsrelatively intact until it reaches the ultimate displacement at 44 mm. With the adjustedultimate displacement of 14 mm of the flexible structure, the rigid structure has athree times larger displacement capacity. An interesting observation is that theflexible and rigid curve are almost identical up to a deformation of 12 mm, where theflexible one reaches its maximum base shear capacity. This means that until thisdeformation the composition of the diaphragms is of no relevance, as they do notcontribute to the response of the structure.
Figure 6.21 Comparison of the pushover curve in the x-direction for the flexible andrigid model
Figure 6.22 presents the two pushover curves for the flexible and rigid structure in
the y-direction. These two curves are rather difficult to compare, since the referencenode 259 is part of the diaphragm deflection in the third floor. Thus, the blue curve isnot the pushover curve representing the relation between the base shear and thedisplacement of the reference node but the average displacement of the nodes of itslevel as shown in Figure 6.14. This curve is a better estimation of the generaldisplacement response of the flexible structure. Comparing the curves in Figure 6.22shows that the flexible structure can withstand the same base shear forces as therigid structure, but only under considerably larger horizontal deformations.

7/21/2019 masterthesis_uelicamathias
http://slidepdf.com/reader/full/masterthesisuelicamathias 77/137
Evaluation 6
61
In Table 6.4 the demands and capacities are summarized for the flexible and rigidmodel of the BHO-structure, based on the displacements of reference node 259. Thedemands are computed with the design response spectra in Figure 6.23. Thespectral acceleration Sa for each performance level is found in Figure 6.23 by using
the correspondent first period of vibration and then by following the red arrows. Byapplying equations (5.10) and (5.25) the spectral displacement Sd is found. Then,using the participation factor for the first period of vibration, given by 3Muri, thecorrespondent displacement value is obtained. Comparing the demands with thecapacities it becomes clear that the demands can be satisfied by the BHO-structure.Only the manually modified capacity of the flexible structure in the x-direction is closeto the demand. The verification is only performed for the real BHO-structure with theflexible floors. In the last column, the ultimate acceleration resistance is given. Thesevalues become important in the next chapter, where the local performance is
investigated.
Figure 6.22 Comparison of the pushover curve in the y-direction for the flexible andrigid model

7/21/2019 masterthesis_uelicamathias
http://slidepdf.com/reader/full/masterthesisuelicamathias 78/137
6 Evaluation
62
Figure 6.23 Design response spectra for the BHO-structure in Bern
The first periods of vibration are for both, the flexible and rigid model under 1 second.For masonry structures low periods are common. Hence these values are realistic.The computation also shows lower first periods of vibration for the rigid model. Thiscould be expected.
6.3.3 Story Drifts
Story drifts are presented in Figure 6.24. They are computed in a conservative way,using the results of two analyses combinations in both, the x- and the y-direction.First the decisive analysis combination with the first-mode-of-vibration-horizontal-load-pattern is determined and then the decisive analysis with the mass-proportional-horizontal-load-pattern. For both analyses the story drifts are analyzed and for each
floor the larger deformation is chosen (see Appendix E.1). These values areassembled and form the curves in Figures 6.24. In Tables 6.5 and 6.6 the values areshown. When story drifts are discussed, the story drifts are delivered in percent. The
Table 6.4 Demands and Capacities of the BHO-structure

7/21/2019 masterthesis_uelicamathias
http://slidepdf.com/reader/full/masterthesisuelicamathias 79/137
Evaluation 6
63
yellow-marked columns show the displacements in the loading direction. For themodel with flexible floors, the largest deformation is observed in the ground floor(EG) with 0.17% drift in the x-direction and a 0.5% drift in the y-direction. Thesevalues indicate a reduced stiffness on the ground floor and a potential soft-storybehavior. However, the values are in an acceptable range. According to EC8-3,Chapter 4.3, the drift of a wall controlled by shear can be assumed to be 0.4% andfor the performance level of near collapse even 0.53 %.
Figure 6.24 Story drifts of the BHO-structure
Table 6.5 Story drifts of the BHO-structure with flexible floors (nodes 60-64)

7/21/2019 masterthesis_uelicamathias
http://slidepdf.com/reader/full/masterthesisuelicamathias 80/137
6 Evaluation
64
The story drifts for the rigid structure in the x-direction are constantly larger thanthose of the flexible structure. This leads to a total top drift of 44 mm, which is twiceas big as the top drift of the flexible structure. However, if the shapes of the drifts inthe x-direction are compared in Figures 6.24, a similar shape is recognizable. Alsothe two curves showing the drifts in the y-direction seem to have a similar shape. Themain difference can be found in the drift of the underground-floor (TP). Theunderground-floor-drift of the rigid structure is considerably larger than the one of theflexible structure. In Appendix E.1 it becomes clear that the considerably larger valuederives from the analysis with the uniform mass-distribution pattern while the drift ofthe other floors is based on the first mode of vibration load-distribution.
Table 6.6 Story drifts of the BHO-structure with rigid floors (nodes 60-64)
6.4 Local Performance
3Muri offers a tool to investigate local mechanisms. As a condition, the model of theBHO-structure needs to be developed as defined in Chapter 5. Out-of-plane failure israther difficult to analyze because the user is requested to define possible
mechanisms. The program estimates the first period of vibration of the structureusing the following, empirical equation, where H is equal to the building’s height.
In Figure 6.26 the two analyzed walls of the BHO-structure are marked in yellow.From all the walls of the structure they appear to be the most exposed to an out-of-plane failure. The out-of-plane failure of the two outside-walls marked in orange coloris prevented by the total BHO-structure and hence, they are not analyzed. Wall 1 and4 are both analyzed starting with the top floor. Once the top floor is analyzed, thenext floor below is additionally considered, until the whole wall is investigated (seeFigure 6.25).

7/21/2019 masterthesis_uelicamathias
http://slidepdf.com/reader/full/masterthesisuelicamathias 81/137
Evaluation 6
65
The user needs to select the resistance-check of interest. He has two options. First,he can conduct a land-constraint-check, which verifies a single element or portion ofthe building that rests on the ground. Therefore equation (6.7) is applied. Secondly,the user can perform a quote-constraint-check, where a local mechanism is analyzedat a certain quote over the ground. This check is based on equation (6.8). Thereforean estimation of the first period and mode of vibration, based on equation (6.5) andequation (6.6), are required. As user-defined wall-block can be performed based on
the following two equations (6.6) and (6.7):
(6.5)
(6.6)
is equal to the building’s height and is the height, compared to the foundation ofthe building. is not exactly described in the user manual of 3Muri [25].
(6.7)
(6.8)
: The spectral seismic acceleration of the activation of the mechanism
: Function of the probability of exceeding the selected Limit State
: Coefficient taking into account the soil type and the topographical conditions
: Structure factor: Value, based on elastic spectrum in accordance with the selected Limit State
Figure 6.26: Ground plan pointing out
Wall 1 and 4
Figure 6.25: 3D-model of local
mechanism

7/21/2019 masterthesis_uelicamathias
http://slidepdf.com/reader/full/masterthesisuelicamathias 82/137
6 Evaluation
66
: First vibration mode
: Modal coefficient participation
In Table 6.7, the achieved resistance of the different out-of-plane mechanismsinvestigated on Wall 1 and 4 are presented. For the walls both the land constraintand quote constraint is computed. Only for the base floor TP the land constraint isrelevant. For the other mechanism the quote constraint is of relevance. All theanalyzed mechanisms show enough resistance against the estimated action. Theresistance of the underground floor is not investigated for the Wall 4 because thiswall lies below the ground level on this side of the building. The definitions of thesingle mechanisms can be found in Appendix E.2.
The action resistances of the local mechanisms, expressed in terms of acceleration,are supposed to amount lower then the maximal acceleration resistance of the global
performance. In Table 6.4 the ultimate acceleration resistance of the globalperformance evaluation can be found. Comparing these values with those of the localperformance evaluation proves this expectation correct.
The global evaluation in the previous chapter showed a diaphragm deflection on thethird floor for the flexible model with loading in the y-direction. Thus, a localevaluation is performed for this section of the Wall 1.
Table 6.7 Results for the investigated Walls 1 and 4 of theBHO-structure concerning out-of-plane failure

7/21/2019 masterthesis_uelicamathias
http://slidepdf.com/reader/full/masterthesisuelicamathias 83/137
Evaluation 6
67
Figures 6.27 and 6.28 visualize the analyzed section.
The analysis results in a resistanceacceleration amounting to 6.19 m/s2 against an action of 0.9 m/s2. Thisresistance acceleration is rather high but
still lower than the ultimate accelerationresistance of the global evaluation of7 m/s2 according to Table 6.4. Figure 6.29shows the local collapse mechanism. Apparently the diaphragm deflection is notcaused by a local collapse but rather bythe horizontal loads, acting from the thirdfloor components.
6.5 Conclusion
The global analysis shows that the BHO-structure satisfies the design requirementsconcerning the global performance under seismic loading. However, the BHO-structure shows a large deformation in the y-direction, while reaching the yield baseshear. In order to reduce the displacement an improvement of the diaphragms couldhelp obtain a better building integrity. It is also questionable if all the timber floors,which are immured about 24 cm deep in the walls would still remain there withdeformations of over 25 cm in the third floor, where the diaphragm deflection occurs.The walls that are connected with these floors would need to move rather equally. In
order to ensure their connection to the walls, it would be reasonable to create betterconnections between the walls and the ceilings. The other thing to do is to createstiffer floors, especially in the third floor. This way the floor deflection can be reduced.
Figure 6.28: Floor plan showing theanalyzed section
Figure 6.27 Front view of the wallshowing the analyzed section
Figure 6.29 Local collapsemechanism for section on thethird floor

7/21/2019 masterthesis_uelicamathias
http://slidepdf.com/reader/full/masterthesisuelicamathias 84/137
6 Evaluation
68
The BHO-structure satisfies all the response requirements according to the 3Muricalculation. However, it is rather difficult do know how reliable the results are. Theresults are based on a model, which is based on masonry parameters according tocode provisions and assumptions. It would be interesting to run the same model withthe masonry parameters from the ongoing material survey of the BHO-structure.Further it would be helpful to compute by hand the shear capacity and first period ofvibration of some single walls.
Since the stiffness of the floors have quite an influence on the response of thestructure, especially concerning the nonlinear behavior, a more detailed knowledgeof the floor-compositions would be helpful. This way, they could be modeled in 3Murimore close to the reality and improve the reliability of the responses.
Another point that may diminish the reliability of the results is the lack of 3Muri to
compute the changes of the connections of the diaphragms to the wall structures,while the lateral loads are increased monotonically. The floors are inserted in 3Muriwith a specific stiffness and some options in order to respect the type of connectionexist as well.
If the structure would fail to satisfy the response requirements, severalmeasurements exist in order to improve its behavior. They vary from strengtheningmasonry walls over strengthening diaphragms and improvements of the structuralintegrity. A reason for a poor seismic behavior of a building may also be a badfoundation. In this case an improvement of the foundation may be required. Further,
damage to non-structural elements often presents a large portion of the overallbuilding damage. Nevertheless, this aspect of BHO performance was not consideredin this study.
6.6 Strengthening of Masonry Structures
Depending on the buildings earthquake resistance, a strengthening may be required.This chapter introduces ways of strengthening of masonry structures based on theexplanations according to Tomazevic [21]. There are also other methods ofstrengthening existing that are not mentioned by Tomazevic.
6.6.1 Methods of Strengthening of Masonry Walls
For stone-masonry, an efficient intervention is simply injecting the grout into the voidparts of the walls. However, for brick- and block-masonry walls, there are severalways of strengthening available.
Crack Repairs
For brick and block masonry, the buildings resistance may be improved by sealingexisting cracks. If the cracks width is about 1 cm, they can be sealed with mortar.However, if the width is larger than 1 cm, it may be necessary to reconstruct the

7/21/2019 masterthesis_uelicamathias
http://slidepdf.com/reader/full/masterthesisuelicamathias 85/137
Evaluation 6
69
damaged part. In the case of thin cracks under 1 mm, epoxy can be injected. Oftencement grouts are preferred, since they are less expensive compared to theeffectiveness. For cracks between 5 and 10 mm, fine sand can be added to thegrouting mixture existing out of 90% Portland cement and 10% Pozzolana.Experiments have shown that injecting the cracks with cement or epoxy grout caneven improve the original load-bearing capacity of the walls in case of poor qualitymasonry. However, the rigidity is mostly not improved and conservators may not besatisfied with solutions existing out of cement or epoxy.
For stone-masonry walls, in contrast, reconstruction of parts or complete walls isoften necessary, where severe cracks are found in the middle parts of the wall. For areconstruction original material should be used in order to maintain the integrity of thewall. If for instance a damaged part is replaced with concrete, the concrete part maybe responsible for the damage of neighboring masonry during a future earthquakeevent [21].
Repointing
Under repointing an improvement of the wall resistance against vertical andhorizontal loading is understood, where a part of the existing poor mortar is replacedwith mortar of significantly better quality such as cement mortar. On one or bothsides of the wall the mortar is removed up to approximately 1/3 of the wall’s thickness(see Figure 6.32) [21].
Figure 6.30 Reconstruction of the central part of a
heavily cracked stone-masonry wall [21]

7/21/2019 masterthesis_uelicamathias
http://slidepdf.com/reader/full/masterthesisuelicamathias 86/137
6 Evaluation
70
Reinforced-cement Coating
This is a useful method for seriously damaged brick- and block-masonry walls as wellas for strengthening existing structures. The lateral resistance is improved byapplying reinforced-cement coating on one or both sides of the wall. It is easy toapply and quite efficient. There have been studies about the possibilities of usingferro-cement or carbon fiber coating instead of reinforcing steel [21].
Grouting
Existent stone and mixed stone-and-brick masonry often have two outer leaves ofuncoursed stones and an inner infill of smaller pieces of stones. Further a poor-quality lime mortar is used as bonding material. Therefore many voids are distributedover the walls. Obviously, systematically injecting cementitious grout is an efficientmethod of strengthening. Unfortunately, only a limited number of laboratory and insitu tests have been performed so far. Hence, values of basic parameters of cement-grouted masonry walls are combined with uncertainties.
Figure 6.31 Repointing of a brick-masonry wall [21]
Figure 6.32 Application of r.c. coating to brick-masonry walls [21]

7/21/2019 masterthesis_uelicamathias
http://slidepdf.com/reader/full/masterthesisuelicamathias 87/137
Evaluation 6
71
One of the main advantages of this intervention is its invisibility. Therefore it is idealfor historical structures, where principles of preservation and restoration should beregarded. If applied, the effect of cement on traditional masonry, caused by impuritiesof the cement, which dissolve in the water and may cause damage to decorations,should be considered. However, it is believed that the composition of the grout mixcan be designed for each particular type of masonry and therefore each specificproblem of this type can be solved [21].
Prestressing
By prestressing the wall in vertical or horizontal direction, the shear resistance of thewall can be improved, since the principal tensile stress is a function of the stressstate in the wall. Many types of prestressing are existent and can be applied [21].
Reconstruction
If a brick- or stone-masonry wall is heavily damaged, it may be necessary toreconstruct that section of the wall. In such a situation, it is important to carefullyremove the old masonry in order to prevent additional damage. The reconstructionmaterial should be of improved quality, but needs to be compatible with the originalmasonry. Further the unit-dimension should match the original dimensions.
Reconstruction is often required for stone-masonry, where a layer has bulgedexcessively or collapsed. In order to avoid bulged walls to collapse, it may be helpful
to use transverse connectors and with steel profiles the wall can be placed in itsoriginal position. Then, after grouting, the steel profiles can be removed. However,the transverse connectors are left in the wall to prevent future bulging [21].
Figure 6.33 Reconstruction of a bulged stone-masonry wall [21]

7/21/2019 masterthesis_uelicamathias
http://slidepdf.com/reader/full/masterthesisuelicamathias 88/137
6 Evaluation
72
6.6.2 Methods of Improving Structural Integrity
Next to strengthening individual structural components such as single walls it may bemore efficient to study and improve the structural integrity. The structural integrity canbe improved with the following methods.
Tying of Walls with Steel Ties
Steel or wooden ties have been known as improvements for structural integrity forcenturies. Observations on ties applied in old masonry buildings have shown asignificant improvement of the earthquake resistance. Steel ties are usually insertedimmediately under the floor structure. Therefore usual reinforcing steel bars areused. Threading them at the ends allows them to be bolted to steel anchor plates atthe ends of the walls.
If they are applied in historical buildings, they are placed in carefully cut notches in
the walls and after installment the notches are filled with the bricks and stones attheir original position. This way the intervention is invisible [21].
Figure 6.34 Position of steel ties in plan of a rural stone-masonry house [21]
Figure 6.35 Position of steel ties in elevation of arural stone-masonry house [21]

7/21/2019 masterthesis_uelicamathias
http://slidepdf.com/reader/full/masterthesisuelicamathias 89/137
Evaluation 6
73
Interventions in Floor Structures and Roofs
Another way to improve the structural integrity is to improve the horizontal diaphragmaction and the connections of the horizontal diaphragms to the structural walls. As amatter of fact, this is one of the main reasons for the poor seismic behavior of
existing masonry buildings. New masonry buildings should have a r.c. tie-beamprovided along the structural walls at each story level. Then, tie-beams shouldconnect the floor to the walls and provide a monolithic behaving structural system.Rigid floor diaphragms and tie-beams prevent possible out-of-plane collapsemechanisms. Often timber floors are replaced by reinforced concrete or prefabricatedslabs. However, this measure provoked a large number of failure of old buildings inL'Aquilla. Another way to reinforce timber floors is by using steel ties. The bond-beams of timber floors that do not pass entirely over the section of the walls shouldbe connected together and anchored to the walls. They should be immured at least
15 cm deep into the supporting wall [21].
Figure 6.37 Detail of anchoring of a wooden floor into a stone-masonry wall [21]
Figure 6.36 Bracing of a large-span wooden floor with metallic truss [21]

7/21/2019 masterthesis_uelicamathias
http://slidepdf.com/reader/full/masterthesisuelicamathias 90/137
6 Evaluation
74
Repair of Corners and Wall Intersection Zones
Corners and wall intersection zones are constantly heavily damaged duringearthquakes. Therefore, damaged corners need frequently strengthening.Sometimes stitching is the method applied for stone or metal. Next to stitching,
vertical confining elements are used for brick-masonry structures. Alternatively, steelstrips welded to anchor plates at the outside ends can be used [21].
Strengthening of Walls by Confinement
The resistance capacity of a masonry structure can be improved significantly byconfining plain masonry walls with vertical confining elements, which are placed at allcorners and wall intersections. Further they should be placed along vertical borders
of large wall openings. This way the structural integrity is improved. Unfortunately,not all buildings are appropriate for installing tie-columns. Rigid floors and horizontalr.c. tie-beams should already exist in the masonry building.
Figure 6.38 Strengthening of the corner zone of a stone-masonrywall with stone stitching [21]
Figure 6.39 Strengthening of the corner zone of a stone-masonrywall with metal stitching [21]

7/21/2019 masterthesis_uelicamathias
http://slidepdf.com/reader/full/masterthesisuelicamathias 91/137
Evaluation 6
75
In case of stone-masonry buildings, it is not recommended to strengthen the wallswith r.c. tie-columns. In general, for the critical zones such as corners and wallintersections the masons used larger and frequently cut stones to connect bothleaves and therefore they form the best parts of the structure [21].
6.6.3 Foundation
In some cases, the foundation or ground failure may cause severe damage or eventhe collapse of a building under earthquake forces. However, existing foundations arerarely the reason for bad behavior of existing masonry buildings during earthquakes.More probably is a damage of masonry walls due to soil phenomena, such asliquefaction or soil sliding, which cause differential settlements, tilting and sinking ofthe building. These phenomena can be avoided with adequate geotechnicalmeasures.
If interventions are required in the foundation it is mostly because of too excessivevertical loading or washing out of subsoil due to inadequate maintenance of the
building’s drainage system. Another reason is the deterioration of foundationsystems, which are based on wooden piles, due to the effects of time [21].
6.6.4 Non-Structural Elements
Non-structural elements such as chimneys, attics and ornamentations do normallynot influence the seismic resistance of a structure. Nevertheless the collapse of thesenon-structural elements can damage structural elements or cause the loss of lives.Therefore non-structural elements should be properly secured [21].
Figure 6.40 Placement of new tie-columns in a
brick-masonry wall [21]

7/21/2019 masterthesis_uelicamathias
http://slidepdf.com/reader/full/masterthesisuelicamathias 92/137
7 Pilot Guideline for Seismic Evaluation of Historic Masonry Building Structures
76
7 Pilot Guideline for Seismic Evaluation of Historic
Masonry Building StructuresThis chapter discusses the evaluation steps used in this dissertation. They arepresented in terms of a list. In each step the important tasks are pointed out. Theidea of this list is that it could be used as guidance for further evaluations of existingmasonry structures. Chapter 7.2 discusses some alternatives.
7.1 Proposed Evaluation Procedure
The evaluation can be divided into four phases. In Phase A the survey of the building
is carried out, including all tasks performed to gain information about the structure ofrelevance. In Phase B a numerical program is selected and the structure of relevanceis modeled. This also includes the process of getting familiar with the software.Following, the evaluation process starts, described with Phase C. In this stage, theachieved performance of the structure of relevance is analyzed and compared withthe expected and required performance. If the performance is not satisfactory,Phase D follows suggesting measures of improvement.
A. Survey of the Building
1. Seismic Properties of the Building of Relevance
It is helpful to collect the seismic site information of the building ofrelevance at the beginning. This way, the design professional knows fromthe beginning with which seismic properties he is dealing with. As visible inChapter 3.1 these seismic properties consist out of the seismic zone, theground class defining the soil on which the building stands and theimportance class, which describes the importance of the structure. With theknowledge of the ground class, the seismic parameters , , and
can be found using the correspondent code. Next to the seismic propertiesbased on the codes, it is also useful to seek for possible local earthquakeevents that may be found in historical records or in national papershandling these matters. They can help to understand the local situation.
2. Geometrical Properties
The knowledge of the geometrical properties is of great importance for asuccessful analysis. Ideally, the original plans of construction of thebuilding as well as plans of any structural modifications can be found.
These old plans can also include useful structural information. However,old plans have to be verified on-site since they may not correspond to theactual situation anymore. If no plans are available, as it was the case for
7/21/2019 masterthesis_uelicamathias
http://slidepdf.com/reader/full/masterthesisuelicamathias 93/137
Pilot Guideline for Seismic Evaluation of Historic Masonry Building Structures 7
77
the BHO-structure, it becomes necessary to create new geometrical plansof the structure even though this is rather time-consuming. They arecreated by collecting the correspondent information during site visits.Thanks to the ongoing renovation of the BHO-structure, an architecturaloffice already created geometrical plans. This way the plans of the buildingpermit were available for the purpose of the seismic performanceevaluation of this work as explained in Chapter 3.2.
3. Structural Properties
For a structural analysis, the structural properties are required. Thereforeoriginal plans of construction and modifications are very useful. It is one ofthe most difficult tasks to completely understand the load-carrying systemof an old, existing structure. Thus, studying the available documents may
not give enough understanding of the structural composition of the buildingand further measures are required in order to obtain a higher knowledgelevel. Often, more detailed information about connections between floorsand walls or between different walls are required. As explained inChapter 3.4, knowledge of the composition of floors and their connectionsis of great importance in respect to their rigidity and to the generalperformance of the building. Since these parts are mostly hidden, it can berather challenging to obtain this information. It may be necessary to applysome of NDT (Non Destructive Tests), MDT (Minor Destructive Tests) orDT (Destructive Tests). The chosen measures need to stand in relation
with their benefit.
Another issue is to understand the foundation and the soil quality. In somecases the foundation or soil phenomena may be the reason for severedamage of the structure during an earthquake. Historical reports may helpto figure out if such phenomena occurred in the region.
In order to create in a later phase a qualitative numerical model of thebuilding’s structure, the structural components of the real structure need tobe understood (see Chapter 5.3).
Further, the vertical loads should be computed in this step. The dead loadscan be computed based on the composition of the floors and walls. Tocalculate the live loads the use of the different rooms is required.
4. Mechanical Properties
Once the structural components are known, the mechanical properties ofthe used materials need to be defined. There are two ways to definematerial characteristics if the necessary information of the used materialsis lacking. The first way is to estimate the required values based on theexperience of similar cases or using recommendations described in codes.

7/21/2019 masterthesis_uelicamathias
http://slidepdf.com/reader/full/masterthesisuelicamathias 94/137
7 Pilot Guideline for Seismic Evaluation of Historic Masonry Building Structures
78
The second way is to perform an experimental investigation. For the BHO-structure the definition of the masonry parameters was challenging. Asvisible in Chapter 3.5, the masonry characteristics are estimated usingprovisions described in Eurocode and Swisscode. Many of these formulasare empirical. However, if possible and economically responsible, thesecond way should be applied, since it delivers more certainty andtherewith a higher knowledge level. A good knowledge of the mechanicalproperties of the materials is of great importance as it is essential for theperformance of the structure. Changing the mechanical properties in a laterstep of the simulation will show that the results change in a rather sensitiveway.
5. Site Visit
For the evaluation of an old existing building it is necessary to conduct asite visit. As explained in the previous steps, more then one site visit maybe required. Connected with step 2 it is at least necessary to verify theavailable plans of the building on their actuality. If no plans are availableseveral site visits are required in order to create new ones. To understandthe structural components and their connections site visits may also benecessary as described in step 3. Then, as discussed in step 4 it isrecommended to perform experimental investigations in order to obtainmaterial characteristics such as the characteristic compression strength ofmasonry. Unless the precise composition of the masonry walls is explained
in the present data, the arrangement of the masonry units, their seizes andthe dimensions of the bed and head joints need to be studied during a sitevisit. These knowledge is required if code provisions are applied (seeChapter 3.5). For the purpose of this dissertation only one site visit wasperformed. As seen in Chapter 3.6 it served to verify the received data.Further, additional information was collected that could not be discoveredby studying the plans, e.g. the vaulted openings in the walls between thestairs (see Figure 3.3).
In order to be efficient during the site visit, it is important to study thecollected data in advance. Then, an outlet containing the uncertainties anddetails of further interest should be created. On the site visit this outlineserves as guidance. The site visit may also reveal differences between thereceived data and the real situation. Moreover, unexpected situations mayshow up.
Having some general knowledge of the surroundings of the building is alsoimportant. Sometimes, they can cause difficulties that could not bediscovered by studying the received data of the building of relevance, e.g.
the accessibility to the building site.

7/21/2019 masterthesis_uelicamathias
http://slidepdf.com/reader/full/masterthesisuelicamathias 95/137
Pilot Guideline for Seismic Evaluation of Historic Masonry Building Structures 7
79
B. Numerical Simulation
1. Choice of Numerical Software
There are multiple programs available on the market, which include tools
for seismic analysis. For the purpose of this dissertation, the 3Murisoftware was selected. As explained in Chapter 5.1, 3Muri is a numericalcomputation program created for the seismic analysis of masonrystructures. Further it has, next to Eurocode and Italian code, alsoSwisscode implemented. Hence, it seemed appropriate for the purpose ofthe seismic performance evaluation of the BHO-structure. The programdelivers deformation-based results with a capacity curve of the structure.
2. Verification
A program needs to be verified, especially if used for the first time. Theuser needs to get familiar with the software. A good way is to conduct testcomputations on simple structures. They can be verified with some handcalculations. Simple structures offer good opportunities to vary singleparameters and to test their sensitivity. In Chapter 5.2 a simple teststructure is defined. Then, a simple analysis is performed using theequivalent lateral force method and the response spectrum method. Additionally, a hand-calculated pushover curve is computed. This hand-calculated pushover curve is ideal for comparing with the pushover curve
computed by 3Muri.
3. Development of a Model of the Structure of Relevance
Once the verification phase is concluded, the development of the structureof relevance starts. The development of a multiple-story structure can betime-consuming if the stories contain different elements. As experiencedwhile modeling the BHO-structure, small mistakes may later cause theprogram to crash (see Chapter 5.3). Therefore it is important to developthe structure in multiple steps and to test after each step if the simulation
still works. This allows to directly identify new problems and to findsolutions.
As explained in Phase A under structural properties, the structuralcomponents need to be known in advance. The user may be forced tomake some simplifications while developing the model, which is easier ifthe structural system is understood.
Further, there may some modifications be required because of the limits ofthe program. During the development of the BHO-structure for example,
some windows in the staircase needed to be moved upwards to the nextstory-level because there would be two windows located over each other in

7/21/2019 masterthesis_uelicamathias
http://slidepdf.com/reader/full/masterthesisuelicamathias 96/137
7 Pilot Guideline for Seismic Evaluation of Historic Masonry Building Structures
80
the same story-level (see first floor in Figure 5.11). But this is somethingthe program refuses.
After the model is developed, the vertical loads of the floors need to beadded. Ideally, they are already calculated and summarized in Phase A,
step 3. This accelerates the model-developing process.
C. Evaluation
1. Computation of Demands
In order to verify the obtained capacities of the evaluation, the requireddemands need to be computed. The simplest way is to use the seismicdesign code. Therefore the seismic properties defined in Phase A, step 1,are required. With these parameters, a design response spectrum can be
computed using the correspondent formulas of the code.
A more precise way to compute the demands is to use the UHS for thecorresponded region. With the UHS the desired demands can becomputed using FEMA 750 [31]. Therefore the spectral acceleration valuesare required for the natural periods of 0.2 s and 1 s.
If less precision is allowed, the demand can be computed as shown inChapter 6.1. For the natural period of one second, the spectralaccelerations are obtained from the UHS for the requested performance
levels. Then, these values are used as the constant in SIA 261 in orderto compute the seismic design spectra.
Eventually, the demand capacities obtained with the seismic designspectra need to be transformed into the same scale as the achievedresponse capacities delivered by 3Muri. This transformation occurs byusing the participation factor as shown in Chapter 6.3. Once this is done,the capacities can be compared with each other.
2. Local Evaluation
3Muri offers a tool to investigate local failure mechanisms. With this toolthe out-of-plane behavior can be investigated. It is rather difficult tosuggest detailed or realistic out-of-plane mechanisms. Maybe some cracksare known from the site visit, which may indicate weak sections.Furthermore, an experienced design professional may be able to predictrealistic failure mechanisms. Another way is to investigate in general thefaçade walls of the building as performed in Chapter 6.4. Based on theglobal evaluation an additional mechanism is investigated in the third floor,
where the diaphragm deflection could be found. In general, the localevaluation should occur before the global one. If a structure collapses

7/21/2019 masterthesis_uelicamathias
http://slidepdf.com/reader/full/masterthesisuelicamathias 97/137
Pilot Guideline for Seismic Evaluation of Historic Masonry Building Structures 7
81
already under local mechanisms, the benefit of a global evaluation islimited.
3. Global Evaluation
The general performance of the building is investigated with a globalanalysis. Unlike in this dissertation, the global evaluation should be carriedout after the local evaluation. With 3Muri, 24 pushover curves are deliveredfor all 24 analyses combinations described in Chapter 5.1.4. 3Muri marksthe decisive analysis combination in the x- and y-direction with a yellow bar(see Appendix E). However, it is necessary to verify them. As inChapter 6.2, the ultimate displacement needs eventually to be redefinedmanually once a certain damage of the building is achieved. The frontfaçade of the BHO-structure collapses for example long before the
reference point reaches its ultimate displacement. Thus, the ultimatedisplacement of the structure needs to be manually redefined. This manualverification of the collapse mechanisms needs to be done for all relevantanalysis combinations. Until then, it is not always clear which analysiscombination that is relevant. Then, the achieved displacement capacity ofthe relevant combination needs to be verified with the correspondentdisplacement demands in order to check if the buildings performancesatisfies its requirements according to the performance levels.
At this point it may be of interest to compute the story drifts. In 3Muri the
displacements can be found for each node during every time-step. Thecomparison of the displacements between the single floors requires theexistence of reference nodes at the same location in each floor (such asnodes 60-64 in Figure 6.4). By subtracting the displacement of the lowerstory from the displacement of the higher one, the drift is obtained.Figure 6.24 visualizes the accumulated story drifts.
Studying the global performance may help find critical sections of thestructure, which may be of interest for a local analysis. This way thepotential local collapse mechanism of the third floor, visible in Figure 6.29,was found and investigated.
In addition to the global evaluation of the structure it could be of interest tocreate a rigid-floor model of the structure as in Chapter 6.3. The evaluationof a rigid-floor model may help to understand the influence and effect of therigidity of the floors on the global performance of the structure. Eventually,it may show that a relatively small improvement of the floor-stiffness mightimprove the global performance considerably.

7/21/2019 masterthesis_uelicamathias
http://slidepdf.com/reader/full/masterthesisuelicamathias 98/137
7 Pilot Guideline for Seismic Evaluation of Historic Masonry Building Structures
82
D. Measures of Improvement
If a structure requires improvement, there are numerous methods. They cangenerally be divided into the following groups: strengthening masonry walls,improving structural integrity, foundation and non-structural elements.
The analysis of the BHO-structure has shown that there are no seriousimprovements required. However, if an old structure undergoes a renovation, itmay be reasonable to investigate those components that collapsed first with thepushover curve in detail. This way the structure might still be improved.
In order to figure out the requested degree of improvement so that the structuresatisfies the required performance, it may be useful to develop a new numericalmodel of the structure, which includes the improvements. This way the effect ofthe improvements can be investigated and compared to the original structure.
Generally, tying of the structure is always recommended as well as improvingdetails and connections.
7.2 Alternatives
Alternatively to the here presented evaluation method, an old masonry building couldbe analyzed according to standard SIA 2018. However, this standard does notspecify very detailed how to analyze such a structure. In SIA D0237, two examplesshow the use of SIA 2018. Another way would be to analyze a structure strictly usingEC8. This way the advantages of the Eurocode in relation to Swisscode could beconsidered. Especially the use of knowledge levels and performance levels isexplained in this code. In any case EC8 is probably needed if standard SIA 2018 isused. Standard SIA 2018 states that for the analysis of a masonry structure with adeformation-based method, SIA 266 and EC8 should be applied.
Most important is to define at the beginning of an evaluation how detailed a structureshould be investigated. If only the basic behavior of a building is required, it may besuitable to perform a simple analysis based on some checklists, such as described in
Tier 1 of FEMA 310 or the checklists published by the Federal Office for Water andGeology (FOWG) [12].
Further, evaluation of the seismic performance of non-structural elements isimportant. Recent earthquake experience shows that, in aggregate, non-structuraldamage often exceeds the costs of structural damage. Nevertheless, the scope ofthis dissertation is limited to structural damage. It should be noted that the proposedevaluation procedure should be extended to cover the performance of non-structuralelements.

7/21/2019 masterthesis_uelicamathias
http://slidepdf.com/reader/full/masterthesisuelicamathias 99/137
Conclusion 8
83
8 Conclusion
Previous to the evaluation of the BHO-structure, evaluation procedures arecompared. Generally, seismic evaluation procedures can be divided into two groups:configuration based checks and strength checks (see Figure 2.1). As mentioned inChapter 1, configuration based checks serve to figure out quickly the generalbehavior of a structure while strength checks serve to compute the load carryingcapacity of the structure.
Comparing Swisscode, Eurocode and FEMA 310 shows that FEMA 310 includes themost advanced evaluation procedure for the evaluation of existent buildingstructures. In Swisscode the definition of performance levels is missing compared toEurocode and FEMA 310. Further, a safety factor expressing the knowledge level asknown in Eurocode is missing in Swisscode as well. For the analysis of old masonrystructures the partial factor for material according to SIA 266 appears to be the
only factor regarding uncertainties. It is rather hard to understand how this materialsafety factor can be equal to the factor of the knowledge level as defined in EC8.This is an issue that might be of interest for a future investigation.
The evaluation procedure described in Standard SIA 2018 is similar to the onedescribed in EC8, since many issues of Swisscode are based on Eurocode. In order
to examine the seismic resistance of existing buildings on a quick way, the FederalOffice for Water and Geology (FOWG) of Switzerland developed an evaluationprocedure based on checklists, similar to Tier 1 of FEMA 310.
The survey of the middle part of the Bundeshaus Ost building was connected withsome difficulties. Unfortunately, it was only possible to get limited knowledge of thebuilding because of security reasons. Some information, such as the seismicparameters were available from the example in documentation SIA 0237. Of thecomposition of floors and walls only limited information is existent. Further, someconnections could only be suggested and since the material characteristics of theongoing material survey were not available yet, they needed to be estimated usingcode provisions. Therefore, several assumptions were necessary in order to obtainall required values needed for the following simulation. After studying the collecteddata, a site visit was performed in order to verify the obtained plans of the buildingpermit of the ongoing renovation and to answer other questions. Also some new factswere discovered. Therefore the importance of a site visit can only be emphasized.
After the survey of the building, a numerical model of the building was created using3Muri-software. As mentioned in Chapter 5.1, 3Muri is a numerical computation
program created for the seismic analysis of masonry structures. The verification ofthe program showed almost matching pushover curves between the 3Muri computedand the hand-calculated one. During the development of the numerical model of the

7/21/2019 masterthesis_uelicamathias
http://slidepdf.com/reader/full/masterthesisuelicamathias 100/137
8 Conclusion
84
BHO-structure, some problems and limits of the program could be detected (seeChapter 5.3). Therefore, it is believed that the software can still be improved in termsof model development.
The evaluation of the BHO-structure has shown that it satisfies the design
requirements concerning the global and local performance under seismic loading forthe performance levels operational (72years), limited damage (475years) andcollapse prevention (2475years). As mentioned in Chapter 6.5, the BHO-structureundergoes a large deformation in the y-direction, while reaching the yield base shear.It is questionable if all the structural elements would remain intact under adisplacement of 25 cm. It could be interesting to investigate in more detail thediaphragm deflection in the third floor using more detailed information of the floorcomposition and connections. An improvement of the diaphragms would improve thebuilding integrity in general. Even though the program showed very good results
during the program verification in Chapter 5.2, it would be helpful to analyze theBHO-structure with another seismic program and to compare the results. It remainsdifficult to know how realistic the results are, considering that several assumptionsand estimations needed to be done in order to obtain the necessary structuralcomponents and the material characteristics. In a next step, it would be interesting torun the same simulation using the masonry parameters obtained from the ongoingmaterial survey and to compare the results to the ones in this dissertation.
Following the analysis of the flexible-floor model, a rigid-floor model was developed.In this model rigid floors replaced all the flexible floors. The load distribution remained
the same. Comparing the results of the rigid-floor model with the results of theflexible-floor model demonstrate that a more rigid-floor structure shows a betterintegrity with a more uniform deformation behavior. The comparison of thedeformation capacity in the y-direction is rather difficult since the reference point liesin the diaphragm deflection, determined in the third floor.
Next, the story drifts of both models were computed. The largest drift of 0.5% isfound to be in the expected area between 0.4% and 0.6%. The rigid-floor structureshows a higher story drift capacity than the flexible-floor one.
With 3Muri, the out-of-plane behavior of the two outside façades was analyzed foreach floor (see Chapter 6.4). In addition a partial local mechanism was investigatedin the third floor, where the diaphragm deflection was detected during the globalevaluation. All these investigations show that the BHO-structure has enoughresistance.
Conclusively, a pilot guideline for seismic evaluation of historic masonry buildingstructures was created. It is based on the experiences collected during the evaluationof the BHO-structure, which excludes the evaluation of the seismic performance of
non-structural elements. It should be noted that the proposed evaluation procedureshould be extended to cover the performance of non-structural elements.

7/21/2019 masterthesis_uelicamathias
http://slidepdf.com/reader/full/masterthesisuelicamathias 101/137
Conclusion 8
85

7/21/2019 masterthesis_uelicamathias
http://slidepdf.com/reader/full/masterthesisuelicamathias 102/137
9 References
86
9 References
[1] SIA D0237 (2010), Beurteilung von Mauerwerksgebäuden bezüglich Erdbeben,Swiss Society of Engineers and Architects, Zürich, pp. 106.
[2] Bachmann, H. and Lang, K. (2002). Zur Erdbebensicherung vonMauerwerksbauten, Institute of Structural Engineering, Swiss Federal Instituteof Technology Zürich, Zürich, pp. 3.
[3] Merkblatt SIA 2018 (2004), Überprüfung bestehender Gebäude bezüglichErdbeben
[4] Wenk, T. (2006). Application of Eurocode 8 in Switzerland, First EuropeanConference on Earthquake Engineering and Seismology, paper number 1399,Geneva
[5] Rai. D. C. (2003), Review of Documents on Seismic Evaluation of ExistingBuildings, Indian Institute of Technology Kanpur, Document Nr. IITK-GSDMA-EQ03-V1.0, Kanpur
[6] SIA 160 (1970) and (1989), Einwirkungen auf Tragwerke, Swiss Society ofEngineers and Architects, Zürich
[7] Empfehlung SIA 160/2 (1975), Praktische Massnahmen zum Schutze derBauwerke gegen Erdbeben, Swiss Society of Engineers and Architects, Zürich
[8] Wenk, T. (2000), Erdbeben-Baunormen der Schweiz, 15. NDK Blockkurs,Institute of Structural Engineering, Swiss Federal Institute of Technology Zürich,Zürich
[9] SIA 261 (2003), Actions on Structures, Swiss Society of Engineers and Architects, Zürich, pp. 114.
[10] SIA 266 (2003), Masonry, Swiss Society of Engineers and Architects, Zürich,pp. 44.
[11] EN 1998-3 (2005), Eurocode 8: Design of structures for earthquake resistance – Part 3: Assessment and retrofitting of buildings, Brussels, pp. 89.
[12] Richtlinien des BWG (2005), Beurteilung der Erdbebensicherheit bestehenderGebäude – Konzept und Richtlinien für die Stufen 1-3, Federal Office for Waterand Geology FOWG, Bern, pp. 133.
[13] FEMA-310 (1998), Handbook for the Seismic Evaluation of Buildings, FederalEmergency Management Agency and American Society of Civil Engineers,pp. 218.
[14] EN 1998-1 (2003), Eurocode 8: Design of structures for earthquake resistance
– Part 1: General rules, seismic actions and rules for buildings, Brussels,pp. 227.

7/21/2019 masterthesis_uelicamathias
http://slidepdf.com/reader/full/masterthesisuelicamathias 103/137
References 9
87
[15] Tena-Colunga, A. and Abrams, D. P. (1996), Seismic Behavior of Structureswith Flexible Diaphragms, Journal of Structural Engineering, 122:439-445,pp. 439-445.
[16] FEMA-356 (2000), Prestandard and Commentary for the Seismic Rehabilitation
of Buildings, Federal Emergency Management Agency, Washington D.C., pp.518.
[17] EN 1996-1-1 (2004), Eurocode 6: Design of masonry structures – Part 1-1:Common rules for reinforced and unreinforced masonry structures, Brussels,pp. 123.
[18] SIA V178 (1996), Naturstein-Mauerwerk, Swiss Society of Engineers and Architects, Zürich, p. 40.
[19] SIA 266/2 (2012), Natural Stone Masonry, Swiss Society of Engineers and
Architects, Zürich, pp. 14-22.[20] EN 1052-1 (1998), Methods of test for masonry – Part 1: Determination of
compressive strength
[21] Toma+evi,, M. (2006), Earthquake-Resistant Design of Masonry Buildings,Slovenian National Building and Civil Engineering Institute, Imperial CollagePress, p.46, p.121. pp. 203-251.
[22] Lang, K. (2002). Seismic vulnerability of existing buildings, Dissertation ETHNo. 14446. Swiss Federal Institute of Technology Zürich, Zürich, pp. 16-18.
[23] Chopra, A. K. (2007). Dynamics of Structures, Theory and Applications toEarthquake Engineering, 3rd Edition. Prentice Hall. p. 556.
[24] 3Muri General Description, Version 4, S.T.A. DATA, Torino, pp. 78.
[25] 3Muri User Manual, Release: 5.0.1, S.T.A. DATA, Torino, pp. 136.
[26] D.M. 14 gennaio 2008, Norme Tecniche per le Costruzioni, pp. 438.
[27] Turn"ek, V. and Cacovic, F. (1971). Some experimental results on the strengthof brick masonry walls, Proceedings of the 2nd IBBMC, Stoke-on-Trent, pp. 149-156.
[28] SIA V177, Mauerwerk, Swiss Society of Engineers and Architects, Zürich,pp. 52.
[29] Wikipedia (visited 01.07.2013). http://en.wikipedia.org/wiki/Hazard
[30] Giardini, D. and Wiemer, S. and Fäh, D. and Deichmann, N. (2004). SeismicHazard Assessment of Switzerland, Swiss Seismological Service, SwissFederal Institute of Technology Zürich, Zürich, pp. 95.
[31] FEMA P-750 (2009), NEHRP Recommended Seismic Provisions for NewBuildings and Other Structures, Federal Emergency Management Agency of theU.S. Department of Homeland Security, Washington D.C., pp. 21-35.

7/21/2019 masterthesis_uelicamathias
http://slidepdf.com/reader/full/masterthesisuelicamathias 104/137
A Appendix
88
Appendix
A Site Visit
Figure A.1 Picture recording positions

7/21/2019 masterthesis_uelicamathias
http://slidepdf.com/reader/full/masterthesisuelicamathias 105/137
Appendix A
89
Figure A.2 Picture 1 Figure A.3 Picture 2
Figure A.4 Picture 3 Figure A.5 Picture 4
Figure A.6 Picture 5 Figure A.7 Picture 6

7/21/2019 masterthesis_uelicamathias
http://slidepdf.com/reader/full/masterthesisuelicamathias 106/137
A Appendix
90
Figure A.8 Picture 7
Figure A.9 Picture 8
Figure A.10 Picture 9
Figure A.11 Picture 10
Figure A.13 Picture 12 Figure A.12 Picture 11

7/21/2019 masterthesis_uelicamathias
http://slidepdf.com/reader/full/masterthesisuelicamathias 107/137
Appendix A
91
Figure A.14 Picture 14 Figure A.15 Picture 15
Figure A.16 Picture 16 Figure A.17 Picture 17
Figure A.18 Picture 18 Figure A.19 Picture 19

7/21/2019 masterthesis_uelicamathias
http://slidepdf.com/reader/full/masterthesisuelicamathias 108/137
A Appendix
92
Figure A.20 Picture 20 Figure A.21 Picture 21
Figure A.22 Picture 22
Figure A.23 Picture 23
Figure A.24 Picture 24
Figure A.25 Picture 25

7/21/2019 masterthesis_uelicamathias
http://slidepdf.com/reader/full/masterthesisuelicamathias 109/137
Appendix A
93
Figure A.26 Picture 26
Figure A.27 Picture 27
Figure A.28 Picture 28
Figure A.29 Picture 29

7/21/2019 masterthesis_uelicamathias
http://slidepdf.com/reader/full/masterthesisuelicamathias 110/137
B Appendix
94
B BHO-structure
B.1 Geometry
Figure B.1 Ground plan of the underground floor (TP) of the middle part of the BHO-structure

7/21/2019 masterthesis_uelicamathias
http://slidepdf.com/reader/full/masterthesisuelicamathias 111/137
Appendix B
95
Figure B.2 Ground plan of the ground floor (EG) of the middle part of the BHO-structure

7/21/2019 masterthesis_uelicamathias
http://slidepdf.com/reader/full/masterthesisuelicamathias 112/137
B Appendix
96
Figure B.3 Ground plan of the first floor (1.OG) of the middle part of the BHO-structure

7/21/2019 masterthesis_uelicamathias
http://slidepdf.com/reader/full/masterthesisuelicamathias 113/137
Appendix B
97
Figure B.4 Ground plan of the second floor (2.OG) of the middle part of the BHO-
structure

7/21/2019 masterthesis_uelicamathias
http://slidepdf.com/reader/full/masterthesisuelicamathias 114/137
B Appendix
98
Figure B.5 Ground plan of the third floor (3.OG) of the middle part of the BHO-structure

7/21/2019 masterthesis_uelicamathias
http://slidepdf.com/reader/full/masterthesisuelicamathias 115/137
Appendix B
99
Figure B.6 Ground plan of the fourth floor (4.OG) of the middle part of the BHO-
structure

7/21/2019 masterthesis_uelicamathias
http://slidepdf.com/reader/full/masterthesisuelicamathias 116/137
B Appendix
100
Figure B.7 Top view of the roof of the middle part of the BHO-structure

7/21/2019 masterthesis_uelicamathias
http://slidepdf.com/reader/full/masterthesisuelicamathias 117/137
Appendix B
101
Figure B.8 Cross section of the middle part of the BHO-structure

7/21/2019 masterthesis_uelicamathias
http://slidepdf.com/reader/full/masterthesisuelicamathias 118/137
B Appendix
102
Figure B.9 Cross section of the east corridor part of the BHO-structure

7/21/2019 masterthesis_uelicamathias
http://slidepdf.com/reader/full/masterthesisuelicamathias 119/137
Appendix B
103
Figure B.10 Longitudinal section of the middle part of the BHO-structure with theentrance hall and the staircases

7/21/2019 masterthesis_uelicamathias
http://slidepdf.com/reader/full/masterthesisuelicamathias 120/137
B Appendix
104
Figure B.11 Longitudinal section of the corridors of the BHO-structure

7/21/2019 masterthesis_uelicamathias
http://slidepdf.com/reader/full/masterthesisuelicamathias 121/137
Appendix B
105
B.2 Vertical Load Assignments and Floor Types
In each floor the load-carrying direction is shown with black arrows. Only the blueand red marked parts have a 50%-load distribution in both directions.
Figure B.12 Ground floor on base floor (EG on TP)
Figure B.13 First floor on ground floor (1.OG on EG)

7/21/2019 masterthesis_uelicamathias
http://slidepdf.com/reader/full/masterthesisuelicamathias 122/137
B Appendix
106
Figure B.14 Second floor on first floor (2.OG on 1.OG)
Figure B.15 Third floor on second floor (3.OG on 2.OG)
Figure B.16 Fourth floor on third floor (4.OG on 3.OG)

7/21/2019 masterthesis_uelicamathias
http://slidepdf.com/reader/full/masterthesisuelicamathias 123/137
Appendix B
107
B.3 Floor types and its components
Figure B.17 Floor types with their components
Figure B.18 Vault types with their components

7/21/2019 masterthesis_uelicamathias
http://slidepdf.com/reader/full/masterthesisuelicamathias 124/137
C Appendix
108
C Mass Center Calculation
Table D.1 Mass center calculation of the ground floor (EG)
Table D.2 Mass center calculation of the first floor (1.OG)

7/21/2019 masterthesis_uelicamathias
http://slidepdf.com/reader/full/masterthesisuelicamathias 125/137
Appendix C
109
Table D.3 Mass center calculation of the second floor (2.OG)
Table D.4 Mass center calculation of the third floor (3.OG)

7/21/2019 masterthesis_uelicamathias
http://slidepdf.com/reader/full/masterthesisuelicamathias 126/137
D Appendix
110
D Test Building Structure
D.1 Equivalent Force Analysis according to SIA 261

7/21/2019 masterthesis_uelicamathias
http://slidepdf.com/reader/full/masterthesisuelicamathias 127/137
Appendix D
111
D.2 Response Spectra Analysis according to SIA 261

7/21/2019 masterthesis_uelicamathias
http://slidepdf.com/reader/full/masterthesisuelicamathias 128/137
D Appendix
112
D.3 Hand calculation to Bachmann and Lang

7/21/2019 masterthesis_uelicamathias
http://slidepdf.com/reader/full/masterthesisuelicamathias 129/137
Appendix D
113
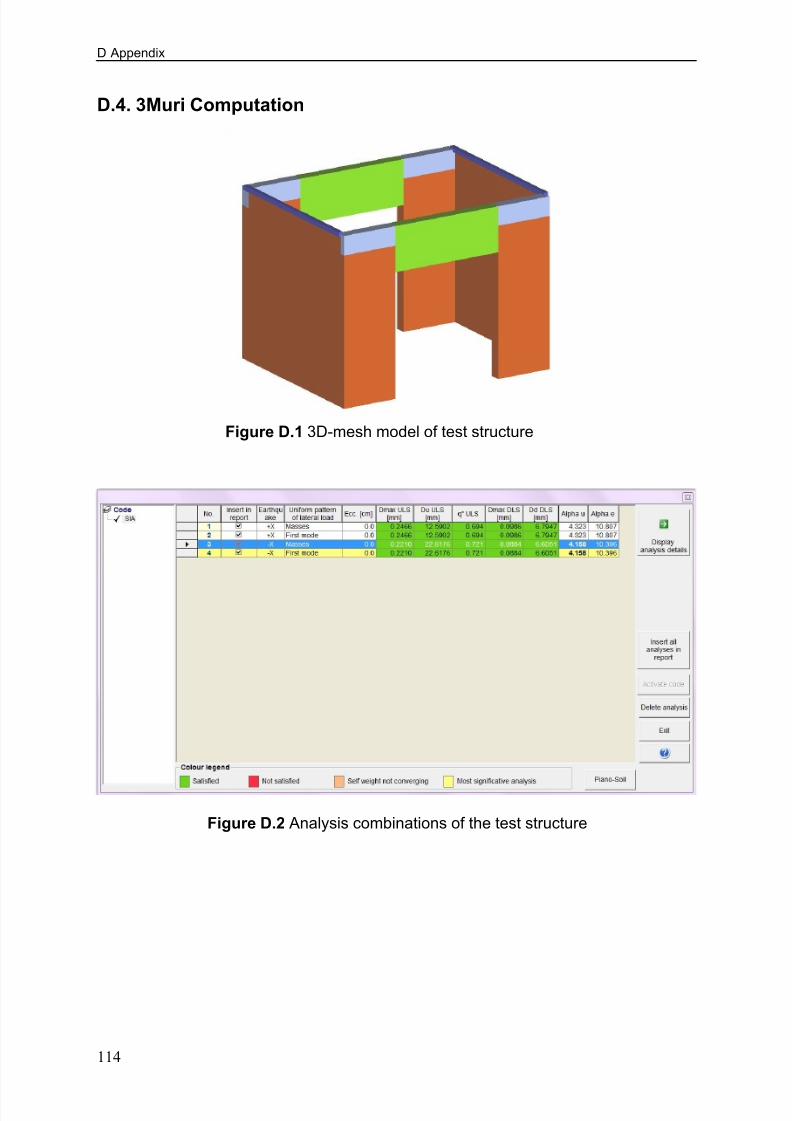
7/21/2019 masterthesis_uelicamathias
http://slidepdf.com/reader/full/masterthesisuelicamathias 130/137
D Appendix
114
D.4. 3Muri Computation
Figure D.2 Analysis combinations of the test structure
Figure D.1 3D-mesh model of test structure

7/21/2019 masterthesis_uelicamathias
http://slidepdf.com/reader/full/masterthesisuelicamathias 131/137
Appendix D
115
Figure D.3 Results of the decisive analysis combination for the test structure

7/21/2019 masterthesis_uelicamathias
http://slidepdf.com/reader/full/masterthesisuelicamathias 132/137
E Appendix
116
E Evaluation
E.1 Global Analysis
Figure E.1 24 analyses combinations for the flexible-floor model
Figure E.2 Analysis results for the decisive analysis nr. 12 in the x-direction

7/21/2019 masterthesis_uelicamathias
http://slidepdf.com/reader/full/masterthesisuelicamathias 133/137
Appendix E
117
Figure E.3 Analysis results for the decisive analysis nr. 18 in the y-direction

7/21/2019 masterthesis_uelicamathias
http://slidepdf.com/reader/full/masterthesisuelicamathias 134/137
E Appendix
118
The following tables contain the values of the story-drift evaluation. Two analysescombinations have been used to determine the maximal story drift in each direction.The green fields show the decisive drift in the correspondent analysis.
Table E.1 Story drift determination for the model with flexible floors

7/21/2019 masterthesis_uelicamathias
http://slidepdf.com/reader/full/masterthesisuelicamathias 135/137
Appendix E
119
Table E.2 Story drift determination of the model with rigid floors

7/21/2019 masterthesis_uelicamathias
http://slidepdf.com/reader/full/masterthesisuelicamathias 136/137
E Appendix
120
E.2 Local Analysis
Local Collapse Mechanisms of Wall 1
Figure E.4 Mechanism 1 of Wall 1 Figure E.5 Mechanism 2 of Wall 1
Figure E.6 Mechanism 3 of Wall 1 Figure E.7 Mechanism 4 of Wall 1
Figure E.8 Mechanism 5 of Wall 1 Figure E.9 Mechanism 6 of Wall 1

7/21/2019 masterthesis_uelicamathias
http://slidepdf.com/reader/full/masterthesisuelicamathias 137/137
Appendix E
Local Collapse Mechanisms of Wall 2
Figure E.10 Mechanism 1 of Wall 2 Figure E.11 Mechanism 2 of Wall 2


