Embed Size (px)
Citation preview
Office of National Marine Sanctuaries Office of Response and Restoration
Screening Level Risk Assessment Package
Material Service
March 2013
National Oceanic and Atmospheric Administration Office of National Marine Sanctuaries Daniel J. Basta, Director Lisa Symons John Wagner Office of Response and Restoration Dave Westerholm, Director Debbie Payton Doug Helton Photo: Photograph of Material Service
Source: http://www.windycitydiving.net/dive-videos/wrecks
i
Table of Contents
Project Background .......................................................................................................................................ii
Executive Summary ......................................................................................................................................1
Section 1: Vessel Background Information: Remediation of Underwater Legacy Environmental Threats (RULET) .....................................................................................................2
Vessel Particulars .........................................................................................................................................2 Casualty Information .....................................................................................................................................3 Wreck Location .............................................................................................................................................4 Casualty Narrative ........................................................................................................................................4 General Notes ..............................................................................................................................................5 Wreck Condition/Salvage History ................................................................................................................6 Archaeological Assessment .........................................................................................................................7 Assessment ..................................................................................................................................................7 Background Information References ............................................................................................................8 Vessel Risk Factors ......................................................................................................................................8
Section 2: Environmental Impact Modeling ...............................................................................................14
Release Scenarios Used in the Modeling ...................................................................................................13 Oil Type for Release ...................................................................................................................................16 Oil Thickness Thresholds ............................................................................................................................16 Potential Impacts to the Water Column .......................................................................................................17 Potential Water Surface Slick ......................................................................................................................18 Potential Shoreline Impacts.........................................................................................................................20
Section 3: Ecological Resources At Risk ..................................................................................................21
Ecological Risk Factors ...............................................................................................................................22
Section 4: Socio-Economic Resources At Risk ........................................................................................27
Socio-Economic Risk Factors .....................................................................................................................30
Section 5: Overall Risk Assessment and Recommendations for Assessment,
Monitoring, or Remediation ..........................................................................................................35
ii
Project Background The past century of commerce and warfare has left a legacy of thousands of sunken vessels along the U.S.
coast. Many of these wrecks pose environmental threats because of the hazardous nature of their cargoes,
presence of munitions, or bunker fuel oils left onboard. As these wrecks corrode and decay, they may
release oil or hazardous materials. Although a few vessels, such as USS Arizona in Hawaii, are well-
publicized environmental threats, most wrecks, unless they pose an immediate pollution threat or impede
navigation, are left alone and are largely forgotten until they begin to leak.
In order to narrow down the potential sites for inclusion into regional and area contingency plans, in
2010, Congress appropriated $1 million to identify the most ecologically and economically significant
potentially polluting wrecks in U.S. waters. This project supports the U.S. Coast Guard and the Regional
Response Teams as well as NOAA in prioritizing threats to coastal resources while at the same time
assessing the historical and cultural significance of these nonrenewable cultural resources.
The potential polluting shipwrecks were identified through searching a broad variety of historical sources.
NOAA then worked with Research Planning, Inc., RPS ASA, and Environmental Research Consulting to
conduct the modeling forecasts, and the ecological and environmental resources at risk assessments.
Initial evaluations of shipwrecks located within American waters found that approximately 600-1,000
wrecks could pose a substantial pollution threat based on their age, type and size. This includes vessels
sunk after 1891 (when vessels began being converted to use oil as fuel), vessels built of steel or other
durable material (wooden vessels have likely deteriorated), cargo vessels over 1,000 gross tons (smaller
vessels would have limited cargo or bunker capacity), and any tank vessel.
Additional ongoing research has revealed that 87 wrecks pose a potential pollution threat due to the
violent nature in which some ships sank and the structural reduction and demolition of those that were
navigational hazards. To further screen and prioritize these vessels, risk factors and scores have been
applied to elements such as the amount of oil that could be on board and the potential ecological or
environmental impact.
1
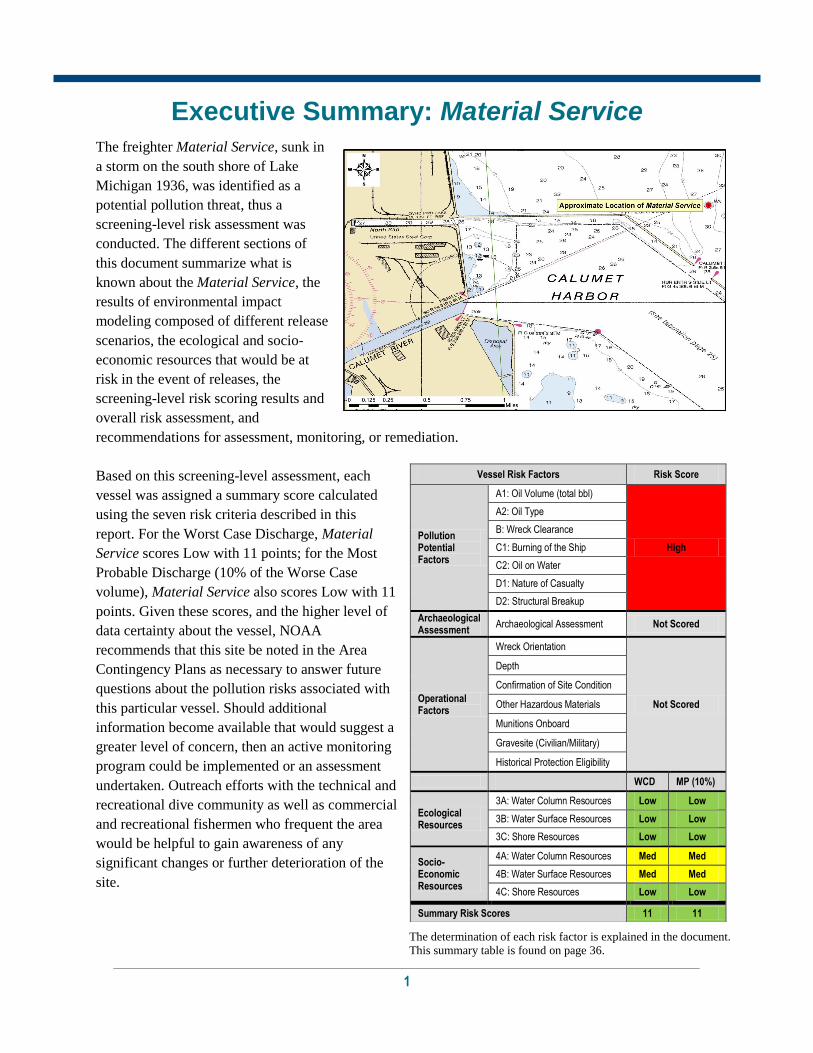
Executive Summary: Material Service
The freighter Material Service, sunk in
a storm on the south shore of Lake
Michigan 1936, was identified as a
potential pollution threat, thus a
screening-level risk assessment was
conducted. The different sections of
this document summarize what is
known about the Material Service, the
results of environmental impact
modeling composed of different release
scenarios, the ecological and socio-
economic resources that would be at
risk in the event of releases, the
screening-level risk scoring results and
overall risk assessment, and
recommendations for assessment, monitoring, or remediation.
Based on this screening-level assessment, each
vessel was assigned a summary score calculated
using the seven risk criteria described in this
report. For the Worst Case Discharge, Material
Service scores Low with 11 points; for the Most
Probable Discharge (10% of the Worse Case
volume), Material Service also scores Low with 11
points. Given these scores, and the higher level of
data certainty about the vessel, NOAA
recommends that this site be noted in the Area
Contingency Plans as necessary to answer future
questions about the pollution risks associated with
this particular vessel. Should additional
information become available that would suggest a
greater level of concern, then an active monitoring
program could be implemented or an assessment
undertaken. Outreach efforts with the technical and
recreational dive community as well as commercial
and recreational fishermen who frequent the area
would be helpful to gain awareness of any
significant changes or further deterioration of the
site.
Vessel Risk Factors Risk Score
Pollution Potential Factors
A1: Oil Volume (total bbl)
High
A2: Oil Type
B: Wreck Clearance
C1: Burning of the Ship
C2: Oil on Water
D1: Nature of Casualty
D2: Structural Breakup
Archaeological Assessment
Archaeological Assessment Not Scored
Operational Factors
Wreck Orientation
Not Scored
Depth
Confirmation of Site Condition
Other Hazardous Materials
Munitions Onboard
Gravesite (Civilian/Military)
Historical Protection Eligibility
WCD MP (10%)
Ecological Resources
3A: Water Column Resources Low Low
3B: Water Surface Resources Low Low
3C: Shore Resources Low Low
Socio-Economic Resources
4A: Water Column Resources Med Med
4B: Water Surface Resources Med Med
4C: Shore Resources Low Low
Summary Risk Scores 11 11
The determination of each risk factor is explained in the document.
This summary table is found on page 36.
Section 1: Vessel Background Information: Remediation of Underwater Legacy Environmental Threats (RULET)
2
SECTION 1: VESSEL BACKGROUND INFORMATION: REMEDIATION OF
UNDERWATER LEGACY ENVIRONMENTAL THREATS (RULET)
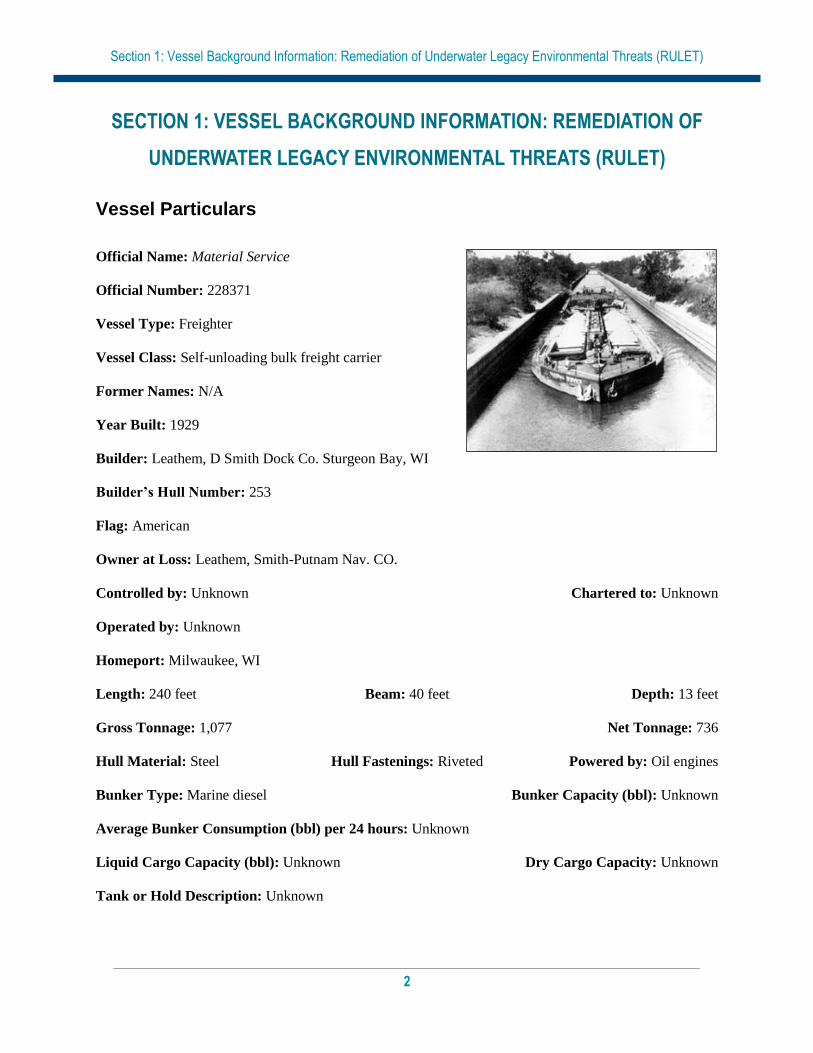
Vessel Particulars
Official Name: Material Service
Official Number: 228371
Vessel Type: Freighter
Vessel Class: Self-unloading bulk freight carrier
Former Names: N/A
Year Built: 1929
Builder: Leathem, D Smith Dock Co. Sturgeon Bay, WI
Builder’s Hull Number: 253
Flag: American
Owner at Loss: Leathem, Smith-Putnam Nav. CO.
Controlled by: Unknown Chartered to: Unknown
Operated by: Unknown
Homeport: Milwaukee, WI
Length: 240 feet Beam: 40 feet Depth: 13 feet
Gross Tonnage: 1,077 Net Tonnage: 736
Hull Material: Steel Hull Fastenings: Riveted Powered by: Oil engines
Bunker Type: Marine diesel Bunker Capacity (bbl): Unknown
Average Bunker Consumption (bbl) per 24 hours: Unknown
Liquid Cargo Capacity (bbl): Unknown Dry Cargo Capacity: Unknown
Tank or Hold Description: Unknown
Section 1: Vessel Background Information: Remediation of Underwater Legacy Environmental Threats (RULET)
3
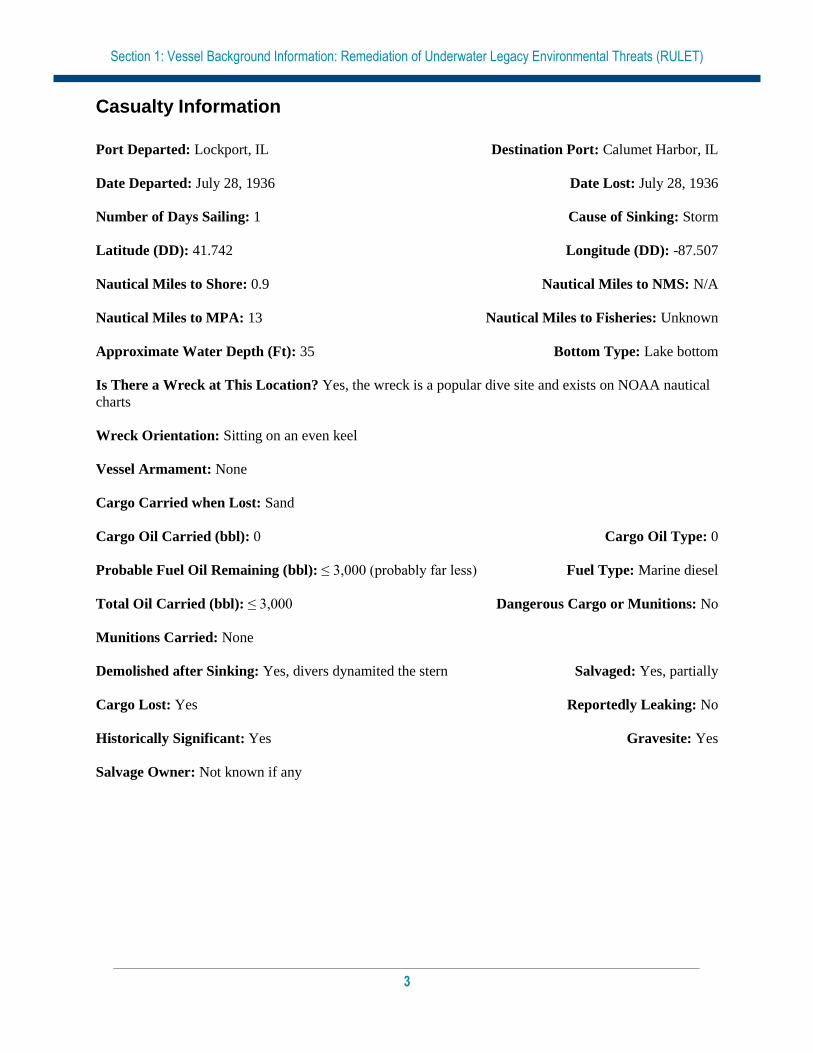
Casualty Information
Port Departed: Lockport, IL Destination Port: Calumet Harbor, IL
Date Departed: July 28, 1936 Date Lost: July 28, 1936
Number of Days Sailing: 1 Cause of Sinking: Storm
Latitude (DD): 41.742 Longitude (DD): -87.507
Nautical Miles to Shore: 0.9 Nautical Miles to NMS: N/A
Nautical Miles to MPA: 13 Nautical Miles to Fisheries: Unknown
Approximate Water Depth (Ft): 35 Bottom Type: Lake bottom
Is There a Wreck at This Location? Yes, the wreck is a popular dive site and exists on NOAA nautical
charts
Wreck Orientation: Sitting on an even keel
Vessel Armament: None
Cargo Carried when Lost: Sand
Cargo Oil Carried (bbl): 0 Cargo Oil Type: 0
Probable Fuel Oil Remaining (bbl): ≤ 3,000 (probably far less) Fuel Type: Marine diesel
Total Oil Carried (bbl): ≤ 3,000 Dangerous Cargo or Munitions: No
Munitions Carried: None
Demolished after Sinking: Yes, divers dynamited the stern Salvaged: Yes, partially
Cargo Lost: Yes Reportedly Leaking: No
Historically Significant: Yes Gravesite: Yes
Salvage Owner: Not known if any
Section 1: Vessel Background Information: Remediation of Underwater Legacy Environmental Threats (RULET)
4
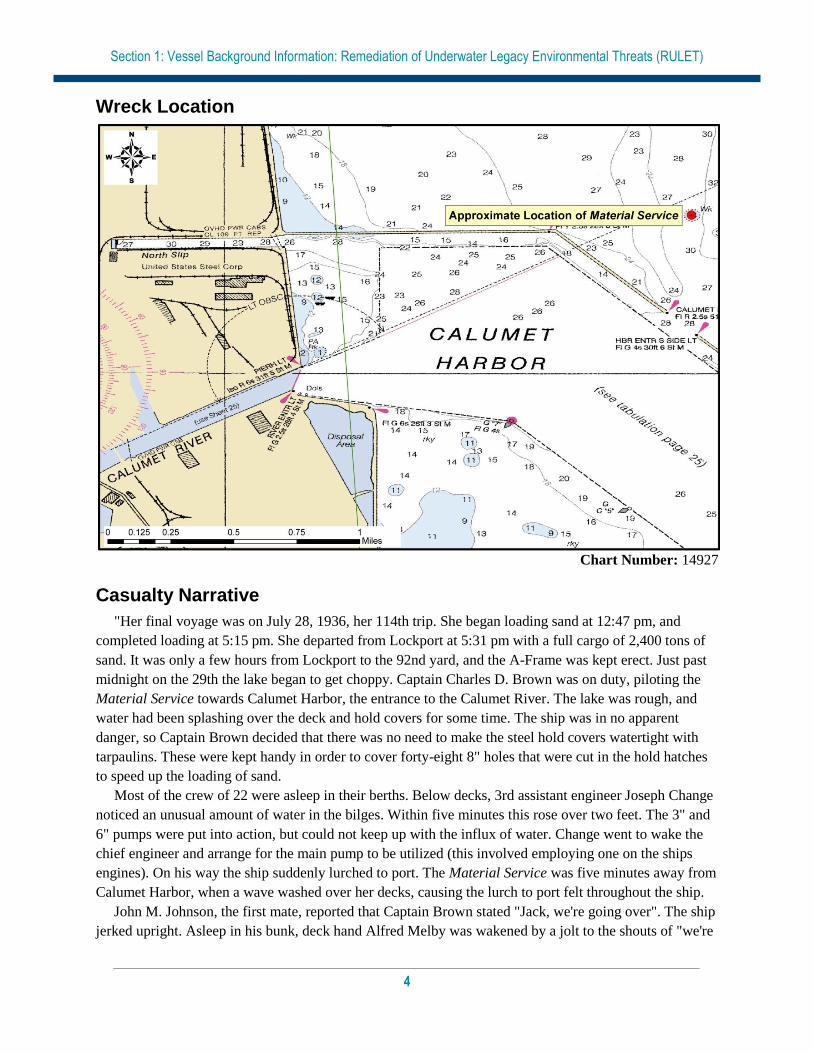
Wreck Location
Chart Number: 14927
Casualty Narrative
"Her final voyage was on July 28, 1936, her 114th trip. She began loading sand at 12:47 pm, and
completed loading at 5:15 pm. She departed from Lockport at 5:31 pm with a full cargo of 2,400 tons of
sand. It was only a few hours from Lockport to the 92nd yard, and the A-Frame was kept erect. Just past
midnight on the 29th the lake began to get choppy. Captain Charles D. Brown was on duty, piloting the
Material Service towards Calumet Harbor, the entrance to the Calumet River. The lake was rough, and
water had been splashing over the deck and hold covers for some time. The ship was in no apparent
danger, so Captain Brown decided that there was no need to make the steel hold covers watertight with
tarpaulins. These were kept handy in order to cover forty-eight 8" holes that were cut in the hold hatches
to speed up the loading of sand.
Most of the crew of 22 were asleep in their berths. Below decks, 3rd assistant engineer Joseph Change
noticed an unusual amount of water in the bilges. Within five minutes this rose over two feet. The 3" and
6" pumps were put into action, but could not keep up with the influx of water. Change went to wake the
chief engineer and arrange for the main pump to be utilized (this involved employing one on the ships
engines). On his way the ship suddenly lurched to port. The Material Service was five minutes away from
Calumet Harbor, when a wave washed over her decks, causing the lurch to port felt throughout the ship.
John M. Johnson, the first mate, reported that Captain Brown stated "Jack, we're going over". The ship
jerked upright. Asleep in his bunk, deck hand Alfred Melby was wakened by a jolt to the shouts of "we're
Section 1: Vessel Background Information: Remediation of Underwater Legacy Environmental Threats (RULET)
5
sinking!" Melby and six other sailors raced up the ladder leading to the deck. Clutching a life-vest, he was
the last to flee. Melby was pulled under by the suction of the sinking ship, the lake "swallowing him up".
He credited the life-vest with saving his life. In the pilot house, Johnson grabbed the captain's arm to help
steady him, but lost his hold. In a pendulum motion, the deck swung almost vertical, starboard and port
becoming up and down. Johnson and Brown were thrown into Lake Michigan. In under a minute the
Material Service was gone.
The upright A-frame and bow light staff were visible above the surface, mute tombstones of steel that
marked the graves of Captain Brown, the Chief Engineer and 14 others. Many were trapped in their berths
or pulled under by suction. Change, Johnson and Melby were counted among the seven survivors. Several
weeks later, on June 24, a waterlogged lifebuoy from the Material Service would wash ashore in Sturgeon
Bay, WI, just one mile from the site of the Material Service's launching. A trip of over 250 miles. The
sinking prompted several inquiries and a law suit for the insured value, $200,000.00. The suit was later
dismissed. The disaster was eventually blamed on water entering the holds, and possibly on the erect A-
Frame making the ship top heavy (the added see-sawing motion could have added to the water entry).
Captain Brown was found to be at fault. The A-Frame and light staff were removed a few days after
the disaster, and the wreck temporarily buoyed. Several attempts at salvage were made over the next
decade. Her $200,000.00 salvage value was a prize for anyone lucky or skilled enough to raise her. A
Canadian company abandoned salvage attempts after two years of efforts. September 1944 witnessed the
sale of the Material Service to a Detroit ship operator, William Nicholson, for $3,250.00. Considered one
of the best salvers on the Great Lakes, his salvage efforts also failed, the weather constantly interfering
with all attempts. The wreck was virtually ignored after that, and was abandoned." -
http://www.materialservicebarge.com/
General Notes
"She was constructed in Sturgeon Bay, WI at the Smith Shipyards from late 1928 to March of 1929. She
cost close to $350,000.00 (that translates to almost 14 million today!), and was on a 10 year lease to the
Material Service Company. The motorbarge was owned by Leatham, Smith, Putnam Navigation Corp.
Putnam was also Secretary/Treasurer of the Material Service Company.
Just over 239 feet long with a 40 foot beam and 13' 10" draft, the Material Service would operate
profitably for several years. Her deck was almost flat, giving the low profile needed to clear the bridges,
her maximum height from waterline to top, just 14' 6". She had only a rudimentary superstructure
extending just three feet above the deck. The pilot house stood about a foot over this, just big enough for
the pilot and one other person to stick his head in and see above the deck. It was often used as a seat for
crew members while on deck. A retractable A-frame would be raised to provide the hoist needed to raise
the unloading conveyor off the deck. This system was an exclusive Putnam patent. With the A-frame
lowered, a man standing on deck would be the tallest object on the ship.
The Material Service so resembled a barge that, to look at her, you would never guess that she had
crews quarters and an engine room! The unloading system was the heart of the ship and ingenious in its
engineering. The erected A-Frame would hoist the far end of the 90 foot long conveyor off the deck. The
conveyor's aft end was attached to a hopper at the base of the A-Frame. Cargo would be fed to the
conveyor via the hopper, which in turn was fed by an inclined conveyor that hauled the cargo up from a
hopper below decks. Sand and gravel was fed to this from the two tunnels that ran the length of the ship
beneath the holds. Crescent shaped scrapers would drag the cargo through the tunnels, up an incline, to
Section 1: Vessel Background Information: Remediation of Underwater Legacy Environmental Threats (RULET)
6
the hopper. The entire deck assembly - A-Frame, hopper and conveyor sat on a huge swivel that could be
set to almost any angle. Cargo could be unloaded at 800 tons per hour.
The Material Service was self propelled, with twin screws powered by two 350 HP diesel engines.
Her maximum speed was 10 1/2 MPH. Her four holds could be loaded via eight 30' X 10' subdivided
hatches, and would carry 2,400 tons of cargo. She was constructed almost entirely of steel. The Material
Service supplied gravel and sand for many Chicago buildings, most notably the Merchandise Mart. She
was en route from Lockport to the Material Service yard at 92nd and the Calumet River when she sank." -
http://www.materialservicebarge.com/
Wreck Condition/Salvage History
"Diving the Material Service is as simple as Lake Michigan diving gets. Located on the south shore of
the lake, it can be easily found on NOAA chart #14927, just Northeast of the Calumet Harbor entrance. It
is indicated as a wreck and as being marked by buoy WR10 (now gone.)... Being so large the Material
Service is easily located with any depth sounder. It lies upright on a flat, sandy plain, the hull resting in
approximately 30 feet of water. Tieing off to the can buoy is illegal, but finding a solid anchor point on
the wreck is uncomplicated. The water tends to be choppy, being so close to the breakwall, but this
turbulence disappears a few feet below the surface. Visibility averages seven feet, and the water is
comfortable enough for a full wet suit and reef gloves…Morning dives provide the best weather and
visibility...It is about a 45 minute ride to the wreck site, the Chicago skyline a constant companion… We
arrive at the buoy and spot the wreck on our depth sounder, the wreck's hull creating a huge peak on the
screen. We drop anchor and drag it until it is secure in the wreckage, probably one of the holds...Visibility
today is just five feet. As we thought, the anchor dropped in one of the holds, and is nearly in the center of
the wreck. Alex signals towards the stern, and we head that way...
To our left is the curved side of the barge. For one used to seeing railings on a ship, their absence is
striking. On the right we pass the ship's holds, gaping open, the hatches long since removed. Soon we are
over the area where the A-Frame was attached and pass the hopper remains. In a few moments we arrive
at the stern of the ship. The damage caused by the dynamiting is all over. Exposed pipes, fractured metal
and buckled plates abound. We explore this section, taking some shots through porthole style openings in
the ship's side and top, then drop over the stern. Wreckage is scattered on the bottom, the remains of the
aft deck and crews quarters. Surprisingly the propellers are still in place, albeit half buried in the silty
bottom. After a few minutes examining this area, Alex and I head towards the bow, this time along the
port side, following the convergence of the lake bottom and the ship's hull…To our left, front and back
visibility fades to light green/brown, to the right passes the Algae covered, rusting hull. Nothing moves
except our buddy team, the only sound our regulators and exhaust. We pass over more debris, and an
occasional aluminum can. The front appears abruptly, with little contour. Perhaps a foot from the bottom,
attached to the ship's nose is a large towing shackle. After a couple of more photographs here we ascend
to the decks and begin our exploration of the holds. The hatch covers are long since gone, and the holds
make an eerie dive. The openings are about the size of a garage door, so are easy to enter. Their bottoms
are shaped like four connected v's (vvvv), to guide the cargo to the hidden tunnels.
To support the decking, I beams run down the center, between the second and third "v". They are
spaced every few feet, far enough apart so a diver can pass between them. I have shot some fantastic
video here, as well as unusual photographs. Little of the cargo remains, and this area is very silty…Some
of the most interesting sites are what appears to be parallel railroad tracks running along the center of the
ship, steel rollers between them. These are the remains of the conveyor assembly. What appears to be a
Section 1: Vessel Background Information: Remediation of Underwater Legacy Environmental Threats (RULET)
7
cart at the track's terminus is actually the hopper. There are also some inviting openings with ladders
descending below decks scattered around the ship.
These can be entered with tanks removed, but only EXPERIENCED wreck divers skilled in
penetration techniques should enter. Take care diving this wreck in the early summer, as Smelt anchors
and fishing line abound…." -http://www.materialservicebarge.com/
Archaeological Assessment
The archaeological assessment provides additional primary source based documentation about the sinking
of vessels. It also provides condition-based archaeological assessment of the wrecks when possible. It
does not provide a risk-based score or definitively assess the pollution risk or lack thereof from these
vessels, but includes additional information that could not be condensed into database form.
Where the current condition of a shipwreck is not known, data from other archaeological studies of
similar types of shipwrecks provide the means for brief explanations of what the shipwreck might look
like and specifically, whether it is thought there is sufficient structural integrity to retain oil. This is more
subjective than the Pollution Potential Tree and computer-generated resource at risk models, and as such
provides an additional viewpoint to examine risk assessments and assess the threat posed by these
shipwrecks. It also addresses questions of historical significance and the relevant historic preservation
laws and regulations that will govern on-site assessments
In some cases where little additional historic information has been uncovered about the loss of a vessel,
archaeological assessments cannot be made with any degree of certainty and were not prepared. For
vessels with full archaeological assessments, NOAA archaeologists and contracted archivists have taken
photographs of primary source documents from the National Archives that can be made available for
future research or on-site activities.
Assessment
Because Material Service sank in 1936, records relating to the loss of the vessel were not part of the
National Archives record groups examined by NOAA archaeologists, so we cannot provide much
additional historic background or assessment other than what was included under the Casualty Narrative
section in this package. This means that the best assessment and report on the sinking of the ship may be
from a U.S. Coast Guard’s Marine Board of Investigation Report written about this vessel if one exists or
from additional reports readily accessible online.
Although it is not know if any diesel oil remains inside this ship, the stern of the wreck which contained
the crews quarters and the engine room was blasted open with dynamite in the 1970s, likely destroying
the vessel’s fuel tanks and releasing any diesel that may have remained in the tanks. The wreck also rests
upright on the bottom, which is an orientation that often leads to loss of oil from vents and piping long
before loss of structural integrity of hull plates from corrosion or other physical impacts. Because NOAA
archaeologists have never visited the site, it is not possible to guarantee the condition of the fuel tanks and
additional condition based analysis cannot be made.
If the U.S. Coast Guard decides to assess this vessel, it should be noted that this vessel is of historic
significance and will require appropriate actions be taken under the National Historic Preservation Act
Section 1: Vessel Background Information: Remediation of Underwater Legacy Environmental Threats (RULET)
8
(NHPA) prior to any actions that could impact the integrity of the vessel. This vessel may be eligible for
listing on the National Register of Historic Places and archaeologists with the State of Illinois should be
consulted to ensure compliance with archaeological standards for assessing a historic resource. The site is
also considered a gravesite and appropriate actions should be undertaken to minimize disturbance to the
site.
Background Information References
Vessel Image Sources: http://www.windycitydiving.net/dive-videos/wrecks
Construction Diagrams or Plans in RULET Database? No
Text References:
-http://www.materialservicebarge.com/
-http://greatlakeshistory.homestead.com/files/m.htm
-http://www.scubachicago.com/msb.html
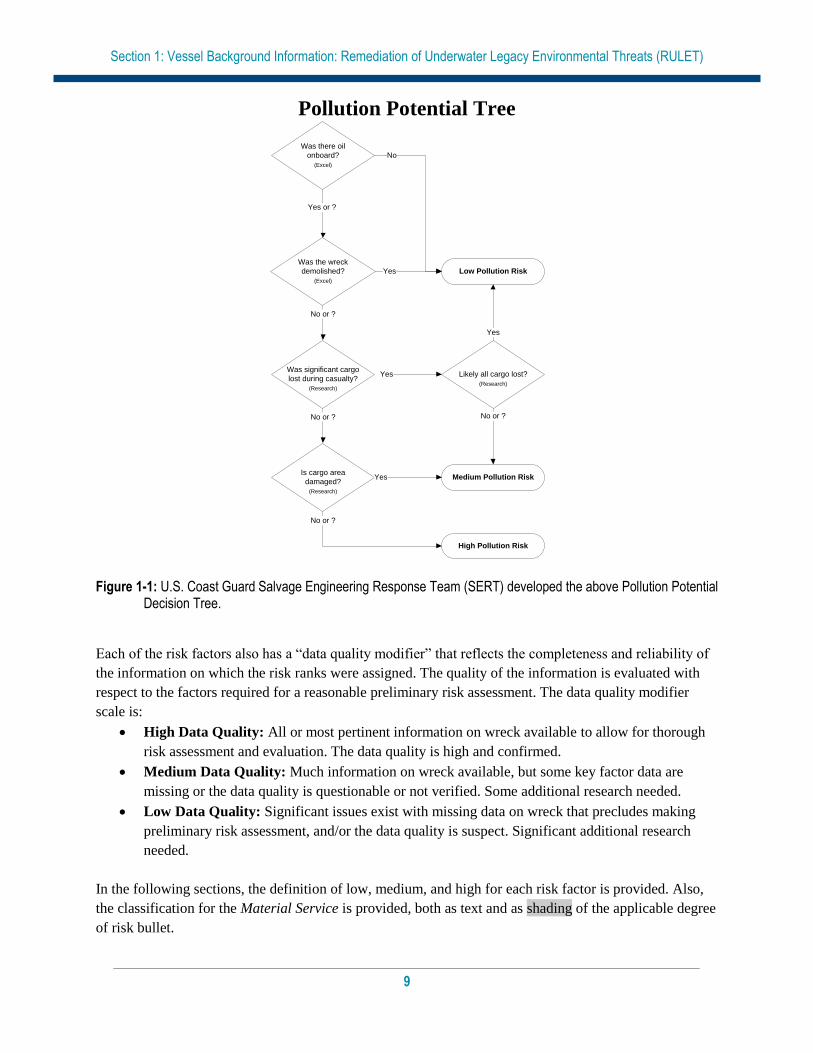
Vessel Risk Factors
In this section, the risk factors that are associated with the vessel are defined and then applied to the
Material Service based on the information available. These factors are reflected in the pollution potential
risk assessment development by the U.S. Coast Guard Salvage Engineering Response Team (SERT) as a
means to apply a salvage engineer’s perspective to the historical information gathered by NOAA. This
analysis reflected in Figure 1-1 is simple and straightforward and, in combination with the accompanying
archaeological assessment, provides a picture of the wreck that is as complete as possible based on
current knowledge and best professional judgment. This assessment does not take into consideration
operational constraints such as depth or unknown location, but rather attempts to provide a replicable and
objective screening of the historical date for each vessel. SERT reviewed the general historical
information available for the database as a whole and provided a stepwise analysis for an initial indication
of Low/Medium/High values for each vessel.
In some instances, nuances from the archaeological assessment may provide additional input that will
amend the score for Section 1. Where available, additional information that may have bearing on
operational considerations for any assessment or remediation activities is provided.
Each risk factor is characterized as High, Medium, or Low Risk or a category-appropriate equivalent such
as No, Unknown, Yes, or Yes Partially. The risk categories correlate to the decision points reflected in
Figure 1-1.
Section 1: Vessel Background Information: Remediation of Underwater Legacy Environmental Threats (RULET)
9
Pollution Potential Tree
Figure 1-1: U.S. Coast Guard Salvage Engineering Response Team (SERT) developed the above Pollution Potential Decision Tree.
Each of the risk factors also has a “data quality modifier” that reflects the completeness and reliability of
the information on which the risk ranks were assigned. The quality of the information is evaluated with
respect to the factors required for a reasonable preliminary risk assessment. The data quality modifier
scale is:
High Data Quality: All or most pertinent information on wreck available to allow for thorough
risk assessment and evaluation. The data quality is high and confirmed.
Medium Data Quality: Much information on wreck available, but some key factor data are
missing or the data quality is questionable or not verified. Some additional research needed.
Low Data Quality: Significant issues exist with missing data on wreck that precludes making
preliminary risk assessment, and/or the data quality is suspect. Significant additional research
needed.
In the following sections, the definition of low, medium, and high for each risk factor is provided. Also,
the classification for the Material Service is provided, both as text and as shading of the applicable degree
of risk bullet.
Was there oil
onboard?
(Excel)
Was the wreck
demolished?
(Excel)
Yes or ?
Low Pollution Risk
No
Yes
Medium Pollution Risk
High Pollution Risk
No or ?
Was significant cargo
lost during casualty?
(Research)
Yes
Is cargo area
damaged?
(Research)
No or ?
No or ?
Yes
Likely all cargo lost?
(Research)
No or ?
Yes
Section 1: Vessel Background Information: Remediation of Underwater Legacy Environmental Threats (RULET)
10
Pollution Potential Factors Risk Factor A1: Total Oil Volume The oil volume classifications correspond to the U.S. Coast Guard spill classifications:
Low Volume: Minor Spill <240 bbl (10,000 gallons)
Medium Volume: Medium Spill ≥240 – 2,400 bbl (100,000 gallons)
High Volume: Major Spill ≥2,400 bbl (≥100,000 gallons)
The oil volume risk classifications refer to the volume of the most-likely Worst Case Discharge from the
vessel and are based on the amount of oil believed or confirmed to be on the vessel.
The Material Service is ranked as High Volume because it is thought to have a potential for up to 3,000
bbl, based on what is probably a very conservative estimate for how much fuel oil the vessel could carry,
although some of that may have been lost at the time of the casualty or after the vessel sank. Data quality
is low because an exact bunker capacity for Material Service is not known.
The risk factor for volume also incorporates any reports or anecdotal evidence of actual leakage from the
vessel or reports from divers of oil in the overheads, as opposed to potential leakage. This reflects the
history of the vessel’s leakage. There are no reports of leakage from the Material Service.
Risk Factor A2: Oil Type The oil type(s) on board the wreck are classified only with regard to persistence, using the U.S. Coast
Guard oil grouping1. (Toxicity is dealt with in the impact risk for the Resources at Risk classifications.)
The three oil classifications are:
Low Risk: Group I Oils – non-persistent oil (e.g., gasoline)
Medium Risk: Group II – III Oils – medium persistent oil (e.g., diesel, No. 2 fuel, light crude,
medium crude)
High Risk: Group IV – high persistent oil (e.g., heavy crude oil, No. 6 fuel oil, Bunker C)
The Material Service is classified as Medium Risk because the bunker oil is diesel oil, a Group II oil type.
Data quality is high.
Was the wreck demolished?
Risk Factor B: Wreck Clearance This risk factor addresses whether or not the vessel was historically reported to have been demolished as a
hazard to navigation or by other means such as depth charges or aerial bombs. This risk factor is based on
historic records and does not take into account what a wreck site currently looks like. The risk categories
are defined as:
Low Risk: The wreck was reported to have been entirely destroyed after the casualty
1 Group I Oil or Nonpersistent oil is defined as “a petroleum-based oil that, at the time of shipment, consists of hydrocarbon fractions: At least 50% of which, by volume, distill at a temperature of 340°C (645°F); and at least 95% of which, by volume, distill at a temperature of 370°C (700°F).” Group II - Specific gravity less than 0.85 crude [API° >35.0] Group III - Specific gravity between 0.85 and less than .95 [API° ≤35.0 and >17.5] Group IV - Specific gravity between 0.95 to and including 1.0 [API° ≤17.5 and >10.0]
Section 1: Vessel Background Information: Remediation of Underwater Legacy Environmental Threats (RULET)
11
Medium Risk: The wreck was reported to have been partially cleared or demolished after the
casualty
High Risk: The wreck was not reported to have been cleared or demolished after the casualty
Unknown: It is not known whether or not the wreck was cleared or demolished at the time of or
after the casualty
The Material Service is classified as Medium Risk because the stern was blasted with dynamite in the
1970s. Data quality is high.
Was significant cargo or bunker lost during casualty? Risk Factor C1: Burning of the Ship This risk factor addresses any burning that is known to have occurred at the time of the vessel casualty
and may have resulted in oil products being consumed or breaks in the hull or tanks that would have
increased the potential for oil to escape from the shipwreck. The risk categories are:
Low Risk: Burned for multiple days
Medium Risk: Burned for several hours
High Risk: No burning reported at the time of the vessel casualty
Unknown: It is not known whether or not the vessel burned at the time of the casualty
The Material Service is classified as High Risk because there was no report of fire at the time of casualty.
Data quality is high.
Risk Factor C2: Reported Oil on the Water This risk factor addresses reports of oil on the water at the time of the vessel casualty. The amount is
relative and based on the number of available reports of the casualty. Seldom are the reports from trained
observers so this is very subjective information. The risk categories are defined as:
Low Risk: Large amounts of oil reported on the water by multiple sources
Medium Risk: Moderate to little oil reported on the water during or after the sinking event
High Risk: No oil reported on the water
Unknown: It is not known whether or not there was oil on the water at the time of the casualty
The Material Service is classified as High Risk because no oil was reported to have spread across the
water as the vessel went down. Data quality is low because the vessel sank at night and oil may have gone
unnoticed.
Is the cargo area damaged? Risk Factor D1: Nature of the Casualty This risk factor addresses the means by which the vessel sank. The risk associated with each type of
casualty is determined by the how violent the sinking event was and the factors that would contribute to
increased initial damage or destruction of the vessel (which would lower the risk of oil, other cargo, or
munitions remaining on board). The risk categories are:
Low Risk: Multiple torpedo detonations, multiple mines, severe explosion
Section 1: Vessel Background Information: Remediation of Underwater Legacy Environmental Threats (RULET)
12
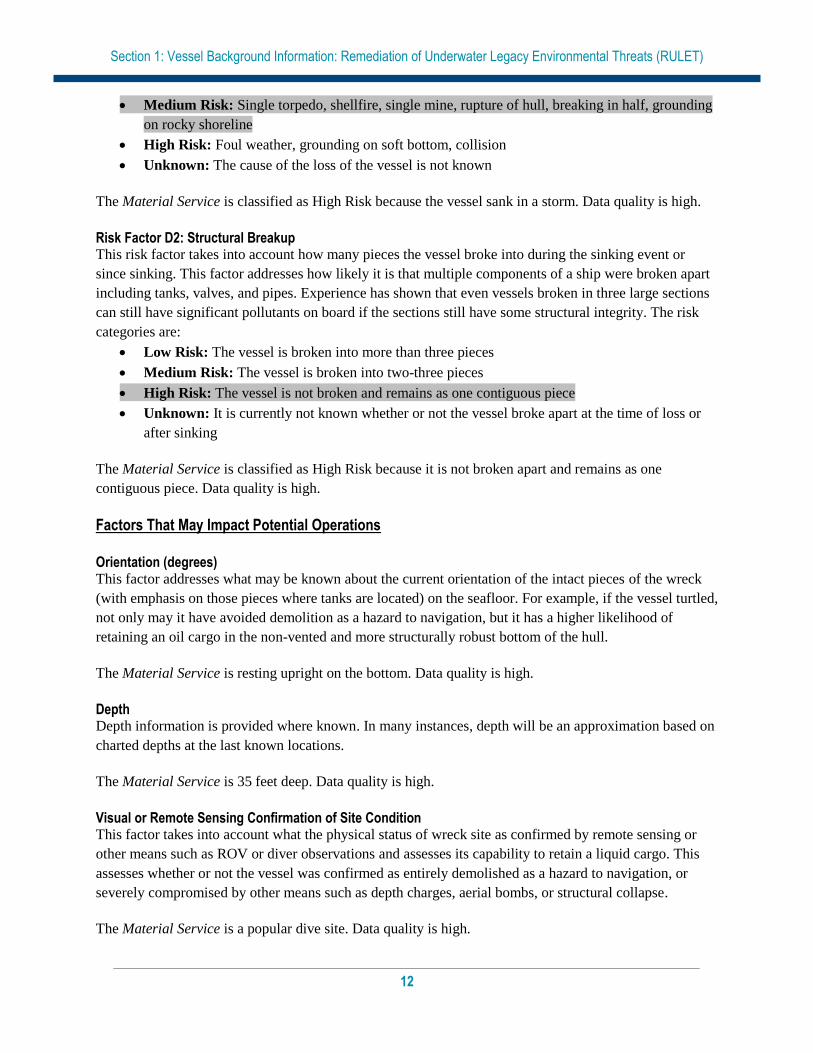
Medium Risk: Single torpedo, shellfire, single mine, rupture of hull, breaking in half, grounding
on rocky shoreline
High Risk: Foul weather, grounding on soft bottom, collision
Unknown: The cause of the loss of the vessel is not known
The Material Service is classified as High Risk because the vessel sank in a storm. Data quality is high.
Risk Factor D2: Structural Breakup This risk factor takes into account how many pieces the vessel broke into during the sinking event or
since sinking. This factor addresses how likely it is that multiple components of a ship were broken apart
including tanks, valves, and pipes. Experience has shown that even vessels broken in three large sections
can still have significant pollutants on board if the sections still have some structural integrity. The risk
categories are:
Low Risk: The vessel is broken into more than three pieces
Medium Risk: The vessel is broken into two-three pieces
High Risk: The vessel is not broken and remains as one contiguous piece
Unknown: It is currently not known whether or not the vessel broke apart at the time of loss or
after sinking
The Material Service is classified as High Risk because it is not broken apart and remains as one
contiguous piece. Data quality is high.
Factors That May Impact Potential Operations
Orientation (degrees) This factor addresses what may be known about the current orientation of the intact pieces of the wreck
(with emphasis on those pieces where tanks are located) on the seafloor. For example, if the vessel turtled,
not only may it have avoided demolition as a hazard to navigation, but it has a higher likelihood of
retaining an oil cargo in the non-vented and more structurally robust bottom of the hull.
The Material Service is resting upright on the bottom. Data quality is high.
Depth Depth information is provided where known. In many instances, depth will be an approximation based on
charted depths at the last known locations.
The Material Service is 35 feet deep. Data quality is high.
Visual or Remote Sensing Confirmation of Site Condition This factor takes into account what the physical status of wreck site as confirmed by remote sensing or
other means such as ROV or diver observations and assesses its capability to retain a liquid cargo. This
assesses whether or not the vessel was confirmed as entirely demolished as a hazard to navigation, or
severely compromised by other means such as depth charges, aerial bombs, or structural collapse.
The Material Service is a popular dive site. Data quality is high.
Section 1: Vessel Background Information: Remediation of Underwater Legacy Environmental Threats (RULET)
13
Other Hazardous (Non-Oil) Cargo on Board This factor addresses hazardous cargo other than oil that may be on board the vessel and could potentially
be released, causing impacts to ecological and socio-economic resources at risk.
There are no reports of hazardous materials onboard. Data quality is high.
Munitions on Board This factor addresses hazardous cargo other than oil that may be on board the vessel and could potentially
be released or detonated causing impacts to ecological and socio-economic resources at risk.
The Material Service did not carry any munitions. Data quality is high.
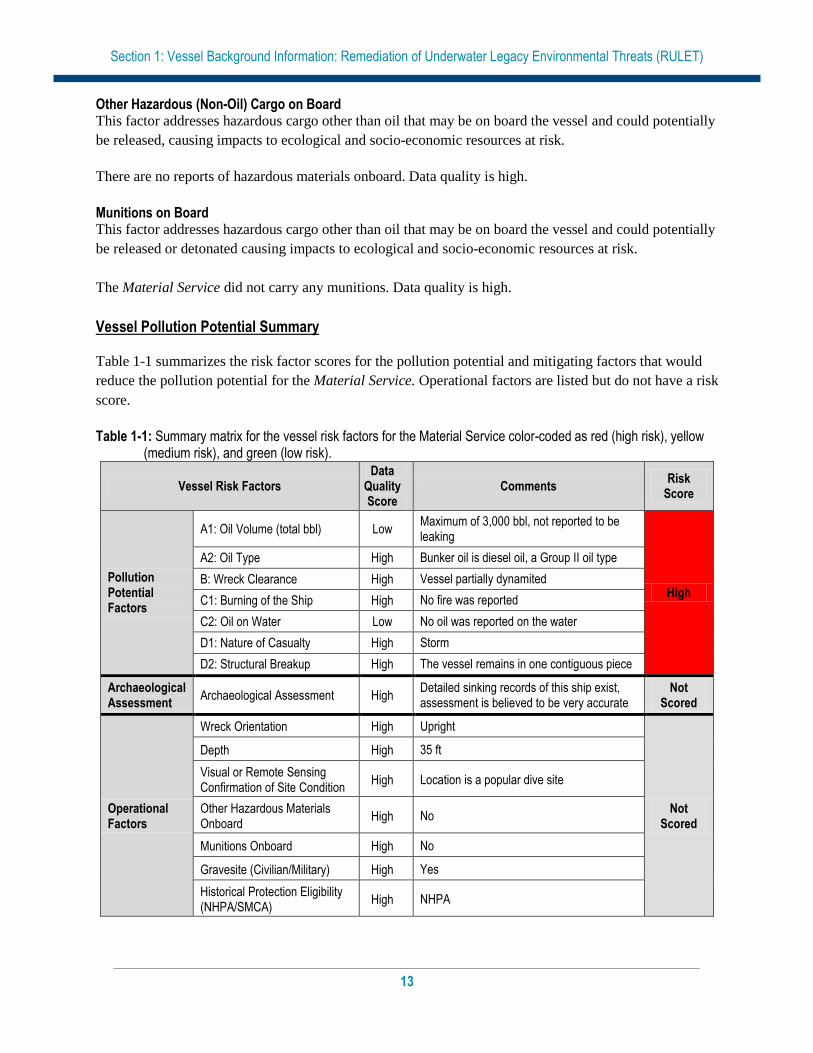
Vessel Pollution Potential Summary
Table 1-1 summarizes the risk factor scores for the pollution potential and mitigating factors that would
reduce the pollution potential for the Material Service. Operational factors are listed but do not have a risk
score.
Table 1-1: Summary matrix for the vessel risk factors for the Material Service color-coded as red (high risk), yellow (medium risk), and green (low risk).
Vessel Risk Factors Data
Quality Score
Comments Risk
Score
Pollution Potential Factors
A1: Oil Volume (total bbl) Low Maximum of 3,000 bbl, not reported to be leaking
High
A2: Oil Type High Bunker oil is diesel oil, a Group II oil type
B: Wreck Clearance High Vessel partially dynamited
C1: Burning of the Ship High No fire was reported
C2: Oil on Water Low No oil was reported on the water
D1: Nature of Casualty High Storm
D2: Structural Breakup High The vessel remains in one contiguous piece
Archaeological Assessment
Archaeological Assessment High Detailed sinking records of this ship exist, assessment is believed to be very accurate
Not Scored
Operational Factors
Wreck Orientation High Upright
Not Scored
Depth High 35 ft
Visual or Remote Sensing Confirmation of Site Condition
High Location is a popular dive site
Other Hazardous Materials Onboard
High No
Munitions Onboard High No
Gravesite (Civilian/Military) High Yes
Historical Protection Eligibility (NHPA/SMCA)
High NHPA
Section 2: Environmental Impact Modeling
14
SECTION 2: ENVIRONMENTAL IMPACT MODELING
To help evaluate the potential transport and fates of releases from sunken wrecks, NOAA worked with
RPS ASA to run a series of generalized computer model simulations of potential oil releases. The results
are used to assess potential impacts to ecological and socio-economic resources, as described in Sections
3 and 4. The modeling results are useful for this screening-level risk assessment; however, it should be
noted that detailed site/vessel/and seasonally specific modeling would need to be conducted prior to any
intervention on a specific wreck.
Release Scenarios Used in the Modeling
The potential volume of leakage at any point in time will tend to follow a probability distribution. Most
discharges are likely to be relatively small, though there could be multiple such discharges. There is a
lower probability of larger discharges, though these scenarios would cause the greatest damage. A Worst
Case Discharge (WCD) would involve the release of all of the cargo oil and bunkers present on the
vessel. In the case of the Material Service this would be about 3,000 bbl of marine diesel fuel based on
current estimates of the maximum amount of oil remaining onboard the wreck.
The likeliest scenario of oil release from most sunken wrecks, including the Material Service, is a small,
episodic release that may be precipitated by disturbance of the vessel in storms. Each of these episodic
releases may cause impacts and require a response. Episodic releases are modeled using 1% of the WCD.
Another scenario is a very low chronic release, i.e., a relatively regular release of small amounts of oil
that causes continuous oiling and impacts over the course of a long period of time. This type of release
would likely be precipitated by corrosion of piping that allows oil to flow or bubble out at a slow, steady
rate. Chronic releases are modeled using 0.1% of the WCD.
The Most Probable scenario is premised on the release of all the oil from one tank. In the absence of
information on the number and condition of the cargo or fuel tanks for all the wrecks being assessed, this
scenario is modeled using 10% of the WCD. The Large scenario is loss of 50% of the WCD. The five
major types of releases are summarized in Table 2-1. The actual type of release that occurs will depend on
the condition of the vessel, time factors, and disturbances to the wreck. Note that episodic and chronic
release scenarios represent a small release that is repeated many times, potentially repeating the same
magnitude and type of impact(s) with each release. The actual impacts would depend on the
environmental factors such as real-time and forecast winds and currents during each release and the
types/quantities of ecological and socio-economic resources present.
The model results here are based on running the RPS ASA Spill Impact Model Application Package
(SIMAP) two hundred times for each of the five spill volumes shown in Table 2-1. The model randomly
selects the date of the release, and corresponding environmental, wind, and ocean current information
from a long-term wind and current database.
When a spill occurs, the trajectory, fate, and effects of the oil will depend on environmental variables,
such as the wind and current directions over the course of the oil release, as well as seasonal effects. The
Section 2: Environmental Impact Modeling
15
magnitude and nature of potential impacts to resources will also generally have a strong seasonal
component (e.g., timing of bird migrations, turtle nesting periods, fishing seasons, and tourism seasons).
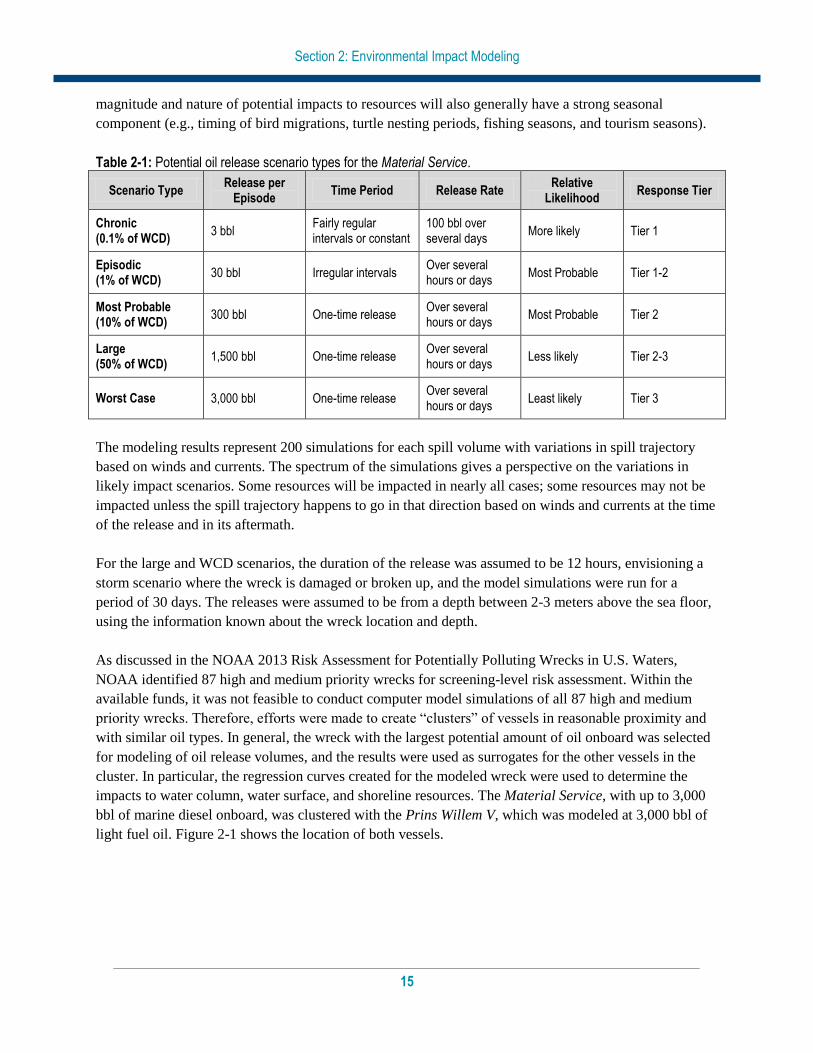
Table 2-1: Potential oil release scenario types for the Material Service.
Scenario Type Release per
Episode Time Period Release Rate
Relative Likelihood
Response Tier
Chronic (0.1% of WCD)
3 bbl Fairly regular intervals or constant
100 bbl over several days
More likely Tier 1
Episodic (1% of WCD)
30 bbl Irregular intervals Over several hours or days
Most Probable Tier 1-2
Most Probable (10% of WCD)
300 bbl One-time release Over several hours or days
Most Probable Tier 2
Large (50% of WCD)
1,500 bbl One-time release Over several hours or days
Less likely Tier 2-3
Worst Case 3,000 bbl One-time release Over several hours or days
Least likely Tier 3
The modeling results represent 200 simulations for each spill volume with variations in spill trajectory
based on winds and currents. The spectrum of the simulations gives a perspective on the variations in
likely impact scenarios. Some resources will be impacted in nearly all cases; some resources may not be
impacted unless the spill trajectory happens to go in that direction based on winds and currents at the time
of the release and in its aftermath.
For the large and WCD scenarios, the duration of the release was assumed to be 12 hours, envisioning a
storm scenario where the wreck is damaged or broken up, and the model simulations were run for a
period of 30 days. The releases were assumed to be from a depth between 2-3 meters above the sea floor,
using the information known about the wreck location and depth.
As discussed in the NOAA 2013 Risk Assessment for Potentially Polluting Wrecks in U.S. Waters,
NOAA identified 87 high and medium priority wrecks for screening-level risk assessment. Within the
available funds, it was not feasible to conduct computer model simulations of all 87 high and medium
priority wrecks. Therefore, efforts were made to create “clusters” of vessels in reasonable proximity and
with similar oil types. In general, the wreck with the largest potential amount of oil onboard was selected
for modeling of oil release volumes, and the results were used as surrogates for the other vessels in the
cluster. In particular, the regression curves created for the modeled wreck were used to determine the
impacts to water column, water surface, and shoreline resources. The Material Service, with up to 3,000
bbl of marine diesel onboard, was clustered with the Prins Willem V, which was modeled at 3,000 bbl of
light fuel oil. Figure 2-1 shows the location of both vessels.
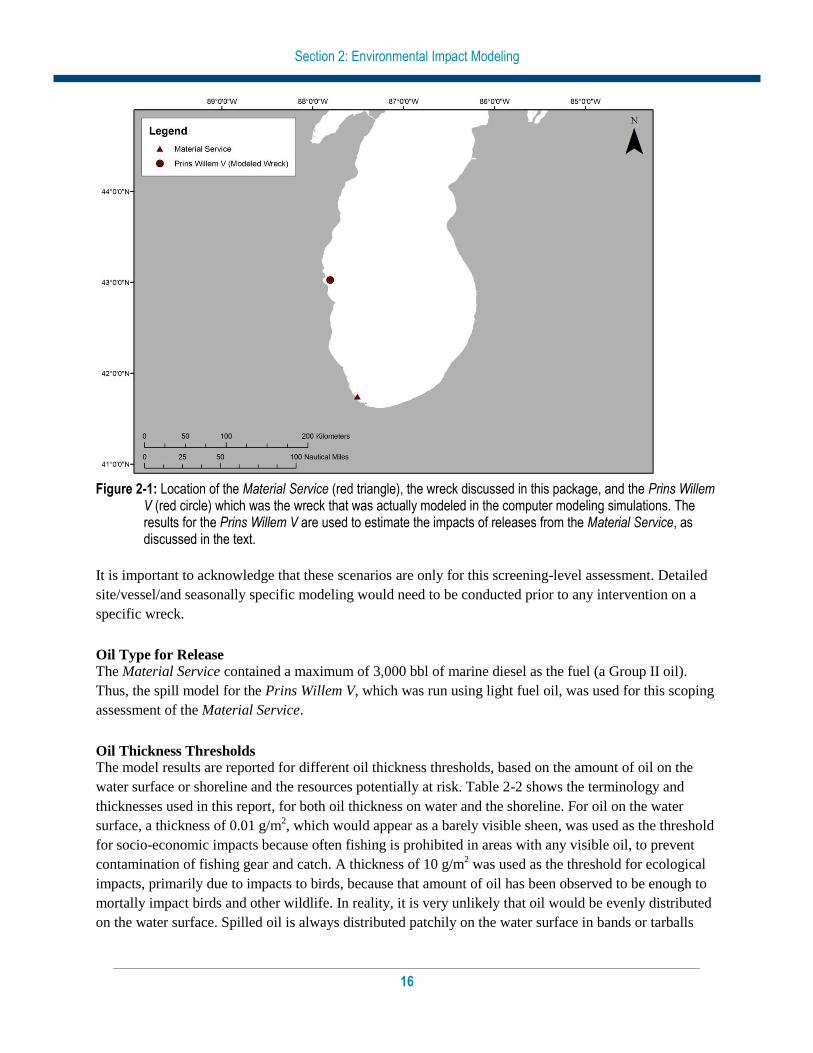
Section 2: Environmental Impact Modeling
16
Figure 2-1: Location of the Material Service (red triangle), the wreck discussed in this package, and the Prins Willem
V (red circle) which was the wreck that was actually modeled in the computer modeling simulations. The results for the Prins Willem V are used to estimate the impacts of releases from the Material Service, as discussed in the text.
It is important to acknowledge that these scenarios are only for this screening-level assessment. Detailed
site/vessel/and seasonally specific modeling would need to be conducted prior to any intervention on a
specific wreck.
Oil Type for Release
The Material Service contained a maximum of 3,000 bbl of marine diesel as the fuel (a Group II oil).
Thus, the spill model for the Prins Willem V, which was run using light fuel oil, was used for this scoping
assessment of the Material Service.
Oil Thickness Thresholds
The model results are reported for different oil thickness thresholds, based on the amount of oil on the
water surface or shoreline and the resources potentially at risk. Table 2-2 shows the terminology and
thicknesses used in this report, for both oil thickness on water and the shoreline. For oil on the water
surface, a thickness of 0.01 g/m2, which would appear as a barely visible sheen, was used as the threshold
for socio-economic impacts because often fishing is prohibited in areas with any visible oil, to prevent
contamination of fishing gear and catch. A thickness of 10 g/m2 was used as the threshold for ecological
impacts, primarily due to impacts to birds, because that amount of oil has been observed to be enough to
mortally impact birds and other wildlife. In reality, it is very unlikely that oil would be evenly distributed
on the water surface. Spilled oil is always distributed patchily on the water surface in bands or tarballs
Section 2: Environmental Impact Modeling
17
with clean water in between. So, Table 2-2a shows the number of tarballs per acre on the water surface
for these oil thickness thresholds, assuming that each tarball was a sphere that was 1 inch in diameter.
For oil stranded onshore, a thickness of 1 g/m2 was used as the threshold for socio-economic impacts
because that amount of oil would conservatively trigger the need for shoreline cleanup on amenity
beaches. A thickness of 100 g/m2 was used as the threshold for ecological impacts based on a synthesis of
the literature showing that shoreline life has been affected by this degree of oiling.2 Because oil often
strands onshore as tarballs, Table 2-2a shows the number of tarballs per m2 on the shoreline for these oil
thickness thresholds, assuming that each tarball was a sphere that was 1 inch in diameter.
Table 2-2a: Oil thickness thresholds used in calculating area of water impacted. Refer to Sections 3 and 4 for explanations of the thresholds for ecological and socio-economic resource impacts.
Oil Description Sheen
Appearance Approximate Sheen
Thickness No. of 1 inch
Tarballs Threshold/Risk Factor
Oil Sheen Barely Visible 0.00001 mm 0.01 g/m2
~5-6 tarballs per acre
Socio-economic Impacts to Water Surface/Risk Factor 4B-1 and 2
Heavy Oil Sheen Dark Colors 0.01 mm 10 g/m2 ~5,000-6,000 tarballs per acre
Ecological Impacts to Water Surface/ Risk Factor 3B-1 and 2
Table 2-2b: Oil thickness thresholds used in calculating miles of shoreline impacted. Refer to Sections 3
and 4 for explanations of the thresholds for ecological and socio-economic resource impacts.
Oil Description Oil
Appearance Approximate Sheen
Thickness No. of 1 inch
Tarballs Threshold/Risk Factor
Oil Sheen/Tarballs Dull Colors 0.001 mm 1 g/m2 ~0.12-0.14 tarballs/m2
Socio-economic Impacts to Shoreline Users/Risk Factor 4C-1 and 2
Oil Slick/Tarballs Brown to Black 0.1 mm 100 g/m2 ~12-14 tarballs/m2 Ecological Impacts to Shoreline Habitats/Risk Factor 3C-1 and 2
Potential Impacts to the Water Column
Impacts to the water column from an oil release from the Material Service will be determined by the
volume of leakage. Because oil from sunken vessels will be released at low pressures, the droplet sizes
will be large enough for the oil to float to the surface. Therefore, impacts to water column resources will
result from the natural dispersion of the floating oil slicks on the surface, which is limited to about the top
33 feet. The metric used for ranking impacts to the water column is the area of water surface in mi2 that
has been contaminated by 1 part per billion (ppb) oil to a depth of 33 feet. At 1 ppb, there are likely to be
impacts to sensitive organisms in the water column and potential tainting of seafood, so this concentration
is used as a screening threshold for both the ecological and socio-economic risk factors for water column
resource impacts. To assist planners in understanding the scale of potential impacts for different leakage
volumes, a regression curve was generated for the water column volume oiled using the five volume
2 French, D., M. Reed, K. Jayko, S. Feng, H. Rines, S. Pavignano, T. Isaji, S. Puckett, A. Keller, F. W. French III, D. Gifford, J. McCue, G. Brown, E. MacDonald, J. Quirk, S. Natzke, R. Bishop, M. Welsh, M. Phillips and B.S. Ingram, 1996. The CERCLA type A natural resource damage assessment model for coastal and marine environments (NRDAM/CME), Technical Documentation, Vol. I - V, Office of Environmental Policy and Compliance, U.S. Dept. Interior, Washington, DC.
Section 2: Environmental Impact Modeling
18
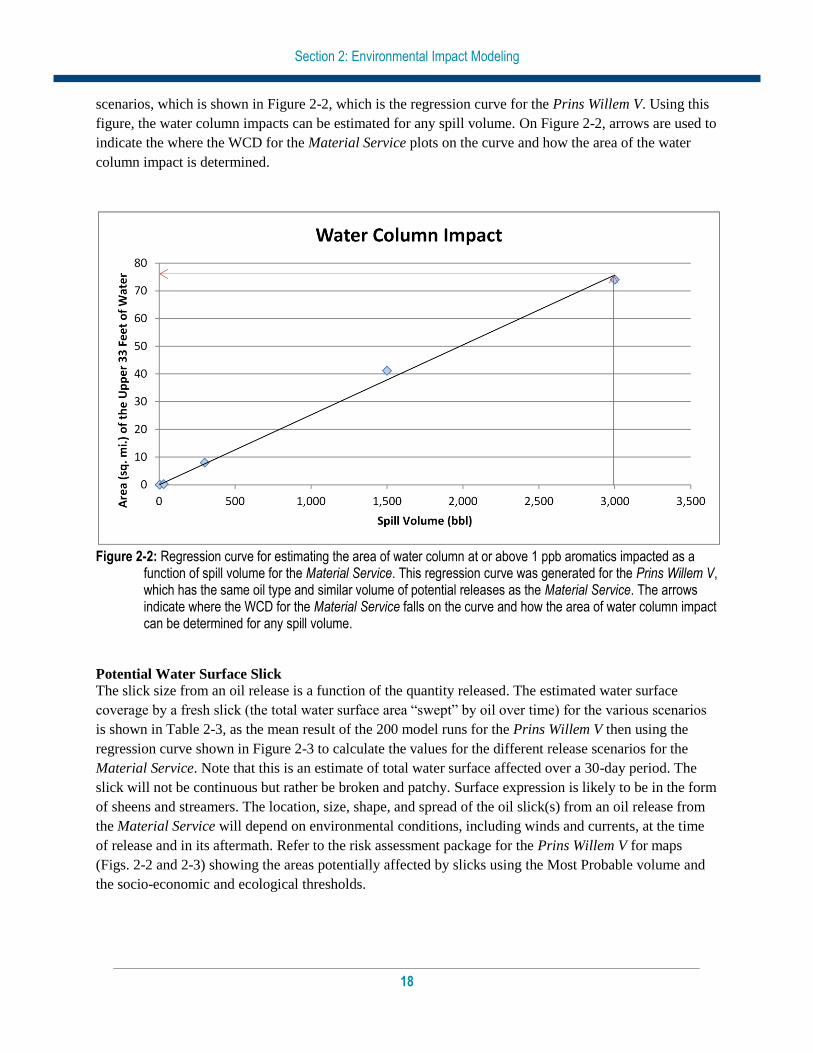
scenarios, which is shown in Figure 2-2, which is the regression curve for the Prins Willem V. Using this
figure, the water column impacts can be estimated for any spill volume. On Figure 2-2, arrows are used to
indicate the where the WCD for the Material Service plots on the curve and how the area of the water
column impact is determined.
Figure 2-2: Regression curve for estimating the area of water column at or above 1 ppb aromatics impacted as a
function of spill volume for the Material Service. This regression curve was generated for the Prins Willem V, which has the same oil type and similar volume of potential releases as the Material Service. The arrows indicate where the WCD for the Material Service falls on the curve and how the area of water column impact can be determined for any spill volume.
Potential Water Surface Slick
The slick size from an oil release is a function of the quantity released. The estimated water surface
coverage by a fresh slick (the total water surface area “swept” by oil over time) for the various scenarios
is shown in Table 2-3, as the mean result of the 200 model runs for the Prins Willem V then using the
regression curve shown in Figure 2-3 to calculate the values for the different release scenarios for the
Material Service. Note that this is an estimate of total water surface affected over a 30-day period. The
slick will not be continuous but rather be broken and patchy. Surface expression is likely to be in the form
of sheens and streamers. The location, size, shape, and spread of the oil slick(s) from an oil release from
the Material Service will depend on environmental conditions, including winds and currents, at the time
of release and in its aftermath. Refer to the risk assessment package for the Prins Willem V for maps
(Figs. 2-2 and 2-3) showing the areas potentially affected by slicks using the Most Probable volume and
the socio-economic and ecological thresholds.
Section 2: Environmental Impact Modeling
19
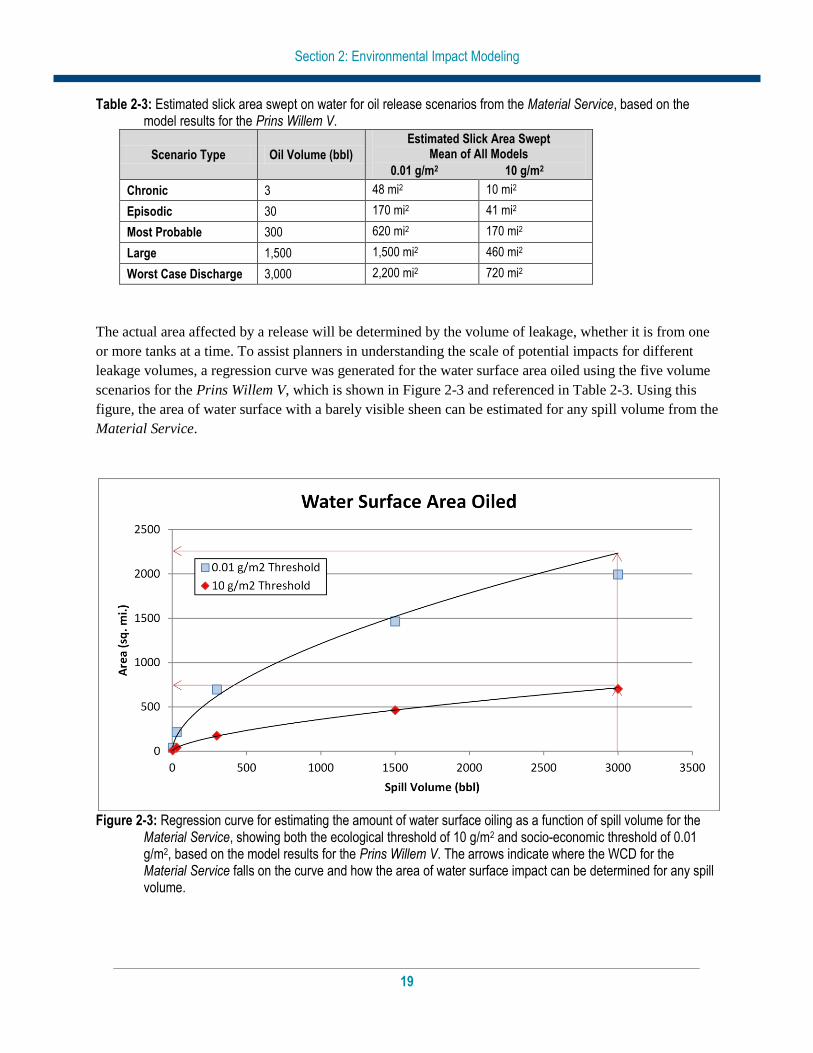
Table 2-3: Estimated slick area swept on water for oil release scenarios from the Material Service, based on the model results for the Prins Willem V.
Scenario Type Oil Volume (bbl)
Estimated Slick Area Swept Mean of All Models
0.01 g/m2 10 g/m2
Chronic 3 48 mi2 10 mi2
Episodic 30 170 mi2 41 mi2
Most Probable 300 620 mi2 170 mi2
Large 1,500 1,500 mi2 460 mi2
Worst Case Discharge 3,000 2,200 mi2 720 mi2
The actual area affected by a release will be determined by the volume of leakage, whether it is from one
or more tanks at a time. To assist planners in understanding the scale of potential impacts for different
leakage volumes, a regression curve was generated for the water surface area oiled using the five volume
scenarios for the Prins Willem V, which is shown in Figure 2-3 and referenced in Table 2-3. Using this
figure, the area of water surface with a barely visible sheen can be estimated for any spill volume from the
Material Service.
Figure 2-3: Regression curve for estimating the amount of water surface oiling as a function of spill volume for the
Material Service, showing both the ecological threshold of 10 g/m2 and socio-economic threshold of 0.01 g/m2, based on the model results for the Prins Willem V. The arrows indicate where the WCD for the Material Service falls on the curve and how the area of water surface impact can be determined for any spill volume.
Section 2: Environmental Impact Modeling
20
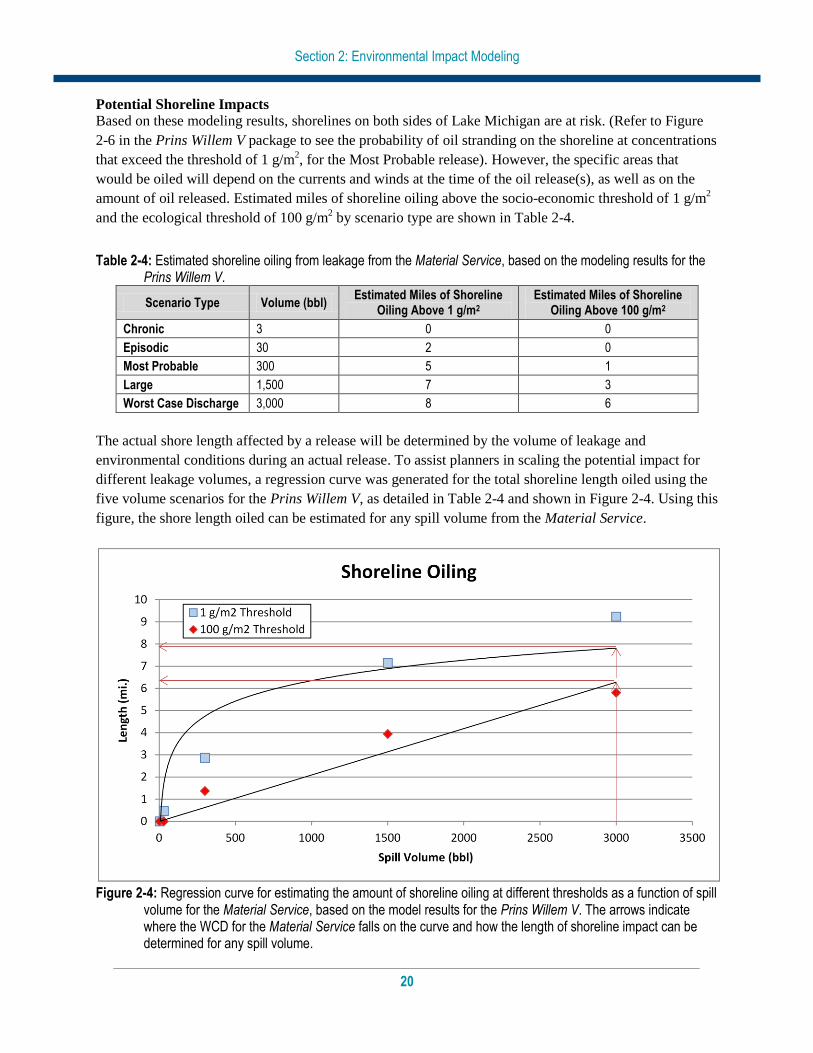
Potential Shoreline Impacts
Based on these modeling results, shorelines on both sides of Lake Michigan are at risk. (Refer to Figure
2-6 in the Prins Willem V package to see the probability of oil stranding on the shoreline at concentrations
that exceed the threshold of 1 g/m2, for the Most Probable release). However, the specific areas that
would be oiled will depend on the currents and winds at the time of the oil release(s), as well as on the
amount of oil released. Estimated miles of shoreline oiling above the socio-economic threshold of 1 g/m2
and the ecological threshold of 100 g/m2 by scenario type are shown in Table 2-4.
Table 2-4: Estimated shoreline oiling from leakage from the Material Service, based on the modeling results for the Prins Willem V.
Scenario Type Volume (bbl) Estimated Miles of Shoreline
Oiling Above 1 g/m2 Estimated Miles of Shoreline
Oiling Above 100 g/m2
Chronic 3 0 0
Episodic 30 2 0
Most Probable 300 5 1
Large 1,500 7 3
Worst Case Discharge 3,000 8 6
The actual shore length affected by a release will be determined by the volume of leakage and
environmental conditions during an actual release. To assist planners in scaling the potential impact for
different leakage volumes, a regression curve was generated for the total shoreline length oiled using the
five volume scenarios for the Prins Willem V, as detailed in Table 2-4 and shown in Figure 2-4. Using this
figure, the shore length oiled can be estimated for any spill volume from the Material Service.
Figure 2-4: Regression curve for estimating the amount of shoreline oiling at different thresholds as a function of spill
volume for the Material Service, based on the model results for the Prins Willem V. The arrows indicate where the WCD for the Material Service falls on the curve and how the length of shoreline impact can be determined for any spill volume.
Section 3: Ecological Resources at Risk
21
SECTION 3: ECOLOGICAL RESOURCES AT RISK
Ecological resources at risk from a catastrophic release of oil from the Material Service (Table 3-1)
include numerous guilds of birds, particularly those sensitive to surface oiling while rafting or plunge
diving to feed and are present in nearshore waters. Large numbers of birds use the lakeshore as migratory
habitat and beaches are important habitat for migratory shorebirds. Several species of recreational and
commercially caught fish are present in nearshore Lake Michigan.
Table 3-1: Ecological resources at risk from a release of oil from the Material Service. (*FT = Federal threatened; FE = Federal endangered; ST = State threatened, SE = State endangered).
Species Group Species Subgroup and Geography Seasonal Presence
Diving Ducks, Waterfowl and Seabirds
Nearshore areas are important foraging locations for migratory and overwintering ring-billed and herring gulls, Caspian (SE), common (SE) and Forster’s (SE) terns, diving ducks (scaup, scoters, mergansers), common loon, horned and pied-billed grebes, and Canada geese
Important locations: Sheboygan Reef, Ozaukee Bight, Harrington Beach Lakeshore
Greater scaup, common goldeneye, bufflehead, red-breasted merganser are highly abundant; long tailed duck, white-winged scoter, black scoter, surf scoter are common
Rare gull species have been seen here on occasion (wintering glaucous, Iceland, Thayer’s, lesser black-backed, greater black-backed, ivory gulls)
Shorebirds present Apr-Oct Waterfowl/diving ducks present Aug-May
Shorebirds Critical migratory and foraging habitat for piping plover (FE) exists along shorelines in the area of impact and plovers historically nested in the region
Populations of other shorebirds can be found along the lakeshore in highest numbers in spring and fall, including sanderling, dunlin, common snipe, and spotted, least, semipalmated, pectoral sandpipers
Piping plover present spring/fall Shorebirds present spring-fall
Raptors and Passerines
Migratory raptors (bald eagle, osprey, peregrine falcon (SE), red-shouldered hawk (ST), northern goshawk) and passerines use these areas
1,000s of migrating raptors use Ozaukee Bight in fall; lower numbers in spring
Raptors present Aug -May
Mammals Raccoon, mink, river otter and beaver occur in nearshore habitats Year round
Fish Lake Michigan is home to almost 100 species of fish. The lakeshore and adjacent rivers support important recreational fisheries Coastal rivers support higher diversity of species, such as shiners, catfish, sunfish, perches, including longear sunfish (ST) and greater redhorse (ST) Coastal wetlands comprise very little of shoreline but are extremely important juvenile and forage fish habitat Many fish spawn seasonally in nearshore or upstream areas
Mouths of rivers are spawning/aggregation hotspots for rainbow trout, yellow perch, rainbow smelt, muskellunge, walleye, gizzard shad, rock bass, northern pike, carp, spottail shiner, smallmouth bass, alewife, coho salmon, lake whitefish, brook trout, lake trout, Chinook salmon, brown trout
Lake whitefish are abundant near shorelines in the fall and spawn in shallow rock or sand bottomed lake waters less than 25 feet deep
Lake trout spawn on nearshore shoals throughout the area of impact
Brook trout spawn over hard substrate along the lakeshore
Rainbow trout spawn in the mouths of rivers
Spring spawning Lake sturgeon, walleye, rainbow trout, yellow perch, rainbow smelt, muskellunge, gizzard shad, rock bass Summer spawning Spottail shiner, smallmouth bass, carp, alewife Fall spawning Lake whitefish, lake trout, coho and Chinook salmon, brown trout, lake trout
Section 3: Ecological Resources at Risk
22
The Environmental Sensitivity Index (ESI) atlases for the potentially impacted coastal areas from a leak
from the Material Service are generally available at each U.S. Coast Guard Sector. They can also be
downloaded at: http://response.restoration.noaa.gov/esi. These maps show detailed spatial information on
the distribution of sensitive shoreline habitats, biological resources, and human-use resources. The tables
on the back of the maps provide more detailed life-history information for each species and location. The
ESI atlases should be consulted to assess the potential environmental resources at risk for specific spill
scenarios. In addition, the Geographic Response Plans within the Area Contingency Plans prepared by the
Area Committee for each U.S. Coast Guard Sector have detailed information on the nearshore and
shoreline ecological resources at risk and should be consulted.
Ecological Risk Factors
Risk Factor 3: Impacts to Ecological Resources at Risk (EcoRAR)
Ecological resources include plants and animals (e.g., fish, birds, invertebrates, and mammals), as well as
the habitats in which they live. All impact factors are based on a Worst Case and the Most Probable
Discharge oil release from the wreck. Risk factors for ecological resources at risk (EcoRAR) are divided
into three categories:
Impacts to the water column and resources in the water column;
Impacts to the water surface and resources on the water surface; and
Impacts to the shoreline and resources on the shoreline.
The impacts from an oil release from the wreck would depend greatly on the direction in which the oil
slick moves, which would, in turn, depend on wind direction and currents at the time of and after the oil
release. Impacts are characterized in the risk analysis based on the likelihood of any measurable impact,
as well as the degree of impact that would be expected if there is an impact. The measure of the degree of
impact is based on the median case for which there is at least some impact. The median case is the
“middle case” – half of the cases with significant impacts have less impact than this case, and half have
more.
For each of the three ecological resources at risk categories, risk is defined as:
The probability of oiling over a certain threshold (i.e., the likelihood that there will be an impact
to ecological resources over a certain minimal amount); and
The degree of oiling (the magnitude or amount of that impact).
As a reminder, the ecological impact thresholds are: 1 ppb aromatics for water column impacts; 10 g/m2
for water surface impacts; and 100 g/m2 for shoreline impacts.
In the following sections, the definition of low, medium, and high for each ecological risk factor is
provided. Also, the classification for the Material Service is provided, both as text and as shading of the
applicable degree of risk bullet, for the WCD release of 3,000 bbl and a border around the Most Probable
Discharge of 300 bbl. Please note: The probability of oiling cannot be determined using the regression
curves; probability can only be determined from the 200 model runs. Thus, the modeling results and
Section 3: Ecological Resources at Risk
23
regression curves for the Prins Willem V are used to estimate the values used in the risk scoring for the
degree of oiling only.
Risk Factor 3A: Water Column Impacts to EcoRAR
Water column impacts occur beneath the water surface. The ecological resources at risk for water column
impacts are fish, marine mammals, and invertebrates (e.g., shellfish, and small organisms that are food for
larger organisms in the food chain). These organisms can be affected by toxic components in the oil. The
threshold for water column impact to ecological resources at risk is a dissolved aromatic hydrocarbons
concentration of 1 ppb (i.e., 1 part total dissolved aromatics per one billion parts water). Dissolved
aromatic hydrocarbons are the most toxic part of the oil. At this concentration and above, one would
expect impacts to organisms in the water column.
Risk Factor 3A-1: Water Column Probability of Oiling of EcoRAR (not scored)
This risk factor reflects the probability that at least 0.2 mi2 of the upper 33 feet of the water column would
be contaminated with a high enough concentration of oil to cause ecological impacts. The three risk
scores for water column oiling probability are:
Low Oiling Probability: Probability = <10%
Medium Oiling Probability: Probability = 10 – 50%
High Oiling Probability: Probability > 50%
Risk Factor 3A-2: Water Column Degree of Oiling of EcoRAR
The degree of oiling of the water column reflects the total volume of water that would be contaminated by
oil at a concentration high enough to cause impacts. The three categories of impact are:
Low Impact: impact on less than 0.2 mi2 of the upper 33 feet of the water column at the
threshold level
Medium Impact: impact on 0.2 to 200 mi2 of the upper 33 feet of the water column at the
threshold level
High Impact: impact on more than 200 mi2 of the upper 33 feet of the water column at the
threshold level
The Material Service is classified as Medium Risk for degree of oiling for water column ecological
resources for the WCD of 3,000 bbl because the mean volume of water contaminated in the model runs
was 76 mi2 of the upper 33 feet of the water column. For the Most Probable Discharge of 300 bbl, the
Material Service is classified as Medium Risk for degree of oiling because the mean volume of water
contaminated was 8 mi2 of the upper 33 feet of the water column.
Risk Factor 3B: Water Surface Impacts to EcoRAR
Ecological resources at risk at the water surface include surface feeding and diving sea birds, sea turtles,
and marine mammals. These organisms can be affected by the toxicity of the oil as well as from coating
with oil. The threshold for water surface oiling impact to ecological resources at risk is 10 g/m2 (10 grams
of floating oil per square meter of water surface). At this concentration and above, one would expect
impacts to birds and other animals that spend time on the water surface.
Section 3: Ecological Resources at Risk
24
Risk Factor 3B-1: Water Surface Probability of Oiling of EcoRAR (not scored)
This risk factor reflects the probability that at least 1,000 mi2 of the water surface would be affected by
enough oil to cause impacts to ecological resources. The three risk scores for oiling are:
Low Oiling Probability: Probability = <10%
Medium Oiling Probability: Probability = 10 – 50%
High Oiling Probability: Probability > 50%
Risk Factor 3B-2: Water Surface Degree of Oiling of EcoRAR
The degree of oiling of the water surface reflects the total amount of oil that would affect the water
surface in the event of a discharge from the vessel. The three categories of impact are:
Low Impact: less than 1,000 mi2 of water surface impact at the threshold level
Medium Impact: 1,000 to 10,000 mi2 of water surface impact at the threshold level
High Impact: more than 10,000 mi2 of water surface impact at the threshold level
The Material Service is classified as Low Risk for degree of oiling for water surface ecological resources
for the WCD because the mean area of water contaminated in the model runs was 720 mi2. It is also
classified as Low Risk for degree of oiling for the Most Probable Discharge because the mean area of
water contaminated was 170 mi2.
Risk Factor 3C: Shoreline Impacts to EcoRAR
The impacts to different types of shorelines vary based on their type and the organisms that live on them.
For the modeled wrecks, shorelines were weighted by their degree of sensitivity to oiling. Wetlands are
the most sensitive (weighted as “3” in the impact modeling), rocky and gravel shores are moderately
sensitive (weighted as “2”), and sand beaches (weighted as “1”) are the least sensitive to ecological
impacts of oil. In this risk analysis for the Material Service, shorelines have NOT been weighted by their
degree of sensitivity to oiling because these data are available only for modeled vessels. Therefore, the
impacts are evaluated only on the total number of shoreline miles oiled as determined from the regression
curve.
Risk Factor 3C-1: Shoreline Probability of Oiling of EcoRAR (not scored)
This risk factor reflects the probability that the shoreline would be coated by enough oil to cause impacts
to shoreline organisms. The threshold for shoreline oiling impacts to ecological resources at risk is 100
g/m2 (i.e., 100 grams of oil per square meter of shoreline). The three risk scores for oiling are:
Low Oiling Probability: Probability = <10%
Medium Oiling Probability: Probability = 10 – 50%
High Oiling Probability: Probability > 50%
Risk Factor 3C-2: Shoreline Degree of Oiling of EcoRAR
The degree of oiling of the shoreline reflects the length of shorelines oiled by at least 100 g/m2 in the
event of a discharge from the vessel. The three categories of impact are:
Low Impact: less than 10 miles of shoreline impacted at the threshold level
Medium Impact: 10 - 100 miles of shoreline impacted at the threshold level
High Impact: more than 100 miles of shoreline impacted at the threshold level
Section 3: Ecological Resources at Risk
25
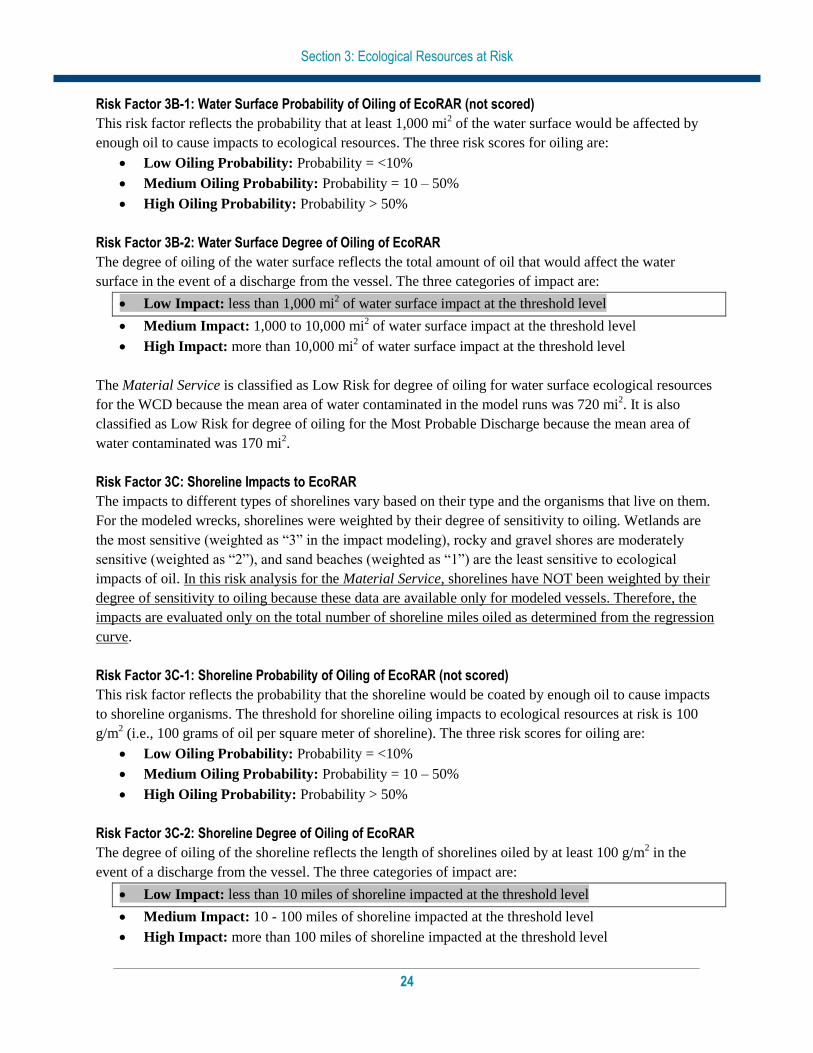
The Material Service is classified as Low Risk for degree of oiling for shoreline ecological resources for
the WCD because the mean length of shoreline contaminated in the model runs was 6 miles. It is
classified as Low Risk for degree of oiling for the Most Probable Discharge because the mean length of
shoreline contaminated in the model runs was 1 mile.
Considering the modeled risk scores and the ecological resources at risk, the ecological risk from
potential releases of the WCD of 3,000 bbl of light fuel oil from the Material Service is summarized as
listed below and indicated in the far-right column in Table 3-2:
Water column resources – Low, because of the limited potential for impacts to nearshore fish
spawning habitat
Water surface resources – Low, because of limited concentrations of migratory, wintering, and
nesting birds in the relatively small surface area affected. It should be noted that oil on the
surface will not be continuous but rather be broken and patchy and in the form of sheens and
streamers
Shoreline resources – Low, because of the lower likelihood of significant amounts of light fuel
oil to strand onshore and most of the potentially impacted shorelines are man-made structures
and sand/gravel beaches where a light fuel oil would not be as persistent as heavier oils
Table 3-2: Ecological risk factor scores for the Worst Case Discharge of 3,000 bbl of light fuel oil from the Material Service.
Risk Factor Risk Score Explanation of Risk Score Final Score
3A-1: Water Column Probability EcoRAR Oiling
Low Medium High N/A: Only available for modeled vessels
Low 3A-2: Water Column Degree EcoRAR Oiling
Low Medium High The mean volume of water contaminated above 1 ppb was 76 mi2 of the upper 33 feet of the water column
3B-1: Water Surface Probability EcoRAR Oiling
Low Medium High N/A: Only available for modeled vessels
Low 3B-2: Water Surface Degree EcoRAR Oiling
Low Medium High The mean area of water contaminated above 10 g/m2
was 720 mi2
3C-1: Shoreline Probability EcoRAR Oiling
Low Medium High N/A: Only available for modeled vessels
Low 3C-2: Shoreline Degree EcoRAR Oiling
Low Medium High The length of shoreline contaminated by at least 100
g/m2 was 6 mi
Section 3: Ecological Resources at Risk
26
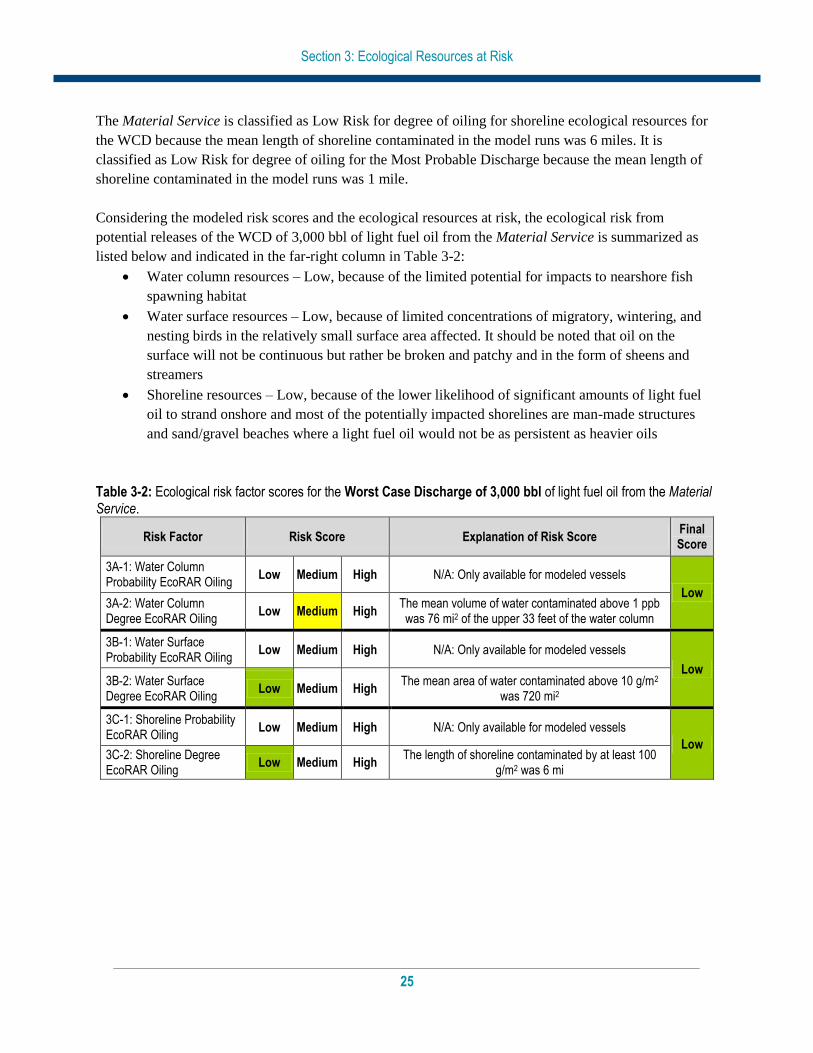
For the Most Probable Discharge of 300 bbl of light fuel oil, the ecological risk from potential releases
from the Material Service is summarized as listed below and indicated in the far-right column in Table 3-
3:
Water column resources – Low, because of the likely smaller volume of potential water column
impacts
Water surface resources – Low, because of limited concentrations of migratory, wintering, and
nesting birds in the relatively small surface area affected. It should be noted that oil on the
surface will not be continuous but rather be broken and patchy and in the form of sheens and
streamers
Shoreline resources – Low, because so few miles of shoreline are at risk
Table 3-3: Ecological risk factor scores for the Most Probable Discharge of 300 bbl of light fuel oil from the Material Service.
Risk Factor Risk Score Explanation of Risk Score Final Score
3A-1: Water Column Probability EcoRAR Oiling
Low Medium High N/A: Only available for modeled vessels
Low 3A-2: Water Column Degree EcoRAR Oiling
Low Medium High The mean volume of water contaminated above 1 ppb
was 8 mi2 of the upper 33 feet of the water column
3B-1: Water Surface Probability EcoRAR Oiling
Low Medium High N/A: Only available for modeled vessels
Low 3B-2: Water Surface Degree EcoRAR Oiling
Low Medium High The mean area of water contaminated above 10 g/m2
was 170 mi2
3C-1: Shoreline Probability EcoRAR Oiling
Low Medium High N/A: Only available for modeled vessels
Low 3C-2: Shoreline Degree EcoRAR Oiling
Low Medium High The length of shoreline contaminated by at least 100
g/m2 was 1 mi
Section 4: Socio-economic Resources at Risk
27
SECTION 4: SOCIO-ECONOMIC RESOURCES AT RISK
In addition to natural resource impacts, spills from sunken wrecks have the potential to cause significant
social and economic impacts. Socio-economic resources potentially at risk from oiling are listed in Table
4-1 and shown in Figures 4-1 and 4-2. The potential economic impacts include disruption of coastal
economic activities such as commercial and recreational fishing, boating, vacationing, commercial
shipping, and other activities that may become claims following a spill.
Socio-economic resources in the areas potentially affected by a release from the Material Service include
recreational beaches along the coasts of western Michigan and eastern Wisconsin that are very highly
utilized. Many areas along the entire potential spill zone contain popular seaside resorts and support
recreational activities such as boating, diving, sightseeing, sailing, fishing, and wildlife viewing.
A release could impact shipping lanes, which accommodate ports in Wisconsin, Indiana, and Illinois, and
into inland ports in the inland Mississippi River system. There are over 51,000 port vessel calls to the
three major ports in Lake Michigan annually. Commercial fishing is somewhat economically important to
the region. A release could impact fishing fleets where regional commercial landings for 2009 exceeded
$7.2 million.
In addition to the ESI atlases, the Geographic Response Plans within the Area Contingency Plans
prepared by the Area Committee for each U.S. Coast Guard Sector have detailed information on
important socio-economic resources at risk.
Spill response costs for a release of oil from the Material Service would be dependent on volume of oil
released and specific areas impacted. The specific shoreline impacts and spread of the oil would
determine the response required and the costs for that response.
Table 4-1: Socio-economic resources at risk from a release of oil from the Material Service.
Resource Type Resource Name Economic Activities
Shore Communities Benton Harbor, MI Chicago, IL Evanston, IL Grand Haven, MI Hagar Shores, MI Highland Park, IL Kenosha, WI Lake Bluff, IL Lake Forest, IL Ludington, MI Milwaukee, WI Muskegon, MI Norton Shores, MI Pentwater, MI Port Washington, WI Racine, WI Saugatuck, MI Sheboygan, WI South Haven, MI
Potentially affected lake-front communities in Wisconsin, Illinois, and Michigan provide recreational activities (e.g., swimming, boating, recreational fishing, wildlife viewing, nature study, sports, dining, camping, and amusement parks) with substantial income for local communities and state tax income. Many of these recreational activities are limited to or concentrated into the late spring through the early fall months.
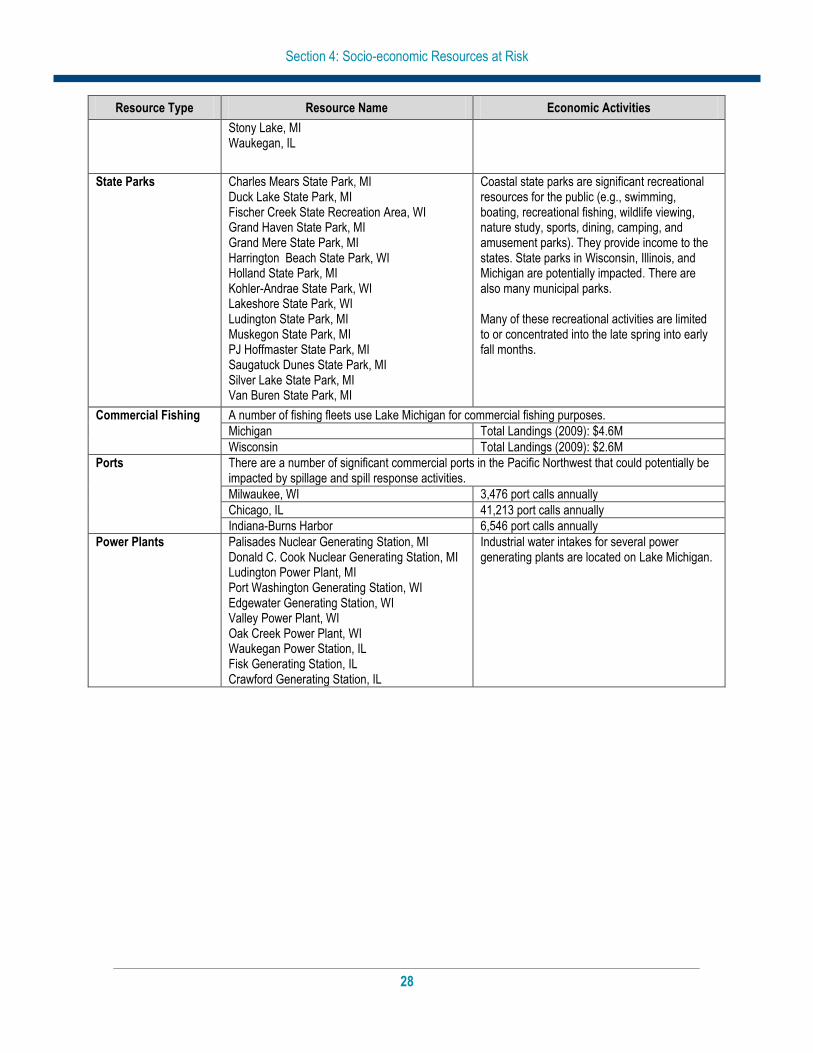
Section 4: Socio-economic Resources at Risk
28
Resource Type Resource Name Economic Activities
Stony Lake, MI Waukegan, IL
State Parks Charles Mears State Park, MI Duck Lake State Park, MI Fischer Creek State Recreation Area, WI Grand Haven State Park, MI Grand Mere State Park, MI Harrington Beach State Park, WI Holland State Park, MI Kohler-Andrae State Park, WI Lakeshore State Park, WI Ludington State Park, MI Muskegon State Park, MI PJ Hoffmaster State Park, MI Saugatuck Dunes State Park, MI Silver Lake State Park, MI Van Buren State Park, MI
Coastal state parks are significant recreational resources for the public (e.g., swimming, boating, recreational fishing, wildlife viewing, nature study, sports, dining, camping, and amusement parks). They provide income to the states. State parks in Wisconsin, Illinois, and Michigan are potentially impacted. There are also many municipal parks. Many of these recreational activities are limited to or concentrated into the late spring into early fall months.
Commercial Fishing A number of fishing fleets use Lake Michigan for commercial fishing purposes.
Michigan Total Landings (2009): $4.6M
Wisconsin Total Landings (2009): $2.6M
Ports There are a number of significant commercial ports in the Pacific Northwest that could potentially be impacted by spillage and spill response activities.
Milwaukee, WI 3,476 port calls annually
Chicago, IL 41,213 port calls annually
Indiana-Burns Harbor 6,546 port calls annually
Power Plants Palisades Nuclear Generating Station, MI Donald C. Cook Nuclear Generating Station, MI Ludington Power Plant, MI Port Washington Generating Station, WI Edgewater Generating Station, WI Valley Power Plant, WI Oak Creek Power Plant, WI Waukegan Power Station, IL Fisk Generating Station, IL Crawford Generating Station, IL
Industrial water intakes for several power generating plants are located on Lake Michigan.
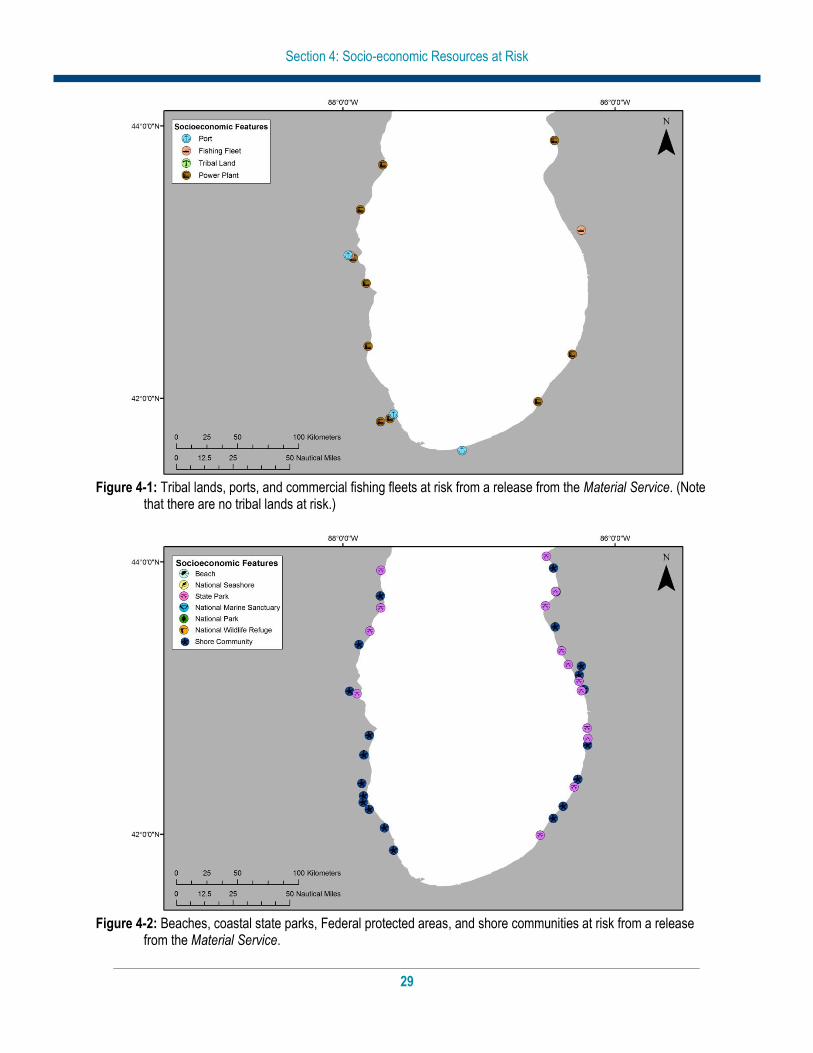
Section 4: Socio-economic Resources at Risk
29
Figure 4-1: Tribal lands, ports, and commercial fishing fleets at risk from a release from the Material Service. (Note
that there are no tribal lands at risk.)
Figure 4-2: Beaches, coastal state parks, Federal protected areas, and shore communities at risk from a release
from the Material Service.
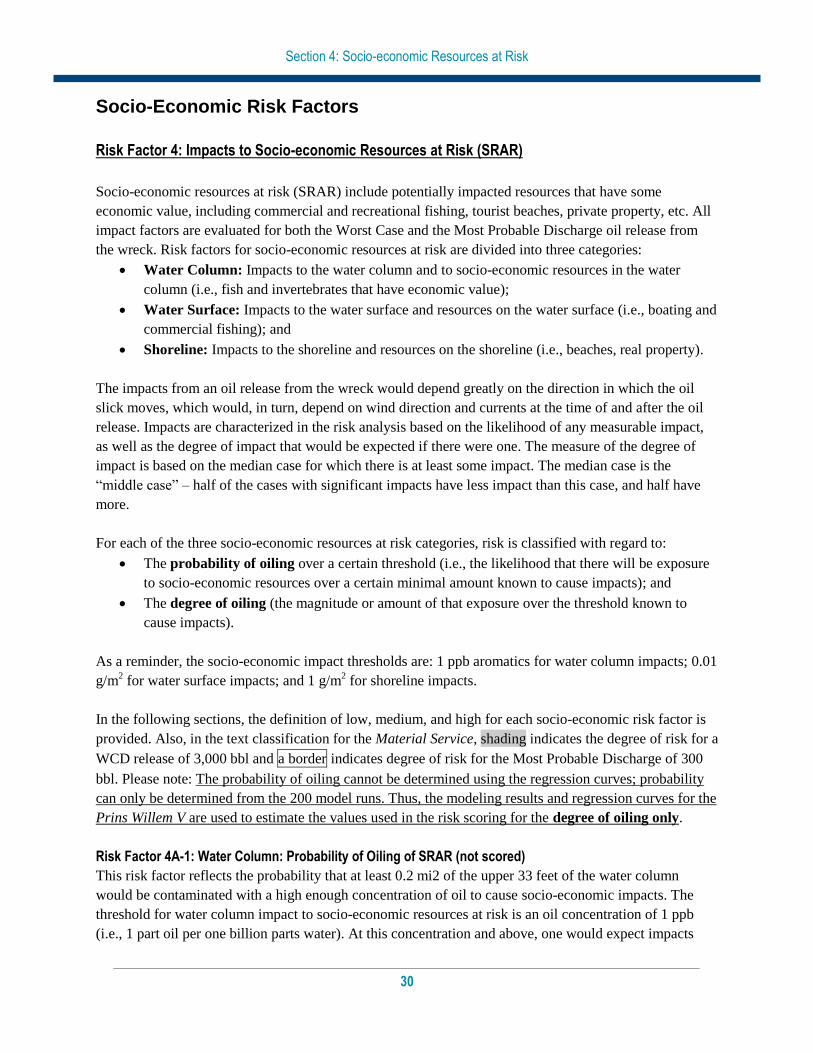
Section 4: Socio-economic Resources at Risk
30
Socio-Economic Risk Factors
Risk Factor 4: Impacts to Socio-economic Resources at Risk (SRAR)
Socio-economic resources at risk (SRAR) include potentially impacted resources that have some
economic value, including commercial and recreational fishing, tourist beaches, private property, etc. All
impact factors are evaluated for both the Worst Case and the Most Probable Discharge oil release from
the wreck. Risk factors for socio-economic resources at risk are divided into three categories:
Water Column: Impacts to the water column and to socio-economic resources in the water
column (i.e., fish and invertebrates that have economic value);
Water Surface: Impacts to the water surface and resources on the water surface (i.e., boating and
commercial fishing); and
Shoreline: Impacts to the shoreline and resources on the shoreline (i.e., beaches, real property).
The impacts from an oil release from the wreck would depend greatly on the direction in which the oil
slick moves, which would, in turn, depend on wind direction and currents at the time of and after the oil
release. Impacts are characterized in the risk analysis based on the likelihood of any measurable impact,
as well as the degree of impact that would be expected if there were one. The measure of the degree of
impact is based on the median case for which there is at least some impact. The median case is the
“middle case” – half of the cases with significant impacts have less impact than this case, and half have
more.
For each of the three socio-economic resources at risk categories, risk is classified with regard to:
The probability of oiling over a certain threshold (i.e., the likelihood that there will be exposure
to socio-economic resources over a certain minimal amount known to cause impacts); and
The degree of oiling (the magnitude or amount of that exposure over the threshold known to
cause impacts).
As a reminder, the socio-economic impact thresholds are: 1 ppb aromatics for water column impacts; 0.01
g/m2 for water surface impacts; and 1 g/m
2 for shoreline impacts.
In the following sections, the definition of low, medium, and high for each socio-economic risk factor is
provided. Also, in the text classification for the Material Service, shading indicates the degree of risk for a
WCD release of 3,000 bbl and a border indicates degree of risk for the Most Probable Discharge of 300
bbl. Please note: The probability of oiling cannot be determined using the regression curves; probability
can only be determined from the 200 model runs. Thus, the modeling results and regression curves for the
Prins Willem V are used to estimate the values used in the risk scoring for the degree of oiling only.
Risk Factor 4A-1: Water Column: Probability of Oiling of SRAR (not scored)
This risk factor reflects the probability that at least 0.2 mi2 of the upper 33 feet of the water column
would be contaminated with a high enough concentration of oil to cause socio-economic impacts. The
threshold for water column impact to socio-economic resources at risk is an oil concentration of 1 ppb
(i.e., 1 part oil per one billion parts water). At this concentration and above, one would expect impacts
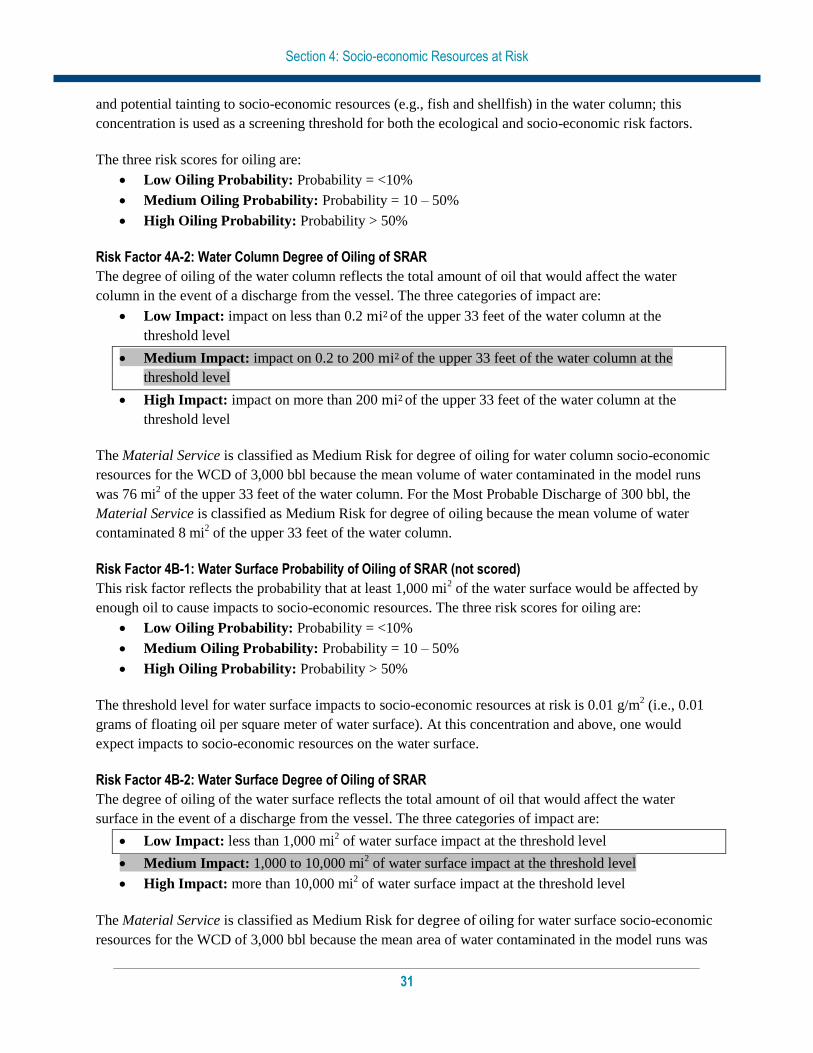
Section 4: Socio-economic Resources at Risk
31
and potential tainting to socio-economic resources (e.g., fish and shellfish) in the water column; this
concentration is used as a screening threshold for both the ecological and socio-economic risk factors.
The three risk scores for oiling are:
Low Oiling Probability: Probability = <10%
Medium Oiling Probability: Probability = 10 – 50%
High Oiling Probability: Probability > 50%
Risk Factor 4A-2: Water Column Degree of Oiling of SRAR
The degree of oiling of the water column reflects the total amount of oil that would affect the water
column in the event of a discharge from the vessel. The three categories of impact are:
Low Impact: impact on less than 0.2 mi2 of the upper 33 feet of the water column at the
threshold level
Medium Impact: impact on 0.2 to 200 mi2 of the upper 33 feet of the water column at the
threshold level
High Impact: impact on more than 200 mi2 of the upper 33 feet of the water column at the
threshold level
The Material Service is classified as Medium Risk for degree of oiling for water column socio-economic
resources for the WCD of 3,000 bbl because the mean volume of water contaminated in the model runs
was 76 mi2 of the upper 33 feet of the water column. For the Most Probable Discharge of 300 bbl, the
Material Service is classified as Medium Risk for degree of oiling because the mean volume of water
contaminated 8 mi2 of the upper 33 feet of the water column.
Risk Factor 4B-1: Water Surface Probability of Oiling of SRAR (not scored)
This risk factor reflects the probability that at least 1,000 mi2 of the water surface would be affected by
enough oil to cause impacts to socio-economic resources. The three risk scores for oiling are:
Low Oiling Probability: Probability = <10%
Medium Oiling Probability: Probability = 10 – 50%
High Oiling Probability: Probability > 50%
The threshold level for water surface impacts to socio-economic resources at risk is 0.01 g/m2 (i.e., 0.01
grams of floating oil per square meter of water surface). At this concentration and above, one would
expect impacts to socio-economic resources on the water surface.
Risk Factor 4B-2: Water Surface Degree of Oiling of SRAR
The degree of oiling of the water surface reflects the total amount of oil that would affect the water
surface in the event of a discharge from the vessel. The three categories of impact are:
Low Impact: less than 1,000 mi2 of water surface impact at the threshold level
Medium Impact: 1,000 to 10,000 mi2 of water surface impact at the threshold level
High Impact: more than 10,000 mi2 of water surface impact at the threshold level
The Material Service is classified as Medium Risk for degree of oiling for water surface socio-economic
resources for the WCD of 3,000 bbl because the mean area of water contaminated in the model runs was
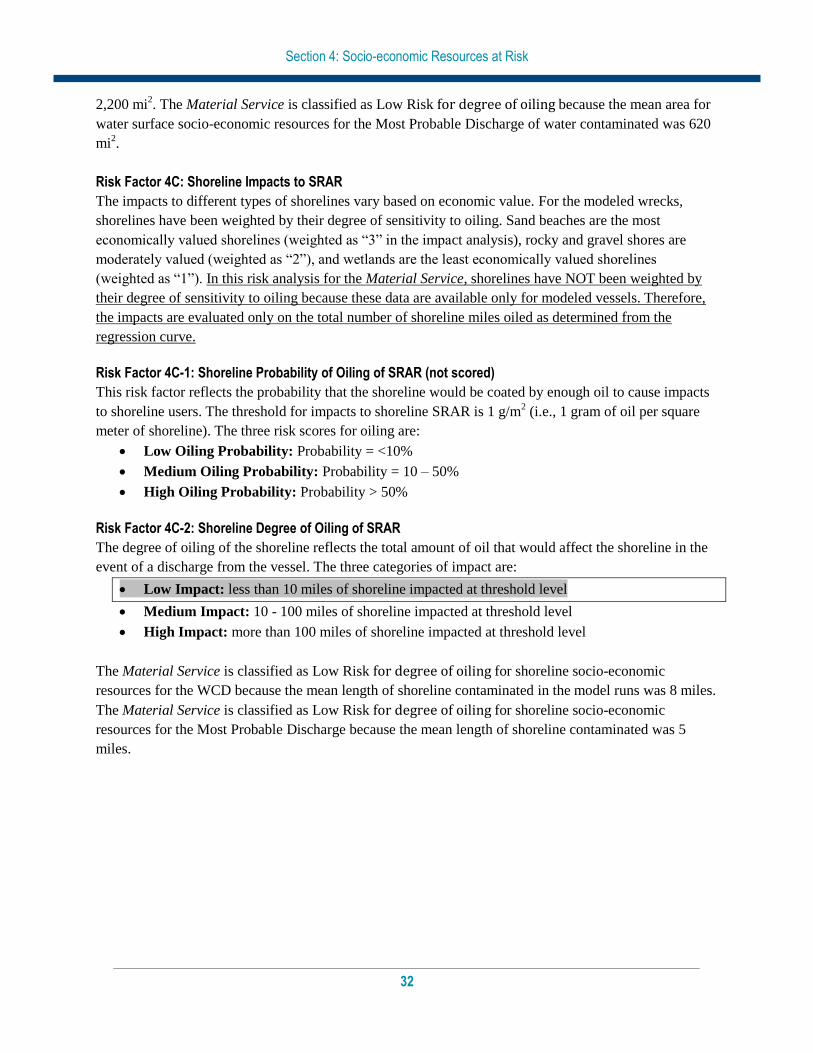
Section 4: Socio-economic Resources at Risk
32
2,200 mi2. The Material Service is classified as Low Risk for degree of oiling because the mean area for
water surface socio-economic resources for the Most Probable Discharge of water contaminated was 620
mi2.
Risk Factor 4C: Shoreline Impacts to SRAR
The impacts to different types of shorelines vary based on economic value. For the modeled wrecks,
shorelines have been weighted by their degree of sensitivity to oiling. Sand beaches are the most
economically valued shorelines (weighted as “3” in the impact analysis), rocky and gravel shores are
moderately valued (weighted as “2”), and wetlands are the least economically valued shorelines
(weighted as “1”). In this risk analysis for the Material Service, shorelines have NOT been weighted by
their degree of sensitivity to oiling because these data are available only for modeled vessels. Therefore,
the impacts are evaluated only on the total number of shoreline miles oiled as determined from the
regression curve.
Risk Factor 4C-1: Shoreline Probability of Oiling of SRAR (not scored)
This risk factor reflects the probability that the shoreline would be coated by enough oil to cause impacts
to shoreline users. The threshold for impacts to shoreline SRAR is 1 g/m2 (i.e., 1 gram of oil per square
meter of shoreline). The three risk scores for oiling are:
Low Oiling Probability: Probability = <10%
Medium Oiling Probability: Probability = 10 – 50%
High Oiling Probability: Probability > 50%
Risk Factor 4C-2: Shoreline Degree of Oiling of SRAR
The degree of oiling of the shoreline reflects the total amount of oil that would affect the shoreline in the
event of a discharge from the vessel. The three categories of impact are:
Low Impact: less than 10 miles of shoreline impacted at threshold level
Medium Impact: 10 - 100 miles of shoreline impacted at threshold level
High Impact: more than 100 miles of shoreline impacted at threshold level
The Material Service is classified as Low Risk for degree of oiling for shoreline socio-economic
resources for the WCD because the mean length of shoreline contaminated in the model runs was 8 miles.
The Material Service is classified as Low Risk for degree of oiling for shoreline socio-economic
resources for the Most Probable Discharge because the mean length of shoreline contaminated was 5
miles.
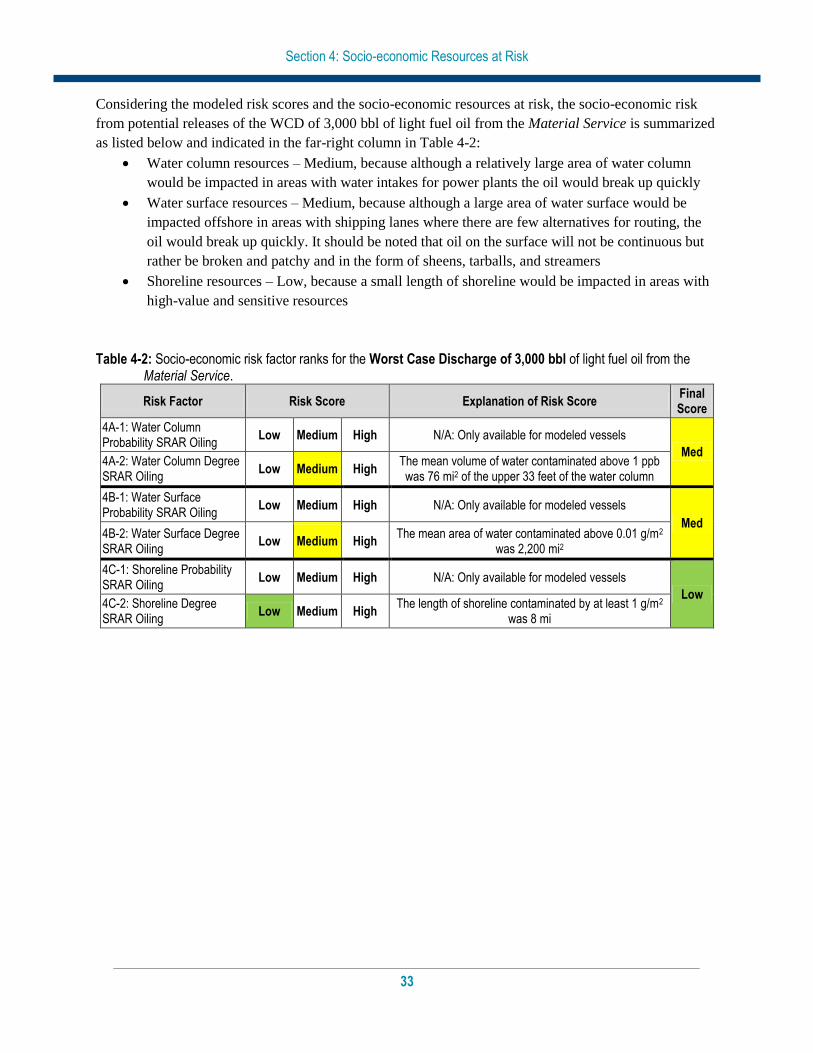
Section 4: Socio-economic Resources at Risk
33
Considering the modeled risk scores and the socio-economic resources at risk, the socio-economic risk
from potential releases of the WCD of 3,000 bbl of light fuel oil from the Material Service is summarized
as listed below and indicated in the far-right column in Table 4-2:
Water column resources – Medium, because although a relatively large area of water column
would be impacted in areas with water intakes for power plants the oil would break up quickly
Water surface resources – Medium, because although a large area of water surface would be
impacted offshore in areas with shipping lanes where there are few alternatives for routing, the
oil would break up quickly. It should be noted that oil on the surface will not be continuous but
rather be broken and patchy and in the form of sheens, tarballs, and streamers
Shoreline resources – Low, because a small length of shoreline would be impacted in areas with
high-value and sensitive resources
Table 4-2: Socio-economic risk factor ranks for the Worst Case Discharge of 3,000 bbl of light fuel oil from the Material Service.
Risk Factor Risk Score Explanation of Risk Score Final Score
4A-1: Water Column Probability SRAR Oiling
Low Medium High N/A: Only available for modeled vessels
Med 4A-2: Water Column Degree SRAR Oiling
Low Medium High The mean volume of water contaminated above 1 ppb was 76 mi2 of the upper 33 feet of the water column
4B-1: Water Surface Probability SRAR Oiling
Low Medium High N/A: Only available for modeled vessels
Med 4B-2: Water Surface Degree SRAR Oiling
Low Medium High The mean area of water contaminated above 0.01 g/m2
was 2,200 mi2
4C-1: Shoreline Probability SRAR Oiling
Low Medium High N/A: Only available for modeled vessels
Low 4C-2: Shoreline Degree SRAR Oiling
Low Medium High The length of shoreline contaminated by at least 1 g/m2
was 8 mi
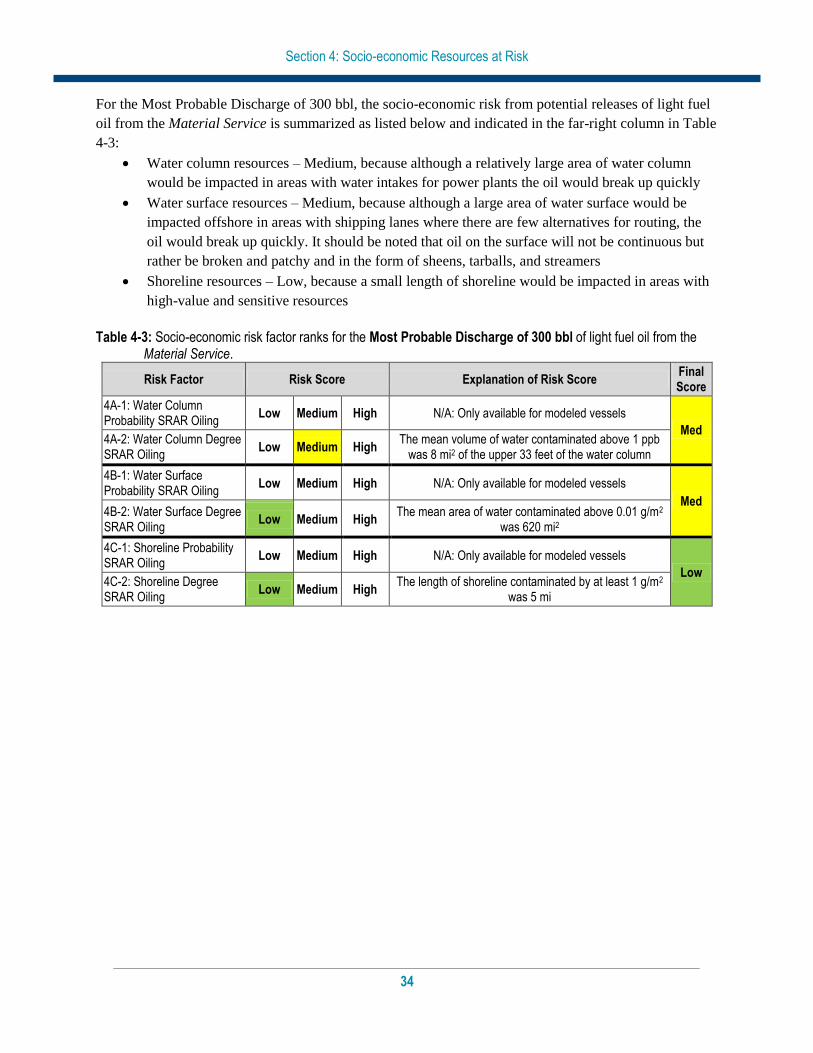
Section 4: Socio-economic Resources at Risk
34
For the Most Probable Discharge of 300 bbl, the socio-economic risk from potential releases of light fuel
oil from the Material Service is summarized as listed below and indicated in the far-right column in Table
4-3:
Water column resources – Medium, because although a relatively large area of water column
would be impacted in areas with water intakes for power plants the oil would break up quickly
Water surface resources – Medium, because although a large area of water surface would be
impacted offshore in areas with shipping lanes where there are few alternatives for routing, the
oil would break up quickly. It should be noted that oil on the surface will not be continuous but
rather be broken and patchy and in the form of sheens, tarballs, and streamers
Shoreline resources – Low, because a small length of shoreline would be impacted in areas with
high-value and sensitive resources
Table 4-3: Socio-economic risk factor ranks for the Most Probable Discharge of 300 bbl of light fuel oil from the Material Service.
Risk Factor Risk Score Explanation of Risk Score Final Score
4A-1: Water Column Probability SRAR Oiling
Low Medium High N/A: Only available for modeled vessels
Med 4A-2: Water Column Degree SRAR Oiling
Low Medium High The mean volume of water contaminated above 1 ppb
was 8 mi2 of the upper 33 feet of the water column
4B-1: Water Surface Probability SRAR Oiling
Low Medium High N/A: Only available for modeled vessels
Med 4B-2: Water Surface Degree SRAR Oiling
Low Medium High The mean area of water contaminated above 0.01 g/m2
was 620 mi2
4C-1: Shoreline Probability SRAR Oiling
Low Medium High N/A: Only available for modeled vessels
Low 4C-2: Shoreline Degree SRAR Oiling
Low Medium High The length of shoreline contaminated by at least 1 g/m2
was 5 mi
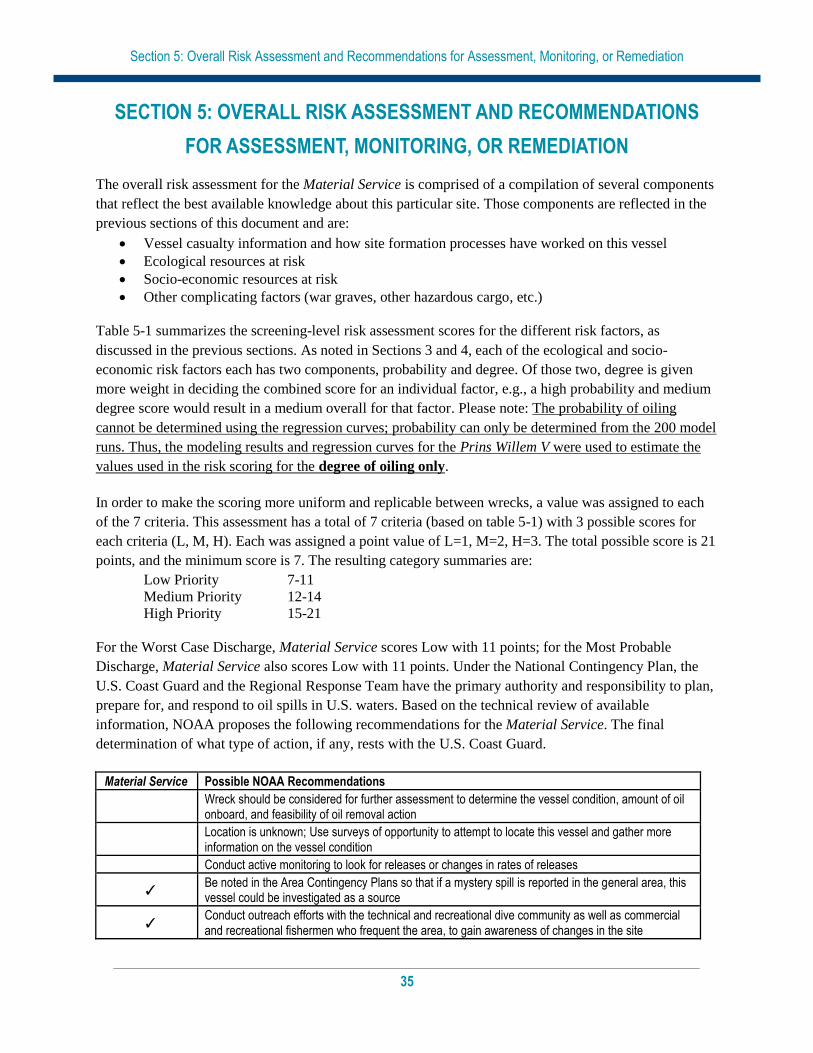
Section 5: Overall Risk Assessment and Recommendations for Assessment, Monitoring, or Remediation
35
SECTION 5: OVERALL RISK ASSESSMENT AND RECOMMENDATIONS
FOR ASSESSMENT, MONITORING, OR REMEDIATION
The overall risk assessment for the Material Service is comprised of a compilation of several components
that reflect the best available knowledge about this particular site. Those components are reflected in the
previous sections of this document and are:
Vessel casualty information and how site formation processes have worked on this vessel
Ecological resources at risk
Socio-economic resources at risk
Other complicating factors (war graves, other hazardous cargo, etc.)
Table 5-1 summarizes the screening-level risk assessment scores for the different risk factors, as
discussed in the previous sections. As noted in Sections 3 and 4, each of the ecological and socio-
economic risk factors each has two components, probability and degree. Of those two, degree is given
more weight in deciding the combined score for an individual factor, e.g., a high probability and medium
degree score would result in a medium overall for that factor. Please note: The probability of oiling
cannot be determined using the regression curves; probability can only be determined from the 200 model
runs. Thus, the modeling results and regression curves for the Prins Willem V were used to estimate the
values used in the risk scoring for the degree of oiling only.
In order to make the scoring more uniform and replicable between wrecks, a value was assigned to each
of the 7 criteria. This assessment has a total of 7 criteria (based on table 5-1) with 3 possible scores for
each criteria (L, M, H). Each was assigned a point value of L=1, M=2, H=3. The total possible score is 21
points, and the minimum score is 7. The resulting category summaries are:
Low Priority 7-11
Medium Priority 12-14
High Priority 15-21
For the Worst Case Discharge, Material Service scores Low with 11 points; for the Most Probable
Discharge, Material Service also scores Low with 11 points. Under the National Contingency Plan, the
U.S. Coast Guard and the Regional Response Team have the primary authority and responsibility to plan,
prepare for, and respond to oil spills in U.S. waters. Based on the technical review of available
information, NOAA proposes the following recommendations for the Material Service. The final
determination of what type of action, if any, rests with the U.S. Coast Guard.
Material Service Possible NOAA Recommendations
Wreck should be considered for further assessment to determine the vessel condition, amount of oil onboard, and feasibility of oil removal action
Location is unknown; Use surveys of opportunity to attempt to locate this vessel and gather more information on the vessel condition
Conduct active monitoring to look for releases or changes in rates of releases
✓ Be noted in the Area Contingency Plans so that if a mystery spill is reported in the general area, this vessel could be investigated as a source
✓ Conduct outreach efforts with the technical and recreational dive community as well as commercial and recreational fishermen who frequent the area, to gain awareness of changes in the site
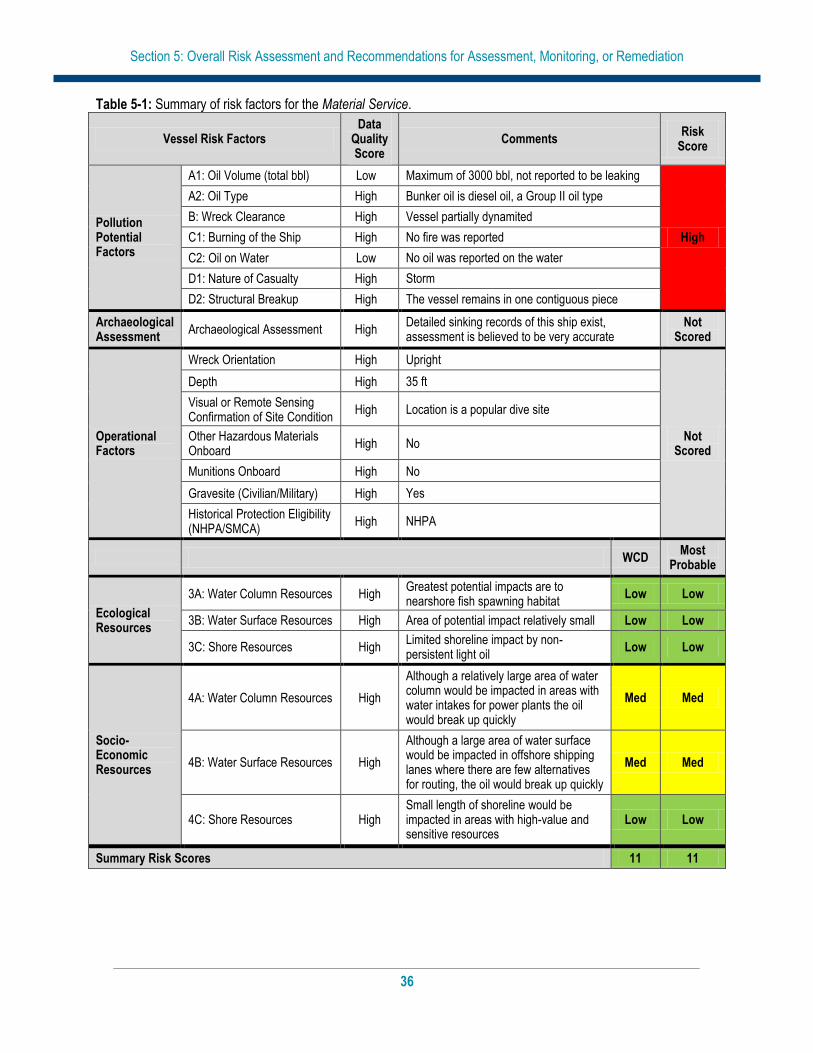
Section 5: Overall Risk Assessment and Recommendations for Assessment, Monitoring, or Remediation
36
Table 5-1: Summary of risk factors for the Material Service.
Vessel Risk Factors Data
Quality Score
Comments Risk
Score
Pollution Potential Factors
A1: Oil Volume (total bbl) Low Maximum of 3000 bbl, not reported to be leaking
High
A2: Oil Type High Bunker oil is diesel oil, a Group II oil type
B: Wreck Clearance High Vessel partially dynamited
C1: Burning of the Ship High No fire was reported
C2: Oil on Water Low No oil was reported on the water
D1: Nature of Casualty High Storm
D2: Structural Breakup High The vessel remains in one contiguous piece
Archaeological Assessment
Archaeological Assessment High Detailed sinking records of this ship exist, assessment is believed to be very accurate
Not Scored
Operational Factors
Wreck Orientation High Upright
Not Scored
Depth High 35 ft
Visual or Remote Sensing Confirmation of Site Condition
High Location is a popular dive site
Other Hazardous Materials Onboard
High No
Munitions Onboard High No
Gravesite (Civilian/Military) High Yes
Historical Protection Eligibility (NHPA/SMCA)
High NHPA
WCD Most
Probable
Ecological Resources
3A: Water Column Resources High Greatest potential impacts are to nearshore fish spawning habitat
Low Low
3B: Water Surface Resources High Area of potential impact relatively small Low Low
3C: Shore Resources High Limited shoreline impact by non-persistent light oil
Low Low
Socio-Economic Resources
4A: Water Column Resources High
Although a relatively large area of water column would be impacted in areas with water intakes for power plants the oil would break up quickly
Med Med
4B: Water Surface Resources High
Although a large area of water surface would be impacted in offshore shipping lanes where there are few alternatives for routing, the oil would break up quickly
Med Med
4C: Shore Resources High Small length of shoreline would be impacted in areas with high-value and sensitive resources
Low Low
Summary Risk Scores 11 11


![National Marine Sanctuaries Act · National Marine Sanctuaries Act 1 SEC. 301. [16 U.S.C. 1431] FINDINGS, PURPOSES, AND POLICIES; ESTABLISHMENT OF SYSTEM (a) FINDINGS.—The Congress](https://img.pdfslide.net/doc/110x75/60022edba04cf4577540bed6/national-marine-sanctuaries-act-national-marine-sanctuaries-act-1-sec-301-16.jpg)