Embed Size (px)
Citation preview
sensors
Article
Study on the Correlation between Humidity andMaterial Strains in Separable Micro HumiditySensor Design
Chih-Yuan Chang
Department of Civil Engineering, Feng Chia University, No. 100, Wenhwa Rd., Seatwen, Taichung 40724,Taiwan; [email protected]; Tel.: +886-424517250 (ext. 3130); Fax: +886-424516982
Academic Editor: Vittorio M. N. PassaroReceived: 25 February 2017; Accepted: 5 May 2017; Published: 8 May 2017
Abstract: Incidents of injuries caused by tiles falling from building exterior walls are frequentlyreported in Taiwan. Humidity is an influential factor in tile deterioration but it is more difficultto measure the humidity inside a building structure than the humidity in an indoor environment.Therefore, a separable microsensor was developed in this study to measure the humidity of thecement mortar layer with a thickness of 1.5–2 cm inside the external wall of a building. 3D printingtechnology is used to produce an encapsulation box that can protect the sensor from damage causedby the concrete and cement mortar. The sensor is proven in this study to be capable of measuringtemperature and humidity simultaneously and the measurement results are then used to analyze theinfluence of humidity on external wall tile deterioration.
Keywords: humidity sensor; microminiaturization; smart external wall; tile; strain gauge
1. Introduction
Ceramic tiles are decoration materials commonly used on the external walls of buildings in Asia.They are subject to deterioration, loosening or falling caused by environmental factors such as humidity,temperature, sunlight exposure, acid rain, vibration or earthquakes. In recent years, there have beenfrequent incidents of injuries caused by falling tiles, the government has implemented legislationrequiring that old buildings be regularly examined [1–3]. This is a labor intensive task and the safetyof buildings with tiles on their external walls could be better ensured with the development of smartand self-diagnosing external walls that use different kinds of sensors to monitor and control signs oftile deterioration. To achieve this goal, the first key step is to be able to measure the temperature andhumidity of the external walls.
From the perspective of building medicine [4], the external walls of a building are equivalent tothe human skin. Without good care and maintenance, they both are prone to aging or even diseases.In human skin, there is a system of nervous sensors transmitting signals from environmental perceptions.By the same token, buildings require a network of sensors within their external walls to perceive andtransmit information about the physical properties of the building structure and the surroundingenvironment. In addition, after the completion of their construction, the exterior walls of buildings willhave to endure severe weathering, including damage caused by wind, rain, humidity and pollution.Among the weathering factors, humidity is one that cannot be ignored [5].
Along with technological advancements, many types of sensors have been used in constructionengineering to provide a wide variety of data for management and maintenance. Take RH/Tsensors (the sensors used in this study can simultaneously measure temperature and humidity, hencehereinafter they are referred to as RH/T sensors) for example. Currently, they are mostly appliedeither to monitor indoor environments in order to enable comfortable environment management or
Sensors 2017, 17, 1066; doi:10.3390/s17051066 www.mdpi.com/journal/sensors
Sensors 2017, 17, 1066 2 of 14
to monitor temperature/humidity changes in building structures in order to assess their structuralhealth. This study is unique in its development of a separable RH/T microsensor particularly suitablefor very limited and narrow measurement spaces. The sensor developed in this study is protectedin a 3D-printed encapsulation and deployed in a cement mortar layer of 1.5–2 cm thickness insidethe building’s exterior wall. An experiment was conducted to test if the sensor could measurethe temperature and humidity properly and the measurement results were then used to analyzethe influence of humidity on the strain of external wall tile deterioration. It is hoped that thesensor developed in this study will become the technological foundation for the research on wearcharacteristics causing external wall tile deterioration and for the development of IoT-based smartwalls or buildings that are capable of self-diagnosing to ensure better public safety.
2. Background Research
2.1. Application of RH/T Sensors in the Construction Industry
Persistent humidity in a 80~90% range will cause concrete to deteriorate and shorten the life ofbuilding structures [6]. Excessively high humidity inside the concrete structure will also promoterusting of rebar, causing the concrete cover to fall off and consequently impairing the structuralsafety [7]. Therefore, humidity is an indispensable parameter in the monitoring of concrete structures.Currently, research on the application of temperature/humidity sensors (RH/T sensors) in theconstruction industry can be divided into two types: sensors applied to measure humidity in indoorenvironments and sensors applied to measure humidity within building structures. There is a largequantity of research on how to use sensors to measure and monitor humidity in indoor environments.For example, energy management platforms have been developed with sensors deployed in indoorenvironments to have long-term monitoring of the wall surface temperature, relative humidity, sunlightexposure, and CO/CO2 concentration in the environment and the monitoring data can providereferences for indoor environment management [8]. The monitoring data of the sensors can be used asreferences to create a comfortable indoor environment through adjustments of heating, ventilation andair conditioning (HVAC) [9]. These sensors have also be used to provide references for the conservationof ancient mosque buildings [10].
For the measurement of humidity inside building structures, some researchers developed newsensing device (5 cm × 4.8 cm × 5 cm) using radio frequency integrated circuits (RFICs) and RH/Tsensors [11]. Other researchers developed a 5.2 cm × 4.6 cm × 4.6 cm Smart Temperature InformationMaterial (STIM), which can automatically and continuously transmit concrete humidity data to aBuilding Physiology Information System (BPIS) for a long period of time [12]. STIM was used in aone-year study comparing the performance of different roof insulation materials for reinforced concretebuildings [13]. Different RH/T sensors were tested with their probes protected by polypropyleneencapsulation to find out which sensor could successfully overcome the high alkaline environmentfound in concrete and continuously monitor the temperature and humidity for two months [14].Encapsulation boxes (6.5 cm × 4 cm × 6.5 cm) were designed, developed and used to help RH/Tsensors overcome the strong alkalinity in the concrete environment [15].
Moreover, some studies also embedded temperature, humidity, and ultrasonic sensors throughWireless Sensor Networks into a precast concrete slab for quality management of the mass andcompressive strength of concrete during the curing process [16]. Humidity and temperature are two ofthe factors affecting the surface corrosion and durability of concrete. Therefore, a study embedded andplaced temperature-humidity sensors into concrete blocks in a moist tropical environment. Througha one-year experiment, it became apparent that the west side of a concrete block was most likelyto experience carbonation in a high humidity environment [17]. Humidity is very important in themaintenance of concrete structures. If the humidity is abnormal, cracks are easily generated in theconcrete structure, causing structural defects. Therefore, a study embedded the humidity sensors intonormal-strength and high-strength concretes structures that had just been completely poured, in order
Sensors 2017, 17, 1066 3 of 14
to understand the difference in internal relative humidity changes inside concrete structures of differentstrengths during the early stage of consolidations, and to provide a benchmark as a reference for themaintenance of high-strength concrete [18]. In addition, another study installed displacement sensorsinto high-strength concrete structures to understand the changes in structural strains of differentrelative humidity structures through embedded temperature-humidity sensors. The experimentalresults of this study show that a drier structure had smaller internal strains [19]. Furthermore, a studyembedded a humidity sensor into the concrete structure under simulated environment scenarioexperiments in the laboratory, to understand the impact of different climates on the internal relativehumidity and distribution state of the concrete structure. As indicated by the experimental results,among the impact factors of rainfall on structure, the rainfall duration, and whether concrete is exposeddirectly to the rainwater have greater impact on the internal relative humidity of a structure than theamount of rainfall [20]. The humidity experiments above focus on the concrete’s quality management,durability, crack effects, strain amount, and rainfall effects, respectively. It can clearly be seen that themeasurement of humidity is important in concrete structure evaluation. Regarding the strain amount,although the humidity is directly proportional to the strain amount, its more accurate quantificationdifferences are correlated with other deterioration factors, such as tile hollowing rate, which is stillpending further study.
There are several cases of RH/T sensors applied to monitor building structures such as awater-proof system on the roof of a museum to make sure the system was functioning properlyafter it was repaired [21]. RH/T sensors are used in structure simulation specimens together withvibration sensors and network technologies to measure the linear change of stress inside the structureand calculate the correlation between strain and humidity [22].
Even though there have been breakthroughs in solving the problem of the strong alkalinityof freshly mixed concrete, signal transmission and power supply for RH/T sensors with all theirelectronic circuits, wireless/wired transmission modules and power supply units, they are oftenquite large in size. Such large sensors are difficult to deploy in the narrow or limited measurementspaces inside building structures, such as the cement mortar layer (often only 1.5–2 cm thick) betweenthe exterior tiles and the reinforced concrete structure of a building, making the development ofRH/T microsensors with suitable encapsulation protection to obtain continuous and long-term RH/Tmeasurement data an interesting challenge.
2.2. Existing Diagnosis Methods for External Wall Tiles
Like humans, buildings are subject to aging and “death”. So are a building’s external walls.The adherence of tiles to building exterior is a complicated process and each layer of the structurecontracts or expand differently when humidity changes, causing the tiles to deteriorate and separatefrom the building exterior [23]. By collating the literature related to the deterioration of tile externalwalls, the results show that humidity is also one of the factors that affect environmental deterioration [24].Moreover, some studies also conducted status surveys and literature compilation, and learned thatthe impact factors of degradation in tiles of external walls include tile degradation form, degradationrange, degradation position, temperature, and humidity [25]. Another study also pointed out thattiles of external walls will experience different levels of spalling, swelling, or shedding, and otherdeterioration phenomena according to the wind, rain, sunlight, dew, temperature, humidity, sunshinevolume, construction quality, and maintenance quality [26]. In addition to environmental factors, thereis a study exploring the impact of temperature on the strength of adhesives during the binding process;the results show that when coating a layer of adhesive gel after applying the cement and mortar,if the pasting is not carried out immediately, it will be likely to lead to lower binding strength, andtemperature has a significant impact on the strength of adhesives [27]. Even though temperature andhumidity are theoretically established by many studies as important factors for the deterioration ofbuilding exterior decoration materials (such as tiles), there have been relatively few studies analyzingthrough long-term monitoring the correlation between humidity and deterioration of external wall
Sensors 2017, 17, 1066 4 of 14
decoration materials. It is mainly because of the difficulties in measuring humidity inside concrete orbuilding structures. Measuring the humidity in the interface layer of cement and mortar in a limitedspace is difficult.
Currently, the most common methods to diagnose external wall tile deterioration are still thevisual evaluation method and the tap tone method [28]. The tap tone method is believed to be moreeconomical [29]. Robots can be used for the tap tone method and the diagnosis data are sent to mobiledevices through wireless transmission [30]. For external wall decoration materials on high-risingbuildings, there are other methods such as the passive quantitative infrared thermography (PQIRT) anderrors in the diagnosis data can be corrected through algorithms and experiments [31]. A combinationof different methods such as infrared diagnosis, acoustic emission and ultrasound scanning can beused to diagnose the external wall structure and predict its deterioration process [32]. There are alsostudies that apply acoustic frequency characteristics to test the adherence integrity of tiles [33] or pulsethermal imaging to diagnose the deterioration of tiled building exterior [34].
There is an insufficiency of research on the correlations among factors of external wall deteriorationor on the pathological characteristics of the deterioration process. This is probably because thetechnology for application of humidity sensors inside building external walls is still in an incipientstage. The cement mortar layer exists between the external wall tiles and the concrete structure of abuilding. Theoretically, when humidity changes, the cement mortar layer and the reinforced concretewill have different levels of contraction or strain. Therefore, in the analysis of tile deterioration factors,it is theoretically necessary to consider the influence of humidity. Nevertheless, among the humiditysensors currently available on the market it is difficult to find ones of the right size for the thin cementmortar layer. Another challenge that needs to be addressed is finding the encapsulation design thatcan protect the sensors from the highly alkaline concrete environment. As a result, it is a relativelyfeasible option to develop self-designed sensors of the required sizes and features like the separableRH/T microsensor developed in this study until there are suitable options available on the market.
3. Materials and Methods
3.1. Humidity Sensor
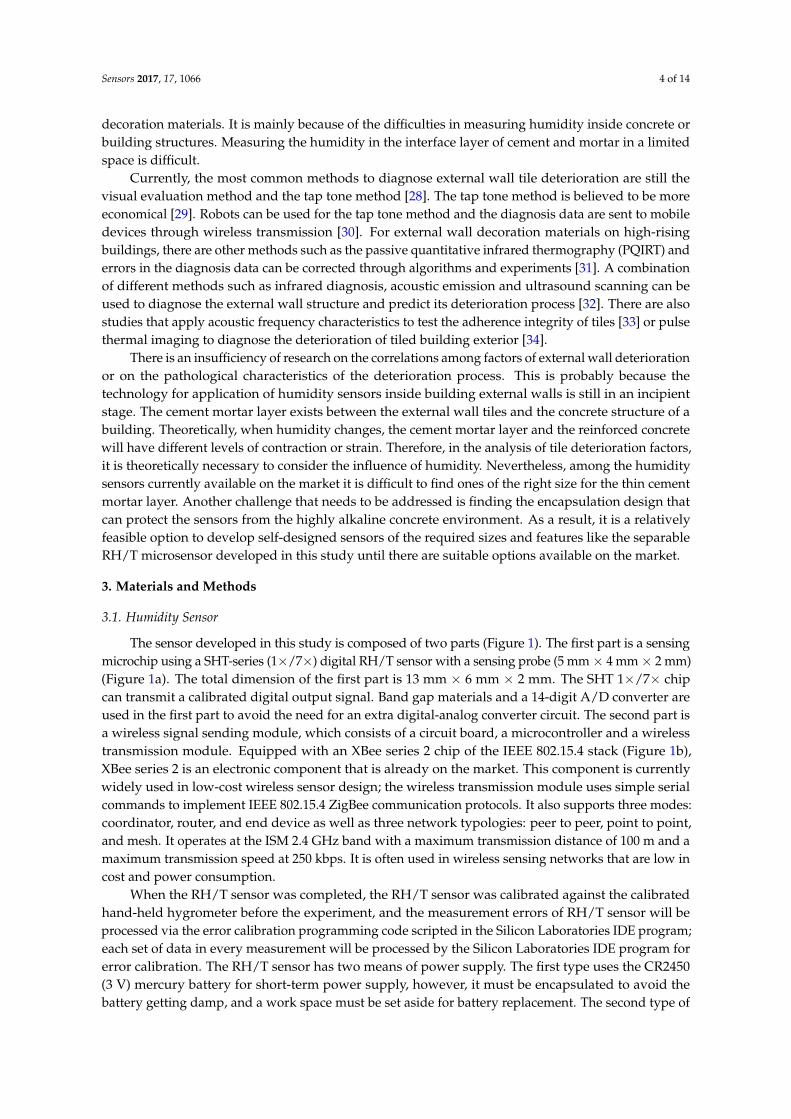
The sensor developed in this study is composed of two parts (Figure 1). The first part is a sensingmicrochip using a SHT-series (1×/7×) digital RH/T sensor with a sensing probe (5 mm × 4 mm × 2 mm)(Figure 1a). The total dimension of the first part is 13 mm × 6 mm × 2 mm. The SHT 1×/7× chipcan transmit a calibrated digital output signal. Band gap materials and a 14-digit A/D converter areused in the first part to avoid the need for an extra digital-analog converter circuit. The second part isa wireless signal sending module, which consists of a circuit board, a microcontroller and a wirelesstransmission module. Equipped with an XBee series 2 chip of the IEEE 802.15.4 stack (Figure 1b),XBee series 2 is an electronic component that is already on the market. This component is currentlywidely used in low-cost wireless sensor design; the wireless transmission module uses simple serialcommands to implement IEEE 802.15.4 ZigBee communication protocols. It also supports three modes:coordinator, router, and end device as well as three network typologies: peer to peer, point to point,and mesh. It operates at the ISM 2.4 GHz band with a maximum transmission distance of 100 m and amaximum transmission speed at 250 kbps. It is often used in wireless sensing networks that are low incost and power consumption.
When the RH/T sensor was completed, the RH/T sensor was calibrated against the calibratedhand-held hygrometer before the experiment, and the measurement errors of RH/T sensor will beprocessed via the error calibration programming code scripted in the Silicon Laboratories IDE program;each set of data in every measurement will be processed by the Silicon Laboratories IDE program forerror calibration. The RH/T sensor has two means of power supply. The first type uses the CR2450(3 V) mercury battery for short-term power supply, however, it must be encapsulated to avoid thebattery getting damp, and a work space must be set aside for battery replacement. The second type of
Sensors 2017, 17, 1066 5 of 14
power supply uses a 5 V/1 A power cable. As there is a requirement for long-term and continuousmonitoring, it is recommended that the second type of power supply is used. The power consumptionof RH/T sensors depends on the frequency of data capture, taking the first type of CR2450 batterywith a nameplate capacity of 660 mA·h, if the frequency of data capture is 30 min, theoretically thepower supply life of the battery can reach 10 years.Sensors 2017, 17, 1066 5 of 14
(a) (b)
Figure 1. RH/T microsensor developed in this study. (a) SHT-series (1×/7×); (b) XBee series 2.
3.2. Strain Gauge
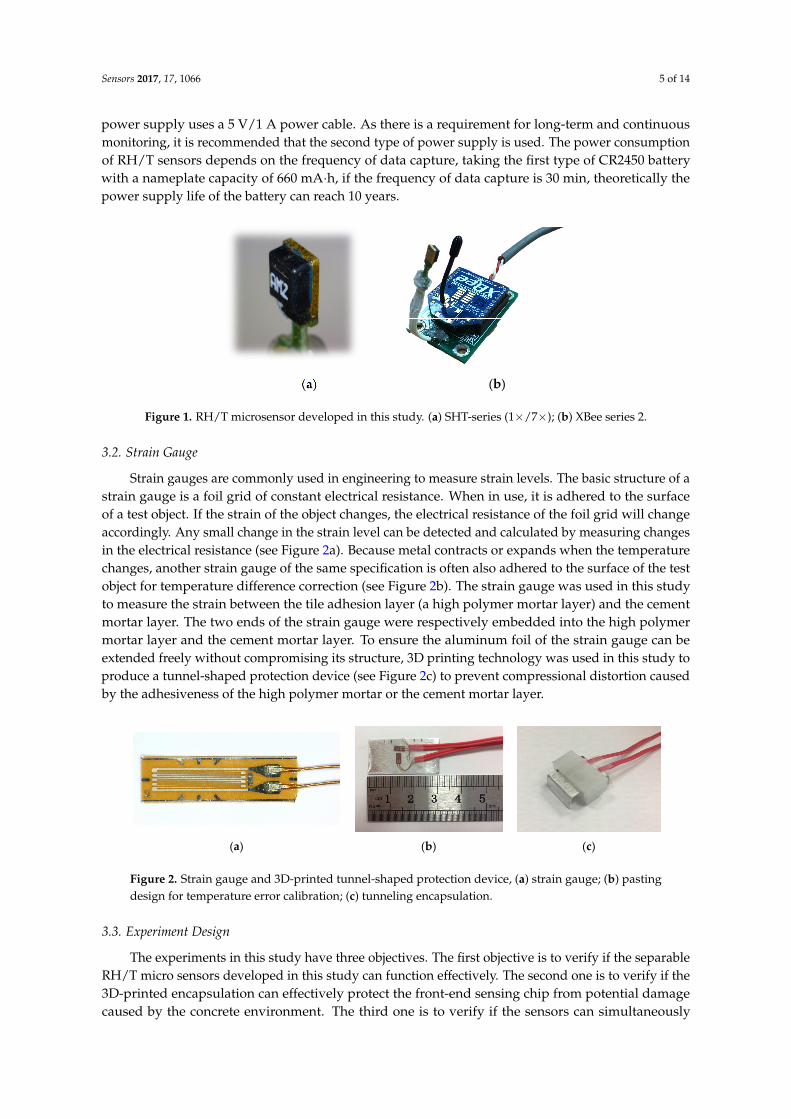
Strain gauges are commonly used in engineering to measure strain levels. The basic structure of a strain gauge is a foil grid of constant electrical resistance. When in use, it is adhered to the surface of a test object. If the strain of the object changes, the electrical resistance of the foil grid will change accordingly. Any small change in the strain level can be detected and calculated by measuring changes in the electrical resistance (see Figure 2a). Because metal contracts or expands when the temperature changes, another strain gauge of the same specification is often also adhered to the surface of the test object for temperature difference correction (see Figure 2b). The strain gauge was used in this study to measure the strain between the tile adhesion layer (a high polymer mortar layer) and the cement mortar layer. The two ends of the strain gauge were respectively embedded into the high polymer mortar layer and the cement mortar layer. To ensure the aluminum foil of the strain gauge can be extended freely without compromising its structure, 3D printing technology was used in this study to produce a tunnel-shaped protection device (see Figure 2c) to prevent compressional distortion caused by the adhesiveness of the high polymer mortar or the cement mortar layer.
(a) (b) (c)
Figure 2. Strain gauge and 3D-printed tunnel-shaped protection device, (a) strain gauge; (b) pasting design for temperature error calibration; (c) tunneling encapsulation.
3.3. Experiment Design
The experiments in this study have three objectives. The first objective is to verify if the separable RH/T micro sensors developed in this study can function effectively. The second one is to verify if the 3D-printed encapsulation can effectively protect the front-end sensing chip from potential damage caused by the concrete environment. The third one is to verify if the sensors can simultaneously measure the strain of test objects under different humidity conditions. There were totally two external wall simulation specimens (40 cm × 25 cm × 15 cm each) in the experiment of this study and the strain gage and the separable RH/T micro sensor were embedded in each of the specimens. The strain gage was embedded across the tile adhesion layer (high polymer mortar layer) and the cement mortar layer. The “front-end sensing chip” and “back-end transmission module” of the sensor were embedded respectively into the cement mortar layer and the concrete layer. When the tapping test (external force factor) was conducted on the external wall tiles, the strain level, air
Figure 1. RH/T microsensor developed in this study. (a) SHT-series (1×/7×); (b) XBee series 2.
3.2. Strain Gauge
Strain gauges are commonly used in engineering to measure strain levels. The basic structure of astrain gauge is a foil grid of constant electrical resistance. When in use, it is adhered to the surfaceof a test object. If the strain of the object changes, the electrical resistance of the foil grid will changeaccordingly. Any small change in the strain level can be detected and calculated by measuring changesin the electrical resistance (see Figure 2a). Because metal contracts or expands when the temperaturechanges, another strain gauge of the same specification is often also adhered to the surface of the testobject for temperature difference correction (see Figure 2b). The strain gauge was used in this studyto measure the strain between the tile adhesion layer (a high polymer mortar layer) and the cementmortar layer. The two ends of the strain gauge were respectively embedded into the high polymermortar layer and the cement mortar layer. To ensure the aluminum foil of the strain gauge can beextended freely without compromising its structure, 3D printing technology was used in this study toproduce a tunnel-shaped protection device (see Figure 2c) to prevent compressional distortion causedby the adhesiveness of the high polymer mortar or the cement mortar layer.
Sensors 2017, 17, 1066 5 of 14
(a) (b)
Figure 1. RH/T microsensor developed in this study. (a) SHT-series (1×/7×); (b) XBee series 2.
3.2. Strain Gauge
Strain gauges are commonly used in engineering to measure strain levels. The basic structure of a strain gauge is a foil grid of constant electrical resistance. When in use, it is adhered to the surface of a test object. If the strain of the object changes, the electrical resistance of the foil grid will change accordingly. Any small change in the strain level can be detected and calculated by measuring changes in the electrical resistance (see Figure 2a). Because metal contracts or expands when the temperature changes, another strain gauge of the same specification is often also adhered to the surface of the test object for temperature difference correction (see Figure 2b). The strain gauge was used in this study to measure the strain between the tile adhesion layer (a high polymer mortar layer) and the cement mortar layer. The two ends of the strain gauge were respectively embedded into the high polymer mortar layer and the cement mortar layer. To ensure the aluminum foil of the strain gauge can be extended freely without compromising its structure, 3D printing technology was used in this study to produce a tunnel-shaped protection device (see Figure 2c) to prevent compressional distortion caused by the adhesiveness of the high polymer mortar or the cement mortar layer.
(a) (b) (c)
Figure 2. Strain gauge and 3D-printed tunnel-shaped protection device, (a) strain gauge; (b) pasting design for temperature error calibration; (c) tunneling encapsulation.
3.3. Experiment Design
The experiments in this study have three objectives. The first objective is to verify if the separable RH/T micro sensors developed in this study can function effectively. The second one is to verify if the 3D-printed encapsulation can effectively protect the front-end sensing chip from potential damage caused by the concrete environment. The third one is to verify if the sensors can simultaneously measure the strain of test objects under different humidity conditions. There were totally two external wall simulation specimens (40 cm × 25 cm × 15 cm each) in the experiment of this study and the strain gage and the separable RH/T micro sensor were embedded in each of the specimens. The strain gage was embedded across the tile adhesion layer (high polymer mortar layer) and the cement mortar layer. The “front-end sensing chip” and “back-end transmission module” of the sensor were embedded respectively into the cement mortar layer and the concrete layer. When the tapping test (external force factor) was conducted on the external wall tiles, the strain level, air
Figure 2. Strain gauge and 3D-printed tunnel-shaped protection device, (a) strain gauge; (b) pastingdesign for temperature error calibration; (c) tunneling encapsulation.
3.3. Experiment Design
The experiments in this study have three objectives. The first objective is to verify if the separableRH/T micro sensors developed in this study can function effectively. The second one is to verify if the3D-printed encapsulation can effectively protect the front-end sensing chip from potential damagecaused by the concrete environment. The third one is to verify if the sensors can simultaneously
Sensors 2017, 17, 1066 6 of 14
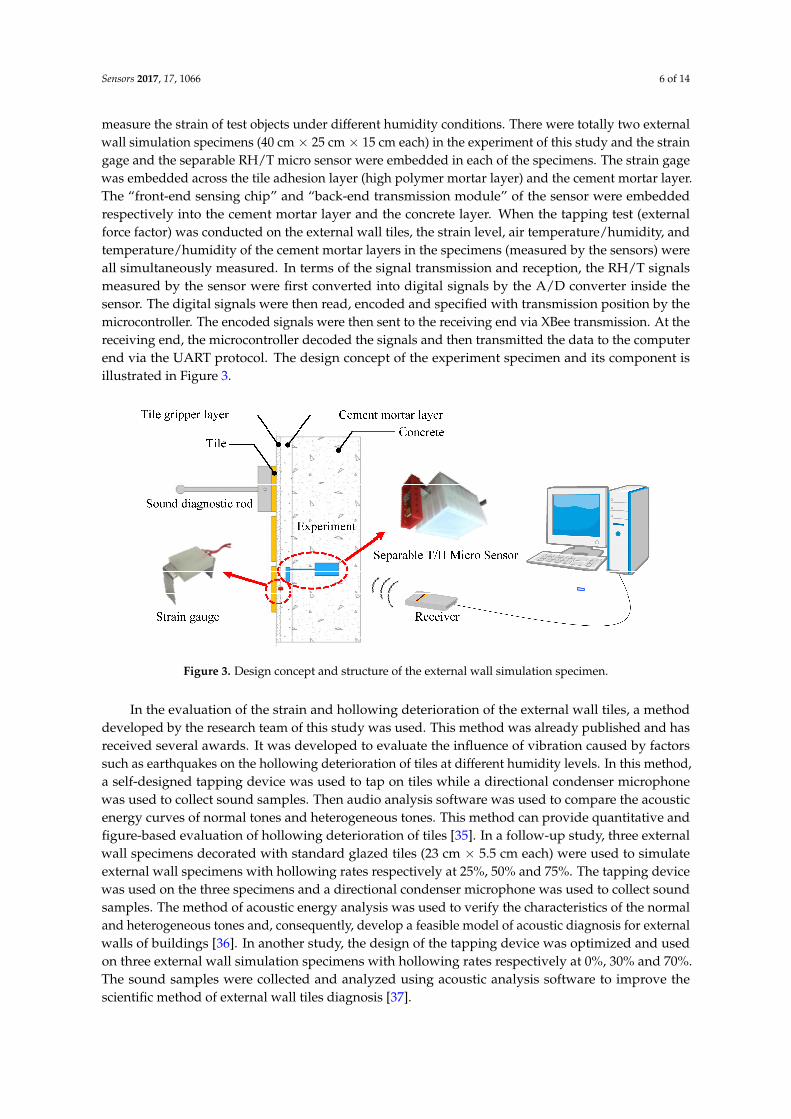
measure the strain of test objects under different humidity conditions. There were totally two externalwall simulation specimens (40 cm × 25 cm × 15 cm each) in the experiment of this study and the straingage and the separable RH/T micro sensor were embedded in each of the specimens. The strain gagewas embedded across the tile adhesion layer (high polymer mortar layer) and the cement mortar layer.The “front-end sensing chip” and “back-end transmission module” of the sensor were embeddedrespectively into the cement mortar layer and the concrete layer. When the tapping test (externalforce factor) was conducted on the external wall tiles, the strain level, air temperature/humidity, andtemperature/humidity of the cement mortar layers in the specimens (measured by the sensors) wereall simultaneously measured. In terms of the signal transmission and reception, the RH/T signalsmeasured by the sensor were first converted into digital signals by the A/D converter inside thesensor. The digital signals were then read, encoded and specified with transmission position by themicrocontroller. The encoded signals were then sent to the receiving end via XBee transmission. At thereceiving end, the microcontroller decoded the signals and then transmitted the data to the computerend via the UART protocol. The design concept of the experiment specimen and its component isillustrated in Figure 3.
Sensors 2017, 17, 1066 6 of 14
temperature/humidity, and temperature/humidity of the cement mortar layers in the specimens (measured by the sensors) were all simultaneously measured. In terms of the signal transmission and reception, the RH/T signals measured by the sensor were first converted into digital signals by the A/D converter inside the sensor. The digital signals were then read, encoded and specified with transmission position by the microcontroller. The encoded signals were then sent to the receiving end via XBee transmission. At the receiving end, the microcontroller decoded the signals and then transmitted the data to the computer end via the UART protocol. The design concept of the experiment specimen and its component is illustrated in Figure 3.
Figure 3. Design concept and structure of the external wall simulation specimen.
In the evaluation of the strain and hollowing deterioration of the external wall tiles, a method developed by the research team of this study was used. This method was already published and has received several awards. It was developed to evaluate the influence of vibration caused by factors such as earthquakes on the hollowing deterioration of tiles at different humidity levels. In this method, a self-designed tapping device was used to tap on tiles while a directional condenser microphone was used to collect sound samples. Then audio analysis software was used to compare the acoustic energy curves of normal tones and heterogeneous tones. This method can provide quantitative and figure-based evaluation of hollowing deterioration of tiles [35]. In a follow-up study, three external wall specimens decorated with standard glazed tiles (23 cm × 5.5 cm each) were used to simulate external wall specimens with hollowing rates respectively at 25%, 50% and 75%. The tapping device was used on the three specimens and a directional condenser microphone was used to collect sound samples. The method of acoustic energy analysis was used to verify the characteristics of the normal and heterogeneous tones and, consequently, develop a feasible model of acoustic diagnosis for external walls of buildings [36]. In another study, the design of the tapping device was optimized and used on three external wall simulation specimens with hollowing rates respectively at 0%, 30% and 70%. The sound samples were collected and analyzed using acoustic analysis software to improve the scientific method of external wall tiles diagnosis [37].
In summary, this study conducted the impact-echoing experiment using the external wall tiles diagnosis technology in the existing study. The experiment can roughly be divided into five steps:
Step 1: The angle between the specimen and the ground of the experimental site is adjusted to 90° through a laser level, unified specimen positioning can ensure consistency during the hitting of each specimen.
Step 2: To avoid the hitting position being different before and after, the hitting position is marked on the preset tiles to be hit.
Figure 3. Design concept and structure of the external wall simulation specimen.
In the evaluation of the strain and hollowing deterioration of the external wall tiles, a methoddeveloped by the research team of this study was used. This method was already published and hasreceived several awards. It was developed to evaluate the influence of vibration caused by factorssuch as earthquakes on the hollowing deterioration of tiles at different humidity levels. In this method,a self-designed tapping device was used to tap on tiles while a directional condenser microphonewas used to collect sound samples. Then audio analysis software was used to compare the acousticenergy curves of normal tones and heterogeneous tones. This method can provide quantitative andfigure-based evaluation of hollowing deterioration of tiles [35]. In a follow-up study, three externalwall specimens decorated with standard glazed tiles (23 cm × 5.5 cm each) were used to simulateexternal wall specimens with hollowing rates respectively at 25%, 50% and 75%. The tapping devicewas used on the three specimens and a directional condenser microphone was used to collect soundsamples. The method of acoustic energy analysis was used to verify the characteristics of the normaland heterogeneous tones and, consequently, develop a feasible model of acoustic diagnosis for externalwalls of buildings [36]. In another study, the design of the tapping device was optimized and usedon three external wall simulation specimens with hollowing rates respectively at 0%, 30% and 70%.The sound samples were collected and analyzed using acoustic analysis software to improve thescientific method of external wall tiles diagnosis [37].
Sensors 2017, 17, 1066 7 of 14
In summary, this study conducted the impact-echoing experiment using the external wall tilesdiagnosis technology in the existing study. The experiment can roughly be divided into five steps:
Step 1: The angle between the specimen and the ground of the experimental site is adjusted to 90◦
through a laser level, unified specimen positioning can ensure consistency during the hitting ofeach specimen.
Step 2: To avoid the hitting position being different before and after, the hitting position is marked onthe preset tiles to be hit.
Step 3: To maintain the consistency of collected sound samples, the distance between the directionalmicrophone and the specimen is unified to be 30 cm.
Step 4: The angle between the tapping device and specimen surface is adjusted to be 90◦, so that thetapping device is hitting the tiles in a free falling manner, while the directional microphone isused to collect the sound samples.
Step 5: The eigenvalues of sound samples are analyzed using the sound analysis program, WaveSurfer.
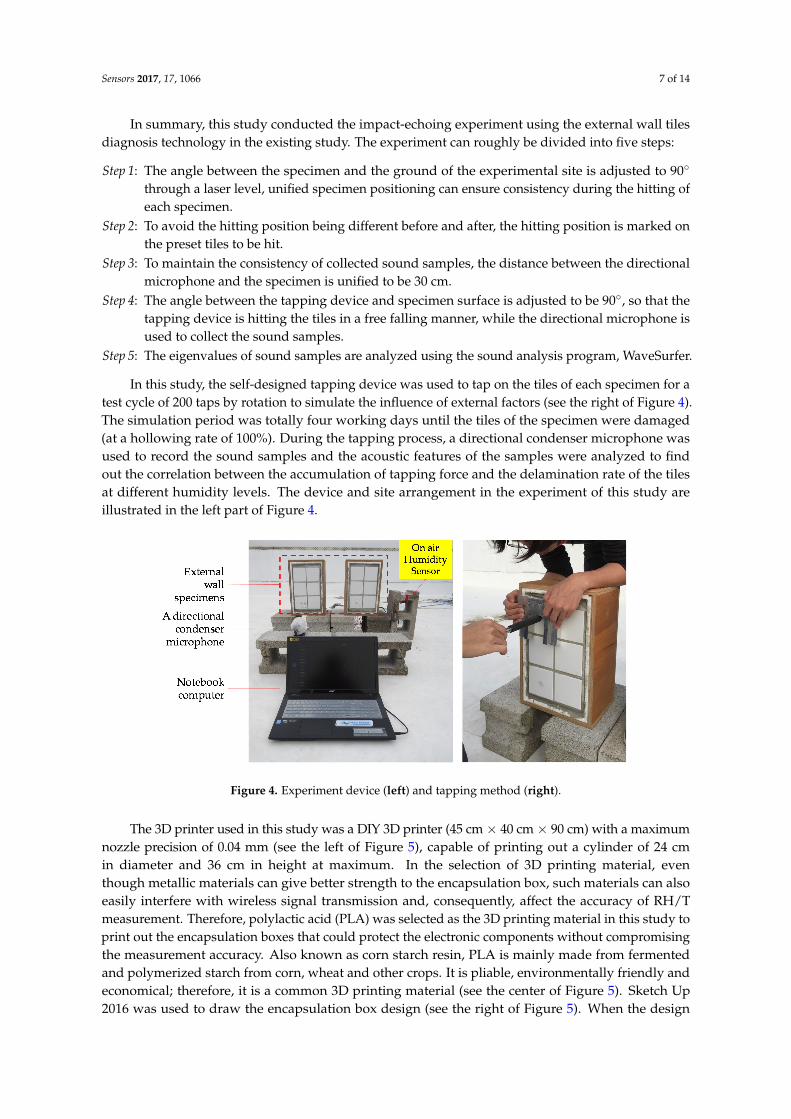
In this study, the self-designed tapping device was used to tap on the tiles of each specimen for atest cycle of 200 taps by rotation to simulate the influence of external factors (see the right of Figure 4).The simulation period was totally four working days until the tiles of the specimen were damaged(at a hollowing rate of 100%). During the tapping process, a directional condenser microphone wasused to record the sound samples and the acoustic features of the samples were analyzed to findout the correlation between the accumulation of tapping force and the delamination rate of the tilesat different humidity levels. The device and site arrangement in the experiment of this study areillustrated in the left part of Figure 4.
Sensors 2017, 17, 1066 7 of 14
Step 3: To maintain the consistency of collected sound samples, the distance between the directional microphone and the specimen is unified to be 30 cm.
Step 4: The angle between the tapping device and specimen surface is adjusted to be 90°, so that the tapping device is hitting the tiles in a free falling manner, while the directional microphone is used to collect the sound samples.
Step 5: The eigenvalues of sound samples are analyzed using the sound analysis program, WaveSurfer.
In this study, the self-designed tapping device was used to tap on the tiles of each specimen for a test cycle of 200 taps by rotation to simulate the influence of external factors (see the right of Figure 4). The simulation period was totally four working days until the tiles of the specimen were damaged (at a hollowing rate of 100%). During the tapping process, a directional condenser microphone was used to record the sound samples and the acoustic features of the samples were analyzed to find out the correlation between the accumulation of tapping force and the delamination rate of the tiles at different humidity levels. The device and site arrangement in the experiment of this study are illustrated in the left part of Figure 4.
Figure 4. Experiment device (left) and tapping method (right).
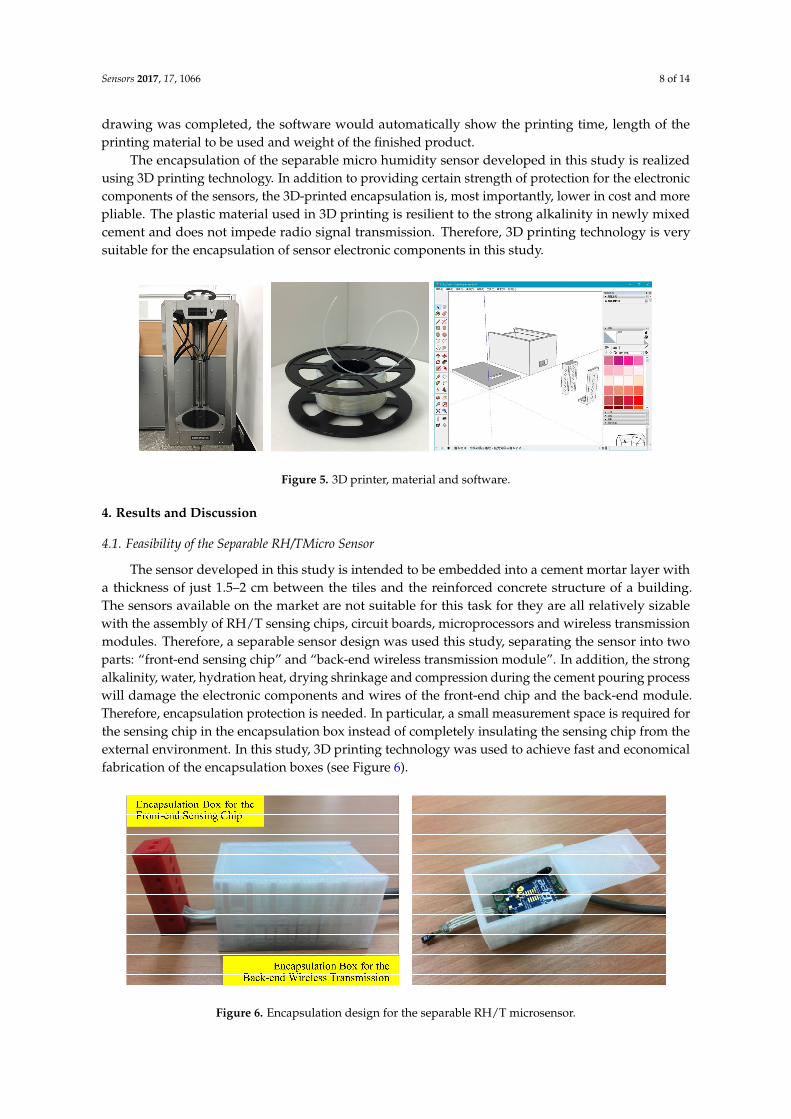
The 3D printer used in this study was a DIY 3D printer (45 cm × 40 cm × 90 cm) with a maximum nozzle precision of 0.04 mm (see the left of Figure 5), capable of printing out a cylinder of 24 cm in diameter and 36 cm in height at maximum. In the selection of 3D printing material, even though metallic materials can give better strength to the encapsulation box, such materials can also easily interfere with wireless signal transmission and, consequently, affect the accuracy of RH/T measurement. Therefore, polylactic acid (PLA) was selected as the 3D printing material in this study to print out the encapsulation boxes that could protect the electronic components without compromising the measurement accuracy. Also known as corn starch resin, PLA is mainly made from fermented and polymerized starch from corn, wheat and other crops. It is pliable, environmentally friendly and economical; therefore, it is a common 3D printing material (see the center of Figure 5). Sketch Up 2016 was used to draw the encapsulation box design (see the right of Figure 5). When the design drawing was completed, the software would automatically show the printing time, length of the printing material to be used and weight of the finished product.
The encapsulation of the separable micro humidity sensor developed in this study is realized using 3D printing technology. In addition to providing certain strength of protection for the electronic components of the sensors, the 3D-printed encapsulation is, most importantly, lower in cost and more pliable. The plastic material used in 3D printing is resilient to the strong alkalinity in newly mixed cement and does not impede radio signal transmission. Therefore, 3D printing technology is very suitable for the encapsulation of sensor electronic components in this study.
Figure 4. Experiment device (left) and tapping method (right).
The 3D printer used in this study was a DIY 3D printer (45 cm × 40 cm × 90 cm) with a maximumnozzle precision of 0.04 mm (see the left of Figure 5), capable of printing out a cylinder of 24 cmin diameter and 36 cm in height at maximum. In the selection of 3D printing material, eventhough metallic materials can give better strength to the encapsulation box, such materials can alsoeasily interfere with wireless signal transmission and, consequently, affect the accuracy of RH/Tmeasurement. Therefore, polylactic acid (PLA) was selected as the 3D printing material in this study toprint out the encapsulation boxes that could protect the electronic components without compromisingthe measurement accuracy. Also known as corn starch resin, PLA is mainly made from fermentedand polymerized starch from corn, wheat and other crops. It is pliable, environmentally friendly andeconomical; therefore, it is a common 3D printing material (see the center of Figure 5). Sketch Up2016 was used to draw the encapsulation box design (see the right of Figure 5). When the design
Sensors 2017, 17, 1066 8 of 14
drawing was completed, the software would automatically show the printing time, length of theprinting material to be used and weight of the finished product.
The encapsulation of the separable micro humidity sensor developed in this study is realizedusing 3D printing technology. In addition to providing certain strength of protection for the electroniccomponents of the sensors, the 3D-printed encapsulation is, most importantly, lower in cost and morepliable. The plastic material used in 3D printing is resilient to the strong alkalinity in newly mixedcement and does not impede radio signal transmission. Therefore, 3D printing technology is verysuitable for the encapsulation of sensor electronic components in this study.Sensors 2017, 17, 1066 8 of 14
Figure 5. 3D printer, material and software.
4. Results and Discussion
4.1. Feasibility of the Separable RH/TMicro Sensor
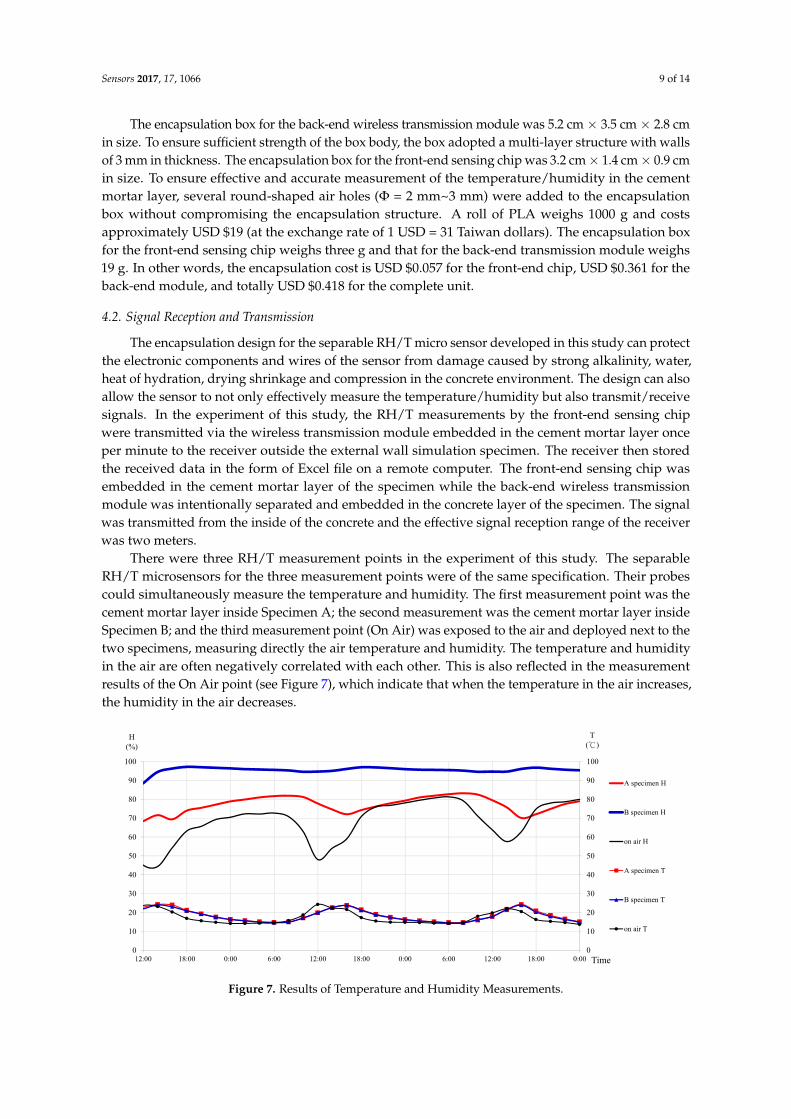
The sensor developed in this study is intended to be embedded into a cement mortar layer with a thickness of just 1.5–2 cm between the tiles and the reinforced concrete structure of a building. The sensors available on the market are not suitable for this task for they are all relatively sizable with the assembly of RH/T sensing chips, circuit boards, microprocessors and wireless transmission modules. Therefore, a separable sensor design was used this study, separating the sensor into two parts: “front-end sensing chip” and “back-end wireless transmission module”. In addition, the strong alkalinity, water, hydration heat, drying shrinkage and compression during the cement pouring process will damage the electronic components and wires of the front-end chip and the back-end module. Therefore, encapsulation protection is needed. In particular, a small measurement space is required for the sensing chip in the encapsulation box instead of completely insulating the sensing chip from the external environment. In this study, 3D printing technology was used to achieve fast and economical fabrication of the encapsulation boxes (see Figure 6).
Figure 6. Encapsulation design for the separable RH/T microsensor.
The encapsulation box for the back-end wireless transmission module was 5.2 cm × 3.5 cm × 2.8 cm in size. To ensure sufficient strength of the box body, the box adopted a multi-layer structure with walls of 3 mm in thickness. The encapsulation box for the front-end sensing chip was 3.2 cm × 1.4 cm × 0.9 cm in size. To ensure effective and accurate measurement of the temperature/humidity in the cement mortar layer, several round-shaped air holes (Φ = 2 mm~3 mm) were added to the encapsulation box without compromising the encapsulation structure. A roll of PLA weighs 1000 g and costs approximately USD $19 (at the exchange rate of 1 USD = 31 Taiwan dollars). The encapsulation box for the front-end sensing chip weighs three g and that for the back-end
Figure 5. 3D printer, material and software.
4. Results and Discussion
4.1. Feasibility of the Separable RH/TMicro Sensor
The sensor developed in this study is intended to be embedded into a cement mortar layer witha thickness of just 1.5–2 cm between the tiles and the reinforced concrete structure of a building.The sensors available on the market are not suitable for this task for they are all relatively sizablewith the assembly of RH/T sensing chips, circuit boards, microprocessors and wireless transmissionmodules. Therefore, a separable sensor design was used this study, separating the sensor into twoparts: “front-end sensing chip” and “back-end wireless transmission module”. In addition, the strongalkalinity, water, hydration heat, drying shrinkage and compression during the cement pouring processwill damage the electronic components and wires of the front-end chip and the back-end module.Therefore, encapsulation protection is needed. In particular, a small measurement space is required forthe sensing chip in the encapsulation box instead of completely insulating the sensing chip from theexternal environment. In this study, 3D printing technology was used to achieve fast and economicalfabrication of the encapsulation boxes (see Figure 6).
Sensors 2017, 17, 1066 8 of 14
Figure 5. 3D printer, material and software.
4. Results and Discussion
4.1. Feasibility of the Separable RH/TMicro Sensor
The sensor developed in this study is intended to be embedded into a cement mortar layer with a thickness of just 1.5–2 cm between the tiles and the reinforced concrete structure of a building. The sensors available on the market are not suitable for this task for they are all relatively sizable with the assembly of RH/T sensing chips, circuit boards, microprocessors and wireless transmission modules. Therefore, a separable sensor design was used this study, separating the sensor into two parts: “front-end sensing chip” and “back-end wireless transmission module”. In addition, the strong alkalinity, water, hydration heat, drying shrinkage and compression during the cement pouring process will damage the electronic components and wires of the front-end chip and the back-end module. Therefore, encapsulation protection is needed. In particular, a small measurement space is required for the sensing chip in the encapsulation box instead of completely insulating the sensing chip from the external environment. In this study, 3D printing technology was used to achieve fast and economical fabrication of the encapsulation boxes (see Figure 6).
Figure 6. Encapsulation design for the separable RH/T microsensor.
The encapsulation box for the back-end wireless transmission module was 5.2 cm × 3.5 cm × 2.8 cm in size. To ensure sufficient strength of the box body, the box adopted a multi-layer structure with walls of 3 mm in thickness. The encapsulation box for the front-end sensing chip was 3.2 cm × 1.4 cm × 0.9 cm in size. To ensure effective and accurate measurement of the temperature/humidity in the cement mortar layer, several round-shaped air holes (Φ = 2 mm~3 mm) were added to the encapsulation box without compromising the encapsulation structure. A roll of PLA weighs 1000 g and costs approximately USD $19 (at the exchange rate of 1 USD = 31 Taiwan dollars). The encapsulation box for the front-end sensing chip weighs three g and that for the back-end
Figure 6. Encapsulation design for the separable RH/T microsensor.
Sensors 2017, 17, 1066 9 of 14
The encapsulation box for the back-end wireless transmission module was 5.2 cm × 3.5 cm × 2.8 cmin size. To ensure sufficient strength of the box body, the box adopted a multi-layer structure with wallsof 3 mm in thickness. The encapsulation box for the front-end sensing chip was 3.2 cm × 1.4 cm × 0.9 cmin size. To ensure effective and accurate measurement of the temperature/humidity in the cementmortar layer, several round-shaped air holes (Φ = 2 mm~3 mm) were added to the encapsulationbox without compromising the encapsulation structure. A roll of PLA weighs 1000 g and costsapproximately USD $19 (at the exchange rate of 1 USD = 31 Taiwan dollars). The encapsulation boxfor the front-end sensing chip weighs three g and that for the back-end transmission module weighs19 g. In other words, the encapsulation cost is USD $0.057 for the front-end chip, USD $0.361 for theback-end module, and totally USD $0.418 for the complete unit.
4.2. Signal Reception and Transmission
The encapsulation design for the separable RH/T micro sensor developed in this study can protectthe electronic components and wires of the sensor from damage caused by strong alkalinity, water,heat of hydration, drying shrinkage and compression in the concrete environment. The design can alsoallow the sensor to not only effectively measure the temperature/humidity but also transmit/receivesignals. In the experiment of this study, the RH/T measurements by the front-end sensing chipwere transmitted via the wireless transmission module embedded in the cement mortar layer onceper minute to the receiver outside the external wall simulation specimen. The receiver then storedthe received data in the form of Excel file on a remote computer. The front-end sensing chip wasembedded in the cement mortar layer of the specimen while the back-end wireless transmissionmodule was intentionally separated and embedded in the concrete layer of the specimen. The signalwas transmitted from the inside of the concrete and the effective signal reception range of the receiverwas two meters.
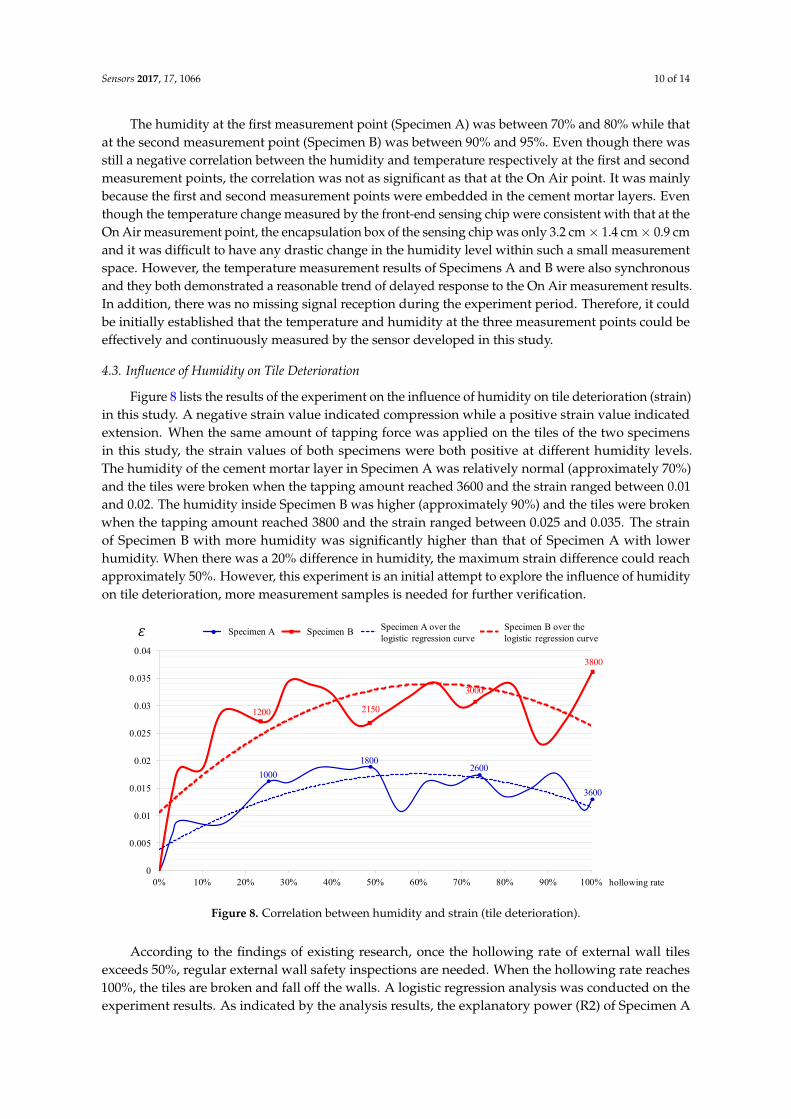
There were three RH/T measurement points in the experiment of this study. The separableRH/T microsensors for the three measurement points were of the same specification. Their probescould simultaneously measure the temperature and humidity. The first measurement point was thecement mortar layer inside Specimen A; the second measurement was the cement mortar layer insideSpecimen B; and the third measurement point (On Air) was exposed to the air and deployed next to thetwo specimens, measuring directly the air temperature and humidity. The temperature and humidityin the air are often negatively correlated with each other. This is also reflected in the measurementresults of the On Air point (see Figure 7), which indicate that when the temperature in the air increases,the humidity in the air decreases.
Sensors 2017, 17, 1066 9 of 14
transmission module weighs 19 g. In other words, the encapsulation cost is USD $0.057 for the front-end chip, USD $0.361 for the back-end module, and totally USD $0.418 for the complete unit.
4.2. Signal Reception and Transmission
The encapsulation design for the separable RH/T micro sensor developed in this study can protect the electronic components and wires of the sensor from damage caused by strong alkalinity, water, heat of hydration, drying shrinkage and compression in the concrete environment. The design can also allow the sensor to not only effectively measure the temperature/humidity but also transmit/receive signals. In the experiment of this study, the RH/T measurements by the front-end sensing chip were transmitted via the wireless transmission module embedded in the cement mortar layer once per minute to the receiver outside the external wall simulation specimen. The receiver then stored the received data in the form of Excel file on a remote computer. The front-end sensing chip was embedded in the cement mortar layer of the specimen while the back-end wireless transmission module was intentionally separated and embedded in the concrete layer of the specimen. The signal was transmitted from the inside of the concrete and the effective signal reception range of the receiver was two meters.
There were three RH/T measurement points in the experiment of this study. The separable RH/T microsensors for the three measurement points were of the same specification. Their probes could simultaneously measure the temperature and humidity. The first measurement point was the cement mortar layer inside Specimen A; the second measurement was the cement mortar layer inside Specimen B; and the third measurement point (On Air) was exposed to the air and deployed next to the two specimens, measuring directly the air temperature and humidity. The temperature and humidity in the air are often negatively correlated with each other. This is also reflected in the measurement results of the On Air point (see Figure 7), which indicate that when the temperature in the air increases, the humidity in the air decreases.
Figure 7. Results of Temperature and Humidity Measurements.
The humidity at the first measurement point (Specimen A) was between 70% and 80% while that at the second measurement point (Specimen B) was between 90% and 95%. Even though there was still a negative correlation between the humidity and temperature respectively at the first and second measurement points, the correlation was not as significant as that at the On Air point. It was mainly because the first and second measurement points were embedded in the cement mortar layers. Even though the temperature change measured by the front-end sensing chip were consistent with that at the On Air measurement point, the encapsulation box of the sensing chip was only 3.2 cm × 1.4 cm × 0.9 cm and it was difficult to have any drastic change in the humidity level within such a small measurement space. However, the temperature measurement results of
0
10
20
30
40
50
60
70
80
90
100
0
10
20
30
40
50
60
70
80
90
100
12:00 18:00 0:00 6:00 12:00 18:00 0:00 6:00 12:00 18:00 0:00
A specimen H
B specimen H
on air H
A specimen T
B specimen T
on air T
H(%)
T(℃)
Time
Figure 7. Results of Temperature and Humidity Measurements.
Sensors 2017, 17, 1066 10 of 14
The humidity at the first measurement point (Specimen A) was between 70% and 80% while thatat the second measurement point (Specimen B) was between 90% and 95%. Even though there wasstill a negative correlation between the humidity and temperature respectively at the first and secondmeasurement points, the correlation was not as significant as that at the On Air point. It was mainlybecause the first and second measurement points were embedded in the cement mortar layers. Eventhough the temperature change measured by the front-end sensing chip were consistent with that at theOn Air measurement point, the encapsulation box of the sensing chip was only 3.2 cm × 1.4 cm × 0.9 cmand it was difficult to have any drastic change in the humidity level within such a small measurementspace. However, the temperature measurement results of Specimens A and B were also synchronousand they both demonstrated a reasonable trend of delayed response to the On Air measurement results.In addition, there was no missing signal reception during the experiment period. Therefore, it couldbe initially established that the temperature and humidity at the three measurement points could beeffectively and continuously measured by the sensor developed in this study.
4.3. Influence of Humidity on Tile Deterioration
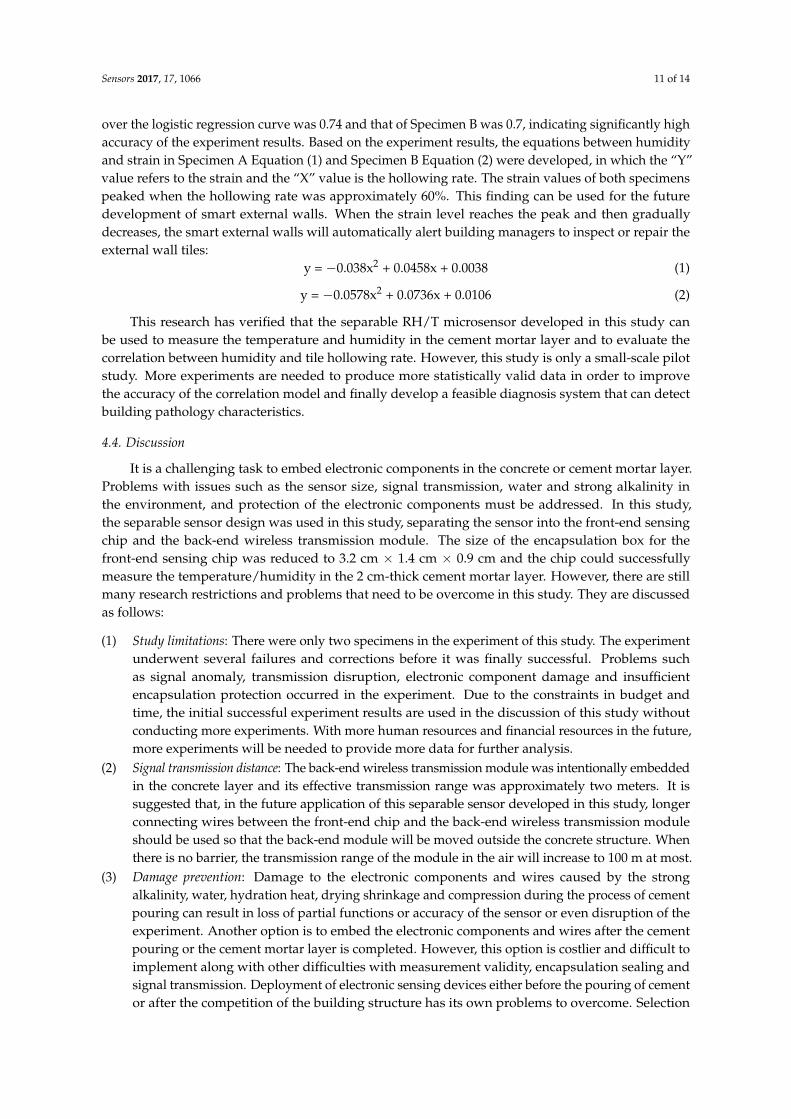
Figure 8 lists the results of the experiment on the influence of humidity on tile deterioration (strain)in this study. A negative strain value indicated compression while a positive strain value indicatedextension. When the same amount of tapping force was applied on the tiles of the two specimensin this study, the strain values of both specimens were both positive at different humidity levels.The humidity of the cement mortar layer in Specimen A was relatively normal (approximately 70%)and the tiles were broken when the tapping amount reached 3600 and the strain ranged between 0.01and 0.02. The humidity inside Specimen B was higher (approximately 90%) and the tiles were brokenwhen the tapping amount reached 3800 and the strain ranged between 0.025 and 0.035. The strainof Specimen B with more humidity was significantly higher than that of Specimen A with lowerhumidity. When there was a 20% difference in humidity, the maximum strain difference could reachapproximately 50%. However, this experiment is an initial attempt to explore the influence of humidityon tile deterioration, more measurement samples is needed for further verification.
Sensors 2017, 17, 1066 10 of 14
Specimens A and B were also synchronous and they both demonstrated a reasonable trend of delayed response to the On Air measurement results. In addition, there was no missing signal reception during the experiment period. Therefore, it could be initially established that the temperature and humidity at the three measurement points could be effectively and continuously measured by the sensor developed in this study.
4.3. Influence of Humidity on Tile Deterioration
Figure 8 lists the results of the experiment on the influence of humidity on tile deterioration (strain) in this study. A negative strain value indicated compression while a positive strain value indicated extension. When the same amount of tapping force was applied on the tiles of the two specimens in this study, the strain values of both specimens were both positive at different humidity levels. The humidity of the cement mortar layer in Specimen A was relatively normal (approximately 70%) and the tiles were broken when the tapping amount reached 3600 and the strain ranged between 0.01 and 0.02. The humidity inside Specimen B was higher (approximately 90%) and the tiles were broken when the tapping amount reached 3800 and the strain ranged between 0.025 and 0.035. The strain of Specimen B with more humidity was significantly higher than that of Specimen A with lower humidity. When there was a 20% difference in humidity, the maximum strain difference could reach approximately 50%. However, this experiment is an initial attempt to explore the influence of humidity on tile deterioration, more measurement samples is needed for further verification.
Figure 8. Correlation between humidity and strain (tile deterioration).
According to the findings of existing research, once the hollowing rate of external wall tiles exceeds 50%, regular external wall safety inspections are needed. When the hollowing rate reaches 100%, the tiles are broken and fall off the walls. A logistic regression analysis was conducted on the experiment results. As indicated by the analysis results, the explanatory power (R2) of Specimen A over the logistic regression curve was 0.74 and that of Specimen B was 0.7, indicating significantly high accuracy of the experiment results. Based on the experiment results, the equations between humidity and strain in Specimen A Equation (1) and Specimen B Equation (2) were developed, in which the “Y” value refers to the strain and the “X” value is the hollowing rate. The strain values of both specimens peaked when the hollowing rate was approximately 60%. This finding can be used for the future development of smart external walls. When the strain level reaches the peak and then gradually decreases, the smart external walls will automatically alert building managers to inspect or repair the external wall tiles:
0
0.005
0.01
0.015
0.02
0.025
0.03
0.035
0.04
0% 10% 20% 30% 40% 50% 60% 70% 80% 90% 100%
L1B L1C 多項式(L1B) 多項式(L1C)
3800
21501200
3000
3600
18002600
1000
hollowing rate
Specimen A Specimen B Specimen A over the logistic regression curve
Specimen B over the logistic regression curve
Figure 8. Correlation between humidity and strain (tile deterioration).
According to the findings of existing research, once the hollowing rate of external wall tilesexceeds 50%, regular external wall safety inspections are needed. When the hollowing rate reaches100%, the tiles are broken and fall off the walls. A logistic regression analysis was conducted on theexperiment results. As indicated by the analysis results, the explanatory power (R2) of Specimen A
Sensors 2017, 17, 1066 11 of 14
over the logistic regression curve was 0.74 and that of Specimen B was 0.7, indicating significantly highaccuracy of the experiment results. Based on the experiment results, the equations between humidityand strain in Specimen A Equation (1) and Specimen B Equation (2) were developed, in which the “Y”value refers to the strain and the “X” value is the hollowing rate. The strain values of both specimenspeaked when the hollowing rate was approximately 60%. This finding can be used for the futuredevelopment of smart external walls. When the strain level reaches the peak and then graduallydecreases, the smart external walls will automatically alert building managers to inspect or repair theexternal wall tiles:
y = −0.038x2 + 0.0458x + 0.0038 (1)
y = −0.0578x2 + 0.0736x + 0.0106 (2)
This research has verified that the separable RH/T microsensor developed in this study canbe used to measure the temperature and humidity in the cement mortar layer and to evaluate thecorrelation between humidity and tile hollowing rate. However, this study is only a small-scale pilotstudy. More experiments are needed to produce more statistically valid data in order to improvethe accuracy of the correlation model and finally develop a feasible diagnosis system that can detectbuilding pathology characteristics.
4.4. Discussion
It is a challenging task to embed electronic components in the concrete or cement mortar layer.Problems with issues such as the sensor size, signal transmission, water and strong alkalinity inthe environment, and protection of the electronic components must be addressed. In this study,the separable sensor design was used in this study, separating the sensor into the front-end sensingchip and the back-end wireless transmission module. The size of the encapsulation box for thefront-end sensing chip was reduced to 3.2 cm × 1.4 cm × 0.9 cm and the chip could successfullymeasure the temperature/humidity in the 2 cm-thick cement mortar layer. However, there are stillmany research restrictions and problems that need to be overcome in this study. They are discussedas follows:
(1) Study limitations: There were only two specimens in the experiment of this study. The experimentunderwent several failures and corrections before it was finally successful. Problems suchas signal anomaly, transmission disruption, electronic component damage and insufficientencapsulation protection occurred in the experiment. Due to the constraints in budget andtime, the initial successful experiment results are used in the discussion of this study withoutconducting more experiments. With more human resources and financial resources in the future,more experiments will be needed to provide more data for further analysis.
(2) Signal transmission distance: The back-end wireless transmission module was intentionally embeddedin the concrete layer and its effective transmission range was approximately two meters. It issuggested that, in the future application of this separable sensor developed in this study, longerconnecting wires between the front-end chip and the back-end wireless transmission moduleshould be used so that the back-end module will be moved outside the concrete structure. Whenthere is no barrier, the transmission range of the module in the air will increase to 100 m at most.
(3) Damage prevention: Damage to the electronic components and wires caused by the strongalkalinity, water, hydration heat, drying shrinkage and compression during the process of cementpouring can result in loss of partial functions or accuracy of the sensor or even disruption of theexperiment. Another option is to embed the electronic components and wires after the cementpouring or the cement mortar layer is completed. However, this option is costlier and difficult toimplement along with other difficulties with measurement validity, encapsulation sealing andsignal transmission. Deployment of electronic sensing devices either before the pouring of cementor after the competition of the building structure has its own problems to overcome. Selection
Sensors 2017, 17, 1066 12 of 14
of which option to use must consider the requirements of each case as well as the technologicalfeasibility, economic benefits and ease of maintenance.
(4) Improvement of encapsulation: 3D printing technology was used in this study to provide encapsulationprotection for the front-end sensing chip and the back-end wireless transmission module.The internal space of the encapsulation box for the front-end chip was 28 mm × 10 mm × 4.5 mm(1.26 cm3 in volume) with several air holes (Φ = 2 mm~3 mm) on its walls. Even thoughthe encapsulation box for the front-end chip was proven feasible, water or strongly alkalineliquid running through the air holes could still easily damage the chip. To solve this problem,improvements can be made with the adjustment of the air hole (such as changing the shape,size, location and orientation of the air hole) or with the use of innovative air hole screeningmaterials (such as breathable fiber fabrics). In this study, the compression on the encapsulationbox was not severe. However, it is research-worthy to design an easy-to-repair encapsulation boxin the future.
5. Conclusions and Suggestions
The goal of this study is to solve the problems of RH/T measurement in limited spaces in concretestructures. A separable RH/T microsensor was developed in this study. The sensor was composed ofa front-end sensing chip and a back-end wireless transmission module. 3D printing technology wasused to produce encapsulation boxes for the front-end chip, the back-end module and the connectingwire in between, protecting them from damage caused by the compression, strong alkalinity andmoisture from the cement mortar and concrete layers. The 3D-printed encapsulation box used in thisstudy at a total cost of USD $0.418 each is very cost-effective. The 3D design software required forthis encapsulation box is for free and easily accessible. The form, specification, material and color ofthe encapsulation box can be easily changed as well. For the research on how to protect electroniccomponents to be embedded in concrete structures, 3D printing is a very useful and economical tool.
Even though it was verified that the separable microsensor developed in this study is capable ofcontinuously measuring the temperature and humidity in the cement mortar layer and its measurementresults can be used to analyze the correlation between humidity and tile deterioration, this study isonly a small-scale pilot study. More experiments and studies are needed in the future to producemore statistically reliable and valid data in order to improve the accuracy of the correlation modeland finally develop a feasible diagnosis system that can detect characteristics of building pathology.In addition, future research is suggested to incorporate the IoT technology with different sensorsmonitoring the temperature, humidity, strain, and sunlight exposure inside and outside the building.With the development of smart external walls capable of self-diagnosing based on the characteristicsof tile deterioration, we will be a step closer to the future of people living in smart buildings that willself-diagnose the deterioration of their external wall tiles and automatically report to the buildingmanagers to ensure better public safety management for everyone in the city.
Acknowledgments: The research team acknowledges with gratitude the 2016 research grant issued by theMinistry of Science and Technology (Project No: MOST 105-2221-E-035-019-).
Author Contributions: Chih-Yuan Chang designed the experiments, analyzed the data and wrote the paper.
Conflicts of Interest: The authors declare no conflict of interest.
References
1. Tiles Falling from a Building Injured a Child and Brought a Lawsuit against the 12 Households Living in theBuilding. Available online: https://goo.gl/MmpHRF (accessed on 21 February 2017).
2. Tile Showers: Tiles Falling from 67 Buildings in Taiwan during a Cold Front Passage. Available online:https://goo.gl/T5BHuC (accessed on 21 February 2017).
3. Tall Buildings Aged ≥ 15 Years or Those with Stone-Based Exterior Walls in Taipei Will Undergo MandatoryRegular Checkups. Available online: https://goo.gl/xGJw5w (accessed on 21 February 2017).
Sensors 2017, 17, 1066 13 of 14
4. Chang, C.Y. The Concept and Implements for Building Medicine. Ph.D. Dissertation, National TaiwanUniversity, Taipei, Taiwan, 2006.
5. Yiu, C.Y.; Ho, D.C.; Lo, S.M. Weathering effects on external wall tiling systems. Constr. Build. Mater. 2007, 21,594–600. [CrossRef]
6. Tamimi, A.K.; Abdalla, J.A.; Sakka, Z.I. Prediction of long term chloride diffusion of concrete in harshenvironment. Constr. Build. Mater. 2008, 22, 829–836. [CrossRef]
7. Chew, M.Y.L. Defect analysis in wet areas of buildings. Constr. Build. Mater. 2005, 19, 165–173. [CrossRef]8. Ali, A.S.; Zanzinger, Z.; Debose, D.; Stephens, B. Open Source Building Science Sensors (OSBSS): A low-cost
Arduino-based platform for long-term indoor environmental data collection. Build. Environ. 2016, 100,114–126. [CrossRef]
9. Yun, J.; Won, K.H. Won Building Environment Analysis Based on Temperature and Humidity for SmartEnergy Systems. Sensors 2012, 12, 13458–13470. [CrossRef] [PubMed]
10. Mesas-Carrascosa, F.J.; Santano, D.V.; De Larriva, J.E.M.; Cordero, R.O.; Fernandez, R.E.H.; Garcia-Ferrer, A.Monitoring Heritage Buildings with Open Source Hardware Sensors: A Case Study of the Mosque-Cathedralof Córdoba. Sensors 2016, 16, 1620. [CrossRef] [PubMed]
11. Chang, C.Y.; Hung, S.S.; Peng, Y.F. An Evaluation of the Embedment of a Radio Frequency IntegratedCircuit with a Temperature Detector in Building Envelopes for Energy Conservation. Energy Build. 2011, 43,2900–2907. [CrossRef]
12. Hung, S.S.; Chang, C.Y.; Hsu, C.J.; Chen, S.W. Analysis of Building Envelope Insulation PerformanceUtilizing Integrated Temperature and Humidity Sensors. Sensors 2012, 12, 8987–9005. [CrossRef] [PubMed]
13. Chang, C.Y. Using STIM in Concrete to Evaluate the Varying Thermal Insulation Efficiency of Roof MaterialsCaused by Climatic Factors in Taiwan. Sens. Transducers J. 2014, 173, 132–143.
14. Barroca, N.; Borges, L.M.; Velez, F.J.; Monteiro, F.; Górski, M.; Castro-Gomes, J. Wireless sensor networks fortemperature and humidity monitoring within concrete structures. Constr. Build. Mater. 2013, 40, 1156–1166.[CrossRef]
15. Zhou, S.; Deng, F.; Yu, L.; Li, B.; Wu, X.; Yin, B. A Novel Passive Wireless Sensor for Concrete HumidityMonitoring. Sensors 2016, 16, 1535. [CrossRef] [PubMed]
16. Ranz, J.; Aparicio, S.; Fuente, J.V.; Anaya, J.J.; Hernández, M.G. Monitoring of the curing process in precastconcrete slabs: An experimental study. Constr. Build. Mater. 2016, 122, 406–416. [CrossRef]
17. Castro-Borges, P; Veleva, L. Time of Wetness and HR-T Complex as Tools for Corrosion Risk Evaluation in aConcrete Block Exposed to a Humid Tropical Environment. Rev. De La Constr. 2015, 14, 65–71. [CrossRef]
18. Zhang, J.; Huang, Y.; Qi, K.; Gao, Y. Interior Relative Humidity of Normal- and High-Strength Concrete atEarly Age. J. Mater. Civ. Eng. 2012, 24, 615–622. [CrossRef]
19. Gao, X.J.; Yang, Y.Z.; Deng, H.W. Shrinkage Strain Distribution in High Strength Concrete with One SurfaceExposed to Different Relative Humidity. Rev. Romana De Mater. Rom. J. Mater. 2011, 41, 316–324.
20. Ryu, D.W.; Ko, J.W.; Noguchi, T. Effects of simulated environmental conditions on the internal relativehumidity and relative moisture content distribution of exposed concrete. Cem. Concr. Compos. 2011, 33,142–153. [CrossRef]
21. Sanchez, J.; Andrade, C.; Fullea, J. Hydrothermal monitoring using embedded sensors of the actual roofsystem of the Prado Museum. Constr. Build. Mater. 2010, 24, 2579–2589. [CrossRef]
22. Kim, S.S.; Park, J.S.; Go, S.J.; Ro, H.J. Design and Development of Strain Measurement System Based onZigbee Wireless Network. J. Korea Inst. Electron. Commun. Sci. 2012, 7, 585–590.
23. Lin, S.-T. A Study of the Causes and Solutions for Falling External Wall Tiles. Archit. Technol. Suppl. Edit.Space Mag. 1993, 4, 284–291.
24. Kao, T.-I. A Research and Innovation of the External Wall Tile Deterioration on the Building—For Example with theUniversity School Building; National Cheng Kung University: Tainan, Taiwan, 2000.
25. Lin, L.-D. A Research on the Degradation of Ceramic Titles of External Walls and the Establishment of the EvaluationTools for Residential Collection; National Taipei University of Technology: Taipei, Taiwan, 2012.
26. Chiang, L.W.; Guo, S.J.; Chang, C.Y.; Lo, T.P. The Development of a Diagnostic Model for the Deteriorationof External Wall Tiles of Aged Buildings in Taiwan. J. Asian Archt. Build. Eng. 2016, 15, 111–118. [CrossRef]
27. Chew, M.Y.L. Factors affecting ceramic tile adhesion for external cladding. J. Constr. Build. Mater. 1999, 13,293–296. [CrossRef]
Sensors 2017, 17, 1066 14 of 14
28. Luk, B.L.; Liu, K.P.; Tong, F. Rapid evaluation of tile-wall bonding integrity using multiple-head impactacoustic method. NDT E Int. 2011, 44, 297–304. [CrossRef]
29. Jiang, Z.D.; Luk, B.L.; Liu, K.P. Bisector-based impact acoustic non-destructive evaluation. NDT E Int. 2009,42, 652–657. [CrossRef]
30. Liu, K.P.; Luk, B.L.; Tong, F.; Chan, Y.T. Application of service robots for building NDT inspection tasks.Ind. Robot 2011, 38, 58–65. [CrossRef]
31. Lai, W.W.L.; Lee, K.K.; Poon, C.S. Validation of size estimation of debonds in external wall’s compositefinishes via passive Infrared thermography and a gradient algorithm. Constr. Build. Mater. 2015, 87, 113–124.[CrossRef]
32. Khan, F.; Rajaram, S.; Vanniamparambil, P.A.; Bolhassani, M.; Hamid, A.; Kontsos, A.; Bartoli, I. Multi-sensingNDT for damage assessment of concrete masonry walls. Struct. Control Health Monit. 2015, 22, 449–462.[CrossRef]
33. Tong, F.; Tso, S.K.; Hung, M.Y.Y. Impact-acoustics-based health monitoring of tile-wall bonding integrityusing principal component analysis. J. Sound Vib. 2006, 294, 329–340. [CrossRef]
34. Bushell, J.; Sherlock, P.; Mummery, P.; Bellin, B.; Zacchia, F. An investigation of pulsed phase thermographyfor detection of debonds in HIP-bonded beryllium tiles in ITER normal heat flux first wall (NHF FW)components. Fusion Eng. Des. 2015, 98–99, 1244–1249. [CrossRef]
35. Chang, C.Y.; Yan, J.C. A Feasibility Study on the Use of Acoustic Energy Analysis for External WallTile Deterioration Diagnosis. In Proceedings of the 17th Symposium on Construction Engineering andManagement, Taipei, Taiwan, 28 June 2013.
36. Chang, C.Y.; Yei, R.J. An Acoustic Evaluation Model for Building Exterior Wall Diagnosis. In Proceedingsof the 8th Taiwan Institute of Property Management Thesis Presentation Conference, Taipei, Taiwan,31 May 2014.
37. Lee, Y.S.; Yang, Z.S.; Siao, H.Y.; Chang, C.Y. Feasibility of the Application of Acoustic FingerprintingTechnology in Civil Engineering—A Case Study of Building External Wall Diagnosis. In Proceedings of the19th Symposium on Construction Engineering and Management, Kaohsiung, Taiwan, 3 July 2015.
© 2017 by the author. Licensee MDPI, Basel, Switzerland. This article is an open accessarticle distributed under the terms and conditions of the Creative Commons Attribution(CC BY) license (http://creativecommons.org/licenses/by/4.0/).


![Almost transitive and almost homogeneous Separable Banach ... · in some separable almost transitive Banach space ([9]). A classical example of an almost homogeneous separable Banach](https://img.pdfslide.net/doc/110x75/60213e540d9f2439067866c2/almost-transitive-and-almost-homogeneous-separable-banach-in-some-separable.jpg)