Embed Size (px)
Citation preview
MATERIALS AND METHODS
2. MATERIALS AND METHODS
2.1. ISOLATION AND SELECTION OF A PHENOL DEGRADING STRAIN BY ENRICHMENT CULTURE
2.1.1 Sample collection
Soil samples were collectc?d from domestic laundry premises of
Kottayam town, Kerala.
2.1.2. Screening of phenol tolerating strains
109 soil collected from the detergent contaminated area was mixed with
90 ml of sterilized distilled water coitaining I mM phenol and was incubated in
a rotary shaker at 150 rpm at room temperature (30 * 2%) for 24 hours. The
soil samples were subjected to serial dilution using sterile distilled water and
were pour plated with nutrient agar medium (appendix V). The plates were
incubated at room temperature for 48 hours and the colony wunt was taken
(Ali et a/., 1998).The same procedure was repeated by the enrichment of the
soil extract progressively with 2wM, 5mM and lOmM phenol concentration
and the respective colony counts were taken.
2.1.3. Screening of the phenol degrading strains
All the 40 * 4 colonies isolated by soil enrichment technique were
individually inoculated into 10n11 of the Mineral Salt Phenol Medium
(MSPM) with ImM phenol conc:entration. The composition of the basal
medium used was l g KHZPO4, 1g(NH4)2S04, 0.5 g Mg S04. 7H20 and
0.001g CaC12 in 1 litre of the distilled water at pH 7. The tubes were
incubated on a rotary shaker at 150 rpm at room temperature (30 * 2%) for 2 days .The isolates, which showed growth in the broth and also on
plating with phenol containing nutrient agar medium were used to inoculate
individually into MSPM with 2mM phenol concentration. The same
procedure was repeated and ihe isolates, which showed growth, were
inoculated into MSPM with 5mM phenol concentration. The same
procedure was repeated with .OmM phenol containing MSPM. The
colonies, which showed growth in MSPM enriched with lOmM phenol
concentration was selected as the phenol degrading strains. The selected
cultures were purified by repeateaj streaking and were stored at 2 0 ' ~ in
50mM KH2POdK2HP04 buffer at pH 7.2 containing 20% (vlv) glycerol.
Working cultures were maintained by sub culturing every two weeks on
mineral salt agar slants plate and broth containing phenol at lOmM
concentration (Ali, et a/. 1998).
2.1.4. Selection of the most efficient strain for the biodegradation of phenol
The selection of the most efficient strain was done by inoculating
the mineral salt phenol medium .at lOmM phenol concentration with the
seven primary screened isolates. Phenol estimation was done at regular
intervals of 12 hours for five consecutive days and the strain, which gave
maximum degradation in minimurn incubation time, was selected as the
most efficient strain. All the isola-ies showed consistent growth upto five
days in MSPM with lOmM phenol concentration and were taken for
identification.
2.1.5. Phenol assay
Phenol concentrations were determined by a modified
spectrophotometric technique, based on a standard method for phenol
estimations (Mordocco et a/, 1999). From the phenol standards of known
concentrations different aliquots were taken in clean test tubes. The
aliquots were made into 5 ml using distilled water. To each of the
standards 50p1 2% Camino phenazone, 50~1, 25N ammonia solution and
25p1 8% potassium ferricyanide were added. The tubes were vortexed and
incubated for 15 minutes at room temperature (30 i 2OC). Optical density
was recorded at 500 nm (Shimadzu spectrophotometer) and a graph was
plotted with Optical Density on Y axis and phenol concentration on X axis.
The graph was used to calculate the unknown phenol concentrations.
2.2. IDENTIFICATION OF M E SELECTED BACTERIAL STRAINS
2.2.1 Morphological characteristics
The cell shape, size, arrangement and the spores of the isolated
bacterium were studied using the nticroscope.
2.2.2. Motility
Hanging drop slides were prepared from 18 h old nutrient broth
cultures and were observed under microscope.
2.2.3 Grams straining
Gram straining of all the isolated bacteria was done by the smear
prepared from 18 h old viable slant cultures. The slides were heat fixed
and treated with crystal violet for :30s. Rinsed gently in a stream of water,
allowed to dry, blotted, flooded with Grams iodine solution for 1 min,
washed with 95% alcohol for 20s and rinsed subsequently with water.
After drying it was flooded with saffranin as counter stain for 30 s, washed
gently with a stream of water, tllotted to dryness and observed under
immersion microscopes.
2.2.4. Biochemical tests
2.2.4.1 Carbohydrate fermentation
The ingredients (appendix I) were dissolved and pH was adjusted
to 7. Medium was sterilized at 15 lbs for 12 min, cooled and were
inoculated with the bacterial strain along with a control. The tubes were
incubated at 30 +- 2% for 48 h and the biochemical changes were noted.
2.2.4.2. Oxidation /Fermentation
Hugh Leifson's medium (appendix II) was melted and poured into
tubes. The tubes were sterilizer1 and cooled. Then the medium was
inoculated by stabbing on hard agar without allowing air bubbles to enter.
The slops were streaked with the same needle, incubated for 48h and
biochemical changes were observt?d.
2.2.4.3. Citrate test
The ingredients of citrate medium (appendix X) were dissolved,
transferred to culture tubes and sterilized at 15 lbs for 15 min. Agar slants
were streaked on the slants with sterile loop, incubated for 48 h at 3oe0C,
and the biochemical changes were noted.
2.2.4.4. lndole test
Tryptone broth was prepared (appendix XIII) poured into test tubes
and sterilized. The medium was inoculated with a loopful of culture and
incubated at 30 + 2OC for 48 h mixed with 3 ml of Kovac's reagent, shaken
well and allowed to stand for 5 mir!. The observations were recorded.
2.2.4.5. Methyl Red test (MR test)
The glucose phosphate broth (appendix Ill and IV) was sterilized
and inoculated with bacterial cult~re and incubated at room temperature
for 48 h. A few drops of methyl red indicator was added and observations
were noted.
2.2.4.6. Voges proskaeur test VP (test)
The tubes of glucose phosphate broth (appendix Ill and IV) were
inoculated with a loopful of bacterial cultures. The tubes were then
incubated at room temp for 48 h and 3 ml of 40% KOH solution was added.
The 0b~e~ations were noted.
2.2.4.7. Gelatin hydrolysis
Gelatin agar medium (appendix XIV and XV) was prepared
sterilized and was poured into pre-sterilized petriplates. The petriplates
were kept inverted for 24h and the bacterial cultures were inoculated by
streaking the surface. It was incubated at 30+iQ°C for 48 h and the medium
was flooded with 10 mi mercuric: chloride reagent. The changes were
noted.
2.2.4.8. Catalase test
A few drops of H2O2 was kept on a clean glass slide. A loopful of
isolated bacterial culture was placed into the drop and the observations
were noted.
2.2.4.9. Starch amylase test
Starch agar medium (appendix XI) was prepared, sterilized and
poured into presterilised petridishes. The petridishes were left for 24 h in
an inverted position for surface drying. The changes were noted. The
medium was inoculated with bacterial cultures by surface streaking
method. The petridishes were incubated at room temperature for two days.
The medium was flooded with geam's iodine solution and the changes
were noted.
2.2.4.10. Hydrogen sulfide production test
Sulfide indole motility aga, medium (appendix IX) was prepared,
poured into tubes and sterilized at 15 lbs for 15 min. The agar tubes were
stabbed with sterile needle containing bacterial culture and kept at 3 w 0 ~
for 48 h. The tubes were examined for presence or absence of black
precipitate along the line of inoculation and the observations were noted.
2.2.4.1 1. Triple sugar iron test
Ingradients of triple sugar iron agar medium (appendix XII) were
dissolved in 11 of dist. H,O and the pH was adjusted to 7.4. They were
distributed in tubes and were sterilized in an autoclave for 15 min at 121°C
under 151bs. The young cultures were stabbed and streaked over the
slop. Inoculated tubes were incubated at room temperature for 48 h and
the biochemical changes were noted.
2.2.4.12. Oxidase test
A piece of Whatman No: 2 filter paper was smeared with oxidase
test reagent (appendix VII). A loooful of organism were smeared over a
small area of the paper and the changes were noted.
2.3. OPTIMIZATION OF THE CONDITIONS OF PHENOL DEGRADATION
2.3.1. lnoculum preparation
One loopful of the culture was inoculated to 50 ml of peptone broth
containing 40 mM phenol. The flasks were incubated over night at room
temperature (30 * 2'~) at 150 rpm. From the culture the cells were
harvested by centrifugation. The pellets were collected and diluted using
physiological saline (0.86% NaCI) till the OD becomes 1. This was used as
the inoculum for process optimizatioai studies.
2.3.2. Effect of phenol concentration on speclfic growth rate
Growth curve of the organism at dierent phenol concentration
were obtained by inoculating 1%( vlv) of 1 OD bacterial suspension in
physiological saline into Mineral salt Phenol Medium at 20mM, 40mM,
60mM, 80mM. 100mM and 120mM phenol concentration and incubating at
room temperature (302+ OC) for five days. Samples were drawn at regular
intervals. Growth was estimated in terms of turbidity resulted in the culture
medium and expressed as optical density (0.D) obtained at 650 nm using
a spectrophotometer. The OD values were plotted against incubation time
in order to draw the growth cuwe. The specific growth rate of the
Alcaligenes sp d2 was determined at each concentration of the phenol and
a graph was plotted with specific growth rate against the respective phenol
concentration.
2.3.3. Effect of Substrate (phenol) concentration on the biodegradation of phenol
5% inoculum was added to the mineral salt phenol medium at different
concentrations of phenol as 2OmM, 40mM, 60mM, 80mM, IOOmM and 120mM.
The flasks were kept at room temperature at 150 rpm along with the control.
The percentage degradation of phenol at each substrate concentration was
monitored for five days and a graph was plotted with % of phenol reduction
against the substrate concentration The highest concentration of phenol at
which 100% phenol degradation txxxlrred was selected as the optimum
substrate concentration for phenol degradation process.
2.3.4. Effect of incubation period on the biodegradation of phenol
The basal medium containing 60mM phenol (optimum substrate
concentration) was inoculated with 3% inoculum and was incubated for 50
hours at room temperature at 150 rpm. Samples were drawn at every 2 h
and the percentage of phenol degradation was calculated in the cell free
supernatant. The minimum incubation period required to effect maximum
phenol degradation was selected as the optimum incubation period.

2.3.5. Effect of pH on the biodegradation of phenol
3% inoculum was added to the basal medium (MSPM) containing
60mM phenol as the substrate. The pH range was from 3.5-10.5. The
flasks were kept at room temperature at 150 rpm for 32 hours. The
percentage of phenol degraded afler 32 hours at each pH was noted. The
pH, which gave maximum pecentage of phenol degradation, was
considered as the optimum pH.
2.3.6. Preparation of immobilized cells
Alcaligenes sp d2, grown in mineral salt phenol medium(MSPM)
for 24 hours were harvested bq centrifugation at 10000 rpm for 30
minutes. These cells were suspenoed in physiological saline (0.86% NaCI)
at a cell concentration of 1 0.D and were mixed with 4% sodium alginate in
the ratio 1:2. The mixture was added drop wise to excess, 0.2M CaCI, to
get alginate entrapped cells (Jayachandran et ab, 1994).
2.3.7. Activation of immobilized viable cells
The immobilized viable beaus were activated for achieving maximal
activity using the mineral salt phenol medium. Prepared immobilized beads
were taken in large 500 ml beaker and immersed with phenol containing
minimal medium for varying time intervals. Optimal activation time that
promoted maximal activity, for immobilized cells was determined in terms
of percentage reduction of phenol.
2.3.8. Growth c u m of free and immobilized cells of Alcaligenes sp dd,
Mineral salt phenol medium (MSPM) was inoculated with 1 O/O
inoculum of 1 OD concentration in the case of free cells and 100
beads/l0Mnl in the case of immobilized cells. The quantification of the
growth of free cells was done by serial dilution of the sample followed by
viable counts at regular intervals of 4 hours. In the case of alginate-
immobilized cells, to recover bacteria for viable counts, known amount of
the beads were immersed in phosphate buffer (lM, pH-7), and dissolved
by vigorous shaking (Muyima and Clorte, 1995).
2.3.9. Biodegradation of phenol by immobilized cells of Alcaligenes sP d2
The mineral salt phenol medium was taken as 300 ml aliquots in
llitre flasks and was inoculated with 300 activated immobilized beads
(Jayachandran et a/, 1994). T7ese flasks were incubated at room
temperature (30* 2 OC) on a shak,sr at 150 rpm under optimized conditions
of phenol degradation. Samples were withdrawn at regular intervals of 4
hours for phenol estimations frorn the mineral salt medium and a graph
was plotted with% of phenol reduction against incubation period.
2.4. ANALYSIS OF THE PRODUCTS OF PHENOL DEGRADATION
2.4.1 Ortho lMeta cleavage test
100 ml of the MSPM was inoculated with 3% of the inoculum
(mentioned in 2.3.1 section) of Alcaligenes sp d2 and was incubated for 32
hours at optimized conditions 'of phenol biodegradation. lOml samples
were taken at an interval of 4 hours and were centrifuged at lOOOOg for 15
minutes at 4OC. From the concentrate 0.5 ml was resuspended in two ml of
0.2M tris buffer (pH8) and was added to 0.5 ml of toluene to solubilize the
membrane. This was shaker1 with 0.2ml of 1M catechol solution.
Appearance of yellow color wittiin few minutes was the indication of meta
cleavage activity. To 2.5ml of the cell suspension l g ammonium sulphate
was added and incubated for one hour at 30'~. The pH was adjusted to 10
with 0.5 ml ammonia (5N) and a drop of 1% sodium nitroprusside was
added to the mixture. Appearance of deep blue colour was observed for
the orthocleavage activity.
2.4.2. Analysis of the products of biodegredation by GClMS and FTnR
lOOOml of the MSPM was taken as equal aliquots in three IOOOml
flasks and were inoculated with the Alcaligenes sp d2 at 3% inoculum.
(Mentioned under 2.3.1 section).The flasks were incubated for 32 hours
under the optimized conditions of phenol biodegradation. The medium was
centrifuged at IOOOOg and the pellet was separated. The supernatant was
repeatedly extracted with the solvent ether and the extract was
concentrated by evaporation. This extract was used as the extract of
biodegraded MSPM (biodegraded phenol). A control was also kept by
incubating lOOOml of MSPM (without inoculation) under similar conditions
for 32 hours. It was also extracted similarly and was concentrated by
evaporation. This extract was used as the extract of uninoculated MSPM
(Phenol control). The two extract5 prepared under similar conditions were
subjected to GCIMS and FTIIR analysis at STIC, Cochin University,
Cochin, Kerala. The conditions used in the above analysis are specified in
appendix XVI and XVII.
2.5. ISOLATION AND PURlflCATlON OF POLYPHENOL OXIDASE FROM Ahdi~e- SP d,
2.5.1. Enzyme production in the MSPM by Alcaligenes sp d2
The Alcaligenes strain was inoculated to 500 ml of mineral salt
phenol medium (MSPM) and wa:; allowed to grow for 32 h under the
optimum conditions of phenol bicxlegradation. Atter 32 h the culture was
centrluged at 10000 rpm for 10 minutes. The cell free supernatant was
collected and used for estimating the enzyme activity.
2.5.2. Assay of polyphenol oxidase
The enzyme activity of the supernatant was determined by measuring
the oxidation of 40mM ABTS (2,2' azinobis benzthiazoline 6 sulfonate) in
50mM phosphate citrate buffer, pH 5 (Hublik and Schinner, 2000).
2.5.3. Preparation of partially purified enzyme concentrate
500 ml of the MSPM was inoculated with Alcaligenes sp d2 and
incubated for 32hours.The cell free supematant was collected after 32 h of
inoculation by centriiuging at a speed of 10000 rpm for 10 minutes at 4OC.
2.5.3.1. Ammonium sulphate precipitation
The cell free supernatani was subjected to ammonium sulfate
fractionation at different saturation concentrations starting from 30°h
saturation. The finely powdered ammonium sulphate was added very
slowly into the crude enzyme with continuous stirring at 4% in an ice bath.
The precipitated protein was removed by centrifugation at 10000 rpm for
20 minutes at 4Oc.~he same procedure was repeated for successive
saturation concentrations up to 90% ammonium sulphate saturation. The
enzyme assay (Hublik and Schinner, 2000)) and protein assay (Bradford,
1976) of all pellets at different anlmonium sulphate concentrations and the
corresponding supernatants were performed. The pellet, which gave
maximum activity for polyphenol oxidase, was taken. It was dissolved in
5ml of the 0.04M phosphate citrate buffer (pH 5) and was subjected to
dialysis.
2.5.3.2. Dialysis
The dialysis was performed in the cellulose acetate semi permeable
dialysis bag in excess of 0.04M phosphate citrate buffer (pH 5) taken in a
500 ml beaker. The dialysis was continued up to 24 hours at 4% with
frequent mixing and buffer changes. The protein and enzyme estimations
were done as mentioned earlier
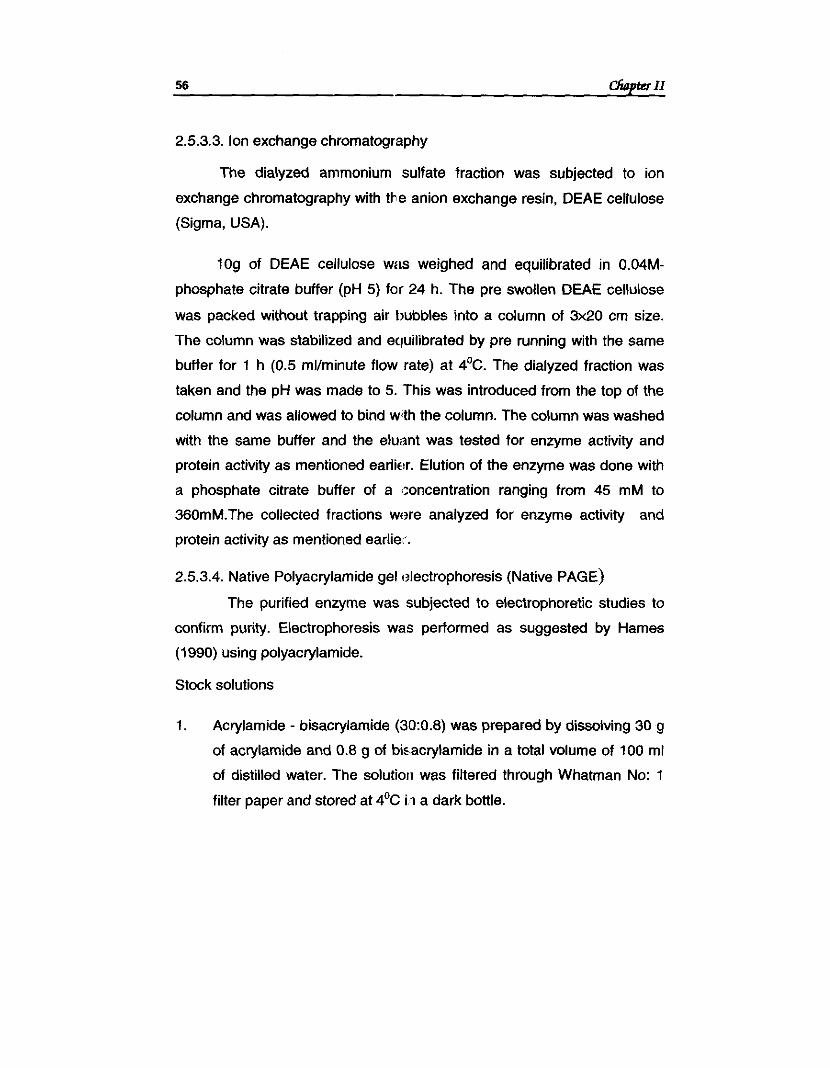
2.5.3.3. Ion exchange chromatography
The dialyzed ammonium sulfate fraction was subjected to ion
exchange chromatography with tbe anion exchange resin, DEAE cellulose
(Sigma, USA).
109 of DEAE cellulose was weighed and equilibrated in 0.04M-
phosphate citrate buffer (pH 5) for 24 h. The pre swollen DEAE cellulose
was packed without trapping air bubbles into a column of 3x20 cm size.
The column was stabilized and equilibrated by pre running with the same
buffer for 1 h (0.5 mllminute flow rate) at 4%. The dialyzed fraction was
taken and the pH was made to 5. This was introduced from the top of the
column and was allowed to bind with the column. The column was washed
with the same buffer and the eluant was tested for enzyme activity and
protein activity as mentioned earlic!r. Elution of the enzyme was done with
a phosphate citrate buffer of a 'concentration ranging from 45 mM to
360mM.The collected fractions were analyzed for enzyme activity and
protein activity as mentioned earlie[,.
2.5.3.4. Native Polyacrylamide gel 13lectrophoresis (Native PAGE)
The purified enzyme was subjected to electrophoretic studies to
confirm purity. Electrophoresis was performed as suggested by Hames
(1990) using polyactylamide.
Stock solutions
1. Actylamide - bisactylamide (30:0.8) was prepared by dissolving 30 g
of acrylamide and 0.8 g of bis.acrylamide in a total volume of 100 ml
of distilled water. The solutiori was filtered through Whatman No: 1
filter paper and stored at 4OC i I a dark bottle.
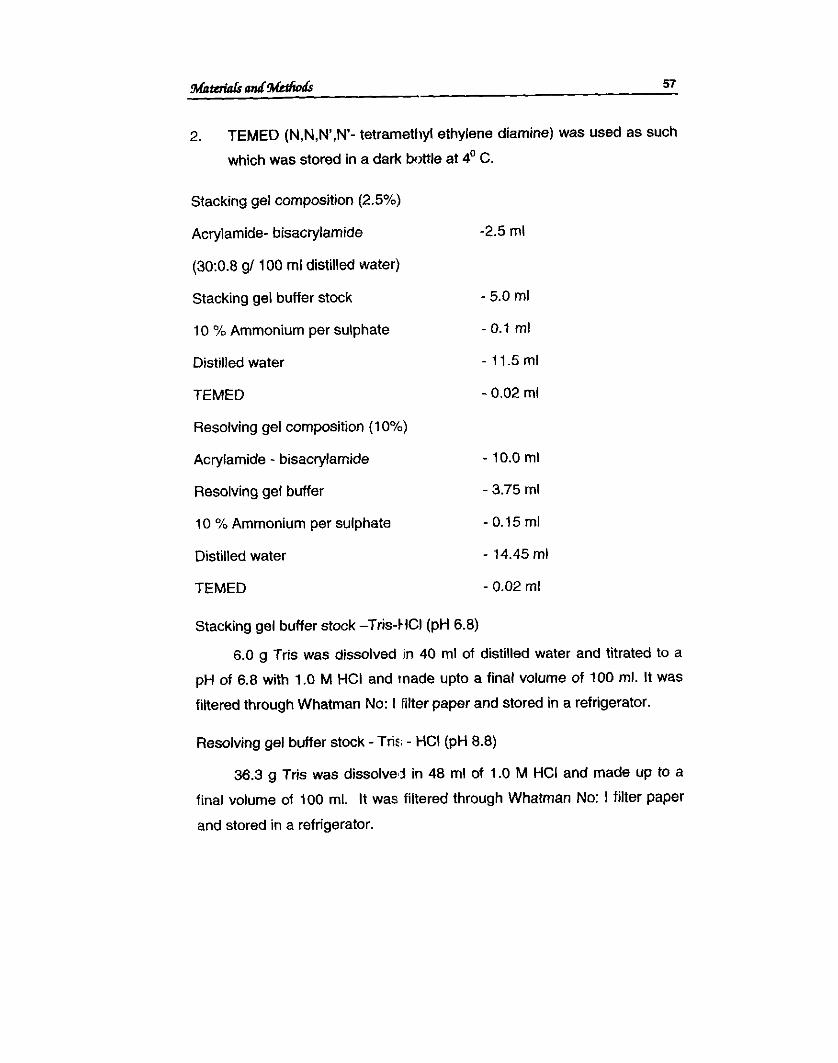
2. TEMED (N,N,N',N'- tetrametlryl ethylene diamine) was used as such
which was stored in a dark bottle at 4' C.
Stacking gel composition (2.5%)
Acrylamide- bisacrylamide -2.5 ml
(30:0.8 g/ 100 ml distilled water)
Stacking gel buffer stock - 5.0 ml
10 % Ammonium per sulphate
Distilled water
TEMED
Resolving gel composition (1 0%)
Acrylamide - bisacrylamide
Resolving gel buffer
10 % Ammonium per sulphate
Distilled water
TEMED
- 10.0 ml
- 3.75 ml
- 0.15 ml
- 14.45 ml
- 0.02 rnl
Stacking gel buffer stock -Tris-tic1 (pH 6.8)
6.0 g Tris was dissolved in 40 ml of distilled water and titrated to a
pH of 6.8 with 1.0 M HCI and rnade upto a final volume of 100 ml. It was
filtered through Whatman No: I filter paper and stored in a refrigerator.
Resolving gel buffer stock - Tris; - HCI (pH 8.8)
36.3 g Tris was dissolve~-l in 48 ml of 1 .O M HCI and made up to a
final volume of 100 ml. It was filtered through Whatman No: I filter paper
and stored in a refrigerator.
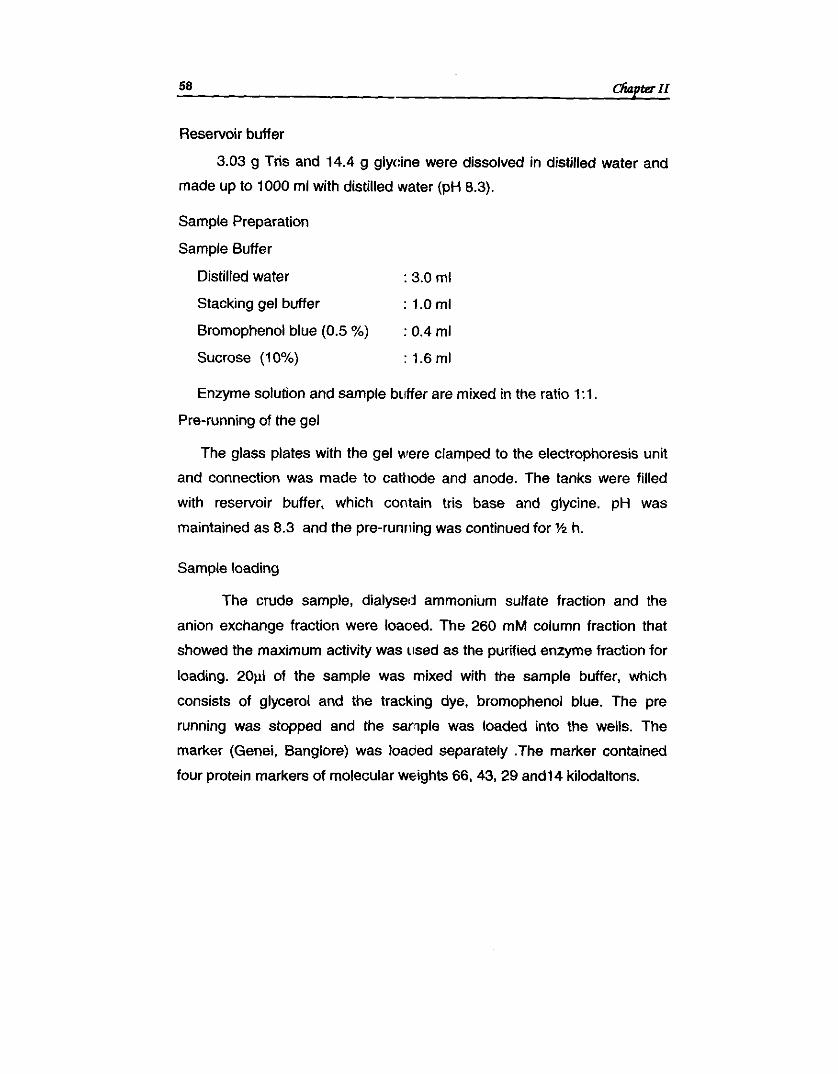
Reservoir buffer
3.03 g Tris and 14.4 g g1yc:ine were dissolved in distilled water and
made up to 1000 ml with distilled water (pH 8.3).
Sample Preparation
Sample Buffer
Distilled water : 3.0 ml
Stacking gel buffer : 1.0ml
Bromophenol blue (0.5 %) : 0.4 ml
Sucrose (1 0%) : 1.6 ml
Enzyme solution and sample buffer are mixed in the ratio 1:l.
Pre-running of the gel
The glass plates with the gel were clamped to the electrophoresis unit
and connection was made to catt~ode and anode. The tanks were filled
with rese~oir buffer, which contain tris base and glycine. pH was
maintained as 8.3 and the pre-running was continued for '/2 h.
Sample loading
The crude sample, dialysed ammonium sulfate fraction and the
anion exchange fraction were loaoed. The 260 mM column fraction that
showed the maximum activity was used as the purified enzyme fraction for
loading. 20pI of the sample was mixed with the sample buffer, which
consists of glycerol and the tracking dye, bromophenol blue. The pre
running was stopped and the sariple was loaded into the wells. The
marker (Genei, Banglore) was loaded separately .The marker contained
four protein markers of molecular weights 66, 43,29 andl4 kilodaltons.
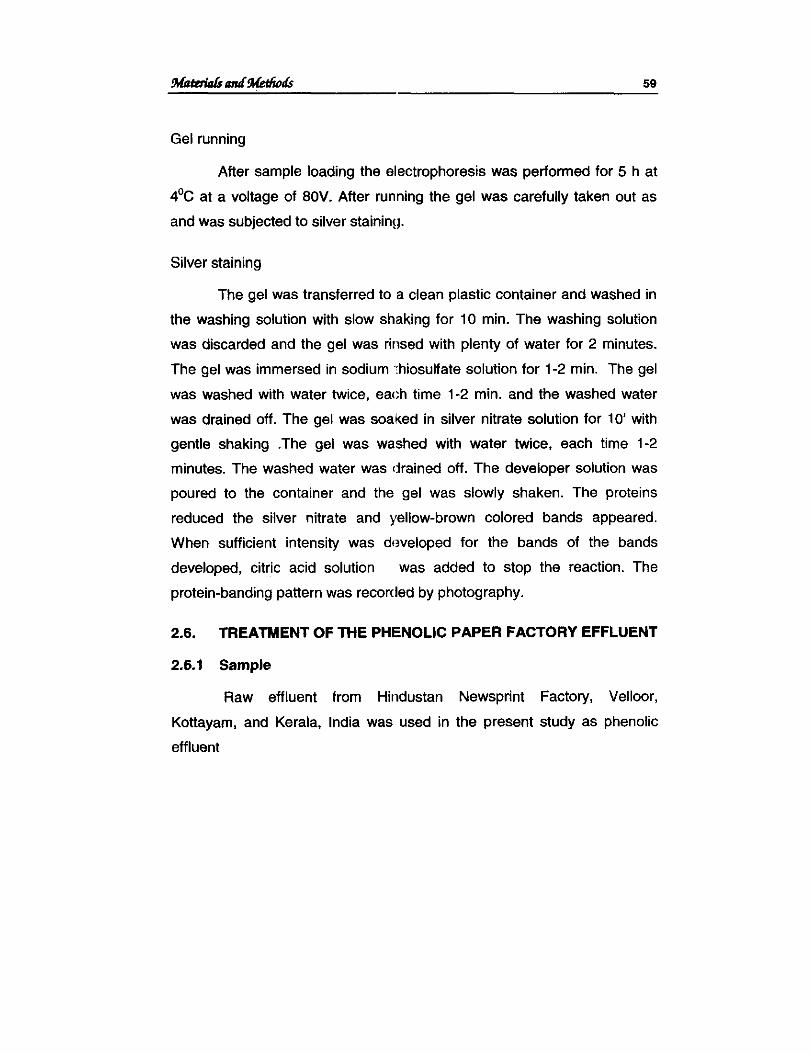
Gel running
After sample loading the electrophoresis was performed for 5 h at
4OC at a voltage of 80V. After running the gel was carefully taken out as
and was subjected to silver staining.
Silver staining
The gel was transferred to a clean plastic container and washed in
the washing solution with slow shaking for 10 min. The washing solution
was discarded and the gel was rir~sed with plenty of water for 2 minutes.
The gel was immersed in sodium :hiosulfate solution for 1-2 min. The gel
was washed with water twice, each time 1-2 min. and the washed water
was drained off. The gel was soaked in silver nitrate solution for 10' with
gentle shaking .The gel was washed with water twice, each time 1-2
minutes. The washed water was drained off. The developer solution was
poured to the container and the gel was slowly shaken. The proteins
reduced the silver nitrate and yellow-brown colored bands appeared.
When sufficient intensity was dt?veloped for the bands of the bands
developed, citric acid solution was added to stop the reaction. The
protein-banding pattern was recorded by photography.
2.6. TREATMENT OF THE PHENOLIC PAPER FACTORY EFFLUENT
2.6.1 Sample
Raw effluent from Hindustan Newsprint Factory, Velloor,
Kottayam, and Kerala, India was used in the present study as phenolic
effluent
2.6.2 Characterization of the effluent
2.6.2.1. Analytical methods
The phenolic effluent was a~ialysed for Total solids, Chemical Oxygen
Demand (COD) and Biological Oxygen Demand (BOD) (APHA, 1989).
2.6.2.2. Total solids (TS)
Total solids (both dissolved and suspended solids) present in the
effluent were determined based on the method suggested by
APHA (1 989).
Total Suspended Solids (TSS)
1. A known volume of sample (100 ml) was filtered through a tarred
crucible ignited to constan weight (w,) and the crucible was dried
at 130°C for 1 h.
2. Later, the crucible with the contents was cooled in a desiccator and
the weight of the crucible was recorded (w2).
3. Suspended solids were calculated using the formula.
w , - w , x106 Total suspended solids (mg/l)=
volume of the sample
Total dissolved solids (TDS)
1. A known volume of the filtrate (100 ml) obtained from the above
experiment was taken in a tarred dish ignited to constant weight (w,).
2. The dish with the contents was dried at 130°C for 1 h, cooled in a
desiccator and weighed (W2).
3. Dissolved solids were calc~~lated using the formula
w, -w,x106 Total dissolved solids (mg/l)=
volume of the sample
2.6.2.3. pH
Measurement of pH was carried out using a pH meter (Systronics
digital pH meter).
2.6.2.4.Biochemical Oxygen Demcind
The biochemical oxygen demand was estimated as per the official
method in APHA (1989).
1. The collected samples wore diluted before incubation to bring the
oxygen demand and supoly into an appropriate balance. One litre
of distilled water was miwed with nutrients. 1 ml each of buffer,
calcium chloride magnesium sulfate and ferric chloride.
2. Samples were neutralized to pH 6.5-7.5 with 1 M H2S04 or 1M
NaOH.
3. The DO of the sample w3s determined initially and after 5 days of
incubation in a BOD incubator at 20°C.
4. A blank was also carried out simultaneously.
5. The BOD5 was then calculated by the following formula.
BOD5 at 20°C in mg/l= (I)o-D5)-(Co-C5)xdilution factor
Dilution factor= lOOC -
vol.of sa rnple
Where
Do - - DO content of the sample on the 1" day
D5 - - DO content of the sample on the tith day
co - - DO content of the blank on the IS' day
c5 - - DO content of the blank on the 5'h day
2.6.2.5. Chemical Oxygen Demana (COD)
Chemical Oxygen Demancl was determined following the official
method mentioned in APHA (1989).
1. 10 ml of the sample was diluted to 500 ml using distilled water.
2. 50 ml of the diluted sample was taken in a round bottom flask
(R. 6. Flask) for COD determination.
3. l g HgS04 was added to the above sample to overcome the
difficulties caused by chloricle ions.
4. 5 ml of con. HzSO4 was added to dissolve the HgSO.,.
5. 1 g AgS04 was then added to the above mixture as a catalyst.
6. To the above solution 25 n ~ l of 0.25 N potassium dichromate was
added.
7. The RB flask was attached to the condenser and the water was
allowed to flow.
8. 70 ml of con. H2S04 was added through the open end of the
condenser and swirling was continued while the acid was being
added.
9. The contents in the flask were refluxed for 2h, cooled, washed into
a 500 ml beaker and was suitably diluted and made upto 140 rnl.
10. 3-4 drops of ferroin indicator was added and the contents were
titrated against ferrous ammonium sulfate (0.25 N).
11. The end point of the titration was the first sharp colour change from
the blue-green to reddish t,rown.
12. A blank was also run sin~ultaneously in the same manner using
distilled water.
13. The COD then calculated using the formula.
( A - B ) X N O ~ Fe(NH,),SO,x8~1000 COD mg/l=
voll~me of sample
Where A= volume of F:e (NH& SO4 consume for blank (ml)
B= volume of Fe (NH4), SO4 consumed for sample (ml)
2.6.3. Preparation of immobilized cells
lmmobilised viable cells were prepared as mentioned in the section
2.3.6. and 2.3.7.
2.6.4. Growth curve of free and immobilized cells in effluent
The effluent was inoculated with 1 % inoculum of 1 OD concentration
in the case of free cells and 100 beadsJ100ml in the case of immobilized
cells. The quantification of the growth was done by serial dilution of the
sample followed by viable counts at regular intervals of 4 hours. In the case
of alginate-immobilized cells, to recover bacteria for viable counts, known
amount of the beads were immersed in phosphate buffer (lM, pH-7). and
dissolved by vigorous shaking (Muyima and Clorte, 1995).
2.6.5 Treatment of the effluent by free and immobilized cells of Alcaligenes sp d, under batch process
The phenolic effluent samples were taken as 300 ml aliquots in llitre
flasks and were inoculated with the 18 hour old culture at 5% inoculum level
in free cell treatment and 300 activated immobilized beads in immobilized
cell treatment (Jayachandran et ai, 1994). These flasks were incubated at
room temperature (30 * 2 OC) on a shaker at 150 rpm. Samples were
withdrawn at regular intervals of L. hours for phenol and chemical oxygen
demand estimations. The graph w,as plotted with %reduction in phenol and
COD along Y axis and incubation period along X axis.
2.6.6. Treatment of the effluent by immobilized cells of Alcaligenes sp d2 under continuous process
Continuous treatment of the phenolic effluent was performed with a
packed bed reactor in a glass column (30 cm length and 6cm diameter).
lmmobilised cells in beads (number of beads- 1050 approximately) were
packed to a height of 25 cm in the glass column carefully without trapping
any air bubble. After activation of the immobilised beads with phenolic
effluent, the packed bed reactor was exposed to the effluent at varying
flow rates of 2.5 ml /hour, 5 mWttour, 7.5 rnl/ hour and 10 ml /hour. The
percentage reduction in phenol and chemical oxygen demand of the
respective samples were also estimated.
2.6.7. Treatment of the phenolic pager factory effluent by the bioaeactsr
2.6.7.1. Monitoring of the colour of the effluent
The monitoring of the colour of the phenolic paper factory effluent
was performed by finding out the absorption maxima. The coloured effluent
was scanned in a wavelength range from 200 nm to 1100nm and the
wavelength which showed maximum absorbance was taken as the
absorption maxima. The intensity of the colaur of the effluent was
expressed as the optical density at the absorption maxima (Edwards et a/.,
1999).
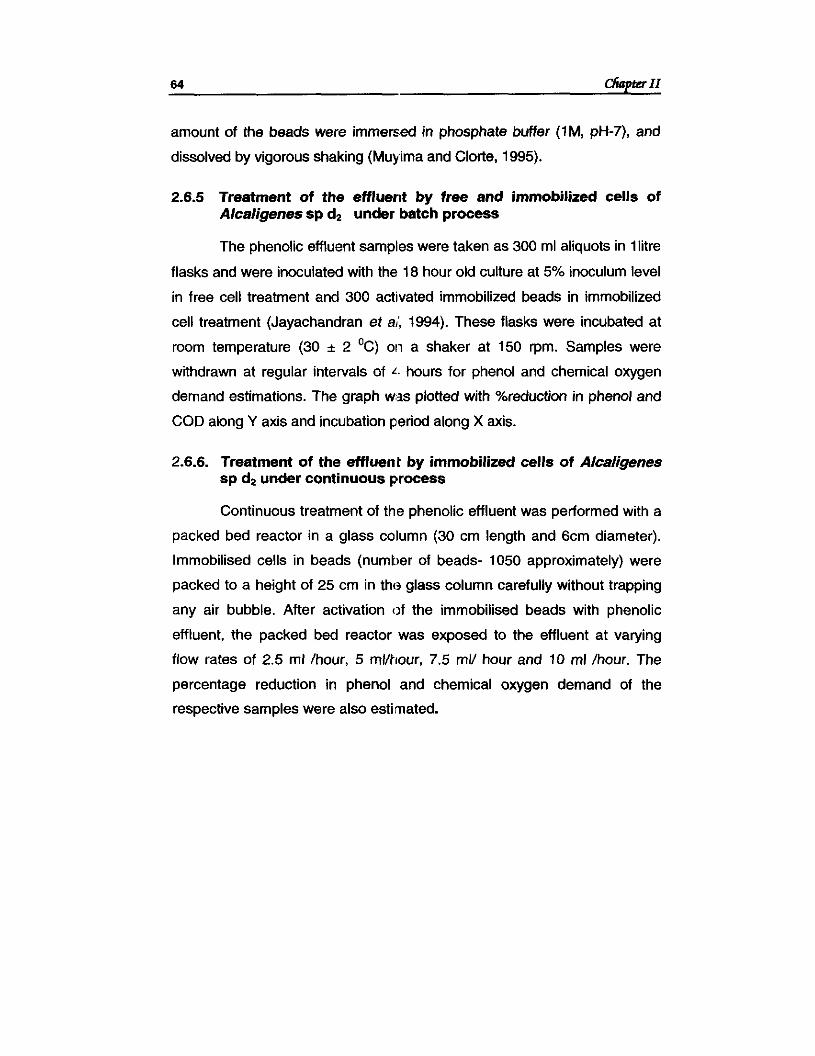
2.6.7.2. Designing of the bioreactor
The bioreactor was made with poly acrylic sheet of 4mm thickness
as three separate reactors of same dimension of 9.5cm x9.5 cm. x 13cm.
Each reactor was equipped with one removable plastic filter of Imm pore
size at both bottom and top of the reactor. These three reactors could be
used as individual units and also in association with each other. One of
these reactors was equipped with an inlet (First reactor-plate 1) and.
another was equipped with an outlet (Third reactor- plate 3). The remaining
one was considered as the second reactor (Second -plate 2).The second
reactor was used only in the three stage process as the final stage reactor
with chitosan coating.
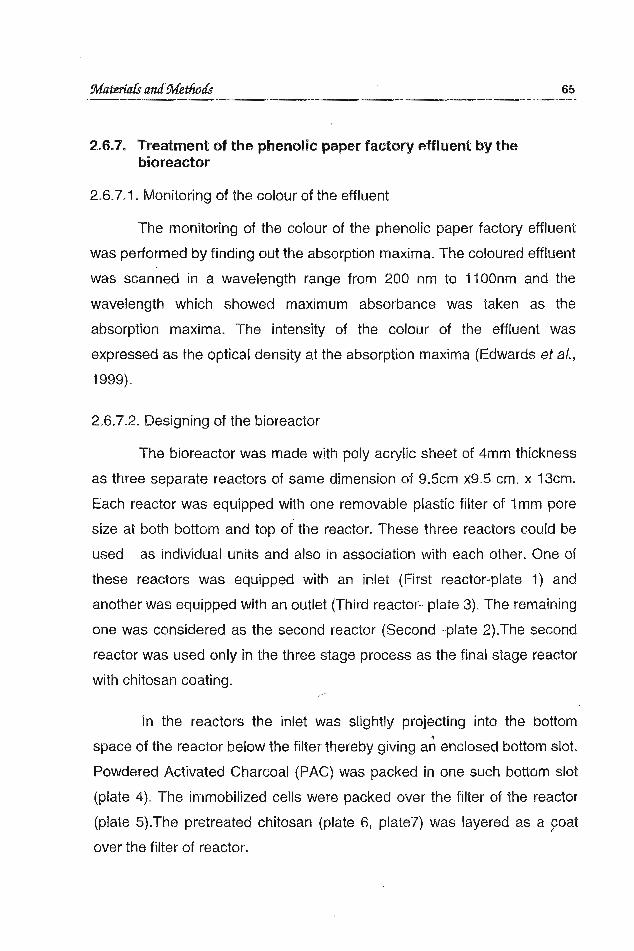
In the reactors the inlet was slightly projecting into the bottom
space of the reactor below the filter thereby giving a; enclosed bottom slot.
Powdered Activated Charcoal (PAC) was packed in one such bottom slot
(plate 4). The immobilized cells were packed over the filter of the reactor
(plate 5).The pretreated chitosan (plate 6, plate7) was layered as a $oat
over the filter of reactor.
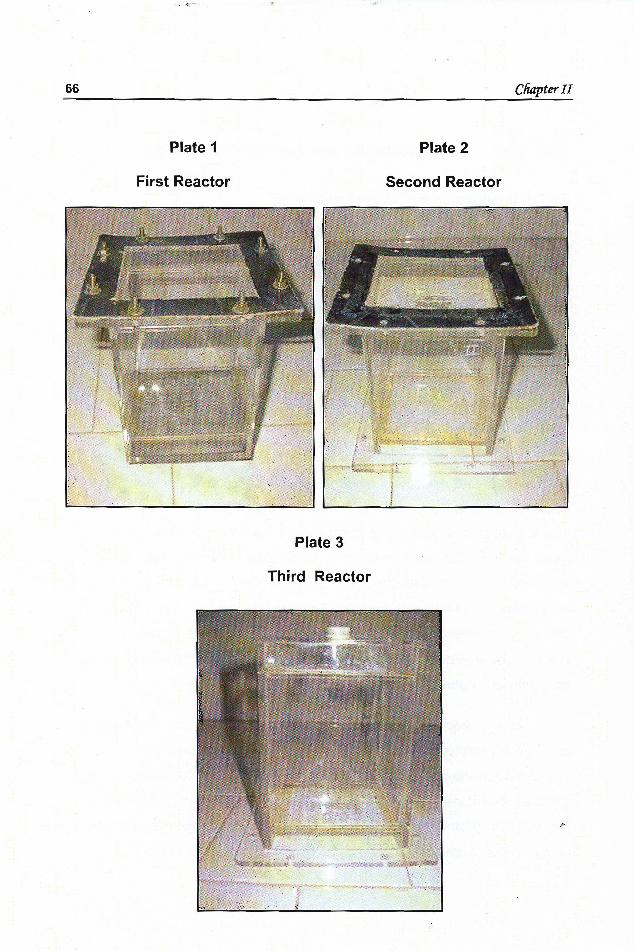
Plate I
First Reactor
Plate 2
Second Reactor
Plate 3
Third Reactor
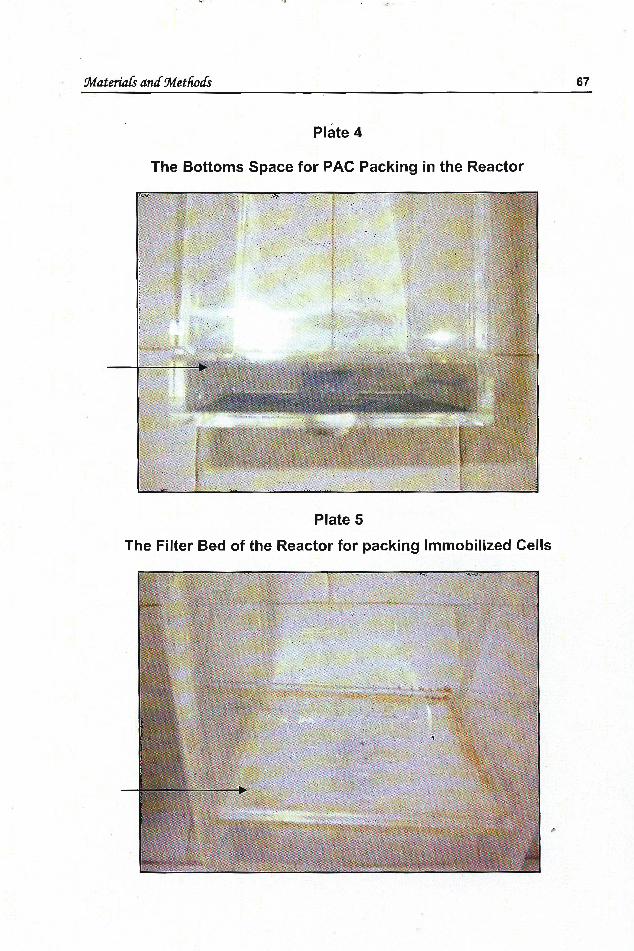
plate 4
The Bottoms Space for PAC Packing in the Reactor
Plate 5
The Filter Bed of the Reactor for packing Immobilized Cells
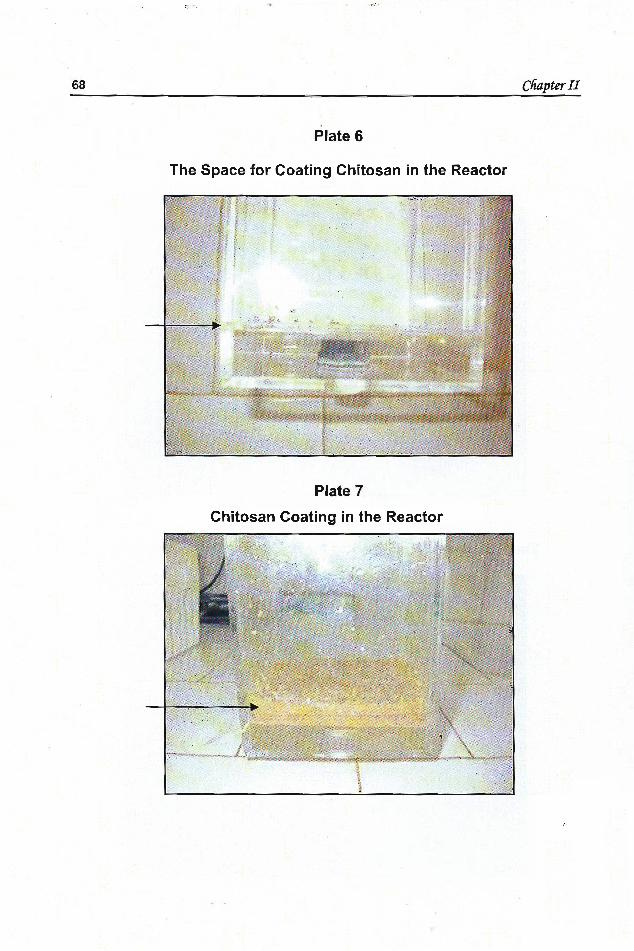
Plate 6
The Space for Coating Chitosan in the Reactor
Plate -7- .. . . .
Chitosan Coating in the,Reactor
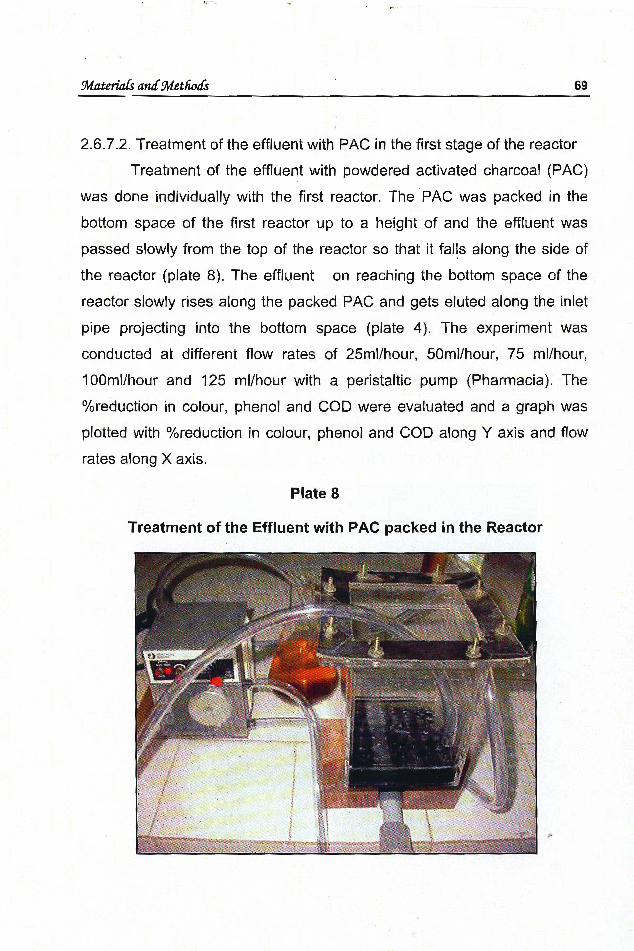
2.6.7.2. Treatment of the effluent with PAC in the first stage of the reactor
Treatment of the effluent with powdered activated charcoal (PAC)
was done individually with the first reactor. The PAC was packed in the
bottom space of the first reactor up to a height of and the effluent was
passed slowly from the top of the reactor so that it falls along the side of
the reactor (plate 8). The effluent on reaching the bottom space of the
reactor slowly rises along the packed PAC and gets eluted along the inlet
pipe projecting into the bottom space (plate 4). The experiment was
conducted at different flow rates of 25mllhour, 50ml/hour, 75 mllhour,
100ml/hour and 125 milhour with a peristaltic pump (Pharrnacia). The
%reduction in colour, phenol and COD were evaluated and a graph was
plotted with %reduction in colour, phenol and COD alo,ng Y axis and flow
rates along X axis.
Plate 8
Treatment of the Effluent with PAC packed In the Reactor
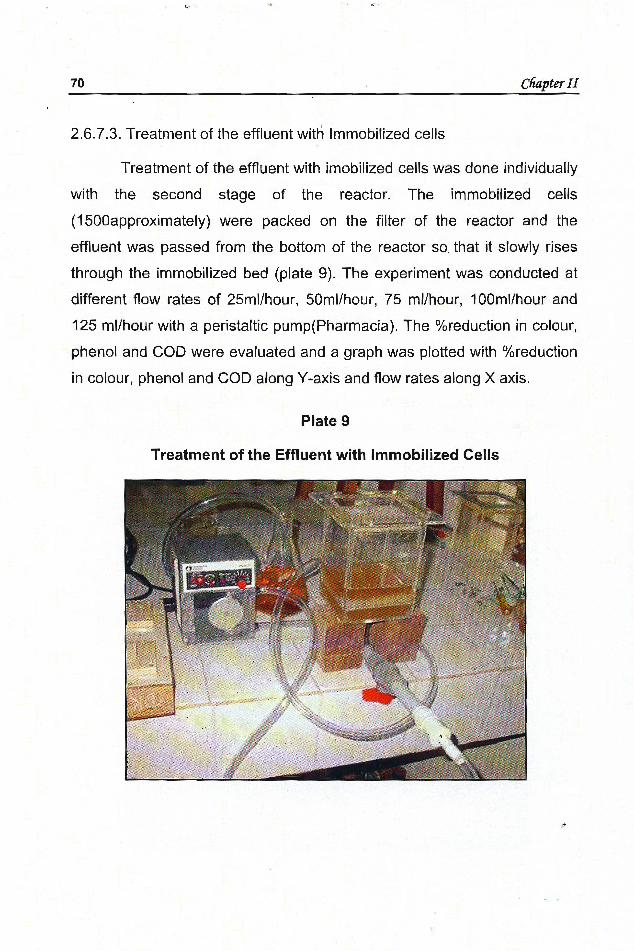
2.6.7.3. Treatment of the effluent with Immobilized cells
Treatment of the effluent with imobilized cells was done individually
with the second stage of the reactor. The immobilized cells
(1500approximately) were packed on the filter of the reactor and the
effluent was passed from .the bottom of the reactor so, that it slowly rises
through the immobilized bed (plate 9). The experiment was conducted at
different flow rates of 25ml/hour, 50ml/hour, 75 mllhour, 100mllhour and
125 mllhour with a peristaltic pump(Pharmacia). The %reduction in colour,
phenol and COD were evaluated and a graph was plotted with %reduction
in colour, phenol and COD along Y-axis and flow rates along X axis.
Plate 9
Treatment of the Effluent with Immobilized Cells
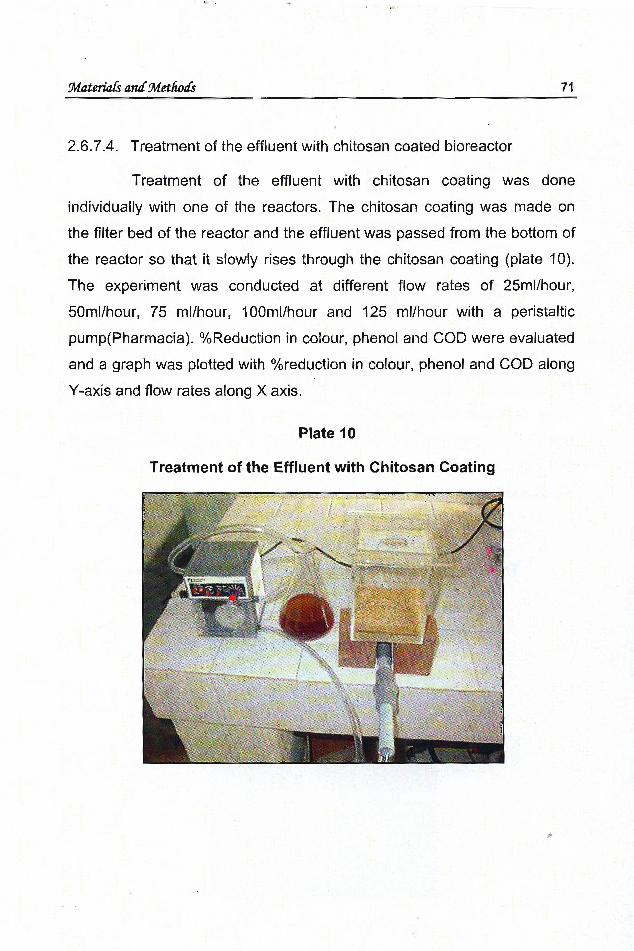
2.6.7.4. Treatment of the effluent with chitosan coated bioreactor
Treatment of the effluent with chitosan coating was done
individually with one of the reactors. The chitosan coating was made on
the filter bed of the reactor and the effluent was passed from the bottom of
the reactor so that it slowly rises through the chitosan coating (plate 10).
The experiment was conducted at different flow rates of 25ml/hour,
50ml/hour, 75 mllhour, 100ml/hour and 125 mllhour with a peristaltic
pump(Pharmacia). %Reduction in colour, phenol and COD were evaluated
and a graph was plotted with %reduction in colour, phenol and COD along
Y-axis and flow rates along X axis.
Plate 10
Treatment of the Effluent with Chitosan Coating
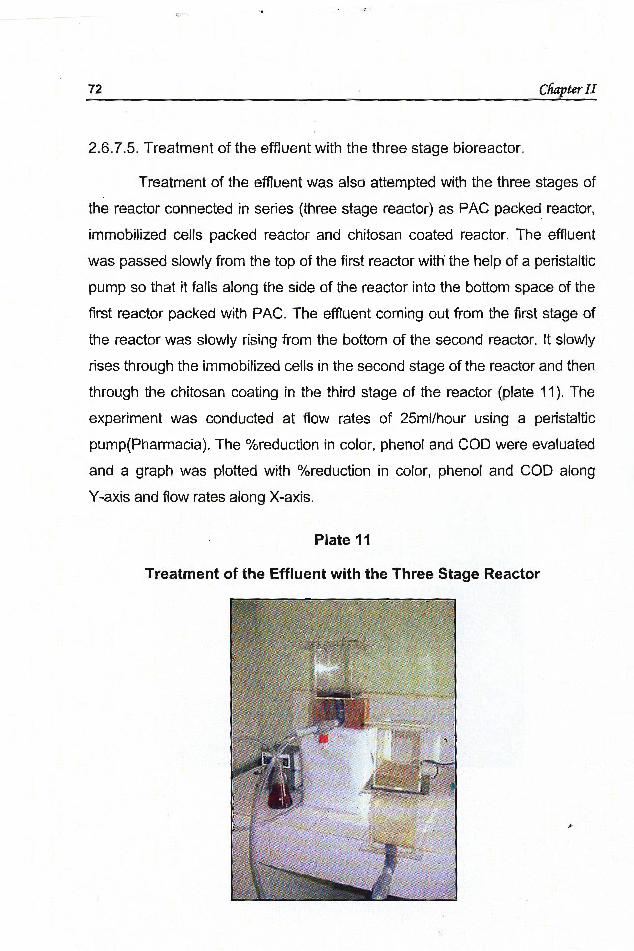
2.6.7.5. Treatment of the effluent with the three stage bioreactor.
Treatment of the effluent was also attempted with the three stages of
tha reactor connected in series (three stage reador) as PAC packed reactor,
immobilized cells packed reactor and chitosan coated reactor. The effluent
was passed slowly from the top of the first reactor witfithe help of a peristaltic
pump so that it falls along the side of the reactor into the bottom space of the
first reactor packed with PAC. The effluent coming out from the first stage of
the reactor was slowly rising from the bottom of the second reactor. It slowly
rises through the immobilized cells in the second stage of the reactor and then
through the chitosan coating in the third stage of the reactor (plate I I). The
experiment was conducted at flow rates of 25mllhour using a peristaltic
pump(Pharmacia). The %reduction in color, phenol and COD were evaluated
and a graph was plotted with %reduction in color, phenol and COD along
Y-axis and flow rates along X-axis.
Plate 11
Treatment of the Effluent with the Three Stage Reactor