Embed Size (px)
Citation preview

Vogel et al. BMC Pregnancy and Childbirth 2014, 14:56http://www.biomedcentral.com/1471-2393/14/56
RESEARCH ARTICLE Open Access
Maternal morbidity and preterm birth in 22low- and middle-income countries: a secondaryanalysis of the WHO Global Survey datasetJoshua P Vogel1,2*, Anne CC Lee3,4 and João Paulo Souza2
Abstract
Background: Preterm birth (PTB) (<37weeks) complicates approximately 15 million deliveries annually, 60%occurring in low- and middle-income countries (LMICs). Several maternal morbidities increase the risk ofspontaneous (spPTB) and provider-initiated (piPTB) preterm birth, but there is little data from LMICs.
Method: We used the WHO Global Survey to analyze data from 172,461 singleton deliveries in 145 facilities across22 LMICs. PTB and six maternal morbidities (height <145 cm, malaria, HIV/AIDS, pyelonephritis/UTI, diabetes andpre-eclampsia) were investigated. We described associated characteristics and developed multilevel models for therisk of spPTB/piPTB associated with maternal morbidities. Adverse perinatal outcomes (Apgar <7 at 5 minutes, NICUadmission, stillbirth, early neonatal death and low birthweight) were determined.
Results: 8.2% of deliveries were PTB; one-quarter of these were piPTB. 14.2% of piPTBs were not medicallyindicated. Maternal height <145 cm (AOR 1.30, 95% CI 1.10–1.52), pyelonephritis/UTI (AOR 1.16, 95% CI 1.01–1.33),pre-gestational diabetes (AOR 1.41, 95% CI 1.09–1.82) and pre-eclampsia (AOR 1.25, 95% CI 1.05–1.49) increasedodds of spPTB, as did malaria in Africa (AOR 1.67, 95%CI 1.32-2.11) but not HIV/AIDS (AOR 1.17, 95% CI 0.79-1.73).Odds of piPTB were higher with maternal height <145 cm (AOR 1.47, 95% CI 1.23-1.77), pre-gestational diabetes(AOR 2.51, 95% CI 1.81-3.47) and pre-eclampsia (AOR 8.17, 95% CI 6.80-9.83).
Conclusions: Maternal height <145 cm, diabetes and pre-eclampsia significantly increased odds of spPTB andpiPTB, while pyelonephritis/UTI and malaria increased odds of spPTB only. Strategies to reduce PTB and associatednewborn morbidity/mortality in LMICs must prioritize antenatal screening/treatment of these common conditionsand reducing non-medically indicated piPTBs where appropriate.
Keywords: Maternal, Newborn, Morbidity, Spontaneous preterm birth, Provider-initiated preterm birth, Maternalheight, Urinary tract infection, Pre-eclampsia, Diabetes, Malaria, HIV
BackgroundPreterm birth (birth before 37 weeks gestation) compli-cates an estimated 15 million deliveries every year, ofwhich 1.1 million infants will die due to preterm birth-related complications [1]. It is the leading cause of deathin the first month of life and preterm neonates are at an
* Correspondence: [email protected] of Population Health, Faculty of Medicine, Dentistry and HealthSciences, University of Western Australia, 35 Stirling Highway, Crawley 6009,Australia2UNDP/UNFPA/UNICEF/WHO/World Bank Special Programme of Research,Development and Research Training in Human Reproduction (HRP),Department of Reproductive Health and Research, World HealthOrganization, Avenue Appia 20, Geneva CH-1211, SwitzerlandFull list of author information is available at the end of the article
© 2014 Vogel et al.; licensee BioMed Central LCommons Attribution License (http://creativecreproduction in any medium, provided the or
increased risk for post-neonatal mortality and a widerange of respiratory, infectious, metabolic and nervoussystem morbidities [2,3]. These risks persist beyond theneonatal period – preterm birth is the second leadingcause of death in children under 5 [4] and preterm in-fants have more illnesses, hospital admissions and edu-cational and behavioral problems in childhood and earlyadulthood [5-8]. They are also at greater risk of adultchronic diseases, such as hypertension and diabetes [9]. In2012, the “Born Too Soon: the Global Action Report onPreterm Birth” was released, reporting the first country-level estimates of preterm deliveries and mapping a com-prehensive global strategy to address preterm birth [10].
td. This is an open access article distributed under the terms of the Creativeommons.org/licenses/by/2.0), which permits unrestricted use, distribution, andiginal work is properly cited.

Vogel et al. BMC Pregnancy and Childbirth 2014, 14:56 Page 2 of 14http://www.biomedcentral.com/1471-2393/14/56
Over 60% of preterm births occur in low- and middle-income countries (LMICs) and the incidence has con-sistently risen in most countries [1,10]. A worldwideco-operative effort to empower women and improvethe availability of family planning and pre-pregnancyand antenatal care may prevent preterm birth, while up-scaling simple, low-cost interventions can save the lives ofpremature infants [10].Approximately 45-50% of preterm deliveries follow
spontaneous onset of labour, 30% follow preterm ruptureof membranes and 15-20% of preterm births are provider-initiated [11]. While the etiology of spontaneous pretermbirth is heterogeneous and poorly understood, many ma-ternal factors are known to increase risk, such as age (ado-lescence and advanced age), race, multiple pregnancy,short inter-pregnancy interval, infections, medical condi-tions, poor nutrition, lifestyle factors, psychological factorsand genetic predisposition [12-14]. Provider-initiated pre-term birth can be life-saving for both mother and fetus,such as in severe pre-eclampsia, placental abruption orfetal distress. However, some provider-initiated pretermdeliveries may not have a strong medical indication or areunintentionally preterm due to gestational age error [10].Consequently, a significant fraction of the worldwide pre-term birth burden may be unnecessary and avoidable.There is a dearth of large-scale prevalence data from
LMICs on the different phenotypes of preterm birth (spon-taneous and provider-initiated) and on antenatal maternalmorbidities known to contribute to preterm birth, as wellas neonatal morbidity and mortality amongst preterm in-fants. In many resource-constrained settings, conditionsthat are known to be risk factors for preterm birth (suchas urinary tract infections, malaria, undernutrition andhypertensive disorders) are frequently under-diagnosed,under-treated or both. Consequently, the magnitude ofthe association between maternal morbidities, the riskof preterm birth and neonatal morbidity and mortalityin these settings is difficult to establish, despite the avai-lability of proven interventions for these conditions [10].The Child Health Epidemiology Research Group
(CHERG) has conducted a series of analyses exploringthe association between maternal risk factors (nutri-tion, infections and pregnancy morbidity) and intra-uterine growth restriction and preterm birth [3]. Aspart of that work, we conducted a secondary analysisof facility deliveries in an international WHO datasetto describe the prevalences and relationships betweenselected maternal morbidities, spontaneous and provider-initiated preterm birth and neonatal morbidity and mortal-ity in preterm infants in 22 LMICs.
MethodsThe WHO Global Survey on Maternal and PerinatalHealth (hereafter referred to as WHOGS) is a multi-
country, facility-based, cross-sectional survey of maternaland perinatal outcomes following delivery. The methodo-logical details have been previously published [15,16]. Inbrief, a stratified, multistage sampling design was used toobtain a global sample of countries and health institutions.Countries in WHO regions were grouped according toadult and child mortality and countries were randomlyselected (probability proportional to population). Ofthese, 24 participated in Africa (Angola, Democratic Re-public of Congo, Algeria, Kenya, Niger, Nigeria andUganda), Latin America (Argentina, Brazil, Cuba, Ecuador,Mexico, Nicaragua, Paraguay and Peru) and Asia(Cambodia, China, India, Japan, Nepal, Philippines, SriLanka, Thailand and Vietnam). From within the capitalcity and two randomly selected provinces, seven institu-tions with over 1,000 births per year and the capacity toperform caesarean sections (CS) were randomly selected.The study was conducted over 2004-2005 (Africa andLatin America) and 2007-2008 (Asia).All women delivering over 20 weeks gestation in par-
ticipating institutions during a three-month study periodwere included. Trained data collectors reviewed and ex-tracted relevant data from medical records to completethe individual data forms on mothers and neonates dur-ing admission for delivery until discharge or day 7 post-partum (whichever came first). Maternal or neonatalmorbidity or mortality occurring after discharge or day7 postpartum was not captured. Maternal morbiditiesavailable in the WHOGS dataset known to increase therisk of preterm birth were selected as exposure vari-ables, namely: maternal height (as a proxy for maternalmalnutrition), malaria, HIV/AIDS (evidence in the hos-pital records of the woman being HIV positive or havingAIDS), pyelonephritis/UTI (history of infection duringthe pregnancy or delivery), pre-gestational diabetes(women who became pregnant and were known to havediabetes that antedated pregnancy) and pre-eclampsia(blood pressure of 140/90 or greater, or an increase of30 mm Hg systolic or 15 mm Hg diastolic over baselinevalues on at least two occasions six or more hours apart,developing after 20 weeks plus proteinuria/albumin-uria). These conditions were recorded as binary vari-ables (yes/no), except for maternal height which westratified into four groups (<145 cm, 145 – 149.9 cm,150 – 154.9 cm, > = 155 cm) There is no universal def-inition for low maternal height, however 145 cm and150 cm are common cutoffs used in anthropometrystudies in LMICs ([17-19] and we reported results forall four height groups (> = 155 cm as reference group).Women were not universally screened for these condi-tions; they may have been diagnosed at any point duringpregnancy. Information on severity, method of diagno-sis and management of these morbidities was not re-corded in the WHOGS.

Vogel et al. BMC Pregnancy and Childbirth 2014, 14:56 Page 3 of 14http://www.biomedcentral.com/1471-2393/14/56
We created a primary outcome variable related to pre-term birth with three mutually exclusive groups, namely1) spontaneous preterm birth (spPTB) defined as deliv-eries occurring before 37 weeks gestation followingspontaneous onset of labour, 2) provider-initiated pre-term birth (piPTB) defined as delivery before 37 weeksgestation following induction of labour, or no labour and3) term births (> = 37 weeks gestation, reference group).Medically indicated piPTB were those with one or moredocumented medical indications, while non-medicallyindicated piPTB deliveries were recorded as elective orby maternal request only. Those piPTB deliveries withno documented indications (medical or otherwise) werereported as unknown. Perinatal outcomes were: Apgarscore <7 at 5 minutes, admission to neonatal intensivecare unit (NICU), stillbirth (neonate showing no signs oflife at time of delivery), low birthweight (birthweight<2500 g) and early neonatal mortality (ENM) by dis-charge or day 7. Deaths occurring in the first week of lifeafter discharge (at home or during a postpartum re-admission) were not captured.The WHOGS captured 290,610 deliveries in 373 insti-
tutions across Africa, Latin America and Asia. For thisanalysis, we used data on liveborn singletons only fromthe 22 LMICs in the WHOGS dataset, as defined by theOrganization for Economic Cooperation and Develop-ment (www.oecd.org) (Japan was excluded as it is classi-fied as a high-income country). We excluded multiplepregnancies on account of the differences in pretermbirth rates between singletons and multiples and contro-versy surrounding the optimal timing of delivery formultiple births [20,21]. The relationship between mater-nal morbidities and multiple pregnancies may also differ,potentially leading to over-estimates of effect. We ex-cluded facilities that had less than 500 deliveries, andthose with implausible/unrepresentative data or evidenceof poor data capture (i.e.: a preterm birth rate of lessthan 3% or greater than 40%, or a low birthweight rateof less than 1%). Deliveries with a gestational age of 22to 45 weeks were included, however deliveries withmissing gestational age were excluded, as were outliergestational age/birthweight combinations identified byalgorithms developed by Alexander et al.[22] As perthese criteria, 172,461 singleton live births from 22countries available for analysis (Figure 1). All deliveriesin Angola were excluded as they did not meet the abovedata quality criteria.The prevalences of maternal and neonatal characteris-
tics were reported for spPTB, piPTB and term birthgroups. Missing values were reported, however theywere excluded from significance testing. Chi-square testsand Student’s t-test tested significance for spPTB vs termand piPTB vs term. We also reported the prevalence ofpreterm birth groups and maternal morbidities at the
country level. Global and regional multi-level logistic re-gression models (using the GENLINMIXED procedurein SPSS) were used to determine adjusted odds ratios ofspPTB and piPTB associated with the maternal morbid-ities, while accounting for clustering of mothers withinfacilities. Maternal age, education, marital status, parity,antenatal care, multiple pregnancy and facility (as a ran-dom effect) were included as confounders in the multi-variate models. The frequency of HIV/AIDS and malariawas extremely low in Latin America and Asia and werethus excluded from these models and the global model.Missing values were excluded from modelling. Perinataloutcomes were reported by gestational age bands (<28,28 to 31, 32 to 33, 34 - <37 and >37 weeks) and by pre-term groups. Ethical clearance from all Ministries ofHealth of participating countries, WHO Ethics ReviewCommittee and that of each health institution or sub-region were obtained. All analyses were performed usingSPSS 20 [23].
ResultsOf the 172,461 liveborn singletons in this analysis,14,155 (8.2%) were preterm (Figure 1). Approximatelythree-quarters of all preterm births were spontaneous(spPTB) while one-quarter were provider-initiated pre-term births (piPTB); this proportion varied by region(Latin America 31.7%, Africa 11.8% and Asia 22.6%)(Table 1, Figures 2, 3, 4, 5). Globally, 85.8% of theprovider-initiated preterm deliveries were medically indi-cated (Latin America 91.1%, Africa 88.7% and Asia80.1%).Table 2 shows maternal and neonatal characteristics
and preterm birth risk factors across all included preg-nancies. Women experiencing spPTB trended signifi-cantly towards younger age, less education, lessantenatal care, lower maternal height, as well as higherrates of malaria (2.1% vs 1.1%, p < 0.001) and pre-eclampsia (3.5% vs 2.6%, p < 0.001) compared to womenwith term deliveries (Table 2). Vaginal deliveries (79.7%vs 72.0%, p < 0.001) were more common among spPTB.Differences between piPTB and term deliveries weresimilar, however rates of malaria were slightly lower(0.5% vs 1.1%, p = 0.003), while pyelonephritis/UTI (8.2%vs 7.1%, p = 0.013), diabetes (2.9% vs 0.8%, p < 0.001) andpre-eclampsia (18.2% vs 2.6%, p < 0.001) were higher inwomen with piPTB. Caesarean section (66.4% vs 28.0%,p < 0.001) was significantly more common in piPTB.Most (97%) of all deliveries occurred in urban or peri-urban facilities, but piPTBs were more commonly in ter-tiary facilities (64.6%) compared to spPTB (59.1%) andterm deliveries (54.7%).At the country level (Table 3), the median singleton
preterm birth rate was 8.3% (interquartile range 6.7% to9.7%). The median proportion of preterm deliveries due

Table 1 Prevalence of preterm birth groups, by region
Global Latin America Africa Asia
Number of facilities 122 54 27 64
Number of liveborn singleton deliveries 172,461 64,181 30,544 77,736
Term births (> = 37 weeks) 158,295 (91.8) 59,288 (92.4) 28,284 (92.6) 70,723 (91.0)
All preterm births (< 37 weeks) 14,166 (8.2) 4,893 (7.6) 2,260 (7.4) 7,013 (9.0)
Spontaneous preterm birth (spPTB)a 10,750 (75.9) 3,336 (68.2) 1,990 (88.1) 5,424 (77.3)
Provider-initiated preterm births (piPTB)a 3,404 (24.0) 1,550 (31.7) 266 (11.8) 1,588 (22.6)
Preterm birth, labour status unknowna 12 (0.1) 7 (0.1) 4 (0.2) 1 (0.0)
Medically indicated piPTBb 2,920 (85.8) 1,412 (91.1) 236 (88.7) 1,272 (80.1)
Not medically indicated piPTBb 333 (9.8) 79 (5.1) 7 (2.6) 247 (15.6)
Indication unknown, piPTBb 151 (4.4) 59 (3.8) 23 (8.6) 69 (4.3)aDenominator is all preterm births.bDenominator is all provider-initiated preterm births.
Figure 1 Study flowchart.
Vogel et al. BMC Pregnancy and Childbirth 2014, 14:56 Page 4 of 14http://www.biomedcentral.com/1471-2393/14/56

Figure 2 Phenotypes of preterm birth, 22 low- and middle-income countries.
Vogel et al. BMC Pregnancy and Childbirth 2014, 14:56 Page 5 of 14http://www.biomedcentral.com/1471-2393/14/56
to piPTB was 18.3% (interquartile range 12.6% to 34.7%).The proportion of piPTB deliveries that did not have amedical indication was generally less than 10% of allpiPTBs, however facilities in Sri Lanka (23.8%), China(22.3%) and India (16.2%) had the highest proportion ofnon-medically indicated piPTBs. Height <145 cm rangedfrom 0.2% (Algeria) to 9.7% (Nepal). Malaria and HIV/AIDS were largely confined to African countries, withmalaria ranging from 0.1% (Algeria) to 28.6% (Niger)and HIV/AIDS ranging from 0.2% (Algeria) to 3.7%(Uganda) in Africa. Pyelonephritis/UTI ranged from0.0% (Cambodia) to 28.2% (Ecuador), diabetes ranged
Figure 3 Phenotypes of preterm birth, Latin American countries.
from 0.1% (Kenya, Ecuador, Nicaragua, Cambodia andNepal) to 2.7% (Sri Lanka) and pre-eclampsia rangedfrom 0.4% (Sri Lanka) to 6.9% (Ecuador).Table 4 shows the bivariate and multivariate risk factor
analysis for preterm birth by regions and globally. In thepooled global analysis, all maternal morbidities (mater-nal height <145 cm, 145-149.9 cm and 150-154.9 cm,diabetes, pre-eclampsia, UTI/pyelonephritis) were signifi-cantly associated with spPTB, however these associationsvaried in magnitude and significance at the regional level.Diabetes was significant in Latin America and Africa andpre-eclampsia was significant in Africa and Asia. Maternal

Figure 4 Phenotypes of preterm birth, African countries.
Vogel et al. BMC Pregnancy and Childbirth 2014, 14:56 Page 6 of 14http://www.biomedcentral.com/1471-2393/14/56
height <145 cm and 145-149.9 cm, diabetes and pre-eclampsia were significantly associated with piPTB. InAfrica, malaria was significantly associated with spPTB(AOR 1.67, 95% CI 1.32 – 2.11) while HIV/AIDS did notreach significance for spPTB (AOR 1.17, 95% CI 0.79 –1.73) or piPTB (AOR 1.09, 95% CI 0.86 – 1.40).For both spPTB and piPTB groups, the prevalence of
all adverse neonatal outcomes decreased with increasinggestational age (Figures 6 and 7). Rates of adverse out-comes by gestational age bands were comparable be-tween spPTB and piPTB neonates, however the rates ofearly neonatal death before discharge/day 7 were con-sistently higher in piPTB neonates.
Figure 5 Phenotypes of preterm birth, Asian countries.
DiscussionWe used a dataset of 172,461 deliveries across 145 facil-ities in 22 LMICs to examine the contribution of com-mon maternal conditions to the risk of spPTB andpiPTB independently in LMICs, as well as the associatedperinatal outcomes. The accepted figure for provider-initiated preterm deliveries is 15-20%, [11] however wefound a piPTB rate of 24.0%, likely reflecting the higherrate of intervention in our facility-based sampling frame.In sub-Saharan African countries where resources forobstetric intervention are often very limited [24] thenon-medically indicated piPTB rate was lower (2.6%).The Latin American piPTB rate (31.7%) is likely due to

Table 2 Global maternal and neonatal characteristics for spontaneous, provider-initiated preterm births and termbirths in liveborn singletons (N = 172,449)*
Spontaneous preterm(spPTB) N (%)
Chi-square pvaluea
Provider-initiated preterm birth(piPTB) N (%)
Chi-square pvalueb
Term N (%)
Total 10,750 3,404 158,295
Maternal age <0.001 <0.001
<18 679 (6.3) 111 (3.3) 6,677 (4.2)
18-35 9,295 (86.5) 2,820 (82.8) 139,333 (88.0)
>35 771 (7.2) 473 (13.9) 12,233 (7.7)
Missing 5 (0.0) 0 (0.0) 52 (0.0)
Years of education <0.001 0.107
0 1,168 (10.9) 191 (5.6) 8,684 (5.5)
1 to 4 764 (7.1) 163 (4.8) 8,457 (5.3)
5 to 9 4,419 (41.1) 1,252 (36.8) 60,726 (38.4)
> = 10 4,139 (38.5) 1,731 (50.9) 77,824 (49.2)
Missing 260 (2.4) 67 (2.0) 2,604 (1.6)
Married 9,425 (87.7) <0.001 3,053 (89.7) 0.708 141,701 (89.5)
Missing 16 (0.1) 5 (0.1) 186 (0.1)
Parity <0.001 0.517
Parity 0 4,950 (46.0) 1,476 (43.4) 70,192 (44.3)
Parity 1-2 4,421 (41.1) 1,530 (44.9) 6,999 (44.2)
Parity > = 3 1,352 (12.6) 394 (11.6) 17,912 (11.3)
Missing 27 (0.3) 4 (0.1) 192 (0.1)
Number of antenatal carevisits
<0.001 <0.001
0 1,023 (9.5) 226 (6.6) 6,425 (4.1)
1 to 3 3,691 (34.3) 717 (21.1) 33,780 (21.3)
4 or more 5,804 (54.0) 2,396 (70.4) 115,685 (73.1)
Missing 232 (2.2) 65 (1.9) 2,405 (1.5)
Maternal height <0.001 <0.001
<145 cm 446 (4.1) 141 (4.1) 4,355 (2.8)
145 – 149.9 cm 991 (9.2) 332 (9.8) 12,583 (7.9)
150 – 154.9 cm 3,375 (31.4) 967 (28.4) 42,497 (26.8)
> = 155 cm 5,299 (49.3) 1,798 (52.8) 91,722 (58.0)
Missing 639 (5.9) 166 (4.9) 7,088 (4.5)
Antenatal medical andobstetric conditions
Malaria 225 (2.1) <0.001 18 (0.5) 0.003 1,669 (1.1)
HIV 79 (0.7) 0.182 31 (0.9) 0.042 995 (0.6)
Pyelonephritis/UTI 712 (6.6) 0.065 279 (8.2) 0.013 11,228 (7.1)
Diabetes 91 (0.8) 0.442 100 (2.9) <0.001 1,233 (0.8)
Pre-eclampsia 380 (3.5) <0.001 619 (18.2) <0.001 4,047 (2.6)
Mode of delivery <0.001 <0.001
Vaginal delivery 8,571 (79.7) 1,144 (33.6) 114,010 (72.0)
Caesarean section 2,178 (20.3) 2,260 (66.4) 44,281 (28.0)
Missing 1 (0.0) 0 (0.0) 4 (0.0)
Vogel et al. BMC Pregnancy and Childbirth 2014, 14:56 Page 7 of 14http://www.biomedcentral.com/1471-2393/14/56

Table 2 Global maternal and neonatal characteristics for spontaneous, provider-initiated preterm births and termbirths in liveborn singletons (N = 172,449)* (Continued)
Neonates
Mean birth weight (SD) 2436.1 (630.5) <0.001c 2308.2 (659.8) <0.001 3154.4 (476.2)
Mean GA (SD) 34.4 (2.3) <0.001c 34.2 (2.4) <0.001 39.1 (1.2)
Female sex 5,181 (48.2) 0.240 1,623 (47.7) 0.197 77,225 (48.8)
Facility characteristics:
Location
Urban 9,746 (90.7) <0.001 3,269 (96.0) <0.001 14,887 (94.0)
Peri-urban 731 (6.8) 66 (1.9) 4,891 (3.1)
Rural 273 (2.5) 69 (2.0) 4,547 (2.9)
Level of facility
Primary 347 (3.2) <0.001 19 (0.6) <0.001 3,471 (2.2)
Secondary 3,261 (30.3) 938 (27.6) 56,444 (35.7)
Tertiary 6,355 (59.1) 2,199 (64.6) 86,577 (54.7)
Other referral level 787 (7.3) 248 (7.3) 11,803 (7.5)*12 preterm deliveries with unknown labour status excluded from this table.aP value calculated by comparison between spontaneous preterm birth and term births only.bP value calculated by comparison between provider-initiated preterm birth and term births only.cStudents t-test used to calculated p-values for continuous variables birthweight and gestational age.
Vogel et al. BMC Pregnancy and Childbirth 2014, 14:56 Page 8 of 14http://www.biomedcentral.com/1471-2393/14/56
lower CS thresholds for and wider availability of electiveCS in these countries [25], however the rate of electivepiPTB deliveries in this region was also quite low (5.1%).The most surprising finding was the non-medically indi-
cated piPTB rate in Asia accounting for over 15% of allprovider-initiated preterm deliveries, driven by facilities inSri Lanka, China and India. While the reason for this isunclear, it could be due to gestational age estimationerrors, mis-documentation of indications for delivery, ma-ternal demand for elective deliveries (despite being pre-term) or a failure by providers to recognize the risks ofelective preterm deliveries. Elective deliveries should onlybe performed when there is a high degree of confidence inthe gestational age estimate as they increase the risk ofsome adverse maternal outcomes [26-28], and we haveshown that rates of neonatal morbidity and mortality at34- < 37 weeks were considerably higher. In resource-constrained settings, reducing these rates also allowsresource redirection to mothers in medical need of in-tervention. Maternal characteristics associated with pre-term deliveries were consistent with the literature [10,13]however in several countries and morbidities, the ex-tremely low prevalence is suggestive of significant under-diagnosis and/or a lack of universal screening protocols.There is a paucity of large-scale maternal morbidity pre-valence data from LMICs, particularly for UTI’s, pre-gestational diabetes and pre-eclampsia - our data, whilesuggestive of consistent under-recognition of commonmorbidities, are the largest and best available for severalLMICs.
Others have reported on the increased risk of PTBwith low maternal height, ranging from OR 1.17 to 1.61[29-31], however we have shown this occurs independ-ently for spPTB and piPTB at <145 cm and 145-149.9 cm.The association with spPTB was stronger in women inAsia where the prevalence of maternal height <145 cmwas higher, while Latin America and Africa did not reachsignificance – this could be due to the lower prevalence ofshorter women in these regions, malnutrition increasingthe risk of preterm birth [32] or potentially a racial predis-position at play. The relationship with piPTB may be dueto the clinician’s desire to avoid obstructed labor associ-ated with cephalopelvic disproportion [33].Malaria can contribute to almost 25% of maternal deaths
in endemic settings [34] and intermittent treatment duringpregnancy has been shown to reduce preterm birth [35].Malaria has been associated with 2-3 times the risk of pre-term birth [36-39], supported by the 67% increase in oddsin our African data. With regards to HIV, a meta-analysisof 31 studies by Brocklehurst and colleagues reported OR1.83 (1.63 – 2.06) for preterm delivery associated with HIVinfection in pregnancy [40] while Lopez and colleaguesdemonstrated increased odds for spPTB (AOR 2.1, 1.5 –3.0) and piPTB (AOR 3.2, 1.8 - 5.7) [41]. Our failure to findan association is likely related to the HIV rates in our data-set being considerably lower than national data. This maybe due to under-detection, under-recognition or under-documentation of HIV infection during delivery. Further-more, universal HIV screening may not be in use in thesefacilities, or mothers are declining testing or not reporting.
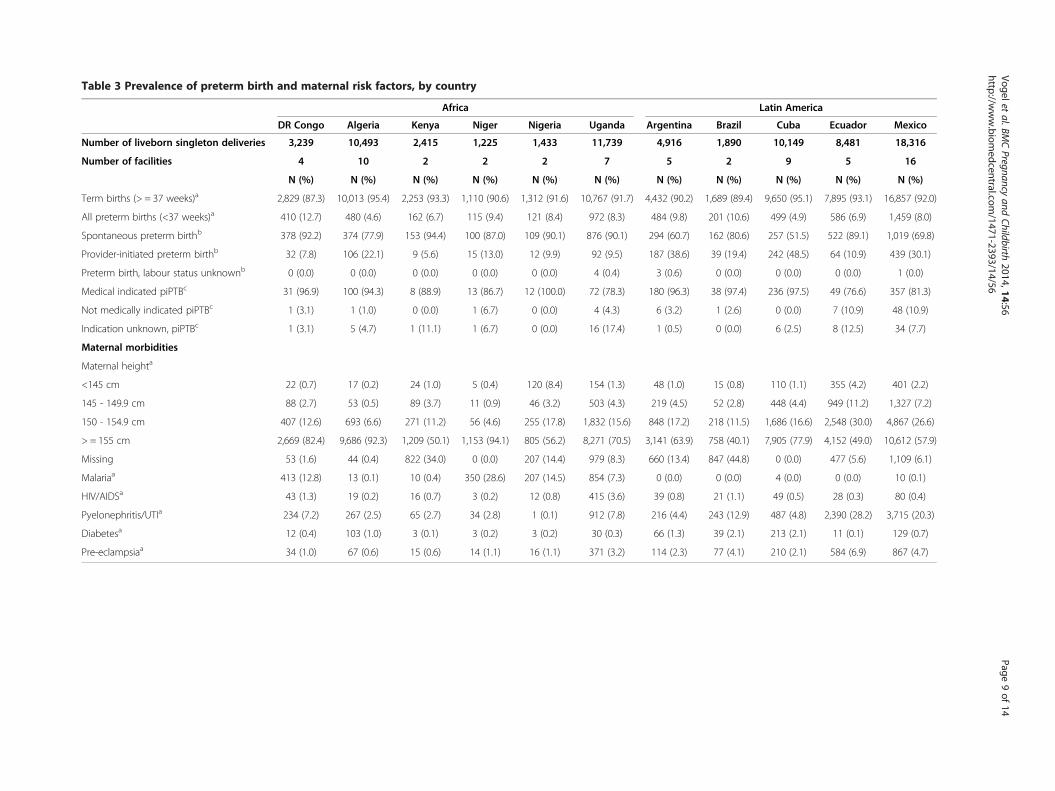
Table 3 Prevalence of preterm birth and maternal risk factors, by country
Africa Latin America
DR Congo Algeria Kenya Niger Nigeria Uganda Argentina Brazil Cuba Ecuador Mexico
Number of liveborn singleton deliveries 3,239 10,493 2,415 1,225 1,433 11,739 4,916 1,890 10,149 8,481 18,316
Number of facilities 4 10 2 2 2 7 5 2 9 5 16
N (%) N (%) N (%) N (%) N (%) N (%) N (%) N (%) N (%) N (%) N (%)
Term births (> = 37 weeks)a 2,829 (87.3) 10,013 (95.4) 2,253 (93.3) 1,110 (90.6) 1,312 (91.6) 10,767 (91.7) 4,432 (90.2) 1,689 (89.4) 9,650 (95.1) 7,895 (93.1) 16,857 (92.0)
All preterm births (<37 weeks)a 410 (12.7) 480 (4.6) 162 (6.7) 115 (9.4) 121 (8.4) 972 (8.3) 484 (9.8) 201 (10.6) 499 (4.9) 586 (6.9) 1,459 (8.0)
Spontaneous preterm birthb 378 (92.2) 374 (77.9) 153 (94.4) 100 (87.0) 109 (90.1) 876 (90.1) 294 (60.7) 162 (80.6) 257 (51.5) 522 (89.1) 1,019 (69.8)
Provider-initiated preterm birthb 32 (7.8) 106 (22.1) 9 (5.6) 15 (13.0) 12 (9.9) 92 (9.5) 187 (38.6) 39 (19.4) 242 (48.5) 64 (10.9) 439 (30.1)
Preterm birth, labour status unknownb 0 (0.0) 0 (0.0) 0 (0.0) 0 (0.0) 0 (0.0) 4 (0.4) 3 (0.6) 0 (0.0) 0 (0.0) 0 (0.0) 1 (0.0)
Medical indicated piPTBc 31 (96.9) 100 (94.3) 8 (88.9) 13 (86.7) 12 (100.0) 72 (78.3) 180 (96.3) 38 (97.4) 236 (97.5) 49 (76.6) 357 (81.3)
Not medically indicated piPTBc 1 (3.1) 1 (1.0) 0 (0.0) 1 (6.7) 0 (0.0) 4 (4.3) 6 (3.2) 1 (2.6) 0 (0.0) 7 (10.9) 48 (10.9)
Indication unknown, piPTBc 1 (3.1) 5 (4.7) 1 (11.1) 1 (6.7) 0 (0.0) 16 (17.4) 1 (0.5) 0 (0.0) 6 (2.5) 8 (12.5) 34 (7.7)
Maternal morbidities
Maternal heighta
<145 cm 22 (0.7) 17 (0.2) 24 (1.0) 5 (0.4) 120 (8.4) 154 (1.3) 48 (1.0) 15 (0.8) 110 (1.1) 355 (4.2) 401 (2.2)
145 - 149.9 cm 88 (2.7) 53 (0.5) 89 (3.7) 11 (0.9) 46 (3.2) 503 (4.3) 219 (4.5) 52 (2.8) 448 (4.4) 949 (11.2) 1,327 (7.2)
150 - 154.9 cm 407 (12.6) 693 (6.6) 271 (11.2) 56 (4.6) 255 (17.8) 1,832 (15.6) 848 (17.2) 218 (11.5) 1,686 (16.6) 2,548 (30.0) 4,867 (26.6)
> = 155 cm 2,669 (82.4) 9,686 (92.3) 1,209 (50.1) 1,153 (94.1) 805 (56.2) 8,271 (70.5) 3,141 (63.9) 758 (40.1) 7,905 (77.9) 4,152 (49.0) 10,612 (57.9)
Missing 53 (1.6) 44 (0.4) 822 (34.0) 0 (0.0) 207 (14.4) 979 (8.3) 660 (13.4) 847 (44.8) 0 (0.0) 477 (5.6) 1,109 (6.1)
Malariaa 413 (12.8) 13 (0.1) 10 (0.4) 350 (28.6) 207 (14.5) 854 (7.3) 0 (0.0) 0 (0.0) 4 (0.0) 0 (0.0) 10 (0.1)
HIV/AIDSa 43 (1.3) 19 (0.2) 16 (0.7) 3 (0.2) 12 (0.8) 415 (3.6) 39 (0.8) 21 (1.1) 49 (0.5) 28 (0.3) 80 (0.4)
Pyelonephritis/UTIa 234 (7.2) 267 (2.5) 65 (2.7) 34 (2.8) 1 (0.1) 912 (7.8) 216 (4.4) 243 (12.9) 487 (4.8) 2,390 (28.2) 3,715 (20.3)
Diabetesa 12 (0.4) 103 (1.0) 3 (0.1) 3 (0.2) 3 (0.2) 30 (0.3) 66 (1.3) 39 (2.1) 213 (2.1) 11 (0.1) 129 (0.7)
Pre-eclampsiaa 34 (1.0) 67 (0.6) 15 (0.6) 14 (1.1) 16 (1.1) 371 (3.2) 114 (2.3) 77 (4.1) 210 (2.1) 584 (6.9) 867 (4.7)
Vogeletal.BM
CPregnancy
andChildbirth
2014,14:56Page
9of
14http://w
ww.biom
edcentral.com/1471-2393/14/56

Table 3 Prevalence of preterm birth and maternal risk factors, by country (Continued)
Latin America Asia
Nicaragua Paraguay Peru Cambodia China India Nepal Ph lippine Sri Lanka Thailand Vietnam
Number of liveborn singleton deliveries 5,002 2,624 12,803 5,064 8,740 17,199 7,440 ,971 14,037 8,926 7,439
Number of facilities 4 4 9 4 9 13 6 8 12 9 3
N (%) N (%) N (%) N (%) N (%) N (%) N (%) (%) N (%) N (%) N (%)
Term births (> = 37 weeks)a 4,669 (93.3) 2,367 (90.2) 11,729 (91.6) 4,733 (93.5) 8,247 (94.4) 14,554 (85.0) 6,764 (90.9) 8,2 0 (91.7) 13,069 (93.1) 7,977 (89.6) 7,129 (95.8)
All preterm births (<37 weeks)a 333 (6.7) 257 (9.8) 1,074 (8.4) 331 (6.5) 493 (5.6) 2,565 (15.0) 676 (9.1) 7 1 (8.3) 968 (6.9) 929 (10.4) 310 (4.2)
Spontaneous preterm birthb 239 (71.8) 161 (62.6) 682 (63.5) 281 (84.9) 314 (63.7) 2,091 (81.5) 592 (87.6) 6 (86.6) 481 (49.7) 760 (81.8) 263 (84.8)
Provider-initiated preterm birthb 94 (28.2) 93 (36.2) 392 (36.5) 50 (15.1) 179 (36.3) 474 (18.5) 84 (12.4) 9 (13.4) 487 (50.3) 168 (18.1) 47 (15.2)
Preterm birth, labour status unknownb 0 (0.0) 3 (1.2) 0 (0.0) 0 (0.0) 0 (0.0) 0 (0.0) 0 (0.0) (0.0) 0 (0.0) 1 (0.1) 0 (0.0)
Medical indicated piPTBc 83 (88.3) 84 (90.3) 385 (98.2) 49 (98.0) 131 (73.2) 390 (82.3) 82 (97.6) 9 (90.9) 334 (68.6) 151 (89.9) 45 (95.7)
Not medically indicated piPTBc 11 (11.7) 4 (4.3) 2 (0.5) 1 (2.0) 40 (22.3) 77 (16.2) 0 (0.0) (0.0) 116 (23.8) 11 (6.5) 2 (4.3)
Indication unknown, piPTBc 0 (0.0) 5 (5.4) 5 (1.3) 0 (0.0) 8 (4.5) 7 (1.5) 2 (2.4) (9.1) 37 (7.6) 6 (3.6) 0 (0.0)
Maternal morbidities
Maternal heighta
<145 cm 202 (4.0) 31 (1.2) 491 (3.8) 128 (2.5) 35 (0.4) 721 (4.2) 722 (9.7) 3 4 (4.3) 772 (5.5) 129 (1.4) 56 (0.8)
145 - 149.9 cm 635 (12.7) 81 (3.1) 1,505 (11.8) 527 (10.4) 122 (1.4) 1,842 (10.8) 1,575 (21.2) 7 2 (8.3) 2,024 (14.4) 727 (8.1) 341 (4.6)
150 - 154.9 cm 1,769 (35.4) 424 (16.2) 3,776 (29.5) 1,678 (33.1) 1,171 (13.4) 8,667 (50.6) 3,801 (51.1) 2,7 9 (30.3) 4,569 (32.5) 2,274 (25.5) 2,313 (31.1)
> = 155 cm 2,396 (47.9) 1,876 (71.5) 6,099 (47.6) 2,644 (52.2) 7,403 (84.7) 5,848 (34.2) 1,334 (17.9) 3,9 5 (43.9) 6,589 (46.9) 5,663 (63.4) 4,728 (63.6)
Missing 0 (0.0) 212 (8.1) 932 (7.3) 87 (1.7) 9 (0.1) 41 (0.2) 8 (0.1) 1,1 1 (13.3) 83 (0.6) 133 (1.5) 1 (0.0)
Malariaa 0 (0.0) 2 (0.1) 2 (0.0) 2 (0.0) 0 (0.0) 37 (0.2) 2 (0.0) (0.0) 2 (0.0) 3 (0.0) 1 (0.0)
HIV/AIDSa 20 (0.4) 3 (0.1) 36 (0.3) 42 (0.8) 17 (0.2) 57 (0.3) 7 (0.1) (0.2) 11 (0.1) 111 (1.2) 57 (0.8)
Pyelonephritis/UTIa 266 (5.3) 53 (2.0) 2,602 (20.3) 2 (0.0) 6 (0.1) 84 (0.5) 5 (0.1) 4 9 (5.6) 86 (0.6) 15 (0.2) 37 (0.5)
Diabetesa 6 (0.1) 12 (0.5) 21 (0.2) 5 (0.1) 70 (0.8) 45 (0.3) 6 (0.1) (0.5) 385 (2.7) 199 (2.2) 14 (0.2)
Pre-eclampsiaa 135 (2.7) 87 (3.4) 830 (6.5) 108 (2.1) 184 (2.1) 567 (3.3) 88 (1.2) 3 3 (4.0) 54 (0.4) 188 (2.1) 75 (1.0)aPercentage calculated using number of liveborn singleton deliveries in country X as denominator.bPercentage calculated using number of all preterm births in country X as denominator.cPercentage calculated using number of all provider-initiated preterm births in country X as denominator.
Vogeletal.BM
CPregnancy
andChildbirth
2014,14:56Page
10of
14http://w
ww.biom
edcentral.com/1471-2393/14/56
i
8
N
3
4
42
9
0
0
0
9
8
4
1
3
9
1
19
9
42
6

Table 4 Crude and adjusted odds of preterm birth (spontaneous and provider-initiated) associated with maternalmorbidities, by region and globally
Spontaneous preterm birth (spPTB) Provider-initiated preterm birth (piPTB)
OR (95% CI) AOR (95% CI) OR (95% CI) AOR (95% CI)
Latin America Maternal height
<145 cm 1.15 (0.92 – 1.42) 1.05 (0.85 – 1.28) 0.99 (0.72 – 1.36) 1.15 (0.85 – 1.57)
145 – 149.9 cm 1.08 (0.95 – 1.23) 1.06 (0.93 – 1.20) 0.92 (0.76 – 1.11) 0.99 (0.82 – 1.20)
150 – 154.9 cm 1.10 (1.01 – 1.19) 1.06 (0.96 – 1.17) 0.93 (0.82 – 1.05) 0.99 (0.86 – 1.13)
> = 155 cm Ref Ref Ref Ref
Pyelonephritis/UTI 1.07 (0.97 – 1.18) 1.20 (1.01 – 1.42)* 1.08 (0.94 – 1.23) 1.27 (0.96 – 1.67)
Diabetes 1.34 (0.93 – 1.92) 1.72 (1.15 – 2.58)* 3.47 (2.48 – 4.85) 2.23 (1.48 – 3.38)*
Pre-eclampsia 1.38 (1.18 – 1.62) 1.18 (0.92 – 1.53) 7.80 (6.90 – 8.83) 7.43 (5.69 – 9.69)
Africa Maternal height
<145 cm 2.02 (1.44 – 2.83) 1.46 (0.81 – 2.62) 1.91 (0.78 – 4.67) 1.21 (0.75 – 1.96)
145 – 149.9 cm 1.22 (0.93 – 1.62) 0.91 (0.72 – 1.16) 1.73 (0.94 – 3.19) 1.13 (0.80 – 1.58)
150 – 154.9 cm 1.51 (1.33 – 1.72) 1.22 (1.04 – 1.43)* 1.33 (0.93 – 1.89) 1.05 (0.92 – 1.19)
> = 155 cm Ref Ref Ref Ref
Malaria 2.00 (1.72 – 2.33) 1.67 (1.32 – 2.11)* 1.06 (0.64 – 1.76) 1.01 (0.84 – 1.21)
HIV/AIDS 1.10 (0.78 – 1.54) 1.17 (0.79 – 1.73) 1.61 (0.75 – 3.42) 1.09 (0.86 – 1.40)
Pyelonephritis/UTI 0.91 (0.73 – 1.13) 0.91 (0.66 – 1.24) 0.44 (0.20 – 0.99) 0.91 (0.81 – 1.02)
Diabetes 1.76 (1.06 – 2.92) 1.96 (1.03 – 3.71)* 4.71 (2.06 – 10.75) 1.66 (1.09 – 2.55)*
Pre-eclampsia 1.40 (1.02 – 1.93) 1.55 (1.11 – 2.17)* 13.57 (9.74 – 18.91) 3.59 (2.02 – 6.40)*
Asia Maternal height
<145 cm 2.12 (1.88 – 2.41) 1.39 (1.13 – 1.71)* 1.94 (1.56 – 2.41) 1.58 (1.26 – 1.98)*
145 – 149.9 cm 1.60 (1.46 – 1.76) 1.21 (1.08 – 1.36)* 1.48 (1.26 – 1.73) 1.25 (1.02 – 1.53)*
150 – 154.9 cm 1.54 (1.45 – 1.64) 1.13 (1.01 – 1.26)* 1.18 (1.05 – 1.32) 1.11 (0.97 – 1.27)
> = 155 cm Ref Ref Ref Ref
Pyelonephritis/UTI 1.53 (1.21 – 1.95) 1.17 (0.78 – 1.77) 1.25 (0.78 – 2.01) 1.30 (0.68 – 2.49)
Diabetes 0.82 (0.60 – 1.12) 1.15 (0.82 – 1.62) 3.83 (2.91 – 5.06) 2.58 (1.59 – 4.19)*
Pre-eclampsia 1.64 (1.39 – 1.94) 1.26 (1.00 – 1.59)* 7.69 (6.56 – 9.02) 8.34 (6.54 – 10.64)*
Global Maternal height
<145 cm 1.77 (1.60 – 1.96) 1.30 (1.10 – 1.52)* 1.65 (1.39 – 1.97) 1.47 (1.23 – 1.77)*
145 – 149.9 cm 1.36 (1.27 – 1.46) 1.15 (1.06 – 1.24)* 1.35 (1.20 – 1.52) 1.18 (1.02 – 1.36)*
150 – 154.9 cm 1.38 (1.32 – 1.44) 1.11 (1.04 – 1.19)* 1.16 (1.07 – 1.26) 1.08 (0.98 – 1.19)
> = 155 cm Ref Ref Ref Ref
Pyelonephritis/UTI 0.93 (0.86 – 1.01) 1.16 (1.01 – 1.33)* 1.17 (1.03 – 1.32) 1.24 (0.96 – 1.59)
Diabetes 1.09 (0.88 – 1.35) 1.41 (1.09 – 1.82)* 3.86 (3.14 – 4.74) 2.51 (1.81 – 3.47)*
Pre-eclampsia 1.40 (1.26 – 1.55) 1.25 (1.05 – 1.49)* 8.47 (7.72 – 9.29) 8.17 (6.80 – 9.83)*
*adjusted odds ratios that reached statistical significance (95% CI excludes 1).
Vogel et al. BMC Pregnancy and Childbirth 2014, 14:56 Page 11 of 14http://www.biomedcentral.com/1471-2393/14/56
Regardless, under-diagnosis is a cause for concern in thelarger African facilities that participated in the WHOGS,where obstetric services and HIV diagnostic capacity arelikely higher than average.The increased risk of prematurity in mothers with pre-
gestational diabetes is nearly four-fold higher [42], how-ever this is at least partly driven by iatrogenic prematurity[43] - whether pre-gestational diabetes is an independent
risk factor for spPTB is unclear. Our findings support the60% increase in the odds of spPTB reported by Sibai andcolleagues [44]. Given the growing global epidemic of dia-betes and obesity, preterm birth rates will likely bedriven higher by this relationship. Our findings alsosupport studies that have implicated urinary tract infec-tions [45] and pre-eclampsia [46,47] in preterm birth. Pre-eclampsia is a leading indication for piPTB [46] - the lower

Figure 6 Perinatal outcomes in spontaneous preterm births.
Vogel et al. BMC Pregnancy and Childbirth 2014, 14:56 Page 12 of 14http://www.biomedcentral.com/1471-2393/14/56
magnitude risk of piPTB in African countries (AOR 3.59)compared to overall (AOR 8.17) likely reflects a rela-tively lower number of women with pre-eclampsia beingmanaged with caesarean, or perhaps comparative overusein other settings. It is important to note that many ofthese conditions can co-occur in LMICs, and improvedaccess and use of health prevention strategies (such asantenatal screening programmes) in these settings willlikely yield a secondary benefit of reduced spPTB rates.Although most adverse perinatal outcomes decreased inprevalence with increasing gestational age, the NICU ad-mission rate was generally lower than we expected, (par-ticularly for early preterm infants) possibly due to poor
Figure 7 Perinatal outcomes in provider-initiated preterm birth.
NICU access. In an estimation exercise for CHERG,Blencowe et al estimated that in countries with <80%national facility delivery rates, <50% of infants had accessto a neonatal intensive care unit (personal communica-tion). While piPTB may save an infant’s life, the higherearly neonatal mortality rate following piPTB likely re-flects the maternal indication.Our analysis had several strengths - it was conducted
in a large, multi-country dataset and stratified by typeof preterm birth and region. Most preterm analyses arefrom high-income settings and are generally not segre-gated by preterm phenotypes; they are unable to distin-guish increased risks of of spPTB from an increased

Vogel et al. BMC Pregnancy and Childbirth 2014, 14:56 Page 13 of 14http://www.biomedcentral.com/1471-2393/14/56
propensity of providers to intervene (such as for mater-nal height <145 cm, diabetes and pre-eclampsia). Theseepidemiological data on preterm birth groups and ma-ternal morbidities are the best available for severalLMICs. Despite our efforts controlling for multiple con-founders, some limitations persist. The sample was pri-marily drawn from larger, urban facilities and thereforesubject to reporting and/or selection biases (higher ratesof complicated pregnancies, or wealthier and more urbanmothers attending tertiary care level facilities). Higher CSrates in some countries and facilities reflect this, thereforethese findings are not representative of the population andcan only be extrapolated to similar settings. Furthermore,the data is based on retrospective review of medical re-cords (which may have been sub-optimal) and morbiditysurveillance may not have been universal in these facilities.The method of diagnosis, timing, severity and treatmentof these morbidities, as well as the method of gestationalage determination, was not recorded. We lacked data onsome relevant PTB risk factors, such as smoking, birthspacing, sexually transmitted infections, physical exertionand lifestyle risk factors. Intrauterine fetal deaths were notincluded. It is important to acknowledge that women whoundergo preterm birth and/or provider interventions maybe more likely to have a risk factor diagnosed than otherwomen, potentially distorting associations.
ConclusionIn facility deliveries in 22 low- and middle-incomecountries, 24.0% of preterm births were provider-initiated,yet nearly 10% of these were without a medical indicationand potentially avoidable. Maternal height <155 cm, py-elonephritis/UTI, diabetes, pre-eclampsia and malaria in-dependently increased the odds of spontaneous pretermbirth. Furthermore, malaria was significantly associatedwith spontaneous preterm birth in Africa. Aside from ma-ternal height, these common maternal conditions areamenable to screening, prevention and treatment – failureto do so increases the risk of preterm birth and associatedneonatal morbidity and mortality in LMICs. Strategies toreduce preterm birth in LMICs must prioritise maternalantenatal screening and treatment of these conditions.
AbbreviationsAOR: Adjusted odds ratio; CHERG: Child health epidemiology referencegroup; CS: Caesarean section; ICU: Intensive care unit; HIV/AIDS: Humanimmunodeficiency virus/acquired immunodeficiency syndrome; LMICs:Low- and middle-income countries; NICU: Neonatal intensive care unit;OECD: Organization for economic cooperation and development;OR: Odds ratio; piPTB: Provider-initiated preterm birth; PTB: Preterm birth;spPTB: Spontaneous preterm birth; USAID: United States Agency forInternational Development; UTI: Urinary tract infection; WHO: World HealthOrganization; WHOGS: World Health Organization Global Survey on Maternaland Perinatal Health.
Competing interestsThe authors declare they have no competing interests.
Authors’ contributionsJPV and ACL designed the analysis, JPV performed the analysis and JPV, ACLand JPS drafted the paper. All authors contributed to and approved the finalversion of the manuscript. JPV had full access to the dataset in the study andtakes responsibility for the integrity of the data and the accuracy of the dataanalysis. The views contained within this manuscript represent the views ofthe named authors alone.
AcknowledgementsJPV is supported by an Australian Postgraduate Award and the A & A SawScholarship. The WHO Global Survey on Maternal and Perinatal Health wasfunded by the Governments of China, India and Japan, and the UnitedStates Agency for International Development (USAID). ACL is supported by agrant from the Bill and Melinda Gates Foundation to the US Fund forUNICEF which supports the work of the Child Health EpidemiologyReference Group.
Author details1School of Population Health, Faculty of Medicine, Dentistry and HealthSciences, University of Western Australia, 35 Stirling Highway, Crawley 6009,Australia. 2UNDP/UNFPA/UNICEF/WHO/World Bank Special Programme ofResearch, Development and Research Training in Human Reproduction(HRP), Department of Reproductive Health and Research, World HealthOrganization, Avenue Appia 20, Geneva CH-1211, Switzerland. 3Departmentof International Health, Johns Hopkins Bloomberg School of Public Health,Baltimore, MD, USA. 4Department of Newborn Medicine, Brigham andWomen’s Hospital, Boston, MA, USA.
Received: 1 April 2013 Accepted: 22 January 2014Published: 31 January 2014
References1. Blencowe H, Cousens S, Oestergaard MZ, Chou D, Moller A-B, Narwal R,
Adler A, Garcia CV, Rohde S, Say L, Lawn JE: National, regional, and world-wide estimates of preterm birth rates in the year 2010 with time trendssince 1990 for selected countries: a systematic analysis and implications.Lancet 2012, 379:2162–2172.
2. Teune MJ, Bakhuizen S, Bannerman CG: A systematic review of severemorbidity in infants born late preterm. AJOG 2011, 205:374.
3. Katz J, Lee AC, Kozuki N, Lawn JE, Blencowe H, Ezzati M, CHERG Preterm-SGAWorking Group: Born too small or too soon: a pooled analysis of mortalityrisk among preterm and small-for-gestational-age infants in low- andmiddle-income countries. Lancet 2013, 382(9890):417–425.
4. Liu L, Johnson HL, Cousens S, Perin J, Scott S, Lawn JE, Rudan I, Campbell H,Cibulskis R, Li M, Mathers C, Black RE: Global, regional, and national causesof child mortality: an updated systematic analysis for 2010 with timetrends since 2000. Lancet 2012, 379:2151–2161.
5. Boyle EM, Poulsen G, Field DJ, Kurinczuk JJ, Wolke D, Alfirevic Z, QuigleyMA: Effects of gestational age at birth on health outcomes at 3 and 5years of age: population based cohort study. BMJ 2011, 344:e896–e896.
6. van Baar ALA, Vermaas JJ, Knots EE, de Kleine MJKM, Soons PP: Functioningat school age of moderately preterm children born at 32 to 36 weeks’gestational age. Pediatrics 2009, 124:251–257.
7. Talge N, Holzman C, Wang J, Lucia V: Late-preterm birth and itsassociation with cognitive and socioemotional outcomes at 6 years ofage. Pediatrics 2010, 126:1124–1131.
8. Ekeus C, Lindström K, Lindblad F, Rasmussen F, Hjern A: Preterm birth,social disadvantage, and cognitive competence in Swedish 18- to 19-year-old men. Pediatrics 2010, 125:e67–e73.
9. Hovi P, Andersson S, Eriksson JG, Järvenpää A-L, Strang-Karlsson S, MäkitieO, Kajantie E: Glucose regulation in young adults with very low birthweight. N Engl J Med 2007, 356:2053–2063.
10. March of Dimes, PMNCH, Save the Children, WHO: Born Too Soon: theGlobal Action Report on Preterm Birth. Geneva, Switzerland: World HealthOrganization; 2012.
11. Menon R: Spontaneous preterm birth, a clinical dilemma: etiologic,pathophysiologic and genetic heterogeneities and racial disparity.Acta Obstet Gynecol Scand 2008, 87:590–600.
12. Plunkett J, Muglia LJ: Genetic contributions to preterm birth: implicationsfrom epidemiological and genetic association studies. Ann Med 2008,40:167–195.

Vogel et al. BMC Pregnancy and Childbirth 2014, 14:56 Page 14 of 14http://www.biomedcentral.com/1471-2393/14/56
13. Goldenberg RL, Culhane JF, Iams JD, Romero R: Epidemiology and causesof preterm birth. Lancet 2008, 371:75–84.
14. Muglia LJ, Katz M: The enigma of spontaneous preterm birth. N Engl JMed 2010, 362:529–535.
15. Shah A, Faundes A, Machoki M, Bataglia V, Amokrane F, Donner A, Mugerwa K,Carroli G, Fawole B, Langer A, Wolombyk JJ, Naravaez A, Nafiou I, Kublickas M,Valladares E, Velasco A, Zavaleta N, Neves I, Villar J: Methodologicalconsiderations in implementing the WHO Global Survey for MonitoringMaternal and Perinatal Health. Bull World Health Organ 2008, 86:126–131.
16. Lumbiganon P, Laopaiboon M, Taneepanichskul S: Method of delivery andpregnancy outcomes in Asia: the WHO global survey on maternal andperinatal health 2007-08. Lancet 2010, 375:490–499.
17. Ozaltin E, Hill K, Subramanian SV: Association of maternal stature withoffspring mortality, underweight, and stunting in low- to middle-incomecountries. JAMA 2010, 303:1507–1516.
18. Black R, Allen L, Bhutta Z, Caulfield L: Maternal and child under nutrition:global and regional exposures and health consequences. Lancet 2008,371(9608):243–260.
19. Subramanian SV, Ackerson LK, Smith GD, John NA: Association of maternalheight with child mortality, anthropometric failure, and anemia in India.JAMA 2009, 301:1691–1701.
20. Dodd JM, Crowther CA, Haslam RR, Robinson JS: Elective birth at 37 weeksof gestation versus standard care for women with an uncomplicatedtwin pregnancy at term: the Twins Timing of Birth Randomised Trial.BJOG: Int J Obstetr Gynaecol 2012, 119:964–973.
21. Bakr AF, Karkour T: What is the optimal gestational age for twin delivery.BMC Pregn Childbirth 2006, 6:3.
22. Alexander GR, Himes JH, Kaufman RB, Mor J, Kogan M: A United Statesnational reference for fetal growth. Obstet Gynecol 1996, 87:163–168.
23. IBM Corporation: PASW Statistics 20. Available: https://www.ibm.com/software/analytics/spss/.
24. Gibbons L, Belizan J, Lauer J, Betran A: Inequities in the use of caesareansections in the World. Am J Obstet Gynecol 2012, 206:331.
25. Betrán AP, Gulmezoglu M, Robson M, Merialdi M, Souza J, Wojdyla D,Widmer M, Carroli G, Torloni M, Langer A, Narvaez A, Velasco A, Faundes A,Acosta A, Valladares E, Romero M, Zavaleta N, Reynoso S, Bataglia V: WHOGlobal Survey on Maternal and Perinatal Health in Latin America:classifying caesarean sections. Reprod Health 2009, 6:18–18.
26. Guerra G, Cecatti J, Souza J: Elective induction versus spontaneous labourin Latin America. Bull World Health Organ 2011, 89:657–665.
27. Vogel J, Souza JP, Gulmezoglu AM: Patterns and outcomes of induction oflabour in Africa and Asia: a secondary analysis of the WHO GlobalSurvey on Maternal and Neonatal Health. Plos One. in press.
28. Souza J, Gülmezoglu A, Lumbiganon P, Laopaiboon M, Carroli G, Fawole B,Ruyan P, the WHO Global Survey on Maternal and Perinatal Health ResearchGroup: Caesarean section without medical indications is associatedwith an increased risk of adverse short-term maternal outcomes: the2004-2008 WHO Global Survey on Maternal and Perinatal Health.BMC Medicine 2010, 8:71.
29. Kramer MS, McLean FH, Eason EL, Usher RH: Maternal nutrition andspontaneous preterm birth. Am J Epidemiol 1992, 136:574–583.
30. Kelly A, Kevany J, de Onis M: A WHO collaborative study of maternalanthropometry and pregnancy outcomes. Int J Gynecol Obstet 1996, 57:1–15.
31. Ben Chong-Pun C, Lao TTH: Maternal height and length of gestation:does this impact on preterm labour in Asian women? Aust N Z J ObstetGynaecol 2009, 49:388–392.
32. Wu G, Imhoff-Kunsch B, Girard AW: Biological mechanisms for nutritionalregulation of maternal health and fetal development. Paediatr PerinatEpidemiol 2012, 26:4–26.
33. Toh-Adam RR, Srisupundit KK, Tongsong TT: Short stature as anindependent risk factor for cephalopelvic disproportion in a country ofrelatively small-sized mothers. Arch Gynecol Obstet 2012, 285:1513–1516.
34. Schantz-Dunn J, Nour NM: Malaria and pregnancy: a global healthperspective. Rev Obstet Gynecol 2008, 2:186–192.
35. Luntamo MM, Kulmala TT, Mbewe BB, Cheung YBY, Maleta KK, Ashorn PP:Effect of repeated treatment of pregnant women with sulfadoxine-pyrimethamine and azithromycin on preterm delivery in Malawi: arandomized controlled trial. Am J Trop Med Hyg 2010, 83:1212–1220.
36. Kalanda BFB, Verhoeff FHF, Chimsuku LL, Harper GG, Brabin BJB:Adverse birth outcomes in a malarious area. Bull Entomol Res 2006,134:659–666.
37. Ticconi C, Mapfumo M, Dorrucci M, Naha N, Tarira E, Pietropolli A, Rezza G:Effect of maternal HIV and malaria infection on pregnancy and perinataloutcome in Zimbabwe. J Acquir Immune Defic Syndr 2003, 34:289–294.
38. Noble A, Ning Y, Woelk GB, Mahomed K, Williams MA: Preterm delivery riskin relation to maternal HIV infection, history of malaria and otherinfections among urban Zimbabwean women. Cent Afr J Med 2005,51:53–58.
39. Gravett MG, Rubens CE, Nunes TM, Group GR: Global report on pretermbirth and stillbirth (2 of 7): discovery science. BMC Pregn Childbirth 2009,10(Suppl 1):S2–S2.
40. Brocklehurst P, French R: The association between maternal HIVinfection and perinatal outcome: a systematic review of the literatureand meta-analysis. BJOG: Int J Obstetr Gynaecol 1998, 105:836–848.
41. Lopez M, Figueras F, Hernandez S, Lonca M, Garcia R, Palacio M, Coll O:Association of HIV infection with spontaneous and iatrogenic pretermdelivery: effect of HAART. AIDS 2012, 26:37–43.
42. Ray JG, Vermeulen MJ, Shapiro JL, Kenshole AB: Maternal and neonataloutcomes in pregestational and gestational diabetes mellitus, and theinfluence of maternal obesity and weight gain: the DEPOSIT study.Diabetes Endocrine Pregnancy Outcome Study in Toronto. Q J Med 2001,94:347–356.
43. Yanit KE, Snowden JM, Cheng YW, Caughey AB: The impact of chronichypertension and pregestational diabetes on pregnancy outcomes.Am J Obstet Gynecol 2012, 207:333–336.
44. Sibai BMB, Caritis SNS, Hauth JCJ, MacPherson CC, VanDorsten JPJ,Klebanoff MM, Landon MM, Paul RHR, Meis PJP, Miodovnik MM,Dombrowski MPM, Thurnau GRG, Moawad AHA, Roberts JJ: Pretermdelivery in women with pregestational diabetes mellitus or chronichypertension relative to women with uncomplicated pregnancies.Am J Obstet Gynecol 2000, 183:5–5.
45. Mazor-Dray E, Levy A, Schlaeffer F, Sheiner E: Maternal urinary tractinfection: is it independently associated with adverse pregnancyoutcome? J Matern Fetal Neonatal Med 2009, 22:124–128.
46. Gruslin A, Lemyre B: Pre-eclampsia: Fetal assessment and neonataloutcomes. Best Pract Res Clin Obstet Gynaecol 2011, 25:17–17.
47. Yücesoy G, Ozkan S, Bodur H, Tan T, Calişkan E, Vural B, Corakçi A: Maternaland perinatal outcome in pregnancies complicated with hypertensivedisorder of pregnancy: a seven year experience of a tertiary care center.Arch Gynecol Obstet 2005, 273:43–49.
doi:10.1186/1471-2393-14-56Cite this article as: Vogel et al.: Maternal morbidity and preterm birth in22 low- and middle-income countries: a secondary analysis of the WHOGlobal Survey dataset. BMC Pregnancy and Childbirth 2014 14:56.
Submit your next manuscript to BioMed Centraland take full advantage of:
• Convenient online submission
• Thorough peer review
• No space constraints or color figure charges
• Immediate publication on acceptance
• Inclusion in PubMed, CAS, Scopus and Google Scholar
• Research which is freely available for redistribution
Submit your manuscript at www.biomedcentral.com/submit