Embed Size (px)
Citation preview

Math 110 (Lehmann)Lecture 1.2
Scattergrams, Marijuana and Inventions

Section Overview
• Coordinate System– Axes – Ordered Pairs– Plotting Points
• Creating Scattergrams on Graph Paper• Independent & Dependent Variables

Before we look at the data…
• What percentage of adults in the U.S. do you think are in favor of legalizing marijuana use?
• Do you think this percentage is higher (no pun intended) or lower than in 1969?
Percentage of Adults in Favor of Legalizing Marijuana Use
year percentage
1969 12
1973 16
1977 28
1980 25
1985 23
1995 25
2000 31
2005 29
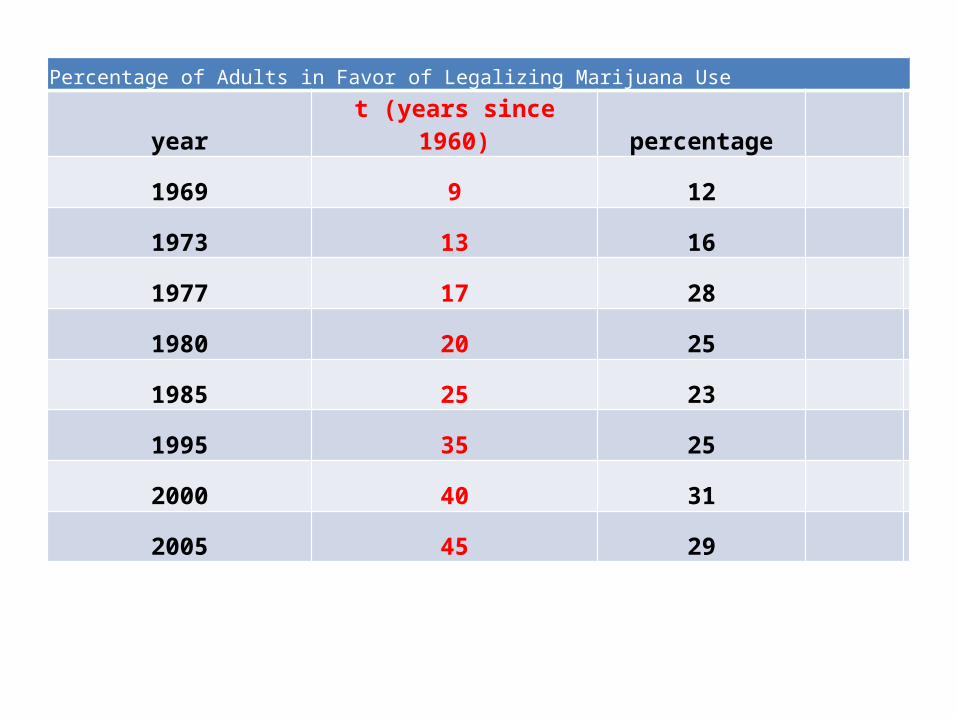
Percentage of Adults in Favor of Legalizing Marijuana Use
year t (years since 1960) percentage
1969 9 12
1973 13 16
1977 17 28
1980 20 25
1985 25 23
1995 35 25
2000 40 31
2005 45 29
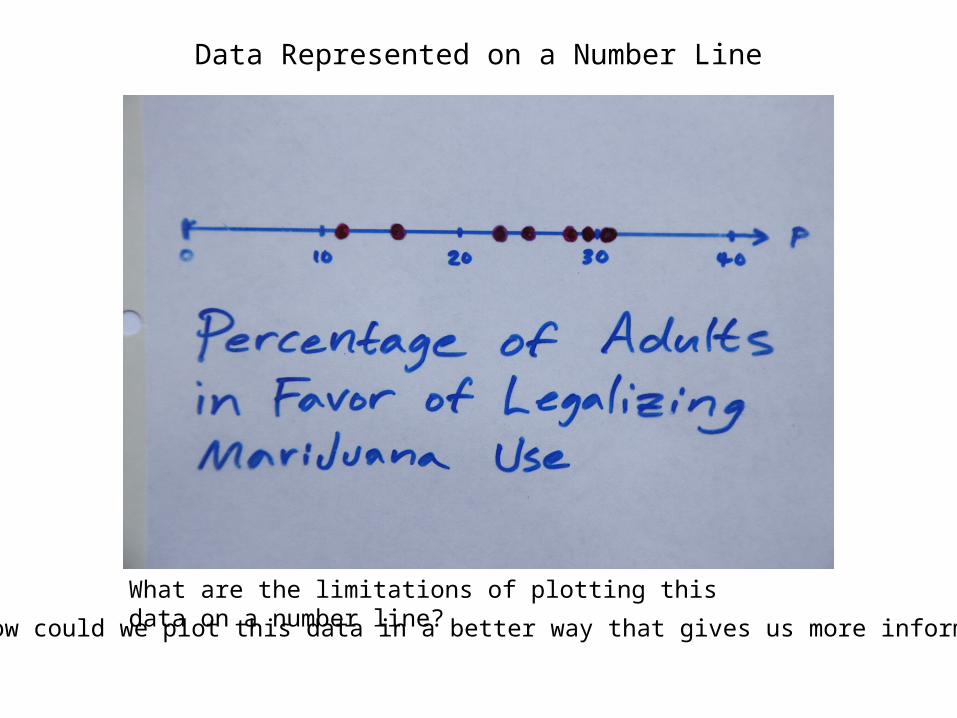
Data Represented on a Number Line
What are the limitations of plotting this data on a number line?
How could we plot this data in a better way that gives us more information?

Scattergram Representation
5 10 15 20 25 30 35 40 45 500
5
10
15
20
25
30
35
Percentage of adults in favor of legalizing marijuana use
How is this scattergram graph better than the number line graph?Overall, is the percentage increasing or decreasing with time?Is the percentage always increasing?What was the largest change? What was the fastest change?

Independent & Dependent Variables
5 10 15 20 25 30 35 40 45 500
5
10
15
20
25
30
35
Percentage of adults in favor of legalizing marijuana use
Like many problems, this one has two variables. In this problem, the variables are t = time and p = percentage. Which one of these depends on the other? Which one is independent of the other?
Note: when we make a scattergram, the horizontal axis relates to the independent variable, and the vertical axis relates to the dependent variable.

Ordered Pairs and Points
5 10 15 20 25 30 35 40 45 500
5
10
15
20
25
30
35
Percentage of adults in favor of legalizing marijuana use
The coordinates of each data point are listed as an ordered pair of the form:(value of independent variable, value of dependent variable).
•For this problem, that means our ordered pairs are of the form: (t-value, p-value). •So, the coordinates of the first three points are (9, 12), (13, 16) and (17, 28).•What are the coordinates of the last point?•If we knew that (30,27) was another point on the graph, what would that mean in real life terms?
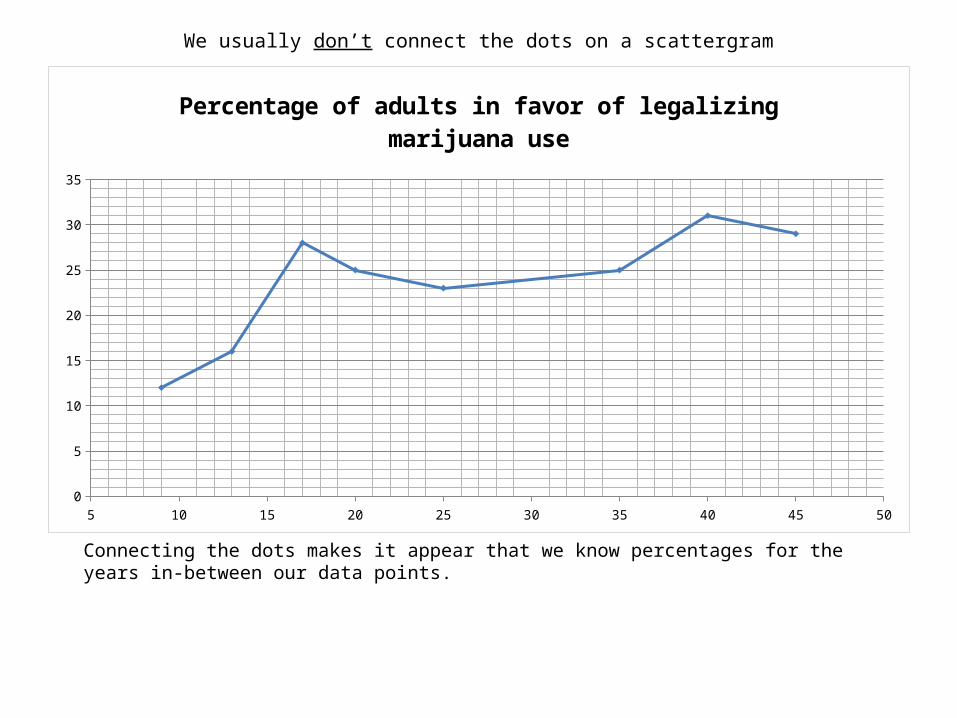
We usually don’t connect the dots on a scattergram
5 10 15 20 25 30 35 40 45 500
5
10
15
20
25
30
35
Percentage of adults in favor of legalizing marijuana use
Connecting the dots makes it appear that we know percentages for the years in-between our data points.

Notes on Making Scattergrams
• Before making a scattergram it is necessary to do some planning, and to make sure that your initial decisions will result in a graph that will be useful. It is also necessary to use graph paper. Failure to do these things will make your graph useless.
• Horizontal ticks need to be equally spaced on the paper. They also need to represent equal increments of the independent variable.– For instance, you can make your tick marks represent 0, 1, 2, 3, …d– or 0, 5, 10, 15, 20, …– or 100, 200, 300, …
• Vertical ticks need to be equally spaced on the paper. They also need to represent equal increments of the dependent variable.
• Note: It is acceptable to have vertical ticks and horizontal ticks represent different increments. For instance: x=0, 1, 2, … and y=100, 110, 120, …
• To make these decisions, it is necessary to examine both your data values, and the number of tick marks you have on your graph paper. This way you can make a good decision (though there are usually many acceptable ways to set up a scattergram.
• Also, your scattergram needs to fit on a sheet of paper, while not being so small that you cannot read it accurately.
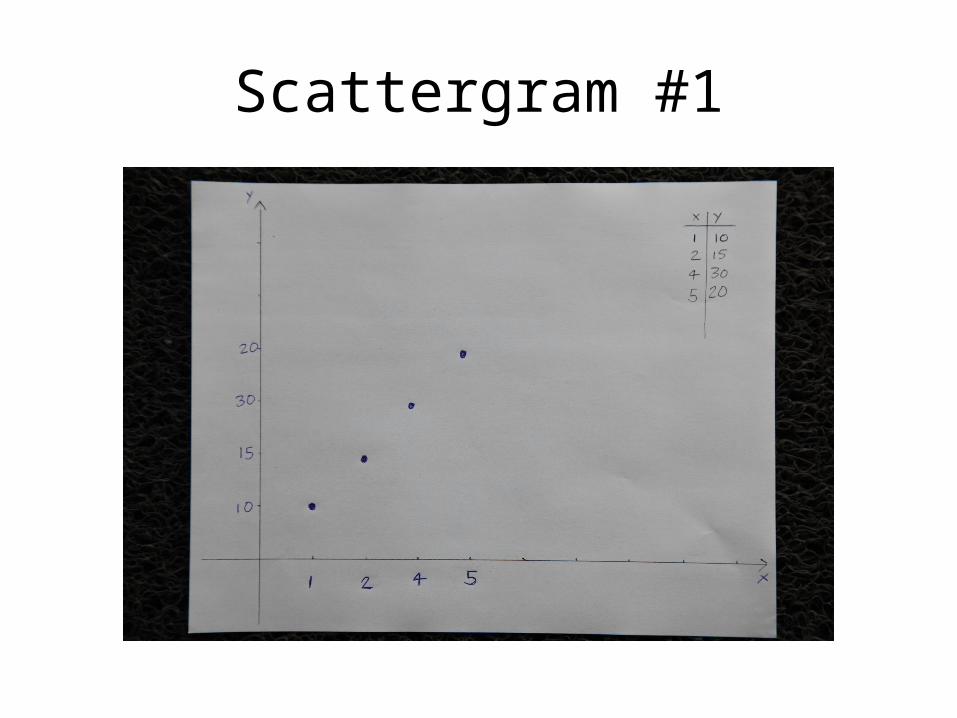
Scattergram #1
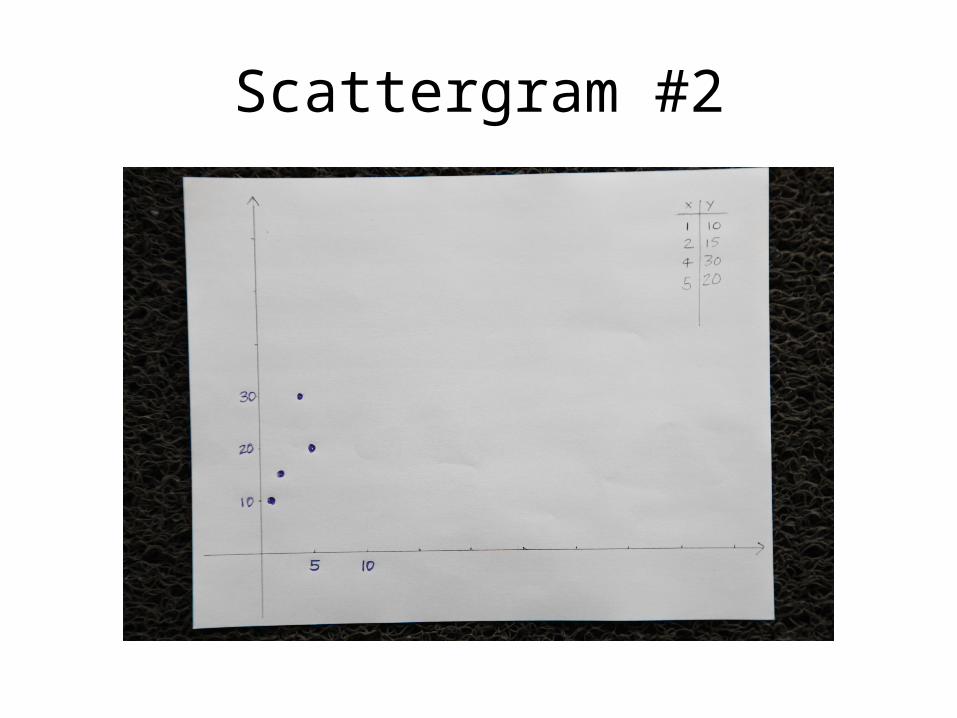
Scattergram #2
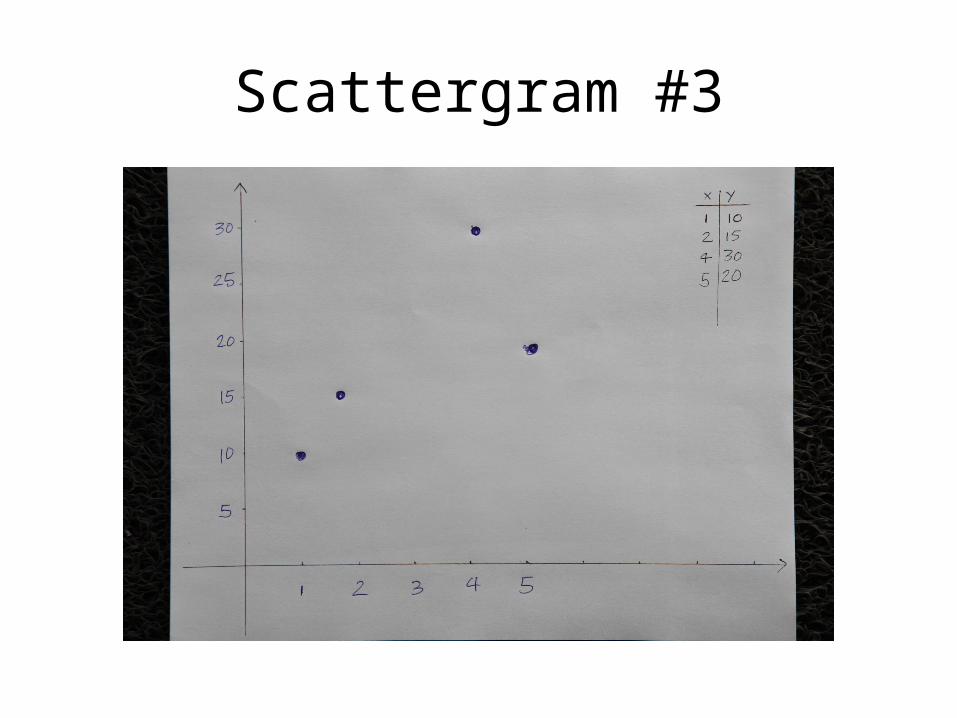
Scattergram #3
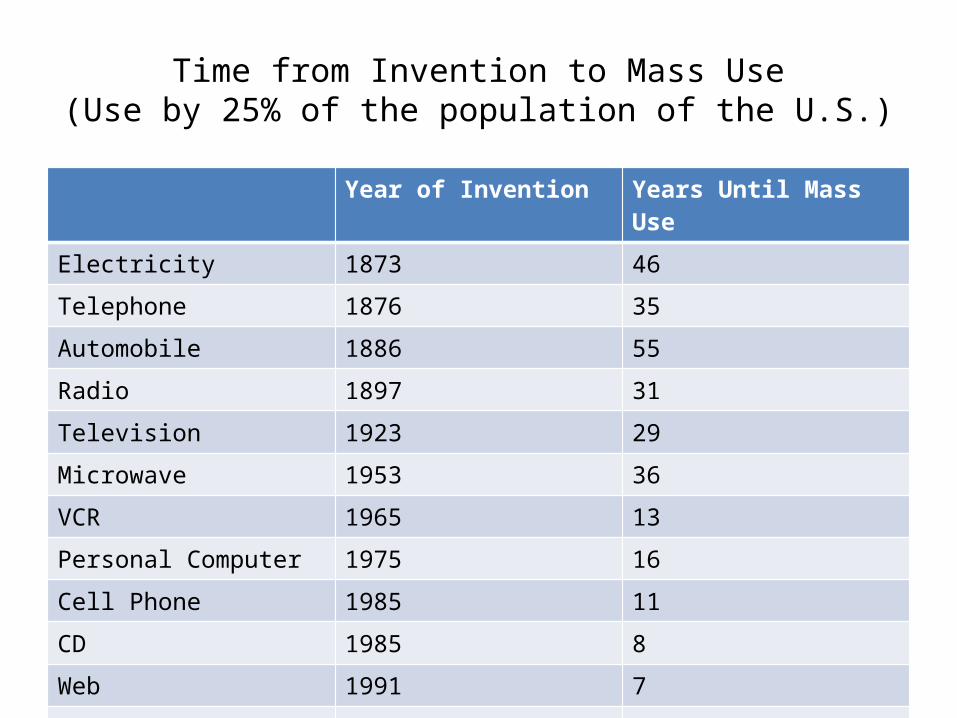
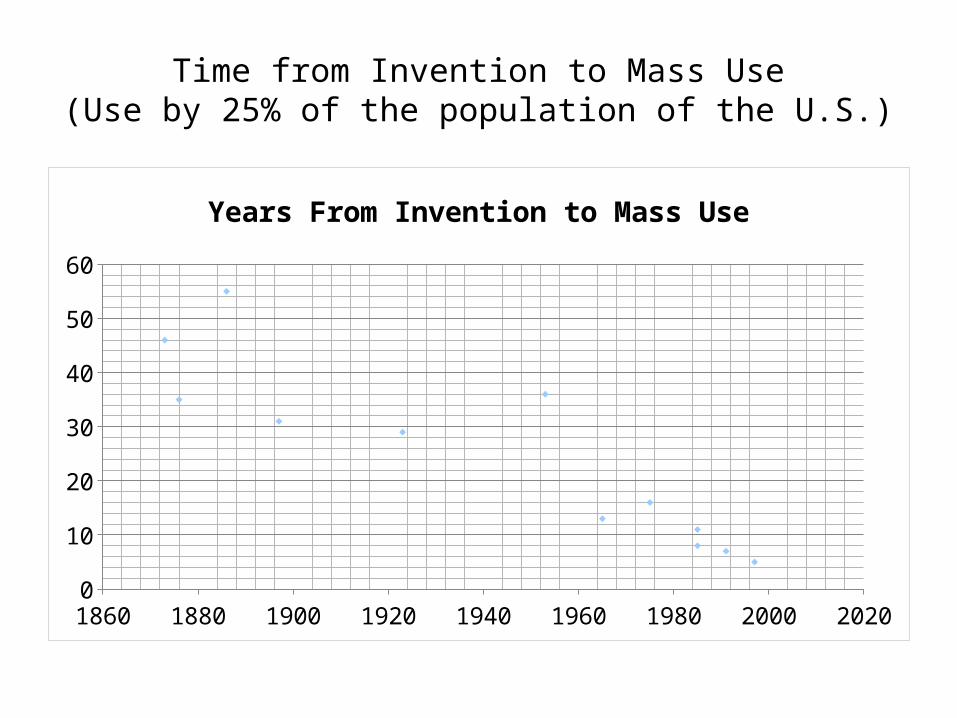
Time from Invention to Mass Use(Use by 25% of the population of the U.S.)
Year of Invention Years Until Mass Use
Electricity 1873 46
Telephone 1876 35
Automobile 1886 55
Radio 1897 31
Television 1923 29
Microwave 1953 36
VCR 1965 13
Personal Computer 1975 16
Cell Phone 1985 11
CD 1985 8
Web 1991 7
DVD 1997 5
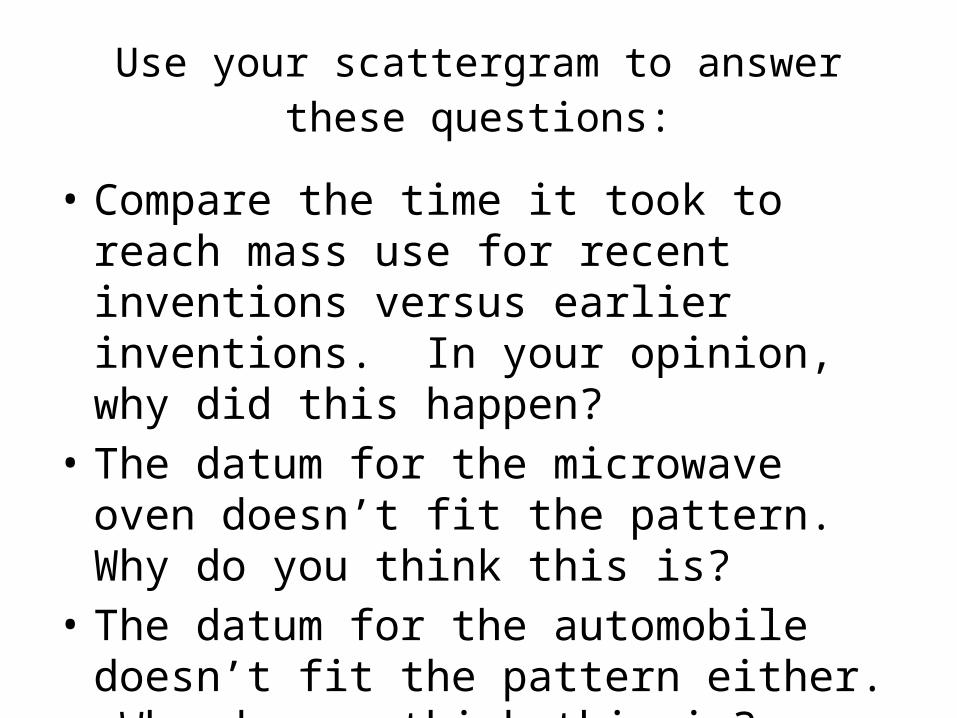
Use your scattergram to answer these questions:
• Compare the time it took to reach mass use for recent inventions versus earlier inventions. In your opinion, why did this happen?
• The datum for the microwave oven doesn’t fit the pattern. Why do you think this is?
• The datum for the automobile doesn’t fit the pattern either. Why do you think this is?
Time from Invention to Mass Use(Use by 25% of the population of the U.S.)
1860 1880 1900 1920 1940 1960 1980 2000 20200
10
20
30
40
50
60
Years From Invention to Mass Use
Regarding Microwaves…
• Microwaves were discovered because people servicing radars were being cooked.
• For many years people feared microwaves would cause radiation poisoning, blindness or impotence.
• No wonder they took a while to catch on!