Embed Size (px)
Citation preview
MATH - 7
Common CoreVs
Kansas Standards

DOMAIN
Ratios andProportional Relationships
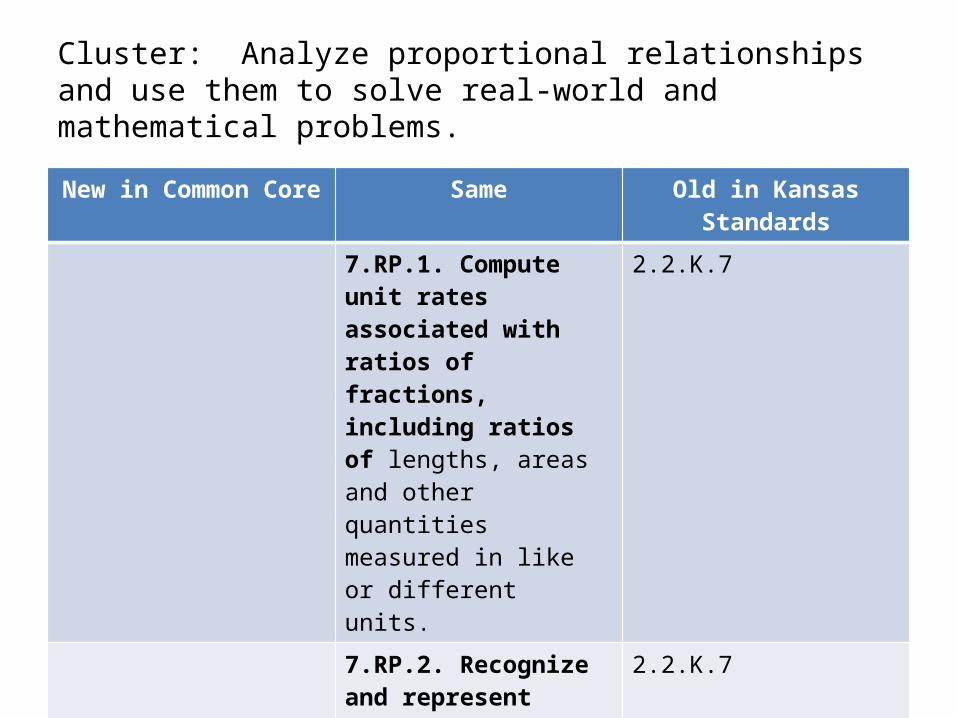
Cluster: Analyze proportional relationships and use them to solve real-world and mathematical problems.
New in Common Core Same Old in Kansas Standards
7.RP.1. Compute unit rates associated with ratios of fractions, including ratios of lengths, areas and other quantities measured in like or different units.
2.2.K.7
7.RP.2. Recognize and represent proportional relationships between quantities.a. Decide whether two quantities are in a proportional relationship, e.g., by testing for equivalentratios in a table or graphing on a coordinate plane and observing whether the graph is astraight line through the origin.b. Identify the constant of proportionality (unit rate) in tables, graphs, equations, diagrams, andverbal descriptions of proportional relationships.c. Represent proportional relationships by equations. d. Explain what a point (x, y) on the graph of a proportional relationship means in terms of thesituation, with special attention to the points (0, 0) and (1, r) where r is the unit rate.
2.2.K.7
7.RP.3. Use proportional relationships to solve multistep ratio and percent problems.Examples: simple interest, tax, markups and markdowns, gratuities and commissions, fees,percent increase and decrease, percent error.
1.4.K.5

p. 2
Removed Moved to another Grade ( )

DOMAIN
The Number System

Cluster: Apply and extend previous understandings of operations with fractions to add, subtract, multiply, and divide rational numbers.
New in Common Core Same Old Kansas Standard
7.NS.1. Apply and extend previous understandings of addition and subtraction to addand subtract rational numbers; represent addition and subtraction on a horizontal or verticalnumber line diagram.a. Describe situations in which opposite quantities combine to make 0. b. Understand p + q as the number located a distance |q| from p, in the positive or negativedirection depending on whether q is positive or negative. Show that a number and its oppositehave a sum of 0 (are additive inverses). Interpret sums of rational numbers by describing real worldcontexts.c. Understand subtraction of rational numbers as adding the additive inverse, p – q = p + (–q).Show that the distance between two rational numbers on the number line is the absolute valueof their difference, and apply this principle in real-world contexts.d. Apply properties of operations as strategies to add and subtract rational numbers.
1.1.A.11.4.K.2
7.NS.2. Apply and extend previous understandings of multiplication and division and offractions to multiply and divide rational numbers.a. Understand that multiplication is extended from fractions to rational numbers by requiring thatoperations continue to satisfy the properties of operations, particularly the distributiveproperty, leading to products such as (–1)(–1) = 1 and the rules for multiplying signednumbers. Interpret products of rational numbers by describing real-world contexts.b. Understand that integers can be divided, provided that the divisor is not zero, and everyquotient of integers (with non-zero divisor) is a rational number. If p and q are integers, then–(p/q) = (–p)/q = p/(–q). Interpret quotients of rational numbers by describing real-worldcontexts.c. Apply properties of operations as strategies to multiply and divide rational numbers.d. Convert a rational number to a decimal using long division; know that the decimal form of arational number terminates in 0s or eventually repeats.
1.4.K.2
7.NS.3. Solve real-world and mathematical problems involving the four operations withrational numbers. (Computations with rational numbers extend the rules for manipulatingfractions to complex fractions.)
1.4.K.5

p. 2
Removed Moved to another Grade ( )
DOMAIN
ExpressionsAnd
Equations

Cluster: Use properties of operations to generate equivalent expressions.
New in Common Core Same Old Kansas Standard
7.EE.1. Apply properties of operations as strategies to add, subtract, factor, andexpand linear expressions with rational coefficients.
2.2.K.8
7.EE.2 Understand that rewriting an expression in different forms in a problem contextcan shed light on the problem and how the quantities in it are related.
2.2.A.12.2.K.8

p. 2
Removed Moved to another Grade ( )

Cluster: Solve real-life and mathematical problems using numerical and algebraic expressions and equations.
New in Common Core Same Old Kansas Standard
7.EE.3. Solve multi-step real-life and mathematical problems posed with positive andnegative rational numbers in any form (whole numbers, fractions, and decimals), using toolsstrategically. Apply properties of operations to calculate with numbers in any form; convertbetween forms as appropriate; and assess the reasonableness of answers using mentalcomputation and estimation strategies.
2.2.A.12.2.K.8
7.EE.4. Use variables to represent quantities in a real-world or mathematical problem, andconstruct simple equations and inequalities to solve problems by reasoning about the quantities.a. Solve word problems leading to equations of the form px+q=r and p(x+q)=r, where p, q, and r arespecific rational numbers. Solve equations of these forms fluently. Compare an algebraic solution toan arithmetic solution, identifying the sequence of the operations used in each approach. b. Solve word problems leading to inequalities of the form px+q>r or px+q < r, where p, q, and r arespecific rational numbers. Graph the solution set of the inequality and interpret it in the context ofthe problem.
2.1.K.12.2.A.12.2.K.8

p. 2
Removed Moved to another Grade ( )
M.7.2.1.K4 (Moved to HS)Δ states the rule to find the nth term of a pattern with one operational change (addition or subtraction) between consecutive terms

DOMAIN
Geometry

Cluster: Draw, construct, and describe geometrical figures and describe the relationships between them.
New in Common Core Same Old Kansas Standard
7.G.1. Solve problems involving scale drawings of geometric figures, such ascomputing actual lengths and areas from a scale drawing and reproducing a scale drawing at adifferent scale.
3.3.A.3
7.G.2. Draw (freehand, with ruler and protractor, and with technology) geometricshapes with given conditions. Focus on constructing triangles from three measures of angles orsides, noticing when the conditions determine a unique triangle, more than one triangle, or notriangle.7.G.3. Describe the two-dimensional figures that result from slicing three dimensional figures, as in planesections of right rectangular prisms and right rectangular pyramids

p. 2
Removed Moved to another Grade ( )
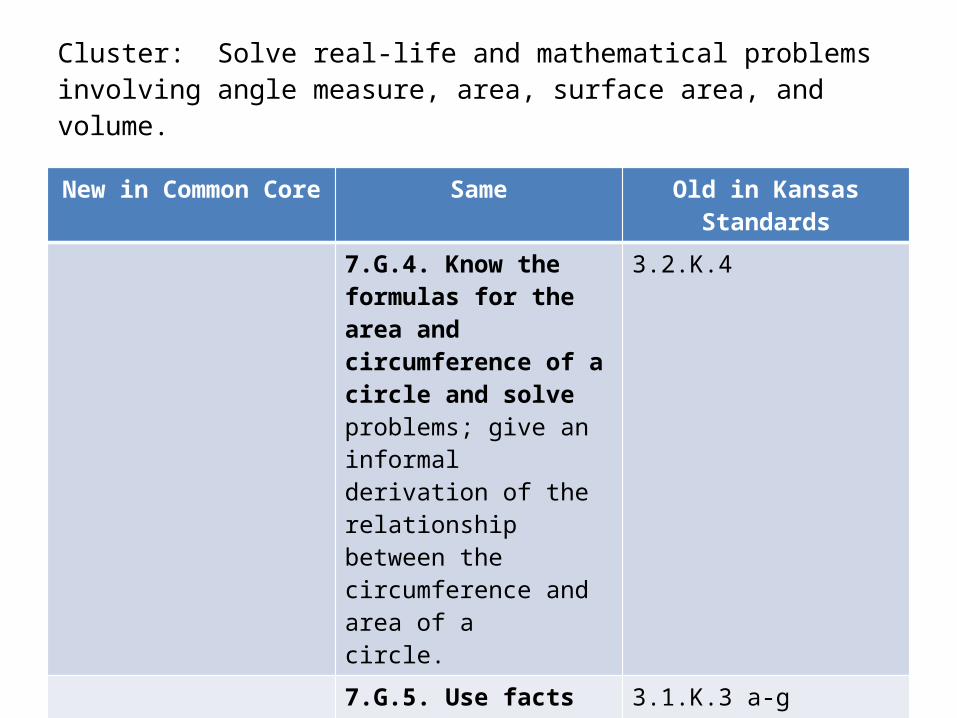
Cluster: Solve real-life and mathematical problems involving angle measure, area, surface area, and volume.
New in Common Core Same Old in Kansas Standards
7.G.4. Know the formulas for the area and circumference of a circle and solveproblems; give an informal derivation of the relationship between the circumference and area of acircle.
3.2.K.4
7.G.5. Use facts about supplementary, complementary, vertical, and adjacent angles ina multi-step problem to write and solve simple equations for an unknown angle in a figure.
3.1.K.3 a-g
7.G.6. Solve real-world and mathematical problems involving area, volume and surfacearea of two- and three-dimensional objects composed of triangles, quadrilaterals, polygons, cubes,and right prisms.
3.2.A.13.2.K.43.2.K.6
p. 2
Removed Moved to another Grade ( )
DOMAIN
StatisticsAnd
Probability
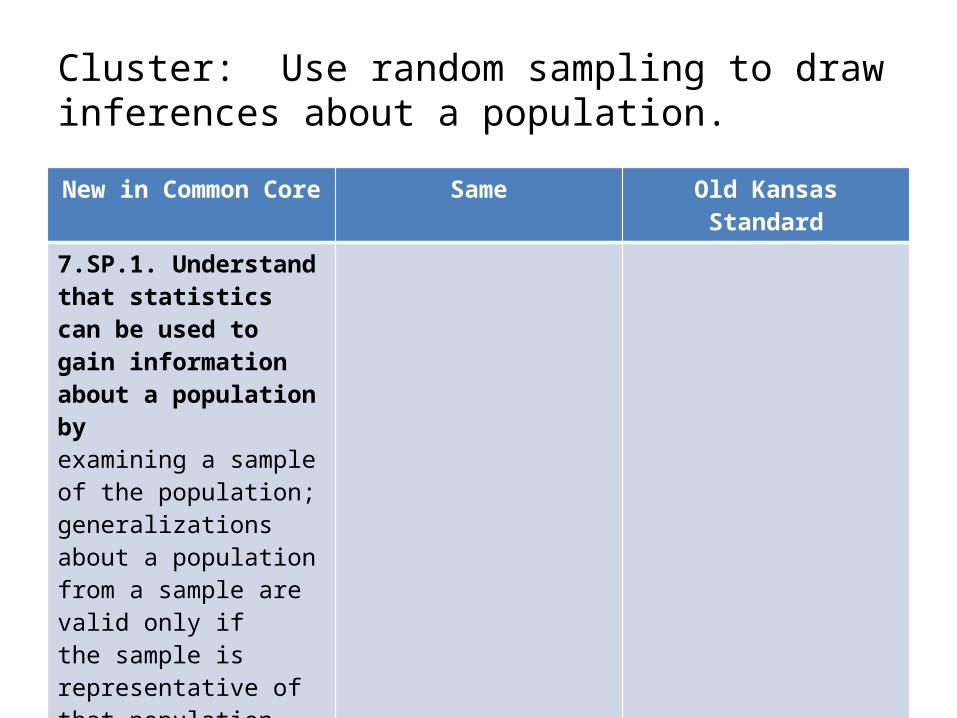
Cluster: Use random sampling to draw inferences about a population.
New in Common Core Same Old Kansas Standard
7.SP.1. Understand that statistics can be used to gain information about a population byexamining a sample of the population; generalizations about a population from a sample are valid only ifthe sample is representative of that population. Understand that random sampling tends to producerepresentative samples and support valid inferences.7.SP.2. Use data from a random sample to draw inferences about a population with anunknown characteristic of interest. Generate multiple samples (or simulated samples) of thesame size to gauge the variation in estimates or predictions.

p. 2
Removed Moved to another Grade ( )
M.7.4.2.A3a-bThe student recognizes and explainsmisleading representations of data andthe effects of scale or interval changes on graphs of data sets.
M.7.4.2.K1a-g ( Moved to 6th Grade)The student organizes, displays, and reads quantitative (numerical) and qualitative (non-numerical) data in a clear, organized, and accurate manner including a title, labels, categories, and rational number intervals using these data displays :
a. frequency tableb. bar, line, and circle graphc. Venn diagrams or other pictorial displaysd. charts and tablese. stem-and-leaf plots (single)f. scatter plotsg. box-and-whiskers plots.
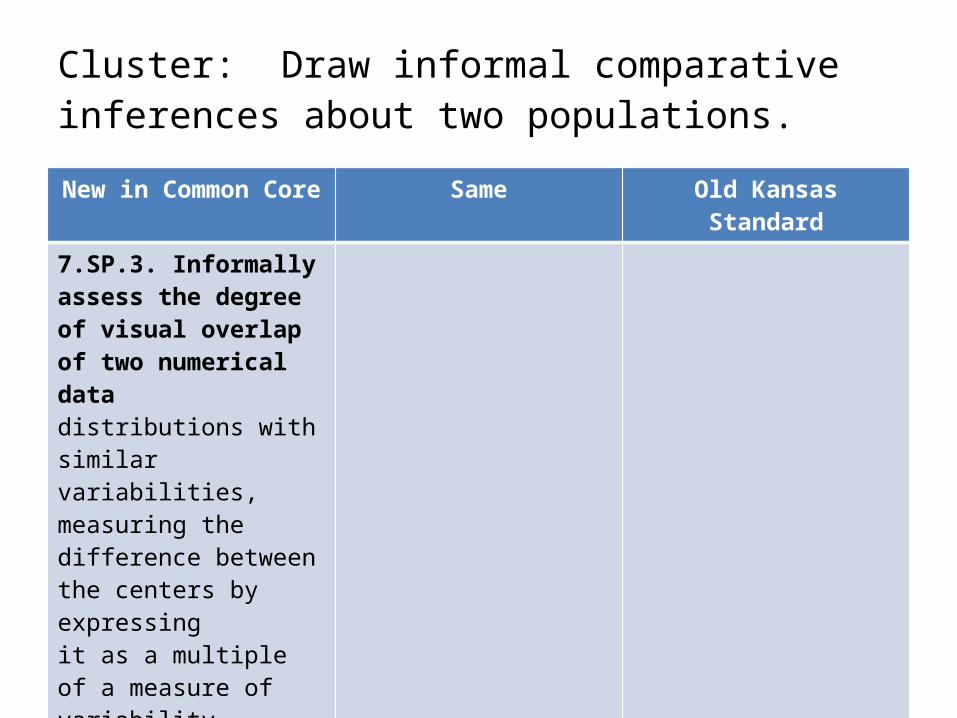
Cluster: Draw informal comparative inferences about two populations.
New in Common Core Same Old Kansas Standard
7.SP.3. Informally assess the degree of visual overlap of two numerical datadistributions with similar variabilities, measuring the difference between the centers by expressingit as a multiple of a measure of variability.7.SP.4. Use measures of center and measures of variability for numerical data fromrandom samples to draw informal comparative inferences about two populations.

p. 2
Removed Moved to another Grade ( )
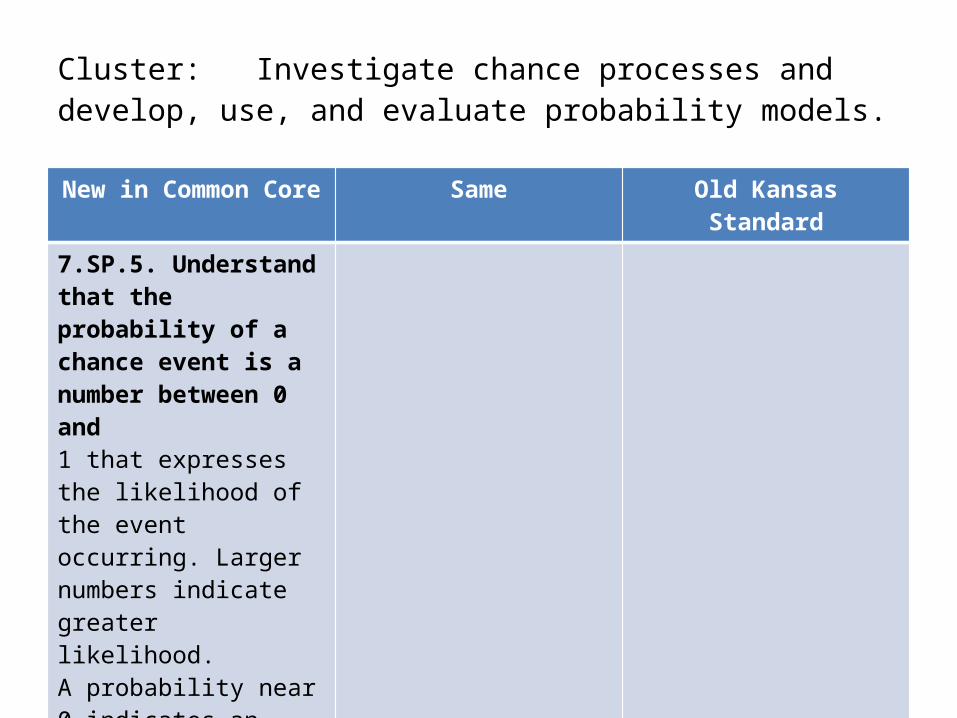
Cluster: Investigate chance processes and develop, use, and evaluate probability models.
New in Common Core Same Old Kansas Standard
7.SP.5. Understand that the probability of a chance event is a number between 0 and1 that expresses the likelihood of the event occurring. Larger numbers indicate greater likelihood.A probability near 0 indicates an unlikely event, a probability around 1/2 indicates an event that isneither unlikely nor likely, and a probability near 1 indicates a likely event.7.SP.6. Approximate the probability of a chance event by collecting data on the chanceprocess that produces it and observing its long-run relative frequency, and predict theapproximate relative frequency given the probability.7.SP.7. Develop a probability model and use it to find probabilities of events. Compareprobabilities from a model to observed frequencies; if the agreement is not good, explain possiblesources of the discrepancy.a. Develop a uniform probability model by assigning equal probability to all outcomes, and use themodel to determine probabilities of eventsb. Develop a probability model (which may not be uniform) by observing frequencies in datagenerated from a chance process.7.SP.8. Find probabilities of compound events using organized lists, tables, treediagrams, and simulation.a. Understand that, just as with simple events, the probability of a compound event is thefraction of outcomes in the sample space for which the compound event occurs.b. Represent sample spaces for compound events using methods such as organized lists, tablesand tree diagrams. For an event described in everyday language (e.g., “rolling double sixes”),identify the outcomes in the sample space which compose the event.c. Design and use a simulation to generate frequencies for compound events.

p. 2
Removed Moved to another Grade ( )