Embed Size (px)
Citation preview
This publication from the Kansas State University Agricultural Experiment Station and Cooperative Extension Service has been archived. Current information is available from http://www.ksre.ksu.edu.
DERIVED FARM FINANCIAL RATIOS FOR KANSAS FARMS *
Larry N. Langemeier**
ABSTRACT
Net farm income for agricultural producers enrolled in the Kansas Farm Management Association(KFMA) program during the period 1991 to 1996 ranged from a low of $22,353 in 1995 to a high of $61,915in 1996. With this large variation in net farm income from year to year as well as among farm businesses,measurement values are needed to detect strengths and weaknesses in a farm business and to indicate finan-cial progress over a period of years. Farm financial ratios provide one way to evaluate the condition of a farmbusiness as a unit. Financial information from farms enrolled in the KFMA program for the period 1991 to1996 was used to derive average farm financial ratios on state, regional, and farm type bases. On a statewidebasis, the debt-to-asset and current ratios averaged 1.92 and 0.34, respectively. The rate of return on farmassets was 3.52%. The asset turnover ratio was 0.30. The operating expense ratio (a measure of financialefficiency) was 61.36% with an average net farm income of $36,980. The farm financial ratios derived forthe six regions were very similar to those obtained for the state. However, levels of the farm financial ratiosdid vary among the various farm types analyzed. The rate of return on farm assets was negative for cow herdand crop-cow herd farms. The debt-to-equity ratio for crop-beef backgrounding farms in the north centralregion was 1.54 indicating a debt level 54% greater than equity. An agricultural producer needs to compareseveral farm financial ratios against benchmark values to determine the strengths and weaknesses of his/herfarm business.
*Contribution No. 99-108-5 from the Kansas Agricultural Experiment Station.
** Professor, Department of Agricultural Economics, Kansas State University, Manhattan, KS 66506.
This publication from the Kansas State University Agricultural Experiment Station and Cooperative Extension Service has been archived. Current information is available from http://www.ksre.ksu.edu.
1
INTRODUCTION
Net farm income for agricultural producers enrolled in the Kansas Farm Management Association(KFMA) program during the period 1991 to 1996 ranged from a low of $22,353 in 1995 to a high of $61,915in 1996.1 The rate of return to equity ranged from a negative 4.75% in 1991 to 2.78% in 1996--a total varia-tion of 7.53%.2 These values indicate the large fluctuations that occur in net income values for farm busi-nesses from year to year. Variation also occurs among farm businesses each year. The medium net farmincome in 1996 was $42,325 compared to the average of $61,915, with over 11% of the agricultural produc-ers incurring a negative income.
With these large differences in net farm income from year to year and among farm businesses, measure-ment values are needed to detect strengths and weaknesses within a farm business as well as to indicatefinancial progress over a period of years. Farm financial ratios provide one way to evaluate the condition of afarm business as a unit.
Comparison of farm financial ratios of a farm business to ratios of other farm businesses of similar typeand size may provide the information needed to detect strengths and weaknesses in the operational unit.Comparison of the ratios to established standards or benchmarks also would be helpful. Yet, the establish-ment of minimum or maximum values that all farm businesses should meet for various financial ratios isextremely difficult. The objective of this study was to develop a set of average farm financial ratios, on state,regional, and farm-type bases, using actual farm data available in Kansas for the period 1991 to 1996. Thisset of average farm financial ratios will serve as the first step in the derivation of standards or benchmarks.
FINANCIAL RATIOS CONSIDERED 3
A number of farm financial ratios have been determined to be useful indicators of financial progressand risk-bearing ability. The ratios considered in this study can be grouped into four categories:
LiquiditySolvencyProfitabilityFinancial Efficiency
1 Source: Larry N. Langemeier and Fredrick D. DeLano, The Annual Report, 1991-96, Department ofAgricultural Economics, Kansas State University, Manhattan, Kansas.2 The rate of return to equity does not include the annual inflation (deflation) in land values and othercapital assets.3 For additional information on farm financial ratios, see Farm Financial Standards Council, “Financial
Guidelines for Agricultural Producers II”, Revised December, 1997 and Larry N. Langemeier, FinancialRatios Used in Financial Management, MF-270, Kansas State University, Agricultural Experiment Station
and Cooperative Extension Service, October, 1998.
This publication from the Kansas State University Agricultural Experiment Station and Cooperative Extension Service has been archived. Current information is available from http://www.ksre.ksu.edu.
2
Liquidity IndicatorsLiquidity measures the ability of a farm business to meet financial obligations as they come due in the
ordinary course of business, without disrupting the normal operations of the business. These financial ratiosand values that measure liquidity are calculated from balance sheet data4:
Current RatioWorking Capital
The Current Ratio indicates the extent to which current farm assets, if liquidated, would cover current farmliabilities. The higher the current ratio, the greater the liquidity. The ratio is computed as follows:
Total Current Farm Assets5
Current Ratio =Total Current Farm Liabilities5
6Example: = 309,040/201,710 = 1.53
Working Capital is a measure of the amount of funds available to purchase inputs and inventory itemsafter the sale of current farm assets and payment of all current farm liabilities. The amount of working capitalconsidered adequate is related to the size and type of farm business. Working capital is defined as follows:
Working Capital = (Total Current Farm Assets) - (Total Current Farm Liabilities)
Example: = 309,040 - 201,710 = $107,330
These two liquidity indicators have some limitations.
1. The values are static, because they measure only financial resources available at a given point in timecompared to the liabilities at that time. Future inflows in relation to outflows are not measured.
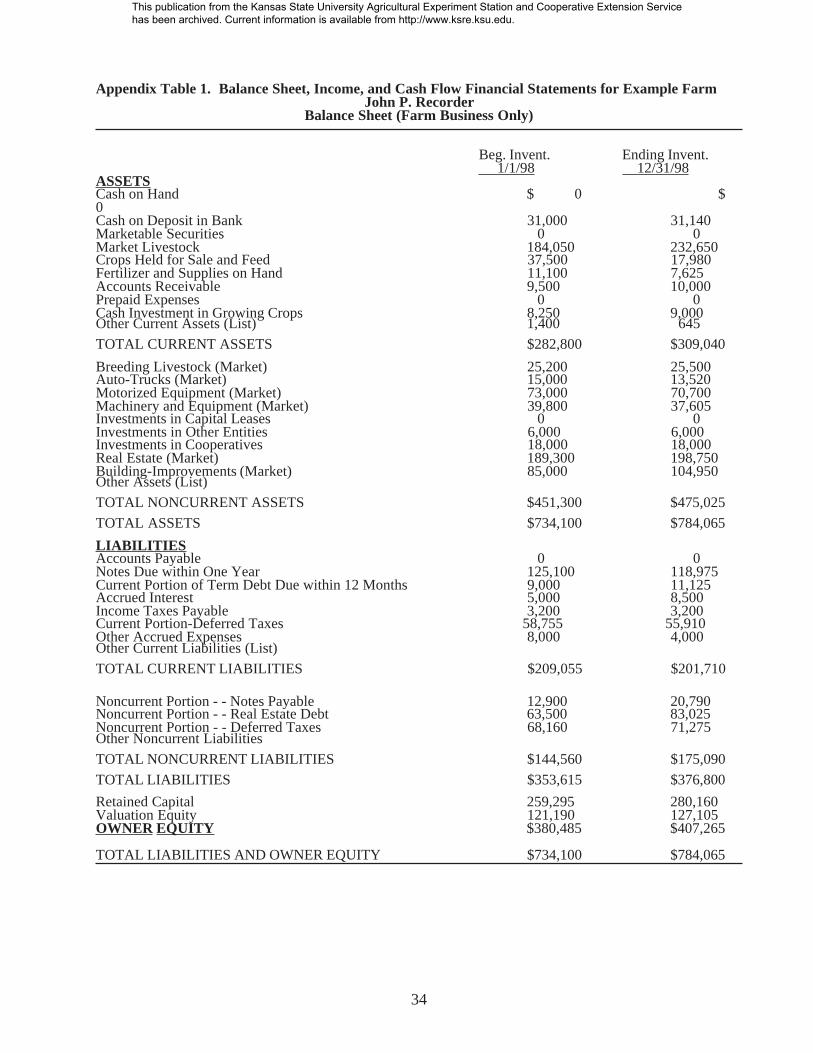
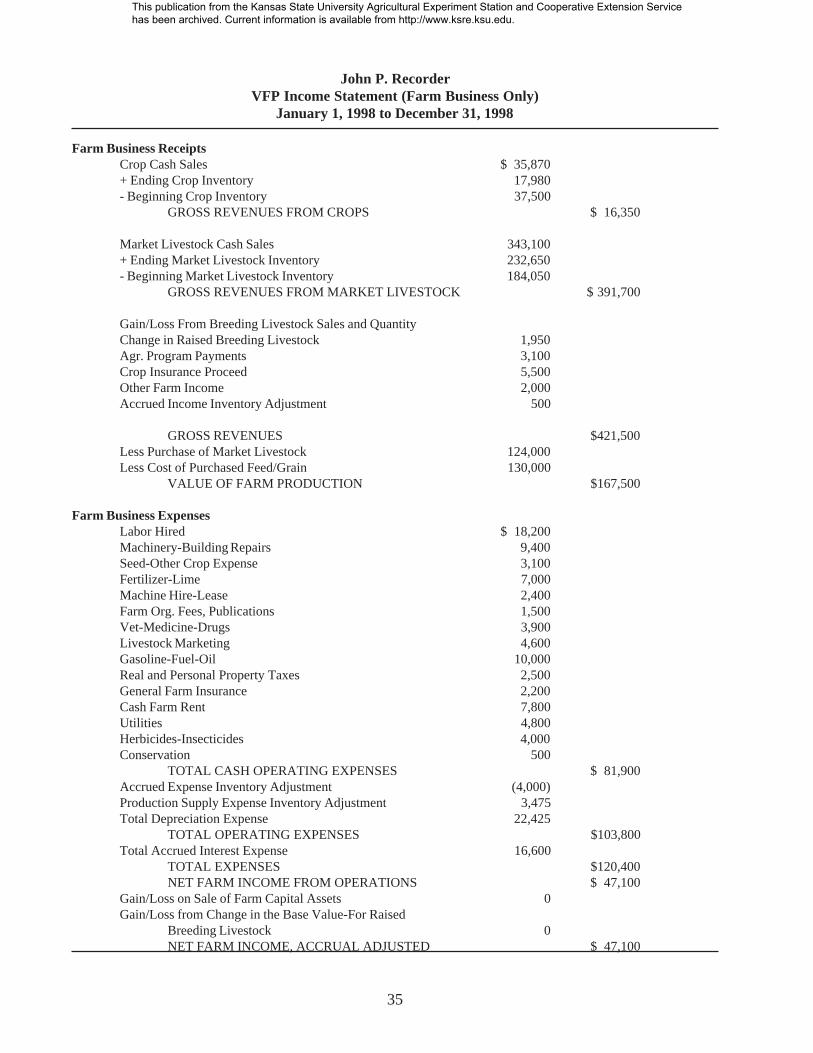
4 Accurate and complete balance sheet and income statements are required for the derivation of relevantfinancial ratios for farm businesses.5 Current farm assets are those assets that “turn over” in a normal year’s operation. Examples of currentfarm assets are crops held for sale or feed, livestock held for sale, cash on hand, and accounts receivable.Current liabilities are debts that come due within the year, including accrued expenses and the current portionof deferred taxes, as well as the portion of noncurrent debt due in the present year’s business.6 Ratio examples are derived from the example farm financial statements shown in Appendix Table 1.Appendix Table 2 provides a summary of liquidity, solvency, and profitability financial ratios utilizing theexample farm financial statements. Appendix Tables 3-5 present example profitability and financialefficiency ratios based on value of farm production, gross revenue, and gross farm income versions of thecomputation of gross farm receipts.
This publication from the Kansas State University Agricultural Experiment Station and Cooperative Extension Service has been archived. Current information is available from http://www.ksre.ksu.edu.
3
2. The values do not measure the quality of current farm assets or whether the assets canbe sold for the value shown on the balance sheet.
3. The values ignore committed lines of credit as financial resources available to assuretimely payment of liabilities.
4. The values will vary by the type of farm business and throughout the yearly productioncycle.
Solvency IndicatorsSolvency measures the amount of debt and other expense obligations used in the farm business relative
to the amount of owner equity invested in the business. Solvency ratios indicate the business’ ability to repayall financial obligations if all assets were sold, as well as the ability to continue operations as a viable farmbusiness after a financial adversity such as a drought. These financial ratios that measure solvency arecalculated from balance sheet data:
Debt/Asset RatioEquity/Asset RatioDebt/Equity Ratio
The Debt/Asset Ratio compares total farm liabilities to the value of total farm assets and, therefore,measures financial position. This ratio expresses what proportion of total farm assets is owed to creditors. Itis one measure of the risk exposure for the farm business and, thus, is important for evaluating the financialtrend of the business. The goal of most farm business operators is to eventually approach a debt- freeoperation. A continual lowering of this ratio is a trend in that direction. The higher the ratio, the greater therisk exposure of the farm business. The ratio is computed as follows:
Total Farm LiabilitiesDebt/Asset Ratio =Total Farm Assets
Example: = (376,800/784,065) x 100 = 48.06%
The Equity/Asset Ratio measures the proportion of total farm assets financed by the owner’s equitycapital and, therefore, indicates financial position. The higher the ratio value, the more total capital has beensupplied by the owner and the less capital supplied by creditors. The ratio is computed as follows:
Total Farm EquityEquity/Asset Ratio =Total Farm Assets
Example: = (407,265/784,065) x 100 = 51.94%
The Debt/Equity Ratio measures financial position and reflects the extent to which farm debt capital isbeing combined with farm equity capital. The higher the ratio value, the more total capital has been suppliedby creditors, and the less capital supplied by the owner.The ratio is computed as follows:
This publication from the Kansas State University Agricultural Experiment Station and Cooperative Extension Service has been archived. Current information is available from http://www.ksre.ksu.edu.
4
Total Farm LiabilitiesDebt/Equity Ratio =Total Farm Equity
Example: = 376,800/407,265 = 0.93
These financial ratios have two limitations:
1. Standards are difficult to specify, because these ratios vary by type of farm business andfrom one agricultural producer to another. The range of acceptable ratio values will depend on a number offactors such as the fluctuations in farm asset values, that may occur because of changing demand foragricultural assets and the proportion of owned land used in the farm business.
2. These ratios are influenced greatly by the value placed on the farm assets.
Profitability IndicatorsProfitability measures the extent to which a farm business generates a profit from the use of labor,
management, and capital. These financial ratios and values that measure profitability are calculated frombalance sheet and income statement data:
Rate of Return on Farm AssetsRate of Return on Farm EquityNet Farm IncomeOperating Profit Margin Ratio
The Rate of Return on Farm Assets Ratio often is used as an overall index of profitability of the farmbusiness. The higher the ratio value, the more profitable the farm business. The rate of return on farm assetsis computed as follows:
Return to CapitalRate of Return on Farm Assets =Average Total Farm Assets
Where,
7Return to Capital = Net Farm Income + Interest Expense - Operator Unpaid Labor andManagement Value - Unpaid Family Labor Value
Example: (8,915/759,083) x 100 = 1.17%
The Rate of Return on Farm Equity Ratio provides a measure of the return on the owner’s equity capitalemployed in the farm business. The higher the ratio value, the more profitable the farm operation. The rate of return on farm equity is computed as follows:
7 The return to capital provides a measure of the operator’s return to capital after giving credit for unpaidlabor and management. A $30,000 labor and management charge per operator was used in the calculation ofthe return to capital.
This publication from the Kansas State University Agricultural Experiment Station and Cooperative Extension Service has been archived. Current information is available from http://www.ksre.ksu.edu.
5
Return to Equity CapitalRate of Return on Farm Equity =Average Total Farm Equity
Where,
Return to Equity Capital = Return to Capital - Interest Expense
Example: ((4,185)/393,875) x 100 = (1.06%)
Net Farm Income is defined as the return to operator’s labor, management, and equity computed on anaccrual basis. Net farm income is calculated by matching farm revenues with farm expenses incurred tocreate those revenues, but before taxes.
Example: $47,100
The Operating Profit Margin Ratio measures profitability in terms of return per dollar of value of farmproduction.8 A farm business has two ways to increase profits--either by increasing the profit per unitproduced or by increasing the volume of production if the farm business is profitable. The ratio is computedas follows:
Return to CapitalOperating Profit Margin Ratio =
Value of Farm Production
Example: = (8,915/167,500) x 100 = 5.32%
These profitability indicators have several limitations.
1. The value for the operator’s unpaid labor and management must be calculated correctly;otherwise, the ratio value will be understated or overstated.
2. Net farm income is computed on a pretax basis.
3. Capital gains on real estate and other assets are not included in net farm income.9 Thus,the rate of return of farm assets and equity ratios will seem low when
compared to nonfarm investments such as stocks. Also, the values for these two ratioswill vary with structural characteristics of the farm business, especially with the proportion of owned land orother assets used in the operation.
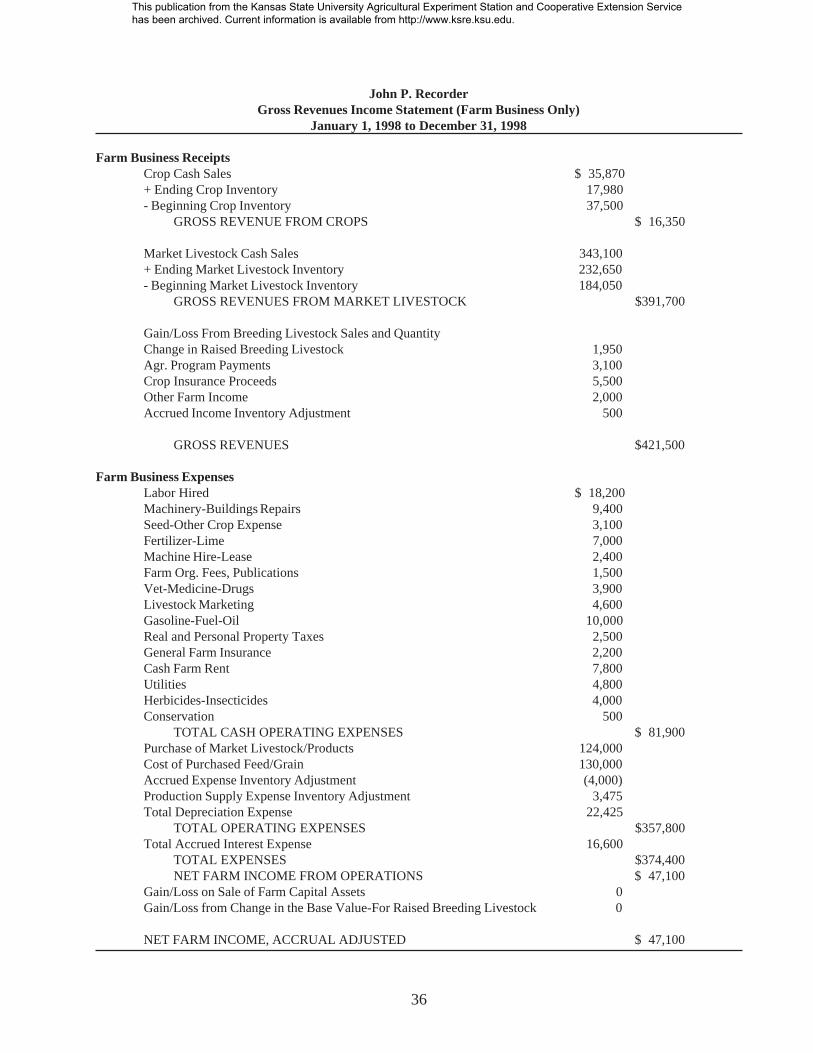
8 Gross revenues or gross farm income can be used as a substitute for the value of farm production. SeeAppendix Table 1 for income statement examples using this approach.9 Capital gains achieved in the farm business during the accounting year on real estate and other assetscould be derived and then added to return to capital when computing the rate of return on farm assets, rate ofreturn on farm equity, and operating profit margin ratios. This procedure would allow a more accuratecomparison of the ratios to nonfarm investments.
This publication from the Kansas State University Agricultural Experiment Station and Cooperative Extension Service has been archived. Current information is available from http://www.ksre.ksu.edu.
6
4. Caution should be used when interpreting the rate of return on farm equity ratio. Forexample, a high ratio, normally associated with a profitable farm business, also may indicate a high leverageoperation.
5. A dollar measurement, such as net farm income, is difficult to compare across farmbusinesses, especially across operations with different forms of business organizations.
Financial Efficiency IndicatorsFinancial efficiency measures the intensity with which a farm business uses its assets to generate the
value of farm production and the effectiveness of production, purchasing, pricing, financing, and marketingdecisions. These financial efficiency ratios are calculated from balance sheet and income statement data:
Asset Turnover RatioOperating Expense RatioDepreciation Expense RatioInterest Expense RatioTotal Expense RatioNet Farm Income Ratio
The Asset Turnover Ratio measures how efficiently farm assets are being used to generate revenue.The higher the ratio value, the more efficiently assets are being used to generate revenue. The value of theratio will vary depending on the type of farm operation. The ratio is computed as follows:
Value of Farm ProductionAsset Turnover Ratio =
Average Total Farm Assets
Example: = 167,500/759,083 = 0.22
A relationship exists among the rate of return on farm assets, the asset turnover ratio, and the operatingprofit margin ratio. If the asset turnover ratio is multiplied by the operating profit margin ratio, the result isthe rate of return on farm assets.
The asset turnover ratio has two limitations.
1. Value of farm production income covers an accounting period, whereas the average forfarm assets represents only two points within that accounting period.
2. The ratio shows wide variations depending on the type of farm business or the structuralcharacteristics of the business.
The five operational ratios reflect the relationship of expense and income categories to value of farmproduction. The sum of the first three operational ratios equals the total expense ratio. The ratios are
This publication from the Kansas State University Agricultural Experiment Station and Cooperative Extension Service has been archived. Current information is available from http://www.ksre.ksu.edu.
7
computed as follows:
Total Operating Expense - Depreciation ExpenseOperating Expense Ratio = -------------------------------------------------------------
Value of Farm Production
Example: = (81,375/167,500) x 100 = 48.58%
Depreciation ExpenseDepreciation Expense Ratio = ------------------------------------
Value of Farm Production
Example: = (22,415/167,500) x 100 = 13.39%
Interest ExpenseInterest Expense Ratio = ---------------------------------
Value of Farm Production
Example: = (16,600/167,500) x 100 = 9.91%
Total Farm ExpenseTotal Expense Ratio = ----------------------------------------
Value of Farm Production
Example: = (120,400/167,500) x 100 = 71.88%
Net Farm IncomeNet Farm Income Ratio = ------------------------------------
Value of Farm Production
Example: = (47,100/167,500) x 100 = 28.12%
This publication from the Kansas State University Agricultural Experiment Station and Cooperative Extension Service has been archived. Current information is available from http://www.ksre.ksu.edu.
8
USES OF FINANCIAL RATIOS
The establishment of minimum or maximum values that all farm businesses should meet for each of thefinancial ratios is extremely difficult. One of the objectives in the use of financial ratios is to evaluate thecondition of a farm business as a unit. A specific ratio concentrates attention upon specific details of thebusiness. The use of a single ratio or placing excessive emphasis on one ratio may be misleading. Forexample, an agricultural producer that has just started a farm business may have a much higher debt/equityratio than an agricultural producer who has built up the business over a longer time span. The youngoperator, even though of equal ability, compares his/her debt to a much smaller equity. But this same youngoperator may show a more desirable rate of return to equity than his/her older counterpart, again because ofthe lower equity base.
The interpretation of one ratio may be altered by other ratios for the same business. Thus, somelending institutions, agricultural producers, and farm advisors have selected a group of ratios that they believegive a composite picture of the farm business. The calculated ratios of a specific farm business are theninterpreted as a group rather than making judgements on individual ratios.
Another objective in the use of financial ratios is to detect strengths and weaknesses within a farmbusiness. Comparison of ratios of a farm business to ratios of other farm businesses of similar type maydetect strengths or weaknesses. Comparing to established standards or benchmarks also is helpful.Comparison to ratios in earlier years indicates progress made within the farm business.
In this study, financial information from farms enrolled in the KFMA program for the period 1991 to1996 was used to derive average liquidity, solvency, profitability, and financial efficiency ratios for the wholestate, six regions, and various farm types. The derivation of these average farm financial ratios for Kansasfarms is the first step toward the formulation of benchmark ratio values.
RESULTS
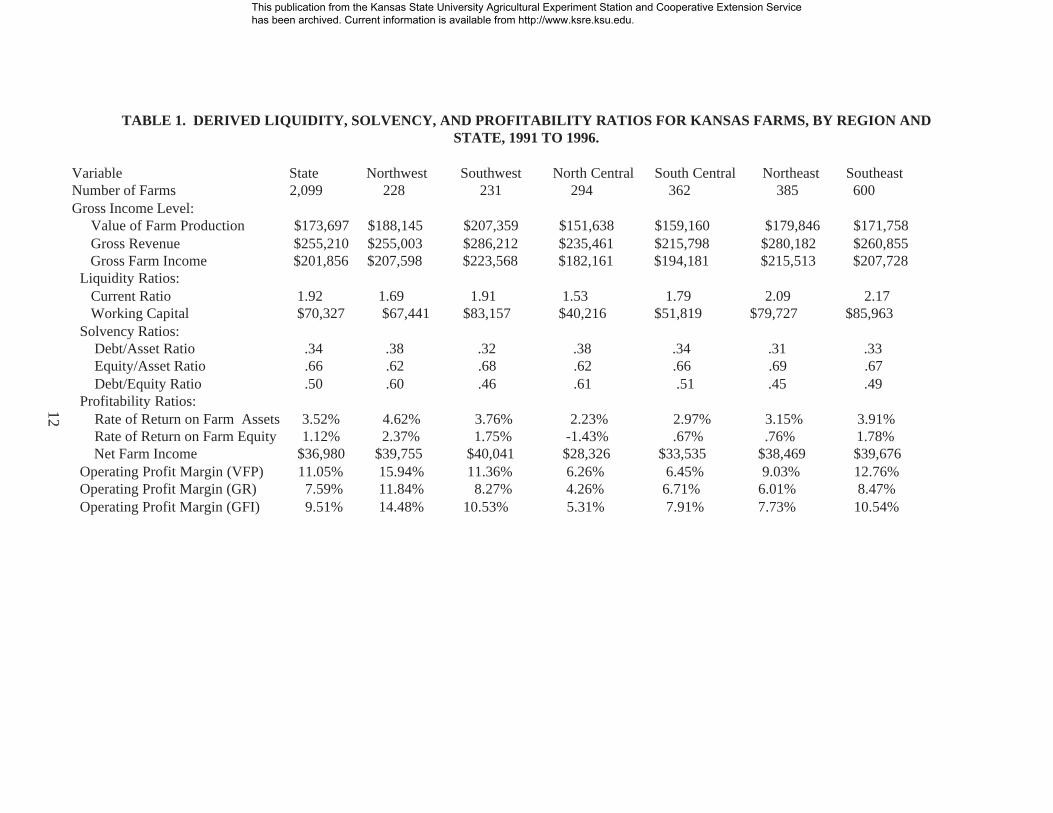
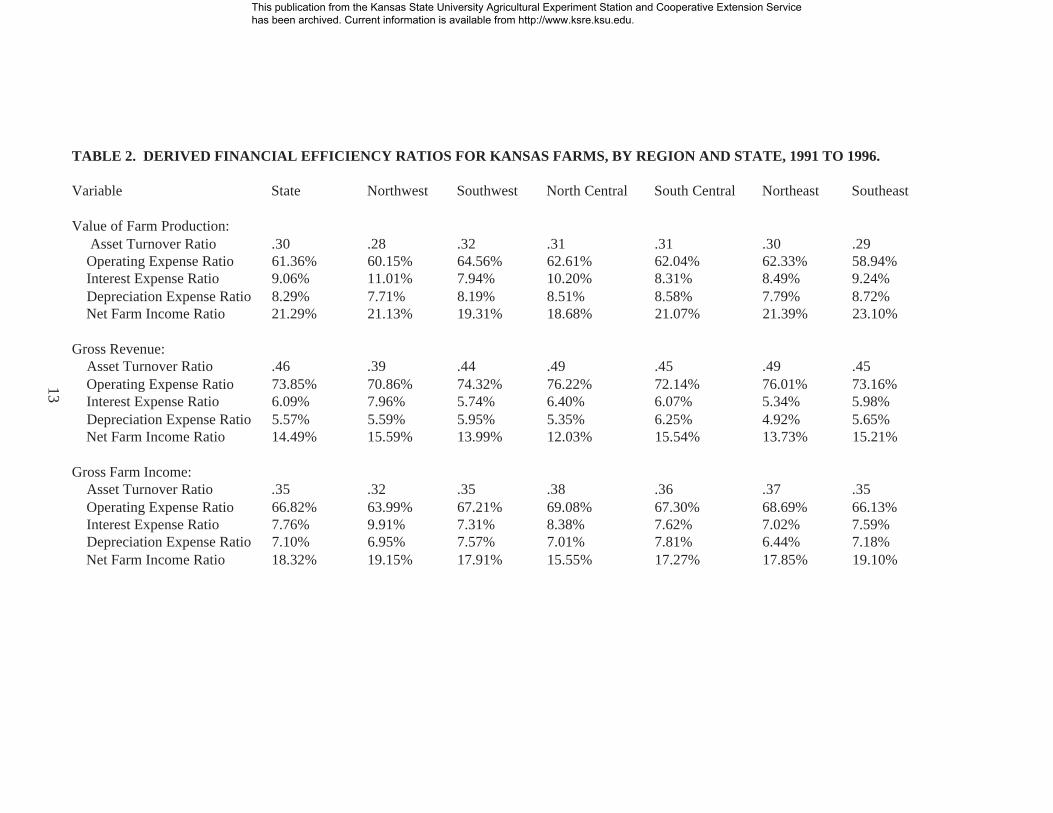
Tables 1 and 2 outline average farm financial ratios on state and regional bases. The operating profitmargin and financial efficiency ratios are presented for the three income approaches of value of farmproduction (VFP), gross revenue (GR), and gross farm income (GFI).
The derived current ratio was 1.92 based on an average of 2,099 farms for the state. That is, theaverage farm had $1.92 of current assets for every $1 of current liabilities. Working capital averaged$70,327. The debt to asset and debt to equity solvency ratios averaged .34 and .50, respectively. The debt toasset ratio expresses what proportion of total farm assets is owed to creditors and, thus, is an importantmeasure of the risk exposure of the farm business. The strong financial position of Kansas farms is shownby the debt to asset ratio value of .34 indicating that only $0.34 of each $1 of assets is owed to creditors. Netfarm income averaged $36,980 for the 6-year period, with an operating profit margin (VFP) ratio of 11.05%.Operating and interest expense financial efficiency ratios were 61.36 and 9.06%, respectively, for the VFPincome approach.
On a regional basis, derived current ratios varied from a low of 1.53 in north central Kansas to a high of2.17 in the southeast region. Working capital was lowest in the north central region at $40,216. The debt toasset ratio ranged from a low of .31 in northeast Kansas to a high of .38 in the northwest and north centralregions. Northeast Kansas had the lowest debt to equity ratio at .45. The southwest region had the highestaverage net farm income at $40,041, although the highest operating profit margin ratio was in northwestKansas at 15.94%. The operating expense (VFP) efficiency ratio varied from a low of 58.94% in thesoutheast region to a high of 64.56% in southwest Kansas.
This publication from the Kansas State University Agricultural Experiment Station and Cooperative Extension Service has been archived. Current information is available from http://www.ksre.ksu.edu.
9
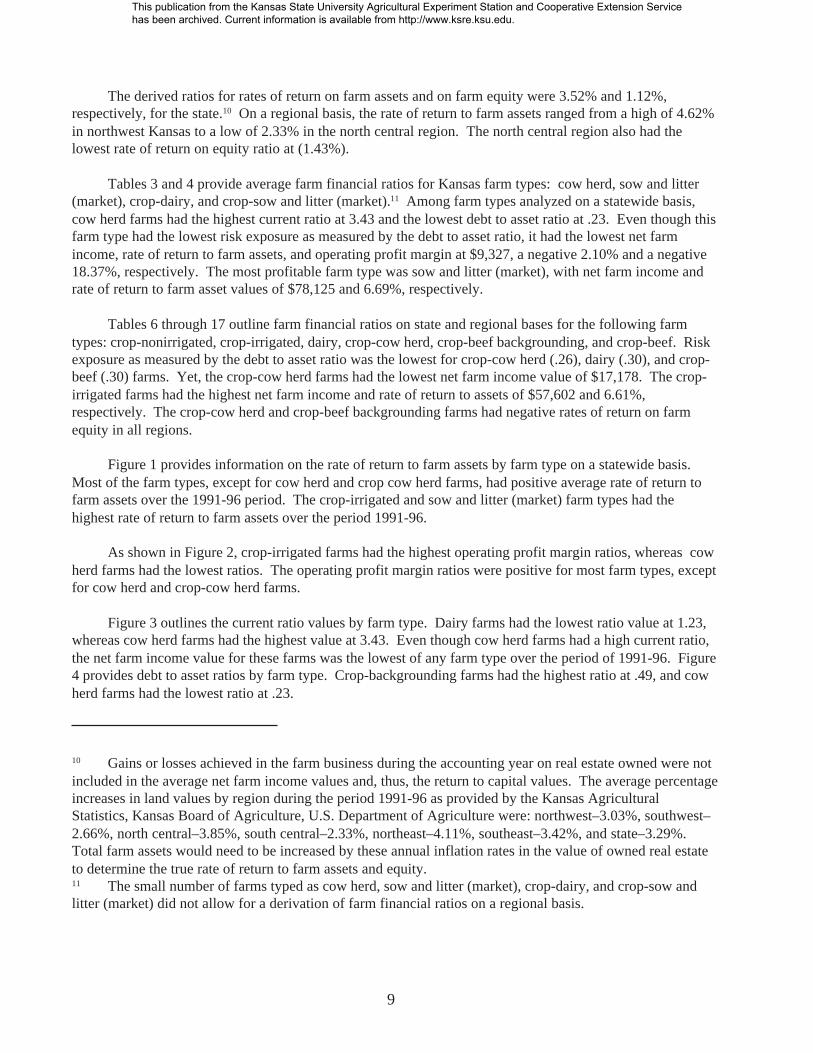
The derived ratios for rates of return on farm assets and on farm equity were 3.52% and 1.12%,respectively, for the state.10 On a regional basis, the rate of return to farm assets ranged from a high of 4.62%in northwest Kansas to a low of 2.33% in the north central region. The north central region also had thelowest rate of return on equity ratio at (1.43%).
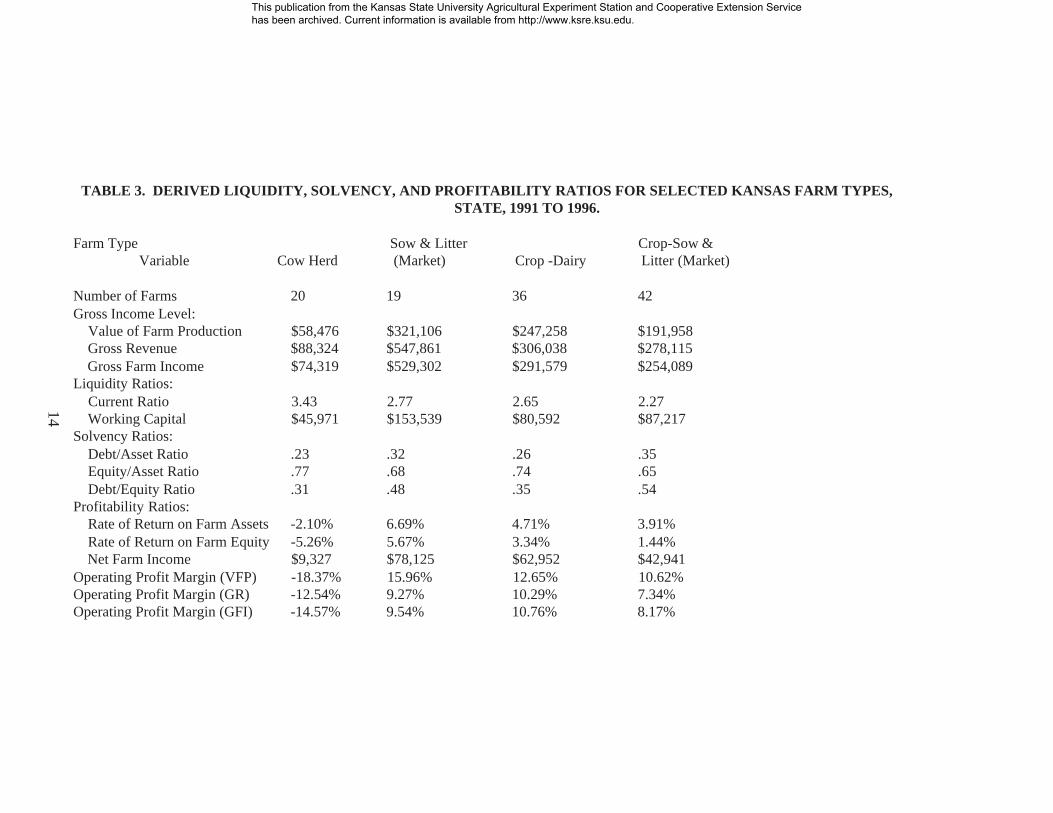
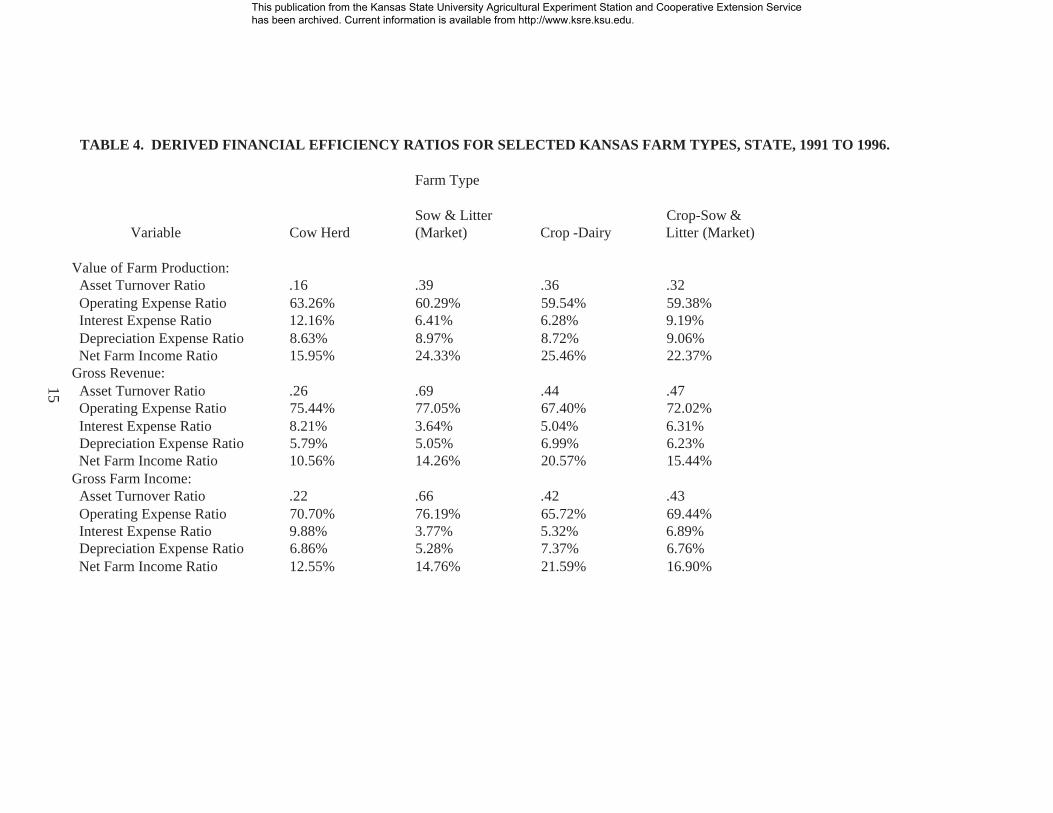
Tables 3 and 4 provide average farm financial ratios for Kansas farm types: cow herd, sow and litter(market), crop-dairy, and crop-sow and litter (market).11 Among farm types analyzed on a statewide basis,cow herd farms had the highest current ratio at 3.43 and the lowest debt to asset ratio at .23. Even though thisfarm type had the lowest risk exposure as measured by the debt to asset ratio, it had the lowest net farmincome, rate of return to farm assets, and operating profit margin at $9,327, a negative 2.10% and a negative18.37%, respectively. The most profitable farm type was sow and litter (market), with net farm income andrate of return to farm asset values of $78,125 and 6.69%, respectively.
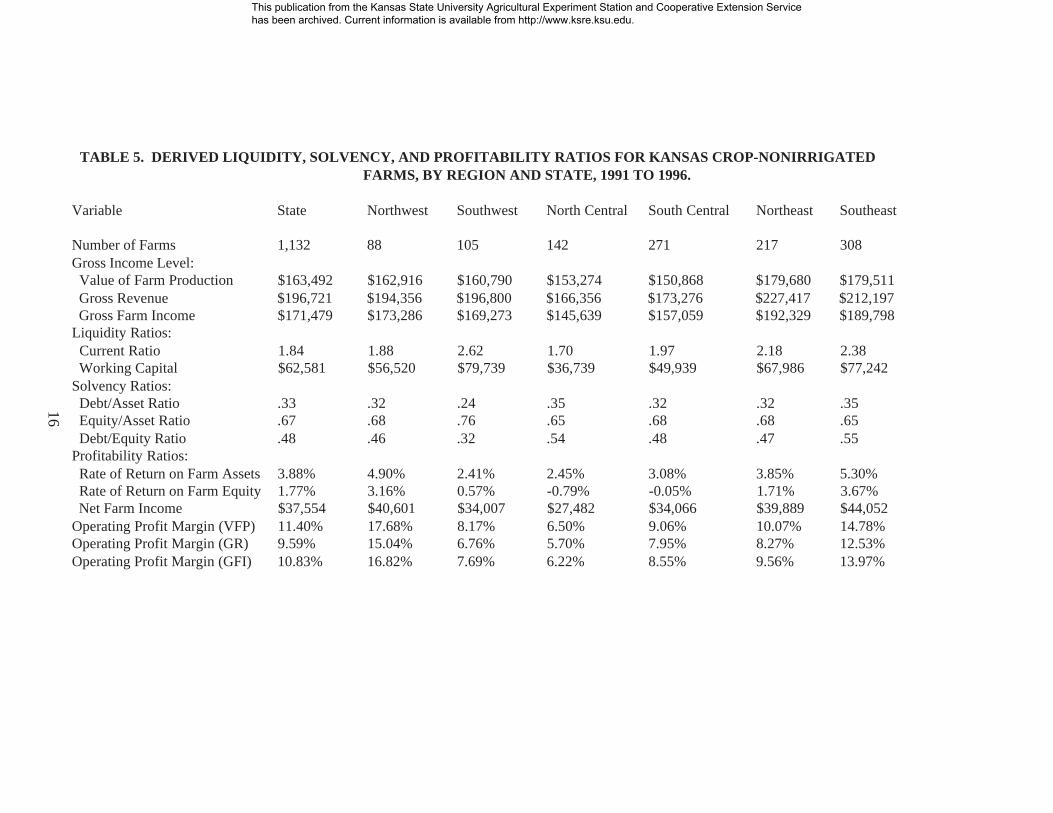
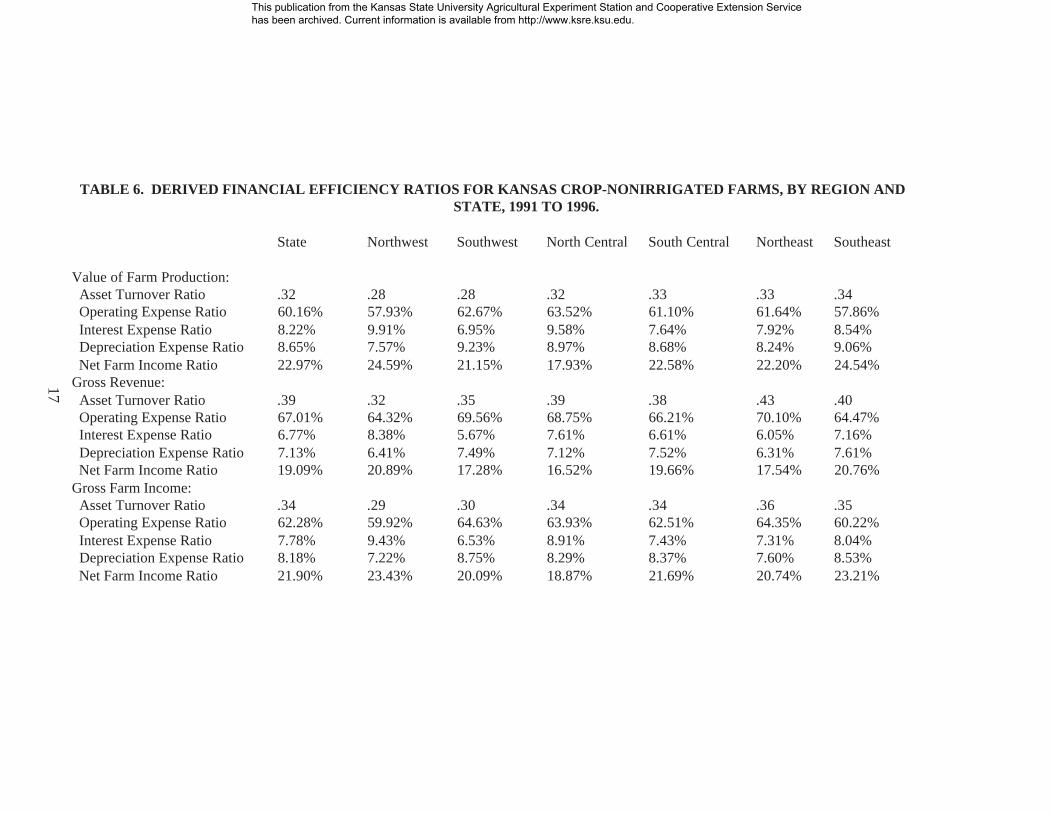
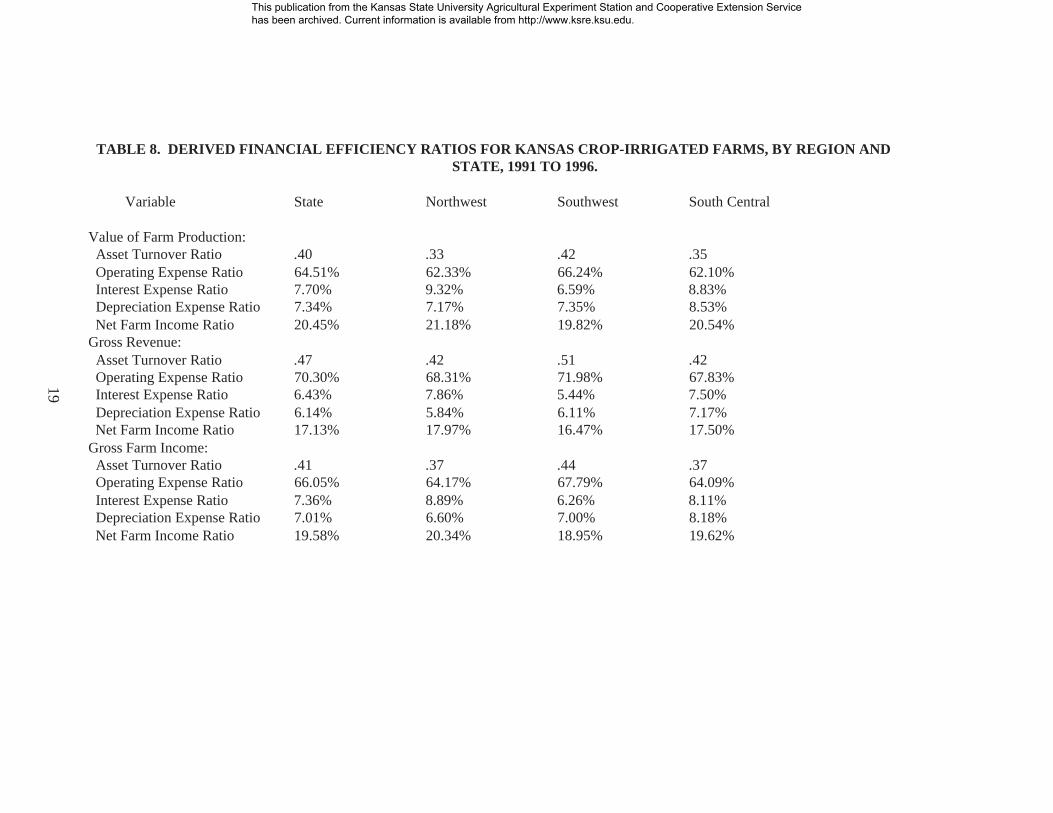
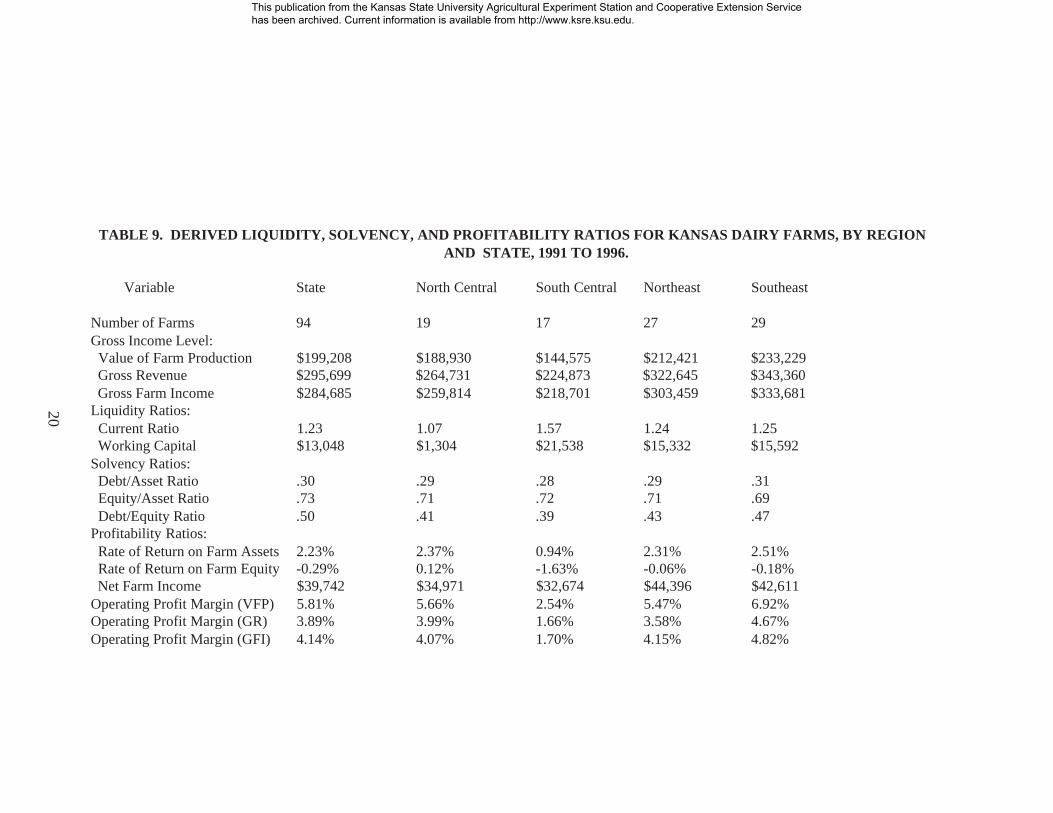
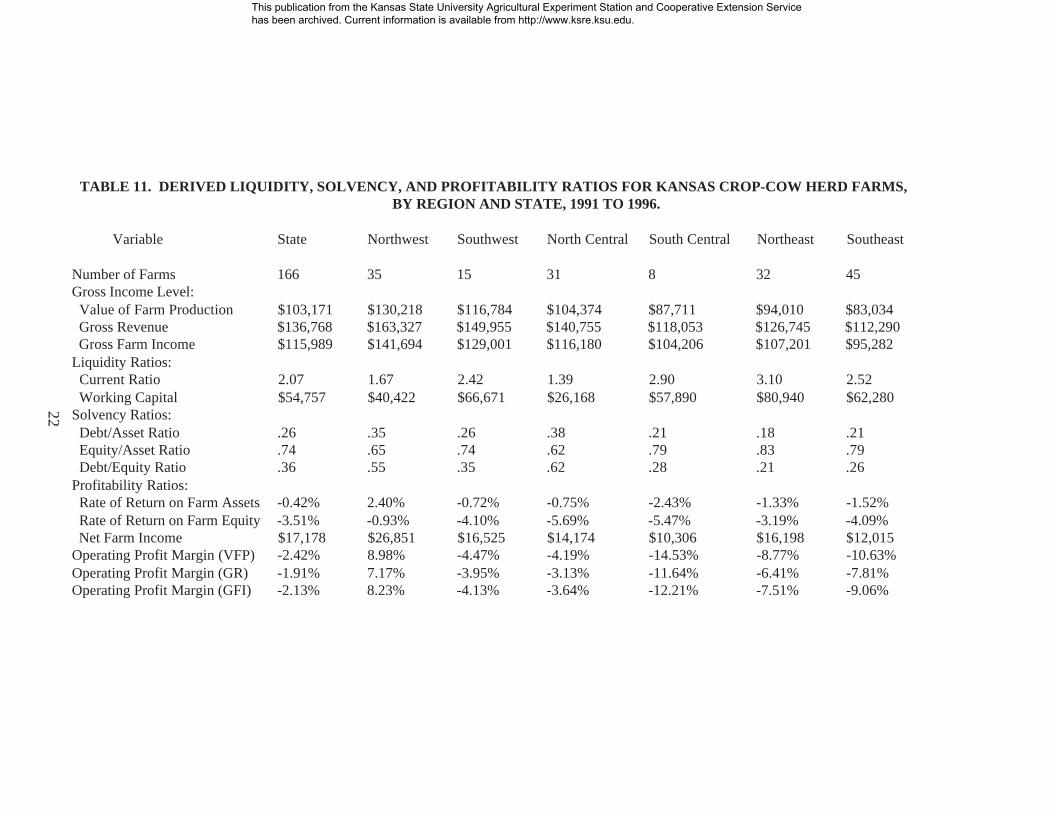
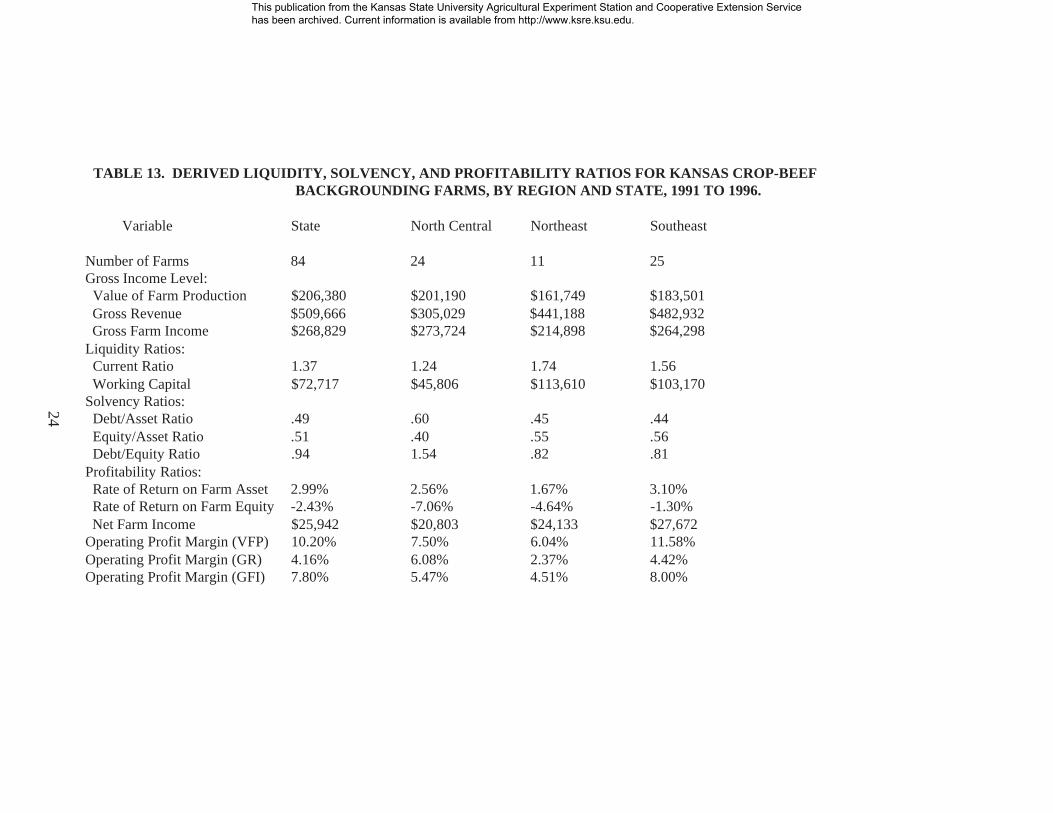
Tables 6 through 17 outline farm financial ratios on state and regional bases for the following farmtypes: crop-nonirrigated, crop-irrigated, dairy, crop-cow herd, crop-beef backgrounding, and crop-beef. Riskexposure as measured by the debt to asset ratio was the lowest for crop-cow herd (.26), dairy (.30), and crop-beef (.30) farms. Yet, the crop-cow herd farms had the lowest net farm income value of $17,178. The crop-irrigated farms had the highest net farm income and rate of return to assets of $57,602 and 6.61%,respectively. The crop-cow herd and crop-beef backgrounding farms had negative rates of return on farmequity in all regions.
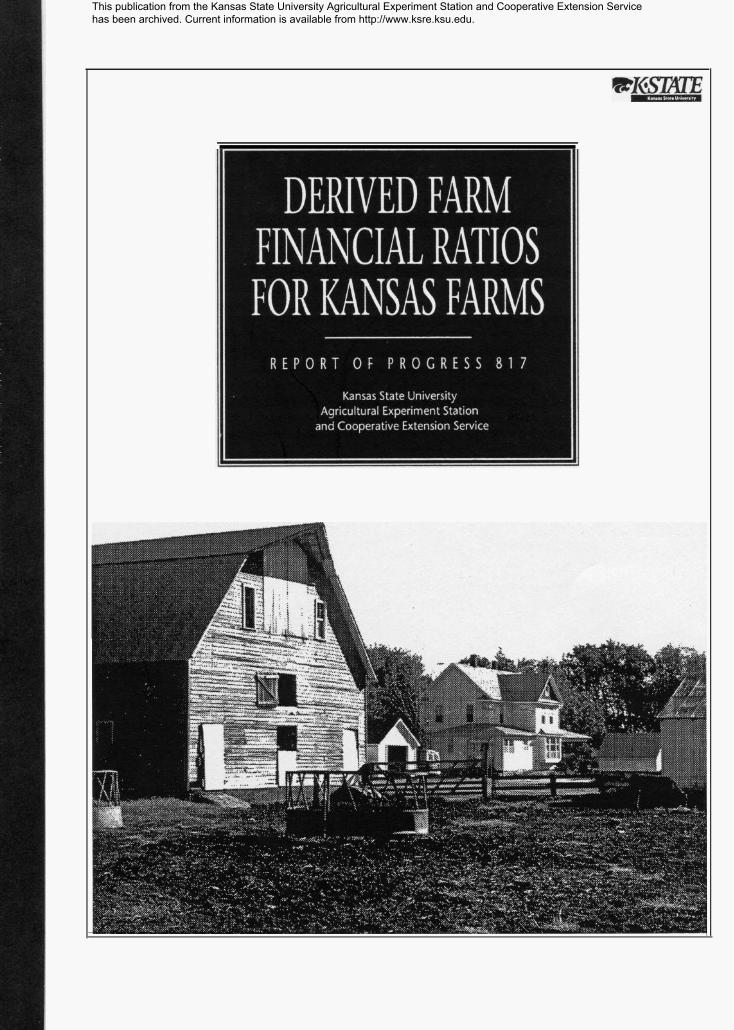
Figure 1 provides information on the rate of return to farm assets by farm type on a statewide basis.Most of the farm types, except for cow herd and crop cow herd farms, had positive average rate of return tofarm assets over the 1991-96 period. The crop-irrigated and sow and litter (market) farm types had thehighest rate of return to farm assets over the period 1991-96.
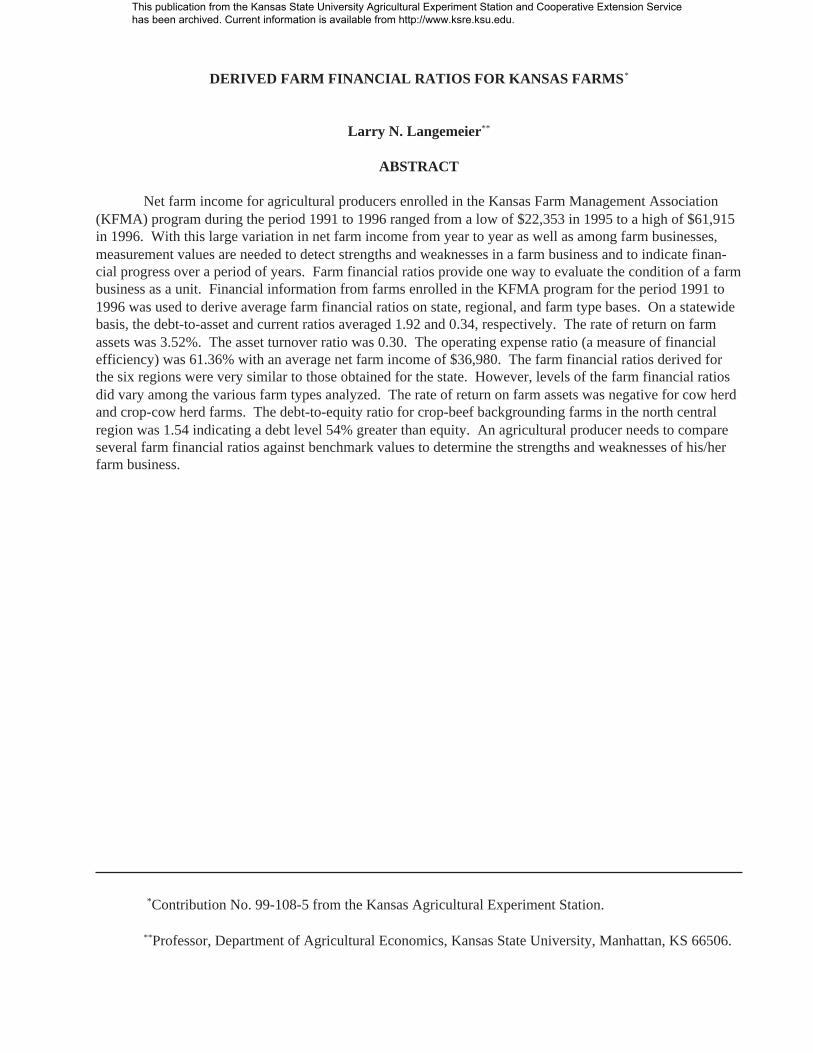
As shown in Figure 2, crop-irrigated farms had the highest operating profit margin ratios, whereas cowherd farms had the lowest ratios. The operating profit margin ratios were positive for most farm types, exceptfor cow herd and crop-cow herd farms.
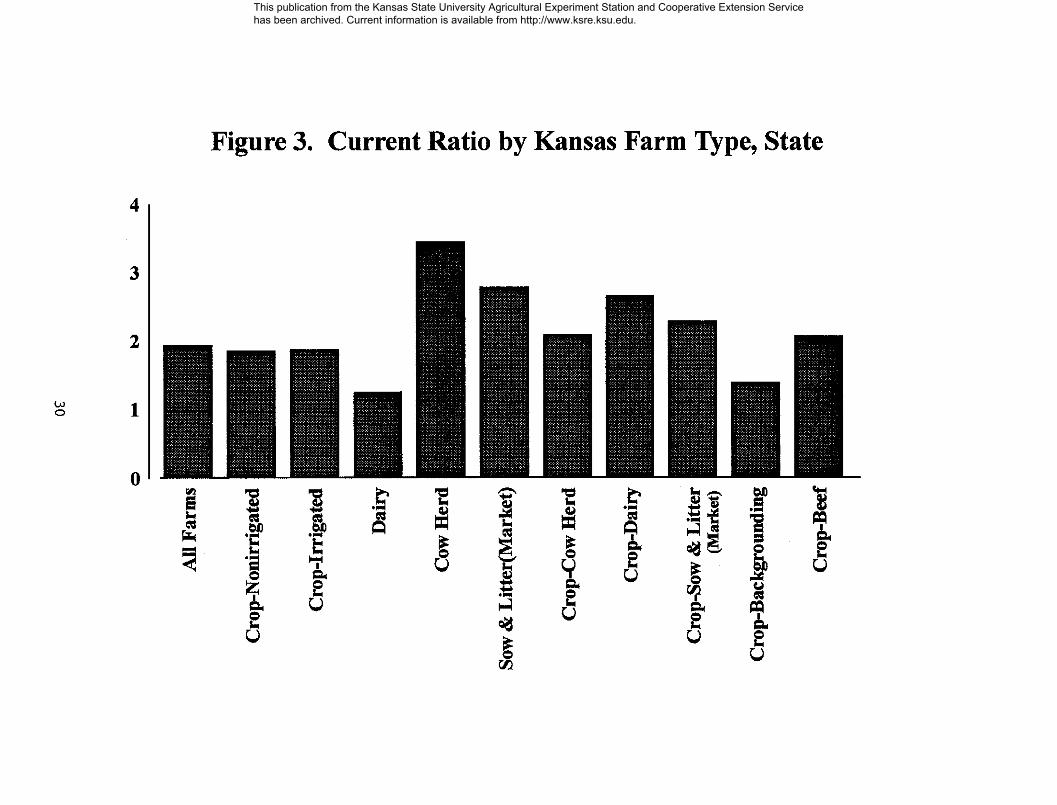
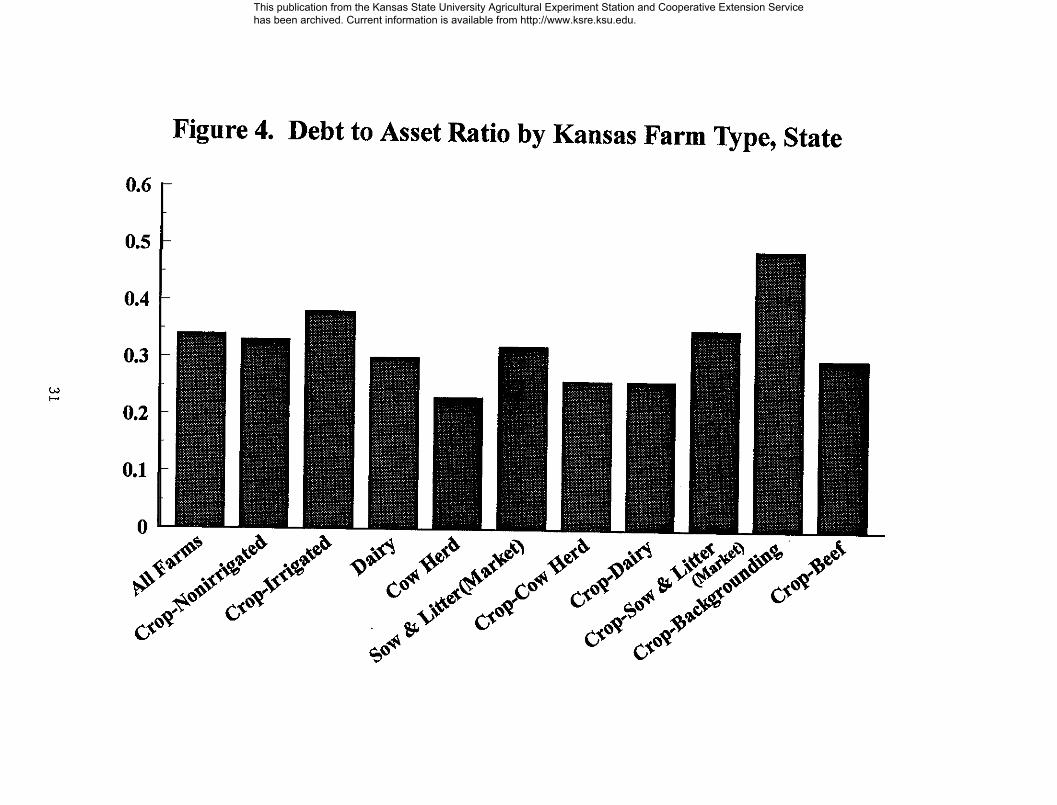
Figure 3 outlines the current ratio values by farm type. Dairy farms had the lowest ratio value at 1.23,whereas cow herd farms had the highest value at 3.43. Even though cow herd farms had a high current ratio,the net farm income value for these farms was the lowest of any farm type over the period of 1991-96. Figure4 provides debt to asset ratios by farm type. Crop-backgrounding farms had the highest ratio at .49, and cowherd farms had the lowest ratio at .23.
10 Gains or losses achieved in the farm business during the accounting year on real estate owned were notincluded in the average net farm income values and, thus, the return to capital values. The average percentageincreases in land values by region during the period 1991-96 as provided by the Kansas AgriculturalStatistics, Kansas Board of Agriculture, U.S. Department of Agriculture were: northwest–3.03%, southwest–2.66%, north central–3.85%, south central–2.33%, northeast–4.11%, southeast–3.42%, and state–3.29%.Total farm assets would need to be increased by these annual inflation rates in the value of owned real estateto determine the true rate of return to farm assets and equity.11 The small number of farms typed as cow herd, sow and litter (market), crop-dairy, and crop-sow andlitter (market) did not allow for a derivation of farm financial ratios on a regional basis.
This publication from the Kansas State University Agricultural Experiment Station and Cooperative Extension Service has been archived. Current information is available from http://www.ksre.ksu.edu.
10
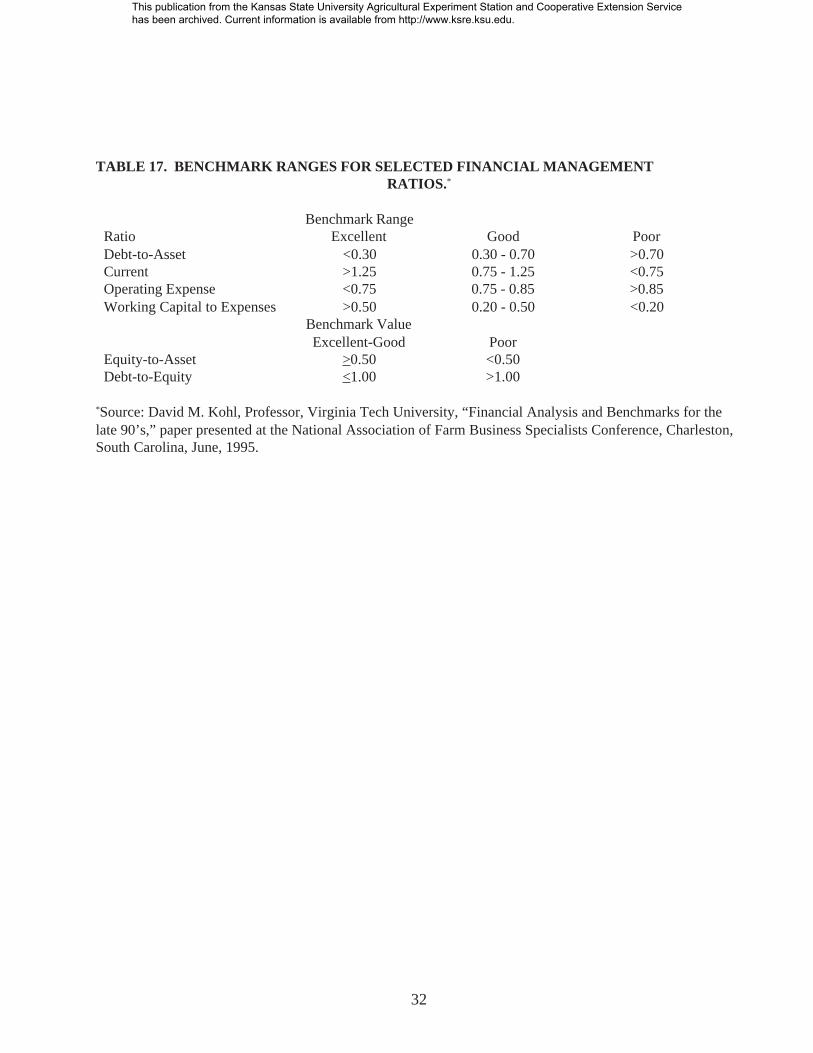
In a 1995 study of financial ratios, David M. Kohl outlined benchmark ranges for selected farmfinancial ratios.12 Benchmark ranges were determined for the three categories of excellent, good, and poor asa measurement of the financial position of the farm business operation for each of the selected farm financialratios shown in Table 17. Farm businesses with farm financial ratios that are in the excellent to goodcategories have fewer financial problems or weaknesses than farm operations that have ratios in the poorcategory. Farm businesses that have a number of farm financial ratios that are in the poor category may haveconsiderable financial problems.
The average financial ratios derived in this analysis for various farm types on a state-wide basis for theperiod 1991 to 1996 as shown in Tables 1-16 were primarily in the excellent to good benchmark rangesoutlined by Kohl’s study. The debt-to-asset ratios for nearly all farm types were less than 0.40, except forcrop-beef backgrounding farms, which had a value of 0.49. The farm types of cow herd, crop-dairy, andcrop-cow herd had debt-to asset ratios less than 0.30. The current ratios for nearly all farm types were greaterthan 1.25, except for dairy farms, which had a current ratio value of 1.23. For all farm types, the operatingexpense ratios were less than 0.75.
The working capital to expenses ratios for the farm types of crop-dairy, crop-irrigated, and crop-beefbackgrounding were in the good benchmark range, with values of 0.44, 0.43, and 0.40, respectively. Dairyfarms had a working capital to expense ratio of 0.08, which was in the poor category of benchmark ranges.13
All the other farm types were in the excellent benchmark ratio range, with working capital to expense ratiosgreater than 0.50. All of the farm types had equity-to-asset and debt-to-equity ratios that were in the excellentto good benchmark range. The crop-beef backgrounding farms had the highest debt-to-equity ratio at 0.94.
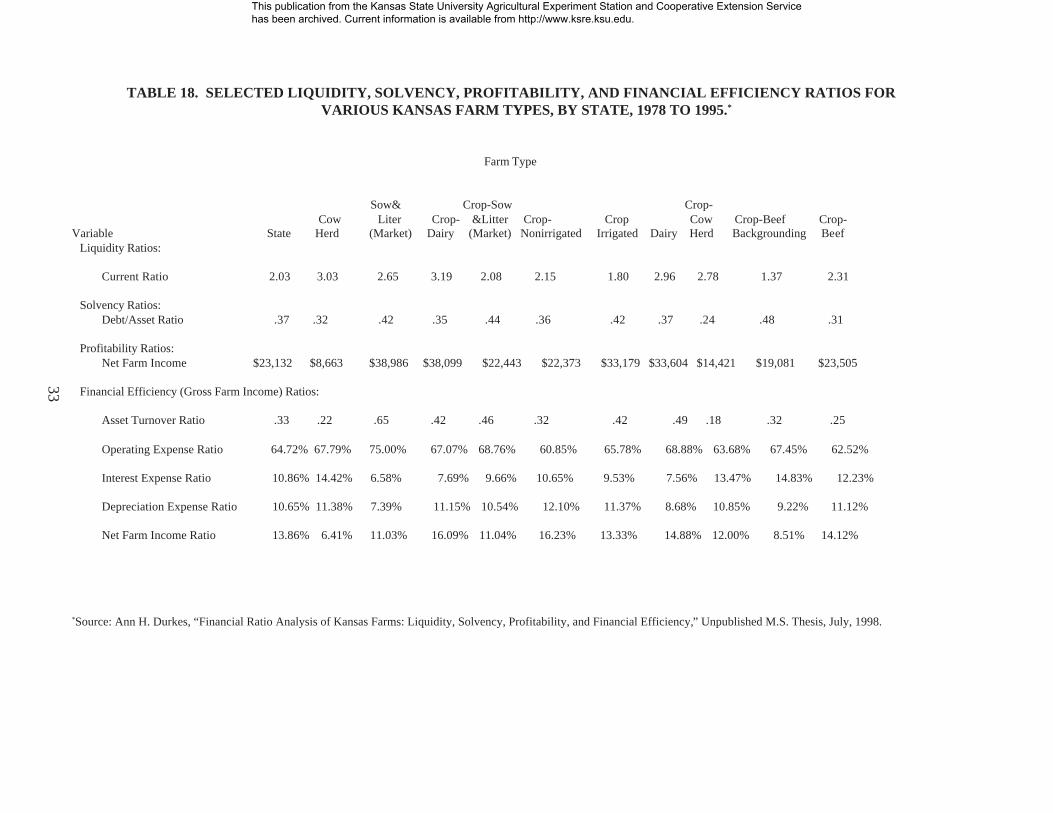
In another study, Ann H. Durkes derived average financial ratios for various farm types for Kansasfarms for the period 1978 to 1995.14 Table 18 outlines selected farm financial ratio values for the state andvarious farm types as determined in that study. The period 1978-1995 included the farm financial crisis yearsof 1981 through 1985, when net farm income averaged only $6,434 per year for farms enrolled in the KFMAprogram. Thus, the net farm income values for all farm types derived in the Durkes’s study were lower thanthose income levels obtained in this analysis. Even then, the average farm financial ratios derived in thisanalysis as outlined in Tables 1 through 16 were very similar to the ratio values shown in Table 18. In thisanalysis, the debt-to-asset values were slightly lower for most of all the farm types, except for crop-cow herdand crop-beef backgrounding farms. For these two farm types, the net farm income values for the periods of1978-1995 and 1991-1996 were very similar.
12 David M. Kohl, Professor, Virginia Tech University, “Financial Analysis and Benchmarks for the Late90’s,” paper presented at the National Association of Farm Business Specialists Conference, Charleston,South Carolina, June, 1995.13 Current assets, and thus working capital, do not include the value of breeding livestock.14 Ann H. Durkes, “Financial Ratio Analysis of Kansas Farms: Liquidity, Solvency, Profitability, andFinancial Efficiency,” Unpublished M.S. Thesis, July, 1998. Data from farms enrolled in the KFMA programwere utilized in this study to determine the average farm financial ratios. The study derived financialefficiency ratios only for the gross farm income method of computing gross farm receipts, and current assetsincluded the value of breeding livestock.
This publication from the Kansas State University Agricultural Experiment Station and Cooperative Extension Service has been archived. Current information is available from http://www.ksre.ksu.edu.
11
CONCLUSIONS
The farm financial ratio values derived on statewide and regional bases from actual farm financialinformation for the period 1991 to 1996 were very similar. The debt-to-asset ratio ranged from a low of 0.31in northeast Kansas to a high of 0.38 in the northwest and north central regions. However, the rate of returnon farm assets was the highest in northwest Kansas at 4.62%. The operating expense ratio obtained using thevalue of farm production income method was 61.36% for the state, and the southeast region had the lowestvalue at 58.94%.
The farm financial ratio values derived for the various farm types showed a wide variation, althoughonly a few of the ratio values indicated financial problems or weaknesses in the farm businesses. On astatewide basis, the debt-to-asset ratio values varied from a low of 0.23 for the cow herd farms to a high of0.49 for the crop-beef backgrounding farms. The sow and litter (market) farms had the highest rate of returnon farm assets at 6.69% followed by crop-irrigated farms at 6.61%. Dairy farms had the lowest current ratiovalue at 1.23.
This study developed a set of average farm financial ratios that can serve as the first step in thederivation of benchmark ratio values. Comparison of farm financial ratios of a farm business to ratios ofother farm businesses of similar type and size may provide the information needed to detect strengths andweaknesses in the operational unit. However, agricultural producers need to study a number of farm financialratios rather than base the profitability of the farm business on only one or two ratios. For example, cow herdfarms had the lowest debt-to-asset ratio of 0.23 and the highest current ratio of 3.43, but also the lowest netfarm income and rate of return to farm assets ratio values of $9,327 and -2.10%, respectively. Whenbenchmark values are available, an agricultural producer should compare a number of farm financial ratiosagainst them to determine the strengths and weaknesses of his/her farm business.
This publication from the Kansas State University Agricultural Experiment Station and Cooperative Extension Service has been archived. Current information is available from http://www.ksre.ksu.edu.
12
TABLE 1. DERIVED LIQUIDITY, SOLVENCY, AND PROFITABILITY RATIOS FOR KANSAS FARMS, BY REGION ANDSTATE, 1991 TO 1996.
Variable State Northwest Southwest North Central South Central Northeast SoutheastNumber of Farms 2,099 228 231 294 362 385 600Gross Income Level: Value of Farm Production $173,697 $188,145 $207,359 $151,638 $159,160 $179,846 $171,758 Gross Revenue $255,210 $255,003 $286,212 $235,461 $215,798 $280,182 $260,855 Gross Farm Income $201,856 $207,598 $223,568 $182,161 $194,181 $215,513 $207,728Liquidity Ratios: Current Ratio 1.92 1.69 1.91 1.53 1.79 2.09 2.17 Working Capital $70,327 $67,441 $83,157 $40,216 $51,819 $79,727 $85,963Solvency Ratios: Debt/Asset Ratio .34 .38 .32 .38 .34 .31 .33 Equity/Asset Ratio .66 .62 .68 .62 .66 .69 .67 Debt/Equity Ratio .50 .60 .46 .61 .51 .45 .49Profitability Ratios: Rate of Return on Farm Assets 3.52% 4.62% 3.76% 2.23% 2.97% 3.15% 3.91% Rate of Return on Farm Equity 1.12% 2.37% 1.75% -1.43% .67% .76% 1.78% Net Farm Income $36,980 $39,755 $40,041 $28,326 $33,535 $38,469 $39,676Operating Profit Margin (VFP) 11.05% 15.94% 11.36% 6.26% 6.45% 9.03% 12.76%Operating Profit Margin (GR) 7.59% 11.84% 8.27% 4.26% 6.71% 6.01% 8.47%Operating Profit Margin (GFI) 9.51% 14.48% 10.53% 5.31% 7.91% 7.73% 10.54%
This publication from the Kansas State University Agricultural Experiment Station and Cooperative Extension Service has been archived. Current information is available from http://www.ksre.ksu.edu.
13
TABLE 2. DERIVED FINANCIAL EFFICIENCY RATIOS FOR KANSAS FARMS, BY REGION AND STATE, 1991 TO 1996.
Variable State Northwest Southwest North Central South Central Northeast Southeast
Value of Farm Production: Asset Turnover Ratio .30 .28 .32 .31 .31 .30 .29 Operating Expense Ratio 61.36% 60.15% 64.56% 62.61% 62.04% 62.33% 58.94% Interest Expense Ratio 9.06% 11.01% 7.94% 10.20% 8.31% 8.49% 9.24% Depreciation Expense Ratio 8.29% 7.71% 8.19% 8.51% 8.58% 7.79% 8.72% Net Farm Income Ratio 21.29% 21.13% 19.31% 18.68% 21.07% 21.39% 23.10%
Gross Revenue: Asset Turnover Ratio .46 .39 .44 .49 .45 .49 .45 Operating Expense Ratio 73.85% 70.86% 74.32% 76.22% 72.14% 76.01% 73.16% Interest Expense Ratio 6.09% 7.96% 5.74% 6.40% 6.07% 5.34% 5.98% Depreciation Expense Ratio 5.57% 5.59% 5.95% 5.35% 6.25% 4.92% 5.65% Net Farm Income Ratio 14.49% 15.59% 13.99% 12.03% 15.54% 13.73% 15.21%
Gross Farm Income: Asset Turnover Ratio .35 .32 .35 .38 .36 .37 .35 Operating Expense Ratio 66.82% 63.99% 67.21% 69.08% 67.30% 68.69% 66.13% Interest Expense Ratio 7.76% 9.91% 7.31% 8.38% 7.62% 7.02% 7.59% Depreciation Expense Ratio 7.10% 6.95% 7.57% 7.01% 7.81% 6.44% 7.18% Net Farm Income Ratio 18.32% 19.15% 17.91% 15.55% 17.27% 17.85% 19.10%
This publication from the Kansas State University Agricultural Experiment Station and Cooperative Extension Service has been archived. Current information is available from http://www.ksre.ksu.edu.
14
TABLE 3. DERIVED LIQUIDITY, SOLVENCY, AND PROFITABILITY RATIOS FOR SELECTED KANSAS FARM TYPES,STATE, 1991 TO 1996.
Farm Type Sow & Litter Crop-Sow & Variable Cow Herd (Market) Crop -Dairy Litter (Market)
Number of Farms 20 19 36 42Gross Income Level: Value of Farm Production $58,476 $321,106 $247,258 $191,958 Gross Revenue $88,324 $547,861 $306,038 $278,115 Gross Farm Income $74,319 $529,302 $291,579 $254,089Liquidity Ratios: Current Ratio 3.43 2.77 2.65 2.27 Working Capital $45,971 $153,539 $80,592 $87,217Solvency Ratios: Debt/Asset Ratio .23 .32 .26 .35 Equity/Asset Ratio .77 .68 .74 .65 Debt/Equity Ratio .31 .48 .35 .54Profitability Ratios: Rate of Return on Farm Assets -2.10% 6.69% 4.71% 3.91% Rate of Return on Farm Equity -5.26% 5.67% 3.34% 1.44% Net Farm Income $9,327 $78,125 $62,952 $42,941Operating Profit Margin (VFP) -18.37% 15.96% 12.65% 10.62%Operating Profit Margin (GR) -12.54% 9.27% 10.29% 7.34%Operating Profit Margin (GFI) -14.57% 9.54% 10.76% 8.17%
This publication from the Kansas State University Agricultural Experiment Station and Cooperative Extension Service has been archived. Current information is available from http://www.ksre.ksu.edu.
15
TABLE 4. DERIVED FINANCIAL EFFICIENCY RATIOS FOR SELECTED KANSAS FARM TYPES, STATE, 1991 TO 1996.
Farm Type
Sow & Litter Crop-Sow & Variable Cow Herd (Market) Crop -Dairy Litter (Market)
Value of Farm Production: Asset Turnover Ratio .16 .39 .36 .32 Operating Expense Ratio 63.26% 60.29% 59.54% 59.38% Interest Expense Ratio 12.16% 6.41% 6.28% 9.19% Depreciation Expense Ratio 8.63% 8.97% 8.72% 9.06% Net Farm Income Ratio 15.95% 24.33% 25.46% 22.37%Gross Revenue: Asset Turnover Ratio .26 .69 .44 .47 Operating Expense Ratio 75.44% 77.05% 67.40% 72.02% Interest Expense Ratio 8.21% 3.64% 5.04% 6.31% Depreciation Expense Ratio 5.79% 5.05% 6.99% 6.23% Net Farm Income Ratio 10.56% 14.26% 20.57% 15.44%Gross Farm Income: Asset Turnover Ratio .22 .66 .42 .43 Operating Expense Ratio 70.70% 76.19% 65.72% 69.44% Interest Expense Ratio 9.88% 3.77% 5.32% 6.89% Depreciation Expense Ratio 6.86% 5.28% 7.37% 6.76% Net Farm Income Ratio 12.55% 14.76% 21.59% 16.90%
This publication from the Kansas State University Agricultural Experiment Station and Cooperative Extension Service has been archived. Current information is available from http://www.ksre.ksu.edu.
16
TABLE 5. DERIVED LIQUIDITY, SOLVENCY, AND PROFITABILITY RATIOS FOR KANSAS CROP-NONIRRIGATEDFARMS, BY REGION AND STATE, 1991 TO 1996.
Variable State Northwest Southwest North Central South Central Northeast Southeast
Number of Farms 1,132 88 105 142 271 217 308Gross Income Level: Value of Farm Production $163,492 $162,916 $160,790 $153,274 $150,868 $179,680 $179,511 Gross Revenue $196,721 $194,356 $196,800 $166,356 $173,276 $227,417 $212,197 Gross Farm Income $171,479 $173,286 $169,273 $145,639 $157,059 $192,329 $189,798Liquidity Ratios: Current Ratio 1.84 1.88 2.62 1.70 1.97 2.18 2.38 Working Capital $62,581 $56,520 $79,739 $36,739 $49,939 $67,986 $77,242Solvency Ratios: Debt/Asset Ratio .33 .32 .24 .35 .32 .32 .35 Equity/Asset Ratio .67 .68 .76 .65 .68 .68 .65 Debt/Equity Ratio .48 .46 .32 .54 .48 .47 .55Profitability Ratios: Rate of Return on Farm Assets 3.88% 4.90% 2.41% 2.45% 3.08% 3.85% 5.30% Rate of Return on Farm Equity 1.77% 3.16% 0.57% -0.79% -0.05% 1.71% 3.67% Net Farm Income $37,554 $40,601 $34,007 $27,482 $34,066 $39,889 $44,052Operating Profit Margin (VFP) 11.40% 17.68% 8.17% 6.50% 9.06% 10.07% 14.78%Operating Profit Margin (GR) 9.59% 15.04% 6.76% 5.70% 7.95% 8.27% 12.53%Operating Profit Margin (GFI) 10.83% 16.82% 7.69% 6.22% 8.55% 9.56% 13.97%
This publication from the Kansas State University Agricultural Experiment Station and Cooperative Extension Service has been archived. Current information is available from http://www.ksre.ksu.edu.
17
TABLE 6. DERIVED FINANCIAL EFFICIENCY RATIOS FOR KANSAS CROP-NONIRRIGATED FARMS, BY REGION ANDSTATE, 1991 TO 1996.
State Northwest Southwest North Central South Central Northeast Southeast
Value of Farm Production: Asset Turnover Ratio .32 .28 .28 .32 .33 .33 .34 Operating Expense Ratio 60.16% 57.93% 62.67% 63.52% 61.10% 61.64% 57.86% Interest Expense Ratio 8.22% 9.91% 6.95% 9.58% 7.64% 7.92% 8.54% Depreciation Expense Ratio 8.65% 7.57% 9.23% 8.97% 8.68% 8.24% 9.06% Net Farm Income Ratio 22.97% 24.59% 21.15% 17.93% 22.58% 22.20% 24.54%Gross Revenue: Asset Turnover Ratio .39 .32 .35 .39 .38 .43 .40 Operating Expense Ratio 67.01% 64.32% 69.56% 68.75% 66.21% 70.10% 64.47% Interest Expense Ratio 6.77% 8.38% 5.67% 7.61% 6.61% 6.05% 7.16% Depreciation Expense Ratio 7.13% 6.41% 7.49% 7.12% 7.52% 6.31% 7.61% Net Farm Income Ratio 19.09% 20.89% 17.28% 16.52% 19.66% 17.54% 20.76%Gross Farm Income: Asset Turnover Ratio .34 .29 .30 .34 .34 .36 .35 Operating Expense Ratio 62.28% 59.92% 64.63% 63.93% 62.51% 64.35% 60.22% Interest Expense Ratio 7.78% 9.43% 6.53% 8.91% 7.43% 7.31% 8.04% Depreciation Expense Ratio 8.18% 7.22% 8.75% 8.29% 8.37% 7.60% 8.53% Net Farm Income Ratio 21.90% 23.43% 20.09% 18.87% 21.69% 20.74% 23.21%
This publication from the Kansas State University Agricultural Experiment Station and Cooperative Extension Service has been archived. Current information is available from http://www.ksre.ksu.edu.
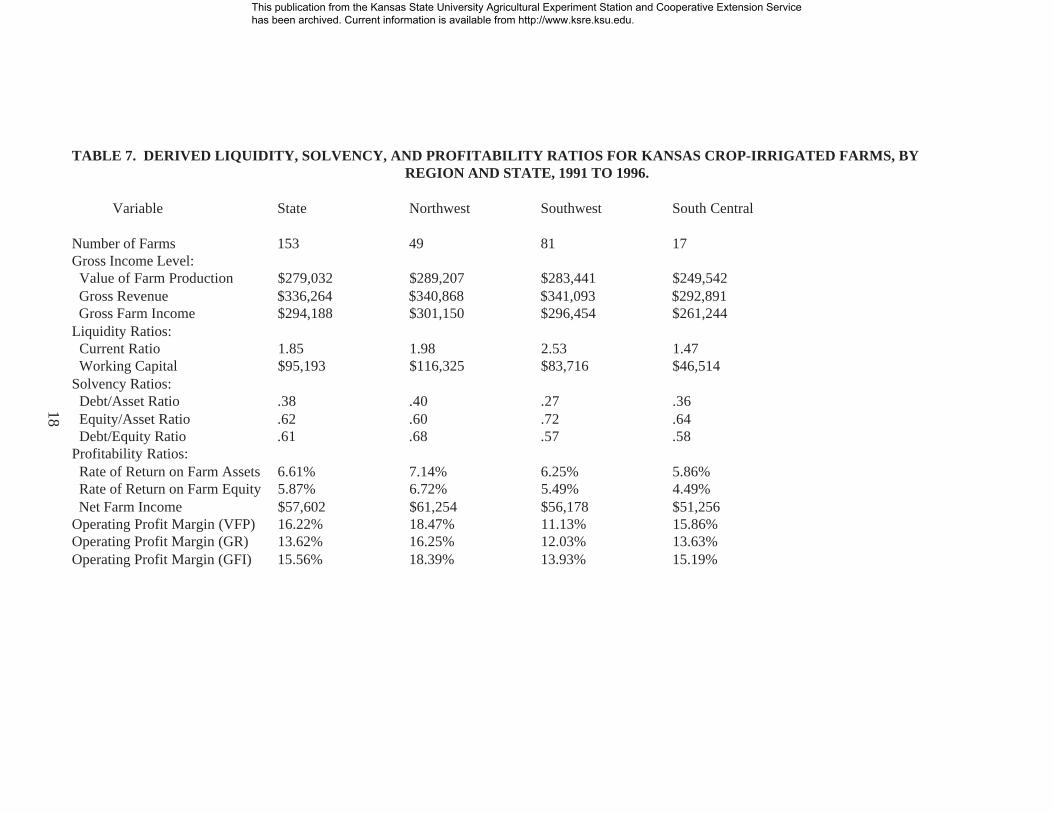
18
TABLE 7. DERIVED LIQUIDITY, SOLVENCY, AND PROFITABILITY RATIOS FOR KANSAS CROP-IRRIGATED FARMS, BYREGION AND STATE, 1991 TO 1996.
Variable State Northwest Southwest South Central
Number of Farms 153 49 81 17Gross Income Level: Value of Farm Production $279,032 $289,207 $283,441 $249,542 Gross Revenue $336,264 $340,868 $341,093 $292,891 Gross Farm Income $294,188 $301,150 $296,454 $261,244Liquidity Ratios: Current Ratio 1.85 1.98 2.53 1.47 Working Capital $95,193 $116,325 $83,716 $46,514Solvency Ratios: Debt/Asset Ratio .38 .40 .27 .36 Equity/Asset Ratio .62 .60 .72 .64 Debt/Equity Ratio .61 .68 .57 .58Profitability Ratios: Rate of Return on Farm Assets 6.61% 7.14% 6.25% 5.86% Rate of Return on Farm Equity 5.87% 6.72% 5.49% 4.49% Net Farm Income $57,602 $61,254 $56,178 $51,256Operating Profit Margin (VFP) 16.22% 18.47% 11.13% 15.86%Operating Profit Margin (GR) 13.62% 16.25% 12.03% 13.63%Operating Profit Margin (GFI) 15.56% 18.39% 13.93% 15.19%
This publication from the Kansas State University Agricultural Experiment Station and Cooperative Extension Service has been archived. Current information is available from http://www.ksre.ksu.edu.
19
TABLE 8. DERIVED FINANCIAL EFFICIENCY RATIOS FOR KANSAS CROP-IRRIGATED FARMS, BY REGION ANDSTATE, 1991 TO 1996.
Variable State Northwest Southwest South Central
Value of Farm Production: Asset Turnover Ratio .40 .33 .42 .35 Operating Expense Ratio 64.51% 62.33% 66.24% 62.10% Interest Expense Ratio 7.70% 9.32% 6.59% 8.83% Depreciation Expense Ratio 7.34% 7.17% 7.35% 8.53% Net Farm Income Ratio 20.45% 21.18% 19.82% 20.54%Gross Revenue: Asset Turnover Ratio .47 .42 .51 .42 Operating Expense Ratio 70.30% 68.31% 71.98% 67.83% Interest Expense Ratio 6.43% 7.86% 5.44% 7.50% Depreciation Expense Ratio 6.14% 5.84% 6.11% 7.17% Net Farm Income Ratio 17.13% 17.97% 16.47% 17.50%Gross Farm Income: Asset Turnover Ratio .41 .37 .44 .37 Operating Expense Ratio 66.05% 64.17% 67.79% 64.09% Interest Expense Ratio 7.36% 8.89% 6.26% 8.11% Depreciation Expense Ratio 7.01% 6.60% 7.00% 8.18% Net Farm Income Ratio 19.58% 20.34% 18.95% 19.62%
This publication from the Kansas State University Agricultural Experiment Station and Cooperative Extension Service has been archived. Current information is available from http://www.ksre.ksu.edu.
20
TABLE 9. DERIVED LIQUIDITY, SOLVENCY, AND PROFITABILITY RATIOS FOR KANSAS DAIRY FARMS, BY REGIONAND STATE, 1991 TO 1996.
Variable State North Central South Central Northeast Southeast
Number of Farms 94 19 17 27 29Gross Income Level: Value of Farm Production $199,208 $188,930 $144,575 $212,421 $233,229 Gross Revenue $295,699 $264,731 $224,873 $322,645 $343,360 Gross Farm Income $284,685 $259,814 $218,701 $303,459 $333,681Liquidity Ratios: Current Ratio 1.23 1.07 1.57 1.24 1.25 Working Capital $13,048 $1,304 $21,538 $15,332 $15,592Solvency Ratios: Debt/Asset Ratio .30 .29 .28 .29 .31 Equity/Asset Ratio .73 .71 .72 .71 .69 Debt/Equity Ratio .50 .41 .39 .43 .47Profitability Ratios: Rate of Return on Farm Assets 2.23% 2.37% 0.94% 2.31% 2.51% Rate of Return on Farm Equity -0.29% 0.12% -1.63% -0.06% -0.18% Net Farm Income $39,742 $34,971 $32,674 $44,396 $42,611Operating Profit Margin (VFP) 5.81% 5.66% 2.54% 5.47% 6.92%Operating Profit Margin (GR) 3.89% 3.99% 1.66% 3.58% 4.67%Operating Profit Margin (GFI) 4.14% 4.07% 1.70% 4.15% 4.82%
This publication from the Kansas State University Agricultural Experiment Station and Cooperative Extension Service has been archived. Current information is available from http://www.ksre.ksu.edu.
21
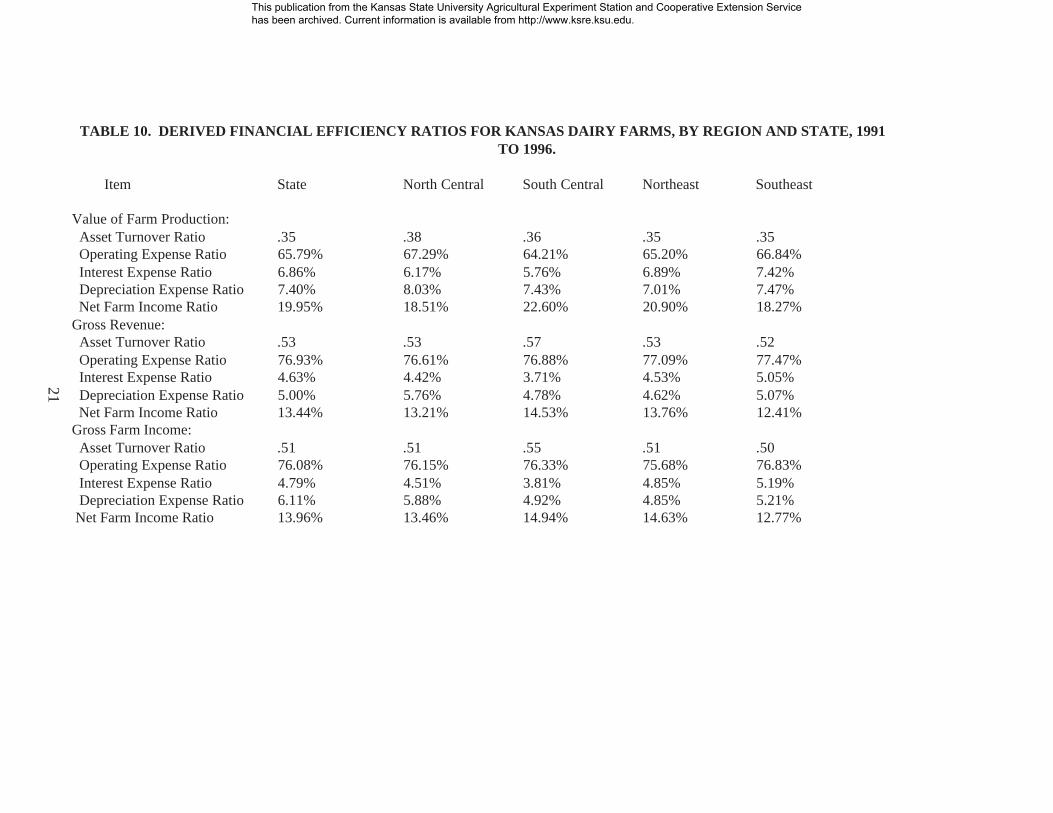
TABLE 10. DERIVED FINANCIAL EFFICIENCY RATIOS FOR KANSAS DAIRY FARMS, BY REGION AND STATE, 1991TO 1996.
Item State North Central South Central Northeast Southeast
Value of Farm Production: Asset Turnover Ratio .35 .38 .36 .35 .35 Operating Expense Ratio 65.79% 67.29% 64.21% 65.20% 66.84% Interest Expense Ratio 6.86% 6.17% 5.76% 6.89% 7.42% Depreciation Expense Ratio 7.40% 8.03% 7.43% 7.01% 7.47% Net Farm Income Ratio 19.95% 18.51% 22.60% 20.90% 18.27%Gross Revenue: Asset Turnover Ratio .53 .53 .57 .53 .52 Operating Expense Ratio 76.93% 76.61% 76.88% 77.09% 77.47% Interest Expense Ratio 4.63% 4.42% 3.71% 4.53% 5.05% Depreciation Expense Ratio 5.00% 5.76% 4.78% 4.62% 5.07% Net Farm Income Ratio 13.44% 13.21% 14.53% 13.76% 12.41%Gross Farm Income: Asset Turnover Ratio .51 .51 .55 .51 .50 Operating Expense Ratio 76.08% 76.15% 76.33% 75.68% 76.83% Interest Expense Ratio 4.79% 4.51% 3.81% 4.85% 5.19% Depreciation Expense Ratio 6.11% 5.88% 4.92% 4.85% 5.21% Net Farm Income Ratio 13.96% 13.46% 14.94% 14.63% 12.77%
This publication from the Kansas State University Agricultural Experiment Station and Cooperative Extension Service has been archived. Current information is available from http://www.ksre.ksu.edu.
22
TABLE 11. DERIVED LIQUIDITY, SOLVENCY, AND PROFITABILITY RATIOS FOR KANSAS CROP-COW HERD FARMS,BY REGION AND STATE, 1991 TO 1996.
Variable State Northwest Southwest North Central South Central Northeast Southeast
Number of Farms 166 35 15 31 8 32 45Gross Income Level: Value of Farm Production $103,171 $130,218 $116,784 $104,374 $87,711 $94,010 $83,034 Gross Revenue $136,768 $163,327 $149,955 $140,755 $118,053 $126,745 $112,290 Gross Farm Income $115,989 $141,694 $129,001 $116,180 $104,206 $107,201 $95,282Liquidity Ratios: Current Ratio 2.07 1.67 2.42 1.39 2.90 3.10 2.52 Working Capital $54,757 $40,422 $66,671 $26,168 $57,890 $80,940 $62,280Solvency Ratios: Debt/Asset Ratio .26 .35 .26 .38 .21 .18 .21 Equity/Asset Ratio .74 .65 .74 .62 .79 .83 .79 Debt/Equity Ratio .36 .55 .35 .62 .28 .21 .26Profitability Ratios: Rate of Return on Farm Assets -0.42% 2.40% -0.72% -0.75% -2.43% -1.33% -1.52% Rate of Return on Farm Equity -3.51% -0.93% -4.10% -5.69% -5.47% -3.19% -4.09% Net Farm Income $17,178 $26,851 $16,525 $14,174 $10,306 $16,198 $12,015Operating Profit Margin (VFP) -2.42% 8.98% -4.47% -4.19% -14.53% -8.77% -10.63%Operating Profit Margin (GR) -1.91% 7.17% -3.95% -3.13% -11.64% -6.41% -7.81%Operating Profit Margin (GFI) -2.13% 8.23% -4.13% -3.64% -12.21% -7.51% -9.06%
This publication from the Kansas State University Agricultural Experiment Station and Cooperative Extension Service has been archived. Current information is available from http://www.ksre.ksu.edu.
23
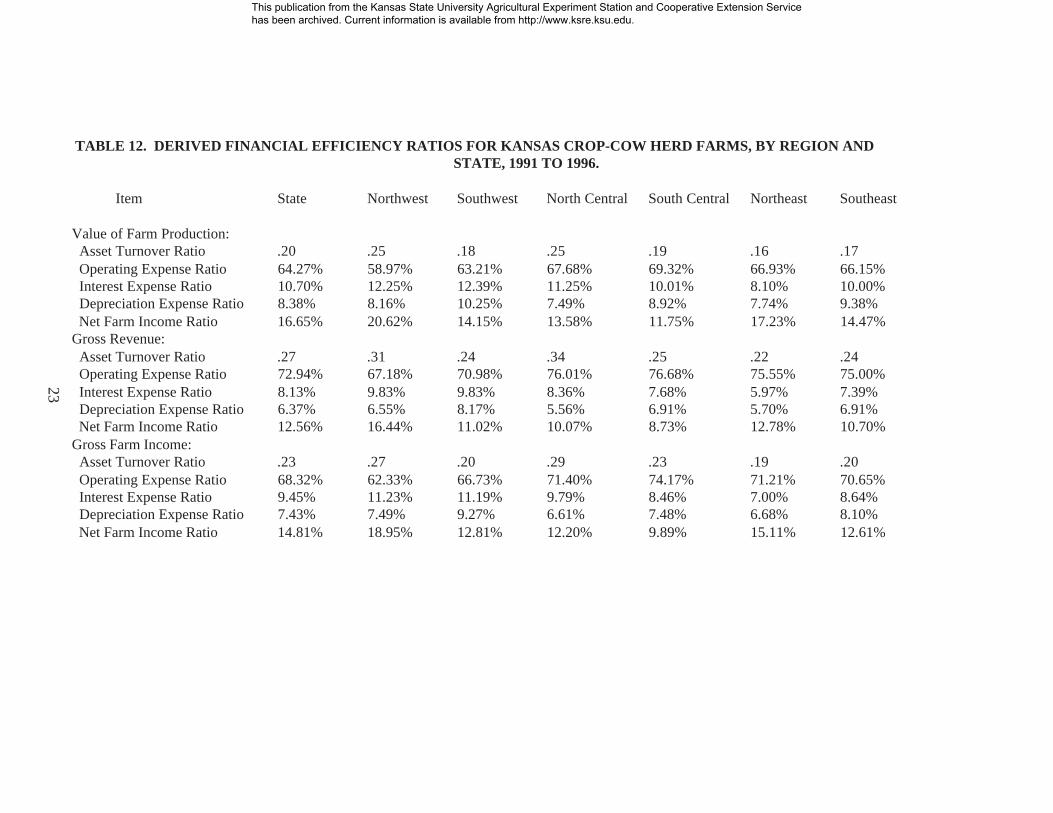
TABLE 12. DERIVED FINANCIAL EFFICIENCY RATIOS FOR KANSAS CROP-COW HERD FARMS, BY REGION ANDSTATE, 1991 TO 1996.
Item State Northwest Southwest North Central South Central Northeast Southeast
Value of Farm Production: Asset Turnover Ratio .20 .25 .18 .25 .19 .16 .17 Operating Expense Ratio 64.27% 58.97% 63.21% 67.68% 69.32% 66.93% 66.15% Interest Expense Ratio 10.70% 12.25% 12.39% 11.25% 10.01% 8.10% 10.00% Depreciation Expense Ratio 8.38% 8.16% 10.25% 7.49% 8.92% 7.74% 9.38% Net Farm Income Ratio 16.65% 20.62% 14.15% 13.58% 11.75% 17.23% 14.47%Gross Revenue: Asset Turnover Ratio .27 .31 .24 .34 .25 .22 .24 Operating Expense Ratio 72.94% 67.18% 70.98% 76.01% 76.68% 75.55% 75.00% Interest Expense Ratio 8.13% 9.83% 9.83% 8.36% 7.68% 5.97% 7.39% Depreciation Expense Ratio 6.37% 6.55% 8.17% 5.56% 6.91% 5.70% 6.91% Net Farm Income Ratio 12.56% 16.44% 11.02% 10.07% 8.73% 12.78% 10.70%Gross Farm Income: Asset Turnover Ratio .23 .27 .20 .29 .23 .19 .20 Operating Expense Ratio 68.32% 62.33% 66.73% 71.40% 74.17% 71.21% 70.65% Interest Expense Ratio 9.45% 11.23% 11.19% 9.79% 8.46% 7.00% 8.64% Depreciation Expense Ratio 7.43% 7.49% 9.27% 6.61% 7.48% 6.68% 8.10% Net Farm Income Ratio 14.81% 18.95% 12.81% 12.20% 9.89% 15.11% 12.61%
This publication from the Kansas State University Agricultural Experiment Station and Cooperative Extension Service has been archived. Current information is available from http://www.ksre.ksu.edu.
24
TABLE 13. DERIVED LIQUIDITY, SOLVENCY, AND PROFITABILITY RATIOS FOR KANSAS CROP-BEEFBACKGROUNDING FARMS, BY REGION AND STATE, 1991 TO 1996.
Variable State North Central Northeast Southeast
Number of Farms 84 24 11 25Gross Income Level: Value of Farm Production $206,380 $201,190 $161,749 $183,501 Gross Revenue $509,666 $305,029 $441,188 $482,932 Gross Farm Income $268,829 $273,724 $214,898 $264,298Liquidity Ratios: Current Ratio 1.37 1.24 1.74 1.56 Working Capital $72,717 $45,806 $113,610 $103,170Solvency Ratios: Debt/Asset Ratio .49 .60 .45 .44 Equity/Asset Ratio .51 .40 .55 .56 Debt/Equity Ratio .94 1.54 .82 .81Profitability Ratios: Rate of Return on Farm Asset 2.99% 2.56% 1.67% 3.10% Rate of Return on Farm Equity -2.43% -7.06% -4.64% -1.30% Net Farm Income $25,942 $20,803 $24,133 $27,672Operating Profit Margin (VFP) 10.20% 7.50% 6.04% 11.58%Operating Profit Margin (GR) 4.16% 6.08% 2.37% 4.42%Operating Profit Margin (GFI) 7.80% 5.47% 4.51% 8.00%
This publication from the Kansas State University Agricultural Experiment Station and Cooperative Extension Service has been archived. Current information is available from http://www.ksre.ksu.edu.
25
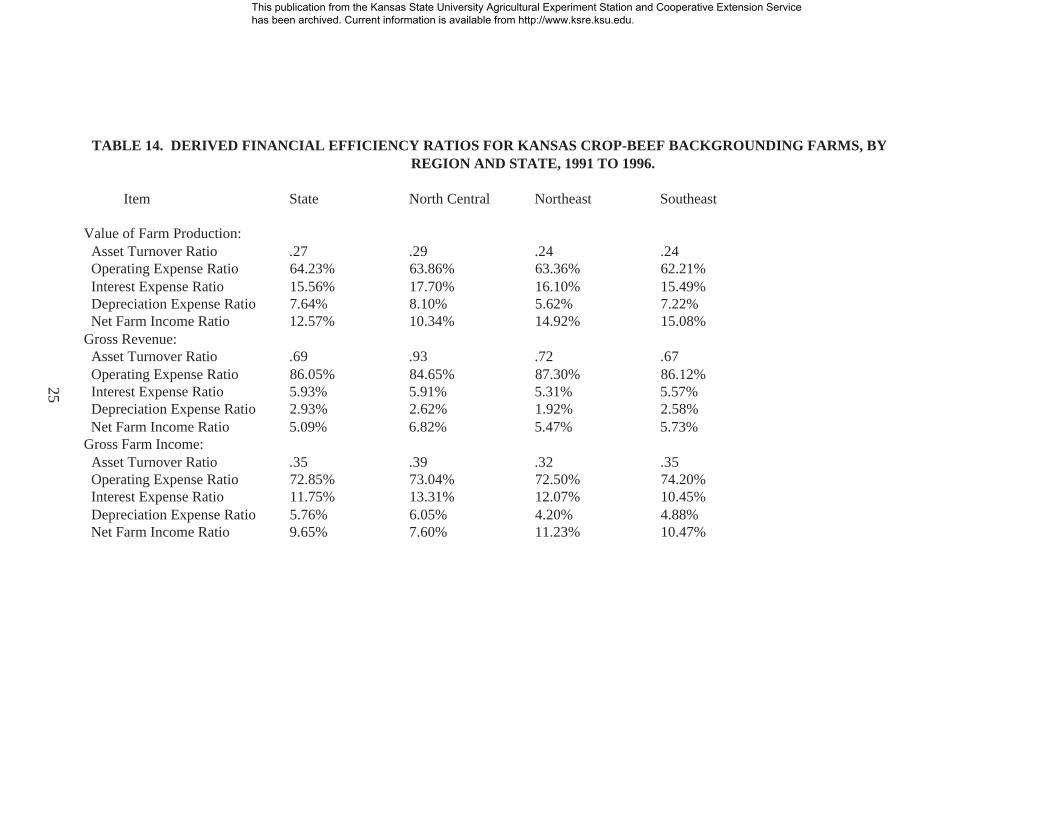
TABLE 14. DERIVED FINANCIAL EFFICIENCY RATIOS FOR KANSAS CROP-BEEF BACKGROUNDING FARMS, BYREGION AND STATE, 1991 TO 1996.
Item State North Central Northeast Southeast
Value of Farm Production: Asset Turnover Ratio .27 .29 .24 .24 Operating Expense Ratio 64.23% 63.86% 63.36% 62.21% Interest Expense Ratio 15.56% 17.70% 16.10% 15.49% Depreciation Expense Ratio 7.64% 8.10% 5.62% 7.22% Net Farm Income Ratio 12.57% 10.34% 14.92% 15.08%Gross Revenue: Asset Turnover Ratio .69 .93 .72 .67 Operating Expense Ratio 86.05% 84.65% 87.30% 86.12% Interest Expense Ratio 5.93% 5.91% 5.31% 5.57% Depreciation Expense Ratio 2.93% 2.62% 1.92% 2.58% Net Farm Income Ratio 5.09% 6.82% 5.47% 5.73%Gross Farm Income: Asset Turnover Ratio .35 .39 .32 .35 Operating Expense Ratio 72.85% 73.04% 72.50% 74.20% Interest Expense Ratio 11.75% 13.31% 12.07% 10.45% Depreciation Expense Ratio 5.76% 6.05% 4.20% 4.88% Net Farm Income Ratio 9.65% 7.60% 11.23% 10.47%
This publication from the Kansas State University Agricultural Experiment Station and Cooperative Extension Service has been archived. Current information is available from http://www.ksre.ksu.edu.
26
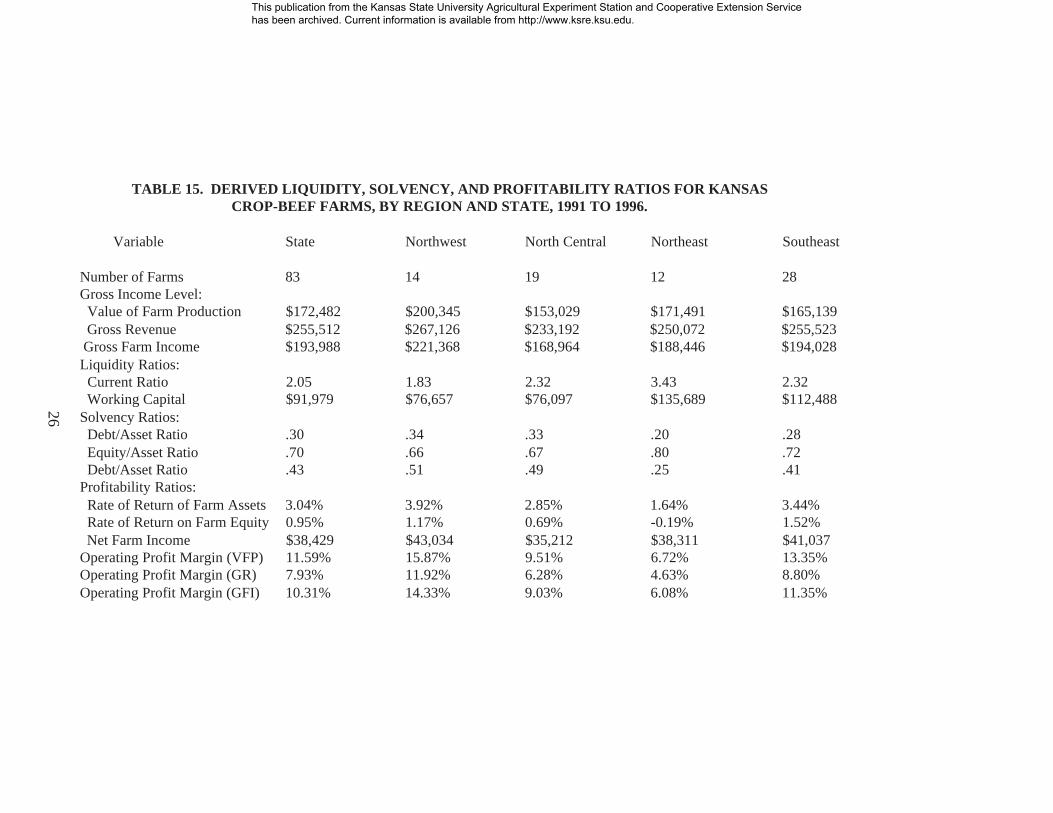
TABLE 15. DERIVED LIQUIDITY, SOLVENCY, AND PROFITABILITY RATIOS FOR KANSASCROP-BEEF FARMS, BY REGION AND STATE, 1991 TO 1996.
Variable State Northwest North Central Northeast Southeast
Number of Farms 83 14 19 12 28Gross Income Level: Value of Farm Production $172,482 $200,345 $153,029 $171,491 $165,139 Gross Revenue $255,512 $267,126 $233,192 $250,072 $255,523 Gross Farm Income $193,988 $221,368 $168,964 $188,446 $194,028Liquidity Ratios: Current Ratio 2.05 1.83 2.32 3.43 2.32 Working Capital $91,979 $76,657 $76,097 $135,689 $112,488Solvency Ratios: Debt/Asset Ratio .30 .34 .33 .20 .28 Equity/Asset Ratio .70 .66 .67 .80 .72 Debt/Asset Ratio .43 .51 .49 .25 .41Profitability Ratios: Rate of Return of Farm Assets 3.04% 3.92% 2.85% 1.64% 3.44% Rate of Return on Farm Equity 0.95% 1.17% 0.69% -0.19% 1.52% Net Farm Income $38,429 $43,034 $35,212 $38,311 $41,037Operating Profit Margin (VFP) 11.59% 15.87% 9.51% 6.72% 13.35%Operating Profit Margin (GR) 7.93% 11.92% 6.28% 4.63% 8.80%Operating Profit Margin (GFI) 10.31% 14.33% 9.03% 6.08% 11.35%
This publication from the Kansas State University Agricultural Experiment Station and Cooperative Extension Service has been archived. Current information is available from http://www.ksre.ksu.edu.
27
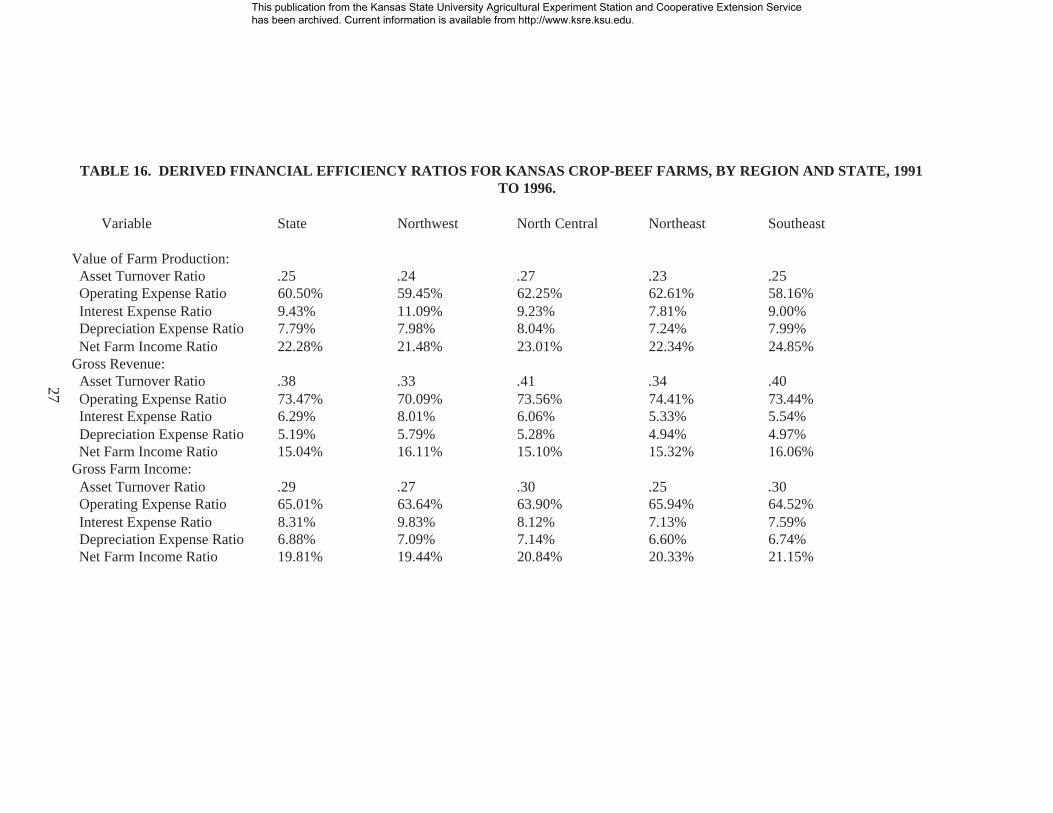
TABLE 16. DERIVED FINANCIAL EFFICIENCY RATIOS FOR KANSAS CROP-BEEF FARMS, BY REGION AND STATE, 1991TO 1996.
Variable State Northwest North Central Northeast Southeast
Value of Farm Production: Asset Turnover Ratio .25 .24 .27 .23 .25 Operating Expense Ratio 60.50% 59.45% 62.25% 62.61% 58.16% Interest Expense Ratio 9.43% 11.09% 9.23% 7.81% 9.00% Depreciation Expense Ratio 7.79% 7.98% 8.04% 7.24% 7.99% Net Farm Income Ratio 22.28% 21.48% 23.01% 22.34% 24.85%Gross Revenue: Asset Turnover Ratio .38 .33 .41 .34 .40 Operating Expense Ratio 73.47% 70.09% 73.56% 74.41% 73.44% Interest Expense Ratio 6.29% 8.01% 6.06% 5.33% 5.54% Depreciation Expense Ratio 5.19% 5.79% 5.28% 4.94% 4.97% Net Farm Income Ratio 15.04% 16.11% 15.10% 15.32% 16.06%Gross Farm Income: Asset Turnover Ratio .29 .27 .30 .25 .30 Operating Expense Ratio 65.01% 63.64% 63.90% 65.94% 64.52% Interest Expense Ratio 8.31% 9.83% 8.12% 7.13% 7.59% Depreciation Expense Ratio 6.88% 7.09% 7.14% 6.60% 6.74% Net Farm Income Ratio 19.81% 19.44% 20.84% 20.33% 21.15%
This publication from the Kansas State University Agricultural Experiment Station and Cooperative Extension Service has been archived. Current information is available from http://www.ksre.ksu.edu.
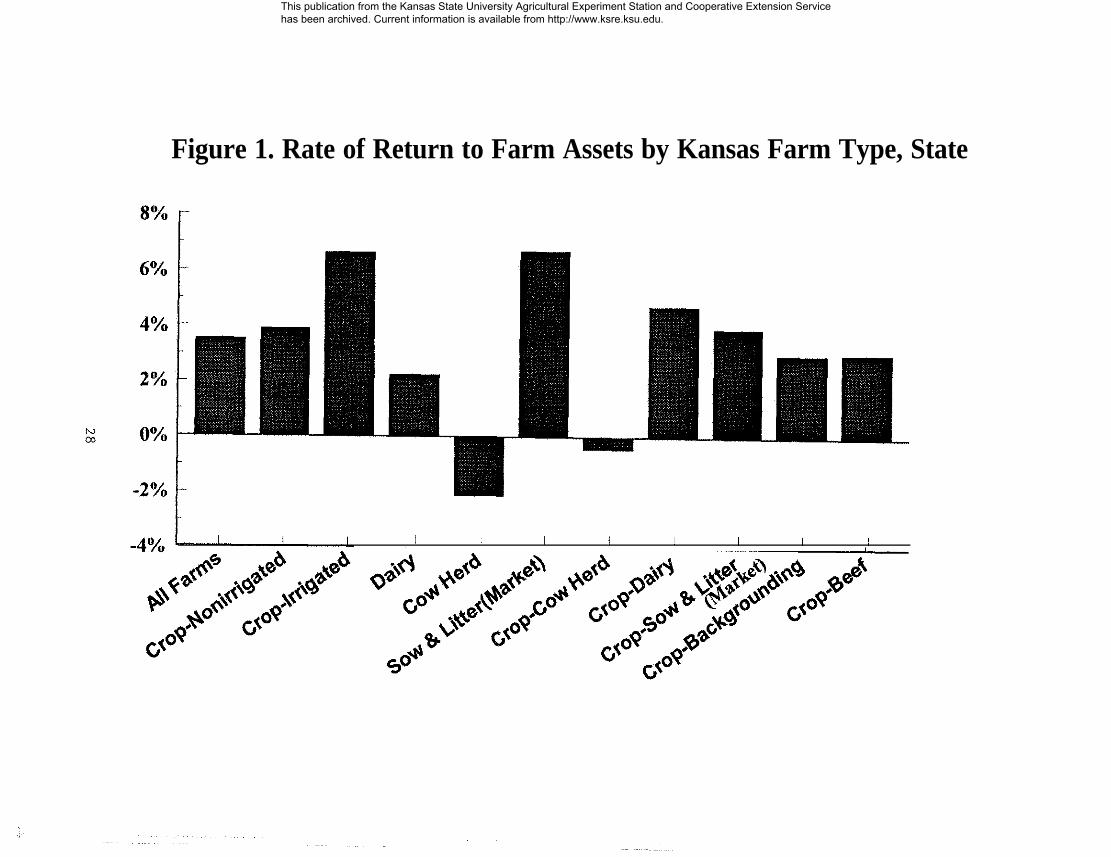
Figure 1. Rate of Return to Farm Assets by Kansas Farm Type, State
6%
4%
2%
E 0%
-2%
I I I I I I I I
This publication from the Kansas State University Agricultural Experiment Station and Cooperative Extension Service has been archived. Current information is available from http://www.ksre.ksu.edu.
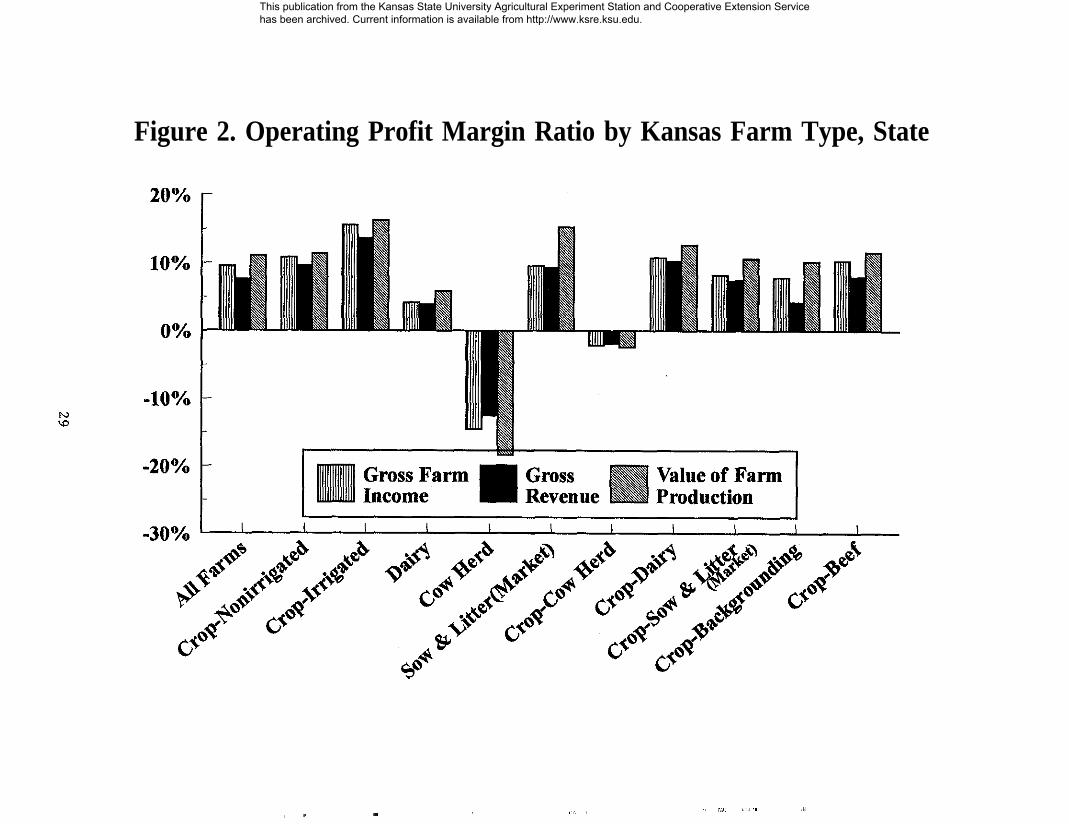
Figure 2. Operating Profit Margin Ratio by Kansas Farm Type, State
0%
-10%c:
Value of Farm
,,, ,,,, ,,,,,, ,‘, VI,, 8, ,,, ,,.,,, ,,,,,m./, ,,/,,
This publication from the Kansas State University Agricultural Experiment Station and Cooperative Extension Service has been archived. Current information is available from http://www.ksre.ksu.edu.
This publication from the Kansas State University Agricultural Experiment Station and Cooperative Extension Service has been archived. Current information is available from http://www.ksre.ksu.edu.
31
This publication from the Kansas State University Agricultural Experiment Station and Cooperative Extension Service has been archived. Current information is available from http://www.ksre.ksu.edu.
32
TABLE 17. BENCHMARK RANGES FOR SELECTED FINANCIAL MANAGEMENTRATIOS. *
Benchmark RangeRatio Excellent Good PoorDebt-to-Asset <0.30 0.30 - 0.70 >0.70Current >1.25 0.75 - 1.25 <0.75Operating Expense <0.75 0.75 - 0.85 >0.85Working Capital to Expenses >0.50 0.20 - 0.50 <0.20
Benchmark ValueExcellent-Good Poor
Equity-to-Asset >0.50 <0.50Debt-to-Equity <1.00 >1.00
*Source: David M. Kohl, Professor, Virginia Tech University, “Financial Analysis and Benchmarks for thelate 90’s,” paper presented at the National Association of Farm Business Specialists Conference, Charleston,South Carolina, June, 1995.
This publication from the Kansas State University Agricultural Experiment Station and Cooperative Extension Service has been archived. Current information is available from http://www.ksre.ksu.edu.
33
TABLE 18. SELECTED LIQUIDITY, SOLVENCY, PROFITABILITY, AND FINANCIAL EFFICIENCY RATIOS FORVARIOUS KANSAS FARM TYPES, BY STATE, 1978 TO 1995.*
Farm Type
Sow& Crop-Sow Crop- Cow Liter Crop- &Litter Crop- Crop Cow Crop-Beef Crop-
Variable State Herd (Market) Dairy (Market) Nonirrigated Irrigated Dairy Herd Backgrounding BeefLiquidity Ratios:
Current Ratio 2.03 3.03 2.65 3.19 2.08 2.15 1.80 2.96 2.78 1.37 2.31
Solvency Ratios:Debt/Asset Ratio .37 .32 .42 .35 .44 .36 .42 .37 .24 .48 .31
Profitability Ratios:Net Farm Income $23,132 $8,663 $38,986 $38,099 $22,443 $22,373 $33,179 $33,604 $14,421 $19,081 $23,505
Financial Efficiency (Gross Farm Income) Ratios:
Asset Turnover Ratio .33 .22 .65 .42 .46 .32 .42 .49 .18 .32 .25
Operating Expense Ratio 64.72% 67.79% 75.00% 67.07% 68.76% 60.85% 65.78% 68.88% 63.68% 67.45% 62.52%
Interest Expense Ratio 10.86% 14.42% 6.58% 7.69% 9.66% 10.65% 9.53% 7.56% 13.47% 14.83% 12.23%
Depreciation Expense Ratio 10.65% 11.38% 7.39% 11.15% 10.54% 12.10% 11.37% 8.68% 10.85% 9.22% 11.12%
Net Farm Income Ratio 13.86% 6.41% 11.03% 16.09% 11.04% 16.23% 13.33% 14.88% 12.00% 8.51% 14.12%
*Source: Ann H. Durkes, “Financial Ratio Analysis of Kansas Farms: Liquidity, Solvency, Profitability, and Financial Efficiency,” Unpublished M.S. Thesis, July, 1998.
This publication from the Kansas State University Agricultural Experiment Station and Cooperative Extension Service has been archived. Current information is available from http://www.ksre.ksu.edu.
34
Appendix Table 1. Balance Sheet, Income, and Cash Flow Financial Statements for Example FarmJohn P. Recorder
Balance Sheet (Farm Business Only)
Beg. Invent. Ending Invent. 1/1/98 12/31/98
ASSETSCash on Hand $ 0 $0Cash on Deposit in Bank 31,000 31,140Marketable Securities 0 0Market Livestock 184,050 232,650Crops Held for Sale and Feed 37,500 17,980Fertilizer and Supplies on Hand 11,100 7,625Accounts Receivable 9,500 10,000Prepaid Expenses 0 0Cash Investment in Growing Crops 8,250 9,000Other Current Assets (List) 1,400 645
TOTAL CURRENT ASSETS $282,800 $309,040
Breeding Livestock (Market) 25,200 25,500Auto-Trucks (Market) 15,000 13,520Motorized Equipment (Market) 73,000 70,700Machinery and Equipment (Market) 39,800 37,605Investments in Capital Leases 0 0Investments in Other Entities 6,000 6,000Investments in Cooperatives 18,000 18,000Real Estate (Market) 189,300 198,750Building-Improvements (Market) 85,000 104,950Other Assets (List)
TOTAL NONCURRENT ASSETS $451,300 $475,025
TOTAL ASSETS $734,100 $784,065
LIABILITIESAccounts Payable 0 0Notes Due within One Year 125,100 118,975Current Portion of Term Debt Due within 12 Months 9,000 11,125Accrued Interest 5,000 8,500Income Taxes Payable 3,200 3,200Current Portion-Deferred Taxes 58,755 55,910Other Accrued Expenses 8,000 4,000Other Current Liabilities (List)
TOTAL CURRENT LIABILITIES $209,055 $201,710
Noncurrent Portion - - Notes Payable 12,900 20,790Noncurrent Portion - - Real Estate Debt 63,500 83,025Noncurrent Portion - - Deferred Taxes 68,160 71,275Other Noncurrent Liabilities
TOTAL NONCURRENT LIABILITIES $144,560 $175,090
TOTAL LIABILITIES $353,615 $376,800
Retained Capital 259,295 280,160Valuation Equity 121,190 127,105OWNER EQUITY $380,485 $407,265
TOTAL LIABILITIES AND OWNER EQUITY $734,100 $784,065
This publication from the Kansas State University Agricultural Experiment Station and Cooperative Extension Service has been archived. Current information is available from http://www.ksre.ksu.edu.
35
John P. RecorderVFP Income Statement (Farm Business Only)
January 1, 1998 to December 31, 1998
Farm Business ReceiptsCrop Cash Sales $ 35,870+ Ending Crop Inventory 17,980- Beginning Crop Inventory 37,500
GROSS REVENUES FROM CROPS $ 16,350
Market Livestock Cash Sales 343,100+ Ending Market Livestock Inventory 232,650- Beginning Market Livestock Inventory 184,050
GROSS REVENUES FROM MARKET LIVESTOCK $ 391,700
Gain/Loss From Breeding Livestock Sales and QuantityChange in Raised Breeding Livestock 1,950Agr. Program Payments 3,100Crop Insurance Proceed 5,500Other Farm Income 2,000Accrued Income Inventory Adjustment 500
GROSS REVENUES $421,500Less Purchase of Market Livestock 124,000Less Cost of Purchased Feed/Grain 130,000
VALUE OF FARM PRODUCTION $167,500
Farm Business ExpensesLabor Hired $ 18,200Machinery-Building Repairs 9,400Seed-Other Crop Expense 3,100Fertilizer-Lime 7,000Machine Hire-Lease 2,400Farm Org. Fees, Publications 1,500Vet-Medicine-Drugs 3,900Livestock Marketing 4,600Gasoline-Fuel-Oil 10,000Real and Personal Property Taxes 2,500General Farm Insurance 2,200Cash Farm Rent 7,800Utilities 4,800Herbicides-Insecticides 4,000Conservation 500
TOTAL CASH OPERATING EXPENSES $ 81,900Accrued Expense Inventory Adjustment (4,000)Production Supply Expense Inventory Adjustment 3,475Total Depreciation Expense 22,425
TOTAL OPERATING EXPENSES $103,800Total Accrued Interest Expense 16,600
TOTAL EXPENSES $120,400NET FARM INCOME FROM OPERATIONS $ 47,100
Gain/Loss on Sale of Farm Capital Assets 0Gain/Loss from Change in the Base Value-For Raised
Breeding Livestock 0NET FARM INCOME, ACCRUAL ADJUSTED $ 47,100
This publication from the Kansas State University Agricultural Experiment Station and Cooperative Extension Service has been archived. Current information is available from http://www.ksre.ksu.edu.
36
John P. RecorderGross Revenues Income Statement (Farm Business Only)
January 1, 1998 to December 31, 1998
Farm Business ReceiptsCrop Cash Sales $ 35,870+ Ending Crop Inventory 17,980- Beginning Crop Inventory 37,500
GROSS REVENUE FROM CROPS $ 16,350
Market Livestock Cash Sales 343,100+ Ending Market Livestock Inventory 232,650- Beginning Market Livestock Inventory 184,050
GROSS REVENUES FROM MARKET LIVESTOCK $391,700
Gain/Loss From Breeding Livestock Sales and QuantityChange in Raised Breeding Livestock 1,950Agr. Program Payments 3,100Crop Insurance Proceeds 5,500Other Farm Income 2,000Accrued Income Inventory Adjustment 500
GROSS REVENUES $421,500
Farm Business ExpensesLabor Hired $ 18,200Machinery-Buildings Repairs 9,400Seed-Other Crop Expense 3,100Fertilizer-Lime 7,000Machine Hire-Lease 2,400Farm Org. Fees, Publications 1,500Vet-Medicine-Drugs 3,900Livestock Marketing 4,600Gasoline-Fuel-Oil 10,000Real and Personal Property Taxes 2,500General Farm Insurance 2,200Cash Farm Rent 7,800Utilities 4,800Herbicides-Insecticides 4,000Conservation 500
TOTAL CASH OPERATING EXPENSES $ 81,900Purchase of Market Livestock/Products 124,000Cost of Purchased Feed/Grain 130,000Accrued Expense Inventory Adjustment (4,000)Production Supply Expense Inventory Adjustment 3,475Total Depreciation Expense 22,425
TOTAL OPERATING EXPENSES $357,800Total Accrued Interest Expense 16,600
TOTAL EXPENSES $374,400NET FARM INCOME FROM OPERATIONS $ 47,100
Gain/Loss on Sale of Farm Capital Assets 0Gain/Loss from Change in the Base Value-For Raised Breeding Livestock 0
NET FARM INCOME, ACCRUAL ADJUSTED $ 47,100
This publication from the Kansas State University Agricultural Experiment Station and Cooperative Extension Service has been archived. Current information is available from http://www.ksre.ksu.edu.
37
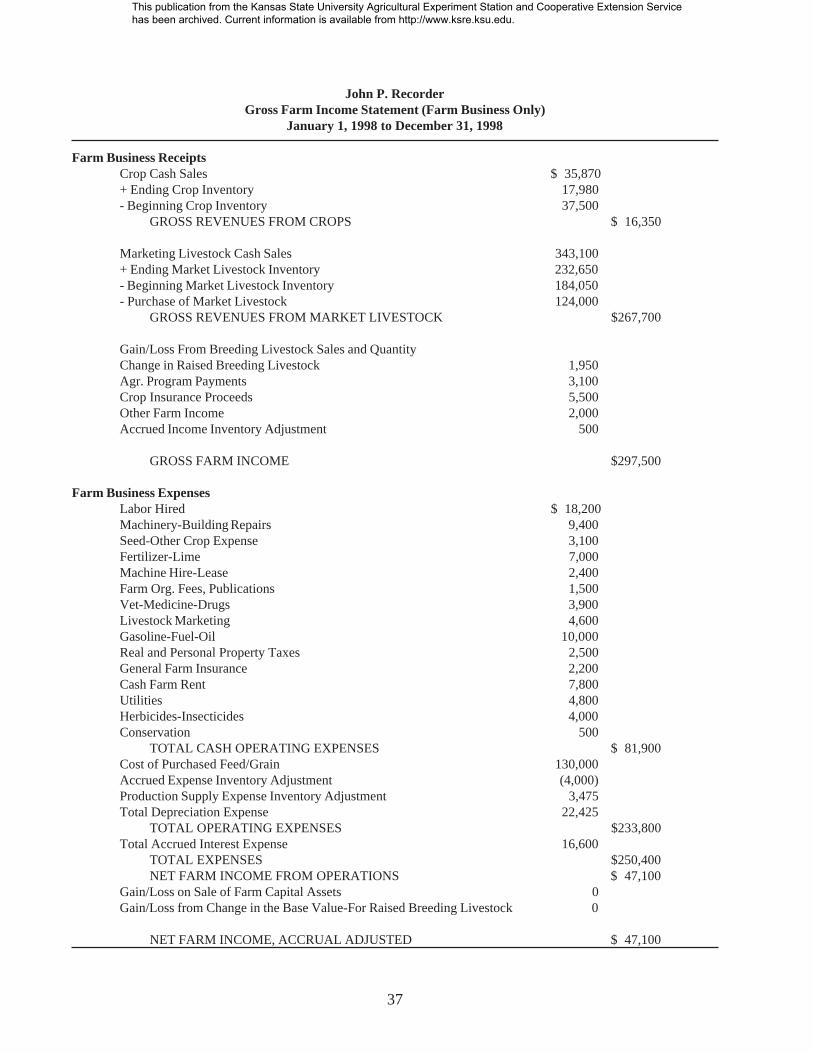
John P. RecorderGross Farm Income Statement (Farm Business Only)
January 1, 1998 to December 31, 1998
Farm Business ReceiptsCrop Cash Sales $ 35,870+ Ending Crop Inventory 17,980- Beginning Crop Inventory 37,500
GROSS REVENUES FROM CROPS $ 16,350
Marketing Livestock Cash Sales 343,100+ Ending Market Livestock Inventory 232,650- Beginning Market Livestock Inventory 184,050- Purchase of Market Livestock 124,000
GROSS REVENUES FROM MARKET LIVESTOCK $267,700
Gain/Loss From Breeding Livestock Sales and QuantityChange in Raised Breeding Livestock 1,950Agr. Program Payments 3,100Crop Insurance Proceeds 5,500Other Farm Income 2,000Accrued Income Inventory Adjustment 500
GROSS FARM INCOME $297,500
Farm Business ExpensesLabor Hired $ 18,200Machinery-Building Repairs 9,400Seed-Other Crop Expense 3,100Fertilizer-Lime 7,000Machine Hire-Lease 2,400Farm Org. Fees, Publications 1,500Vet-Medicine-Drugs 3,900Livestock Marketing 4,600Gasoline-Fuel-Oil 10,000Real and Personal Property Taxes 2,500General Farm Insurance 2,200Cash Farm Rent 7,800Utilities 4,800Herbicides-Insecticides 4,000Conservation 500
TOTAL CASH OPERATING EXPENSES $ 81,900Cost of Purchased Feed/Grain 130,000Accrued Expense Inventory Adjustment (4,000)Production Supply Expense Inventory Adjustment 3,475Total Depreciation Expense 22,425
TOTAL OPERATING EXPENSES $233,800Total Accrued Interest Expense 16,600
TOTAL EXPENSES $250,400NET FARM INCOME FROM OPERATIONS $ 47,100
Gain/Loss on Sale of Farm Capital Assets 0Gain/Loss from Change in the Base Value-For Raised Breeding Livestock 0
NET FARM INCOME, ACCRUAL ADJUSTED $ 47,100
This publication from the Kansas State University Agricultural Experiment Station and Cooperative Extension Service has been archived. Current information is available from http://www.ksre.ksu.edu.
38
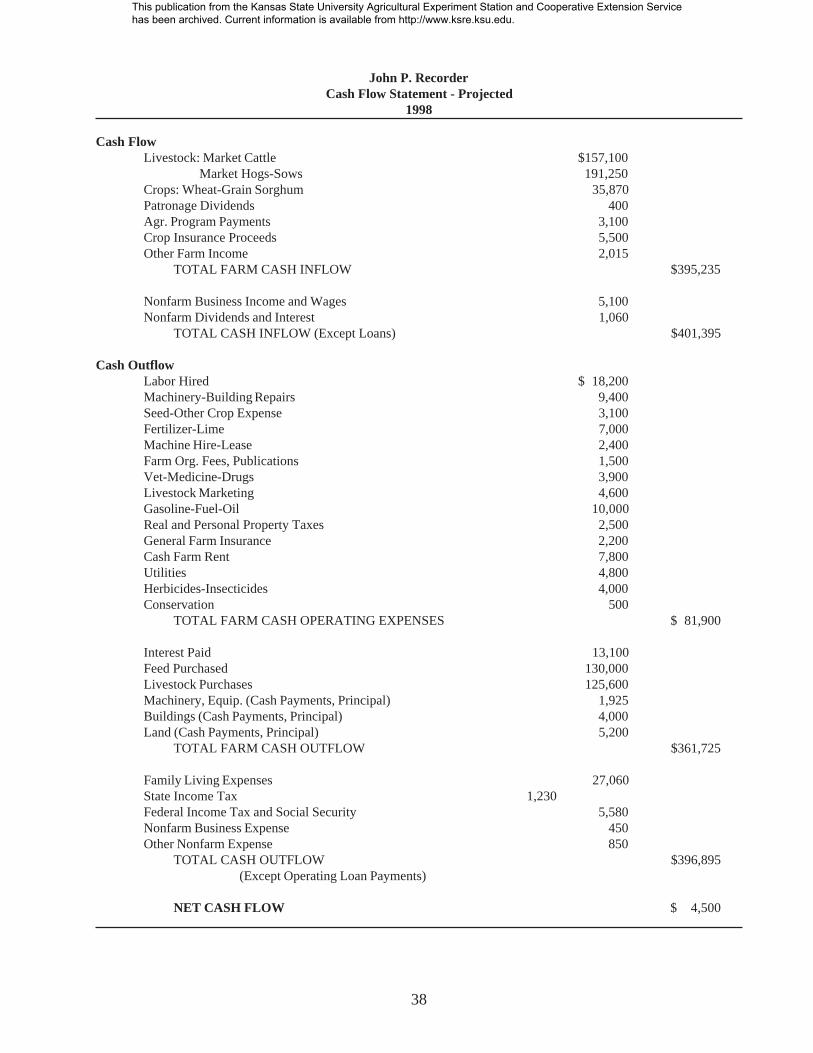
John P. RecorderCash Flow Statement - Projected
1998
Cash FlowLivestock: Market Cattle $157,100
Market Hogs-Sows 191,250Crops: Wheat-Grain Sorghum 35,870Patronage Dividends 400Agr. Program Payments 3,100Crop Insurance Proceeds 5,500Other Farm Income 2,015
TOTAL FARM CASH INFLOW $395,235
Nonfarm Business Income and Wages 5,100Nonfarm Dividends and Interest 1,060
TOTAL CASH INFLOW (Except Loans) $401,395
Cash OutflowLabor Hired $ 18,200Machinery-Building Repairs 9,400Seed-Other Crop Expense 3,100Fertilizer-Lime 7,000Machine Hire-Lease 2,400Farm Org. Fees, Publications 1,500Vet-Medicine-Drugs 3,900Livestock Marketing 4,600Gasoline-Fuel-Oil 10,000Real and Personal Property Taxes 2,500General Farm Insurance 2,200Cash Farm Rent 7,800Utilities 4,800Herbicides-Insecticides 4,000Conservation 500
TOTAL FARM CASH OPERATING EXPENSES $ 81,900
Interest Paid 13,100Feed Purchased 130,000Livestock Purchases 125,600Machinery, Equip. (Cash Payments, Principal) 1,925Buildings (Cash Payments, Principal) 4,000Land (Cash Payments, Principal) 5,200
TOTAL FARM CASH OUTFLOW $361,725
Family Living Expenses 27,060State Income Tax 1,230Federal Income Tax and Social Security 5,580Nonfarm Business Expense 450Other Nonfarm Expense 850
TOTAL CASH OUTFLOW $396,895(Except Operating Loan Payments)
NET CASH FLOW $ 4,500
This publication from the Kansas State University Agricultural Experiment Station and Cooperative Extension Service has been archived. Current information is available from http://www.ksre.ksu.edu.
39
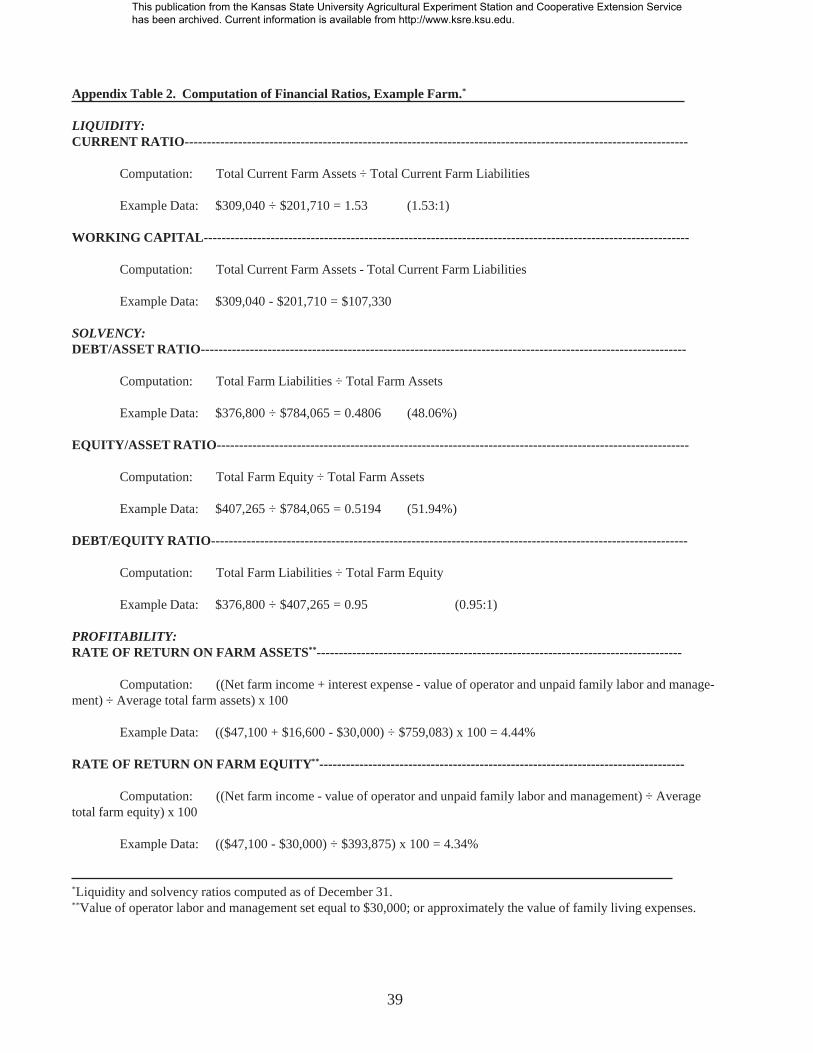
Appendix Table 2. Computation of Financial Ratios, Example Farm.*
LIQUIDITY:CURRENT RATIO-----------------------------------------------------------------------------------------------------------------
Computation: Total Current Farm Assets ÷ Total Current Farm Liabilities
Example Data: $309,040 ÷ $201,710 = 1.53 (1.53:1)
WORKING CAPITAL-------------------------------------------------------------------------------------------------------------
Computation: Total Current Farm Assets - Total Current Farm Liabilities
Example Data: $309,040 - $201,710 = $107,330
SOLVENCY:DEBT/ASSET RATIO-------------------------------------------------------------------------------------------------------------
Computation: Total Farm Liabilities ÷ Total Farm Assets
Example Data: $376,800 ÷ $784,065 = 0.4806 (48.06%)
EQUITY/ASSET RATIO----------------------------------------------------------------------------------------------------------
Computation: Total Farm Equity ÷ Total Farm Assets
Example Data: $407,265 ÷ $784,065 = 0.5194 (51.94%)
DEBT/EQUITY RATIO-----------------------------------------------------------------------------------------------------------
Computation: Total Farm Liabilities ÷ Total Farm Equity
Example Data: $376,800 ÷ $407,265 = 0.95 (0.95:1)
PROFITABILITY:RATE OF RETURN ON FARM ASSETS** ----------------------------------------------------------------------------------
Computation: ((Net farm income + interest expense - value of operator and unpaid family labor and manage-ment) ÷ Average total farm assets) x 100
Example Data: (($47,100 + $16,600 - $30,000) ÷ $759,083) x 100 = 4.44%
RATE OF RETURN ON FARM EQUITY ** ----------------------------------------------------------------------------------
Computation: ((Net farm income - value of operator and unpaid family labor and management) ÷ Averagetotal farm equity) x 100
Example Data: (($47,100 - $30,000) ÷ $393,875) x 100 = 4.34%
*Liquidity and solvency ratios computed as of December 31.** Value of operator labor and management set equal to $30,000; or approximately the value of family living expenses.
This publication from the Kansas State University Agricultural Experiment Station and Cooperative Extension Service has been archived. Current information is available from http://www.ksre.ksu.edu.
40
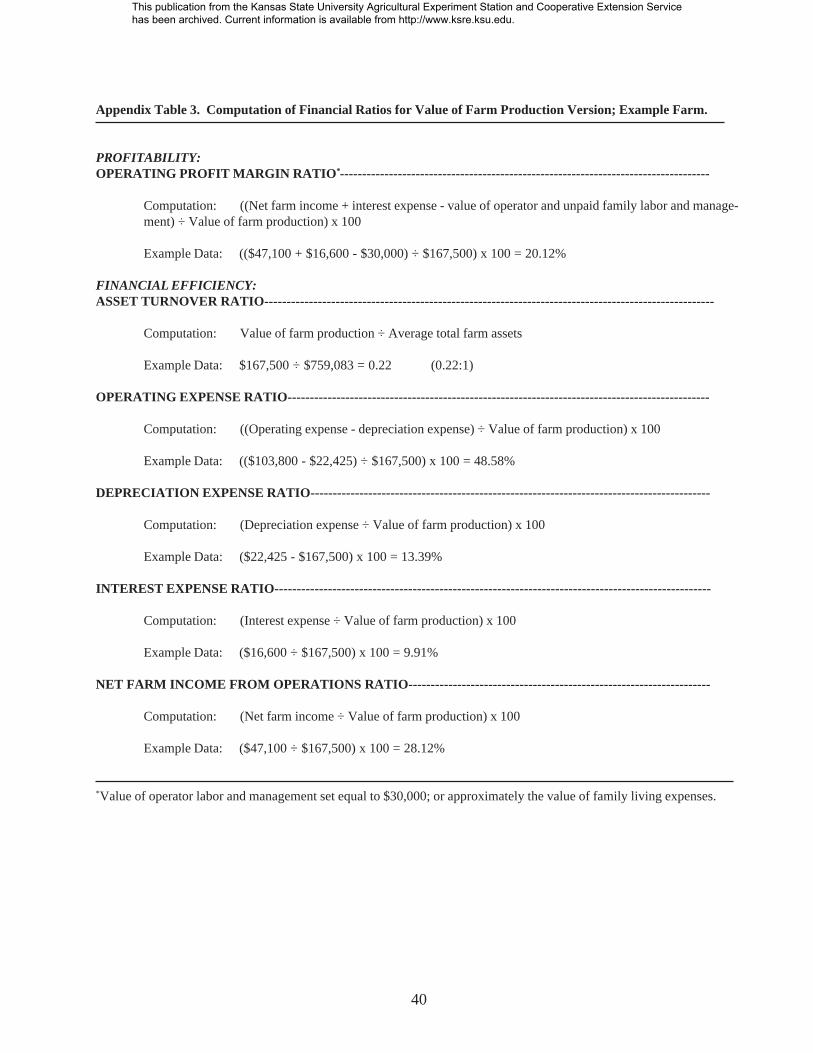
Appendix Table 3. Computation of Financial Ratios for Value of Farm Production Version; Example Farm.
PROFITABILITY:OPERATING PROFIT MARGIN RATIO *-----------------------------------------------------------------------------------
Computation: ((Net farm income + interest expense - value of operator and unpaid family labor and manage-ment) ÷ Value of farm production) x 100
Example Data: (($47,100 + $16,600 - $30,000) ÷ $167,500) x 100 = 20.12%
FINANCIAL EFFICIENCY:ASSET TURNOVER RATIO-----------------------------------------------------------------------------------------------------
Computation: Value of farm production ÷ Average total farm assets
Example Data: $167,500 ÷ $759,083 = 0.22 (0.22:1)
OPERATING EXPENSE RATIO-----------------------------------------------------------------------------------------------
Computation: ((Operating expense - depreciation expense) ÷ Value of farm production) x 100
Example Data: (($103,800 - $22,425) ÷ $167,500) x 100 = 48.58%
DEPRECIATION EXPENSE RATIO------------------------------------------------------------------------------------------
Computation: (Depreciation expense ÷ Value of farm production) x 100
Example Data: ($22,425 - $167,500) x 100 = 13.39%
INTEREST EXPENSE RATIO--------------------------------------------------------------------------------------------------
Computation: (Interest expense ÷ Value of farm production) x 100
Example Data: ($16,600 ÷ $167,500) x 100 = 9.91%
NET FARM INCOME FROM OPERATIONS RATIO--------------------------------------------------------------------
Computation: (Net farm income ÷ Value of farm production) x 100
Example Data: ($47,100 ÷ $167,500) x 100 = 28.12%
*Value of operator labor and management set equal to $30,000; or approximately the value of family living expenses.
This publication from the Kansas State University Agricultural Experiment Station and Cooperative Extension Service has been archived. Current information is available from http://www.ksre.ksu.edu.
41
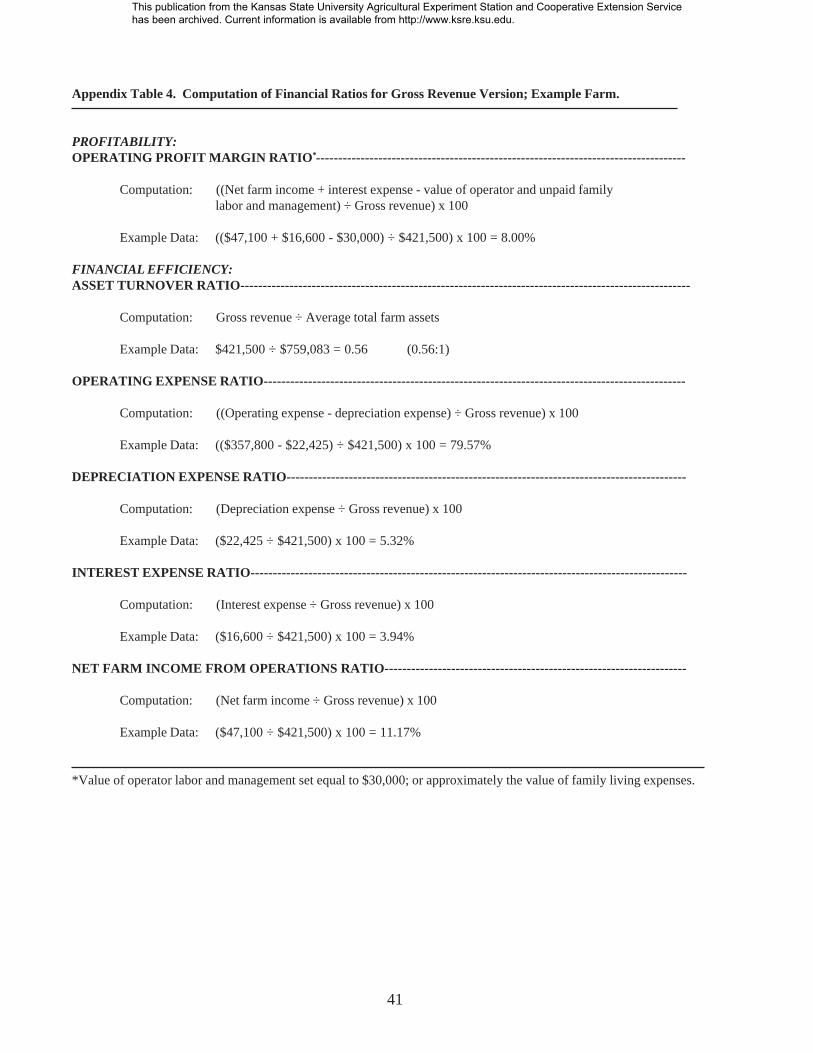
Appendix Table 4. Computation of Financial Ratios for Gross Revenue Version; Example Farm.
PROFITABILITY:OPERATING PROFIT MARGIN RATIO *-----------------------------------------------------------------------------------
Computation: ((Net farm income + interest expense - value of operator and unpaid familylabor and management) ÷ Gross revenue) x 100
Example Data: (($47,100 + $16,600 - $30,000) ÷ $421,500) x 100 = 8.00%
FINANCIAL EFFICIENCY:ASSET TURNOVER RATIO-----------------------------------------------------------------------------------------------------
Computation: Gross revenue ÷ Average total farm assets
Example Data: $421,500 ÷ $759,083 = 0.56 (0.56:1)
OPERATING EXPENSE RATIO-----------------------------------------------------------------------------------------------
Computation: ((Operating expense - depreciation expense) ÷ Gross revenue) x 100
Example Data: (($357,800 - $22,425) ÷ $421,500) x 100 = 79.57%
DEPRECIATION EXPENSE RATIO------------------------------------------------------------------------------------------
Computation: (Depreciation expense ÷ Gross revenue) x 100
Example Data: ($22,425 ÷ $421,500) x 100 = 5.32%
INTEREST EXPENSE RATIO--------------------------------------------------------------------------------------------------
Computation: (Interest expense ÷ Gross revenue) x 100
Example Data: ($16,600 ÷ $421,500) x 100 = 3.94%
NET FARM INCOME FROM OPERATIONS RATIO--------------------------------------------------------------------
Computation: (Net farm income ÷ Gross revenue) x 100
Example Data: ($47,100 ÷ $421,500) x 100 = 11.17%
*Value of operator labor and management set equal to $30,000; or approximately the value of family living expenses.
This publication from the Kansas State University Agricultural Experiment Station and Cooperative Extension Service has been archived. Current information is available from http://www.ksre.ksu.edu.
42
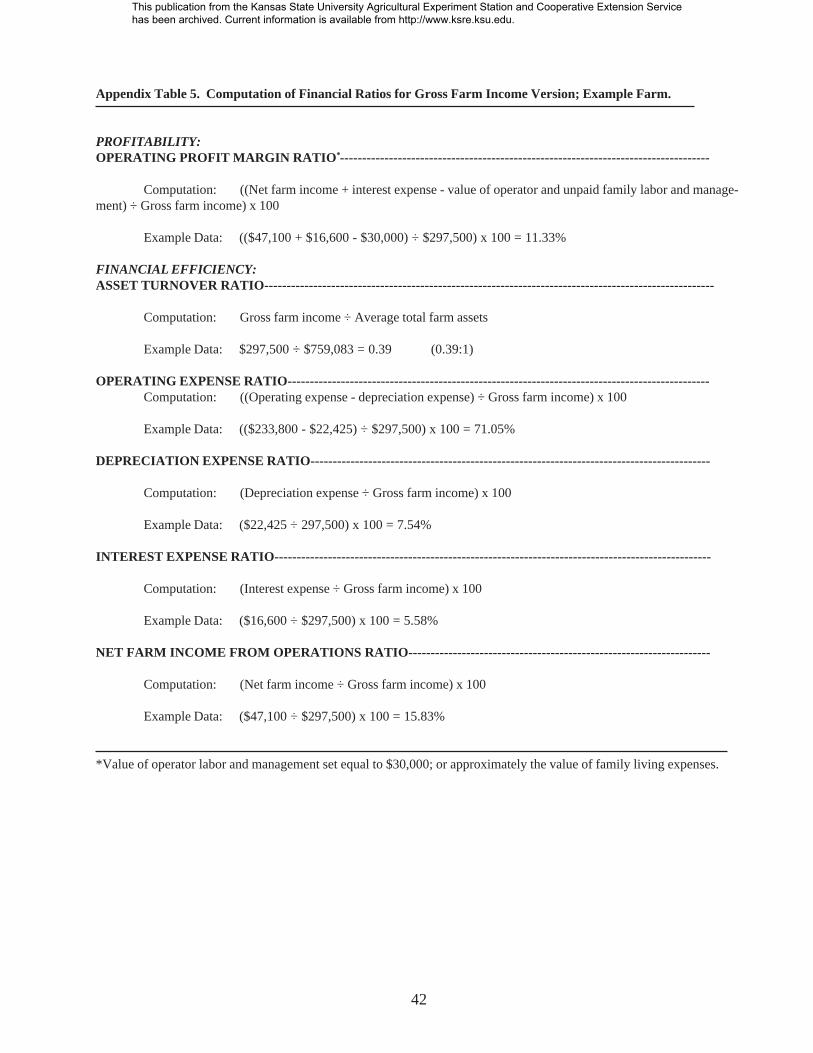
Appendix Table 5. Computation of Financial Ratios for Gross Farm Income Version; Example Farm.
PROFITABILITY:OPERATING PROFIT MARGIN RATIO *-----------------------------------------------------------------------------------
Computation: ((Net farm income + interest expense - value of operator and unpaid family labor and manage-ment) ÷ Gross farm income) x 100
Example Data: (($47,100 + $16,600 - $30,000) ÷ $297,500) x 100 = 11.33%
FINANCIAL EFFICIENCY:ASSET TURNOVER RATIO-----------------------------------------------------------------------------------------------------
Computation: Gross farm income ÷ Average total farm assets
Example Data: $297,500 ÷ $759,083 = 0.39 (0.39:1)
OPERATING EXPENSE RATIO-----------------------------------------------------------------------------------------------Computation: ((Operating expense - depreciation expense) ÷ Gross farm income) x 100
Example Data: (($233,800 - $22,425) ÷ $297,500) x 100 = 71.05%
DEPRECIATION EXPENSE RATIO------------------------------------------------------------------------------------------
Computation: (Depreciation expense ÷ Gross farm income) x 100
Example Data: ($22,425 ÷ 297,500) x 100 = 7.54%
INTEREST EXPENSE RATIO--------------------------------------------------------------------------------------------------
Computation: (Interest expense ÷ Gross farm income) x 100
Example Data: ($16,600 ÷ $297,500) x 100 = 5.58%
NET FARM INCOME FROM OPERATIONS RATIO--------------------------------------------------------------------
Computation: (Net farm income ÷ Gross farm income) x 100
Example Data: ($47,100 ÷ $297,500) x 100 = 15.83%
*Value of operator labor and management set equal to $30,000; or approximately the value of family living expenses.
This publication from the Kansas State University Agricultural Experiment Station and Cooperative Extension Service has been archived. Current information is available from http://www.ksre.ksu.edu.
Kansas State University Agricultural Experiment Station and Cooperative Extension Service, Manhattan 66506SRP 817 October 1998It is the policy of Kansas State University Agricultural Experiment Station and Cooperative Extension Service that all persons shall have equal opportunity andaccess to its educational programs, services, activities, and materials without regard to race, color, religion, national origin, sex, age, or disability. Kansas StateUniversity is an equal opportunity organization. These materials may be available in alternative formats. 601)
This publication from the Kansas State University Agricultural Experiment Station and Cooperative Extension Service has been archived. Current information is available from http://www.ksre.ksu.edu.