Embed Size (px)
Citation preview
MATH GRAPH ASSIGNMENTAditya, Juhee
8

Introduction
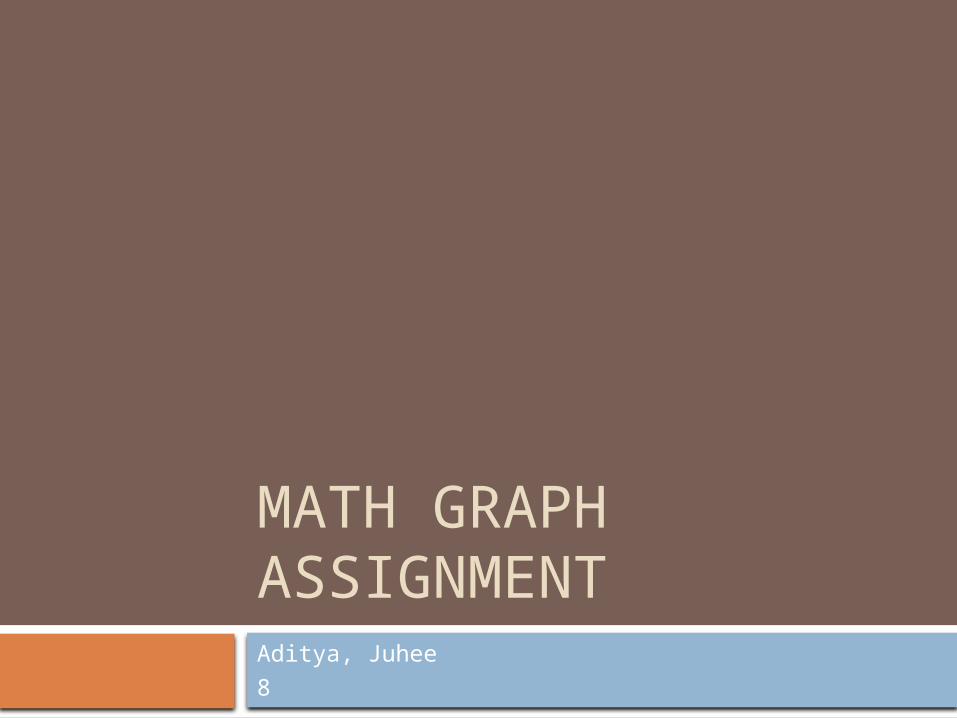
Sport: What sport do you think is best to be played?
Hobbies: What activity would you prefer to do on a daily basis?
Movie Theme: From the countless movie theme categories, which have you always liked to watch?
Book Theme: What book genre do you think is most enjoyable based on the books you read?
Food: Which country produces the most delicious food?
Sports
Bask
etba
ll
Tenn
is
Swim
min
g
Softb
all
Socc
er
Badm
into
n
Ping
-Pon
g0
5
10
15
20
25
Sports Best To Be Played
Votes
=20 =6 =2 =2 =9 =7 =5

0
100
200
300
400
500
600
700 Kids favorite sports in USA
Number of v...

Conclusion
Based On Survey Basketball is the sport most played. Swimming and softball is the sport played
the least. USA graph
Basketball is the sport most played Hockey is the sport played the least

Hobbies
Gamin
g
Social
ize
Slee
ping
Mov
ies
Horse
-Bac
k Rid
ing
Spor
tsAr
ts
Mus
ic0
4
8
12
Preferred Hobbies
Votes
=13=5
=6
=5=12
=1
=5=3

0
5
10
15
20
25
30Enjoyable Hobbies In Australia
Percen...
Conclusion
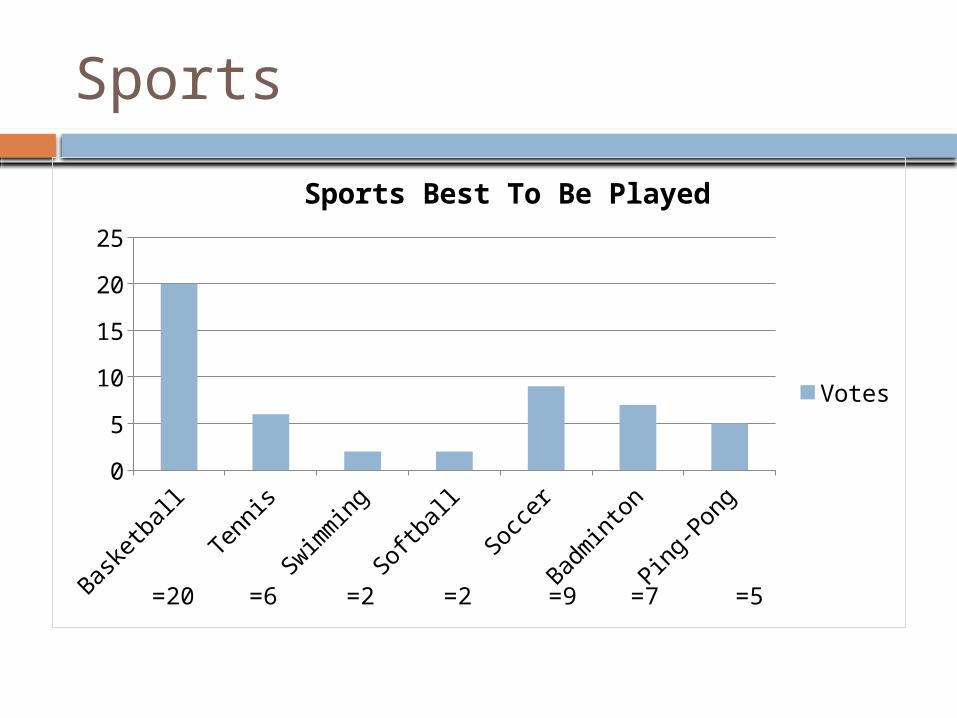
Based On Survey Gaming is the hobby done by most people. Horse back riding is the least appealing
hobby. Australia
Physical activities is the hobby done by most people.
Public speaking is the least appealing hobby

Movie Themes
Most Movie Themes Watched
ComedyHorrorComedy-ActionRomanceAction
34%
19%17%
13%
17%
Movies Themes - Global
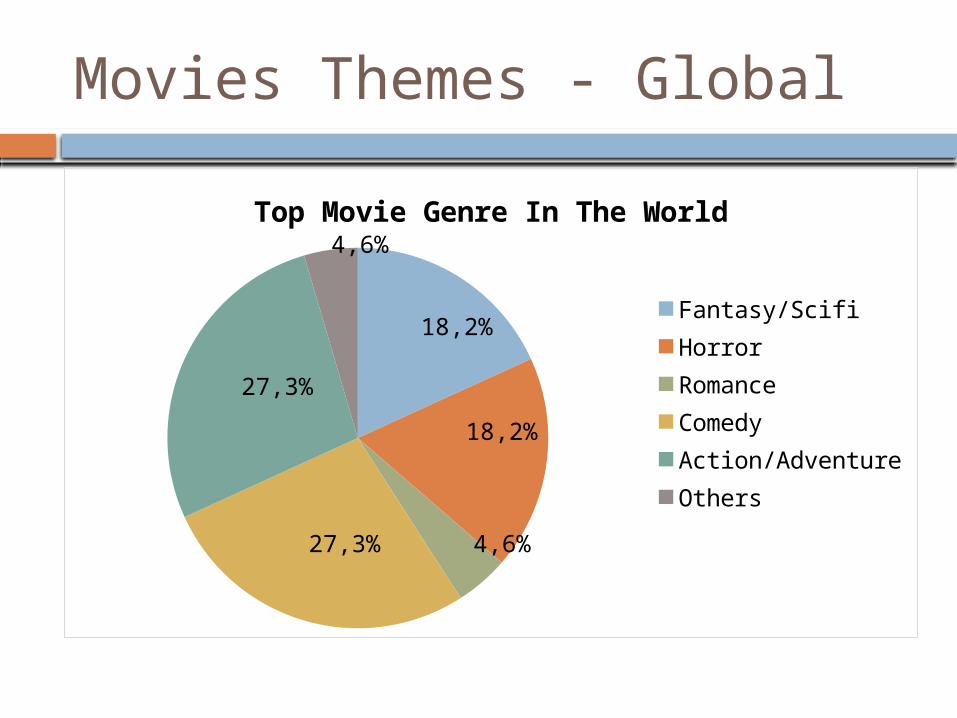
Top Movie Genre In The World
Fantasy/ScifiHorrorRomanceComedyAction/AdventureOthers
18,2%
18,2%
27,3%
27,3%
4,6%
4,6%
Conclusion
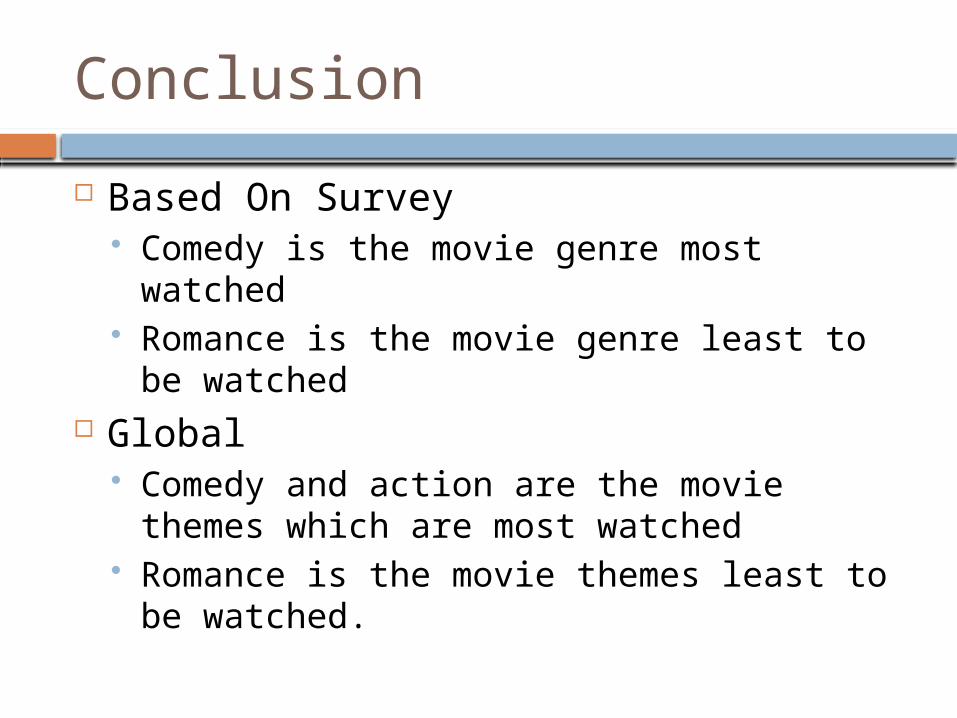
Based On Survey Comedy is the movie genre most watched Romance is the movie genre least to be
watched Global
Comedy and action are the movie themes which are most watched
Romance is the movie themes least to be watched.

Book Theme
Most Book Genre Read
AdventureSci-FiMysteryFantasyRomanceTrue Story
20%
40%
10%
10%
6%
16%

Top Genres In The World
Mystery/ Thriller/ CrimeScience fictionLiteratureRomance novelsGraphic novelsChiefly derogatory
15,2 %
7,8 %
34,8 %
18,8 %
17,4 %
5,8 %
Conclusion
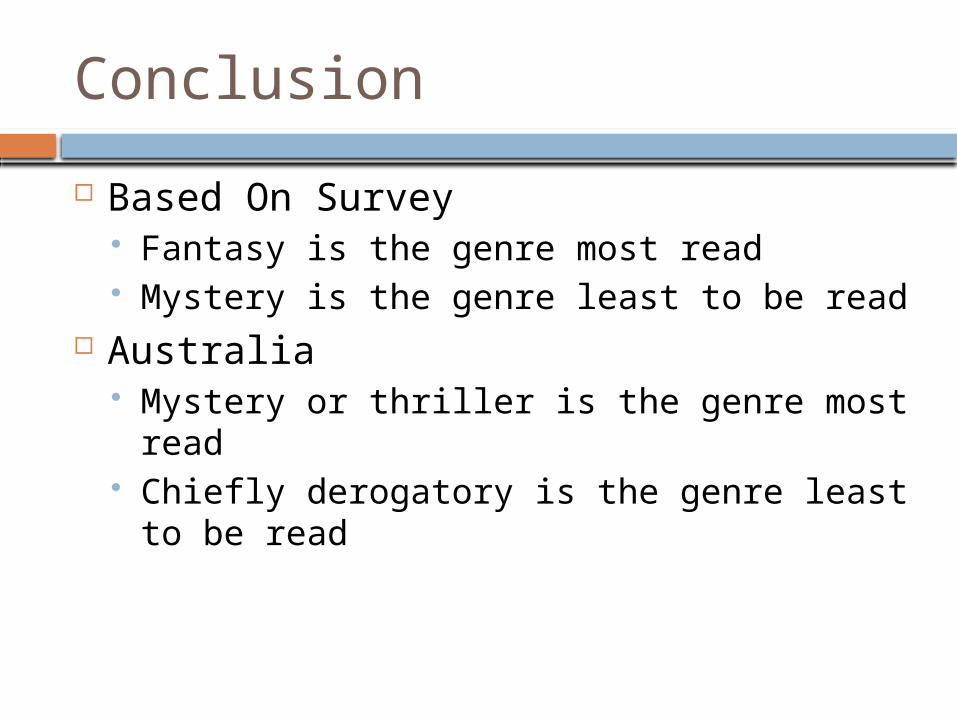
Based On Survey Fantasy is the genre most read Mystery is the genre least to be read
Australia Mystery or thriller is the genre most read Chiefly derogatory is the genre least to be
read

Food
Mexican
Korean
Italian
Japanese
Indonesian
Chinese
0 2 4 6 8 10 12 14
Most Delicious Food
Vote
7=
13=
13=
8=
5=
5=
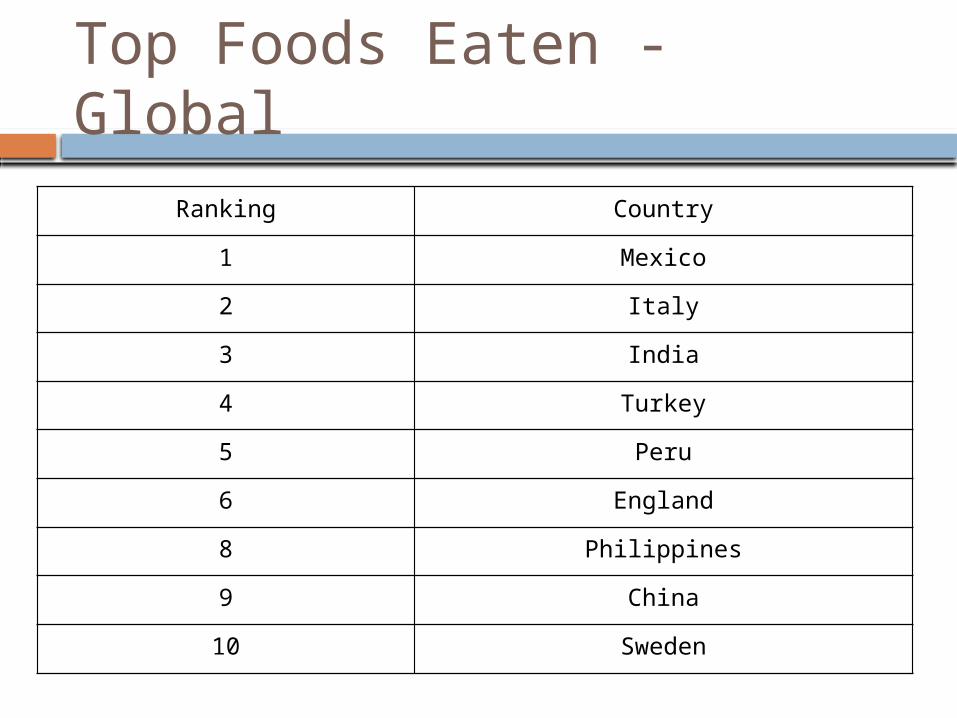
Top Foods Eaten - Global
Ranking Country
1 Mexico
2 Italy
3 India
4 Turkey
5 Peru
6 England
8 Philippines
9 China
10 Sweden
Conclusion
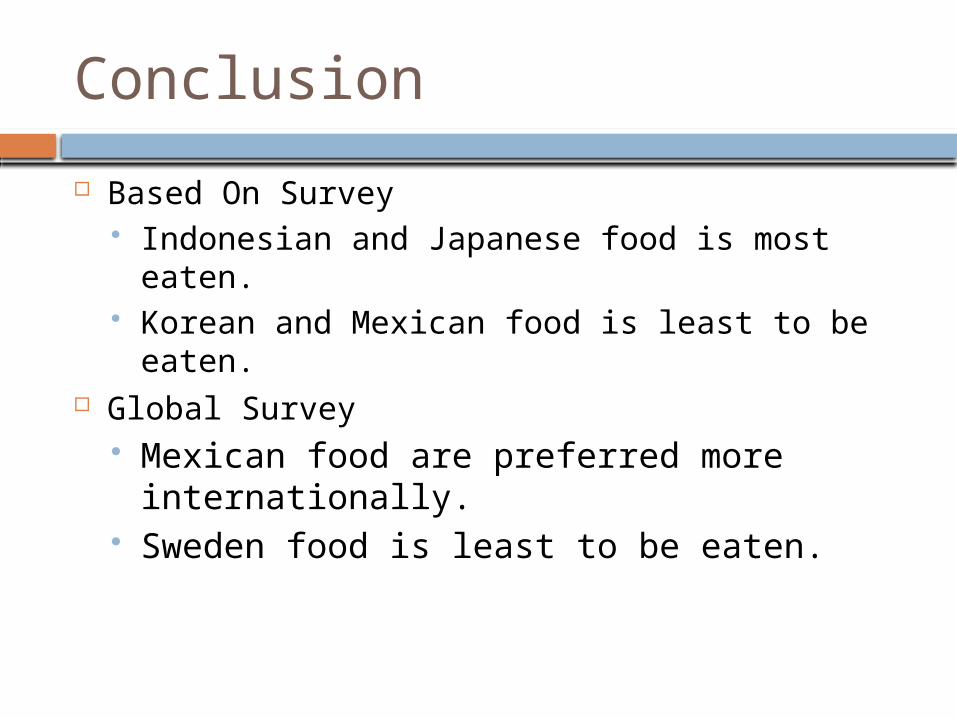
Based On Survey Indonesian and Japanese food is most eaten. Korean and Mexican food is least to be eaten.
Global Survey Mexican food are preferred more
internationally. Sweden food is least to be eaten.

Reflections - Aditya
The first thing to improve would be the method in doing the survey. Our method to find the data was quite simple, first we surveyed everyone in the eight grade except for us of course. We had more or less around 25 people after we surveyed the entire eight grade. The next step was definitely to survey the tenth grade. Everything was recorded in paper, we didn’t use email because some students will not answer our emails. But it turns out our method took too long, ot took around two days until we got all fifty people. If we could have done the survey faster, we would have gotten more time with the validation and the graphs.
Once we organized our data, we turned it into a graph. In total we had five graphs. We tried to make a different graph to give more variety, however we couldn’t use graphs like stem and leaf or box and whiskers. So we used another bar graph for the fifth topic. Before we could conclude each topic, we had to validate our results. The way we did it was to find a survey result about sports, hobbies, movie themes, book themes and food based on global votes. An error we had was that for one of the validation, we were forced to make a table rather then a graph because we coudln’t find the data on the internet. It would have been better if we found all graphs for each validation.
In the future, if there is a assignment similar to this, deciding the right question in the begining would be important because the validation is most difficult. For example if I have changed my question about food into “What food do you consume most everyday?” I would have gotten a graph from the internet. However my question was different then that, it was “Which country produces the most delicious food?” which meant that I couldn’t use the graph from the internet.
Reflection - Juhee
For our group, we could have improve our methods so that it would be faster and our group will have more time making the graphs and doing the validations. We could have done questionnaires so that it wouldn’t waste time and it would be faster. Also we could have made the method better and reliable by making the people that we interview have the same age, culture and interviewing the amount of people divisible by one hundred. To improve the methods, we could have used more of lunch periods and splitting jobs.
Our group used 3 kinds of graphs which are line, bar and pie. I think that we could have a better presentation of data by looking at advantages and disadvantages of each graph and use them according to the survey that is appropriate. Since we have to use at least more than two graphs, we could have seen the disadvantages and advantages and used them to make our graph more precise and according to the data. Such as bar graph has an advantage of showing the data category in a frequency distribution but the disadvantage is that it fails to show patterns. Also another idea is to use
For the validation of the data, we could have been better by using graphs to express our validation. Also I think that we could have used more reliable sources than the ones we have used. Reliable sources from my opinion are ones that are up-to-date so that they won’t be old. Also I believe that reliable sources are not from Wikipedia because people can write whatever they want on that website.
Reference
"Sports in Australia." Portal Oceania. Web. 17 Mar. 2012. <http://portaloceania.com/au-life-sports-ing.htm>.
“Hobbies of the Australians.” Portal Oceania. Web. 18 March. 2012. <http://portaloceania.com/au-life-hobbies-ing.htm>.
"Countries with the Best Food." - Top Ten List. Web. 15 Mar. 2012. <http://www.the-top-tens.com/lists/countries-with-the-best-food.asp>.
"ILounge." Help! Survey for Best Movie Genre Australia. Web. 15 Mar. 2012. <http://forums.ilounge.com/ipod-polls/120785-help-survey-best-movie-genre.html>.
"JOAN REEVES Aka SlingWords: Latest Stats on Genre Books." JOAN REEVES Aka SlingWords. Joan Reeves. Web. 15 Mar. 2012. <http://slingwords.blogspot.com/2010/11/latest-stats-on-genre-books.html>.

Thank You