Embed Size (px)
Citation preview

Mathematical Modeling of Spray Impingement and FilmFormation on Pharmaceutical Tablets during Coating
Charalampos Christodouloua, Eva Sorensena, Salvador Garcıa-Munozb, Luca Mazzeia†
aDepartment of Chemical Engineering, University College London, Torrington Place, London WC1E 7JE, UKbEli Lilly and Company, Lilly Research Laboratories, Indianapolis, IN 46285, USA
Abstract
The application of coating films is an important step in the manufacture of pharmaceutical tablets.Understanding the phenomena taking place during coating spray application provides importantinformation that can be used to reduce the number of defective tablets and select the optimal conditionsfor the coating process. In this work, we investigate spray impact and film spreading on a tablet whilethis passes through the spray-zone in a rotating coating drum. To simulate spray impingement, wedeveloped an one-dimensional (1D) spreading model that is based on the mechanical energy equation.We assumed the spray to be uniform and we divided it into arrays of droplets that impinge successivelyon the substrate orthogonally to its surface. In the mechanical energy equation that describes thecoating spreading, we accounted for the rate of work done on the surface of the liquid coating filmby the impinging droplets that leads to volume change (film spreading and thickness increase). Thenovel model we propose in this work can calculate the coating spreading rate and thickness. Weimplemented the mathematical model employing the gPROMS Modelbuilder platform. To study theeffect of coating properties and process parameters on the film spreading rate and on the final liquidfilm thickness, we performed variance-based sensitivity analysis. The model predictions are in goodagreement with experimental data found in the literature.
1. Introduction
Coating of tablet cores is one of the oldest manufacturing processes utilized by the pharmaceutical
industry [1, 2]. Tablets are coated for several reasons, including enhancement of appearance, taste
masking, protection of sensitive ingredients and control of the Active Pharmaceutical Ingredient (API)
release [3]. Due to the complexity of the spray coating process, problems are often encountered with the
final product [4, 5]. Some of the most common tablet defects are bridging, cracking, colour variations,
roughness/orange-peel roughness, picking and sticking [3]. One main cause of such defects is failing
to adopt the right values for the process parameters in the coating drum, such as spray mass flow rate
or coater temperature and rotational speed [5].
To address the above issues, researchers have investigated the coating spray atomization process [6],
as well as the deceleration and the evaporation of the generated droplets during their flight from the
nozzle to the tablet bed [3, 7]. By combining these spray models with a thermodynamic model that
calculates air temperature and humidity inside the coating drum [8], one can estimate the droplet size
and velocity before impact [9]. Recent work on coating behavior after impact on a tablet core has
been mainly focused on single droplet cases [9, 10], and therefore the information concerning spray
impact and film formation under coating process conditions is limited [2]. Moreover, general spray
impingement models found in the literature are either empirical or based on computationally expensive
Computation Fluid Dynamics (CFD) simulations.
Previous work aiming to numerically simulate spray impingement on impermeable solid substrates
mainly relied on models derived from single droplet impact studies [11]. Models following this approach
describe the spray impingement as a superposition of single droplet impacts. Roisman et al. [12]
questioned this modeling strategy, because it neglects interactions between neighbouring spreading
droplets, a limitation that makes these models insensitive to spray density. Nevertheless, information
about single droplet impacts offers useful insight into the complex spray impingement process [13].
Additionally, using Volume-Of-Fluid (VOF) CFD simulations, in the appendix of this article we show
that in the conditions investigated in this work droplet-droplet interactions on the tablet are negligible.
†Corresponding author. Tel. +44(0)20 7679 4328; Email: [email protected]

Christodoulou et al., 2019 2
The models for single droplet impingement fall into two categories: those considering impact on
dry substrates and those considering impact on wetted surfaces or liquid films. The impingement
of a single droplet on a dry substrate can have several outcomes: the droplet may deposit into a
cylindrical or spherical-cap film, disintegrate (splash) into secondary droplets, or recede and potentially
rebound [12, 13]. In the literature, one can find a few predictive theoretical models that simulate the
spreading, receding, splashing and rebounding after droplet impingement on dry walls [14–17]. For
pharmaceutical coating, Shaari [18] and Bolleddula et al. [10] experimentally investigated single
droplet spreading on tablets, while we developed a model predicting the behavior of Opadry coating
droplets after impact on dry porous substrates [19].
As mentioned, in the literature there are also a few models describing the impingement of a single
droplet on a wetted surface. Roisman et al. [12] and Yarin et al. [20] experimentally and theoretically
investigated droplet impingement on liquid films covering rigid substrates. They found that droplets
with low impact velocity and small size can deposit on the film surface or coalesce, whereas droplets
with moderate and high impact velocities tend to form a crater at the impingement region that leads
to splashing and even to film disintegration. Few researchers have proposed empirical splashing and
disintegration criteria or developed models for predicting the outcome of droplet impact on liquid films
of different thickness [21].
About spray impingement, obtaining accurate and detailed information through experiments or
mathematical modeling is challenging [11]. In the literature, one can find experimental work concerning
the interaction of spray droplets impinging on a wall, and about splashing and breakup [20, 22].
Moreira et al. [13] reviewed the aforementioned studies that were mainly focused on simultaneous and
subsequent impacts of two droplets. Mundo et al. [23] modeled spray impingement as a superposition
of single droplet collisions without considering liquid film formation and the film-droplet interactions.
Roisman et al. [16] developed a model to estimate the velocity and shape of the uprising liquid
film, accounting for droplet collisions on the substrate and the influence of droplet spacing, but not
including predictions for possible break-up of the uprising film. One drawback of these models is that
they do not calculate the final film thickness after spray impingement.
Concerning the prediction of film thickness after spray impact, Lee and Ryou [24] developed an
empirical model aiming to predict the outcome of diesel spray impingement on a rigid wall. Recently,
Kalantari and Tropea [21] conducted experiments and derived a semi-empirical relation for the film
thickness. We used their detailed experimental data and semi-empirical relation to validate the model
developed in this work. In general, research for pharmaceutical sprays is focused on droplet atomization
and evaporation [5], and therefore we were unable to find previous work that deals in detail with coating
spray impact on tablets. To conclude, spray impact models available in the literature are either based
on empirical equations or on computationally expensive CFD simulations [13].
In this paper, we present a novel model (Section 2) that describes spray impact on tablets during
film-coating, without requiring prior knowledge of the process via empirical relations. The model
predicts the time required for the wetting of the entire tablet surface facing the spray, as well as the
liquid film thickness, while taking into account coating (viscosity, density, surface tension) and spray
(droplet size, velocity, mass flow rate) properties.
Compared with CFD simulations – which take hours or days to output results – our model yields
solutions considerably faster (simulation time < 5s) without sacrificing accuracy significantly. This
allowed us to perform variance-based sensitivity analysis to study the influence of process parameters
on the coating spreading behavior. We validated the numerical results with experimental data from
the literature (Section 3). With this work, we aim to provide insight into the process of coating
application on pharmaceutical tablets and to assist in the selection of the appropriate values for the
process parameters required to minimize the number of defective tablets.

Christodoulou et al., 2019 3
2. Mathematical model
Film coatings are generally applied on tablets by spraying a polymer solution or dispersion on their
surface [2]. After impingement onto the tablet, the droplets spread on its dry surface. Based on the
experimental work of Bolleddula et al. [10] for pharmaceutical coating droplets, we assumed that the
droplets spread without disintegrating or rebounding after impact. The spreading of a droplet that
impacts on a dry rigid substrate can be divided into two consecutive regimes [10]: during the first the
spreading is inertia driven, while during the second the droplet continues to spread by capillarity.
Continuous droplet impingement leads to the expansion of the wetted area and the formation of a liquid
film that eventually covers the entire surface of the tablet. Following the liquid film formation, the
solvent (normally water) both evaporates and concurrently absorbs into the porous core of the tablet
leaving behind a dry polymeric film on the tablet surface (Fig. 1). In this work, we investigate multiple
droplet impingement and spreading on a pharmaceutical tablet while the tablet passes through the
spray-zone of a rotating coating drum.
To model spray impingement, we assumed that the spray is uniform and we divided it into arrays
of droplets that impinge successively on the substrate orthogonally to its surface (Fig. 2a). To
simplify the problem, we assumed that over a time interval of magnitude ti = D0/U0, where D0
and U0 represent the average diameter and velocity of the droplets before impact, respectively, the
droplets in the first array impinge and spread without being affected by the subsequent droplets. The
value of ti has the same order of magnitude as the time scale of the inertia-driven spreading regime
reported in the literature [10]. Since the capillarity spreading is much slower, becoming significant
only after several seconds, it can be neglected. At any given time t < ti, we estimated the wetted
area by calculating the spreading of a single droplet of initial diameter D0 and impact velocity U0
(Fig. 2b) and by assuming that all the droplets of the first array behave independently and identically
as they impact on the dry tablet surface.
After the impact of the first array (initial tablet wetting), we assumed that the wetted area is made
up of disconnected films, one associated with each droplet. The impingement of subsequent droplets
on the surface of these films increases their volume, making them spread further and raising their
thickness. We considered the spreading to be completed when the wetted area becomes equal to
the area of the tablet surface that is facing the spray. We assumed that solvent evaporation and
absorption into the tablet core become significant after the tablet is no longer under the spray, and
therefore we neglected drying and absorption phenomena in the current model. This assumption is
based on experimental observations which show that absorption and film drying are significantly slower
than coating spreading after spray impingement [9, 18].
In this section we describe our mathematical model; this is presented in two subsections: Section 2.1
concerns the impact of the first array of droplets on the dry tablet core surface (initial wetting stage)
and Section 2.2 deals with subsequent droplet impingement and spreading (impingement on wetted
surface stage).
TabletTime
Droplets impact Film formation Solvent evaporation and absorption
Figure 1: Outline of the coating application process during pharmaceutical coating.

Christodoulou et al., 2019 4
z
Dry substrate
Before impact After impact
U0hm
r
Rd
(a) (b)
D0
Dry substrate
Figure 2: a) Droplet array and b) single droplet impact on a dry tablet.
2.1 Initial wetting
Here we present the part of the model that simulates multiple droplet impingement on dry surfaces of
tablets entering the spray-zone. We assumed that all the droplets of the first array behave identically
after impact since they are similarly sized and have similar impact velocities. This reasonable
assumption allows us to simulate the spreading of a single droplet impacting the tablet with the
average velocity and diameter of the spray droplets and then calculate, at any time t < ti, the total
wetted area on the tablet surface by multiplying the wetted area of a single droplet by the number of
droplets in the horizontal array (Nd).
To rigorously determine the motion of the droplet as it impinges on the dry tablet surface one would
have to solve the mass and linear momentum balance equations, which is computationally demanding.
In our work, we adopted a simplified approach based on the mechanical energy balance equation
to develop a model that can quickly and accurately estimate the droplet spreading. The integral
mechanical energy balance equation, which is derived from the generalized transport theorem (see
Appendix), reads:
d
dt
[ ∫R1
(1
2ρ1 u1 · u1 + φ1
)dx +
∫S12
(1
2ρ12 u12 · u12 + φ12
)ds +
∫S13
(1
2ρ13 u13 · u13 + φ13
)ds
+ γ12 (A12 – A13 cosθ)
]=
∫S12
n21 · σ2 · u12 ds +
∫S13
n31 · σ3 · u13 ds +
∫R1
τ1 : ∂xu1 dx (1)
where S12 is the interface between the liquid coating (phase 1) and the gas (phase 2) and S13 is the
interface between the liquid and the solid (tablet surface; phase 3). The interfaces are shown in Figure
3. The three-dimensional spatial region bounded by the dividing surfaces S12 and S13 is denoted by
R1. Moreover, nrs denotes the unit vector normal to Srs pointing from phase r into phase s and Ars
denotes the area of Srs. Here, ρr, φr and ur are the fluid density, the gravitational potential energy
(per unit volume) and the fluid velocity for phase r, respectively, whereas ρrs, φrs and urs are the fluid
density, the gravitational potential energy (per unit surface) and the fluid velocity over the dividing
surface Srs, respectively. The stress tensor of phase r is denoted by σr and its deviatoric part by τr,
whereas γ12 is the surface tension on the surface S12 and θ is the dynamic contact angle of the three
phases.
The left-hand side of Equation (1) features the rate of change of the total energy of the droplet,
which comprises kinetic energy, potential energy of the gravitational field and surface energy, while
the right-hand side features the rate of work performed by phases 2 and 3 (surrounding gas and solid
tablet in our case) on the coating and the rate of conversion of mechanical energy into internal energy
due to the action of the viscous stress within the liquid. We can write Equation (1) more concisely
as:dEK
dt+
dEG
dt+
dES
dt= WS – Φ (2)
where EK, EG and ES are the kinetic, gravitational and surface energies of the droplet, respectively;
Φ (which is positive) is the rate of viscous dissipation of the droplet kinetic energy and WS denotes
the rate of work done by the droplet surroundings.

Christodoulou et al., 2019 5
Figure 3: Spherical cap droplet on a tablet surface. θ is the dynamic contact angle and Srs and γrsare the interface and the interfacial tension between phase r and s, respectively.
In the case of a single droplet impingement on a rigid substrate, the rate of work done by the
surroundings can be neglected. Indeed, Equation (2) - without the term WS - has been repeatedly
reported in the literature [17, 10]. However, to the best of our knowledge no rigorous derivation
has been offered. We present our derivation of the mechanical energy balance equation for a droplet
impinging on a solid substrate in the Appendix of this article.
To estimate the rate of change of the droplet gravitational potential energy (dEG/dt) one can neglect
the gravitational potential energy per unit surface (φrs) over the liquid-air (S12) and liquid-tablet (S13)
dividing surfaces. Thus, considering significant only the gravitational potential energy of the coating
droplet per unit volume, φ1, we write:
dEG
dt≈ d
dt
∫R1
φ1 dx =d
dt
(π
6D3
0 ρ1 g hm
)(3)
where g is the gravitational field, D0 is the droplet diameter before impact and hm is the distance from
the tablet surface to the droplet center of mass. The gravitational potential energy of an impinging
droplet is usually neglected [10] if the droplet Bond number is small (Bo≡ρ1g D0/γ12 << 1).
The rate of change of the droplet surface energy appears on the left-hand side of Equation (1):
dES
dt=
d
dt
[γ12 (A12 – A13 cosθ)
](4)
where A12 and A13 are the areas of the liquid-gas and liquid-solid interfaces, respectively. In this work,
we assumed that the surface tension (γ12) is constant and uniform (that is, independent of position).
In Equations (1) and (4), θ is the dynamic contact angle which we assumed to be approximately equal
to the equilibrium contact angle (Fig. 3).
To calculate the kinetic energy of the droplet and the rate of viscous dissipation of kinetic energy, we
need to know the velocity field u1 inside the control volume (coating droplet of volume V). To obtain
this, we would have to solve the mass and linear momentum balance equations; we decided not to do
so, favoring a less computationally demanding modeling approach. The consequence of this choice is
that now to proceed we need to assume a functional form for the velocity field.
The form of the velocity field can vary considerably inside the droplet. For the impact conditions of
interest in our work, we can assume that the droplet presents two regions in which the velocity field
is substantially different; the first region spans almost the entire droplet and in it the flow can be
approximated as inviscid, while the second region is a boundary layer of thickness δ near the tablet
surface (S13) where viscous dissipation is significant.
Batchelor [25] estimated the boundary layer thickness for this flow, showing that:
δ
hm
∼(
μ1
ρ1Umhm
)1/2
∼(
μ1
ρ1U0D0
)1/2
∼ 1√Re
(5)
where Re ≡ ρ1 U0 D0/μ1 is the impact Reynolds number, Um is the velocity of the droplet center of
mass (dhm/dt) and μ1 is the liquid coating viscosity. In our coating droplet simulations, 150< Re <600
and so δ/hm∼0.01; the boundary layer is thus much thinner than the inviscid-flow bulk region.

Christodoulou et al., 2019 6
Based on the above, the velocity field in the inviscid-flow region of the droplet can be used to calculate
the total kinetic energy of the droplet, since the boundary layer, being thin, does not contribute
significantly to this quantity. In contrast, the velocity field in the boundary layer should be used to
calculate the rate of viscous dissipation of the droplet kinetic energy, since the contribution of the
inviscid-flow region to this quantity is negligible.
To calculate the kinetic energy, we assumed that the flow field in the bulk of the droplet is axisymmetric
near a stagnation point (O), which is located on the tablet surface where the droplet impinges
(Fig. 4). This type of flow is known as “stagnation point flow” [25]. The motion of the droplet is then
described in terms of a stream function ψ(r, z, t), where r and z are the radial and vertical cylindrical
coordinates, respectively. In particular, the radial (u1r) and vertical (u1z) velocity components are
given by:
u1r = – (1/r) ∂zψ ; u1z = (1/r) ∂rψ (6)
while the angular velocity component is zero. The stream function for irrotational flow near a
stagnation point is well documented in the literature and is given by ψ = (k/2)zr2, where k is a
constant [25]. Substituting this function in Equation (6) gives:
u1r = –1
2kr ; u1z = kz (7)
For an impinging droplet, the value of the parameter k can be calculated by considering the relations
(7) at the droplet center of mass:
u1r(0, hm, t) = 0 ; u1z(0, hm, t) =dhm
dt= khm ⇒ k =
Um
hm
(8)
Substituting k back into Equation (7) yields:
u1r = –1
2
r
hm
Um (9)
u1z =z
hm
Um (10)
The above equations satisfy the continuity equation for an incompressible fluid. Expressing the
kinetic energy (EK) of the droplet in terms of the velocity components for the “stagnation point
flow” (Equations 9,10) and neglecting the kinetic energy associated with the dividing surfaces S12 and
S13 yields:
EK ≈1
2ρ1
∫R1
u1 · u1 dx =1
2ρ1
∫R1
(u21r + u2
1z) dx ≈ 1
2ρ1
∫R1
[(–
1
2
r
hm
Um
)2
+
(z
hm
Um
)2 ]dx (11)
Here we integrated over the entire region R1 occupied by the impinging droplet instead of restricting
the integration to the inviscid-flow region. This does not affect the result significantly, since in our
simulations the boundary layer (where viscous dissipation is not negligible) is thin. To calculate the
integral above, we assumed that the droplet has a spherical cap shape (Fig. 2b), so that the following
geometrical relations hold [14]:
R2
d =D2
0
3
(D0
hmax
–h2
max
D2
0
); hm =
1
6
(2hmax +
h4
max
D3
0
)(12)
where Rd and hmax are the time-dependent droplet wetted area radius and maximum droplet height,
respectively. Integrating Equation (11) over the volume of a spherical cap described by Equation (12),
and taking the time derivative, yields:
dEK
dt=
d
dt
[ρ1 πU2
m
2h2
m
(R4
d hmax
16+
13R2
d h3
max
72+
h5
max
10
)](13)

Christodoulou et al., 2019 7
BOUNDARY LAYER δ
z
r
O
Figure 4: Axisymmetric stagnation point flow. The lines denote the flow streamlines.
Viscous dissipation during droplet impingement occurs in the boundary layer and the bulk of the
droplet. Since the boundary layer is thin, one can calculate the rate of viscous dissipation in the latter
region by integrating over R1 as follows:
Φb = –
∫R1
τ1 : ∂xu1 dx = 2μ1
∫R1
[(∂ru1r)
2+ (u1r/r)2 + (∂zu1z)
2+
1
2(∂zu1r + ∂ru1z)
2
]dx
= 3μ1
∫R1
(1
hm
Um
)2
dx =μ1πU2
m
2
hmax
h2
m
(3R2
d + h2
max
)(14)
In the boundary layer viscous dissipation is significant [15]. Since in this region we do not have a
functional form for the velocity field u1, we cannot solve the volume integral rigorously as we did in
Equations (11) and (14); however, we can estimate the value of the rate of viscous dissipation in the
boundary layer Φδ using scaling analysis. In the Appendix of this article, we show that the Φδ estimate
can be obtained as follows:
Φδ = –
∫Rδ
τ1 : ∂xu1 dx ∼ μ1δ2
∫Rδ
u21r dx ∼ μ1
δ
∫S13
u21r ds ∼ μ1
hm
(ρ1 Um hm
μ1
)1/2∫S13
(–
1
2
r
hm
Um
)2ds (15)
whereRδ is the boundary layer region and S13 is the droplet-tablet dividing surface that corresponds to
the wetted area. This expression estimates correctly the order of magnitude of Φδ; however, to obtain
a more accurate result, we introduced an empirical dissipation factor, denoted as Fd. Its derivation is
discussed later in this section. With the introduction of the dissipation factor, the expression yields:
Φδ ≈Fd μ1U2
m
4h3
m
(ρ1Umhm
μ1
)1/2∫ 2π
0
∫ Rd
0
r3drdφ =Fd μ1U2
mπR4
d
8h3
m
(ρ1Umhm
μ1
)1/2
(16)
Because the velocity field inside the bulk of the droplet is essentially inviscid, estimating the rate
of viscous dissipation only from Equation (14) would grossly underestimate the value of the viscous
dissipation rate. Indeed, since in our simulations we have hmax∼Rd, using scaling to compare Φb
and Φδ yields: Φb/Φδ ∼ δ/hm << 1. Thus, we considered Φ ≈ Φδ in the mechanical energy balance
Equation (2).
To solve the mechanical energy balance (Equation 2), we substituted the expressions for the
gravitational, surface and kinetic energies, as well as the rate of viscous dissipation given by Equations
(3), (4), (13) and (15), respectively.
Nevertheless, to render the equation solvable, an expression for the factor Fd is needed. Empirical
expressions for the dissipation factor have been derived by Bechtel et al. [14] and Kim and Chun
[15], who fitted their experimental data for water droplets impact to obtain Fd = 5.3 Oh–1/2 and
Fd =√πOh–1/2, respectively. Here Oh denotes the Ohnesorge number (Oh ≡ μ/
√ργD0).

Christodoulou et al., 2019 8
Being interested in pharmaceutical coatings, we fitted Fd to match the experimental data of Bolledulla
et al. [10] for the spreading of various coating droplets impinging on tablets with different Ohnesorge
(Oh) number values. We used gPROMS Modelbuilder [26] to estimate the values of Fd which can be
introduced in our model to approximate the wetted area radius after impact of several OpadryII White
coating droplets (with ranging solid concentrations) and a glycerol/water solution droplet. In all case
studies chosen for the fitting we have Re ∼ 100. By plotting the values of Fd against the corresponding
ones of the Ohnesorge number (Fig. 5) and by using a regression, we derived the expression:
Fd = 1.868 Oh–0.431 (17)
Equation (17) holds for the Opadry coating droplets used in the experiments with which we validated
the results of our model (Section 3.1). Note, that in the validation section the model is predictive, and
not fitted, since we used it to analyze case studies different from those used in the derivation of Equation
(17). The dissipation factor proposed in this work could also be used to estimate viscous dissipation
of various coating liquids for moderate droplet Reynolds and Ohnesorge numbers (Re∼100, Oh∼0.1).
The initial conditions required to solve the mechanical energy balance equation are:
dhm
dt
∣∣t=0
= – U0 ; hmax
∣∣t=0
= D0 (18)
We wrote the mechanical energy balance equation in terms of just one independent variable, which
we chose to be hm. To do so, we substituted the expressions for the droplet potential (gravitational
+ surface) energy, kinetic energy and rate of viscous dissipation, given by Equations (3), (4), (11)
and (15), respectively, into Equation (2) and then used the geometrical relations (12) to eliminate the
variables Rd and hmax. Since all the droplets of the first array behave independently and identically,
we calculated the equivalent radius (Req) of the wetted area at any given time t < ti as:
πR2
eq = Nd
(π R2
d
); Nd = (Qt/V ρ1) ti (19)
where Nd is the number of droplets in each array, which depends on the spray mass flow rate applied
to the tablet (Qt) and on the characteristic time ti. The mass flow rate of coating applied on a single
tablet can be calculated from the overall spray mass flow rate (Q), which is a process parameter, if
the ratio of tablet-bed to single-tablet surface area (L ≡ Abed/At) is known, since Qt = Q/L.
To summarize, the model presented in this section describes droplet spreading until the second array
of droplets impinges on top of the first at t = ti. The subsequent droplets of the spray will impact on
the initial wetted surface leading to further spreading and thickening of the coating film. Successive
droplet impacts on the wetted surface are discussed in the next section.
0 . 1 0 . 2 0 . 3 0 . 4 0 . 5 0 . 6 0 . 7 0 . 8 0 . 9 1 . 00123456789
1 0
� � � � � � � � � � � �W h i t e H P M C / P E G
8 5 % G l y c e r o l / w a t e r
Factor
F d
O h n e s o r g e n u m b e r ( O h )
F i t t e d v a l u e s o f F d F d = 1 . 8 6 8 O h - 0 . 4 3 1
� � � � � � � � � � � � � � � �H P M C
Figure 5: Fd factor estimation. The experimental data are from Bolleddula et al. (2010).

Christodoulou et al., 2019 9
Tablet
D
FilmFilm Film Film Film
00
…
… … …Tablet surface
(a) (b)
…
U
Figure 6: Successive droplet impact on the tablet. a) Side and b) top view of the tablet.
2.2 Droplet impingement on wetted surface
Droplets of the spray which follow directly behind the first array will impinge on the wetted area
(calculated in Section 2.1) and will contribute to its spreading. We assumed that at this stage the
wetted area is made up of disconnected identical cylindrical films (Fig. 6) that expand axisymmetrically.
Over a time interval dt, the impingement of a droplet on the surface of a film increases its volume by
dVf =(Qi/ρ1) dt, where Qi is the droplet mass flow rate applied to each disconnected film (Qi =Qt/Nd).
Thus, the volume of each film at any given time t+dt > ti can be calculated by Vf(t+dt) = Vf(t)+dVf .
The coating application is assumed to be completed when the wetted area reaches the area of the tablet
surface that is facing the spray (At).
Similarly to the single droplet case (Section 2.1), we assumed that the spreading of each disconnected
film of volume Vf is governed by the mechanical energy balance equation:
dEKf
dt+
dEGf
dt+
dESf
dt= WSf – Φf (20)
where EKf , EGf and ESf are the kinetic, gravitational and surface energies of each film, respectively, Φf
is the rate of viscous dissipation of the kinetic energy of the film and WSf denotes the rate of work done
on the film surface by the surroundings. The key difference is that the first term on the right-hand
side, which denotes the rate of work done by the surroundings on the surface of the film, cannot be
neglected. The part of this work that in particular needs to be accounted for is that carried out by
the impinging droplets.
Similarly to the single droplet case, we calculated the rate of change of the gravitational and surface
energies of each cylindrical film:
dEGf
dt=
d
dt(Vf ρ1gHm) (21)
dESf
dt=
d
dt
[2γ12πRf Hf + γ12πR
2
f (1 – cosθ)]
(22)
where Hf , Hm and Rf represent the film thickness, center of mass height and wetted area radius,
respectively. Here, the coating film center of mass height is equal to half of the film thickness
(Hm = Hf/2).
To calculate the kinetic energy rate of change and the rate of viscous dissipation terms in Equation
(20), one needs to assume a functional form for the velocity field inside the spreading films. We followed
the approach of Madejski [27], who proposed the following shear flow velocity field (Fig. 7):
u1r = Crz ; u1z = –Cz2 (23)
where r and z are the radial and vertical cylindrical coordinates. By assuming that the wetted area
expansion (dRf/dt) is equal to the average radial velocity at r = Rf , we can write:
dRf
dt=
1
Hf
∫ Hf
0
u1r(Rf , z) dz =CRf
Hf
∫ Hf
0
z dz ⇒ C =2
RfHf
dRf
dt(24)

Christodoulou et al., 2019 10
z
r
Figure 7: Shear flow velocity field. The dotted lines denote the streamlines.
Substituting C into Equation (23) gives:
u1r =2rz
Rf Hf
dRf
dt(25)
u1z = –2z2
Rf Hf
dRf
dt(26)
Using scaling arguments we prove in the Appendix of this article that the above velocity components
are considerably smaller than the droplet impact velocity U0. Thus, the velocity field inside the film
does not vary considerably during droplet impingement on its surface and therefore no boundary layer
exists. We used the velocity components (Equations 25, 26) to calculate the rate of change of kinetic
energy (dEKf/dt) and viscous dissipation loss rate (Φf) of each cylindrical film of volume Vf as follows:
dEKf
dt=
d
dt
(1
2ρ1
∫Rf
u1 · u1 dx
)=
1
2ρ1
d
dt
[∫Rf
(u21r + u2
1z) dx
]≈ d
dt
[ρ1πHf
60
(6H2
f + 5R2
f
)(dRf
dt
)2](27)
Φf = –
∫Rf
τ1 : ∂xu1 dx = 2μ1
∫Rf
[(∂ru1r)
2+ (u1r/r)2 + (∂zu1z)
2+
1
2(∂zu1r + ∂ru1z)
2
]dx
≈ 2μ1π
Hf
(R2
f + 8H2
f
)(dRf
dt
)2
(28)
In Equation (27), we neglected the kinetic energy associated with the liquid-air (S12) and liquid-tablet
(S13) dividing surfaces and we integrated over the entire region Rf occupied by each cylindrical film.
The rate of work done by the surroundings (phases 2 and 3) on the surface of each film is given by:
WSf =
∫S12
n21 · σ2 · u12 ds +
∫Si
ndf · σ1 · u1 ds +
∫S13
n31 · σ3 · u13 ds (29)
where Si is the droplet-film dividing surface and ndf is the unit vector normal to Si pointing from
the droplet to the film. In Equation (29), we can neglect the first term on the right-hand side which
denotes the rate of work done on the surface S12 by the surrounding gas; this is the same approximation
used in Section 2.1, where we treated a single droplet impinging on a dry substrate. Since the fluid
velocity at the tablet-film interface S13 is zero (u13 = 0; no-slip boundary condition), the third term
on the right-hand side is zero. The rate of work done by the impinging droplets on the surface of each
cylindrical film can be repartitioned into two contributions:
WSf ≈∫
Si
ndf · σ1 · u1 ds =
∫Si
p1 ndf · u1 ds +
∫Si
ndf · τ1 · u1 ds (30)
where p1 is the pressure in the coating liquid. The two terms on the right-hand side represent the
rates of work done by the pressure and viscous forces, respectively, on the surface of the film.

Christodoulou et al., 2019 11
Spreading cylindrical film
Impinging
droplet
a) b)
Droplet–Film
boundary layer
Figure 8: a) Droplet impact on a film, b) Volume-Of-Fluid CFD simulation of droplet-filmimpingement.
Let us first deal with the pressure term on the right-hand side of Equation (30). To calculate the
work done by the pressure forces on Si, one needs an expression for the pressure field. To derive it,
we assumed that the region of the droplet near the interface (droplet-film boundary layer, Fig. 8.b)
decelerates significantly upon impact (in this region the velocity field magnitude is far less than U0).
In fact, using scaling arguments, we can write:
u1z
U0
∼ CH2
f
U0
∼ Hf
Rf U0
dRf
dt∼(
Hf
Rf
)2
∼(
D0
Rf
)2
<< 1 (31)
In the last passage (Equation 31), we have assumed that the thickness of the coating film has the
same order of magnitude as D0 which is true in our simulations, and that dRf/dt ∼ (Hf/Rf) U0 which
is shown to be true using scaling arguments in the Appendix of this article. Notice that at the very
beginning of the spray application, Rf ∼ Hf and so the velocity in the droplet-film boundary layer
and the droplet impact velocity have the same order of magnitude. Note that the time interval over
which this condition holds is very short compared to that over which the tablet is sprayed (∼ 0.1s,
[29]). For most of the time, Hf/Rf << 1 and consequently the droplet impact velocity is significantly
larger than the vertical velocity in the film. This has been also confirmed numerically (refer to the
CFD simulations discussed in the Appendix).
We conclude that in the droplet-film boundary layer the kinetic energy of the fluid turns almost
entirely into pressure energy, so that in this region p1 ≈ (1/2) ρ1U2
0. We can thus write:∫Si
p1ndf · u1 ds ∼ (1/2) ρ1U2
0
∫Si
ndf · u1 ds = (1/2)U2
0 m(t) (32)
where m is the droplet mass entering in/merging with the film per unit time. This quantity is
time-dependent, but its order of magnitude is given by the ratio between the droplet mass MD and
the time ti required by the droplet to fully merge with the film. Based on the above we obtain:∫Si
p1ndf · u1 ds ≡Wp ∼ (1/2)U2
0MD/ti = (1/2)U2
0 Qi (33)
where Qi denotes the droplet mass flow rate applied to each disconnected cylindrical film; this is equal
to the ratio Qt/Nd, in which the values of both quantities can be regarded as known (refer to the
previous section).
As before, to calculate the rate of work done by viscous forces on each film (WV), we considered the
no-slip boundary condition at the tablet film interface, and we neglected the rate of work done on
S12 and we considered significant the rate of work done by the viscous forces only inside the droplet
region that decelerates upon impact (the droplet-film boundary layer). Pasandideh-Fard et al. [28]
report that the droplet-film boundary layer thickness is ` ∼ D0/√
Re.
Since the velocity field inside the boundary layer is unknown, we used scaling analysis to estimate the
rate of work done by the viscous forces. The local scales of the fluid velocity u1 and shear stress τ1 in
the boundary layer are taken to be U0 and μ1 Fd U0/ `, respectively.

Christodoulou et al., 2019 12
D0
Film
Droplet-film boundary layer
a)
b)
Figure 9: Droplet impingement on a film and merging. a) Volume-Of-Fluid CFD simulation andb) our modeling approach.
We then can write:∫Si
ndf · τ1 · u1 ds ∼ –Fdμ1U2
0
`Ai ∼ –
Fdμ1U2
0
`
Qi
U0ρ1∼ –
FdU2
0 Qi
Re
D0
`∼ –
(Fd√Re
)U2
0 Qi (34)
where Ai denotes the area of the surface Si (Fig. 8).
Consequently, if Fd/√
Re << 1, the rate of work done by the viscous forces is negligible compared to
that done by the pressure forces. This is because:(Fd√Re
)U2
0 Qi << U2
0 Qi ⇒∫
Si
ndf · τ1 · u1 ds <<
∫Si
p1 ndf · u1 ds (35)
For sprays where Fd/√
Re ∼ 1, the mechanical energy balance equation (Equation 20) needs to account
for the rate of work done by the viscous forces on each cylindrical film:∫Si
ndf · τ1 · u1 ds ≡WV ∼(
Fd√Re
)WP (36)
So, by substituting Equations (33) and (36) into (30), we can calculate the overall rate of work done
by the surrounding fluid on the surface of each cylindrical film (WS ≡WP+WV).
To calculate the thickness (Hf) of each disconnected film, one needs to solve the mechanical energy
balance Equation (20). To do so, we substituted in it the expressions for the rate of work done by the
surrounding fluid on the film surface (WSf), the rate of change of gravitational, surface and kinetic
energies of the film (EGf , ESf , EKf), as well as the rate of kinetic energy viscous dissipation (Φf), given
by Equations (29), (21), (22), (27) and (28), respectively.
Since the shape of each disconnected film is assumed to be cylindrical [V(t) = πR2
f (t)Hf(t) ; Hm = Hf/2],
we reduced the number of unknown variables in the mechanical energy balance Equation (20) to one
(the variable being Hf) and solved it adopting the following initial conditions:
dRf
dt
∣∣∣∣t=ti
=dRd
dt
∣∣∣∣t=ti
; Rf
∣∣∣t=ti
= Rd
∣∣∣t=ti
(37)
When the equivalent wetted area (Aeq = NdπR2
f ) reaches the area of the tablet surface, we assumed
that the coating application process is completed. We considered that the final film thickness that
covers the tablet is equal to the thickness of each individual film Hf .
To summarize, the current model describes the spreading of disconnected cylindrical coating films
under a spray. To simplify the problem we considered that the droplets merge with the film as they
impact (Fig. 9) and neglected crown formation [30] and splashing. This means that our model might
not yield accurate predictions when these phenomena are relevant. However, it is expected that the
effect of these phenomena will be negligible in our case studies where the impinging droplet Weber
(We ≡ ρ1U2
0 D0/γ12) and Reynolds numbers are relatively small [12] and droplet-film deposition and
merging predominantly occur.
Christodoulou et al., 2019 13
The model presented allows the estimation of the time τF required by the surface of a tablet to become
fully covered by a thin coating film. Predicting this “application” time is important, because if the
tablet is sprayed for a shorter time period, it will only become partially coated, while if it is sprayed
for too long, the coating will spread to adjacent tablets thus possibly leading to inter-tablet coating
non-uniformity. In the next section, we present the results of the model and we validate them with
experimental data from the literature.
3. Numerical results and validation
We validated the numerical results from the model described above with experimental data from the
literature. In Section 3.1, we used experimental data from the work of Bolleddula et al. [10] to
compare the numerical results concerning single droplet impingement on pharmaceutical tablets. In
Section 3.2, we compared the model predictions for the film final thickness with the corresponding
experimental results of Kalantari and Tropea [21], who investigated water spray impingement on rigid
surfaces while varying impact conditions such as the spray droplet average size and velocity. The wide
range of spray impact conditions they investigated and the clarity with which they reported their
findings allowed us to validate our model effectively. All the numerical calculations were performed
in gPROMS [26], employing the Modelbuilder platform.
It is well documented in the literature that film formation after spray impingement on a rigid surface is
influenced by the spray mass flow rate, the droplet mean size and velocity and the liquid properties [11,
21]. We therefore performed variance-based sensitivity analysis employing the gPROMS Modelbuilder
global sensitivity analysis tool [26] to study the effect of these parameters on the coating film thickness
(Hf) and application time (τF). This analysis indicated how the model output variances depend on
the input factors that are subject to uncertainty [31] and allowed us to identify the most important
model parameters.
3.1 Single droplet impact
In this section, we present the numerical results of the model discussed in Section 2.1 for single droplet
impingement on a dry rigid surface. The information derived by this simulation can be used in the
prediction of the equivalent wetted area (Aeq) for t < ti. According to Bolleddula et al. [10], the
characteristic time magnitude of the inertia-driven coating spreading regime is approximately equal
to ti ≡ D0/U0. This means that for t < ti the droplets spread without the influence of the capillary
forces, whose effect is negligible.
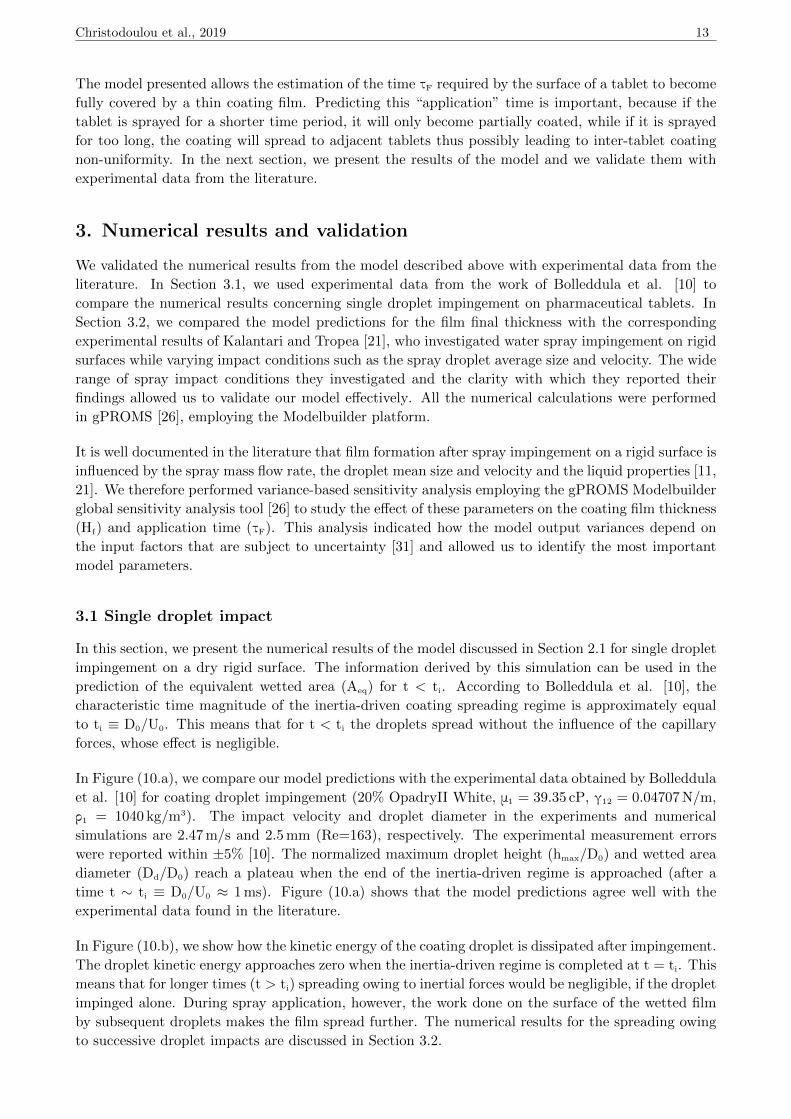
In Figure (10.a), we compare our model predictions with the experimental data obtained by Bolleddula
et al. [10] for coating droplet impingement (20% OpadryII White, μ1 = 39.35 cP, γ12 = 0.04707 N/m,
ρ1 = 1040 kg/m3). The impact velocity and droplet diameter in the experiments and numerical
simulations are 2.47 m/s and 2.5 mm (Re=163), respectively. The experimental measurement errors
were reported within ±5% [10]. The normalized maximum droplet height (hmax/D0) and wetted area
diameter (Dd/D0) reach a plateau when the end of the inertia-driven regime is approached (after a
time t ∼ ti ≡ D0/U0 ≈ 1 ms). Figure (10.a) shows that the model predictions agree well with the
experimental data found in the literature.
In Figure (10.b), we show how the kinetic energy of the coating droplet is dissipated after impingement.
The droplet kinetic energy approaches zero when the inertia-driven regime is completed at t = ti. This
means that for longer times (t > ti) spreading owing to inertial forces would be negligible, if the droplet
impinged alone. During spray application, however, the work done on the surface of the wetted film
by subsequent droplets makes the film spread further. The numerical results for the spreading owing
to successive droplet impacts are discussed in Section 3.2.

Christodoulou et al., 2019 14
0 . 0 0 . 5 1 . 0 1 . 5 2 . 00 . 0
0 . 5
1 . 0
1 . 5
2 . 0
2 . 5
0 . 0 0 . 5 1 . 0 1 . 5 2 . 00 . 0 0 0
0 . 0 0 2
0 . 0 0 4
0 . 0 0 6
0 . 0 0 8
0 . 0 1 0( b )
S p r e a d i n g t i m e ( m s )
W e t t e d a r e a d i a m e t e r ( m o d e l ) W e t t e d a r e a d i a m e t e r ( e x p e r i m e n t s ) D r o p l e t m a x h e i g h t ( m o d e l ) D r o p l e t m a x h e i g h t ( e x p e r i m e n t s )
( a )h m
ax/D0 a
nd D d
/D 0
Dropl
et ener
gy (m
J)
S p r e a d i n g t i m e ( m s )
K i n e t i c e n e r g y P o t e n t i a l e n e r g y T o t a l m e c h a n i c a l e n e r g y D i s s i p a t e d e n e r g y
Figure 10: Single droplet impingement on a dry substrate. (Experiments by Bolleddula et al., 2010).a) Normalized wetted area diameter (Dd/D0) and droplet maximum height (hmax/D0).
b) Kinetic energy dissipation during spreading.
3.2 Spray impact
In this section, we present the numerical results of the model discussed in Section 2.2 for liquid film
spreading after spray impact and we validate them with experimental data found in the literature.
Kalantari and Tropea [21] conducted a thorough experimental investigation of water (ρ1 = 998 kg/m3,
μ1 = 1 cP, γ12 = 0.072 N/m) spray impact onto a rigid surface. They used a high-speed camera to
measure the average film thickness (Hf) after the “target” surface was completely wetted. It should
be noted that in their experiments the thickness (Hf) did not vary significantly during continuous
spraying. In our simulations (Fig. 12), the thickness of each disconnected film increases initially until
it reaches a maximum value. After this point, the thickness does not change significantly and each film
continues only to spread. We considered that the moment the films come into contact, the “target”
surface (in our case the tablet surface) is completely wetted and consequently we calculated Hf at this
point.
In Figure (11.a), we compare the experimental data [21] for the normalized film thickness (Hf/D0) as a
function of the impact Reynolds number with the corresponding numerical results of our model. In our
simulations as well as in the experiments, the film thickness Hf was calculated after the entire target
surface is wetted (application time, t=τF). The water spray volumetric flow rate in both experiments
and simulations was set equal to 1 l/h (Qt = 16.8 g/min) over a cyclical target 5 mm in diameter (in
our modeling approach this represents the tablet) and the impact Reynolds number was set to range
from 300 to 600 (U0 =7 – 18 m/s and D0 = 30 – 75 μm). Kalantari and Tropea [21] reported that the
experimental error of the Hf measurements ranged from 5 μm to 22 μm but they did not mention the
corresponding error at each impact condition (impact Re) they investigated. Thus, in Figure (11.a),
we introduced ± 10% error bars to assess the agreement between numerical and experimental results.
Figure (11.a) shows that our numerical results agree well with the experimental data.
In Figure (11.b), we compare the predictions of our model with the predictions of the empirical equation
Hf = 22149 · D0Re–1.769 which was derived by Kalantari and Tropea [21] by fitting their experimental
data. As seen in Figure (11.b), the results of our model are in reasonable agreement with the values
of the empirical equation (|%Error| < 10%). This is also shown in Table 1, where we calculate the
percentage error of the film thickness model predictions for different Re (%|Error| < 9.1%). Even
though our model results are close to the empirical equation predictions, the small deviation might
be caused by the inability of our model to account for possible splashing and crater formation during
droplet-film impact. According to the literature [32], however, the effect of these phenomena should
be small in the impact conditions during film-coating (small droplet Reynolds and Weber numbers).
This is consistent with the model predictions being good.

Christodoulou et al., 2019 15
1 0 1 5 2 0 2 5 3 0 3 5 4 0 4 5 5 0 5 5 6 01 01 52 02 53 03 54 04 55 05 56 0
3 0 0 3 5 0 4 0 0 4 5 0 5 0 0 5 5 00 . 20 . 30 . 40 . 50 . 60 . 70 . 80 . 91 . 01 . 1
I m p a c t R e y n o l d s n u m b e r E m p i r i c a l e q u a t i o n
F i l m t h i c k n e s s (µ m ) � 1 0 % l i n e s
Curre
nt ma
thema
tical m
odel
( b )
E x p e r i m e n t a l d a t a N u m e r i c a l r e s u l t s
H f / D
0
( a )
Figure 11: Film height as a function of the droplet impact Reynolds number. Comparison witha) experimental data, and b) empirical equation by Kalantari and Tropea [21].
Table 1: Film thickness at the moment when the entire target surface is wetted (t=τF). Empiricalequation by Kalantari and Tropea [21].
Droplet Impact Impact Film thickness (μm)%|Error|
diameter (μm) velocity (m/s) Reynolds number Model Empirical equation
60 10.0 599 16.65 16.24 2.5
65 8.0 519 24.20 22.66 6.8
55 9.0 494 19.62 20.92 6.2
30 15.0 449 12.54 13.50 7.1
50 8.0 399 24.97 27.72 9.9
The results presented in this section can be used to predict the thickness of the liquid film applied
on a tablet surface after passing through the spray zone in a rotating coating drum. If the solvent
evaporates evenly from the surface of the tablet then the final polymer film thickness can be estimated.
3.3 Sensitivity analysis
It is well documented in the literature that film spreading under spray is affected by many parameters
[11, 21]. These parameters include the size and velocity of the spray droplets before impact, the
spray flow rate and liquid viscosity. We performed variance-based sensitivity analysis [31] to assess
the influence of these parameters on the model main outputs: the film thickness (Hf) when the entire
tablet surface is wetted and the application time (τF). We used the global sensitivity tool (GSA) of
gPROMS Modelbuilder and we followed the method of Saltelli et al. [31] to calculate the first order
and total sensitivity indices. The first order sensitivity index, also known as “importance” measure,
represents the main effect of the parameter (factor) on the output. The total index additionally
accounts for all higher-order effects to the output due to interactions between parameters. A large
numerical value indicates a significant effect [26].
Table 2: Sensitivity analysis. Variance-based method by Saltelli [31] in gPROMS Modelbuilder.
Factor First order (Hf) Total effect (Hf) First order (τF) Total effect (τF)
Droplet diameter, D0 0.201 0.254 0.077 0.088
Impact velocity, U0 0.467 0.526 0.170 0.189
Spray mass flow rate, Q 0.001 0.059 0.635 0.641
Liquid viscosity, μ1 0.276 0.326 0.106 0.113

Christodoulou et al., 2019 16
From the sensitivity indices in Table 2 we can rank the model parameters based on their effect on
the model output (response). The droplet viscosity, velocity and diameter before impact are the
parameters that affect the final film thickness (Hf) the most. The overall spray mass flow rate (Q)
only has significant secondary effects on the film thickness, but influences significantly the application
time (τF). A small first order effect does not mean that a factor does not affect the response [31], since
it might still be important through its interactions with other factors (e.g. D0, U0). This is the reason
why we also considered the total effect. The rest of the model parameters (not shown in Table 2) have
small sensitivity indices and do not significantly affect the film thickness and application time.
In Figure (12.a), we consider the influence of the droplet impact velocity (U0) on the thickness (Hf)
of the cylindrical films. We present three scenarios for different impact velocities: 4, 5 and 6 m/s. In
all scenarios, the droplet mean diameter, the spray mass flow rate and the coating viscosity were set
equal to 150 μm, 200 g/min and 10 cP, respectively. The model predicts that the final value of the film
thickness increases when the impact velocity decreases. The simulations also show that the thickness
of each film does not vary significantly after it reaches a maximum value. This prediction agrees with
experimental observations [13]. At this point, each film continues to spread with the same thickness
until the entirety of the tablet surface is wetted. In Figure 12, the application time τF is taken equal
to 100 ms for all case studies.
In Figure (12.b), we study the influence of the spray droplets mean diameter (D0) on the film
thickness (Hf). The velocity of the droplets and the spray rate were set equal to 5 m/s and 200 g/min,
respectively. The numerical model predicts that larger droplets form thicker films. Similar behavior
is experimentally observed for the single coating droplet impact case; larger droplet diameters result
in higher hmax values [18].
0 1 0 2 0 3 0 4 0 5 0 6 0 7 0 8 0 9 0 1 0 02 0
3 0
4 0
5 0
6 0
0 1 0 2 0 3 0 4 0 5 0 6 0 7 0 8 0 9 0 1 0 02 0
3 0
4 0
5 0
6 0
0 1 0 2 0 3 0 4 0 5 0 6 0 7 0 8 0 9 0 1 0 02 0
3 0
4 0
5 0
6 0
0 1 0 2 0 3 0 4 0 5 0 6 0 7 0 8 0 9 0 1 0 02 0
3 0
4 0
5 0
6 0
Film
thickn
ess (µ
m)
Film
thickn
ess (µ
m)
T i m e ( m s )
I m p a c t v e l o c i t y : 4 . 0 m / s I m p a c t v e l o c i t y : 5 . 0 m / s I m p a c t v e l o c i t y : 6 . 0 m / s
( a )
T i m e ( m s )
M a s s f l o w r a t e : 1 0 0 g / m i n M a s s f l o w r a t e : 2 0 0 g / m i n M a s s f l o w r a t e : 3 0 0 g / m i n
( b )
( d )
Film
thickn
ess (µ
m)
T i m e ( m s )
V i s c o s i t y : 1 0 c P V i s c o s i t y : 1 5 c P V i s c o s i t y : 2 0 c P
( c )
Film
thickn
ess (µ
m)
T i m e ( m s )
D i a m e t e r : 1 0 0 µm D i a m e t e r : 1 2 0 µm D i a m e t e r : 1 5 0 µm
Figure 12: Film (γs = 0.040N/m, θe = 30o) thickness variation with changing: a) droplet velocity(D0 =150μm, μ1 =10cP, Q=200g/min), b) droplet diameter (U0 =5m/s, μ1 =10cP, Q=200g/min), c)viscosity (D0 =150μm, Q=200g/min, U0 =5m/s), d) spray rate (D0 =150μm, μ1 =15cP, U0 =5m/s)

Christodoulou et al., 2019 17
The importance of the spray liquid properties has often been mentioned in the literature [13]. In Figure
(12.c), we show the effect of coating viscosity (μ1) on film thickness (Hf). The droplet velocity was set
at 5 m/s and the flow rate at 200 g/min. As expected, more viscous liquids form thicker films that also
spread more slowly. The rate of work done by the viscous forces during droplet-film impact (WV),
which is included in the energy balance, is of high significance when concerning highly viscous coatings.
Figure (12.d) shows the effect of spray mass flow rate (Q) on the film thickness (Hf). We kept the
droplet diameter (150 μm) and impact velocity (5 m/s) constant, and only changed the number of
droplets impinging per unit time (spray density). The numerical simulations show that higher spray
densities result in slightly thinner films. The model prediction agrees with the behavior observed in
the experiments by Kalantari and Tropea [21].
To summarize, the sensitivity analysis we performed shows that the mean droplet diameter (D0) and
velocity (U0) are the parameters that affect significantly the film thickness and the time required for
the coating film to cover the tablet surface which is facing the spray. Moreover, the spray mass flow
rate influences mainly the application time and liquid properties such as the coating viscosity (μ1) and
density (ρ1) play a less significant role.
4. Conclusions
Our work considers the film-coating process, which is widely employed by the pharmaceutical industry.
Film coating is a complex process that is difficult to simulate accurately with reasonable computational
cost. In this work, we developed a novel mathematical model that can quickly calculate the film
thickness and spreading rate on the surface of a tablet passing through the spray zone. The detailed
derivations of the main equations are presented in the main article and in the appendix. The results
of the model, which was implemented in the gPROMS Modelbuilder platform, were validated with
experimental data found in the literature. In Sections 3.1 and 3.2, we showed that the model
predictions are in good agreement with the experiments.
Liquid coating film formation during spray impingement is affected by many parameters. To find out
which parameters (e.g., film thickness and application time) dominate the output of our mathematical
model, we performed a variance-based sensitivity analysis. This analysis was possible because of
the short computational time of each simulation (simulation time < 5s), an advantage of our model
when compared with traditional CFD models. In Section 3.3, we found that the mean diameter and
impact velocity of the droplets are the parameters affecting more strongly the film thickness and the
application time. Additionally, we found that the spray mass flow rate significantly influences only
the time required to cover the tablet with coating film (application time), whereas liquid properties,
such as the coating viscosity and density, are not as important.
Spray properties, such as the atomizing air pressure, the design and configuration of the guns/nozzles
and the spray mass flow rate, influence the droplet mean size and velocity, as well as the spray density
and spray zone area, attributes that play a key role in controlling the process and enhancing the
quality of the tablets. High spray mass flow rates may cause coating defects (the most common being
tablet sticking and logo bridging), whereas significantly low spray mass flow rates may lead to spray
drying phenomena which affect the duration and efficiency of the coating process [33]. Our model
allows predicting the film thickness and application time for a given coating formulation, spray flow
rate and droplet mean size and velocity before impact. This insight can be used by the pharmaceutical
industry to select the appropriate spray operating conditions and optimize the final product.

Christodoulou et al., 2019 18
Appendix
To derive a model that provides solutions for the complex spray impingement problem with relatively
short simulation times one needs to make some simplifications/assumptions. In Section 2, we discussed
and explained the assumptions made in our model. In this Appendix, we derive the mechanical energy
equation used in the model (Section A.1) and we further justify the main assumptions regarding viscous
dissipation in the boundary layer (Section A.2), film velocity field (Section A.4), spray splashing,
droplet-droplet and drop-film interactions (Sections A.3 and A.5).
A.1 Derivation of the mechanical energy balance equation
The mechanical energy balance equation in the form of Equation (2) - without the term for the rate of
work done by the droplet surroundings - has been used several times in the literature [17, 10]. However,
to the best of our knowledge, no rigorous derivation has ever been reported. Here, we therefore derive
the mechanical energy balance equation we employed in the main article.
Consider as control volume the entire droplet. The two surfaces that bound the droplet are dividing
surfaces. The first, denoted by S12, is the interface between the liquid and the gas, while the second,
denoted by S13, is the interface between the liquid and the solid (Fig. 3). The interface S23 between
the gas and the solid is not included in the control volume. The three dividing surfaces meet at the
common line C. The three-dimensional spatial region bounded by the dividing surfaces S12 and S13 is
denoted by R1. We aim to derive the integral mechanical energy balance equation over the control
volume just described. There are various ways of doing this; we base the derivation on the generalized
transport theorem, following the approach of Slattery et al. [34]. Let us consider:
Dt
∫R1
ϕ1 dx + Dt
∫S12
ϕ12 ds + Dt
∫S13
ϕ13 ds (a1)
where it is:
ϕ1 ≡ (1/2) ρ1 u1 · u1 ; ϕ12 ≡ (1/2) ρ12 u12 · u12 ; ϕ13 ≡ (1/2) ρ13 u13 · u13 (a2)
Here ρr and ur are the fluid density and velocity fields within the region Rr, whereas ρrs and urs are
the fluid density and velocity fields over the surface Srs. Using the generalized transport theorem, we
now manipulate each term individually. First, we write:
Dt
∫R1
ϕ1 dx =
∫R1
∂tϕ1 dx +
∫S12
n12 · u12 ϕ1 ds +
∫S13
n13 · u13 ϕ1 ds (a3)
where nrs denotes the unit vector normal to Srs pointing from phase r into phase s (therefore, it is
outwardly directed for region Rr). For the second integral in Equation (a1), we write:
Dt
∫S12
ϕ12 ds =
∫S12
(∇ϕ12 – 2 H12n12 · u12 ϕ12
)ds +
∫Cm12·uC ϕ12 ds (a4)
Here Hrs is the mean curvature of the surface Srs, whereas mrs is the unit vector tangent to the surface
Srs, normal to the line C and outwardly directed. Moreover, uC is the fluid velocity field over C and ∇denotes the invariant time derivative operator [35, 36] defined as:
∇ϕrs ≡ ∂tϕrs – vrs · ∂sϕrs (a5)
In this equation, ∂tϕrs is calculated while holding the surface coordinates constant ; therefore, this
derivative depends on the parametrization, that is, on the choice of surface coordinates. Also vrs,
which represents the coordinate velocity of the surface (that is, the time rate of change of spatial
position following a surface point with fixed surface coordinates), depends on the parametrization.
Conversely, the surface gradient ∂sϕrs and the time derivative ∇ϕrs are invariants and do have a clear

Christodoulou et al., 2019 19
physical meaning. Finally, for the third integral in Equation (a1), we write a similar expression:
Dt
∫S13
ϕ13 ds =
∫S13
(∇ϕ13 – 2 H13n13 · u13 ϕ13
)ds +
∫Cm13 · uC ϕ13 ds (a6)
These equations can be manipulated further using the divergence theorem. Let us start with Equation
(a3); applying this theorem to the region R1, we obtain the following relation:∫R1
∂x · (u1 ϕ1) dx =
∫S12
n12 · u1 ϕ1 ds +
∫S13
n13 · u1 ϕ1 ds (a7)
Notice that while in the generalized surface transport theorem the surface integrals feature the velocity
of the bounding surface (in Equation a3 these velocities are u12 and u13), in the divergence theorem
the surface integrals feature the velocity of the fluid evaluated at the boundary of the region – but
within the region (in Equation a7 this velocity is u1). So, we can write Equation (a3) as follows:
Dt
∫R1
ϕ1 dx =
∫R1
[∂tϕ1 + ∂x · (u1 ϕ1)] dx –
∫S12
n12 · (u1 – u12)ϕ1 ds –
∫S13
n13 · (u1 – u13)ϕ1 ds
=
∫R1
[∂tϕ1 + ∂x · (u1 ϕ1)] dx –
∫S12
V12 ϕ1 ds –
∫S13
V13 ϕ1 ds (a8)
where:
V12 ≡ n12 · (u1 – u12) ; V13 ≡ n13 · (u1 – u13) (a9)
For Equation (a4), we can write:∫S12
∂s · (u12 ϕ12) ds =
∫Cm12 · u12 ϕ12 ds –
∫S12
2 H12n12 · u12 ϕ12 ds (a10)
So, we obtain:
Dt
∫S12
ϕ12 ds =
∫S12
[∇ϕ12 + ∂s · (u12 ϕ12)
]ds –
∫Cm12 · (u12 – uC)ϕ12 ds
=
∫S12
[∇ϕ12 + ∂s · (u12 ϕ12)
]ds –
∫C
V12,C ϕ12 ds (a11)
With similar passages, we also obtain:
Dt
∫S13
ϕ13 ds =
∫S13
[∇ϕ13 + ∂s · (u13 ϕ13)
]ds –
∫C
V13,C ϕ13 ds (a12)
where:
V12,C ≡ n12 · (u12 – uC) ; V13,C ≡ n13 · (u13 – uC) (a13)
The results derived permit us to write:
Dt
∫R1
ϕ1 dx + Dt
∫S12
ϕ12 ds + Dt
∫S13
ϕ13 ds
=
∫R1
[∂tϕ1 + ∂x · (u1 ϕ1)] dx +
∫S12
[∇ϕ12 + ∂s · (u12 ϕ12)
]ds +
∫S13
[∇ϕ13 + ∂s · (u13ϕ13)
]ds
–
∫S12
ϕ1V12 ds –
∫S13
ϕ1V13 ds –
∫C
(ϕ12 V12,C + ϕ13 V13,C
)ds (a14)
In our specific problem, there is no mass transfer between the phases; the equation above, consequently,
may be simplified. In particular, the last line vanishes, because the velocity of the material particles,
of the surface particles and of the common line particles are all equal at the boundaries. Hence, the
volume and surface flow rates introduced in Equations (a9) and (a13) are zero.

Christodoulou et al., 2019 20
We then obtain:
Dt
∫R1
ϕ1 dx + Dt
∫S12
ϕ12 ds + Dt
∫S13
ϕ13 ds =
∫R1
[∂tϕ1 + ∂x · (u1 ϕ1)] dx
+
∫S12
[∇ϕ12 + ∂s · (u12 ϕ12)
]ds +
∫S13
[∇ϕ13 + ∂s · (u13 ϕ13)
]ds (a15)
To manipulate this equation further, we integrate over the region R1 the mechanical energy balance
equation holding for single-phase fluids [38]. This gives:∫R1
[∂tϕ1 + ∂x · (u1 ϕ1)
]dx = –
∫R1
[∂x · (σ1 · u1) – τ1 : ∂xu1 – ρ1 u1 · g
]dx (a16)
where we have assumed that the fluid is incompressible, so that the field u1 is solenoidal. Here σ1 is
the fluid stress tensor field within region R1 and τ1 is its deviatoric part; g is the gravitational field.
The first term on the right-hand side can be expressed as:∫R1
∂x · (σ1 · u1) dx =
∫S12
n12 · σ1 · u1 ds +
∫S13
n13 · σ1 · u1 ds (a17)
Moreover, it is: ∫R1
ρ1 u1 · g dx = –
∫R1
u1 · ∂xφ1 dx = – Dt
∫R1
φ1 dx (a18)
where φ1 is the potential energy per unit volume of the gravitational field in the region considered
(as pointed out, this region identifies a material body, because no mass transfer between the phases
is present). The last two equations allow writing Equation (a16) in the following form:∫R1
[∂tϕ1 + ∂x · (u1ϕ1)] dx =– Dt
∫R1
φ1 dx–
∫S12
n12 · σ1 · u1 ds –
∫S13
n13 · σ1 · u1 ds+
∫R1
τ1 :∂xu1 dx (a19)
We treat the last two terms on the right-hand side of Equation (a15) adopting a similar strategy.
Let us integrate over the surface S12 the jump mechanical energy balance equation [34, 37]. Doing so
yields the following integral equation:∫S12
[∇ϕ12 + ∂s · (u12 ϕ12)
]ds =
∫S12
[n12 · (σ1 – σ2) · u12 + 2 H12n12 · u12 γ12
]ds
+
∫S12
[u12 · ∂sγ12 + ρ12u12 · g
]ds (a20)
Here σ2 is the fluid stress tensor within the region occupied by phase 2, which in our case is the gas,
and γ12 is the surface tension on S12. In writing the equation above, we have assumed that the surface
stress tensor is isotropic, so that no viscous part is present. Assuming that γ12 is uniform (that is,
independent of position), the first term on the second line of Equation (a20) vanishes. Moreover, if
we assume that the surface densities are constant and uniform, it is:∫S12
ρ12 u12 · g ds = –
∫S12
u12 · ∂xφ12 ds = –
∫S12
u12 · (I · ∂xφ12) ds
= –
∫S12
u12 ·[(n12n12 + P) · ∂xφ12
]ds = –
∫S12
[u12 · (n12n12 · ∂xφ12) + u12 · (P · ∂xφ12)
]ds
= –
∫S12
(∇φ12 + u12 · ∂sφ12) ds = –
∫S12
[∇φ12 + ∂s · (u12φ12)
]ds
= –
∫S12
(∇φ12 – 2 H12n12 · u12 ϕ12) ds –
∫Cm12 · u12 ϕ12 ds = – Dt
∫S12
φ12 ds (a21)
where I and P are the identity tensor and the projection tensor, respectively, and φ12 is the potential
energy per unit surface of the gravitational field over the surface considered.

Christodoulou et al., 2019 21
Above, in the passage on the third line, we have replaced u12 ·∂s φ12 with ∂s (u12 · φ12). In general, the
two terms differ by the amount φ12 ∂s · u12. However, because no mass transfer takes place between
the phases and because the surface density has been assumed to be constant and uniform, the surface
velocity field u12 is solenoidal. To show this, we employ the jump mass balance equation, which reads:
∇ρ12 = ρ1V12 + ρ2V21 – ∂s · (ρ12u12) (a22)
In this equation, because of the assumptions just reported, the invariant time derivative and the mass
transfer terms are zero; therefore, so is the divergence of ρ12 u12. But since the density is uniform, this
implies that the velocity field is divergence-free. This completes the proof.
To manipulate the term in Equation (a20) involving the mean curvature of the surface, we assume
that the shape of the droplet is that of a spherical cap. This means that S13 is a disk, whose radius we
denote by Rd, while the common line is a circle. Exploiting the radial symmetry, we can then write:∫S12
2 H12 n12 · u12 γ12 ds =
∫Cm12 · u12 γ12 ds – Dt
∫S12
γ12 ds = γ12
(m12 · u12
∫C
ds – Dt
∫S12
ds
)= γ12
[|u12| (2 πRd) cosθ – Dt A12
]= γ12
[DtRd (2 πRd) cosθ – Dt A12
]= γ12
[Dt(πR2
d) cosθ – Dt A12
]= γ12 Dt(A13 cosθ – A12) (a23)
where we have assumed that the surface tension is constant (in addition to being uniform). Moreover,
θ is the dynamic contact angle - which is not expected to be equal to the equilibrium contact angle,
even if one often replaces the former with the latter - whilst Ars denotes the area of Srs. Equation
(a23) holds for the case of a cylindrical film where the surface S13 is a disk of radius Rf (Section 2.2).
The relations derived above allow us to write Equation (a20) in the following form:∫S12
[∇ϕ12 + ∂s · (u12 ϕ12)] ds = – Dt
[∫S12
φ12 ds + γ12 (A12 – A13 cosθ)
]
+
∫S12
n12 · (σ1 – σ2) · u12 ds (a24)
The last term on the right-hand side of Equation (a15) can be treated similarly; however, since the
surface S13 is flat, the term involving the mean curvature vanishes; the final result is:∫S13
[∇ϕ13 + ∂s · (u13 ϕ13)
]ds = – Dt
∫S13
φ13 ds +
∫S13
n13 · (σ1 – σ3) · u13 ds (a25)
We now introduce the last two equations and Equation (a19) into (a15); doing this yields the integral
mechanical energy balance equation:
Dt
[ ∫R1
(ϕ1 + φ1) dx +
∫S12
(ϕ12 + φ12) ds +
∫S13
(ϕ13 + φ13) ds + γ12 (A12 – A13 cosθ)
]=
∫S12
n21 · σ2 · u12 ds +
∫S13
n31 · σ3 · u13 ds +
∫R1
τ1 : ∂xu1 dx (a26)
The left-hand side features the rate of change of the total energy of the droplet, which comprises
kinetic energy, potential energy and surface energy, while the right-hand side features the rate of work
performed by phases 2 and 3 on the droplet and the rate of conversion of mechanical energy into
internal energy due to the action of the viscous stress within the droplet.

Christodoulou et al., 2019 22
A.2 Estimation of the rate of viscous dissipation in the droplet-film boundary layer
In this section, we estimate the rate of viscous dissipation of the droplet kinetic energy in the boundary
layer of thickness δ near the tablet surface (Fig. 4; Section 2.1) where viscous dissipation is significant.
In the boundary layer we do not have a functional form for the velocity field u1. Thus, we cannot
solve the following volume integral rigorously:
Φδ = –
∫Rδ
τ1 : ∂xu1 dx (a27)
However, we can estimate the value of the rate of viscous dissipation in the boundary layer Φδ using
scaling analysis. The rate of viscous dissipation of kinetic energy in the boundary layer region Rδ is
given by:
Φδ = –
∫Rδ
τ1 : ∂xu1 dx =
∫Rδ
[τrr
∂u1r
∂r+ τrz
∂u1r
∂z+τϑϑ
(u1r
r
)+ τzr
∂u1z
∂r+ τzz
∂u1z
∂z
]dx
=
∫Rδ
[2 μ1
(∂u1r
∂r
)2
+ μ1
(∂u1r
∂z+
∂u1z
∂r
)∂u1r
∂z
+ μ1
(u1r
r
)2
+ μ1
(∂u1r
∂z+
∂u1z
∂r
)∂u1z
∂r+ 2 μ1
(∂u1z
∂z
)2 ]dx (a28)
To estimate Φδ we introduce the following local scales:
∂u1r
∂r∼ vr
Rd
;∂u1r
∂z∼ vr
δ;
∂u1z
∂z∼ vz
δ(a29)
where vr and vz are local scales of the radial and vertical velocity in the boundary layer of thickness
δ and Rd is the radius of the area of the tablet wetted by the droplet.
We considered that ∂ru1z is negligible since the changes of the vertical velocity (u1z) in the radial
direction are expected to be very small inside the boundary layer. The boundary layer thickness δ is
given by Equation (5) in Section 2.1. Substituting the scales above into Equation (a28) gives:
Φδ ∼∫
Rδ
[3 μ1
(vr
Rd
)2
+ μ1
(vr
δ
)2
+ 2 μ1
(vz
δ
)2]
dx (a30)
The first term in the integral on the right-hand side of Equation (a30) can be neglected since: Rd >> δ.
To relate the scales of the radial and vertical velocities we use the continuity equation:
1
r
(r∂u1r
∂r+ u1r
)+
∂u1z
∂z= 0⇒ vr
Rd
∼ vz
δ⇒ vz ∼
δ
Rd
vr (a31)
Substituting Equation (a31) into (a30) yields:
Φδ ∼∫
Rδ
[μ1
(vr
δ
)2
+ 2 μ1
(vr
Rd
)2]dx ∼
∫Rδ
μ1
(vr
δ
)2
dx ∼ μ1δ2
∫Rδ
v2r dx (a32)
Since the scale of a dependent variable is its maximum value in the region of interest, in the boundary
layer we can take u1r to be equal to vr, where u1r is given by Equation (9). Using the relation dx = δ ds,
denoting the wetted area under the droplet by S13, Equation (a32) becomes:
Φδ ∼μ1
δ
∫S13
v2r ds (a33)

Christodoulou et al., 2019 23
A.3 Splashing and droplet-droplet interaction
In their work, Mundo et al [23] and Bolleddula et al. [10] considered that droplet prompt splashing
occurs when:
Oh Re1.25 > 57 (a34)
where Oh and Re are the Ohnesorge and Reynolds numbers of the droplet upon impact, respectively.
In the literature, the empirical criterion (a34) has been used to predict whether splashing occurs when
Opadry coating droplets impact on dry tablets [10]. In cases where we have droplet impact on thin
films, the criterion is different [11]:
Oh–0.4 We > 2100 + 5880 h1.44 (a35)
where h = Hf/D0 and We is the droplet Weber number at impact. In our work, we studied spray
impact where the above criteria (a34, a35) are both met. However, since the above relations are
empirical, further investigation is required to validate them using coating liquids and realistic coating
process parameters (droplet velocities and diameters).
It is reported in the literature that droplet-droplet interaction on the surface of a rigid substrate
can affect the overall film spreading and lead to secondary droplet generation/splashing [30, 21].
We performed Volume-Of-Fluid simulations (Fig. 13) using the commercial software FLUENT [39]
to compare the spreading of two droplets interacting versus a single droplet spreading alone. The
droplets in the VOF simulation were 2.5 mm in diameter (D0) and the points of impact were 2D0
apart. In experiments performed by Barnes et al. [22], it was observed that droplet spacing 2D0
results in maximum probability for secondary splashing during droplet-droplet interaction.
Table 3: Droplet-droplet interaction effect on the wetted area diameter at ti = D0/U0.
Coating Impact Liquid Wetted area diameter (mm)% |Error|
liquid velocity (m/s) Viscosity (cP) 2×Single droplet Two droplets
70 % Glycerol/Water 1.0 35.5 10.10 (2×5.05) 10.05 0.5%
15% OpadryII White PEG 2.5 73.6 11.50 (2×5.75) 11.15 3.0%
10% OpadryII White 5.0 98.0 11.80 (2×5.90) 11.35 3.8%
The results presented in Table 3 show that the droplets collision did not have a significant effect on
the overall spreading since the wetted area diameter of the interacting droplets is very close to the
wetted area diameter of a single spreading droplet multiplied by two at the same characteristic time
ti. The above results indicate that droplet-droplet interactions can be neglected without significantly
sacrificing accuracy in the pharmaceutical coating spraying conditions investigated in this work.
Figure 13: Droplet-droplet interaction on a rigid surface. Volume-Of-Fluid simulation.

Christodoulou et al., 2019 24
A.4 Cylindrical film velocity field scaling analysis
In this section, we use scaling analysis to compare the order of magnitude of the velocity field u1 inside
the spreading films to that of the droplet impact mean velocity (U0). From Equations (25, 26) we get:
u1r =2 r z
Rf Hf
dRf
dt∼ RfHf
Rf Hf
dRf
dt∼ dRf
dt(a36)
u1z = –2 z2
Rf Hf
dRf
dt∼ H2
f
Rf Hf
dRf
dt∼ Hf
Rf
dRf
dt(a37)
To estimate the spreading rate (dRf/dt) one can assume that when a droplet impinges on the film
surface the change in thickness is negligible compared to the wetted area radius increase. Thus, we
have:
dVf = 2 πRf Hf dRf = 2 πRf Hf
dRf
dtti = (1/6) πD3
0 (a38)
where dVf is the change of film volume when a droplet impinges on its surface. Since in the simulation
case studies investigated in this work we have Hf ∼ D0 and ti ∼ D0/U0 we can write:
Rf D0
dRf
dt
D0
U0
∼ D3
0 ⇒dRf
dt∼ D0
Rf
U0 << U0 (a39)
Substituting Equation (a39) into (a36) and (a37) gives:
u1r
U0
∼ D0
Rf
<< 1 (a42)
u1z
U0
∼(
D0
Rf
)2<< 1 (a41)
By comparing the vertical and radial velocity components inside each spreading film we get:
u1z << u1r << U0 (a42)
Notice that at the very first stages of the spray application, Rf∼Hf∼D0 and thus the velocity inside
the spreading film and the droplet impact velocity U0 have the same order of magnitude. In our
simulations, the time interval over which this condition holds is very short compared to that over
which the tablet is sprayed. For most of the time we have D0/Rf << 1 and consequently the order
of magnitude of the droplet impact velocity is significantly larger than the one of the velocity field u1
inside each cylindrical film.
A.5 Drop on film
Equation (31) in Section 2.2 and Equation (a42) in the Appendix Section A.4 suggest that the
vertical velocity in the droplet-film boundary layer during merging is significantly smaller than the
impact velocity (U0). To further support this, we performed CFD Volume-Of-Fluid simulations using
FLUENT [39] (Fig.14).
Impinging
droplet
Film
Figure 14: Vertical to the solid substrate velocity component during water droplet impingement ona film (Re = 250, U0 = 1m/s, D0 = 2.5mm, μ1 = 10 cP, ρ1 = 1000 kg/m3). VOF simulation.

Christodoulou et al., 2019 25
The results confirm that there is at least an order of magnitude difference between U0 (≈ 1 m/s) and
the vertical velocity close to the droplet-film interface (u1z < 0.1 m/s). It is therefore reasonable then
to assume that at the droplet-film boundary layer the kinetic energy is converted almost entirely into
pressure energy and the pressure (p1) in Equation (35) can be expressed as: p1 = (1/2) ρ1 U2
0.
References
[1] S.C. Porter, Coating of pharmaceutical dosage forms, In: Allen, L.V.E.A., Remington the Science andPractice of Pharmacy, Pharmaceutical Press, London, 977 (2012).
[2] L.A., Felton, Mechanisms of polymeric film formation, International journal of pharmaceutics, 457(2), 423(2013).
[3] G.C. Cole, Introduction and overview of pharmaceutical coating, Pharmaceutical coating technology, 1, 1(1995).
[4] G.L. Amidon, P.I Lee, and E.M. Topp, Transport processes in pharmaceutical systems, CRC Press (1999).
[5] A.R. Muliadi, and P.E Sojka, A review of pharmaceutical tablet spray coating, Atomization and Sprays,20(7), (2010).
[6] A. Aliseda, E.J. Hopfinger, J.C Lasheras, D.M. Kremer, A. Berchielli, and E.K. Connolly, Atomization ofviscous and non-Newtonian liquids by a coaxial, high-speed gas jet, Experiments and droplet size modeling,International Journal of Multiphase Flow, 34(2), 161 (2008).
[7] J. Wang, J. Hemenway, W. Chen, D. Desai, W. Early, S. Paruchuri, S.Y. Chang, H. Stamato, and S. Varia,An evaluation of process parameters to improve coating efficiency of an active tablet film-coating process,International journal of pharmaceutics, 427(2), 163 (2012).
[8] M.T. am Ende, and A. Berchielli, A thermodynamic model for organic and aqueous tablet film coating,Pharmaceutical development and technology, 10(1), 47 (2005).
[9] D. Niblett, S. Porter, G. Reynolds, T. Morgan, J. Greenamoyer, R. Hach, S. Sido, K. Karan, and T.Gabbott, Development and evaluation of a dimensionless mechanistic pan coating model for the predictionof coated tablet appearance, International journal of pharmaceutics, 528(1-2), 180 (2017).
[10] D.A. Bolleddula, A. Berchielli and A. Aliseda, Impact of a heterogeneous liquid droplet on a dry surface:Application to the pharmaceutical industry, Advances in colloid and interface science, 159(2), 144 (2010).
[11] G.E. Cossali, M. Marengo, and M. Santini, Single-drop empirical models for spray impact on solid walls:a review, Atomization and Sprays, 15 (2005).
[12] I.V. Roisman, K. Horvat and C. Tropea, Spray Impact: Rim Transverse Instability Initiating FingeringAnd Splash, And Description Of A Secondary Spray, Physics of Fluids 18,10 (2006).
[13] A.L.N. Moreira, A.S. Moita and M.R Panao, Advances and challenges in explaining fuel spray impingement:How much of single droplet impact research is useful?, Progress in energy and combustion science, 36(5),554 (2010).
[14] S.E. Bechtel, D.B. Bogy, and F.E. Talke, Impact of a liquid drop against a flat surface, IBM Journal ofResearch and Development, 25(6), 963 (1981).
[15] H.Y. Kim, and J.H. Chun, The recoiling of liquid droplets upon collision with solid surfaces, Physics offluids, 13(3), 643 (2001).
[16] I.V. Roisman, B. Prunet-Foch, C. Tropea, and M. Vignes-Adler, Multiple drop impact onto a dry solidsubstrate, Journal of colloid and interface science, 256(2), 396 (2002).
[17] P. Attane, F. Girard and V. Morin, An energy balance approach of the dynamics of drop impact on a solidsurface. Physics of Fluids, 19,1 (2007).
[18] K.Z.K. Shaari, Coating Uniformity on a Pharmaceutical Tablet: An Experimental Study and Finite VolumeModeling of Droplet Impact Behaviour, PhD thesis, Morgantown, West Virginia, United States (2007).

Christodoulou et al., 2019 26
[19] C. Christodoulou, E. Sorensen, S. Garcıa-Munoz, and L. Mazzei, Mathematical modelling of waterabsorption and evaporation in a pharmaceutical tablet during film coating, Chemical Engineering Science,175, 40 (2018).
[20] A.L. Yarin and D.A. Weiss, Impact of drops on solid surfaces: self-similar capillary waves, and splashingas a new type of kinematic discontinuity, Journal of Fluid Mechanics, 283, 141 (1995).
[21] D. Kalantari and C. Tropea, Spray impact onto flat and rigid walls: Empirical characterization andmodelling, International Journal of Multiphase Flow, 33(5), 525 (2007).
[22] H.A. Barnes, Y. Hardalupas, A.M.K.P. Taylor and J.H. Wilkins, An investigation of the interaction betweentwo adjacent droplets, ILASS-Europe (1999).
[23] C.H.R. Mundo, M. Sommerfeld and C. Tropea, On the modelling of liquid sprays impinging on surfaces,Atomization and sprays, 8(6), (1998).
[24] S.H. Lee, and H.S. Ryou, Development of a new model and heat transfer analysis of impinging diesel sprayson a wall, Atomization and Sprays, 11(1), (2001).
[25] G.K. Batchelor, An introduction to fluid dynamics, Cambridge university press (2000).
[26] Process Systems Enterprise Ltd. gPROMS User Guide, Release 5.0.2. London, UK, (2018).
[27] J. Madejski, Solidification of droplets on a cold surface, International Journal of Heat and Mass Transfer,19(9), 1009 (1976).
[28] M. Pasandideh-Fard, Y.M. Qiao, S. Chandra, and J. Mostaghimi, Capillary effects during droplet impacton a solid surface, Physics of fluids, 8(3), 650 (1996).
[29] R. Kumar, B. Freireich, and C. Wassgren, DEM-compartment-population balance model for particle coatingin a horizontal rotating drum, Chemical Engineering Science, 125, 144 (2015).
[30] C. Tropea and I.V. Roisman, Modeling of spray impact on solid surfaces, Atomization and sprays, 10(3-5),(2000).
[31] A. Saltelli, P. Annoni, I. Azzini, F. Campolongo, M. Ratto, and S. Tarantola, Variance based sensitivityanalysis of model output, Design and estimator for the total sensitivity index. Computer PhysicsCommunications, 181(2), 259 (2010).
[32] A. Bisighini, G.E. Cossali, C. Tropea and I.V. Roisman, Crater evolution after the impact of a drop ontoa semi-infinite liquid target, Physical Review E, 82(3), 036319 (2010).
[33] A.M. Agrawal, and P. Pandey, Scale Up of Pan Coating Process Using Quality by Design Principles,Journal of pharmaceutical sciences, 104(11), 3589 (2015).
[34] J. C. Slattery, L. Sagis, and E. Oh, Interfacial Transport Phenomena, Springer (2007).
[35] P. Grinfeld, Introduction to Tensor Analysis and the Calculus of Moving Surfaces, Springer (2013).
[36] P. Cermelli, E. Fried, and M. E. Gurtin, Transport relations for surface integrals arising in the formulationof balance laws for evolving fluid interfaces, Journal of Fluid Mechanics, 544, 339 (2005).
[37] J. M. Delhaye, Jump conditions and entropy sources in two-phase systems. Local instant formulation,International Journal of Multiphase Flow, 1, 395 (1974).
[38] R. B. Bird, W. E. Stewart, and E. N. Lightfoot, Transport Phenomena, Wiley (2007).
[39] Fluent, A.N.S.Y.S., Ansys Fluent, Academic Research, Release, 18 (2017).