Embed Size (px)
Citation preview

8';
Chapter 6
MATHEMATICAL SCIENCE FACULTY IN TWO-YEAR COLLEGES
This chapter describes the number, educational qualifica-tions, professional activities, and selected personal character-istics of two-year college mathematical science faculty. It in-cludes profiles of the age, sex, and ethnic composition of these faculty and a flow chart of mobility into, within, and out of two-year college teaching positions.
Summary of Major Results
In Fall 1975 there were 5,944 full-time and 3,411 part-time mathematical science faculty in two-year colleges. Both the num-ber and characteristics of these faculty are substantially chang-ed from 1970.
--From 1970 to 1975 the full-time faculty increased by 22% and the part-time faculty increased by 54%.
--The number of mathematics enrollments per FTE faculty member increased from 104 to 123, an 18% increase.
--The number of full-time two-year college mathematical science faculty holding doctorates more than doubled, to 11% of the total.
--Only 4% of the two-year college mathematical science faculty are over 60 years of age, with the median age 40 years.
--Women now constitute 21% of the full-time faculty and they are concentrated largely in the younger age cate-gory.
--About 8% of full-time faculty are minority -- equally divided among Orientals, Hispanics, and Blacks.

88
--The most common sources of new full-time two-year college mathematical science faculty are graduate school, secon-dary teaching, and part-time two-year college positions.
The data supporting each of these major findings are pre-sented in greater detail later in this chapter. When interpret-ing the results one should keep in mind that data are national estimates for two-year colleges based on responses from a strati-fied sample of 93 institutions. Because private colleges repre-sent only 5% of total two-year college enrollment and the sample of these schools was small, data are often presented for all col-leges or for public colleges alone.
General Information on Two-Year College Faculty
The 1975 study of the mathematical sciences in two-year col-leges revealed striking recent changes in the number, qualifica-tions, teaching responsibilities, and personal characteristics of the faculty. But proper interpretation of those changes must take into account the overall pattern of faculty growth in two-year colleges. While there is no regular comprehensive survey of two-year college faculty characteristics, the data collected in Table 6.1 give a useful backdrop for mathematical science faculty pat-terns mentioned above and elaborated in later sections of this chapter. In addition to data supplied by Table 6.1 it is known that in 1974-75 women comprised 32.7% of public and 44.1% of pri-vate two-year college faculty [OJ.
It appears that since 1970 the total faculty in two-year col-leges has grown more substantially than has the mathematical sci-ence faculty. The growth has been mainly concentrated in part-time faculty appointments which now outnumber full-time positions. If anything, mathematical science departments appear to have re-sisted the pressure toward greater numbers of part-time faculty, perhaps because the part-time staff of two-year colleges is heav-ily involved in the varied non-degree credit programs. Not sur-prisingly, the number of students per faculty member has increased in two-year colleges overall, about 18%, or essentially the in-crease in student load of the mathemtatical science faculty.
Numbers of Mathematical Science Faculty
The Fall 1970 CBMS survey estimated that two-year colleges employed 4,879 full-time and 2,213 part-time mathematical sciences
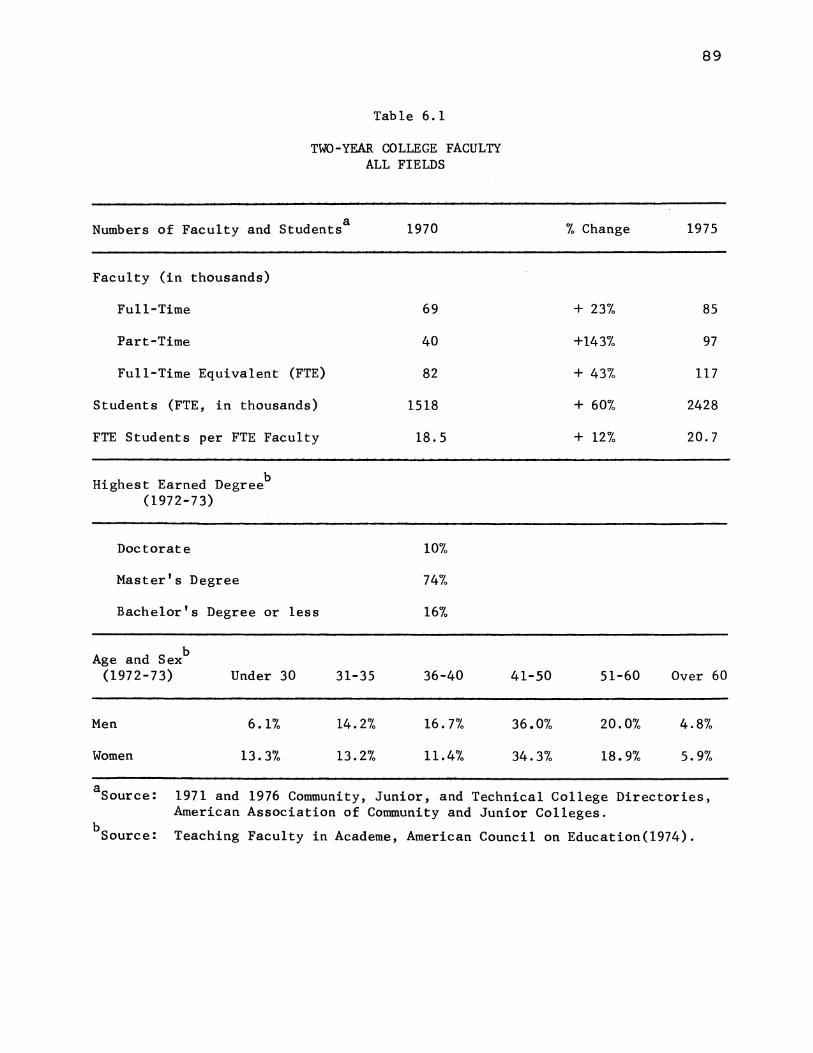
Table 6.1
TWO-YEAR COLLEGE FACULTY ALL FIELDS
a Numbers of Faculty and Students
Faculty (in thousands)
Full-Time
Part-Time
Full-Time Equivalent (FTE)
Students (FTE, in thousands)
FTE Students per FTE Faculty
Highest Earned Degreeb (1972-73)
Doctorate
Master's Degree
Bachelor's Degree or less
b Age and Sex (1972-73)
Men
Women
Under 30
6.1%
13.3%
31-35
14.2%
13.2%
1970
69
40
82
1518
18.5
10%
74%
16%
36-40
16.7%
11.4%
89
% Change 1975
+ 23% 85
+143% 97
+ 43% 117
+ 60% 2428
+ 12% 20.7
41-50 51-60 Over 60
36.0% 20.0% 4.8%
34.3% 18.9% 5.9%
aSource: 1971 and 1976 Community, Junior, and Technical College Directories, American Association of Community and Junior Colleges.
b Source: Teaching Faculty in Academe, American Council on Education(1974).

90
faculty. By Fall 1975 the full-time faculty had increased 22% to 5,944 and the part-time faculty had increased by 54% to 3,411. Employing the usual estimation procedure that counts part-time loads as one-third of full-time yields a 1975 total of 7,081 full-time equivalent mathematical science faculty members, an increase of 26% over 1970, as compared with no growth at all in four-year institutions. Although 26% is a substantial increase in FTE fac-ulty, in the same time period mathematics enrollments increased by 50010.
The most striking feature of Table 6.2 is the 18% increase in enrollments per FTE faculty member since 1970. Reversing a promising change from 1966 to 1970, it appears that the average two-year college mathematical science faculty member has assumed responsibility for 19 additional students. Typical credit-hour teaching loads have not changed since 1970, so the increase in en-rollments must be reflected in greater class size. A similar pat-tern of increased teaching loads has been observed in universities
Faculty Size
Full-Time
Part-Time
FTE
Table 6.2
TWO-YEAR COLLEGE MATHEMATICAL SCIENCE FACULTY GROWTH: 1966-1975
1966 1970 Change
2677 4879 +82%
1318 2213 +68%
3116 5617 +80%
Mathematics Enrollments 348 584 (in thousands) +68%
Enrollments per FTE 112 104 - 7%
1975 Change
5944 +22%
3411 +54%
7081 +26%
874 +5070
123 +1870

91
and four-year colleges, prompting the American Mathematical Soci-ety Council to express its concern in a "Statement on Teaching Loads and Class Size" in January 1976 [QJ.
Educational Qualifications of Mathematical Science Faculty in Public Two-Year Colleges
The enrollment data in Chapter 5 show that teaching respon-sibilities of two-year college mathematical science faculty are divided among remedial (4~1o of total enrollment), pre-calculus and calculus (26%), and elementary service courses (3~1o). Nearly three quarters of all enrollments are below the level of calculus. There is no clear consensus on the appropriate educational and experience preparation for this type of teaching assignment. The data presented in this section stress formal qualifications of two-year college mathematical science faculty -- primarily because they are the only easily obtained measures of quality. Emphasis is on public college data since responses from private colleges were too sparse to produce reliable estimates.
The 1970 CBMS survey report noted significant increases from 1966 in the level of educational qualifications of public two-year college mathematical science faculty. Between 1970 and 1975 there were similar changes
--The number of doctorates is up to nearly 11% of all mathematical science faculty:
--The decline in master's degree holders equalled the doctorate increase and the percent of bachelor's degree holders remained essentially constant.
Table 6.3 gives the details of each pattern.
The apparent sharp drop in two-year college faculty holding master's degree plus one year status has several possible explana-tions. There is evidence from mobility data presented later, and corroborating AMS survey data, that roughly 40 two-year college faculty members completed doctorates during 1975 -- a pattern which, if extrapolated over the five-year period back to 1970, might account for a quarter of the change. Another factor is the inclusion in the 1975 survey of a new degree category "Master's Degree (special program) to cover such degrees as Master of Arts

92
Degree
Doctorate
Table 6.3
HIGHEST DEGREES OF FULL-TIME PUBLIC TWO-YEAR COLLEGE MATHEMATICAL SCIENCE FACULTY
1970
4.5%
Master's Plus 1 Year 46.7%
Master's 42.2%
Bachelor's 6.6%
1975
10.8%
34.8%
47.4%
7.0%
in Teaching. As Table 6.4 shows, this response covered l~fo of two-year college faculty and there is a good chance that many in this category have advanced work in addition to the master's degree.
Highest Degree
Doctor's
Master's + 1 yr.
Master's
Master's (Special Program)
Bachelor's
Total
Table 6.4
EDUCATIONAL QUALIFICATIONS OF FULL-TIME PUBLIC TWO-YEAR COLLEGE MATHEMATICAL SCIENCE FACULTY, 1975
Computer Mathematics Other Mathematics Statistics Science Education Fields
240 274 90
1521 33 19 287 87
1314 28 447 283
404 76 101
192 32 168
3671 33 47 1116 729
Total
604
1947
2072
581
392
5596

93
The data of Table 6.4 are national estimates, in some cells based on very small raw data counts. One must exercise great cau-tion when interpreting the small numbers, but various aggregates .of cell entries provide interesting insight into the character-istics of two-year faculty.
Table 6.5 shows that since 1970 the fraction holding their highest degree in mathematics education has dropped from 25% to 20%. Concurrently, the fraction of two-year mathematical science faculty holding higest degree in a non-mathematical field has in-creased from 9% to 13%.
Table 6.5
FIELD OF HIGHEST LEVEL OF TRAINING OF FULL-TIME PUBLIC TWO-YEAR COLLEGE MATHEMATICAL SCIENCE FACULTY, 1970-1975
Field of Highest Degree 1970
Mathematical Sciences 66%
Mathematics Education 25%
Other 9%
1975
67%
20%
13%
From 1970 to 1975 growth in part-time mathematical science faculty (54%) greatly outstripped growth in full-time faculty (22%). Economic uncertainty during this period may be respon-sible for some of the disparity between growth rates. The gen-erally depressed mathematics job market has focused attention on the increasing use of part-time faculty, making survey of their characteristics particularly timely.
Table 6.6 reveals a general decline in the educational qual-ifications of part-time faculty. The percent of doctorates is more than cut in half, while the number holding bachelor's degrees has increased to one in six. The total of all master's degrees is up slightly over 1970, with the new category "Master's Degree (spe cia1 program)" probably accounting for the differences. A more detailed breakdown of the level and major field for the part-time faculty degrees is given in Table 6.7.

94
Table 6.6
HIGHEST DEGREES HELD BY PART-TIME MATHEMATICAL SCIENCE FACULTY IN PUBLIC TWO-YEAR COLLEGES
Type of Degree 1970
Doctorate \." 9.5%
Master's Plus 1 Year 31.0%
Master's
Bachelor's
Highest Degree
Doctor's
Master's + 1 yr.
Master's
Master's (Special Program)
Bachelor's
Total
45.5%
14.0%
Table 6.7
EDUCATIONAL QUALIFICATIONS OF PART-TIME PUBLIC TWO-YEAR COLLEGE MATHEMATICAL SCIENCE FACULTY, 1975
Computer Mathematics Other Mathematics Statistics Science Education Fields
61 25 42
626 7 3 230 116
761 40 54 359 206
137 45 31
351 12 46 137
1936 47 69 705 532
1975
3.9%
29.9%
49.6%
16.6%
Total
128
982
1420
213
546
3289

95
It is interesting to note that the number of part-time fac-ulty with degrees in non-mathematical fields has declined while among full-time faculty the reverse was noted. A similar rever-sal can be seen for mathematics education.
Table 6.8
FIELD OF HIGHEST LEVEL OF TRAINING OF PART-TIME PUBLIC TWO-YEAR COLLEGE MATHEMATICS FACULTY, 1970 AND 1975
Field of Highest Degree 1970
Mathematical Sciences 62%
Mathematics Education 15%
Non-mathematical Fields 23%
(Columns may not add to 100% due to rounding)
Age, Sex, and Ethnic Group of Public Two-Year College Mathematical Science Faculty
1975
62%
21%
16%
Age distributions are of course very important to anyone attempting to forcast job opportunities in two-year college math-ematics faculty. Sex and ethnic-group distributions are basic to assessing the influence of affirmative action legislation on hir-ing, as well as having intrinsic interest. We begin by consider-ing age distributions.
A brief look at Table 6.9 shows that the two-year college mathematics faculty is young, with nearly half (4~fo) of the fac-ulty under 40 years, although not as young as faculty in four-year colleges and universities. Given the explosive growth of two-year colleges during the last decade, a young faculty is to be expected. The fact that only 4% of the full-time faculty is 60 or more years of age shows that we can expect only about 50 jobs per year for the next five years due to retirement alone. We shall say more about this when considering faculty employment and mobility in a later section.
Table 6.10, showing a distribution of faculty by degree and age, contains few surprises.

96
Percent of Total
Table 6.9
AGE PROFILE OF FULL-TIME PUBLIC TWO-YEAR COLLEGE MATHEMATICAL SCIENCE FACULTY, FALL 1975
Under 30 30-34 35-39 40-44 45-49 50-54
9% 18% 20% 15% 13% 13%
Table 6.10
55-59
8%
DISTRIBUTION BY DEGREE AND AGE FOR FULL-TIME PUBLIC TWO-YEAR COLLEGE MATHEMATICAL SCIENCE FACULTY, FALL 1975
Under 30 30-34 35-39 40-44 45-49 50-54 55-59
Master's Degree 9% 18% .20% 14% 13% 13% 8%
Doctor's Degree 6% 28% 19% 14% 17% 7% 4%
And 60 Over
4%
And 60 Over
4%
5%
The survey shows that women now constitute 21% of the full-time faculty, a figure which is consistent with data from the 1975 AMS Survey [MJ. The later survey indicates that women as a frac-tion of full-time faculty grew by 2% in a one year period! It is thus to be expected that the percent of the female faculty under 30 years of age would be large, as indicated in Table 6.11.
The 1975 survey marks the first time that CBMS has tried to gather information on the ethnic composition of two-year college mathematical science faculties. As in four-year institutions, only 8% of the full-time two-year faculty belong to ethnic min-orities. For the 670 faculty reported by responding institutions~ the ethnic distribution is g'iven in Table 6.12.

Men
Women
(Rows may
Table 6.11
DISTRIBUTION BY AGE AND SEX OF FULL-TIME PUBLIC TWO-YEAR COLLEGE MATHEMATICAL SCIENCE FACULTY, 1975
Under 30 30-34 35-39 40-44 45-49 50-54 55-59
5% 19% 21% 14% 14% 14% 8%
22% 17% 14% 16% 11% 8% 8%
not add t.o 100% due to rounding.)
Table 6.12
DISTRIBUTION BY ETHNIC GROUP OF FULL-TIME PUBLIC TWO-YEAR COLLEGE MATHEMATICAL SCIENCE FACULTY, 1975
Ethnic Group Fraction of Total
Caucasian 92%
Oriental 2%
Hispanic 3%
Black 3%
97
And 60 Over
5%
5%
Full description of the age distribution for ethnic minority faculty was not possible, owing to small raw data entries in most cells of the detailed table. But Table 6.13 gives an aggregated distribution showing that minority faculty tend to be somewhat younger than the average two-year college mathematics faculty member.

98
Table 6.13
AGE DISTRIBUTION OF ETHNIC MINORITIES ON TWO-YEAR PUBLIC COLLEGE MATHEMATICAL SCIENCE FACULTIES, 1975
Percent of all Minorities
Under 35
44%
35-44 45-59
33% 20%
60 and over
3%
The Mathematical Science Faculty in Private Two-Year Colleges
In Fall 1975 the number of mathematical science faculty in private two-year college was 348, down 17% from 421 in 1970. The number of part-time faculty was 122, down 4~fo from 205 in 1970. These figures combine to yield a decline in fu11-time-equiva1ent faculty from 489 in 1970 to 389 in 1975, a 2~fo decrease. Over the same time period mathematical science enrollments declined by l~fo from 50,000 to 45,000. The total number of existing private two-year colleges and the total number of faculty in private two-year colleges also declined, by 11% and ~fo respectively. However, the total number of students in private two-year colleges actually increased by l~fo over the same period. These patterns of change are detailed in Table 6.14. As previously noted, private college responses to more detailed faculty questions yielded numbers in sample cells regarded as too small to justify extrapolation to national totals on any fine structure basis.
Faculty Employment and Mobility
This section reports the sources of new full-time faculty members in two-year college mathematics departments for the year 1975-76 and the destinations of those who left two-year college positions at the end of the academic year 1974-75. Combining the two types of information one can estimate the increase in faculty for the year 1975-76 and get another perspective on the charac-teristics of two-year faculty.
Comparison of Tables 6.15 and 3.24 shows that the sources of two-year college faculty are quite different from those of

99
Table 6.14
FACULTY AND ENROLLMENTS IN PRIVATE TWO-YEAR COLLEGES
1970 1971 Change
Mathematics Faculty
Full-Time 421 348 -17%
Part-Time 205 122 -40%
FTE 489 389 -20%
Total Faculty (All Fields)* 9377 8677 -7%
Mathematical Science Enrollments 50,000 45,000 -10%
Total Enrollments* 134,000 148,000 +10%
*Sources: AACJC o Community, Junior, and Technical College Directory, 1971, 1976 [P].
four-year and university faculty. Nearly one-fifth (l~~) of the new two-year faculty in 1975 carne from secondary school positions. In 1970 the comparable figure was l~~. It thus appears that high schools are continuing to be a strong source o·f new full-time two-year college faculty. Data from the 1975 AMS survey [M] confirm this picture, suggesting that almost one-half of current two-year f~culty have taught at some time in secondary schools. Graduate school and part-time positions in two-year colleges are the other major suppliers of new two-year faculty. However, the graduate school share of 33% is down from 44% in 1970 and the part-time to full-time share of 16% is up from 4% in 1970.
Of the individuals who left two-year colleges for reasons other than death or retirement, nearly all returned to graduate schools.
The combination of tables 6.15 and 6.16 yields a net gain of 174 full-time faculty for 1975-76. From Fall 1970 to Fall 1975,
100
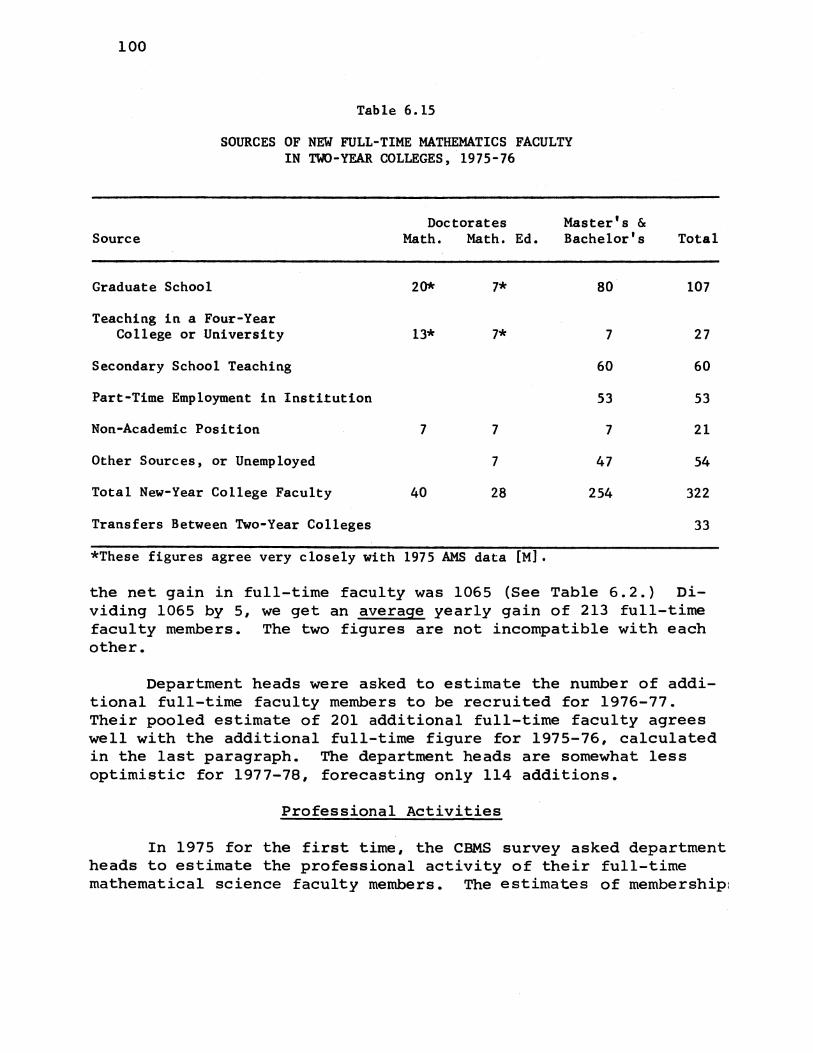
Table 6.15
SOURCES OF NEW FULL-TIME MATHEMATICS FACULTY IN TWO-YEAR COLLEGES, 1975-76
Doctorates Master's & Source Math. Math. Ed. Bachelor's
Graduate School 20* 7* 80
Teaching in a Four-Year College or University 13* 7* 7
Secondary School Teaching 60
Part-Time Employment in Institution 53
Non-Academic Position 7 7 7
Other Sources, or Unemployed 7 47
Total New-Year College Faculty 40 28 254
Transfers Between Two-Year Colleges
*These figures agree very closely with 1975 AMS data [M].
Total
107
27
60
53
21
54
322
33
the net gain in full-time faculty was 1065 (See Table 6.2.) Di-viding 1065 by 5, we get an average yearly gain of 213 full-time faculty members. The two figures are not incompatible with each other.
Department heads were asked to estimate the number of addi-tional full-time faculty members to be recruited for 1976-77. Their pooled estimate of 201 additional full-time faculty agrees well with the additional full-time figure for 1975-76, calculated in the last paragraph. The department heads are somewhat less optimistic for 1977-78, forecasting only 114 additions.
Professional Activities
In 1975 for the first time, the CBMS survey asked department heads to estimate the professional activity of their full-time mathematical science faculty members. The estimates of membership:

Table 6.16
FULL-TIME MATHEMATICS FACULTY LEAVING TWO-YEAR COLLEGES, 1975-76
Reason for Leaving
Death or Retirement
Teaching in a Four-Year College or University
Non-Academic Position
Secondary School Teaching
Returned to Graduate School
Other, or Unemployed
Total Leaving Two-Year Colleges
Doctorates Math. Math. Ed.
7
7
Master's & Bachelor's
80
7
47
7
141
10]
Total
87
7
47
7
148
in professional organizations, given in Table 6.17, agree very closely with data available from at least two of the organizations (MAA and NCTM) •
Table 6.17
ESTIMATED MEMBERSHIPS OF FULL-TIME TWO-YEAR COLLEGE MATHEMATICS FACULTY IN PROFESSIONAL ORGANIZATIONS, 1975-76
STATE STATE CITY Organization NCTM MAA AMS SIAM AFFILIATE ORGAN. ORGAN.
AMATYC
Percent of Faculty
Belonging 29% 25% 5% 2% 17% 22% 4%
OTHER ORGAN.
9%

102
It is clear from Table 6.17 that no single professional organization has captured the interest and loyalty of two-year college mathematics faculty. Of the organizations listed, the first five are known to regularly publish a journal. Even assum-ing that the memberships of the five are pairwise disjoint, it is then estimated that at least 22% of all full time faculty do not regularly receive a professional journal devoted to mathe-matics or mathematics education. Additional information on pro-fessional activities of two-year college mathematical faculty is given in Table 6.18.
Table 6. 18
PROFESSIONAL ACTIVITIES OF FULL-TIME TWO-YEAR COLLEGE MATHEMATICS FACULTY, 1975-76
Activity Percent of Faculty
Engaging in Activity
1. Attendance at at least one mathematics conference per year
2. Taking additional graduate mathematics courses during the year or summer
3. Giving talks on mathematics at conferences
4. Giving talks on mathematics education at conferences
5. Regular reading of journal articles on mathematics
6. Regular reading of journal articles on mathematics education
7. Writing journal articles on mathematics
8. Writing journal articles on mathematics education
9. Writing textbooks
47%
21%
9%
9%
47%
47%
5%
5%
15%
The like responses to 3 and 4, 5 and 6, and 7 and 8 suggest the possibility that mathematics and mathematics education were not sep~rated by respondents.