Embed Size (px)
Citation preview
Maturation of human central auditory system activity:separating auditory evoked potentials by dipole source modeling
Curtis Pontona,b,*, Jos J. Eggermontc,d, Deepak Khoslae, Betty Kwonga, Manuel Dona
aElectrophysiology Laboratory, House Ear Institute, 2100 West Third Street, Los Angeles, CA 90057, USAbNeuroscan Labs, 5700 Cromo Drive, El Paso, TX 79912, USA
cDepartment of Physiology and Biophysics, University of Calgary, Calgary, CanadadDepartment of Psychology, University of Calgary, Calgary, Canada
eHRL Laboratories, LLC 3011 Malibu Canyon Road, Malibu, CA 90265, USA
Accepted 30 November 2001
Abstract
Objectives: Previous studies have shown that observed patterns of auditory evoked potential (AEP) maturation depend on the scalp
location of the recording electrodes. Dipole source modeling incorporates the AEP information recorded at all electrode locations. This
should provide a more robust description of auditory system maturation based on age-related changes in AEPs. Thus, the purpose of this
study was to evaluate central auditory system maturation based dipole modeling of multi-electrode long-latency AEPs recordings.
Methods: AEPs were recorded at 30 scalp-electrode locations from 118 subjects between 5 and 20 years of age. Regional dipole source
analysis, using symmetrically located sources, was used to generate a spatio-temporal source model of age-related changes in AEP latency
and magnitude.
Results: The regional dipole source model separated the AEPs into distinct groups depending on the orientation of the component dipoles.
The sagittally oriented dipole sources contained two AEP peaks, comparable in latency to Pa and Pb of the middle latency response (MLR).
Although some magnitude changes were noted, latencies of Pa and Pb showed no evidence of age-related change. The tangentially oriented
sources contained activity comparable to P1, N1b, and P2. There were various age-related changes in the latency and magnitude of the AEPs
represented in the tangential sources. The radially oriented sources contained activity comparable to the T-complex, including Ta, and Tb,
that showed only small latency changes with age. In addition, a long-latency component labeled TP200 was observed.
Conclusions: It is possible to distinguish 3 maturation groups: one group reaching maturity at age 6 and comprising the MLR components
Pa and Pb, P2, and the T-complex. A second group that was relatively fast to mature (50%/year) was represented by N2. A third group was
characterized by a slower pattern of maturation with a rate of 11–17%/year and included the AEP peaks P1, N1b, and TP200. The observed
latency differences combined with the differences in maturation rate indicate that P2 is not identical to TP200. The results also demonstrated
the independence of the T-complex components, represented in the radial dipoles, from the P1, N1b, and P2 components, contained in the
tangentially oriented dipole sources. q 2002 Elsevier Science Ireland Ltd. All rights reserved.
Keywords: Auditory evoked potentials; Dipole modeling; Maturation; Human; Children
1. Introduction
Studies of age-related changes in auditory evoked poten-
tials (AEPs) have demonstrated at least 3 features of human
central auditory system maturation. First, maturation rates
are not the same throughout the auditory system (Ponton et
al., 1996a,b). Second, comparisons of maturation rates for
latencies of the different AEP peaks indicate that this activ-
ity must arise from parallel subsystems in the thalamo-corti-
cal pathway, since the early maturing peak P2 has a longer
latency than the more slowly maturing shorter latency N1b
(e.g. Ponton et al., 1996a, 2000a). Third, generators or path-
ways contributing to a single evoked response peak may be
distinguished by very different maturation rates. For exam-
ple, the middle latency response (MLR) peak Pa, appears to
represent the sum of activity from two generators and two
different pathways with very different maturation rates
(McGee and Kraus, 1996).
Almost exclusively, AEP maturation has been assessed by
measuring the age-related changes in latencies and magni-
tudes of peaks at selected scalp electrode locations. However,
when AEPs are sampled by an array of electrodes distributed
across the scalp, it is apparent that the pattern of AEP matura-
tion depends on the location of the recording electrode (e.g.
Clinical Neurophysiology 113 (2002) 407–420
1388-2457/02/$ - see front matter q 2002 Elsevier Science Ireland Ltd. All rights reserved.
PII: S1388-2457(01)00733-7
www.elsevier.com/locate/clinph
* Corresponding author. Tel.: 11-915-845-5600, ext. 28; fax: 11-915-
845-2965.
E-mail address: [email protected] (C. Ponton).
CLINPH 2001068
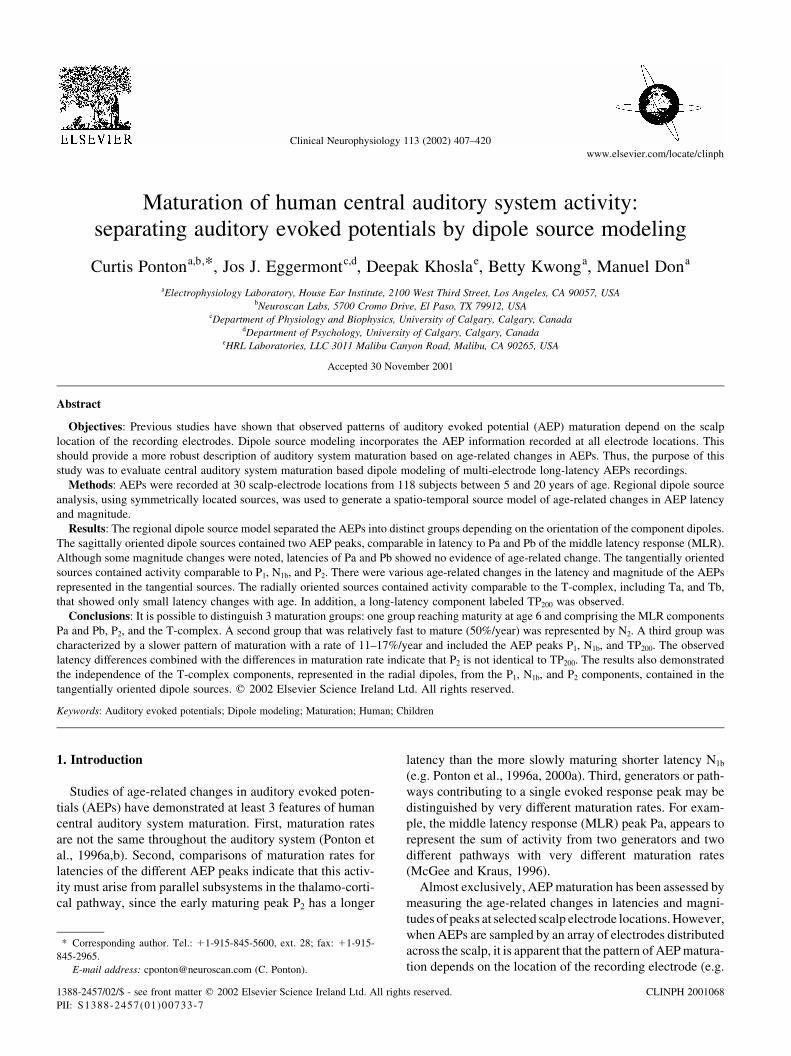
Bruneau et al., 1997; Ponton et al., 2000a). As shown for
electrodes Pz, Cz, and Fz in Fig. 1, age-related changes in
AEP morphology vary significantly even for nearby loca-
tions on the scalp. The variation in AEP maturation as a
function of scalp electrode location reflects the weighted
contribution of activity from different sources, each with
potentially different maturation rates. Electrode-by-elec-
trode AEP analyses may be appropriate when waveform
morphology is relatively constant, but this approach has
significant limitations when the AEPs undergo dramatic
morphological and scalp distribution changes as a function
of the variable of interest; in this case, age. An ideal approach
would provide a maximal separation of maturational changes
per auditory pathway or cortical projection area.
A dipole model of AEP maturation based on activity
recorded from a distribution of electrodes covering large
areas of the scalp may provide a more robust representation
of auditory system maturation. Spatio-temporal source
modeling (STSM), a form of dipole source analysis, takes
into account the scalp distribution and timing of the AEPs at
all electrodes across the entire recording epoch (Scherg and
Von Cramon, 1985, 1986; Achim et al., 1991). Regional
dipole source modeling, a form of STSM described by
Scherg (1990), assumes 3 orthogonally oriented dipoles
with a common location. For AEPs, regional sources are
placed in each hemisphere in order to model the origins of
auditory cortical activity in both the left and the right
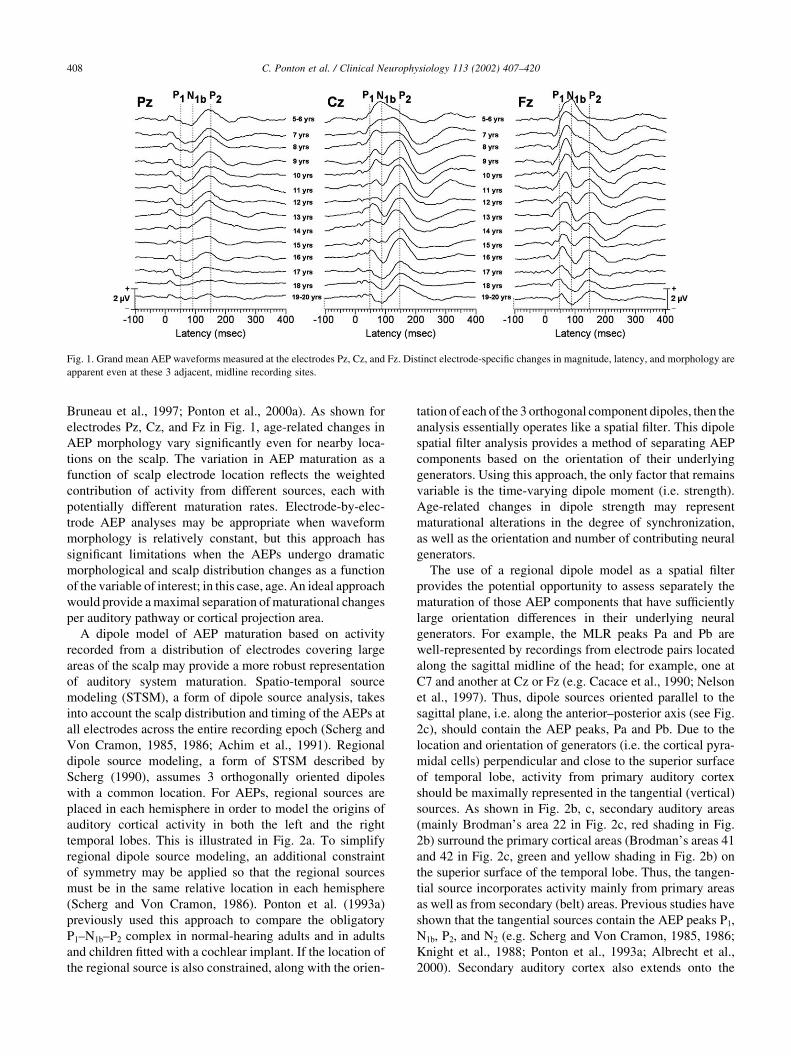
temporal lobes. This is illustrated in Fig. 2a. To simplify
regional dipole source modeling, an additional constraint
of symmetry may be applied so that the regional sources
must be in the same relative location in each hemisphere
(Scherg and Von Cramon, 1986). Ponton et al. (1993a)
previously used this approach to compare the obligatory
P1–N1b–P2 complex in normal-hearing adults and in adults
and children fitted with a cochlear implant. If the location of
the regional source is also constrained, along with the orien-
tation of each of the 3 orthogonal component dipoles, then the
analysis essentially operates like a spatial filter. This dipole
spatial filter analysis provides a method of separating AEP
components based on the orientation of their underlying
generators. Using this approach, the only factor that remains
variable is the time-varying dipole moment (i.e. strength).
Age-related changes in dipole strength may represent
maturational alterations in the degree of synchronization,
as well as the orientation and number of contributing neural
generators.
The use of a regional dipole model as a spatial filter
provides the potential opportunity to assess separately the
maturation of those AEP components that have sufficiently
large orientation differences in their underlying neural
generators. For example, the MLR peaks Pa and Pb are
well-represented by recordings from electrode pairs located
along the sagittal midline of the head; for example, one at
C7 and another at Cz or Fz (e.g. Cacace et al., 1990; Nelson
et al., 1997). Thus, dipole sources oriented parallel to the
sagittal plane, i.e. along the anterior–posterior axis (see Fig.
2c), should contain the AEP peaks, Pa and Pb. Due to the
location and orientation of generators (i.e. the cortical pyra-
midal cells) perpendicular and close to the superior surface
of temporal lobe, activity from primary auditory cortex
should be maximally represented in the tangential (vertical)
sources. As shown in Fig. 2b, c, secondary auditory areas
(mainly Brodman’s area 22 in Fig. 2c, red shading in Fig.
2b) surround the primary cortical areas (Brodman’s areas 41
and 42 in Fig. 2c, green and yellow shading in Fig. 2b) on
the superior surface of the temporal lobe. Thus, the tangen-
tial source incorporates activity mainly from primary areas
as well as from secondary (belt) areas. Previous studies have
shown that the tangential sources contain the AEP peaks P1,
N1b, P2, and N2 (e.g. Scherg and Von Cramon, 1985, 1986;
Knight et al., 1988; Ponton et al., 1993a; Albrecht et al.,
2000). Secondary auditory cortex also extends onto the
C. Ponton et al. / Clinical Neurophysiology 113 (2002) 407–420408
Fig. 1. Grand mean AEP waveforms measured at the electrodes Pz, Cz, and Fz. Distinct electrode-specific changes in magnitude, latency, and morphology are
apparent even at these 3 adjacent, midline recording sites.
lateral surface of superior temporal cortex (Kaas and Hack-
ett, 1998). This lateral surface is approximately perpendicu-
lar to the superior surface of the temporal lobe.
Consequently, radially oriented dipole sources are effec-
tively blind to activity generated by secondary areas located
on the superior surface of the temporal lobe. Thus, the radial
(lateral) dipole sources isolate activity originating from
secondary (parabelt areas) auditory cortical areas on the
lateral surface of the temporal lobe. AEP components
reflected in the radial sources include the T-complex
components Ta and Tb (e.g. Scherg and Von Cramon,
1985, 1986; Knight et al., 1988; Ponton et al., 1993a;
Albrecht et al., 2000). This limited division of activity
from primary and secondary auditory cortical areas into
the tangential and radial sources, respectively, provides an
opportunity to at least partly assess the maturation of AEP
activity originating from each of these areas separately.
The purpose of this study is to describe central auditory
system maturation using age-related changes in AEPs
subjected to regional dipole spatial filtering. Based on the
age-related changes in AEP activity represented in each of
the orthogonal dipole sources, this analysis may distinguish
maturational differences in primary (core) and secondary
(belt and parabelt) cortical areas and the pathways that
dominantly project to these regions. The analyses described
in this study are based on AEP data previously reported by
Ponton et al. (2000a). The subject population and data
collection procedures have been described in Ponton et al.
(2000a), but will be reviewed in detail.
2. Methods
2.1. Subjects
All individuals tested were neurologically normal (no
C. Ponton et al. / Clinical Neurophysiology 113 (2002) 407–420 409
Fig. 2. (a) Shows the regional dipole source model used for analysis in this study. Each regional source consists of 3 orthogonally oriented dipoles. The
orthogonally oriented sources provide a spatial filter of the AEP activity based on orientation. Regional source locations are constrained to be hemispherically
symmetrical. The location of the regional sources is based on the best-fit solution for the group of 18–20-year-old subjects. (b) Represents a schematic of the
core (green area), belt (yellow), and parabelt (red) areas of human auditory cortex. Core and belt areas are located on the superior surface of the temporal lobe.
Parabelt areas extend from the superior surface to the lateral surface of the temporal lobe. (c) Schematically illustrates a coronal section of the temporal lobe
with a superimposed regional dipole source. The tangential, radial, and sagittal component dipoles of the regional source are labeled. Major temporal lobe
landmarks are indicated and areas of Brodman are labeled.
reported head injuries resulting in a loss of consciousness)
with pure-tone thresholds #25 dB HL (ANSI 1989) for the
audiometric frequencies between 0.5 and 8 kHz. Data from
118 subjects representing 137 test sessions are included in
the analyses; 7 subjects were tested twice and 6 subjects
were tested 3 times. At least 1 year elapsed between sessions
for those subjects who were tested on more than one occa-
sion. As shown in Table 1, all subjects were between 5 and
20 years of age. For the generation of grand mean wave-
forms, two 5 year olds and six 6 year olds were combined
into a single group. Six 19 year olds and one 20 year old
were also grouped together. The remaining subjects were
placed in age groups containing only a single year of age.
Subjects 18 years of age and older were considered the adult
reference. Prior to testing, the purpose of the study was
explained to each subject and informed consent was
obtained from older children or from the parent(s) of
younger children.
2.2. Procedure
Auditory stimulation consisted of brief click trains gener-
ated by applying 100 ms voltage pulses to a walkman-style
headphone. Each train consisted of 10 clicks with the inter-
val between the onset of successive clicks fixed at 2 ms.
Thus the total duration of the click train was 18.1 ms. All
subjects tested thus far (children and adults) perceive this
click train as a single acoustic event. The click trains were
presented monaurally to the left ear at approximately 65 dB
nHL, at a rate of 1.3/s.
Subjects were tested while seated in a comfortable reclin-
ing chair in an electrically shielded and sound-attenuated
booth. The subjects were instructed to ignore the auditory
stimuli while the AEPs were recorded. To facilitate compli-
ance, the subjects were encouraged to read, play a hand-held
video game, or watch pre-recorded movies on a television
monitor. Thirty silver/silver chloride electrodes were placed
on the scalp using a conductive water-soluble paste at loca-
tions based on the International 10/20 recording system
(Jasper, 1958). A reference electrode was placed on the
forehead at Fpz, with a ground electrode located 2 cm to
the right and 2 cm up from Fpz. Vertical and horizontal eye
movements were monitored on two differential recording
channels. Electrodes located above and below the right
eye were used to monitor vertical eye movements. Horizon-
tal eye movements were recorded by a pair of electrodes
located on the outer canthus of each eye. The electroence-
phalogram (EEG) was recorded as single epochs, filtered
from either DC or 0.1–300 Hz and sampled at a rate of
1.0 kHz. These individual EEG epochs were stored on a
computer hard disk for off-line processing. Off-line,
single-sweeps were baseline corrected over the pre-stimulus
interval and subjected to an automatic artifact rejection
algorithm. The remaining accepted sweeps (at least 1500)
were corrected for eye movement contamination and aver-
aged. These recordings were then filtered from 1 to 70 Hz
and average referenced. Grand average waveforms were
then generated for each of the 14 age groups described in
Table 1.
2.3. Dipole source analysis
The grand average waveforms for each of the age groups
were imported to the Brain Electric Source Analysis soft-
ware (BESA; MEGIS Software, Munich Germany). The
AEP data were spline interpolated and resampled at
256 Hz thus decimating the original 500 points/channel to
128 points/channel. These data were then band-pass filtered
from 1 to 50 Hz (6 dB/octave rolloff) and subjected to
dipole source modeling.
The dipole source modeling of BESA uses a 4-shell,
spherical head, volume conductor model with an outer
radius of 9 cm. The same volume conductor model was
applied to the AEP data of all subjects. The BESA program
employs a forward-modeling approach in which time-vary-
ing activity for each equivalent dipole source is projected
onto the coordinates of the scalp electrodes. Summing these
projected activities for each electrode location produces a
set of modeled scalp waveforms. The model adjusts para-
meters iteratively using a least-squares regression analysis
to minimize the residual variance between the scalp-
recorded potentials and the modeled waveforms over a
selected epoch by adjusting the dipole source parameters
of location, orientation, and strength.
As outlined in the introduction, the neural activity under-
lying the AEPs was analyzed using a regional dipole spatial
filter analysis, a variation of spatial temporal source model-
ing (Scherg and Von Cramon, 1986). Thus, the constraints
of hemispheric symmetry and fixed location were imposed
on the location of the regional dipole sources. By constrain-
ing these parameters for the spatial filter analysis, the regio-
nal sources were kept in the same relative location in each
hemisphere for all subject groups. Consequently, only the
time-varying dipole moment (i.e. strength) is allowed to
vary in this model.
Dipole source modeling was performed on the grand
mean waveforms of each of the age-based subject groups.
For each group dipole modeling was conducted in two ways.
First, the regional dipole spatial filter analysis was
performed. Second, the assumption that regional source
C. Ponton et al. / Clinical Neurophysiology 113 (2002) 407–420410
Table 1
Age groups and number of subjects
Age 5–6 7 8 9 10 11 12 13 14 15 16 17 18 19–20
N (137) 8 10 11 16 9 10 12 11 11 7 10 7 8 7
location is constant as a function of age was tested. Thus,
best-fit solutions were obtained for the regional dipole
sources by allowing symmetrical movement of the regional
source within each hemisphere.
3. Results
3.1. Dipole source waveforms
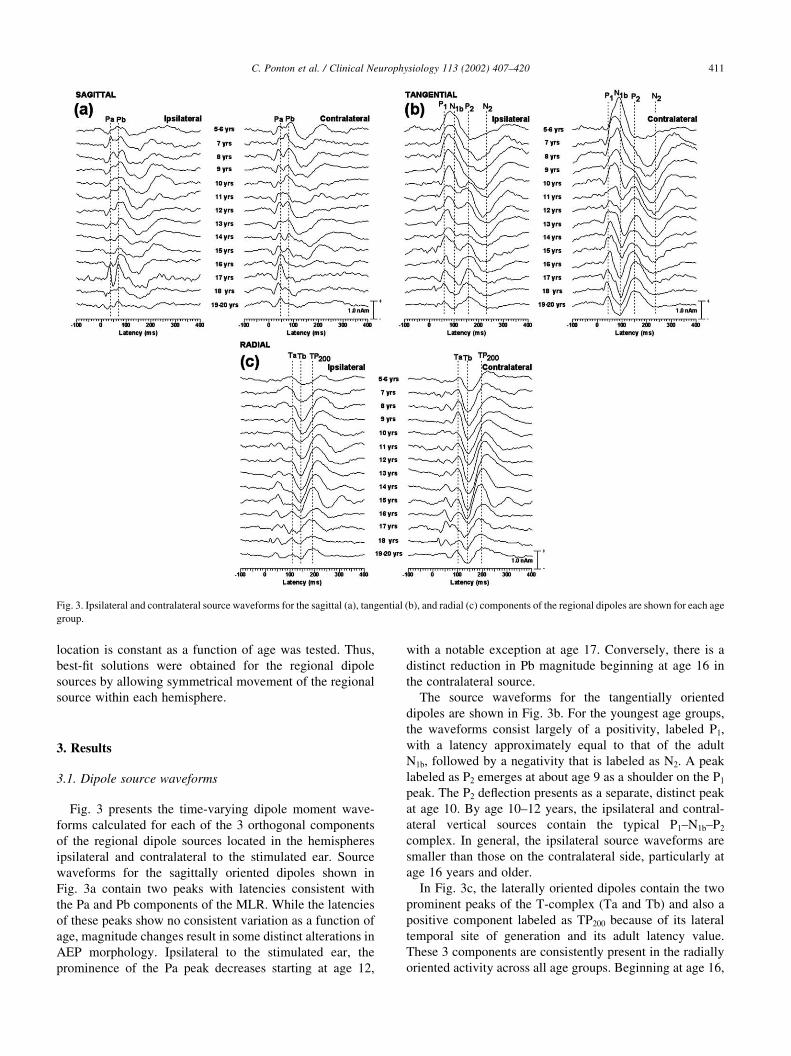
Fig. 3 presents the time-varying dipole moment wave-
forms calculated for each of the 3 orthogonal components
of the regional dipole sources located in the hemispheres
ipsilateral and contralateral to the stimulated ear. Source
waveforms for the sagittally oriented dipoles shown in
Fig. 3a contain two peaks with latencies consistent with
the Pa and Pb components of the MLR. While the latencies
of these peaks show no consistent variation as a function of
age, magnitude changes result in some distinct alterations in
AEP morphology. Ipsilateral to the stimulated ear, the
prominence of the Pa peak decreases starting at age 12,
with a notable exception at age 17. Conversely, there is a
distinct reduction in Pb magnitude beginning at age 16 in
the contralateral source.
The source waveforms for the tangentially oriented
dipoles are shown in Fig. 3b. For the youngest age groups,
the waveforms consist largely of a positivity, labeled P1,
with a latency approximately equal to that of the adult
N1b, followed by a negativity that is labeled as N2. A peak
labeled as P2 emerges at about age 9 as a shoulder on the P1
peak. The P2 deflection presents as a separate, distinct peak
at age 10. By age 10–12 years, the ipsilateral and contral-
ateral vertical sources contain the typical P1–N1b–P2
complex. In general, the ipsilateral source waveforms are
smaller than those on the contralateral side, particularly at
age 16 years and older.
In Fig. 3c, the laterally oriented dipoles contain the two
prominent peaks of the T-complex (Ta and Tb) and also a
positive component labeled as TP200 because of its lateral
temporal site of generation and its adult latency value.
These 3 components are consistently present in the radially
oriented activity across all age groups. Beginning at age 16,
C. Ponton et al. / Clinical Neurophysiology 113 (2002) 407–420 411
Fig. 3. Ipsilateral and contralateral source waveforms for the sagittal (a), tangential (b), and radial (c) components of the regional dipoles are shown for each age
group.
C. Ponton et al. / Clinical Neurophysiology 113 (2002) 407–420412
there is a substantial decrease in the Tb–TP200 peak-to-peak
magnitude in both the contralateral and ipsilateral source
waveforms. A small but consistent early positivity is appar-
ent before Ta, with a latency that is only slightly longer than
that of Pa. Overall, the contralateral sources are larger in
magnitude than the ipsilateral source across all age groups.
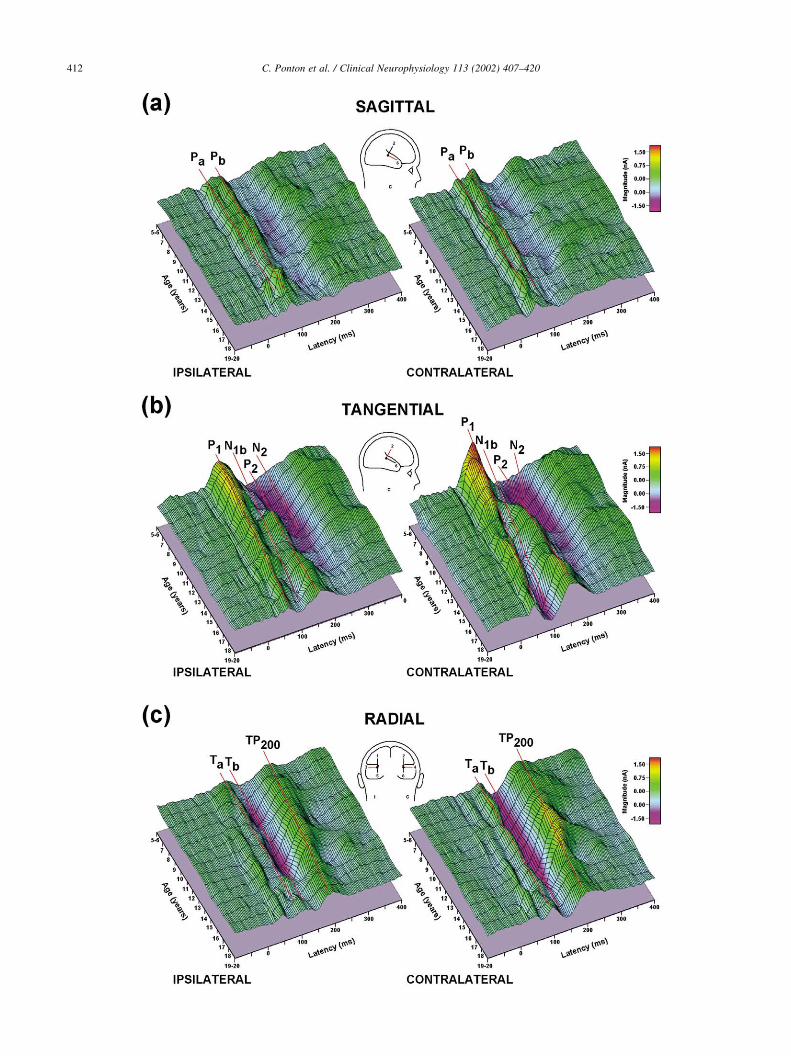
3.2. Surface plot representation
To provide a better representation of the age-related
changes in the AEPs, surface plots of the dipole source
waveforms as a function of age are illustrated in Fig. 4.
The surface plots for the sagittal source waveforms are illu-
strated in Fig. 4a. The MLR peaks Pa and Pb are apparent
both in the surface plots for source waveforms from the
ipsilateral (Fig. 4a, left) and contralateral (Fig. 4a, right)
hemispheres. With the exception of the 17 year olds,
dipole-source strength declines slightly over both hemi-
spheres as a function of age. The surface plots show a better
representation of Pa in the contralateral source and a better
representation of Pb in the ipsilateral source.
As shown in Fig. 4b, the tangentially oriented dipole
source waveforms for 15–20 year olds contain the charac-
teristic P1–N1b–P2–N2 complex. The surface plot representa-
tion of the ipsilateral source waveforms (Fig. 4b, left)
illustrates the more gradual decrease in the P1 magnitude,
a less pronounced N1b, and a smaller P2 compared to those
on the contralateral side (Fig. 4b, right). The surface plot of
the contralateral source waveforms dramatically illustrates
the profound decrease in P1 magnitude and the concomitant
increase in the N1b magnitude. The P2 peak emerges as a
separate deflection at age 10 and its magnitude remains
fairly constant at older ages. The source waveform surface
plots for both hemispheres contain an N2 peak that is more
prominent in younger than older subjects. Unlike previous
interpretations of this peak (e.g. Sharma et al., 1997;
Albrecht et al., 2000), the surface plots clearly show differ-
ences in latencies and developmental time courses between
N2 and N1b.
The surface plots of the radial source waveform shown in
Fig. 4c contain clear representations of the T-complex peaks
Ta and Tb, as well as the TP200. The morphologies of surface
plots for the ipsilateral and contralateral sources appear
nearly identical. The surface plots show only small quanti-
tative differences between ipsilateral and contralateral activ-
ity. Both surface plots contain a positivity with a latency
about equal to that of the adult P1, likely TP41 (Cacace et al.,
1990), followed by the Ta and Tb components and the large
TP200. An age-related decrease in the magnitude of the T-
complex is apparent in both the ipsilateral and contralateral
source waveforms, most notably after age 16.
3.3. Latency changes
As shown in Fig. 5a, the Pa and Pb latencies show little
evidence of change as a function of age. In contrast, P1 and
N1b latencies both decrease with age (Fig. 5b). Exponential
curve fits, superimposed on the latency data and summar-
ized in Table 2, suggest a rate of change of 17%/year for
contralateral P1 and N1b peaks. Similar to Pa and Pb, P2
latency is relatively constant from age 10 onward, whereas
the latency of N2 increases with age (Fig. 5c). The rate of
change for N2 latency (approximately 50%/year) suggests
this peak matures about 3 times faster than P1 and N1b. The
latency of the two components of the T-complex, Ta and Tb,
show little age-dependent latency change. However, the
TP200 peak latency undergoes a gradual latency decrease
with age (Fig. 5d).
3.4. Magnitude changes in source activity
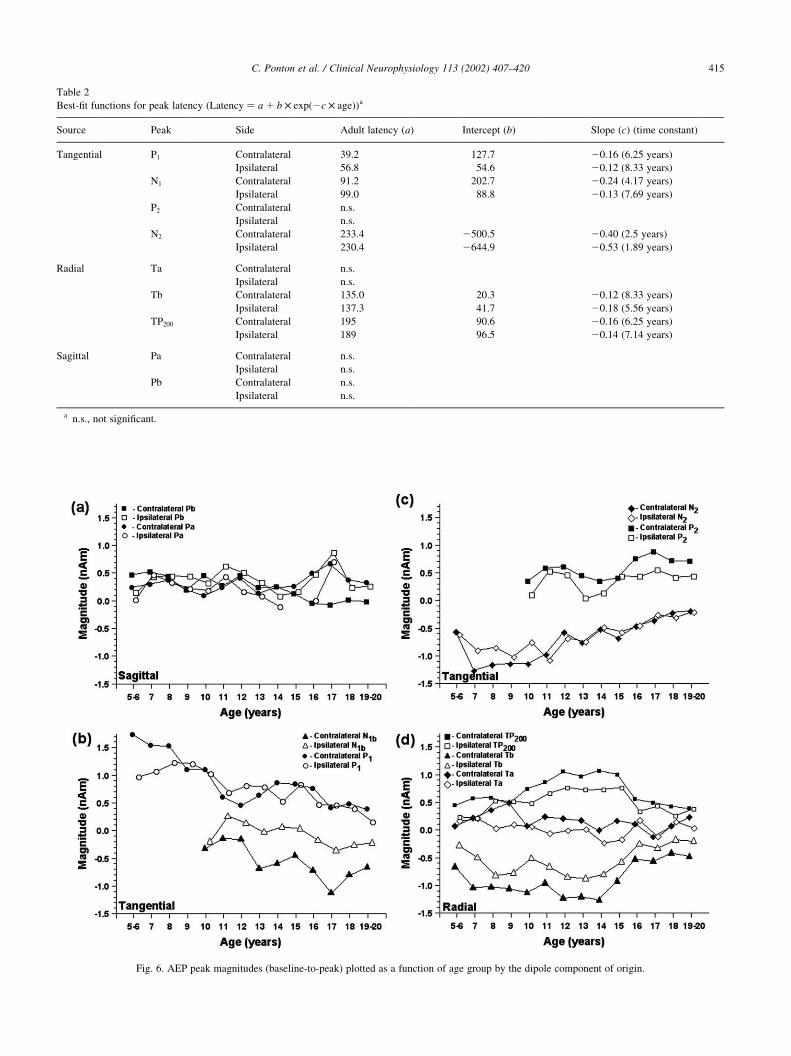
Up to age 15, age-related changes in Pa and Pb magnitude
are similarly small for the ipsilateral and contralateral wave-
forms (Fig. 6a). After age 15, contralateral Pb magnitude
decreases. In a temporary reversal of this pattern, the ipsi-
lateral Pb and both Pa magnitudes sharply increase at age
17. Thereafter, the ipsilateral Pa peak virtually disappears
while the contralateral Pa and ipsilateral Pb magnitudes
return to a level similar to that of the 15 year olds. Fig. 6b
shows a gradual decrease in the contralateral P1 magnitude
with age, whereas the ipsilateral P1 is fairly constant up to
age 10 and then decreases. Ipsilateral N1b magnitude is small
and changes relatively little with age whereas contralateral
N1b magnitude increases with age. The P2 magnitude shows
significant variability with perhaps an increase in magnitude
on the contralateral side at age 15 (Fig. 6c). The N2 magni-
tude (Fig. 6c) is relatively constant up to age 11 and then
steadily decreases (becomes less negative) as age increases.
The magnitude of the contralateral and ipsilateral T-
complex peak, Ta, is essentially constant across the age
span tested in this study (Fig. 6d). In contrast, Tb magnitude,
which is relatively constant up to age 14, decreases sharply
(becomes less negative) thereafter. The TP200 magnitude
slowly increases up to age 15 and then precipitously drops
to a constant level for ages 16–19 years. Compared to
contralateral activity, the magnitude of ipsilateral activity
C. Ponton et al. / Clinical Neurophysiology 113 (2002) 407–420 413
Fig. 4. (a) Surface plots of the ipsilateral (left) and contralateral (right) source waveforms for the sagittally oriented dipoles. These source waveforms contain
activity that corresponds in latency to the scalp-recorded Pa and Pb of the MLR. While there are some age-related changes in magnitude, latencies for both
peaks are nearly constant as a function of age. (b) Surface plots of the ipsilateral and contralateral source waveforms are shown for the tangential dipoles. In
younger children, a large positive peak labeled P1 with a latency similar to that of the adult N1b peak dominates response. As P1 magnitude decreases, the N1b
peak begins to emerge between 9 and 11 years of age. (c) Ipsilateral and contralateral surface plots are shown for radially oriented dipole sources. The two T-
complex components, Ta and Tb, are clearly represented in these source waveforms. A third peak; labeled TP200, is also apparent both ipsilateral and
contralateral to the stimulated ear.

was consistently smaller for the T-complex peaks, including
TP200.
The RMS magnitudes were also calculated for each of the
source waveforms, from stimulus onset to the end of the
recording epoch (0–400 ms). The RMS magnitude for the
sagittal sources slowly increases up to age 10–11 and then
slowly decreases with age (Fig. 7a). For the tangential
dipoles (Fig. 7b), the RMS magnitude reaches a peak at
ages 7–8 in the contralateral source and at age 9 in the
ipsilateral source. Thereafter, the RMS magnitude steadily
decreases with age. From age 6 to 8 years and from age 16
onward, the RMS amplitude for the contralateral source is
clearly larger than for the ipsilateral source. For the radial
dipole sources (Fig. 7c), the RMS magnitude peaks at age 13
contralaterally and ipsilaterally, only to drop to the level of
the 5–6 year olds again at ages 19–20. The radial sources
show the most consistent, contralateral-greater-than-ipsilat-
eral, RMS asymmetry. Age-related changes in the vector
sum of RMS magnitudes (square root of the sum of the
mean squared amplitude for each source component) are
shown in Fig. 7d. This provides an overall measure of
age-related changes in the strength of the two regional
dipole sources. The peak of regional source RMS magnitude
between 8 and 9 years of age is accentuated in this analysis.
With the exception of the 11 year olds, the vector sum is
consistently larger for the regional source located in the
hemisphere contralateral to the stimulated left ear.
3.5. Independent origin of the T-complex
The possibility exits that the T-complex simply repre-
sents an inversion of the P1–N1b–P2–N2 potentials. However,
with the source analysis model applied in this study, the
regional dipoles were rotated around the radial axis to maxi-
mize activity in the tangential sources. Thus, the residual
activity in the radial (and sagittal sources) is orthogonal to
the tangential activity. Therefore, it is likely that activity in
the radial sources is independent from the activity repre-
sented in the tangential sources. To further examine the
relationship between the radial T-complex components in
the radial sources and the obligatory potentials in the
tangential sources, correlation analyses (Pearson Product–
Moment correlations) were performed on both latency and
magnitude data. Based on the correspondence of peak laten-
C. Ponton et al. / Clinical Neurophysiology 113 (2002) 407–420414
Fig. 5. AEP peak latencies plotted as a function of age identified by the dipole component of origin. Best-fit decaying exponential functions are superimposed
on the data where an age-related latency change is apparent.
C. Ponton et al. / Clinical Neurophysiology 113 (2002) 407–420 415
Table 2
Best-fit functions for peak latency ðLatency ¼ a 1 b £ expð2c £ ageÞÞa
Source Peak Side Adult latency (a) Intercept (b) Slope (c) (time constant)
Tangential P1 Contralateral 39.2 127.7 20.16 (6.25 years)
Ipsilateral 56.8 54.6 20.12 (8.33 years)
N1 Contralateral 91.2 202.7 20.24 (4.17 years)
Ipsilateral 99.0 88.8 20.13 (7.69 years)
P2 Contralateral n.s.
Ipsilateral n.s.
N2 Contralateral 233.4 2500.5 20.40 (2.5 years)
Ipsilateral 230.4 2644.9 20.53 (1.89 years)
Radial Ta Contralateral n.s.
Ipsilateral n.s.
Tb Contralateral 135.0 20.3 20.12 (8.33 years)
Ipsilateral 137.3 41.7 20.18 (5.56 years)
TP200 Contralateral 195 90.6 20.16 (6.25 years)
Ipsilateral 189 96.5 20.14 (7.14 years)
Sagittal Pa Contralateral n.s.
Ipsilateral n.s.
Pb Contralateral n.s.
Ipsilateral n.s.
a n.s., not significant.
Fig. 6. AEP peak magnitudes (baseline-to-peak) plotted as a function of age group by the dipole component of origin.

cies for Ta and N1b, Tb and P2, and TP200 and N2, latency and
magnitude correlations were obtained for these 3 respective
pairs of AEP peaks. Table 3 summarizes these analyses. The
magnitude of significant correlations are shown while non-
significant correlations are denoted by n.s. ðP . 0:05Þ. Only
two of 12 correlations were significant; that between the
contralateral magnitudes of Tb and P2 and that between
the ipsilateral latencies of TP200 and N2.
3.6. Relationship between source location and AEP
magnitude
The interpretation of maturational changes in dipole
source strength could be complicated by an age-related
shift in regional dipole source location (i.e. superior to infer-
ior, anterior to posterior, lateral to medial). Fig. 8 shows
source location along each of the orthogonal axes plotted
as a percent of the 90 mm maximum radius of the outer
C. Ponton et al. / Clinical Neurophysiology 113 (2002) 407–420416
Table 3
Correlations of radial and tangential obligatory peaksa
Peaks Side Latency Magnitude
Ta–N1b Ipsilateral n.s. n.s.
Contralateral n.s. n.s.
Tb–P2 Ipsilateral n.s. n.s.
Contralateral n.s. 0.80
TP200–N2 Ipsilateral 20.54 n.s.
Contralateral n.s. n.s.
a n.s., not significant ðP . 0:05Þ.
Fig. 7. Ipsilateral and contralateral regional source RMS magnitude plotted
as a function of age for sagittal (a), tangential (b), and radial sources (c).
The RMS magnitude (nA) for each source was measured from stimulus
onset to the end of the recording epoch 400 ms later. The vector sum of the
RMS magnitudes along each axis of the head model are shown in (d).
Fig. 8. Source location changes along each axis of the head model are
plotted as a function of age. Only the radial source shows a directional
consistent (lateral-to-medial) shift in location as a function of age. Source
location along this axis shifts more than 13 mm from a lateral to a more
medial location as age increases. A decaying exponential, best-fit function
superimposed on these data had a slope of 20.19, similar to that for the P1
AEP.
shell. The only statistically significant and directionally
consistent location change as a function of age was along
the radial axis; the source location was significantly deeper
for older (age 13 and up) than younger (age 12 years and
younger) subjects (Fð1; 12Þ ¼ 19:1, P , 0:001). Thus,
between 5 and 20 years of age, there is a lateral-to-medial
change in source location of approximately 13 mm along
the radial axis. A non-linear curve fit analysis of this change
in location along the radial axis produced a slope value of
20.19 (a time constant of 5.26 years), approximately equal
to that obtained for contralateral P1 latency. The 13 mm
change is probably near the spatial resolution of a general
spherical model based on 30 scalp electrodes. However, as
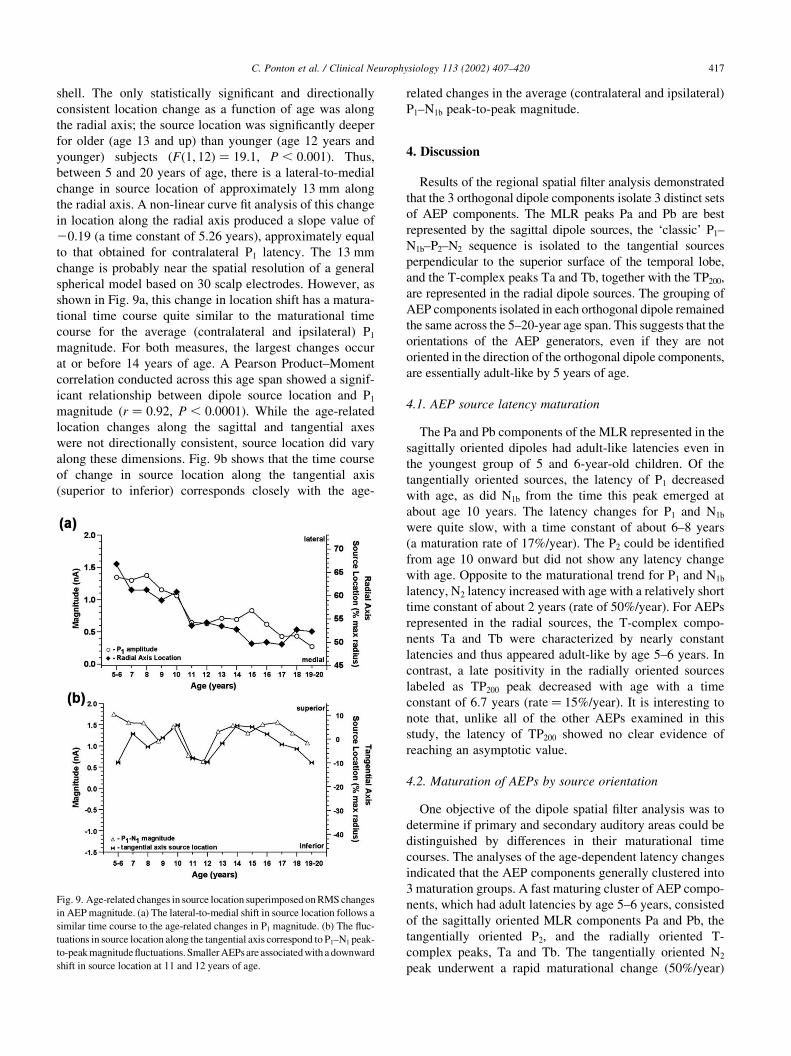
shown in Fig. 9a, this change in location shift has a matura-
tional time course quite similar to the maturational time
course for the average (contralateral and ipsilateral) P1
magnitude. For both measures, the largest changes occur
at or before 14 years of age. A Pearson Product–Moment
correlation conducted across this age span showed a signif-
icant relationship between dipole source location and P1
magnitude (r ¼ 0:92, P , 0:0001). While the age-related
location changes along the sagittal and tangential axes
were not directionally consistent, source location did vary
along these dimensions. Fig. 9b shows that the time course
of change in source location along the tangential axis
(superior to inferior) corresponds closely with the age-
related changes in the average (contralateral and ipsilateral)
P1–N1b peak-to-peak magnitude.
4. Discussion
Results of the regional spatial filter analysis demonstrated
that the 3 orthogonal dipole components isolate 3 distinct sets
of AEP components. The MLR peaks Pa and Pb are best
represented by the sagittal dipole sources, the ‘classic’ P1–
N1b–P2–N2 sequence is isolated to the tangential sources
perpendicular to the superior surface of the temporal lobe,
and the T-complex peaks Ta and Tb, together with the TP200,
are represented in the radial dipole sources. The grouping of
AEP components isolated in each orthogonal dipole remained
the same across the 5–20-year age span. This suggests that the
orientations of the AEP generators, even if they are not
oriented in the direction of the orthogonal dipole components,
are essentially adult-like by 5 years of age.
4.1. AEP source latency maturation
The Pa and Pb components of the MLR represented in the
sagittally oriented dipoles had adult-like latencies even in
the youngest group of 5 and 6-year-old children. Of the
tangentially oriented sources, the latency of P1 decreased
with age, as did N1b from the time this peak emerged at
about age 10 years. The latency changes for P1 and N1b
were quite slow, with a time constant of about 6–8 years
(a maturation rate of 17%/year). The P2 could be identified
from age 10 onward but did not show any latency change
with age. Opposite to the maturational trend for P1 and N1b
latency, N2 latency increased with age with a relatively short
time constant of about 2 years (rate of 50%/year). For AEPs
represented in the radial sources, the T-complex compo-
nents Ta and Tb were characterized by nearly constant
latencies and thus appeared adult-like by age 5–6 years. In
contrast, a late positivity in the radially oriented sources
labeled as TP200 peak decreased with age with a time
constant of 6.7 years (rate ¼ 15%/year). It is interesting to
note that, unlike all of the other AEPs examined in this
study, the latency of TP200 showed no clear evidence of
reaching an asymptotic value.
4.2. Maturation of AEPs by source orientation
One objective of the dipole spatial filter analysis was to
determine if primary and secondary auditory areas could be
distinguished by differences in their maturational time
courses. The analyses of the age-dependent latency changes
indicated that the AEP components generally clustered into
3 maturation groups. A fast maturing cluster of AEP compo-
nents, which had adult latencies by age 5–6 years, consisted
of the sagittally oriented MLR components Pa and Pb, the
tangentially oriented P2, and the radially oriented T-
complex peaks, Ta and Tb. The tangentially oriented N2
peak underwent a rapid maturational change (50%/year)
C. Ponton et al. / Clinical Neurophysiology 113 (2002) 407–420 417
Fig. 9. Age-related changes in source location superimposed on RMS changes
in AEP magnitude. (a) The lateral-to-medial shift in source location follows a
similar time course to the age-related changes in P1 magnitude. (b) The fluc-
tuations in source location along the tangential axis correspond to P1–N1 peak-
to-peak magnitude fluctuations. Smaller AEPs are associated with a downward
shift in source location at 11 and 12 years of age.
and became adult-like around age 10. A third group of
components, characterized by a slow maturation rate of
11–17%/year, consisted of the tangentially oriented P1 and
N1b, and the radially oriented TP200.
Since the AEP maturation clusters crossed the dipoles-of-
origin boundaries, a simple categorization of maturation
based on the orientation of the underlying AEP generators
is not possible. This finding is not entirely unexpected since
primary and secondary areas are not orthogonally mapped
along the 3 regional dipole orientations. While this does not,
a priori, exclude different maturation rates for different
cortical areas, it does make it unlikely.
4.3. AEP maturation as a possible reflection of cortical
laminar development
Studies of human neuroanatomical maturation suggest
that in the auditory system, maturational differences exist
not so much on an area-by-area basis, but on a cortical layer-
by-layer basis. Based on age-related changes in axonal
neurofilament staining, Moore et al. (1997) have shown
that humans, like other mammals (e.g. Liu and Cynader,
1994 for cat visual cortex), undergo a laminar maturation
pattern, with no differences between primary and secondary
areas. As shown in Ponton et al. (1999), cortical layer I in
humans appears adult-like at birth. Between 6 months and 5
years of age, the deep layers (lower layer III to layer VI)
develop in unison. After age 5, the superficial layers (upper
layer III and layer II) undergo significant changes, likely
continuing until age 10–12. It is possible that the matura-
tional time course of the various AEPs may distinguish
those components resulting from generators in the super-
ficial layers from those generated by neurons in the deeper
layers. In 5–6-year-old children, the AEPs are dominated by
a large positivity, labeled P1 with a peak latency of about
80–100 ms (Ponton et al., 2000a). It is possible that this
large positive peak represents recurrent activation of layers
III and IV, the termination zone of the thalamo-cortical
pathway. On the other hand, the generation of N1b may be
dominated by activation of cortical layers upper III and II.
Thus, one might speculate that the early presence of the
large positivity labeled P1 reflects the mature state of deep
cortical layers while the delayed emergence and late
maturation of N1b reflects the prolonged maturation of
axonal systems in superficial cortical layers.
This model of P1 and N1b activity opens the possibility
that the P1 generators (in layers III/IV) provide input to the
N1b generators in layer II following the standard course of
intra-laminar connectivity patterns (Mitzdorf, 1985).
However, because P1 is present bilaterally at early age and
the N1b manifests itself initially only contralaterally (Ponton
et al., 2000b) this suggested pattern of serial activation is
unlikely. Based on the intra-cortical recordings of Liegeois-
Chauval et al. (1994), the generator complex for P1 has been
attributed to the lateral portion of Heschl’s gyrus, which is
mostly likely in secondary auditory cortex. The tangential
orientation of P1 does not exclude an origin in secondary
auditory cortex since all of the belt area and part of the
parabelt area could provide tangentially oriented sources.
For the N1b peak, it is possible that the dominant input to
its generators reflects the activation of callosal fibers origi-
nating from auditory cortex in the contralateral hemisphere
(Makela and Hari, 1992). This, however, suggests the unli-
kely possibility of an asymmetric maturation of inter-hemi-
spheric connectivity through the corpus callosum, or, based
on our exclusively left ear stimulation, an earlier maturation
of left-to-right hemisphere callosal connections. It seems
more likely that the P1 and N1b AEPs represent parallel
rather than serial activation of auditory cortical areas.
While the P1 peak is robustly present and dominates the
morphology of the AEPs in children at least as young as age
5, the N1b peak does not emerge until approximately 10
years of age (for stimulus rates faster than 1/s). The emer-
gence of the N1b peak at age 10 coincides with an abrupt
drop in P1 latency. Despite this late emergence of the N1b
peak, the latencies of P1 and N1b mature at the same rate.
Although the latency changes for these peaks are similar, the
maturational changes in magnitude are opposite; P1 magni-
tude decreases while N1b increases with increasing age. The
marked similarity between the maturation of the P1 and N1b
peak latencies and the negative correlation of their matura-
tional changes in magnitude are quite striking. These data
raise the possibility that perhaps due to the partial temporal
overlap and common tangential orientation of these two
peaks, the magnitude and latency changes of the maturing
N1b peak are superimposed on the mature magnitude and
latency properties of the P1. Specifically, it is suggested
that when N1b emerges in the AEP at about 10 years of
age, the neural generators producing the P1 peak are essen-
tially adult-like. Based on models of AEP generation
proposed by Mitzdorf (1985), this explanation is consistent
with the assumption that P1 originates from the early matur-
ing cortical input layers (III and IV) while N1b originates
from the late maturing superficial layers (Ponton et al.,
1999). It is possible that as the neural generators of N1b
mature and this peak emerges, there is phase cancellation
of the scalp-recorded positivity produced by mature P1
generators. Although P1 is included in the group character-
ized by slow maturation, it is possible that the generators of
this peak are adult-like by age 10 or perhaps even much
younger. A complete description of this proposed model
of AEP generation and its consequence for maturational
change is described in Ponton et al. (2002).
4.4. Comparison with other studies
In a previous study we analyzed the maturational beha-
vior of the components of the classical AEP complex for
specific electrode locations (Ponton et al., 2000a) and
compared the results to other studies. In order to avoid
duplication, we will compare the results from the dipole
source analysis with those of our previous study and with
C. Ponton et al. / Clinical Neurophysiology 113 (2002) 407–420418
studies that were not referred to in the previous paper.
Bruneau et al. (1999) recently showed the early prominence
of the Tb component (at T4) in children 4–8 years of age,
with latencies comparable to ours at that age group. Tonn-
quist-Uhlen (1995) reported Ta and Tb peak latencies for 9–
12-year-old children that were also similar to ours at that
age. The results of a dipole source analysis study of AEP
maturation by Albrecht et al. (2000) also reported the
maturational time course of tangentially and radially
oriented cortical activity. These data clearly showed in 5–
6 year olds, the dominance of the tangentially oriented
source activity by a large positivity identified as P1. In addi-
tion, structured activity was clearly present in the radially
oriented sources, but consistently identifiable responses
were not apparent in the sagittally oriented dipole sources.
The results of the present investigation concur with those
of the previous studies and further expand our knowledge of
AEP maturation. Unlike Albrecht et al. (2000), we found that
well-structured activity was consistently detectable in the
sagittally oriented source waveforms. This activity consisted
of two positive peaks with latencies consistent with the MLR
peaks, Pa and Pb. The latencies of these peaks showed little
evidence of age-related change, suggesting the presence of
adult-like generator complexes as early as 5 years of age. The
absence of these AEPs in the data presented by Albrecht et al.
(2000) may be stimulus related. We elicited the AEPs with
short duration click trains (,20 ms), which may be more
conducive to recording Pa and Pb activity than the much
longer 175 ms tone pulses used by Albrecht et al. (2000).
In contrast to the interpretation of AEP maturation reported
by other investigators (Korpilahti and Lang, 1994; Kurtzberg
et al., 1995; Sharma et al., 1997), the surface plot representa-
tions of the maturing AEP source activity indicates that the
large negativity at approximately 200 ms is not the N1b. This
later negativity, labeled N2, is characterized by a matura-
tional increase in latency opposite to the age-related latency
decreases found for N1b.
In the data described by Ponton et al. (2000a), the matura-
tion rates of P1 for the contralateral electrode position C4
and for the contralateral tangential source component were
exactly the same at 16%/year. For the N1b peak, maturation
rates were also comparable when measured at electrode C4
(18%/year) and in the tangentially oriented dipole (24%/
year). For both representations, P2 latency did not change
significantly with age. However, a clear difference was
found for the latency of the N2 component, which increased
with age in both analyses but at a much smaller rate of 12%/
year for the C4 electrode site compared to 40%/year for the
tangential component of the contralateral dipole. The
increase in N2 latency is inconsistent with the general
pattern of AEP latency decrease associated with maturation
and with results described by other investigators. It is possi-
ble that the use of a very short stimulus or the relatively
rapid stimulus presentation rate may be critical factors in the
pattern of N2 maturation observed in this investigation
(Ceponiene et al., 1998). The N2 latency increase in the
present study coincided with the gradual emergence of P2
in the tangential dipole source. This raises the possibility
that the N2 latency increase may be due to partial phase
cancellation produced by the increase in P2 magnitude.
Smaller maturation rates were found for the ipsilateral
representations of P1 and N1b, compared to the contralateral
representations. In contrast, the maturation rates of N2 were
smaller for the contralateral representation. This suggests
that for P1, N1b, and P2 the activity represented the tangen-
tially oriented dipole sources which is similar to that found
at electrode sites (e.g. C3 or C4) over the same hemisphere,
whereas the activity represented in the N2 is different.
4.5. Dipole source modeling of evoked activity in children
The dipole source model employed by BESA has sphe-
rical shell conductivity and radius parameters based on
adults. This raises the question of whether possible differ-
ences in these parameters for children relative to adults are
sufficiently large to invalidate results based on an adult
volume conductor model. For example, larger, thicker skulls
would presumably result in greater attenuation of the AEPs,
an explanation that is often offered to account for the well-
established differences in evoked potential amplitude
between children and adults. However, it is unlikely that a
difference in the radius of the volume conductor between
children and adults contributes to AEP amplitude differ-
ences. By 1 year of age, head circumference in children is
more than 90% that of adults and is essentially adult-like by
5–6 years of age (Ponton et al., 1993b).
The absence of age-related differences in head circumfer-
ence between 5 and 20 years of age does not rule out the
possibility of age-related differences in skull thickness. If
age-related differences in skull are significant factors, one
would expect the effects to be comparable on all AEP
components, or at least those with a common spatial orien-
tation. Yet, as shown for the tangentially oriented AEPs in
Fig. 8b, c, P2 magnitude remains relatively constant while P1
decreases and N1 increases in magnitude. It seems more
likely that this change reflects the phase cancellation in
similar-oriented, partially temporally overlapped neural
generators. For these analyses of latency and magnitude,
source location was held constant. Subsequent analyses
did demonstrate a 13 mm age-related lateral-to-medial
change in source location (Figs. 9a,b). However, this posi-
tion shift correlated mostly with changes in the P1 AEP.
Systematic changes were not found in the strength of the
T-complex peaks, which one would expect to be most sensi-
tive to position shifts along the radial axis. Certainly, with
very young children and with infants who have open fonta-
nelles, the validity of a source model based on adult para-
meters of skull size and thickness must be scrutinized very
carefully for its validity. However, there is little evidence to
suggest that the maturational changes observed in the
present study are simply an artifact of inappropriate model-
ing parameters.
C. Ponton et al. / Clinical Neurophysiology 113 (2002) 407–420 419
4.6. Summary and conclusions
We have shown that some radial sources, the T-complex
specifically, have a distinctly faster maturation than the
tangential sources P1 and N1b. In turn, the N1b appears
much later and matures much slower than the P1. In fact,
most of the slow maturation pattern of the P1 that we
reported previously (Ponton et al., 1996a,b) may alterna-
tively be explained by phase cancellation of the later parts
of the P1 peak by the increasing magnitude of the N1b. This is
because the N1b and P1 dipoles have the same orientation.
The maturation rates described in this study do not correlate
with source orientation or area of origin. A correlation of
maturation rate with cortical layer of origin does not hold
either; the TP200 matures much slower than the P1 and both
presumably originate from deep layers. The thalamic origin
of Pa and Pb is reflected in mature values at age 5. However,
similar early maturity is found for the presumably cortically
generated Ta and Tb and the P2 attributed to the reticular
activating system. Thus, in order to explain the maturation
rates of the various components, the origin of the activating
input, the cortical layer of generation as well as the latency
of the component all have to be taken into account.
Acknowledgements
We wish to acknowledge the contributions of Ann
Masuda, who collected some of the data in the early phases
of this project.
References
Achim A, Richer F, Saint-Hilaire JM. Methodological considerations for
the evaluation of spatio-temporal source models. Electroenceph clin
Neurophysiol 1991;79:227–240.
Albrecht R, Suchodoletz W, Uwer R. The development of auditory evoked
dipole source activity from childhood to adulthood. Clin Neurophysiol
2000;111:2268–2276.
Bruneau N, Roux S, Guerin P, Barthelemy C, Lelord G. Temporal promi-
nence of auditory evoked potentials (N1 wave) in 4–8-year-old chil-
dren. Psychophysiology 1997;34:32–38.
Bruneau N, Roux S, Adrien JL, Barthelemy C. Auditory associative cortex
dysfunction in children with autism: evidence from late auditory evoked
potentials (N1 wave-T complex). Clin Neurophysiol 1999;110:1927–
1934.
Cacace AT, Satya-Murti S, Wolpaw JR. Human middle-latency auditory
evoked potentials: vertex and temporal components. Electroenceph clin
Neurophysiol 1990;77:6–18.
Ceponiene R, Cheour M, Naatanen R. Interstimulus interval and auditory
event-related potentials in children: evidence for multiple generators.
Electroenceph clin Neurophysiol 1998;108:345–354.
Jasper HH. The ten–twenty system of the international federation. Electro-
enceph clin Neurophysiol 1958;10:371–375.
Kaas JH, Hackett TA. Subdivisions of auditory cortex and levels of proces-
sing in primates. Audiol Neurootol 1998;3:73–85.
Knight RT, Scabini D, Woods DL, Clayworth C. The effects of lesions of
superior temporal gyrus and inferior parietal lobe on temporal and
vertex components of the human AEP. Electroenceph clin Neurophy-
siol 1988;70:499–509.
Korpilahti P, Lang HA. Auditory ERP components and mismatch negativ-
ity in dysphasic children. Electroenceph clin Neurophysiol 1994;91:
256–264.
Kurtzberg D, Vaughn HF, Kreuzer JA, Flieger KZ. Developmental studies
and clinical application of mismatch negativity: problems and
prospects. Ear Hear 1995;16:105–117.
Liegeois-Chauvel C, Musolino A, Badier JM, Marquis P, Chauvel P.
Evoked potentials recorded from the auditory cortex in man: evaluation
and topography of the middle latency components. Electroenceph clin
Neurophysiol 1994;92:204–214.
Liu Y, Cynader M. Postnatal development and laminar distribution of
noradrenergic fibers in cat visual cortex. Brain Res Dev Brain Res
1994;82:90–94.
Makela JP, Hari R. Neuromagnetic auditory evoked responses after a stroke
in the right temporal lobe. NeuroReport 1992;3:94–96.
McGee T, Kraus N. Auditory development reflected by the middle latency
response. Ear Hear 1996;17:219–429.
Mitzdorf U. Current source-density method and application in cat cerebral
cortex: investigation of evoked potentials and EEG phenomena. Physiol
Rev 1985;65:37–100.
Moore JK, Guan Y-L, Wu BJ-C. Maturation of human auditory cortex:
laminar cytoarchitecture and axonal in growth. Assoc Res Otolaryngol
Abstr 1997;20:28.
Nelson MD, Hall JW, Jacobson GP. Factors affecting the recordability of
auditory evoked response component Pb (P1). J Am Acad Audiol
1997;8:89–99.
Ponton CW, Don M, Waring MD, Eggermont JJ, Masuda A. Spatio-
temporal source modeling of AEPs to acoustic and cochlear implant
stimulation of the auditory system. Electroenceph clin Neurophysiol
1993a;88:478–493.
Ponton CW, Eggermont JJ, Coupland SG, Winkelaar R. The relation
between head size and auditory brain-stem response interpeak latency
maturation. J Acoust Soc Am 1993b;94:2149–2158.
Ponton CW, Don M, Eggermont JJ, Waring MD, Masuda A. Maturation of
human cortical auditory function: differences between normal hearing
and cochlear implant children. Ear Hear 1996a;17:430–437.
Ponton CW, Don M, Eggermont JJ, Waring MD, Kwong B, Masuda A.
Auditory system plasticity in children after long periods of complete
deafness. NeuroReport 1996b;8:61–65.
Ponton CW, Moore JK, Eggermont JJ. Prolonged deafness limits auditory
system developmental plasticity: evidence from an evoked potential
study in children with cochlear implants. Scand Audiol 1999;Suppl
51:13–22.
Ponton CW, Eggermont JJ, Kwong B, Don M. Maturation of human central
auditory system activity: evidence from multi-channel evoked poten-
tials. Clin Neurophysiol 2000a;111:220–236.
Ponton CW, Don M, Eggermont JJ, Waring MD, Kwong B, Cunningham J,
Trautwein P. Maturation of the mismatch negativity: effects of
profound deafness and cochlear implant use. Audiol Neurootol 2000b;
5:167–185.
Ponton CW, Eggermont JJ. Of kittens and kids: altered cortical maturation
following profound deafness and cochlear implant use. Audiol Neuroo-
tol 2002 (in press).
Scherg M. Fundamentals of dipole source analysis. In: Grandori F, Hoke M,
Romani RL, editors. Auditory evoked magnetic fields and electric
potentials, Basel: Karger, 1990. pp. 40–69.
Scherg M, Von Cramon D. Two bilateral sources of the late AEP as iden-
tified by a spatio-temporal dipole model. Electroenceph clin Neurophy-
siol 1985;62:32–44.
Scherg M, Von Cramon D. Evoked dipole source potentials of the human
auditory cortex. Electroenceph clin Neurophysiol 1986;65:344–360.
Sharma A, Kraus N, McGee TJ, Nicol TG. Developmental changes in P1
and N1 central auditory responses elicited by consonant–vowel sylla-
bles. Electroenceph clin Neurophysiol 1997;104:540–545.
Tonnquist-Uhlen I, Borg E, Spens KE. Topography of auditory evoked long
latency potentials in normal children, with particular reference to the
N1 component. Electroenceph clin Neurophysiol 1995;95:34–41.
C. Ponton et al. / Clinical Neurophysiology 113 (2002) 407–420420