Embed Size (px)
Citation preview
infrastructures
Article
Maturity Improvements in Flood Protection AssetManagement across the North Sea Region
Berry Gersonius 1,*, Bart Vonk 2, Richard M. Ashley 3, Frank den Heijer 4, Wouter Jan Klerk 5 ,Natasa Manojlovic 6, Jeroen Rijke 4, Paul Sayers 7 and Assela Pathirana 8
1 ResilienServices, 120, 2613 PN Delft, The Netherlands2 Rijkswaterstaat, 3526 LA Utrecht, The Netherlands; [email protected] EcoFutures Ltd., Honley, Holmfirth HD9 6JW, UK; [email protected] Sustainable River Management Group, HAN University of Applied Sciences, Ruitenberglaan 26,
6826 CC Arnhem, The Netherlands; [email protected] (F.d.H.); [email protected] (J.R.)5 Deltares, 2629 HV Delft, The Netherlands; [email protected] Wasserbau, Hamburg University of Technology, 21073 Hamburg, Germany; [email protected] Sayers and Partners, Watlington OX49 5PY, UK; [email protected] UNDP, Boduthakurufaanu Magu, Malé 20026, Maldives; [email protected]* Correspondence: [email protected]
Received: 27 October 2020; Accepted: 2 December 2020; Published: 10 December 2020�����������������
Abstract: North Sea Region countries depend heavily on flood protection infrastructure, such asdikes, dams, sluices and flood gates. Knowledge on where, when and how much to invest toensure functioning is of crucial importance for asset owners and operators. This requires assetmanagement approaches that are adaptable, respond to feedback and function within variouscontexts. The FAIR (Flood defense infrastructure Asset management & Investment in Renovation,adaptation, optimisation and maintenance) project has developed a unique framework to ensurethat asset management processes are adaptive, comprehensive and make effective connectionsacross strategic, tactical and operational contexts. The framework has for the first time informed anassessment of maturity of five flood protection asset management organisations in the North SeaRegion, using a seven-factor maturity assessment model. This paper describes the self-assessmentprocess and the self-reported maturity changes during the project. Maturity assessments wereundertaken on two occasions, at the start of the project, and again toward the end. This has revealedhow the baseline level of maturity for each organisation developed over the course of the three-yearproject. The observed maturity changes indicate that adopting the FAIR framework has added valuein improving current approaches to asset management.
Keywords: asset management; climate change adaptation; flood protection; flood risk management;maturity analysis
1. Introduction
North Sea Region (NSR) countries depend heavily on flood protection infrastructure assets,such as dikes, dams and hydraulic structures (e.g., sluices and flood gates). Most of these hydraulicstructures were built in the early 1900s and after World War II (1939–1945) with a notional designlife of 80–100 years. Hence, many are ageing and will increasingly require significant renovation orreplacement. Deciding on the best means of replacement or improvement is a daunting task for assetowners and operators. For example, the flood protection assets managed by the Dutch governmenthave a replacement value of EUR 19 billion. Across the NSR, policies aim to maintain, renovate andadapt the existing flood protection infrastructure. This has led to large-scale investment programmes,
Infrastructures 2020, 5, 112; doi:10.3390/infrastructures5120112 www.mdpi.com/journal/infrastructures

Infrastructures 2020, 5, 112 2 of 13
such as the UK flood and coastal erosion risk management investment programme [1] and the Dutchflood protection programme [2]. Knowledge on where, when and how much to invest is of crucialimportance for asset owners. They need to make best use of (shrinking) budgets for flood protection.This requires a systematic and systemic use of Asset Management (AM) strategies, using life-cycleapproaches to inform choices between abandonment, maintenance, renovation and adaptation. It alsorequires looking for and using opportunities to connect investments in flood protection infrastructurewith other complementary investments [3], including transportation, telecommunications, recreationand ecosystem restoration. Co-creation approaches [4] enable asset owners to move out of theorganizational silo’s and stimulate cross-sectoral and cross-departmental collaborations. The principlesfor improved AM strategies for flood protection infrastructure include [5]:
1. Priorities: AM should be focused on priority areas in terms of flood risk reduction.2. Options: Flood risk addressed from a range of options can be assessed, so that best value AM
(that is, not necessarily cheaper) can be selected.3. Best value: Innovative methods and tools can help to justify maintenance, renovation
and adaptation actions in terms of flood risk reduction and other requirements, such asecosystem restoration.
4. Evidence: Assets will be managed based on evidence of their location, condition and contributionto reducing flood risk.
5. Information: An AM system will steer the collection of relevant data and develop improved riskinformation for investment decision making.
6. Consistency: There will be a consistent approach to flood risk management at the national orregional level, providing more consistent protection across the country or region, and bringingefficiencies and opportunities in terms of capacity development.
In the context of these principles, the objective of this paper is to analyse improvements in thematurity of AM approaches for flood protection infrastructure within the partner organisations ofthe Interreg NSR project FAIR (Flood defense infrastructure Asset management & Investment inRenovation, adaptation, optimisation and maintenance) [6]. FAIR brings together flood protection assetowners, operating authorities and researchers from across the NSR to share the policy, practice andemerging science. It aims to reduce flood risk across the NSR by developing and implementingimproved approaches for AM for flood protection. Maturity is a measurement of the ability of anorganization for continuous improvement in a particular discipline. Two main aspects determinethe maturity of AM organisations: (i) effective and efficient technical planning and operation ofassets, and (ii) the organisational arrangements in place to deliver these. These aspects have beenreviewed by the FAIR partner organisations using a maturity assessment model. As a baseline,the AM approaches in use and those emerging across NSR countries were reviewed at the start of theproject. Subsequently, the maturity changes throughout the FAIR project were evaluated by the partnerorganizations, taking into account the new insights and experiences from adopting the FAIR framework.This framework defines three ‘planning and decision contexts’ to consider the comprehensiveness ofapproaches to AM (as outlined below, Figure 1).

Infrastructures 2020, 5, 112 3 of 13
Infrastructures 2019, 4, x FOR PEER REVIEW 5 of 12
the operational context informs the strategic processes, initially from the network performance
assessment. This creates a continuous process through the ongoing interconnection between (mainly)
short-term operations and (mainly) long-term strategy via a ‘tactical handshake’. This process is
explained below:
Strategic loop—the why and what? It establishes the strategy and consequential long-term
planning processes using an overall integrated system perspective from understanding threats,
asset operational effectiveness, responsive policy, standards and processes for interactions
within flood protection asset systems and beyond the flood risk domain. It develops investment
priorities to balance cost, risk and performance from an understanding of the flood risks, the
opportunities associated with alternative strategies, objectives and functional requirements, and
from the performance of alternative adaptation measures necessary to achieve these.
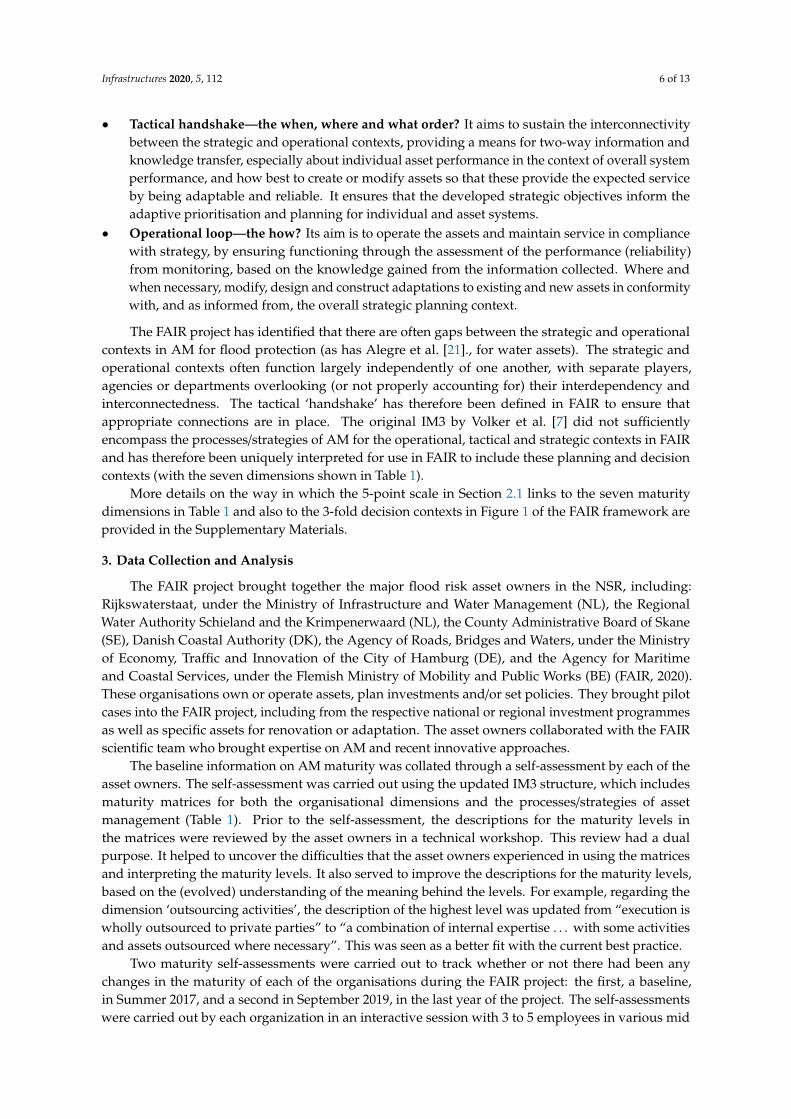
Tactical handshake—the when, where and what order? It aims to sustain the interconnectivity
between the strategic and operational contexts, providing a means for two-way information and
knowledge transfer, especially about individual asset performance in the context of overall
system performance, and how best to create or modify assets so that these provide the expected
service by being adaptable and reliable. It ensures that the developed strategic objectives inform
the adaptive prioritisation and planning for individual and asset systems.
Operational loop—the how? Its aim is to operate the assets and maintain service in compliance
with strategy, by ensuring functioning through the assessment of the performance (reliability)
from monitoring, based on the knowledge gained from the information collected. Where and
when necessary, modify, design and construct adaptations to existing and new assets in
conformity with, and as informed from, the overall strategic planning context.
Figure 1. FAIR framework, linking strategic and operational asset management through a tactical
handshake.
The FAIR project has identified that there are often gaps between the strategic and operational
contexts in AM for flood protection (as has Alegre et al. [21]., for water assets). The strategic and
operational contexts often function largely independently of one another, with separate players,
agencies or departments overlooking (or not properly accounting for) their interdependency and
interconnectedness. The tactical ‘handshake’ has therefore been defined in FAIR to ensure that
appropriate connections are in place. The original IM3 by Volker et al. [7] did not sufficiently
encompass the processes/strategies of AM for the operational, tactical and strategic contexts in FAIR
and has therefore been uniquely interpreted for use in FAIR to include these planning and decision
contexts (with the seven dimensions shown in Table 1).
Figure 1. FAIR framework, linking strategic and operational asset management through atactical handshake.
2. A Maturity Assessment Model for Asset Management of Flood Protection Infrastructure
2.1. Maturity Assessment Models
Maturity assessment models provide a structured approach to help to assess the effectiveness bywhich asset owners have and are implementing AM approaches [7]. In the FAIR project, the maturityassessment has helped asset owners consider best practices and competencies for AM and to understandthe need for and effectiveness of the AM processes they use. A maturity assessment model has beenused based on a set of structured guidelines as to how different dimensions and/or processes of,and in, an organisation are able to contribute to a set of predetermined organisational outcomes.Volker et al. [8] reviewed the use of maturity models in the context of AM. They concluded that thereare various types of models, but most were optimised for other domains and therefore unsuitablefor public infrastructure management. Nevertheless, the maturity assessment concept has evolvedfrom an appraisal method for software processes [9] to being widely used across a range of areas,including for infrastructure AM [7,10–12].
The purpose of using a maturity model is to assess the capability, strengths and weaknesses of anorganisation in relation to their intended goals [13]. This also allows the organisation to understand thepotential for improvements in existing processes. A key assumption behind the original maturity modelas developed by Paulk et al. [9] is that organisations’ processes need to be predictable, effective and incontrol, in order to develop into a mature organisation. The model utilises a theoretical continuumalong which maturity can be considered incrementally over five levels, defined by Williams et al. [14]:
1. Optimised: The organisation is “best practice,” capable of learning and adapting itself.It not only uses experience to correct any problems, but also uses experience to change itsoperation procedures.
2. Well managed: The organisation has control over its internal processes, specifies requirementsand ensures that these are met through feedback.
3. Standardised: The organisation can say what it does and how it goes about it.4. Repeatable: The organisation can repeat what it has done before but not necessarily define what
it does.5. Ad hoc: The organisation has limited experience and is at a learning and development stage.

Infrastructures 2020, 5, 112 4 of 13
While almost all maturity assessments use the five levels defined above, various maturity modelsvary considerably in the dimensions and processes considered. However, here, a modified form ofthese has been used to rank the various dimensions and/or process attributes relevant to flood assetmanagement of the organisations involved in FAIR.
2.2. The Infrastructure Management Maturity Matrix (IM3)
A comparative study by Mahmood et al. [15] has shown that most of the maturity models forinfrastructure assets display a weakness of tending to focus on the operational and technical context,while neglecting the strategic context in terms of governance, policy, and strategy. Moreover, the modelslack association with the processes related to human and social issues, such as communication,trust building and team-enabling activities. The maturity model Infrastructure Management MaturityMatrix (IM3) was developed by Volker et al. [7] to fill these gaps, and has been modified for usein the FAIR project—though alternative models have been developed (e.g., Chemweno et al. [16];Laue et al. [11]). IM3 was originally developed for Rijkswaterstaat, which is the Netherlands publicinfrastructure provider and the lead organisation for the project. This model was chosen because it hasbeen specifically developed for the organisational aspects of managing public (highway) infrastructure.Compared with alternative maturity models, IM3 has a stronger focus on the inclusion of stakeholdersand communication issues. Outsourcing activities have also been added as a dimension, because ofthe importance of procurement and contracting for the delivery of public infrastructure.
The IM3 is a two-dimensional matrix consisting of seven dimensions which are ranked using thefive (high-level) maturity levels outlined in Section 2.1. An overview of all seven dimensions is shownin the first column in Table 1. More detailed descriptions of the criteria used to assess the maturity on alldimensions are given by Volker et al. [7]. For example, at the lowest level of the Internal Co-ordinationdimension (3), there is a distinguishable ‘horizontal coordination’ within one regional division for theplanning and execution of operational activities in one regional area. Contrastingly, effective horizontalco-ordination between the national agency and regional divisions in system planning and budgetallocation is scored highly.
Table 1. Organisational dimensions used in the FAIR maturity assessment.
Maturity Dimensions(Interpreted for FAIR Application from Volker et al., 2013)
Correspondence with OrganisationalCompetencies (Alegre et al., 2016)
Description Information Engineering Management
1. Asset managementdecisions
The use of risk management methodsand life-cycle (LC) approaches in
decisions at strategic and operationalAM contexts.
√ √ √
2. Informationmanagement
The availability and use of(standardised) static and dynamic
data-bases for decision-making
√ √
3. Internalco-ordination
Co-ordination and problem solvingbetween the different departments of
the organization
√ √
4.External co-ordination
Co-ordination and problem solvingbetween the different stakeholders ofa project, including communication
with users
√ √

Infrastructures 2020, 5, 112 5 of 13
Table 1. Cont.
Maturity Dimensions(Interpreted for FAIR Application from Volker et al., 2013)
Correspondence with OrganisationalCompetencies (Alegre et al., 2016)
Description Information Engineering Management
5. Outsourcingactivities
Strategy about and implementation ofintegrated and performance-based
contracting and innovativeprocurement methods
√ √
6. Processes and rolesClarity, definition and
implementation of job responsibilitiesand roles within the organisation
√ √
7. Culture andleadership
Level of knowledge, implementationand support of AM related issues
√ √
2.3. A Maturity Matrix Including AM Processes and Strategies
The FAIR project has uniquely defined three ‘planning and decision contexts’ to consider thecomprehensiveness of the approaches to AM, including the processes for AM and AM planning(Figure 1): 1. Strategic (corporate and long-term view); 2. Tactical (ensuring effective interconnectionsbetween strategic and operational); 3. Operational (a focus on day-to-day asset operation andmaintenance). The need to consider the strategic and operational contexts for AM has been a recurrenttheme in various national programmes and projects in this Century. These have been used variously inflood-integrated AM (e.g., Defra/EA, 2004; EA, 2009, and Sayers et al. [17]) and in water and wastewaterAM (e.g., Marlow and Burn [18]; Ward, 2015 [19]). The TRUST (Transition to Sustainable UrbanWater Services of Tomorrow) project (Alegre and Covas, [20]) developed a framework that covers athree-dimensional matrix, including the three FAIR planning and decision contexts, together with threedimensions of analysis: cost, risk and performance, and three competencies: information, engineeringand management, creating a 27 factor matrix. Each factor can be assessed for individual assets, or for asystem/network for both present conditions and for future scenarios. In the context of FAIR, these needto be included in all three contexts (strategic, operational and tactical), alongside the competences of theowner/operator: information, engineering and management, Table 1 (illustrated by Alegre et al. [21]).
The linkages between the AM processes in the strategic, tactical and operational context areillustrated as a framework in Figure 1. This shows the essential processes of AM, as defined bythe FAIR partners (building upon Sayers et al. [17]; Sharp et al. [22]; Klerk and den Heijer [23]).The framework shows the strategic components: (1) assessing the performance of the network aspassed on from the operational context; (2) identifying threats and opportunities; (3) setting objectivesand requirements; (4) identifying and analysing measures for the AM system; (5) developing anadaptive plan. These components inform the operational processes, which are: (A) identifying andanalysing measures for individual assets and groups; (B) designing and constructing; (C) monitoringand maintaining; (D) assessing the performance of individual assets and groups. In turn, feedback fromthe operational context informs the strategic processes, initially from the network performanceassessment. This creates a continuous process through the ongoing interconnection between (mainly)short-term operations and (mainly) long-term strategy via a ‘tactical handshake’. This process isexplained below:
• Strategic loop—the why and what? It establishes the strategy and consequential long-termplanning processes using an overall integrated system perspective from understanding threats,asset operational effectiveness, responsive policy, standards and processes for interactions withinflood protection asset systems and beyond the flood risk domain. It develops investment prioritiesto balance cost, risk and performance from an understanding of the flood risks, the opportunitiesassociated with alternative strategies, objectives and functional requirements, and from theperformance of alternative adaptation measures necessary to achieve these.
Infrastructures 2020, 5, 112 6 of 13
• Tactical handshake—the when, where and what order? It aims to sustain the interconnectivitybetween the strategic and operational contexts, providing a means for two-way information andknowledge transfer, especially about individual asset performance in the context of overall systemperformance, and how best to create or modify assets so that these provide the expected serviceby being adaptable and reliable. It ensures that the developed strategic objectives inform theadaptive prioritisation and planning for individual and asset systems.
• Operational loop—the how? Its aim is to operate the assets and maintain service in compliancewith strategy, by ensuring functioning through the assessment of the performance (reliability)from monitoring, based on the knowledge gained from the information collected. Where andwhen necessary, modify, design and construct adaptations to existing and new assets in conformitywith, and as informed from, the overall strategic planning context.
The FAIR project has identified that there are often gaps between the strategic and operationalcontexts in AM for flood protection (as has Alegre et al. [21]., for water assets). The strategic andoperational contexts often function largely independently of one another, with separate players,agencies or departments overlooking (or not properly accounting for) their interdependency andinterconnectedness. The tactical ‘handshake’ has therefore been defined in FAIR to ensure thatappropriate connections are in place. The original IM3 by Volker et al. [7] did not sufficientlyencompass the processes/strategies of AM for the operational, tactical and strategic contexts in FAIRand has therefore been uniquely interpreted for use in FAIR to include these planning and decisioncontexts (with the seven dimensions shown in Table 1).
More details on the way in which the 5-point scale in Section 2.1 links to the seven maturitydimensions in Table 1 and also to the 3-fold decision contexts in Figure 1 of the FAIR framework areprovided in the Supplementary Materials.
3. Data Collection and Analysis
The FAIR project brought together the major flood risk asset owners in the NSR, including:Rijkswaterstaat, under the Ministry of Infrastructure and Water Management (NL), the RegionalWater Authority Schieland and the Krimpenerwaard (NL), the County Administrative Board of Skane(SE), Danish Coastal Authority (DK), the Agency of Roads, Bridges and Waters, under the Ministryof Economy, Traffic and Innovation of the City of Hamburg (DE), and the Agency for Maritimeand Coastal Services, under the Flemish Ministry of Mobility and Public Works (BE) (FAIR, 2020).These organisations own or operate assets, plan investments and/or set policies. They brought pilotcases into the FAIR project, including from the respective national or regional investment programmesas well as specific assets for renovation or adaptation. The asset owners collaborated with the FAIRscientific team who brought expertise on AM and recent innovative approaches.
The baseline information on AM maturity was collated through a self-assessment by each of theasset owners. The self-assessment was carried out using the updated IM3 structure, which includesmaturity matrices for both the organisational dimensions and the processes/strategies of assetmanagement (Table 1). Prior to the self-assessment, the descriptions for the maturity levels inthe matrices were reviewed by the asset owners in a technical workshop. This review had a dualpurpose. It helped to uncover the difficulties that the asset owners experienced in using the matricesand interpreting the maturity levels. It also served to improve the descriptions for the maturity levels,based on the (evolved) understanding of the meaning behind the levels. For example, regarding thedimension ‘outsourcing activities’, the description of the highest level was updated from “execution iswholly outsourced to private parties” to “a combination of internal expertise . . . with some activitiesand assets outsourced where necessary”. This was seen as a better fit with the current best practice.
Two maturity self-assessments were carried out to track whether or not there had been anychanges in the maturity of each of the organisations during the FAIR project: the first, a baseline,in Summer 2017, and a second in September 2019, in the last year of the project. The self-assessmentswere carried out by each organization in an interactive session with 3 to 5 employees in various mid
Infrastructures 2020, 5, 112 7 of 13
to higher management roles, such as strategic advisors, programme managers and/or operationalmanagers. The sessions lasted 1 to 1.5 h. The participation of employees from various roles wasimportant from the perspective of shared responsibility for AM.
The self-assessment for the ‘planning and decision contexts’ was performed by all the assetowners involved from each of the NSR countries together. This focus was adopted to reflect the sharedresponsibility for the implementation of AM between different asset owners. In the Netherlands,for example, the Regional Water Authorities are mostly involved with AM at the tactical and operationalcontext, and less with strategic AM.
The results of the interactive session were reported (using Google Forms) as the consensusmaturity levels, along with practical examples to support the judgement of maturity. This informationwas collated by the scientific team and translated into illustrations, including spider diagrams. In afurther technical workshop, the results of the self-assessment of maturity were analysed and comparedby the asset owners and scientific team. This served as a validation step to ensure consistency inthe interpretation of the maturity levels and in the judgements on maturity. This led to some minoradjustments in maturity levels for some asset owners. This validation step also highlighted the pitfallaround asset owners ‘not knowing that they did not know’, i.e., exposing knowledge needs that wereessential for effective AM. To avoid this pitfall, it was agreed to keep the option open for asset ownersto adjust their own baseline in the years to come (that is, in hindsight).
In the second round of the maturity analysis, the asset owners had the option to adjust the originalbaseline level assessments where they had a better view of the maturity they had in the beginningof the project, i.e., hindsight adjustments. Two asset owners retrospectively modified their baselinematurity at this stage, and the revisions are used in this paper.
4. Results of The Maturity Analysis
4.1. Organizational Maturity
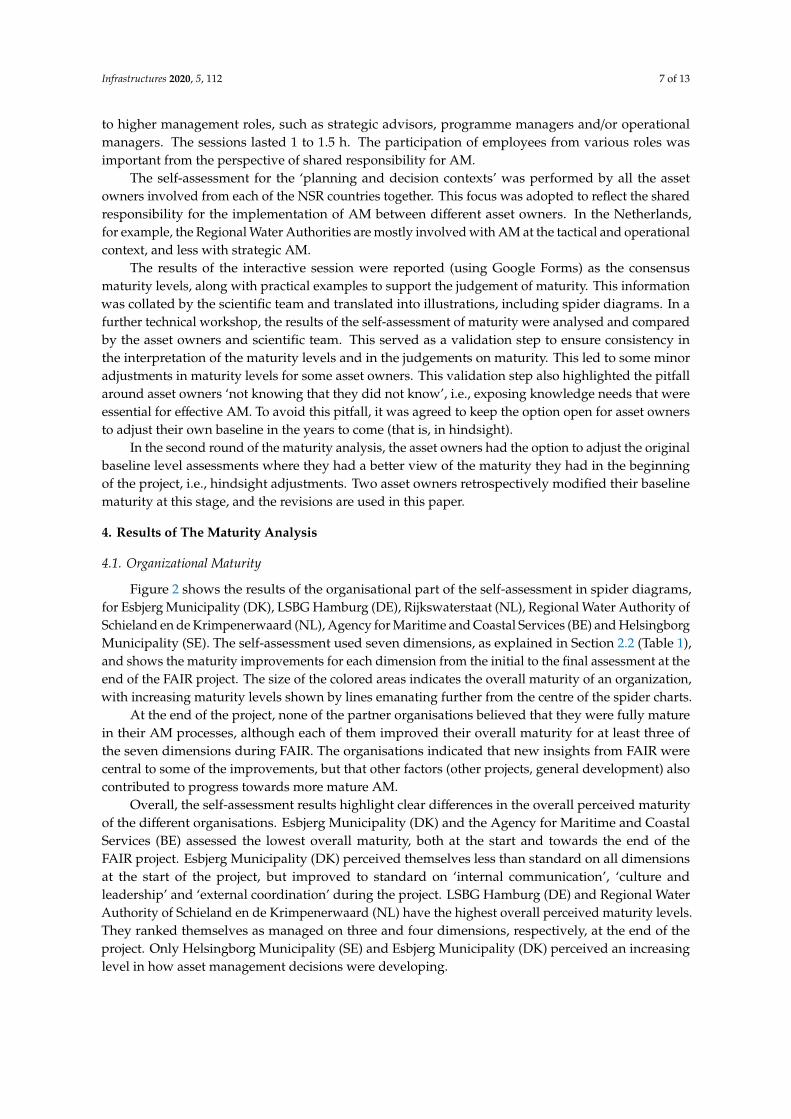
Figure 2 shows the results of the organisational part of the self-assessment in spider diagrams,for Esbjerg Municipality (DK), LSBG Hamburg (DE), Rijkswaterstaat (NL), Regional Water Authority ofSchieland en de Krimpenerwaard (NL), Agency for Maritime and Coastal Services (BE) and HelsingborgMunicipality (SE). The self-assessment used seven dimensions, as explained in Section 2.2 (Table 1),and shows the maturity improvements for each dimension from the initial to the final assessment at theend of the FAIR project. The size of the colored areas indicates the overall maturity of an organization,with increasing maturity levels shown by lines emanating further from the centre of the spider charts.
At the end of the project, none of the partner organisations believed that they were fully maturein their AM processes, although each of them improved their overall maturity for at least three ofthe seven dimensions during FAIR. The organisations indicated that new insights from FAIR werecentral to some of the improvements, but that other factors (other projects, general development) alsocontributed to progress towards more mature AM.
Overall, the self-assessment results highlight clear differences in the overall perceived maturityof the different organisations. Esbjerg Municipality (DK) and the Agency for Maritime and CoastalServices (BE) assessed the lowest overall maturity, both at the start and towards the end of theFAIR project. Esbjerg Municipality (DK) perceived themselves less than standard on all dimensionsat the start of the project, but improved to standard on ‘internal communication’, ‘culture andleadership’ and ‘external coordination’ during the project. LSBG Hamburg (DE) and Regional WaterAuthority of Schieland en de Krimpenerwaard (NL) have the highest overall perceived maturity levels.They ranked themselves as managed on three and four dimensions, respectively, at the end of theproject. Only Helsingborg Municipality (SE) and Esbjerg Municipality (DK) perceived an increasinglevel in how asset management decisions were developing.

Infrastructures 2020, 5, 112 8 of 13
Infrastructures 2019, 4, x FOR PEER REVIEW 7 of 12
4. Results of The Maturity Analysis
4.1. Organizational Maturity
Figure 2 shows the results of the organisational part of the self-assessment in spider diagrams,
for Esbjerg Municipality (DK), LSBG Hamburg (DE), Rijkswaterstaat (NL), Regional Water Authority
of Schieland en de Krimpenerwaard (NL), Agency for Maritime and Coastal Services (BE) and
Helsingborg Municipality (SE). The self-assessment used seven dimensions, as explained in Section
2.2 (Table 1), and shows the maturity improvements for each dimension from the initial to the final
assessment at the end of the FAIR project. The size of the colored areas indicates the overall maturity
of an organization, with increasing maturity levels shown by lines emanating further from the centre
of the spider charts.
Figure 2. Results of the self-assessment of maturity across seven organizational dimensions during
the FAIR project.
At the end of the project, none of the partner organisations believed that they were fully mature
in their AM processes, although each of them improved their overall maturity for at least three of the
seven dimensions during FAIR. The organisations indicated that new insights from FAIR were
Figure 2. Results of the self-assessment of maturity across seven organizational dimensions during theFAIR project.
The maturity improvements for the Dutch partners (Rijkswaterstaat and HHSK) were reportedlythe result of innovative FAIR insights, specifically on ‘information management’ and ‘externalcoordination’. The shift to a system-wide and strategic perspective, from a mono-perspective duringFAIR, is illustrated by the changes to the planned investments in dike reinforcement by the WaterBoard, and investments in the approach to the Flood Protection Hollandse IJssel storm surge barrier byRijkswaterstaat (see FAIR, [6] for more details). This shift to a system perspective gave a higher ratingfor external co-ordination by the HHSK between the start and end of the project.
Other improvements in self-assessments were due to a number of factors, examples are:
• Belgium (Flanders)—Implementation of ISO (International Organization for Standardization)standards for AM; more co-ordination due to management change (leadership); investmentmanagement system implemented (government wide);
• Sweden—More clarity of the indicators delivered, and a clearer view of the problems; the analyticalreport on the Helsingborg case example has helped understand the details and costs; greateropenness to innovation on the part of the organisation to the ideas of the specialist consultants.
Infrastructures 2020, 5, 112 9 of 13
4.2. Planning and Decision Contexts
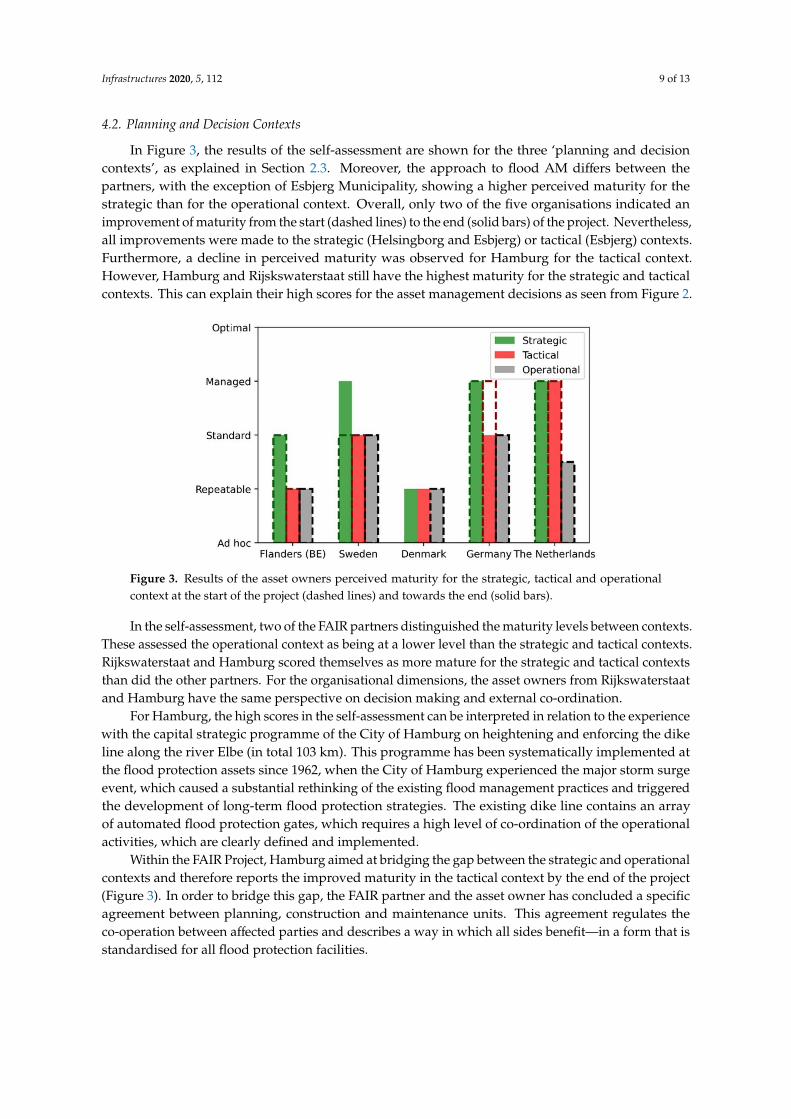
In Figure 3, the results of the self-assessment are shown for the three ‘planning and decisioncontexts’, as explained in Section 2.3. Moreover, the approach to flood AM differs between thepartners, with the exception of Esbjerg Municipality, showing a higher perceived maturity for thestrategic than for the operational context. Overall, only two of the five organisations indicated animprovement of maturity from the start (dashed lines) to the end (solid bars) of the project. Nevertheless,all improvements were made to the strategic (Helsingborg and Esbjerg) or tactical (Esbjerg) contexts.Furthermore, a decline in perceived maturity was observed for Hamburg for the tactical context.However, Hamburg and Rijskswaterstaat still have the highest maturity for the strategic and tacticalcontexts. This can explain their high scores for the asset management decisions as seen from Figure 2.
Infrastructures 2019, 4, x FOR PEER REVIEW 9 of 12
array of automated flood protection gates, which requires a high level of co-ordination of the
operational activities, which are clearly defined and implemented.
Within the FAIR Project, Hamburg aimed at bridging the gap between the strategic and operational
contexts and therefore reports the improved maturity in the tactical context by the end of the project
(Figure 3). In order to bridge this gap, the FAIR partner and the asset owner has concluded a specific
agreement between planning, construction and maintenance units. This agreement regulates the co-
operation between affected parties and describes a way in which all sides benefit—in a form that is
standardised for all flood protection facilities.
Figure 3. Results of the asset owners perceived maturity for the strategic, tactical and operational
context at the start of the project (dashed lines) and towards the end (solid bars).
5. Discussion on Improvement Potential
The results of the maturity analysis are based on a self-assessment. This has strengths and
weaknesses in determining how best to improve organisational AM processes within an organisation
and between those organisations with responsibility for flood risk management. The self-assessment,
by definition, reflects the perception of maturity—a perception that may or may not reflect reality. In
fact, the well-known “The Dunning-Kruger Effect” informs that sometimes self-assessments,
particularly at the early stages of maturity, can make individuals overestimate their abilities and skills
(Schlösser et al. [24]). While the focus of the current self-assessment were organizations as opposed
to individuals, still similar shortcomings come into play as the assessments are done by individuals.
In fact, there were several occasions where the respondents adjusted their baseline assessments at the
second round, illustrating this point. This also indicates a strength of the self-assessment approach:
apart from being a metric, the assessment process also acts as a learning event, providing an
opportunity for the respondents to reflect and learn about the maturity of their own organizations.
This is further enhanced by (a) opportunities to brainstorm across organizations as the sessions were
organized in the same physical space with plenary discussions, and (b) sessions were also facilitated
by the knowledge partners, who interacted with the respondents. The key strength of the maturity
analysis is in the potential to drive improvements to AM in an organisation or across the various
institutions engaged in flood risk management within a given jurisdiction. Therefore, the results
shown here should not be interpreted as a comparison between organizations or countries (assuming
the FAIR partner is representative); although this may be useful in highlighting differences in AM
practice, it is not an assessment of who is better than whom. The maturity assessment enables
organizations to highlight areas of potential complacency when shared across the organization
(where the self-assessment may overstate maturity), as well as highlighting those areas of AM that
are perceived to be less developed and therefore a focus for improvement. This includes how effective
various parts of one organisation are in working together, or how effective the processes are across
Figure 3. Results of the asset owners perceived maturity for the strategic, tactical and operationalcontext at the start of the project (dashed lines) and towards the end (solid bars).
In the self-assessment, two of the FAIR partners distinguished the maturity levels between contexts.These assessed the operational context as being at a lower level than the strategic and tactical contexts.Rijkswaterstaat and Hamburg scored themselves as more mature for the strategic and tactical contextsthan did the other partners. For the organisational dimensions, the asset owners from Rijkswaterstaatand Hamburg have the same perspective on decision making and external co-ordination.
For Hamburg, the high scores in the self-assessment can be interpreted in relation to the experiencewith the capital strategic programme of the City of Hamburg on heightening and enforcing the dikeline along the river Elbe (in total 103 km). This programme has been systematically implemented atthe flood protection assets since 1962, when the City of Hamburg experienced the major storm surgeevent, which caused a substantial rethinking of the existing flood management practices and triggeredthe development of long-term flood protection strategies. The existing dike line contains an arrayof automated flood protection gates, which requires a high level of co-ordination of the operationalactivities, which are clearly defined and implemented.
Within the FAIR Project, Hamburg aimed at bridging the gap between the strategic and operationalcontexts and therefore reports the improved maturity in the tactical context by the end of the project(Figure 3). In order to bridge this gap, the FAIR partner and the asset owner has concluded a specificagreement between planning, construction and maintenance units. This agreement regulates theco-operation between affected parties and describes a way in which all sides benefit—in a form that isstandardised for all flood protection facilities.
Infrastructures 2020, 5, 112 10 of 13
5. Discussion on Improvement Potential
The results of the maturity analysis are based on a self-assessment. This has strengths andweaknesses in determining how best to improve organisational AM processes within an organisationand between those organisations with responsibility for flood risk management. The self-assessment,by definition, reflects the perception of maturity—a perception that may or may not reflect reality.In fact, the well-known “The Dunning-Kruger Effect” informs that sometimes self-assessments,particularly at the early stages of maturity, can make individuals overestimate their abilities and skills(Schlösser et al. [24]). While the focus of the current self-assessment were organizations as opposedto individuals, still similar shortcomings come into play as the assessments are done by individuals.In fact, there were several occasions where the respondents adjusted their baseline assessments at thesecond round, illustrating this point. This also indicates a strength of the self-assessment approach:apart from being a metric, the assessment process also acts as a learning event, providing an opportunityfor the respondents to reflect and learn about the maturity of their own organizations. This is furtherenhanced by (a) opportunities to brainstorm across organizations as the sessions were organized in thesame physical space with plenary discussions, and (b) sessions were also facilitated by the knowledgepartners, who interacted with the respondents. The key strength of the maturity analysis is in thepotential to drive improvements to AM in an organisation or across the various institutions engagedin flood risk management within a given jurisdiction. Therefore, the results shown here should notbe interpreted as a comparison between organizations or countries (assuming the FAIR partner isrepresentative); although this may be useful in highlighting differences in AM practice, it is not anassessment of who is better than whom. The maturity assessment enables organizations to highlightareas of potential complacency when shared across the organization (where the self-assessment mayoverstate maturity), as well as highlighting those areas of AM that are perceived to be less developedand therefore a focus for improvement. This includes how effective various parts of one organisationare in working together, or how effective the processes are across the various organisations with someresponsibilities for flood AM. The best use of maturity self-assessment is as a longitudinal assessmenttool for a specific organization.
The maturity assessment has exposed several common challenges that may need to be improvedwithin an organisation for effective and adaptive AM. The need to: (i) better link strategic andoperational planning; (ii) more effectively share asset information; and (iii) better co-ordinate with otherinternal or external organisations to deliver multi-functional assets and multi-beneficial AM activities.
Various methods and tools have emerged to help address these challenges (e.g., EnvironmentAgency [25]; Klerk and Den Heijer [23]). These recognize the need to prioritise limited resourcesand take account of present and future uncertainties, but, to provide meaningful support to AM,any methods and tools used must be (adapted from Sayers et al. [17]):
• Systems-based—Recognise that flood defence assets behave as a system, as it is the performanceof the asset system as a whole (and not necessarily the performance of an individual asset) as thesystem responds under a wide range of loading;
• Evidence-based—Recognise the need for transparent and auditable/challengeable evidence.Central to this is formally acknowledging uncertainty in the asset data and the associated analysis(in credible and meaningful terms);
• Hierarchical—Decisions can never be based on perfect/complete information and the FAIRframework (Figure 1) includes different decision contexts. Allowing for progressive refinementof the data and analysis to reflect the demands of the decision at hand (being just sufficient toensure a robust choice and one that further refinement would not alter) is central to developing anefficient AM process and ensuring an effective ‘handshake’ between strategy and operation;
• Wide ranging—Effective flood risk management needs to be set in the context of the portfolio ofmeasures required to deliver multi-layers of safety (Gersonius et al. [26]). Fixed and operationalflood protection assets must be seen as only one, albeit important, component of a wider flood risk
Infrastructures 2020, 5, 112 11 of 13
management strategy (where structural and non-structural measures act in concert to manageflood risk, meaning that the response of one asset can compensate for another where the responseis inadequate).
6. Conclusions
Maturity assessment models can provide a structured approach to help to assess the effectivenessby which asset owners have and are implementing AM approaches. This paper has introducedthe use of a modified asset management (AM) maturity assessment (IM3), uniquely interpretedfor use by flood protection infrastructure owners and operators. The matrix has been used by thesix asset operating partners to self-assess the maturity changes in their organisational approach toadaptive asset management at the start and again at the end of the Interreg IV North Sea RegionFAIR project. Maturity levels were determined for the six organizations in the context of the FAIRframework using a five-fold scoring system and seven dimensions: (1) asset management decisions;(2) information management; (3) internal co-ordination; (4) external co-ordination; (5) outsourcingactivities; (6) processes and roles; and (7) culture and leadership. The maturity assessmentprocess encouraged self-reflection within the organizations, as shown by some of the organizationsretrospectively adjusting their baseline maturities after two years of progress (e.g., the Regional WaterAuthority of Schieland en de Krimpenerwaard).
The unique maturity assessment showed that there were clear differences in the approaches beingused for flood AM between each of the FAIR organisations from the baseline maturity assessment atthe start of the project. FAIR created a unique opportunity for co-learning and knowledge exchangebetween the partner organisations, helping to collectively identify the challenges and also the keycomponents of adaptive AM for optimising the details of, and AM process for, flood protectioninfrastructure. Between the baseline assessment and the second assessment, all six asset ownerorganisations perceived an overall improvement in maturity for at least two of the seven dimensions.These improvements were, in part, attributable to the development and utilisation of the FAIRframework (Figure 1) by the partner organisations. The framework connects the strategic, tactical andoperational contexts of AM and, therefore, ensures that decisions are made using a long-term andwhole system perspective. For example, the collaboration between the Regional Water Authority ofSchieland en de Krimpenerwaard and Rijkswaterstaat on the Hollandsche IJssel storm surge barrier(adopting a whole system perspective) resulted in maturity improvements for both organisations.
Supplementary Materials: The following are available online at http://www.mdpi.com/2412-3811/5/12/112/s1,Table S1: The 5-point scale and the 7 maturity indicators of Volker et al. (2013) as used in FAIR, Table S2:The 5-point maturity levels and definitions linked to the 3 decision contexts in the FAIR framework.
Author Contributions: Conceptualization, B.G., P.S. and J.R.; methodology, B.G., F.d.H. and W.J.K.;writing—original draft preparation, B.G.; writing—review and editing, A.P., N.M. and R.M.A.; visualization, B.G.and W.J.K.; project lead, B.V.; funding acquisition, B.V. All authors have read and agreed to the published versionof the manuscript.
Funding: This research was funded by North Sea Region Programme 2014–2020, through the FAIR Project.
Conflicts of Interest: The authors declare no conflict of interest.
References
1. National Flood and Coastal Erosion Risk Management Strategy for England. Available online:https://www.gov.uk/government/publications/national-flood-and-coastal-erosion-risk-management-strategy-for-england--2?utm_source=b4eee61e-0967-4dba-8ee4-5b15f40e6bc8&utm_medium=email&utm_campaign=govuk-notifications&utm_content=immediate (accessed on 8 December 2020).
2. Jorissen, R.; Kraaij, E.; Tromp, E. Dutch flood protection policy and measures based on risk assessment.E3S Web Conf. 2016, 7, 20016. [CrossRef]
3. Rijke, J.; Ashley, R.; Gersonius, B.; Sakic, R. Adaptation Mainstreaming for Achieving Flood Resilience in Cities;Cooperative Research Centre for Water Sensitive Cities: Melbourne, Australia, 2016.

Infrastructures 2020, 5, 112 12 of 13
4. Alves, H. Co-creation and innovation in public services. Serv. Ind. J. 2013, 33, 671–682. [CrossRef]5. Sayers, P.B.; Simm, J.D.; Wallis, M.; Buijs, F.; Flikweert, J.; Hamer, B. Developing a performance—based
management system for flood and coastal defence assets. In Proceedings of the 41st Defra Flood and CoastalManagement Conference, York, UK, 4–6 July 2006.
6. FAIR. 2020. Available online: https://northsearegion.eu/fair/ (accessed on 8 December 2020).7. Volker, L.; Ligtvoet, A.; Van Den Boomen, M.; Wessels, L.P.; Van Der Velde, J.; Van Der Lei, T.E.; Herder, P.M.
Asset management maturity in public infrastructure: The case of Rijkswaterstaat. Int. J. Strateg. Eng.Asset Manag. 2013, 1, 439–453. [CrossRef]
8. Volker, L.; Van Der Lei, T.; Ligtvoet, A. Developing a maturity model for infrastructural asset managementsystems. In Proceedings of the Conference on Applied Infrastructure Research, Berlin, Germany, 7–8 October2011; pp. 7–8.
9. Paulk, M. Capability Maturity Model for Software. Encyclopedia of Software Engineering; Software EngineeringInstitute, Carnegie Mellon University: Pittsburgh, PA, USA, 1993.
10. Feunekes, U.; Palmer, S.; Feunekes, A.; Macnaughton, J.; Cunningham, J.; Mathisen, K. Taking the politicsout of paving: Achieving transportation asset management excellence through OR. Interfaces 2011, 41, 51–65.[CrossRef]
11. Laue, M.; Brown, K.; Scherrer, P.; Keast, R. Integrated strategic asset management: Frameworks anddimensions. In Infranomics; Springer: Cham, Switzerland, 2014.
12. Winter, C.-P.; Fabry, C. Closing the implementation gap for SMEs-tools for enabling asset management insmall and medium enterprises. In Asset Management; Springer: Heidelberg, Germany, 2012.
13. Hillson, D. Assessing organisational project management capability. J. Facil. Manag. 2003, 2, 298–311.[CrossRef]
14. Williams, K.; Robertson, N.; Haritonov, R.C.; Strutt, J. Reliability capability evaluation and improvementstrategies for subsea equipment suppliers. Underw. Technol. 2003, 25, 165–173. [CrossRef]
15. Mahmood, M.N.; Dhakal, S.P.; Wiewiora, A.; Keast, R.; Brown, K. Towards an integrated maturity modelof asset management capabilities. In Proceedings of the 7th World Congress on Engineering Asset Management(WCEAM 2012), Daejeon City, Korea, 8–9 October 2012; Springer: Heidelberg, Germany, 2015; pp. 431–441.
16. Chemweno, P.; Pintelon, L.; Horenbeek, A.V.; Muchiri, P.N. Asset maintenance maturity model: Structuredguide to maintenance process maturity. Int. J. Strateg. Eng. Asset Manag. 2015, 2, 119–135. [CrossRef]
17. Sayers, P.B.; Wallis, M.; Simm, J.D.; Baxter, G.; Andryszewski, T. Towards the Next Generation of Risk-BasedAsset Management Tools; Pender, G., Flaukner, H., Eds.; Blackwell Publishing Ltd.: Oxford, UK, 2011.
18. Marlow, D.R.; Burn, S. Effective use of condition assessment within asset management. J. Am. WaterWorks Assoc. 2008, 100, 54–63. [CrossRef]
19. Ward, B. Integrated Asset Management Systems for Water Infrastructure. Doctor Thesis, University of Exeter,Exeter, UK, 2015.
20. Alegre, H.; Covas, D. Integrated Planning of Urban Water Services: A Global Approach. TRUST Manual ofBest Practice. 2015. Available online: https://riunet.upv.es/handle/10251/53758 (accessed on 2 December 2020).
21. Alegre, H.; Coelho, S.T.; Vitorino, D.; Covas, D. Infrastructure asset management—The TRUST approach andprofessional tools. Water Sci. Technol. Supply 2016, 16, 1122–1131. [CrossRef]
22. Sharp, M.; Wallis, M.; Deniaud, F.; Hersch-Burdick, R.; Tourment, R.; Matheu, E.; Seda-Sanabria, Y.;Wersching, S.; Veylon, G.; Durand, E. The International Levee Handbook; CIRIA: London, UK, 2013.
23. Klerk, W.; Den Heijer, F. A framework for life-cycle management of public infrastructure. Life-Cycle ofEngineering Systems: Emphasis on Sustainable Civil Infrastructure. In Proceedings of the Fifth InternationalSymposium on LifeCycle Civil Engineering (IALCCE 2016), Delft, The Netherlands, 16–19 October 2016; CRC Press:Boca Raton, FL, USA, 2016; p. 101.
24. Schlösser, T.; Dunning, D.; Johnson, K.L.; Kruger, J. How unaware are the unskilled? Empirical tests of the“signal extraction” counterexplanation for the Dunning–Kruger effect in self-evaluation of performance.J. Econ. Psychol. 2013, 39, 85–100. [CrossRef]
25. Environment Agency. PAMS (Performance-Based Asset Management System)—Phase2, Outcome Summary Report.Flood and Coastal Defence R&D Programme Science Report SC040018/SR1; Environment Agency: Bristol, UK,2010; In Press.

Infrastructures 2020, 5, 112 13 of 13
26. Gersonius, B.; Van Buuren, A.; Zethof, M.; Kelder, E. Resilient flood risk strategies: Institutional preconditionsfor implementation. Ecol. Soc. 2016, 21, 28. [CrossRef]
Publisher’s Note: MDPI stays neutral with regard to jurisdictional claims in published maps and institutionalaffiliations.
© 2020 by the authors. Licensee MDPI, Basel, Switzerland. This article is an open accessarticle distributed under the terms and conditions of the Creative Commons Attribution(CC BY) license (http://creativecommons.org/licenses/by/4.0/).