Embed Size (px)
Citation preview
MAVIS real-time control system: a high-end implementationof the COSMIC platform
D. Gratadoura,b, J. Bernarda, N. Douceta, F. Ferreirab, A. Sevinb, R. Biasic, and F. Rigauta
aAAO-Stromlo, Australian National University, Cotter Road, Weston, ACT2600, AustraliabLESIA, Observatoire de Paris, Universite PSL, CNRS, Sorbonne Universite, Universite de
Paris, 5 place Jules Janssen, 92195 Meudon, FrancecMicrogate, Italy
ABSTRACT
To provide data sharper than JWST and deeper than HST, MAVIS (the MCAO Assisted Visible Imager andSpectrograph) will be driven by a state-of-the-art real-time control (RTC) system leveraging cutting edge tech-nologies both in terms of hardware and software. As an implementation of the COSMIC platform, the MAVISRTC will host a hard RTC module, fed in quasi real-time with optimized parameters from its companion softRTC. In order to meet the AO performance requirement in the visible, the overall real-time pipeline latencyshould be in the range of few hundreds microseconds ; and, considering the several high order wavefront sensors(WFS) of the current optical design, the specifications of the hard RTC module are very close to those contem-plated for ELT first light SCAO systems, making it as an at scale pathfinder for these future facilities. In thispaper, we will review the hardware and software design and prototyping activities led during phase A of theproject.
Keywords: Adaptive optics, ELT, RTC, GPU, COSMIC
1. INTRODUCTION TO THE COSMIC PLATFORM
COSMIC is a platform for AO Real-Time Control (RTC), comprising both a hardware architecture and a softwarestack, fulfilling the needs of the many flavors of AO at various scales including ELT instruments. It includes theso-called hard real-time controller (HRTC), the soft real-time cluster (SRTC), an optimized middleware solutionand a simulator (both hardware and software). COSMIC is designed to cover the requirements of the mostchallenging AO instruments, while maximizing efficiency and minimizing cost and complexity.
The hardware design relies on the use of a dense clusters of GPUs and many-cores, integrating an optimisedhardware interface unit based on the FPGA technology. Analysing past and current technology trends togetherwith future trends in High Performance Computing (HPC), these hardware choices have been driven by:
• the end of Moore’s law on a pure hardware standpoint and the advent of highly parallel processing featuringheterogeneous hardware accelerators devices;
• the so-called memory wall problem due to the difference on the operational frequencies of the CPU andthe main memory, (exacerbated on heterogeneous computing due to host-to-accelerator communications),and how the emergence of High Bandwidth Memory (HBM) as a new industry standard is partly solvingit;
• the roofline model, used to evaluate performance achievable on a given processor from its specificationsand how a typical AO workload is mapped on this model, showing clear benefits of using HBM equippedaccelerators;
• the bottleneck for applications running on clusters of distributed processors due to network communicationlatency;
Further author information: (Send correspondence to D. Gratadour)D. Gratadour: E-mail: damien.gratadour at anu.edu.au

• the emergence of dense nodes concepts from all mainstream vendors, composed of clusters of GPUs tightlycoupled through “intra-connect” not only optimised for high bandwidth between the GPUs but also forlow latency, to bypass this bottleneck;
• the prevalence of GPU acceleration devices on the HPC market today, with a clear domination of NvidiaGPUs (see Top500 list).
To ensure long term maintainability with a guarantee of performance, the software platform relies on off-the-shelf libraries and a both optimised and modular approach to build a variety of pipelines able to cope withvarious AO flavors, from single conjugate to multi-conjugate and multi-object AO. This comprehensive softwarestack includes the hard real-time pipeline as well as a feature-rich supervisory software, including performancemonitoring and loop optimisation tools together with a sequencer, a user interface and mandatory services(alarms, logs) currently under heavy development, with the right level of abstraction to ensure compatibilitywith a variety of observatories frameworks.
As shown by benchmarking results provided in this paper, the hard real-time solution is already deliveringthe required performance in terms of throughput and jitter on existing hardware. In addition, it can scale to thewhole suite of ELTs instruments. The most complex and compute intensive part of the supervisor bundle is, aswell, already meeting the specifications of the most challenging AO concepts for ELTs.
This software platform also includes a comprehensive numerical simulation package, COMPASS, fully inte-grated with the RTC framework to provide a tool for checking performance and stability of the RTC pipeline aswell as a validation tool for future integration of innovative control schemes.
In this paper, we will review the hardware design and software architecture and provide relevant benchmarksat the output of phase A for MAVIS.
2. COSMIC DESIGN FOR MAVIS
The AO RTC for MAVIS is based on an implementation of the COSMIC platform matching the needs fordiffraction limited observations in the visible wavelengths on the VLT. The main features include:
• a HRTC hardware platform based on a single server hosting a high density GPU cluster;
• a low latency data acquisition solution based on the µXLink concept from Microgate, providing the flexi-bility required to handle the multiple streams of data from the various WFS and to the DMs and possiblyother hardware.
• a hard RTC software stack based on a comprehensive software bundle (a.k.a. OCEAN1), providing a setof functions including, inter-process communication, business units management, a configuration daemonand monitoring tools.
• a soft RTC software stack, including the SHIPS and TIDES bundles, comprising high performance andportable software for the identification of turbulence parameters together with an optimized pipeline forthe computation of the tomographic reconstruction. Additional loop supervision and optimization toolsare also included together with data distribution services.
• tight coupling between these components and a realistic and fast end-to-end simulator based on the COM-PASS platform.2
2.1 HRTC design
The current baseline dimensioning for MAVIS includes 8 Laser Guide Star (LGS) wavefront sensors (WFS) withabout 40x40 subapertures each, totaling about 20k slopes ; and 3 Deformable Mirrors (DM) including the VLTDeformable Secondary Mirror (DSM) and 2 additional post-focal DMs, totaling about 5k actuators.3
Assuming a typical sampling time of 1ms (to keep a maximum up-time even during the low Sodium season)and obtain an 0dB AO rejection bandwidth better than 60Hz, the overall delay should be of the order of 2 frames
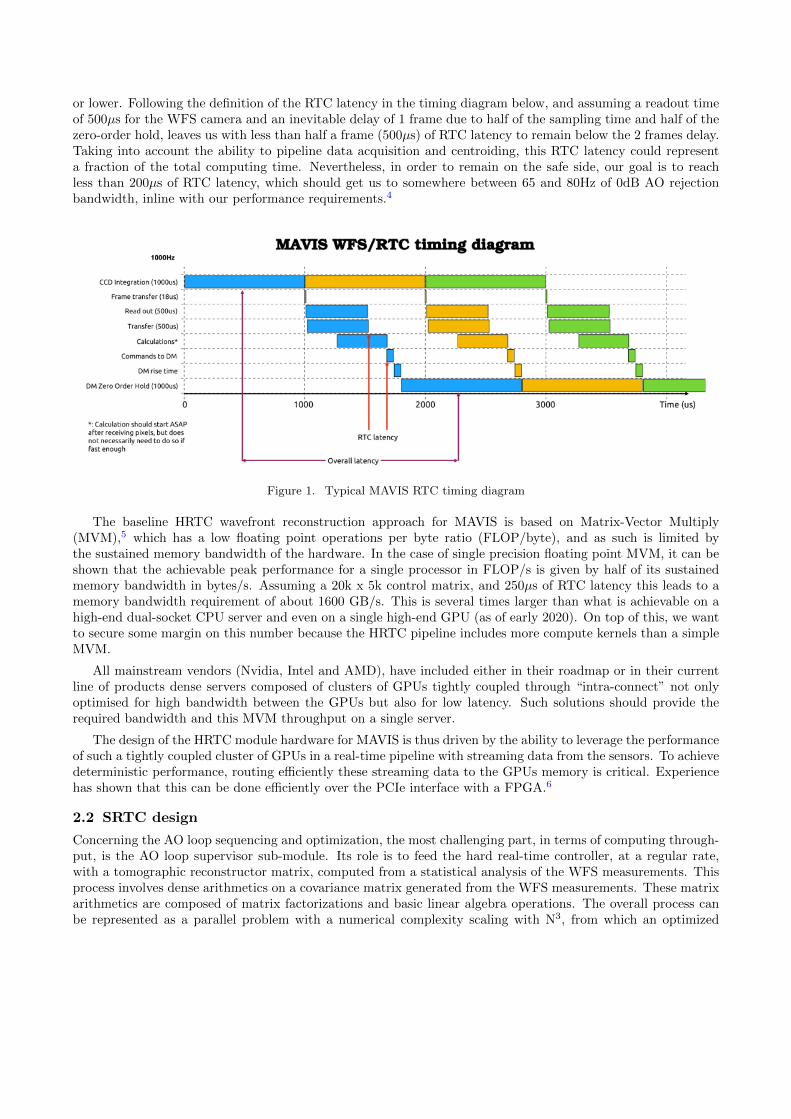
or lower. Following the definition of the RTC latency in the timing diagram below, and assuming a readout timeof 500µs for the WFS camera and an inevitable delay of 1 frame due to half of the sampling time and half of thezero-order hold, leaves us with less than half a frame (500µs) of RTC latency to remain below the 2 frames delay.Taking into account the ability to pipeline data acquisition and centroiding, this RTC latency could representa fraction of the total computing time. Nevertheless, in order to remain on the safe side, our goal is to reachless than 200µs of RTC latency, which should get us to somewhere between 65 and 80Hz of 0dB AO rejectionbandwidth, inline with our performance requirements.4
Figure 1. Typical MAVIS RTC timing diagram
The baseline HRTC wavefront reconstruction approach for MAVIS is based on Matrix-Vector Multiply(MVM),5 which has a low floating point operations per byte ratio (FLOP/byte), and as such is limited bythe sustained memory bandwidth of the hardware. In the case of single precision floating point MVM, it can beshown that the achievable peak performance for a single processor in FLOP/s is given by half of its sustainedmemory bandwidth in bytes/s. Assuming a 20k x 5k control matrix, and 250µs of RTC latency this leads to amemory bandwidth requirement of about 1600 GB/s. This is several times larger than what is achievable on ahigh-end dual-socket CPU server and even on a single high-end GPU (as of early 2020). On top of this, we wantto secure some margin on this number because the HRTC pipeline includes more compute kernels than a simpleMVM.
All mainstream vendors (Nvidia, Intel and AMD), have included either in their roadmap or in their currentline of products dense servers composed of clusters of GPUs tightly coupled through “intra-connect” not onlyoptimised for high bandwidth between the GPUs but also for low latency. Such solutions should provide therequired bandwidth and this MVM throughput on a single server.
The design of the HRTC module hardware for MAVIS is thus driven by the ability to leverage the performanceof such a tightly coupled cluster of GPUs in a real-time pipeline with streaming data from the sensors. To achievedeterministic performance, routing efficiently these streaming data to the GPUs memory is critical. Experiencehas shown that this can be done efficiently over the PCIe interface with a FPGA.6
2.2 SRTC design
Concerning the AO loop sequencing and optimization, the most challenging part, in terms of computing through-put, is the AO loop supervisor sub-module. Its role is to feed the hard real-time controller, at a regular rate,with a tomographic reconstructor matrix, computed from a statistical analysis of the WFS measurements. Thisprocess involves dense arithmetics on a covariance matrix generated from the WFS measurements. These matrixarithmetics are composed of matrix factorizations and basic linear algebra operations. The overall process canbe represented as a parallel problem with a numerical complexity scaling with N3, from which an optimized

implementation should maximize the usage of computing cores rather than the memory bus. Optimizing thecompute performance means higher update rate of the reconstructor matrix hence better image quality at theoutput of the telescope and incidentally better science return. This computational load is quite significant foran AO system at the scale of MAVIS for the VLT but can be handled efficiently using GPUs.
Over the past years, significant work have demonstrated the performance of an efficient implementationof the control matrix computation for tomographic AO on multicore system with multiple GPUs using high-performance numerical library for solving large dense linear algebra problems with hardware accelerators.7–9
Such high performance implementation relies on the use of a dynamic run time system to schedule computationaltasks simultaneously on various compute devices and a data flow programming model based on the use of directacyclic graphs for an efficient scheduling in which the tasks are executed out-of-order and scheduled accordingto a critical path for the execution. These implementations outperform asymptotically previous state-of-the-artand runs at an unprecedented scale. The figure below shows the consistent performance improvement obtainedwith GPUs, as compared to CPUs based architecture, for the computation of the tomographic reconstructor,since 2012.
Figure 2. Time-to-solution for the computation of the tomographic reconstructor as a function of the measurementscovariance matrix size and hardware generations.
The design of the SRTC module hardware for MAVIS is thus driven by the use of clusters of GPUs as tightlycoupled as possible. While most of the benchmarking presented in this paper is based on the use of high-endGPU clusters with a dedicated ”intra-connect”, the compliance with such a hardware platform with variousobservatories standards is still a matter of debate.
3. HRTC SUB-SYSTEM
3.1 HRTC software architecture
In a previous analysis,10 we proposed to prototype a real-time pipeline, using the concept of persistent kernelscoupled to direct memory access on the GPU. However, a major drawback of the persistent kernel approach isthe need to develop custom kernels which severely impacts the complexity of code and the ability to maintainit over the long term. We are now proposing a hybrid approach, with a smart active wait mechanism, similar towhat is used in the persistent kernel approach, coupled to a more standard programming model for the computekernels allowing more flexibility in terms of:
• using standard optimized libraries such as CUBLAS, as much as possible in the pipeline

• implementing various BUs, for additional processing tasks that can be switched on and off
A detailed description of the HRTC software architecture is provided in.1
3.2 HRTC benchmarking
In order to get realistic latencies estimates, we have run a series of end-to-end tests including most of the HRTCpipeline (wavefront processing, wavefront reconstruction) and performed profiling, first over a large number ofiterations, after several optimization rounds. For these tests we have used 4 GPUs of a DGX-1 platform fromNvidia, equipped with Tesla V100 GPUs.11
In terms of software, the final setup we used in the validation tests is a prototype of the final HRTC softwaresolution discussed above, with most of the building blocks working together:
• a basic high-level user interface is launching several Marlin Business Units (BUs) to cover the main pipelineoperations
• each of these BUs is connected to both the main Redis database containing all the system parameters andtwo shared memory interfaces: one for FPS (configuration parameters of the BUs) and one for real-timedata
• the shared memory interfaces all rely on the Octopus abstraction layer to provide various kinds of sharedmemory (CPU or GPU) seamlessly
• another process is used as a fast simulator, receiving the DM commands sent at the end of the pipelineand mimicking the production of a new WFS frame
• once a new frame is available the HRTC kernels perform the computations, sequentially through severalMarlin BUs and produce a command vector, made available on shared memory to be consumed by the fakesimulator
• an additional Marlin BU is used for precision timing. Several strategies have been tested and the mostaccurate one relies on CUDA events
• a Kraken monitoring process can be launched from the user interface to check status and activity in thethreads
Several optimization strategies have been studied to obtain the results outlined below:
• each process involved in the real-time pipeline is shielded and given RT priorities at the OS level
• CUDA MPS is used to manage the multiple processes launching kernels on the same GPU and appropriateGPU flags are set
• resources allocation on the GPU is adapted for each BU, taking into account the difference in terms ofworkload, relying on CUDA MPS to allocate these resources properly at runtime
• BUs with limited workload such as centroiding on each WFS are regrouped into a container so that onlyone process is consumed
• this enables the use of CUDA streams and the kernels in a container can be pipelined
• synchronization between processes is done through active wait based on smart memory polling rather thana semaphore-based wait/notify mechanism
• precision timing is done through CUDA events rather than a dedicated CPU process

Using multiple Marlin BUs provides full flexibility over the pipeline, with the ability to add or removeprocessing tasks in the pipeline without a full reconfiguration. Using containers, we are able to reduce thenumber of actual concurrent processes and leverage CUDA streams to pipeline efficiently both data transfer andkernels execution. The resolution of the precision timer using CUDA events is of the order of 1µs.
For benchmarking purposes, we have tested a simple pipeline realizing the critical / most compute intensivetasks:
• the fast simulator is producing, at a regular rate (1kHz) a group of fake WFS frames, emulating theacquisition of multiple WFS producing concurrently one frame each, and uploading this jumbo frame ontothe master GPU main memory, while notifying the timing BU to start measuring time
• several BU containerized into a single process perform centroiding on this group of WFS frames, fullypipelined with the frame transfer, and leveraging concurrent execution using CUDA streams on the masterGPU a large MVM operation is launched on multiple GPUs
• results are gathered on the master GPU, the corresponding vectors are summed into one and the integratorlaw is performed on the master GPU the fake simulator is notified that pipeline execution has finished,together with the timing BU to stop timing
• at this point all the processes end up in active wait, until the fake simulator produces a new jumbo frame
We show below an execution profile obtained with the CUDA profiler. Note that, when the profiler is running,precision timing is not possible, since the profiler probes may impact the execution. In the example below, wehave considered 6 LGS WFS (40x40) only and 3 NGS WFS (2x2 subaps).
Figure 3. Execution profile zoomed over a pair of iterations. The incoming “jumbo” frame transfer is shown in orange andthe other colors represent compute or active wait kernels. The first group of lines is the total execution profile (includingall GPUs and all streams) and the lines below show the detailed execution profile per stream and per GPU.
This profile shows that most of the time between two incoming frames is spent “active waiting” whichprovides enough margin to perform additional, non critical tasks. This can be leveraged to perform telemetrytasks, without impacting performance. On top of this, there is even more margin on the slave GPUs, whichare only performing a fraction of the MVM. This could be leveraged in a more complex pipeline to performadditional tasks such as Pseudo-Open Loop slopes reconstruction.

Figure 4. More details on the same execution profile, showing concurrent CUDA streams and memory transfer as wellas MVM on multiple GPU.
The scalability of this approach up to the current baseline dimensioning for MAVIS has been studied andresults are provided in the figure below. In this case, the system configuration included 8 LGS WFS 40x40 (1200valid sub-apertures per WFS) and 3 NGS WFS 2x2 (4 valid) and 5404 actuators distributed over 3 DMs. Weperformed a long run of 1M iterations with a camera emulator providing WFS images at a 1kHz frame rate,showing that no observed outlier during this period of time.
Figure 5. Execution profile over a long run (20 minutes of operation) for a MAVIS baseline system dimensioning (8 LGSWFS + 3 NGS WFS and 5k actuators)

Figure 6. Histogram of the execution time over a long run (20 minutes of operation) for a MAVIS baseline systemdimensioning (8 LGS WFS + 3 NGS WFS and 5k actuators).
From this results we obtain the following statistics on the execution profile:
• Mean time-to-solution (pure RTC latency) : ≈262µs
• P2V jitter: ≈45µs
• RMS jitter: ≈6µs
With this benchmarking, we have demonstrated our ability to perform the most demanding tasks of theMAVIS pipeline, on multiple GPUs, within the target envelope of 250µs (assumed target to be confirmed follow-ing further simulation/analysis and flow down from the TLR to the RTC subsystem specifications), includingtelemetry offload and regular command matrix updates. It has to be noted that significant margin exists, inparticular on the slaved GPUs, and will be leveraged in the future phases of the project to implement a morecomplex pipeline.
With these benchmarks, we have shown that a very low latency (of the order of 250µs) can be reachedwith simple optimization recipes while keeping a high level of modularity in the pipeline and very low jitter(of the order of few µs RMS) and enough margin is now available to run the additional tasks of the MAVISpipeline. This demonstration of an implementation of active wait using memory polling opens as well the wayto a better pipelining of the computation steps with the data transfer to reduce the overall RTC latency to the150µs level. This feature, fully integrated in the Marlin BU, can be coupled to efficient data acquisition throughthe GPUdirect mechanism.
We have thus also demonstrated the feasibility of GPUdirect using standard development tools available onthe µXComp board from Microgate, which is already available and similar, in terms of FPGA device and driver,to the µXlink board we plan to use. To do so, we have developed a small prototype based on the reference designavailable with the Arria 10 FPGA and the associated driver, to be implemented on the µXcomp board. In thistest, a simple DMA operation is performed between the µXcomp board and a GV100 GPU on a motherboardwith a single X86 socket. The server runs CentOS and standard development tools have been installed. We havecompared the bandwidth and latency achieved with the DMA engine included with the FPGA hard IP both to

CPU memory and GPU memory, with respect to buffer size. The results are shown in figure 2. The obtainedresults show that data transfer directly from the Microgate board to the GPU memory is at worst as efficientas transfer to CPU memory. For this test, we have implemented scatter/gather DMA with 128 descriptors. Toincrease the buffer size, we have modified the number of words per descriptor. The results show that similar tobetter bandwidth can be obtained from the µXComp board to the GPU as compared to the case with CPU.
Figure 7. bandwidth (left) and latency benchmarking for direct memory access from a FPGA interface to CPU memory(blue) and GPU memory (red) for various packet sizes.
For small buffer sizes, the workload is not able to saturate the bus and a floor latency of about 10µs isobserved. Reading eight ALICE cameras will require an overall buffer size of about 400kBytes. From the resultsbelow, this leads to a theoretical latency of about 60µs. We note here that this is almost 10 times smaller thanthe camera readout time of 500µs and we thus do not expect to introduce any additional latency with dataacquisition directly on the GPU.
4. SRTC SUB-SYSTEM
The SRTC software is composed of two main components:
• SHIPS: is a software stack gathering the sequencer, the user interface, services such as alarms and logshandling as well as compute intensive modules for supervising and optimizing the AO loop
• TIDES: is a software bundle covering the middleware domains for sending commands to the RTC andpublishing / receiving telemetry data
4.1 Command interface and data distribution
Concerning TIDES, the Telemetry Interface and Data Exchange Software, we have followed a similar approachas adopted for Octopus, by developing abstraction layers for the main functions in order to make the code baseagnostic to any particular software standards. The UML diagram below depicts the two abstraction layers devel-oped for both the command and the telemetry interfaces, together with examples of possible implementations,including:
• DDS, raw UDP and MUDPI for the telemetry interface
• ZeroMQ for the command interface
More implementations could be added in the future, depending on the evolution of standards and instrumentsspecifications.
A critical benefit from using these abstraction layers is our ability to adapt to different standards, withoutaffecting the code base. This is particularly relevant to cope with both the VLT and ELT frameworks and providea unified solution.
Figure 8 depicts the two main TIDES software components. The stack is composed of three main softwares:

Figure 8. TIDES concept for streamers and commands
4.2 Overall supervisory software
SHIPS, the Smart and High Performance Supervisory software is still under heavy development and we plan toleverage the extended experience of the COSMIC partners in designing, implementing and operating AO systemsto provide a feature-rich software stack covering the needs of most AO concepts.
The main features will include:
• Performance Monitor module: a number of routines to monitor the behavior of the AO system and its envi-ronment including seeing, Strehl ratio, PSF reconstruction and all associated calibrated data (background,flat field, reference slopes and NCPA)
• Optimizer module: a wide range of functionalities will be provided to the user, including optimized modalbasis computations, modal gains optimizations, centroid gains identification and optimization. Most ofthe core routines are already available from the COMPASS simulator and will be better integrated inthe SRTC software. On top of this, we are developing a tomographic AO supervisor (described below),together with predictive control and vibration mitigation. Here, close collaborations with instrumentsconsortia are contemplated to fit the needs of each instrument, while the COSMIC platform provides thetools for optimized implementations
• Sequencer and UI: we have plans for a Python-based sequencer, fully interfaced with TIDES and botha command line and a graphical UI (based on Qt). A prototype is already in place as a command lineinterface. The engineering GUI is inherited from COMPASS.
• Services module: this will be based on abstraction layers as well, to cope with various possible standardsfor logging and alarms. The online database will be consistent with the approach followed in OCEAN andwill be based on the Redis database.
These components are fairly well aligned with current development at ESO codenamed RTC Toolkit and theCOSMIC solution is designed to integrate the corresponding modules as they are made available. Our goal isnot to provide an alternative solution to the RTC toolkit but rather be able to integrate its components. Wehave superimposed the components of our software stack on the RTC Toolkit components, in the block diagrambelow, taken from the Toolkit specifications document.
4.3 Tomographic supervisor solution
The most challenging component of the SRTC software in terms of workload is the optimizer module and inparticular for tomography. We take here the example of the Learn and Apply scheme (see Vidal et al. 2012) inwhich computing a relevant tomographic reconstructor can be decomposed into five tasks:
• The first one, consists of computing an empirical covariance matrix of the measurements from the actualWFS
• The next step, so-called Learn, takes as input the empirical covariance matrix newly computed. Its objectiveis to retrieve (Learn) the atmospheric profile composed of three parameters per layer: the altitude, strengthand outer scale, as well as some particular system parameters (depending on how well the actual systemhas been calibrated). In order to do so, we rely on a model function, returning a covariance matrix ofmeasurements given parameters of the optical system which will be considered as invariant in the followingand the atmospheric parameters of interest.
• Once the atmospheric profile has been estimated, it can be used to generate, with the help of the samemodel function, the theoretical covariance matrix of the actual measurements, and the theoretical covariancematrices of virtual truth sensors measurements with the theoretical measurements of the actual WFS.
• The next step is the core of the supervisor and is so-called Apply. The objective of this step is to find thetomographic reconstructor derived from the matrices computed at the previous step, by solving a systemof linear equations through Cholesky factorization
• Finally, the tomographic reconstructor is multiplied by a control matrix. The result of this step is a changeof basis matrix, from the actual measurements to the DM’s commands, providing a way to control theDMs.
4.4 SRTC benchmarks
We have performed some benchmarking of both the Learn and Apply steps of the supervisor pipeline. Whilethis approach is not the current baseline for the loop supervision pipeline, it provides a good estimate in terms ofcompute load and achievable performance. These benchmarks were obtained on a DGX-1 server from NVIDIA,with the 2018 configuration, based on V100 GPUs hosting 16GB of glocal memory per GPU. Newest DGX-1configurations involve the same V100 GPUs with similar HBM2 memory but with increased capacity (up to 32GB of global memory per GPU) and we do not expect a significant speedup with this generation.
Concerning the Learn step, since this part of the pipeline consists mostly in the optimization of a score functionbased on the measurements covariance matrix obtained from the actual WFS data and a model function, ourimplementation is based on an optimized multi-GPU implementation of the Levenberg-Marquardt algorithm(in-house development).
The results are shown below, using 4 of the 8 GPUs onboard the DGX-1 server and for varying numbers ofturbulence parameters (respectively 10 and 40 layers) and varying matrix sizes (the MAVIS case is around themiddle of the X-axis: 20k).
These results show that a 40 layers turbulence profile can be obtained in about 80 sec for a 22k x 22kcovariance matrix on a DGX-1 server equipped with 8 V100 GPUs but using only half of it, which complies withthe requirement of a few minutes to update the tomographic reconstructor. This implementation relies mostlyon GPU resources and using limited CPU resources (a single process on a single core).

Figure 9. Performance in terms of time-to-solution for the parameter identification pipeline (a.k.a. Learn) in a 2-passprocess: first rough estimate on 10 parameters only and then full estimate on 43 parameters, using previous results as thestarting point. The 43 parameters include 40 turbulent layer strengths and 3 geometrical parameters (misregistration).
In terms of robustness of the estimator, these benchmarks were performed targeting the ESO median profile(VLT-SPE-ESO-11250-4110). The two graphs below demonstrate the accuracy of the reconstructed profile. Aslight overshoot can be noticed for the ground layer, but we believe it will have a rather limited impact on thetomographic error. This will be investigated during phase B.
Figure 10. Accuracy of the reconstructed profile. Left: targeted versus reconstructed profile on 40 layers, right: samecomparison but with cumulated profiles.
Concerning the Apply step, we have performed similar benchmarking on varying matrix sizes on the DGX-1server equipped with V100 GPUs and using a single precision implementation.
In this case we considered the MCAO case for the Apply pipeline as described in12 with up to 25 truthssensors (TS). In this approach, the covariance matrices between the truth sensors measurements and the actualWFS are concatenated in a single meta-matrix (meta-Ctm) and the obtained reconstructor (the product of thismeta-Ctm with the invert of the covariance matrices of the actual WFS measurements) is then multiplied by a

meta least-square control matrix, between the TS and the system DMs (see equation 7, 8 and 9 of Doucet et al).
This is somehow a worst case scenario for the Apply step, where the size of the matrices are very large ascompared to a typical MMSE approach based on modes rather than TS slopes. For these benchmarks, the TShave each around 2.5k measurements and the system hosts about 5k actuators in total. The results are reportedin the Figure below and show that the tomographic reconstructor can be obtained in less than 5sec for theMAVIS case (20k x 5k). Again, this pipeline relies mostly on GPU resources and is using a very limited amountof CPU resources (single process on a single core).
Figure 11. Performance in terms of time-to-solution for the computation of the tomographic reconstructor (a.k.a “Applystep”) on a NVIDIA DGX-1 equiped with V100 GPUs, using only 4 GPUs for varying matrix size. RHS means RightHand Side, it is the number of actuators in the system.
It can be noticed that performance for the smallest matrix size is worse than for larger matrices. It is due toa combination of two factors:
• the workload is too small to maximize the resources occupancy on this multiple GPU setup
• we are relying on a dynamic scheduler (Chameleon) which automatically assigns blocks of computations togiven resources in the system. A custom approach, relying on static scheduling for this particular matrixsize, would help to improve performance, but we have chosen to avoid this path, to keep enough flexibilityfor future developments
With these results, we show that the tomographic reconstructor for MAVIS could be updated every twominutes or less, thanks to these optimized implementations (including both turbulence parameters identificationand tomographic reconstructor computation). Further optimization (hence lower execution time) is expectedwhen leveraging mixed precision at the different steps of the pipeline.
5. CONCLUSION
There is no dispute that the current baseline for MAVIS RTC, based on the COSMIC platform, will be ableto deliver the necessary performance (HRTC and SRTC). The vast majority of the codebase (90%) is based onwell accepted standards (C++, python) and is designed for extensibility to facilitate future upgrades (e.g. interms of adding new compute kernels in the pipeline). It is using standard mathematical libraries (e.g. BLAS,LApack), at the exclusion of any specialised, unsupported packages, or low level tweaks tailored to specifichardware platforms which are difficult to maintain.
The field of AO supervision, performance optimisation through e.g. predictive methods, turbulence identifi-cation methods, is in full bloom right now. We already have such optimisation methods, and without a doubt

more will come in the next four to five years, prior to MAVIS AO RTC integration. An important point wewould like to raise is that the platform, having overhead performance space, will be able to handle these. Theplatform, having overhead performance space, will be able to handle these.
REFERENCES
[1] Ferreira, F. and et al, “Hard real-time core software of the AO RTC COSMIC platform: architecture andperformance,” in [This Conference ], Proc. SPIE (2020).
[2] Ferreira, F., Gratadour, D., Sevin, A., and Doucet, N., “Compass: An efficient gpu-based simulation softwarefor adaptive optics systems,” in [2018 International Conference on High Performance Computing Simulation(HPCS) ], 180–187 (2018).
[3] Viotto, V. and et al, “MAVIS: the adaptive optics module feasibility study,” in [This Conference ],Proc. SPIE, 11448–9 (2020).
[4] Rigaut, F. and et al, “MAVIS conceptual design,” in [This Conference ], Proc. SPIE, 11447–332 (2020).
[5] Agapito, G. and et al, “MAVIS System modelling and performance prediction,” in [This Conference ],Proc. SPIE, 11448–103 (2020).
[6] Perret, D., Laine, M., Bernard, J., Gratadour, D., and Sevin, A., “Bridging FPGA and GPU technologiesfor AO real-time control,” in [Adaptive Optics Systems V ], Proc. SPIE 9909, 99094M (July 2016).
[7] Charara, A., Ltaief, H., Gratadour, D., Keyes, D. E., Sevin, A., Abdelfattah, A., Gendron, E., Morel,C., and Vidal, F., “Pipelining Computational Stages of the Tomographic Reconstructor for Multi-ObjectAdaptive Optics on a Multi-GPU System,” in [SC’14 ], 262–273, IEEE (2014).
[8] Ltaief, H., Gratadour, D., Charara, A., and Gendron, E., “Adaptive Optics Simulation for the World’sLargest Telescope on Multicore Architectures with Multiple GPUs,” in [Proceedings of the Platform forAdvanced Scientific Computing Conference ], PASC ’16, 9:1–9:12, ACM, New York, NY, USA (2016).
[9] Ltaief, H., Charara, A., Gratadour, D., Doucet, N., Hadri, B., Gendron, E., Feki, S., and Keyes, D.,“Real-time massively distributed multi-object adaptive optics simulations for the european extremely largetelescope,” in [2018 IEEE International Parallel and Distributed Processing Symposium (IPDPS) ], 75–84(2018).
[10] Bernard, J., Perret, D., Sevin, A., Laine, M., Buey, T., and Gratadour, D., “Design and performance of ascalable GPU-based AO RTC prototype,” in [Adaptive Optics Systems VI ], Close, L. M., Schreiber, L., andSchmidt, D., eds., Society of Photo-Optical Instrumentation Engineers (SPIE) Conference Series 10703,107034B (July 2018).
[11] https://images.nvidia.com/content/technologies/deep-learning/pdf/61681 DB2-Launch-Datasheet-Deep-Learning-Letter-WEB.pdf, “Dgx-1 product brief,” tech. rep.
[12] Doucet, N., Kriemann, R., Gendron, E., Gratadour, D., Ltaief, H., and Keyes, D., “Scalable soft real-timesupervisor for tomographic AO,” in [Adaptive Optics Systems VI ], Society of Photo-Optical InstrumentationEngineers (SPIE) Conference Series 10703, 107034L (Jul 2018).